Article

Structural Characteristics of the Pine Stands on Degraded Lands in the South-East of Romania, in the Context of Climate Changes

by
Constandache Cristinel
1,
Tudor Ciprian
1,2,*,
Laurențiu Popovici
1,
Vlad Radu
1,
Vlad Crișan
1 and
Lucian Constantin Dincă
1
1
Department of Forestry Research, “Marin Drăcea” National Institute for Research and Development in Forestry, 077190 Voluntari, Romania
2
Department of Forest Engineering, “Transilvania” University of Brașov, 500123 Braşov, Romania
*
Author to whom correspondence should be addressed.
Appl. Sci. 2024, 14(18), 8127; https://doi.org/10.3390/app14188127
Submission received: 28 June 2024 / Revised: 4 September 2024 / Accepted: 6 September 2024 / Published: 10 September 2024
(This article belongs to the Section Ecology Science and Engineering)

Abstract

:
The present research was carried out in stands of Scots pine and black pine, pure or mixed with deciduous trees, installed on degraded lands from the Curvature Subcarpathian area, Romania, in a representative network of permanent research plots and followed the analysis of the structural diversity and stability indicators of these stands at different ages and in different conditions of degraded lands. The relationships between the quantitative variables with reference to the structure were established by analyzing the significance of the Pearson correlation coefficient (r) and also including datasets of slenderness indexes, which were classed into three domains of vulnerability to abiotic factors (like wind and snow). The compositional diversity of pine stands (pure or mixed with deciduous ones) is different in relation to age and is correlated with the structural diversity. The obtained correlation coefficients (r Pearson) express very strong and significant relationships between biometric parameters (h x Dbh, h x Lc%, Dc x Dbh, and Lc% x Dbh) of the structural diversity (r = 0.800–0.930), which is important for the analysis of the stability and vulnerability of pine forests. The strong correlation between the analyzed variables expresses a weak vulnerability to the action of harmful abiotic factors and the increase in the stability and resilience of the studied stands, especially of over 50 years old. In the old pine stands, the low-vulnerability domain (I < 0.80) is the best represented one, with an average of 64.01% from the total number of trees. At this age, trees with DBH > 22 cm fall into the low-vulnerability category. The explanation is that the stands were affected in their youth by the action of snow and wind, which, combined with the silvotechnical works performed, led to their compositional and structural diversification and increased stability. The young (<45 years) and pure-pine stands with higher consistency (>0.8) and even-aged structure are the most vulnerable to abiotic factors due to the fact that a large number of trees are passing gradually into the higher cenotic classes.

1. Introduction

Stands on degraded lands perform multiple functions of environmental protection, and degradation of their structure would cause serious ecological disturbances [1]. For diminishing the negative wind impact, mechanistic models for assessment have been developed [2].
In the south-east of Romania, the Curvature Subcarpathian area represents one of the areas most affected by land degradation processes (erosion, gullying, and landslides) triggered after the cutting of forests, especially to create pastures, after 1890 [3]. Starting in 1930 and especially after 1950, important improvement works were realized for afforesting degraded lands, with Scots pine and black pine as main species [4,5]. Since 1982, a network of research surfaces with a permanent character [6] has been created, which are representative for tracking forest cultures realized on degraded lands from Romania. The evolution of biometric, structural, and qualitative parameters in stands from degraded lands (that reflect their health and diversity) is realized under the influence of environmental conditions, silvotechnical works, and a complex of harmful biotic (insects, mushrooms, and game) and abiotic factors (wind, snow, and drought). Their action can cause strong imbalances in the development of ecosystems, while their condition, behavior, and evolution are unpredictable [7]. In line with this, recent research has more often taken into consideration stability issues and the structure, regeneration, and dynamics of stands development in general but also, as in this paper, stands from degraded lands [8,9].
Pine stands located outside their habitat, composed by a single type of species, have a high vulnerability towards abiotic factors [10]. In some experiments carried out for establishing diversity in the disturbed stands, Scots pine is the species used to created homogenous clusters for hardwood species such as oak, beech, and even spruce for the richness of biodiversity and favoring the mixture of broadleaved species [11].
Structure derangement and degradation are the consequences of exogenous factors such as wind and snow. Health alterations have been found to be caused by drought, leading to a decrease of ecosystem stability [12,13,14], leading to significant negative ecological consequences [15]. Furthermore, the influence of harmful factors leads to downgrading the remaining trees and, as the stand’s crown thins out, decreasing the stand’s stability, health state, biological diversity, and regeneration capacity. Many stands are affected by dryness and breaks, among other things, after climate changes [16]. The causes of injuries produced in pine stands on degraded lands are multiple, one of them being the big density (big number of trees) due to unappliable stand-tending operations [17].
The research carried within the our institute has highlighted the necessity and efficiency of silvicultural operations as measures of sustainable development for stands in general and especially for those from degraded lands [18], as these are forests that accomplish special functions of protection.
At the European level, Scots pine (Pinus sylvestris L.) is one of the most widely distributed and vulnerable species when it comes to the influence of climate changes and drought [19,20]. The studies with reference to Scots pine have targeted the reaction of radial growth to climate change [21,22,23,24,25]. The frequent damages caused by wind and snow in spruce and pine stands reflect the problem of realizing resistant stands capable of performing the functions for which they were created [26,27]. The research in this direction has shown the existence of a close relationship between the value of the stability index and the injuries caused by wind and snow, meaning that the frequency of injuries is increased as the value of stability index exceeds the unit value. Forest management depends on the uncertainties caused by climatic risks. Tracking the behavior of pine forest crops on degraded lands has been the subject of previous or recent research [28,29,30].
The present research aimed at understanding the effects of environmental conditions (especially land degradation) and some harmful abiotic (climatic) factors on some characteristics of pine stands on degraded lands. The research started from the hypothesis that the analysis of some structural and qualitative parameters of the trees or stands offers us new scientific information regarding their condition and stability in relation to the form and intensity of the degradation, based on which the forest management and regeneration measures of pine stands on degraded lands can be optimized. In this context, the results obtained contribute to the sustainable management of pine stands on degraded lands and the realization of forest ecosystems with optimal structures that are resilient and adaptable to environmental conditions so that they can fulfill their protective role.

2. Materials and Methods

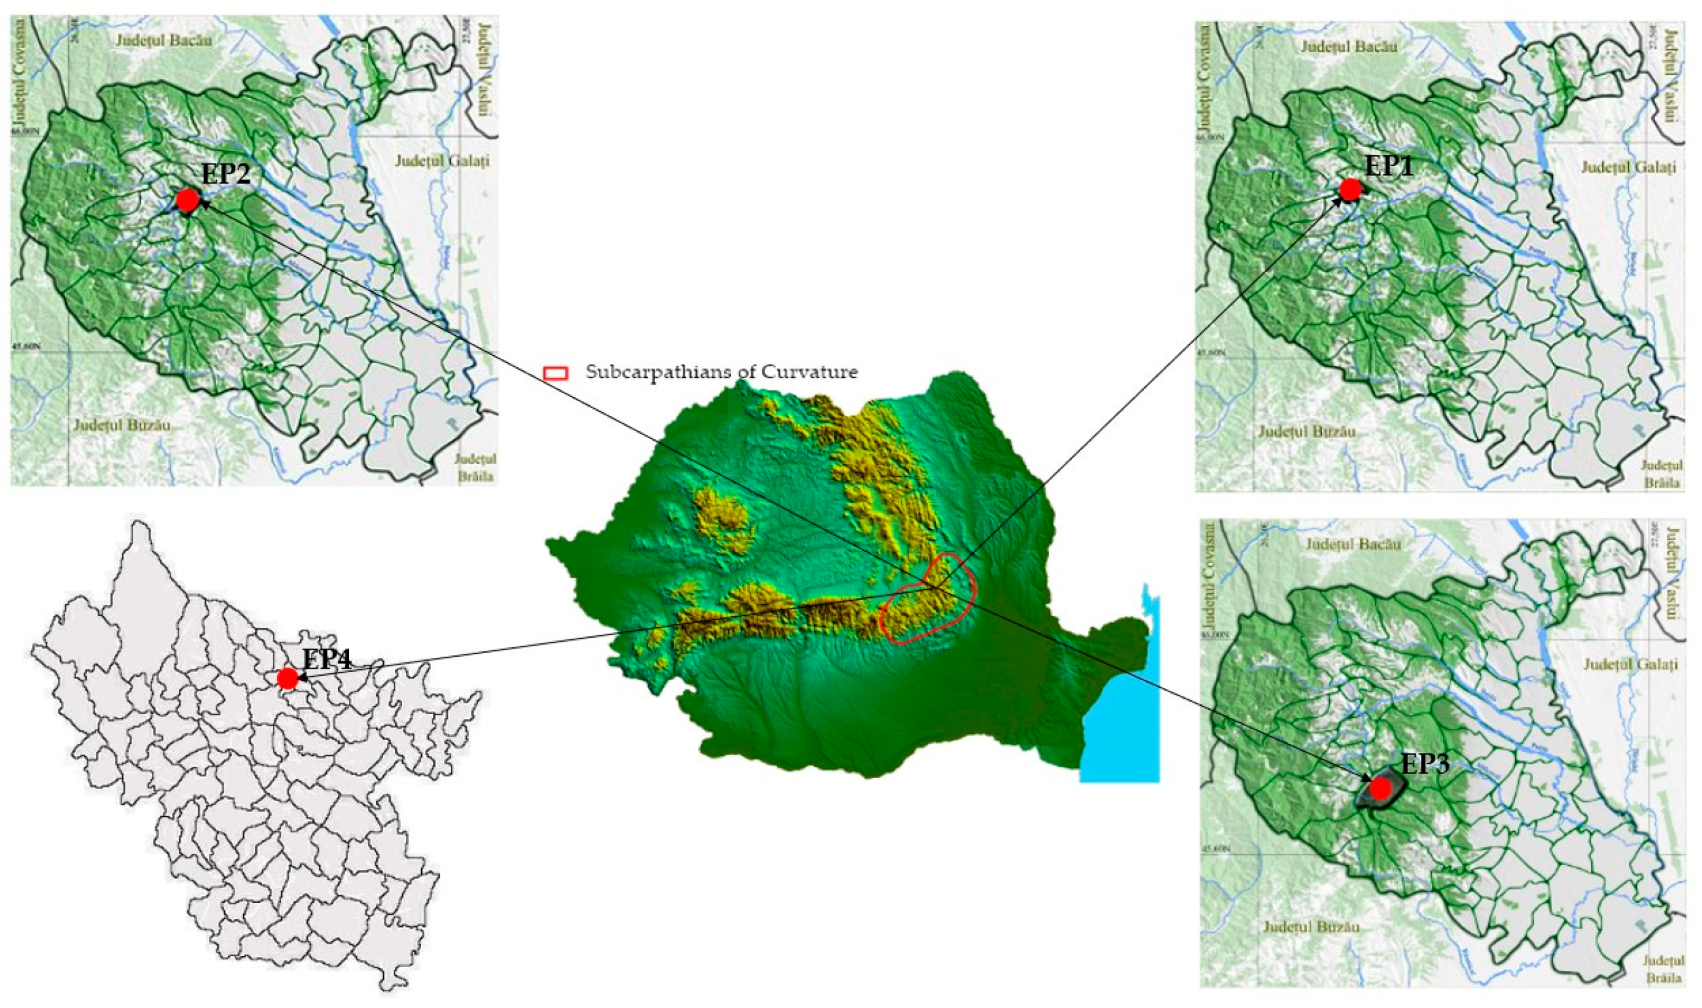
2.1. Data Collection

The research was realized in Scots pine and black pine stands, either pure or mixed with broadleaved trees, installed on degraded lands from the south-east zone of Romania, which are representative of the extent and forms of land degradation as well as of the types of forestry works carried out on degraded lands (Figure 1). They are situated in four permanent experimental perimeters (EP) that are representative of the forest cultures installed on degraded lands (Table 1). In each experimental perimeter, we established a network of research plots (RP) that highlight the nature of the degradation and its intensity. From this network, we selected a total number of 10 representative RPs that cover both the zone of the pure pine stands and the ones mixed with hardwood species. The EP are distributed by phytoclimatic floor as follows:
(1)
The sessile oak and common beech phytoclimatic storey (FD3): (i) Vidra Experimental Base, experimental perimeters: Caciu-Bârseşti (EP1) (45°55′19.69″ N, 26°44′44.74″ E) and Pârâul Sărat–Valea Sării (EP2) (45°52′35.57″ N, 26°47′51.97″ E); (ii) Focșani Forest District, experimental perimeter Roşoiu–Andreiaşu (EP3) (45°44′56.24″ N, 26°49′55.96″ E);
(2)
The internal hilly forest-steppe site (Ssd): (iii) Râmnicu-Sărat Forest District perimeter Livada–Râmnicu Sărat (EP4) (45°23′55.78″ N, 26°55′29.49″ E).
The afforestation works are distinctive due to the black pine and Scots pine plantations mixed with white sea buckthorn and/or other broadleaved species. These are located on very strongly (excessively) eroded lands and were set up/consolidated by special works in order to ensure minimum vegetation conditions. The realized forest cultures from EP1 Caciu-Bârsești, EP2 Pârâul Sărat–Valea Sării, and EP3 Roșoiu-Andreiașu presently have ages between 45–65 years and are located in the sessile oak-common beech phytoclimatic storey (FD3) and fulfill special hydrological and anti-erosion protection functions. The stand aged over 70 years is located in the internal hilly forest-steppe site (Ssd), fulfilling the management goals of protection (soil, water, etc.). The most representative stands are composed of pure pine species or mixed with broadleaved ones (mahaleb cherry, sweet cherry, sycamore, manna, etc.) in different proportions of participation in stand composition, with a maximum of 30%.
Due to the fragmented relief from the Curvature Subcarpathians, with steep and strongly inclined slopes, the climate is characterized by torrential rains. Together with the lithological substratum, composed mainly of marls and clays, this leads to the appearance of numerous degradation phenomena, the most frequent being pluvial erosion produced both at the surface and in depth.

The Description of Degradation

In general, land degradation represents the alteration of soil characteristics so that they becomes inferior in quality, and it includes several degradation processes (erosion, gullying, landslides, etc.). For the research undertaken in this paper, the erosion processes caused by water that generate eroded land are of interest. In relation to the intensity of erosion, three degrees of erosion are distinguished: moderate erosion or 1st degree (E1); high erosion or 2nd degree (E2); and very high erosion or 3rd degree (E3).
The significance of the degrees of erosion and the pedological characteristics of the eroded lands are shown in Table 2.
Removing the fertile soil layer from the surface leads to serious consequences on the plant production capacity. Therefore, many of the lands from this area were declared unproductive or poorly productive, generating ecological, economic, and social imbalances. The altitudinal limits are located between 300–700 m, while the area is characterized by a continental climate. From a geological perspective, the soils are generally brown, argiluvial, diversely eroded, erodisoils, cruzite soils (mixture of soil and rock), typical erodisoils or cambic, or soils trenched from landslides and caving.

2.2. Data Analysis

The characteristics of pine stands located on degraded lands have been permanently monitored through periodic works (at 5 to 10 years) regarding the main biometric and structural parameters (diameter, height, etc.). The research plots (EP) from each experimental perimeter (EP) were inventoried in the period 2019 to 2020, with the next inventory being at the end of vegetation season from the current year (2024) and in the beginning of the previous one (2025). The works consisted of quantitatively evaluating the trees by determining the following dendrometric parameters: basal diameter (DBH); total height (h); pruned height (hc); diameter of the crown (Dc); the crown’s relative length (Lc%); and the slenderness index (I) as well as stand structural evaluation (participation of the species in composition (%), number of trees per hectare (N−1), and density index by the number of trees (IN) and by the basal area (IG)). The data’s statistical process emphasizes the structural diversity and the qualitative and stability characteristics of pine stands from degraded lands by using general statistical parameters (mean, median, standard deviation (s), minimum and maximum, and variation coefficient (cv%) for the basal diameter (DBH) and total height (h). The basal diameter (DBH) was measured for all trees at breast height (DBH at 1.30 m height) on two perpendicular directions. The Mantax Blue forest caliper was used to measure the basal diameter. The reading of the basal diameter values was realized at a millimeter scale. The total height (h) and the pruned height (hc) was measured for all the trees from the stand by using the Vertex IV precision device. The diameter of the crown (Dc) in meters was measured on two axes (one axis in the north direction and one axis in the south direction). The measurements were carried out using the model of Spencer forest roullete with 20 m length.
Usually, the slenderness index (I) is situated in the interval [0, 1], but in some cases, this index can take values over the maximum limit [31].
The relationships between the quantitative variables referring to the structure were established by analyzing the Pearson correlation coefficient (r). Significant tests were applied for the vulnerability classes established by the slenderness index’s values (I) by analyzing the means and variations between the groups (the pairwise t-test and F test). We tested the null hypothesis by using the one-way ANOVA single factors (H0: All the slenderness index means obtained in different site areas for the crown section are equally distributed). When the ANOVA results had a p-value < 0.05, the null hypothesis was rejected, and we could conclude that significant differences were considered between the groups. Furthermore, the pairwise t-test method was applied to find all the significant differences between the means divided on groups, including the datasets of crown biometry and slenderness indexes (I). For comparing the means of slenderness indexes obtained in certain conditions, we used a scale of vulnerability divided in three domains: (a) domain 1—low vulnerability: I less than 0.8; (b) domain 2—moderate vulnerability: I between 0.8 and 1.0; domain 3—high vulnerability: I greater than 1.0. At the 95% significance level, there is an important difference between the groups when the p-value < α. In order to emphasize the relationships between the stands’ structural characteristics of basal diameter and total height, respectively, and the crown’s biometric indicators, the experimental distributions were theorized by linear regression equations as well as logarithmic ones for a better compensation of experimental values. Tool packages from Microsoft Office (Excel) and Statistica 8.0 were used to process the statistical data. To evaluate the structural diversity, a series of indexes were calculated: the number of trees per hectare; the basal area per hectare; the mean of the arithmetic diameter; the mean of arithmetic height; the means of both the basal diameter of the basal area and the corresponding height; the means for the parameters of crown biometry; the class of productivity (Table 3). When analyzing the structural diversity of forest cultures, the grouping of individuals in space, their functional relationships, and size variability were taken into account, highlighting the stability and ability of both pure pine stands and mixed stands to adapt to environmental conditions.
All these indicators are necessary for understanding the effects of the environmental conditions on the characteristics of the stands and determining the optimal structures, the types of resistant stands, adaptability to the existing environmental conditions, as well as the forestry management and regeneration measures of the stands on the degraded lands.

3. Results

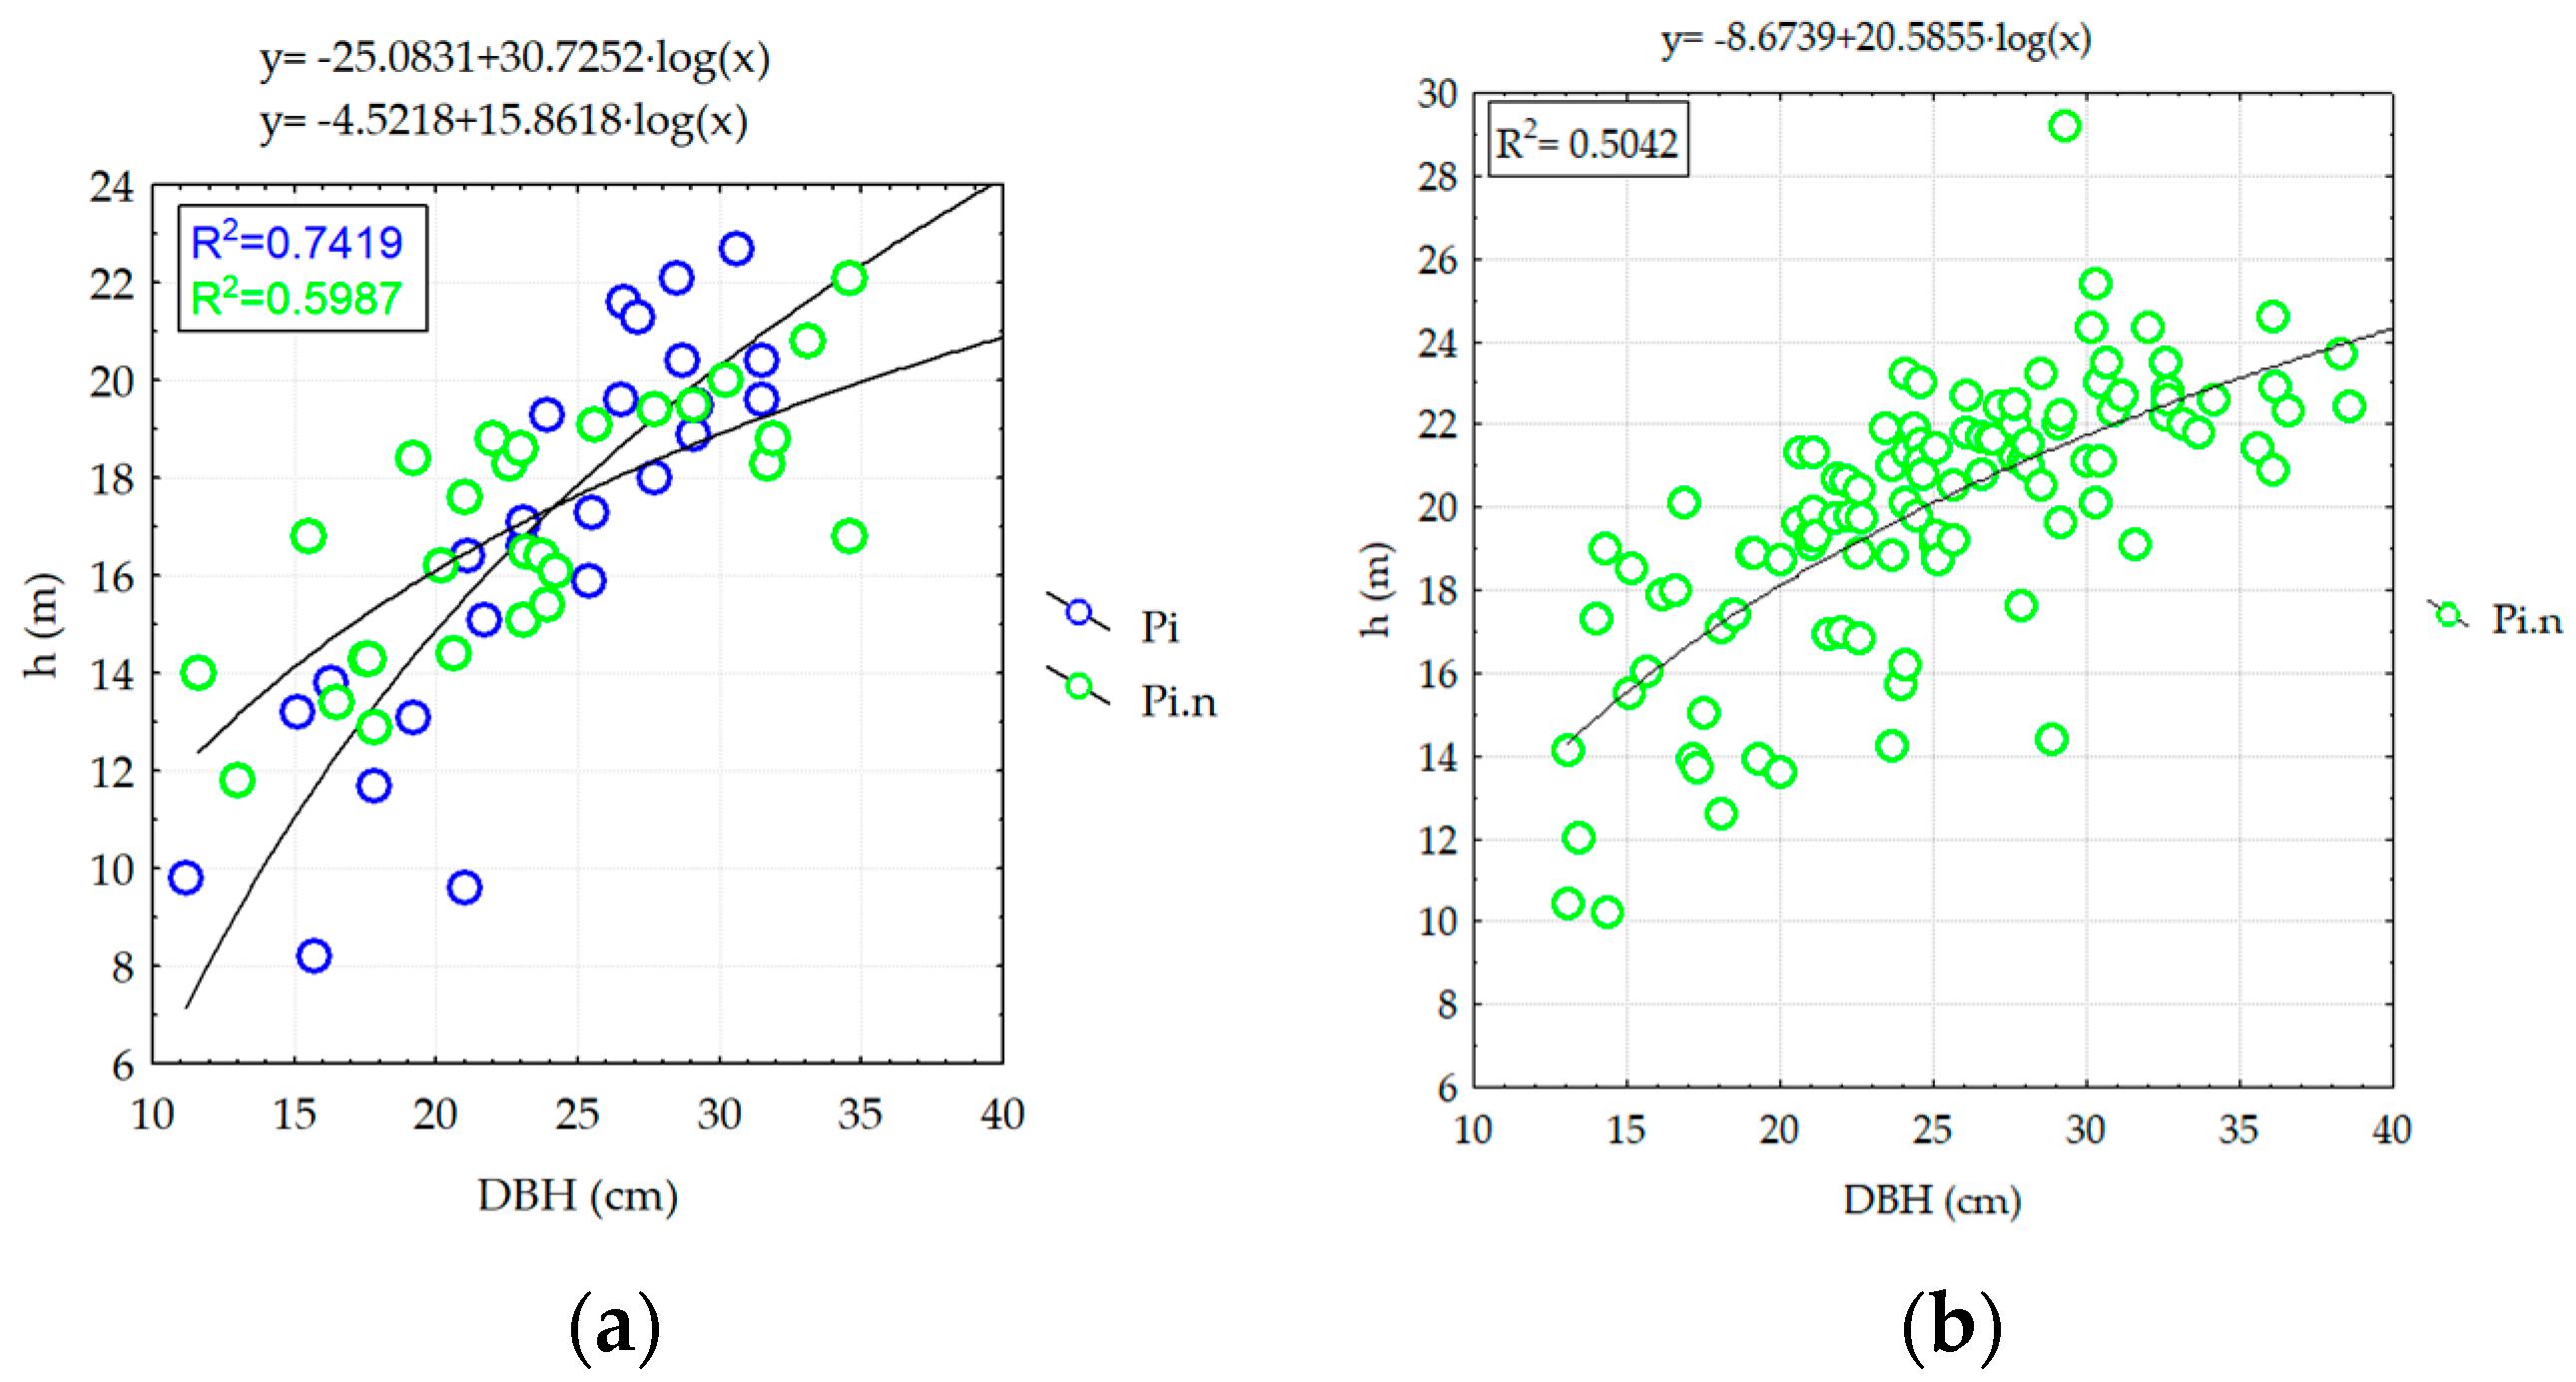
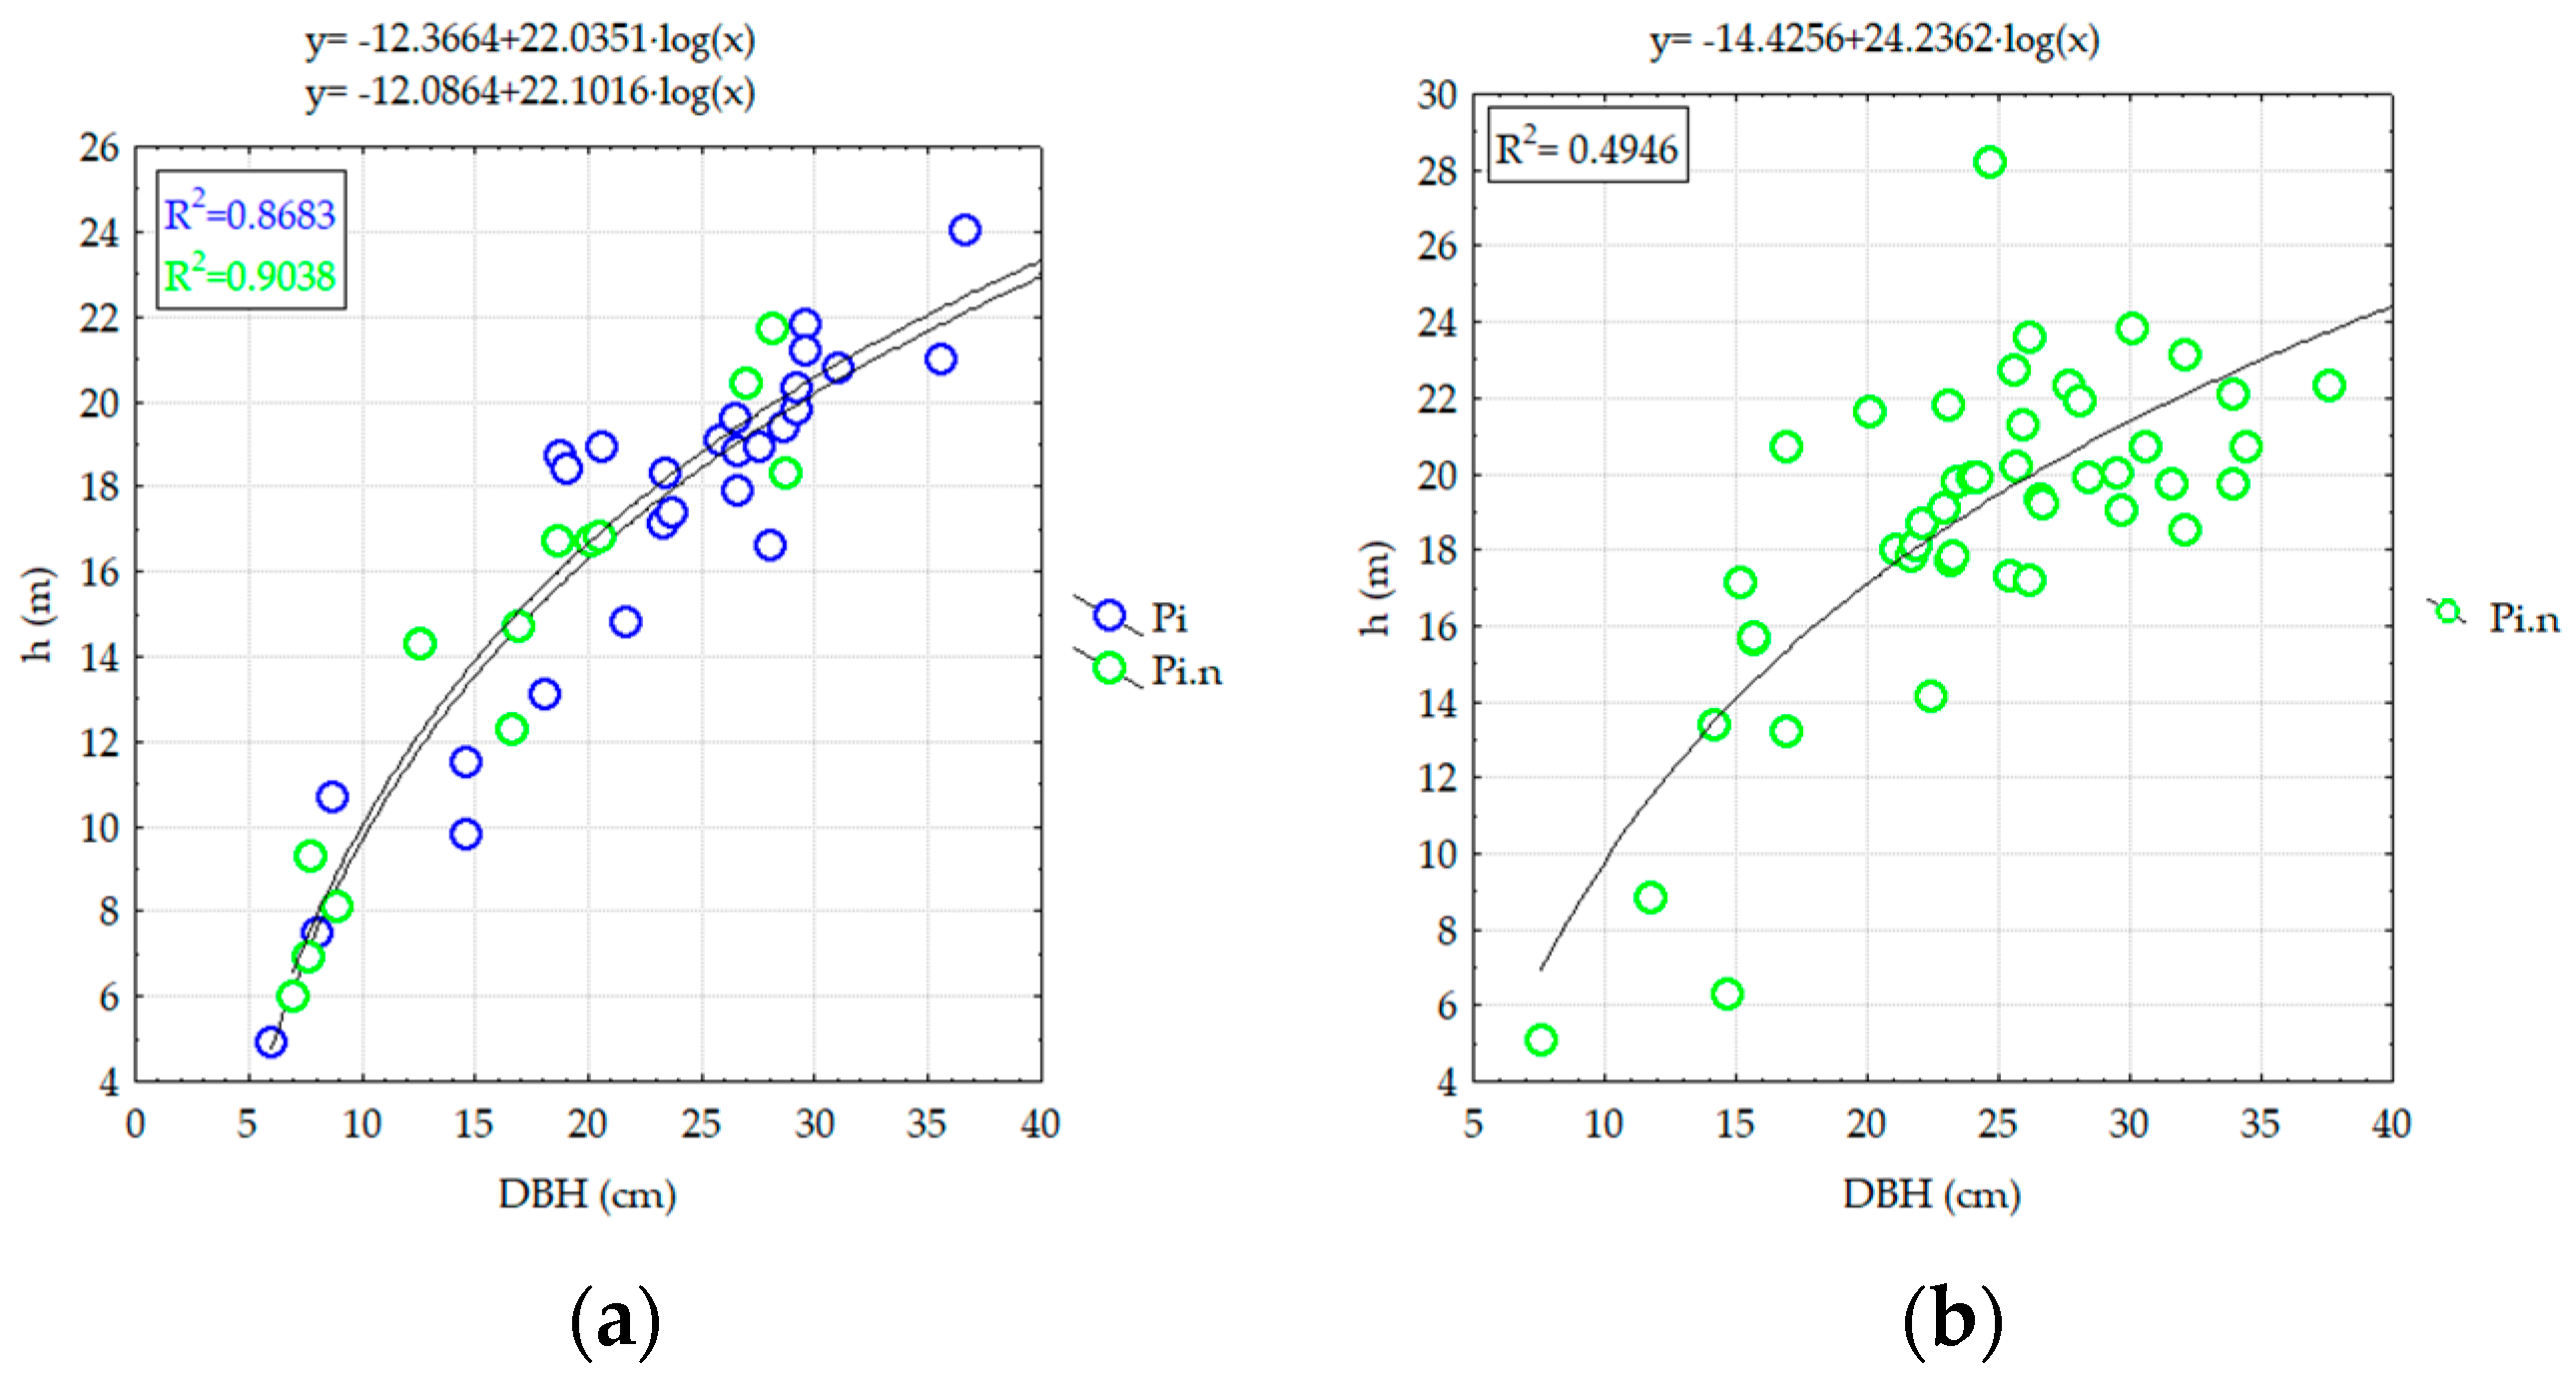
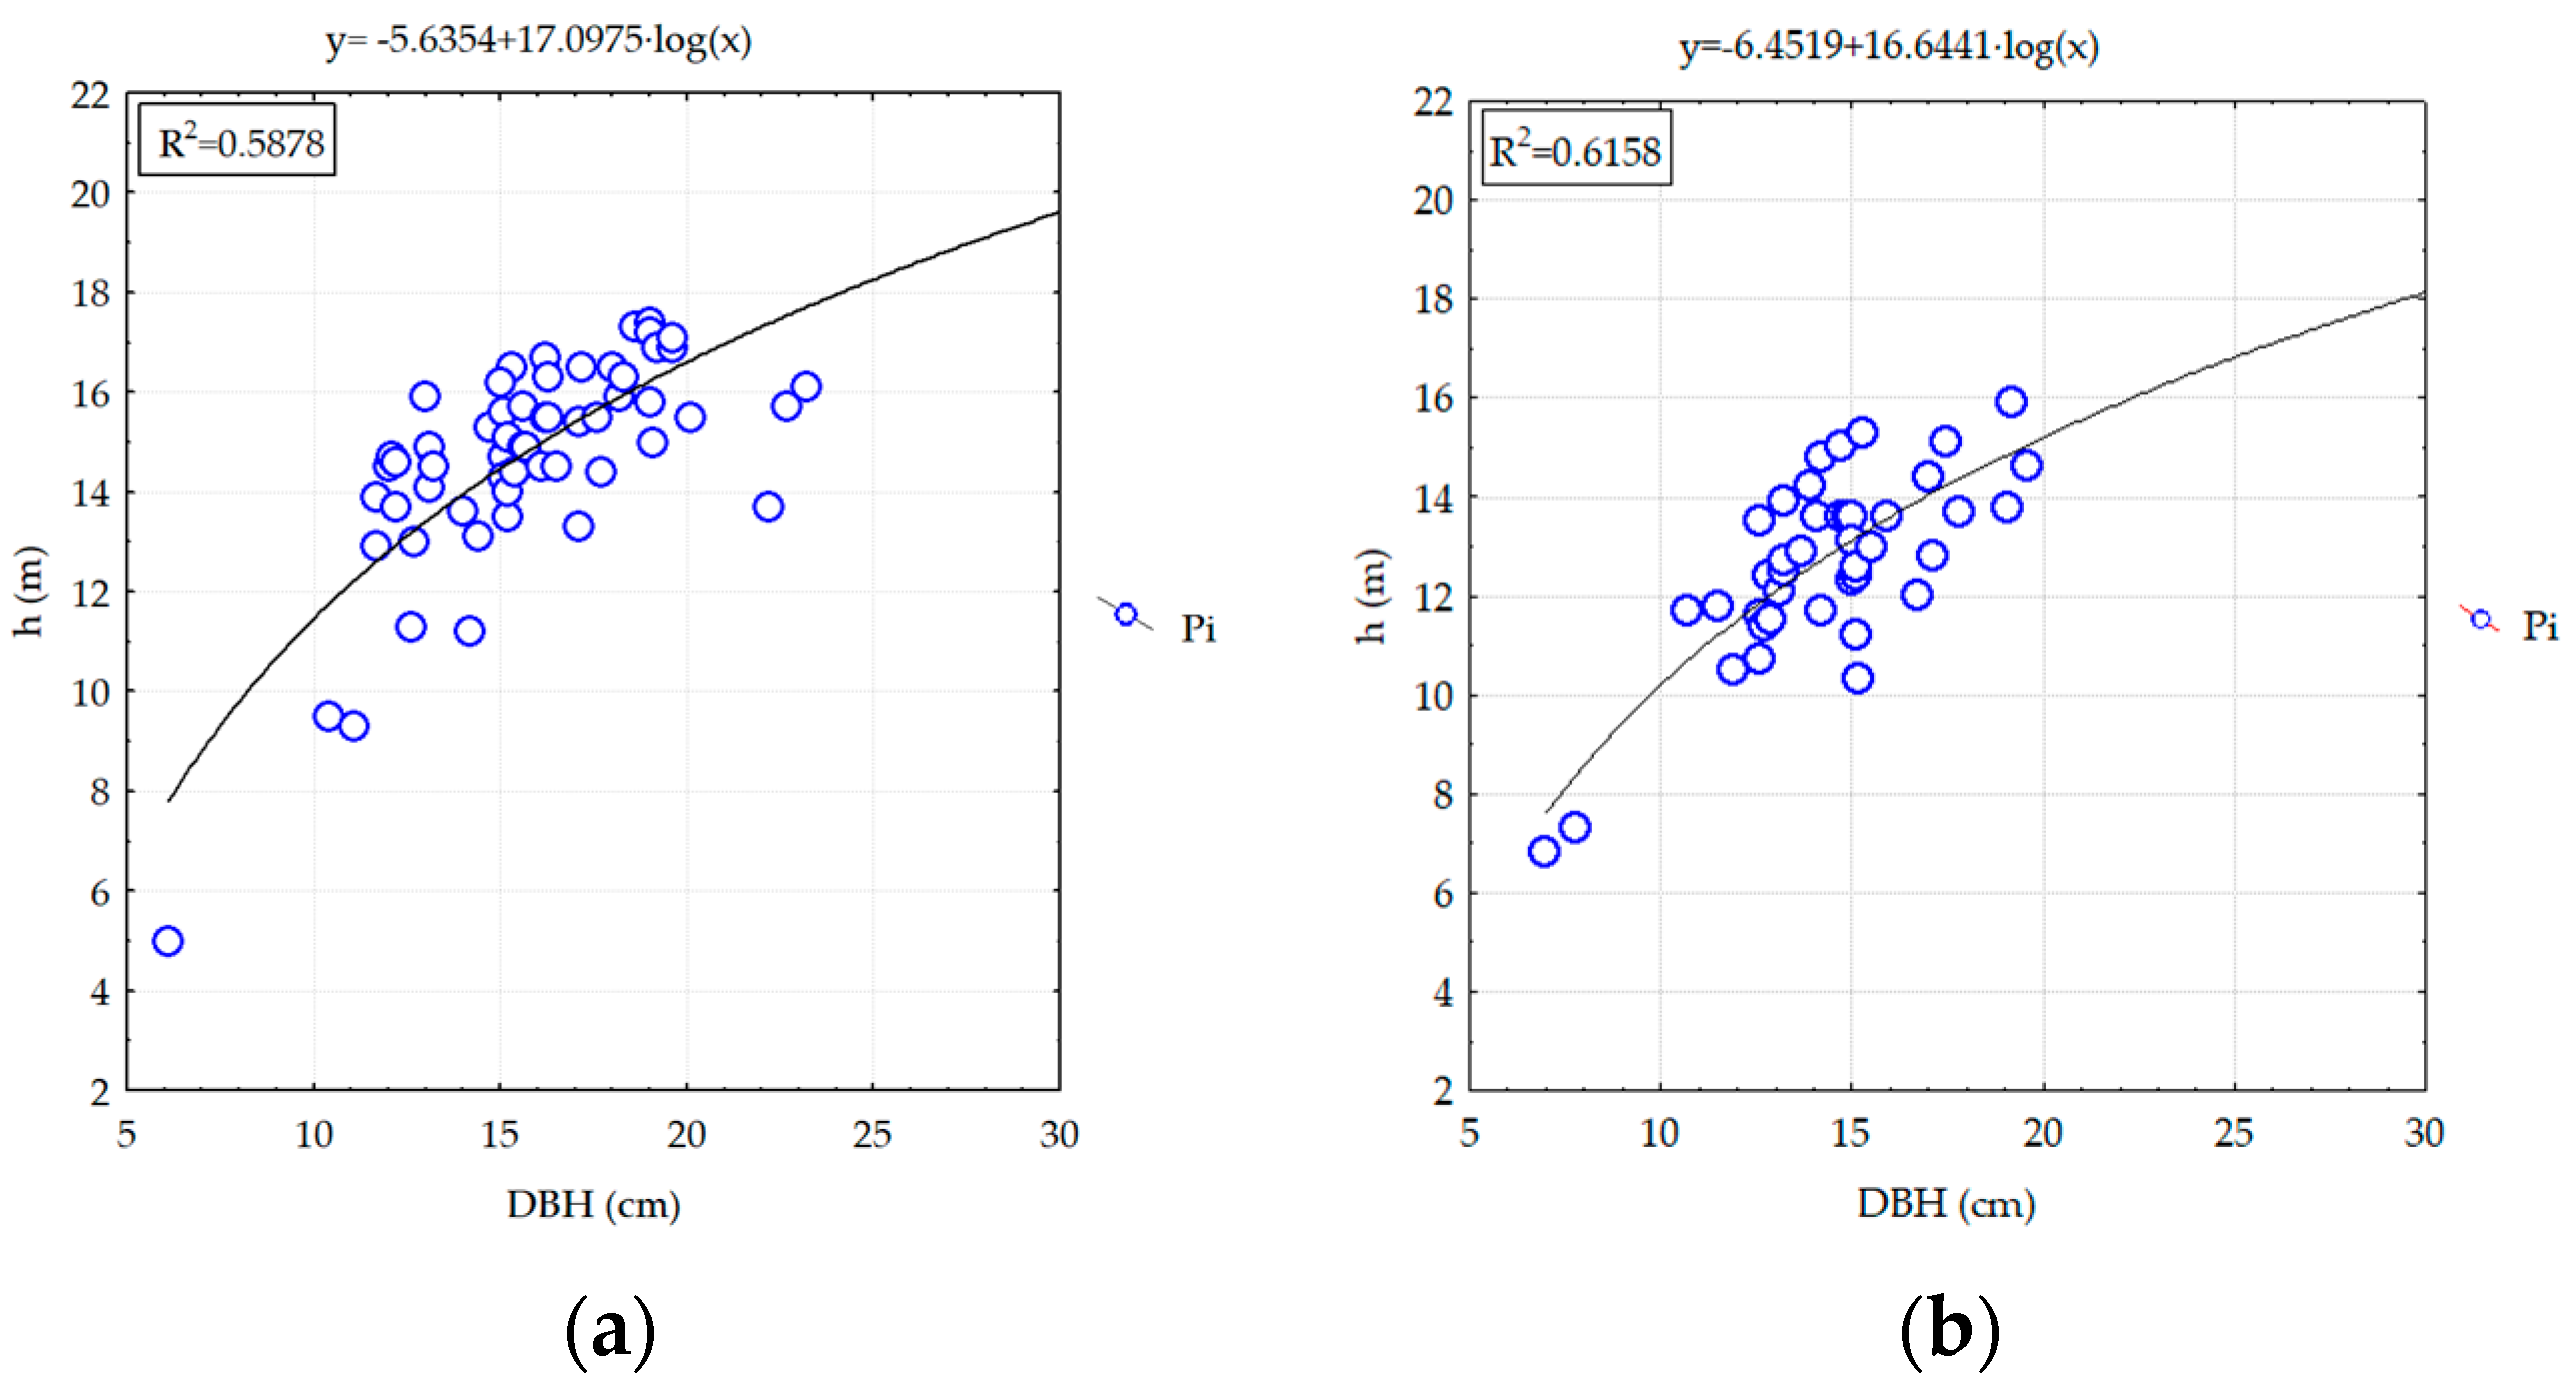
3.1. Structural and Diversity Parameters of Pine Stands from Degraded Lands

Analyzing the correlation between DBH and Dc (Figure 2a–d, Figure 3a–d, Figure 4a,b and Figure 5a,b), showed that as the diameter increases, the crown length increases, according to a linear regression. The same tendency is expected in the case of the correlation between diameter and the crown’s relative length (Lc%), showing the same hypothesis (Figure 6a,b, Figure 7a,b, Figure 8a–c and Figure 9a,b). The obtained correlation coefficients showed a medium to strong correlation between the considered local variables of crown diameter (Dc) x basal diameter (DBH), with r ranging between 0.6556 and 0.8276 in the case of the Scots pine species, respectively, and between 0.6578 and 0.9407 in the case of black pine species.
In the experimental plots (RP) from experimental perimeter EP3 Roșoiu Andreiașu, the mean crown diameter ( D c ¯ ) ranges between 1.22 ± 1.53 and 5.22 ± 1.23 m in the case of Scots pine species (EP3—RP4, RP9, and RP10), respectively, and between 1.55 ± 1.20 and 3.34 ± 3.75 m in the case of black pine species (EP3—RP4 and RP9). The mean of crown relative length L c % ¯ —ranges between 57.95 ± 7.80 and 68.46 ± 12.02% in the case of Scots pine species (EP3—RP4, RP9, and RP10), respectively, and between 58.05 ± 10.33 and 62.53 ± 9.63% in the case of black pine species (EP3—RP4 and RP9).
In the experimental plots (RP) from experimental perimeter EP1 Caciu Bârsești, the mean crown diameter ( D c ¯ ) ranges between 2.86 ± 0.84 and 3.36 ± 0.83 m in the case of Scots pine species (EP1—RP5 and RP9), respectively, and between 2.62 ± 0.83 and 3.36 ± 0.83 m in the case of black pine species (EP1—RP5 and RP9). The mean of crown relative length ( L c % ¯ —ranges between 49.06 ± 14.87 and 49.87 ± 9.85% in the case of Scots pine species (EP1—RP5 and RP9), respectively, and between 45.35 ± 12.54 and 56.29 ± 10.21% in the case of black pine species (EP1—RP5 and RP9).
The correlation coefficients (r) obtained from the relationship between crown relative length (Lc%) x basal diameter (DBH) range between 0.4859 and 0.6597 in the case of the Scots pine species, respectively, and between 0.6578 and 0.9407 in the case of the black pine species for the relationship between crown diameter (Dc) and basal diameter (DBH). Weak correlations were obtained between the following variables: pruned height (hc) x basal diameter (DBH), pruned height (hc) x crown diameter (Dc), and pruned height (hc) x crown relative length (Lc%), where the correlation coefficient (r) is situated between 0.1300 and 0.2900.
In the case of pine stands mixed with broadleaved species (EP2), the crown diameters recorded for the black pine species are comparatively higher than the ones obtained for Scots pine, especially for the middle− and high− diameter categories. Thus, the mean of the crown diameter registered for Scots pine species is of 3.92 ± 0.94 m, and the mean of crown diameter for black pine species is 4.21 ± 0.69 m. In general, there were strong correlations between the analyzed variables, with these being direct and positive in all cases as well as strong (Scots pine, RP1: Dc x DBH: r = 0.8401; black pine, RP9: Dc x DBH: r = 0.7500) (Figure 4a,b). The mean of crown relative length (Lc%) (Figure 8a–c) for Scots pine species (RP1) is 52.31 ± 8.56%, with the amplitude ranging between 37.50 and 66.20%. In the case of black pine species, the mean of crown relative length (Lc%) ranges between 46.42 ± 9.23 (RP1) and 50.61 ± 7.29% (RP9), with the amplitude ranging between 23.23 (RP1) and 67.31% (RP9).
Medium correlations between Dc and DBH were obtained for the both species in EP4 Livada-Râmnicu Sărat (Figure 5a,b). The amplitude of the mean crown diameter (Dc) ranges between 1.41 and 4.18 m in the case of Scots pine stands (RP6), with the mean of 2.47 ± 0.66 m, respectively, and between 1.22 and 4.00 m in the case of black pine stands (RP9), with the mean of 2.43 ± 0.74. It seems that natural pruning is more active in the case of the pure Scots pine stands (RP6), as the crown relative length (Lc%) has an amplitude ranging between 13.61 and 61.57% compared to pure black pine stands (RP9), where the Lc% ranges between 22.60 and 67.84%.

3.2. The Effect of Damaging Factors on the Composition and Structure of Pine Stands on Degraded Lands

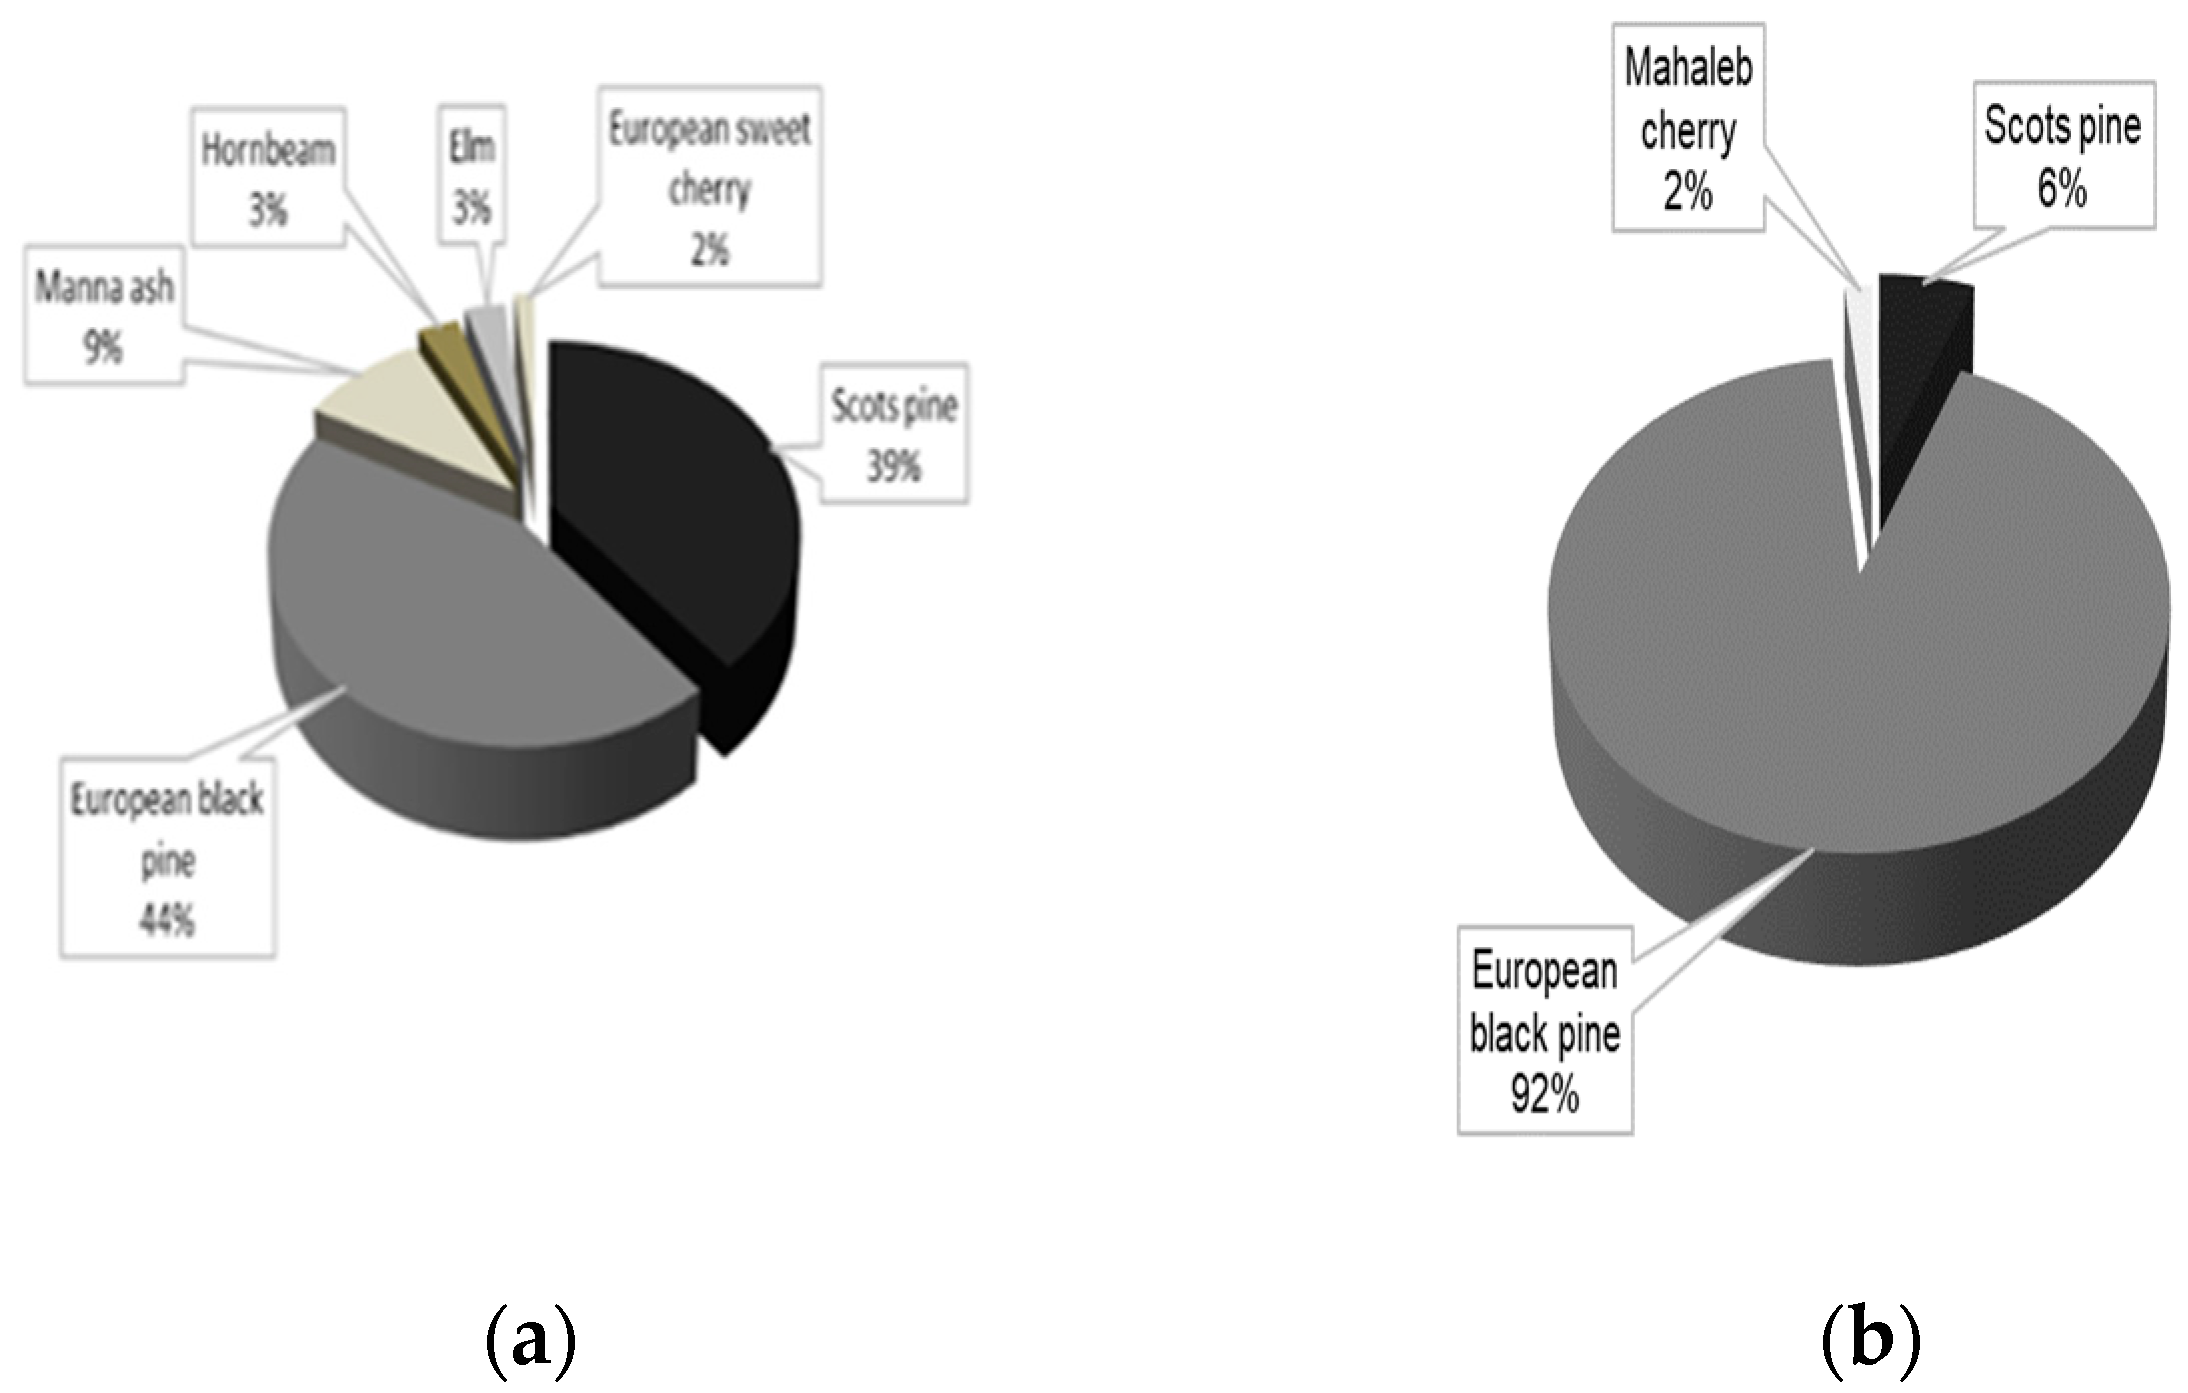
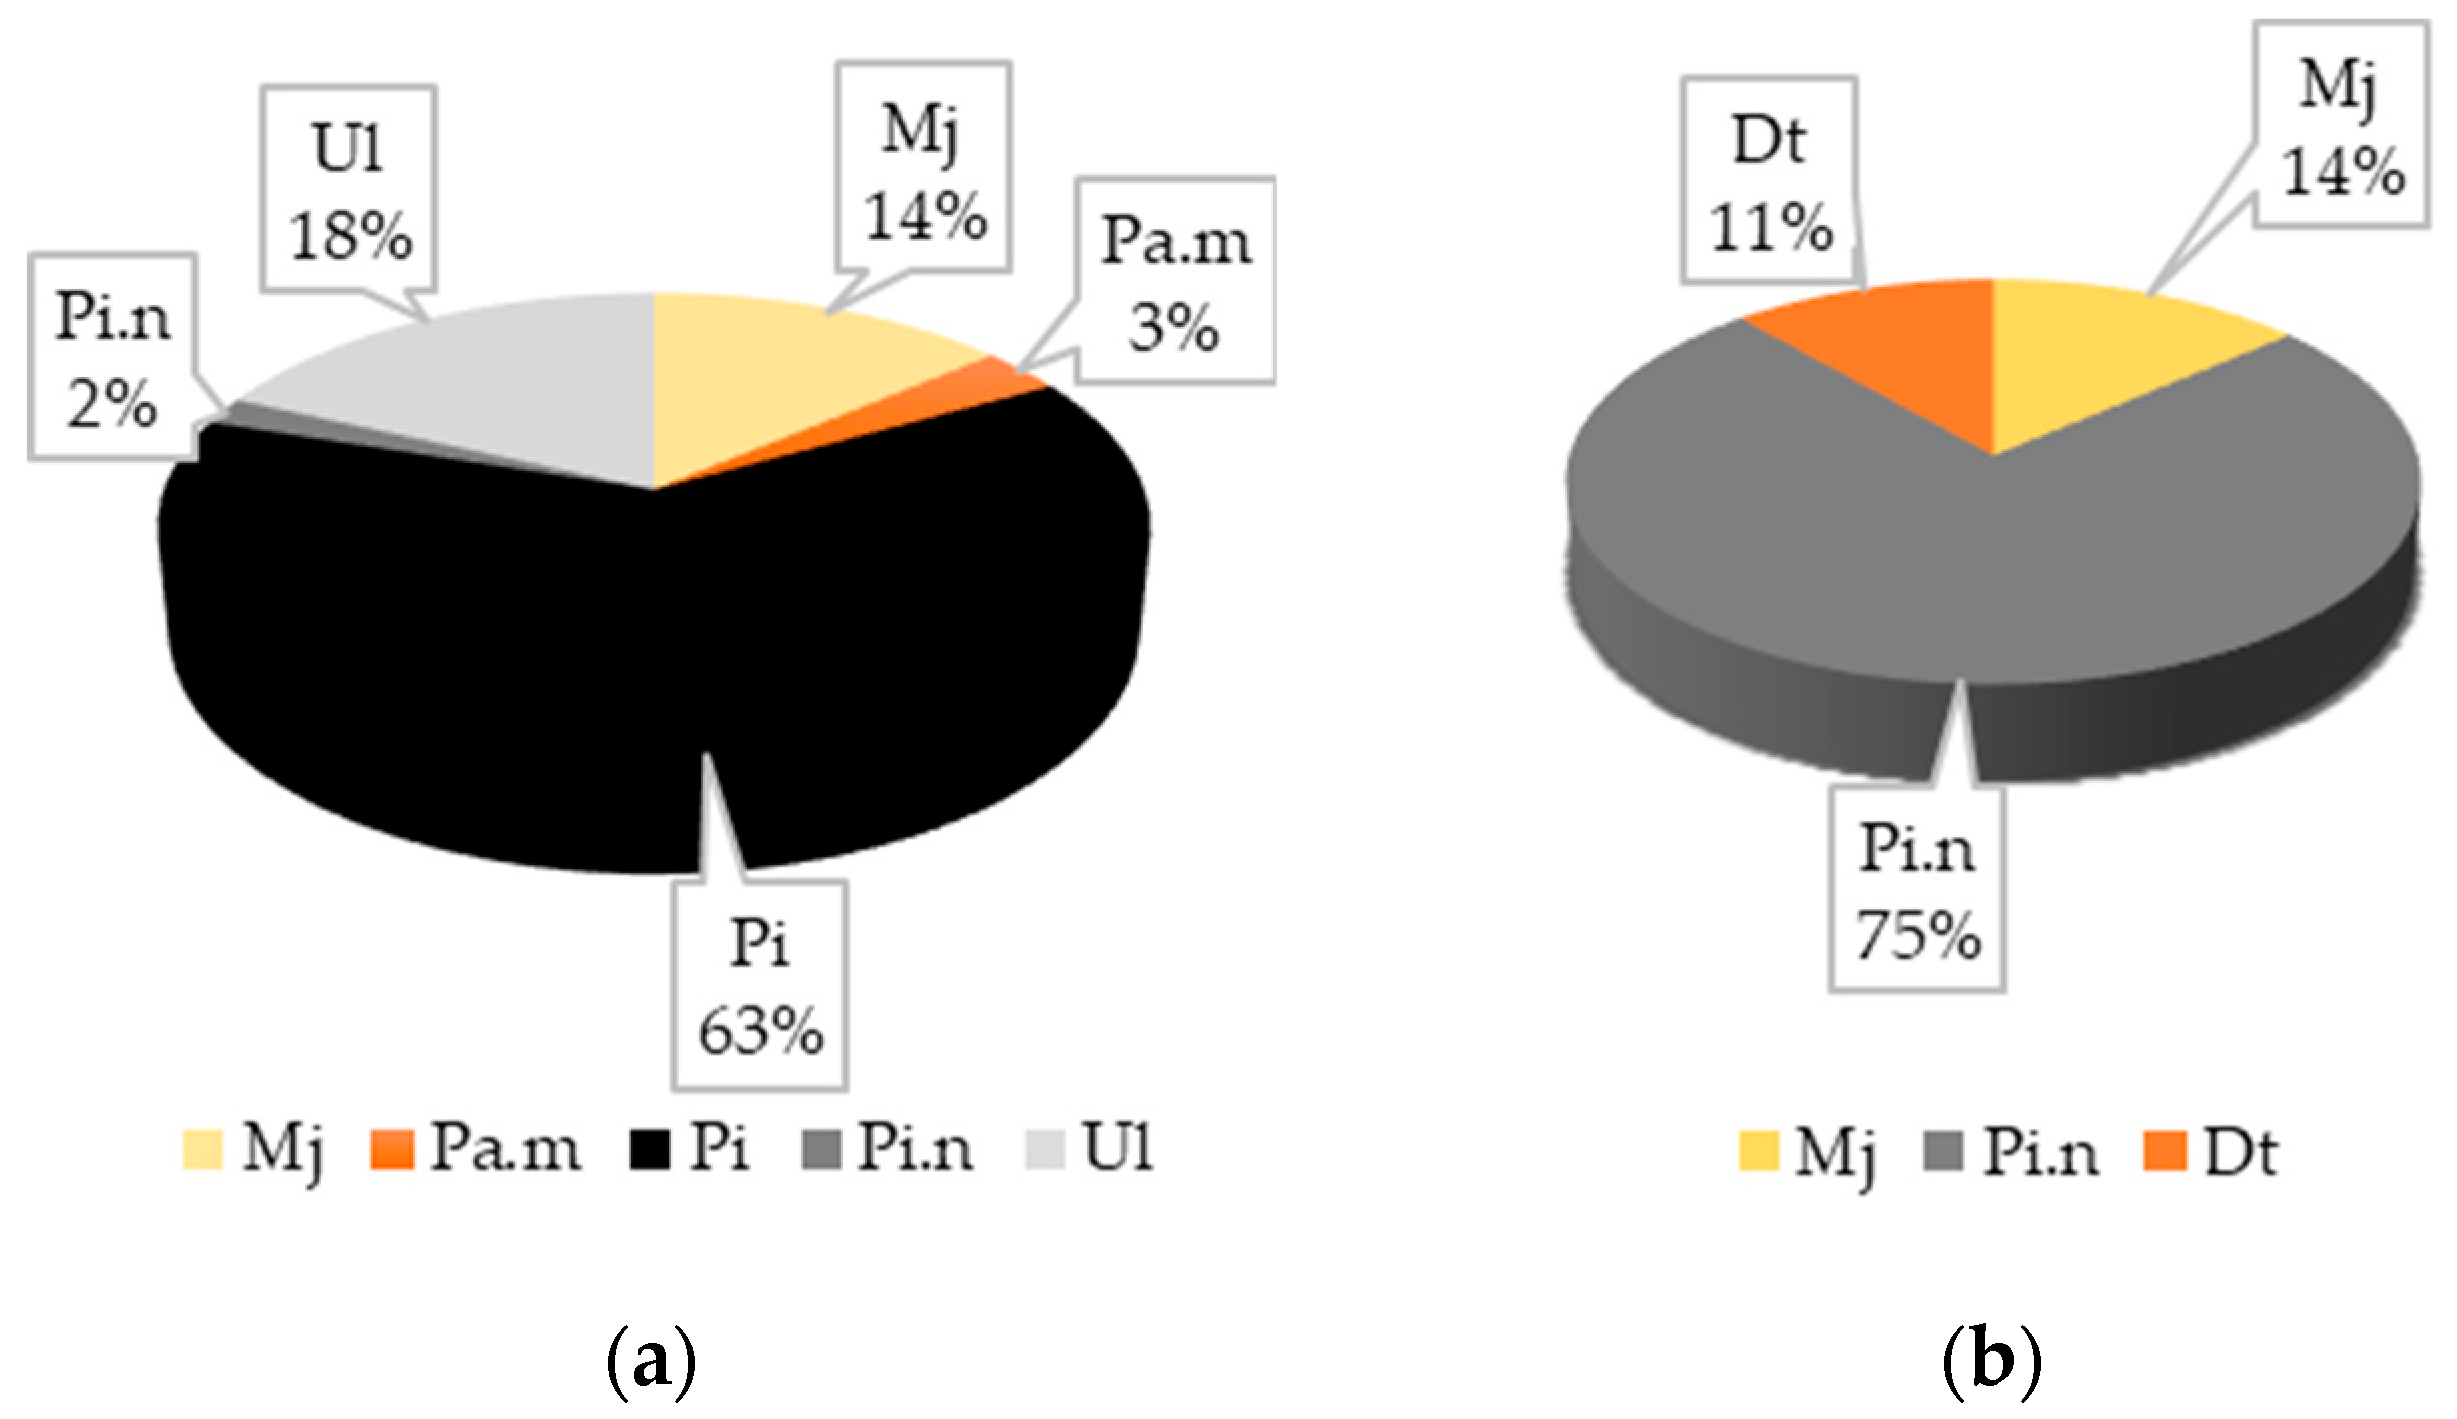
3.2.1. The Compositional Diversity of Pine Stands

The plantations on degraded lands were realized with different species and compositions (Table 1) after the application of some improvement works of the land, namely terraces supported by small fences, terraces supported by banquettes made of dry stone masonry, and terraces reinforced by vegetation with branches, stems, and thorns of sea buckthorn.
In the stands aged between 55 and 65 years (EP2 and EP3), composition is formed by Scots pine and black pine in a percentage of 20 to 98%; they are on moderately to strongly eroded lands and 82 to 92% on very strongly eroded fields, and they are complemented by disseminated broadleaved species (sycamore, European sweet cherry, Tatarian maple, etc.). The broadleaved species initially installed in an intimate mixture with pine, in a percentage of 30 to 40%, were eliminated, favoring the growth of pine percentages [32]. The stands from EP2 are mainly formed by proportions of Scots pine and European black pine (Figure 10a,b) as well as deciduous species (manna ash, common hornbeam, elm, sweet cherry, and mahaleb cherry). High proportions of black pine compared to Scots pine were obtained, the highest being in RP9 and EP2 (92%, Figure 10b).The stands from EP3 are occupied by Scots pine and black pine species in a proportion of 82%; the composition is completed by sycamore, Tartarian maple, and European sweet cherry (18%, Figure 11a,b).
The effect of abiotic factors (wind, snow, etc.) and the proportion of species in the evolution of stand composition on the structure of pine stands is significant.
The proportion of pine has been greatly reduced as a result of the injuries suffered (snow breaks and wind); in RP5, Scots pine, initially representing 50% in the composition (Table 1), was almost completely eliminated; a higher percentage in the current composition (91 to 92%) compared to the one after installation (70 to 80%) represents pine in situations where the mixture with hardwood species (sweet cherry, sycamore, etc.) was intimate (RP1 and RP2), with these being largely eliminated; the proportion of pine trees with defects in the crown, with the broken top and restored, or with a forked stem (caused by previous breaks) is also higher (33 to 51%) in these situations (RP1 and RP2). Between the two species of pine, Scots pine was the most strongly affected. The variability of pure pine stands, from the perspective of diameter and height, is generally high, as the populations are heterogenous if we consider the participation of all species in the stand (Table 4). If we refer only to the Scots pine and black pine populations, these are relatively homogenous from a statistical perspective. The same situation is present in the case of pine stands mixed with broadleaved species.
In the case where more species have appeared naturally in the experimental plots under the influence of abiotic factors, we can see a bilayer tendency, as shown in Figure 12a,b and Figure 13a,b. The determination coefficients (R2) express a close correlation between diameter and height. We were able to adjust the experimental values after a logarithmic regression equation: y = a·log(x)b, where y is height; x is basal diameter; a and b are the regression equation coefficients. The same model for both species is not comprehensive because their behavior in different even in the same environmental conditions (Figure 12a and Figure 13a).
A very strong correlation between total height (h) and basal diameter (DBH) was found for both species: R2 = 0.8683 for Scots pine, and R2 is between 0.4946 and 0.9038 for European black pine (Figure 13a,b).
In the case of the stands with lower age (45 years), the diversity of pine stands, both pure or mixed with broadleaved species (EP1), located in the FD3 sessile oak–common beech stand, on very strongly eroded and ravenous lands, is characterized by various compositions composed of Scots pine (26 to 42%) mixed with black pine (55 to 73%). The difference is represented by broadleaved species (manna ash, white alder, locust, etc.) that were naturally installed (Figure 14a,b).
Sea buckthorn, used to make vegetally reinforced terraces but also introduced in the afforestation composition in an intimate mixture with pines (Table 1), especially on very strongly eroded lands, ensured both the consolidation of the lands and the improvement of the soil. After the closure of the massif, the sea buckthorn dried up, favoring the development of young pines, which led to a greater structural diversity of pine stands.
In general, the variability of pure pine stands from the diameter and height perspective is reduced, with the variation index (cv%) under 30%. The populations are relatively homogenous if we consider the participation of all species in the stand (Table 5). Analyzing the height of the trees, when the two species are mixed, the superiority of the height of the Scots pine compared to that of the black pine was found.
The determination coefficients (R2) express a strong relationship between diameter and height (Figure 15a,b) for the Scots pine tree population.
In the stands aged over 70 years old (Table 6), in the internal forest-steppe site (Ssd) EP4, the pure stands of Scots pine and black pine are the main species, with over 60% proportion of participation in compositions (Figure 16a,b) on moderately to strongly eroded lands (E1 and E2), and they are complemented by disseminated broadleaved species or from natural regeneration (sycamore, elm, Tatarian maple, manna ash, etc.). The broadleaved species appeared in low proportions (not more than 15%) after the installation of pine species. We found a high proportion of participation in compositions by black pine species compared to Scots pine (Figure 17).

3.2.2. Analyzing the Stability of Scots Pine and Black Pine Stands

The effect of wind and snow on pine stands is different based on the stand age and composition as well as density (the number of trees per hectare). As a consequence of damage, the number of trees was reduced, including the consistency, leading to an increase in vital growing space. The effect of naturally reducing the number of trees causes increasing stability and is reflected in a reduced average slenderness index. Analyzing the relationship between diameter (DBH) and the slenderness index (I) in relation to the vulnerability domains for the main base species, i.e., pine, shows that as the diameter increases, the slenderness index decreases according to the power regression equation (Figure 18a–f). The relationships between the two analyzed parameters are negative and significant and are expressed for all vulnerability domains (Figure 18a–d, Figure 19a,b and Figure 20a,b).

Pine Stands with Age between 55 and 65 Years (RP1 and RP9-EP2; RP4, RP9 and RP10-EP3) and over 70 Years (RP6 and RP9-EP4)

In the pine stands aged between 55 and 65 years, the value of the average slenderness index per stand for the pine species indicates a low vulnerability of pine species towards wind and snow (Figure 18a–d). The main species from the stand’s composition are situated in the low-vulnerability domain (Scots pine) and in the moderate-vulnerability domain (black pine). The explanation resides in the stand’s age (55 years) as well as in the strong damages suffered previously, in which trees with small diameters and high slenderness index were affected (I > 1.00). This is typical for the even-aged pine stands and expresses the presence of a large number of trees that, in the presence of light and with high thickness, migrate from an inferior cenotic class towards the middle or even superior ones. The growth in height becomes superior to that in basal diameter, generating slenderness indexes that exceed the value of 1.00. In regard to the distribution of the number of remaining trees (%) on vulnerability domains, we concluded that the low-vulnerability domain (I < 0.80) is the best represented one, with an average of 64.01% of the total number of pine trees (N) (Figure 18a,d), and it is characterized by values between 50.45% (RP9 and EP2) and 81.82% (RP10 and EP3). The moderate-vulnerability domain (I between 0.80 and 1.00), with an average of 30.11% from N, has a percentage of trees remaining in N being situated between 18.18% (RP10 and EP3) and 39.64% (RP9 and EP2). The high-vulnerability domain (I > 1.00) has an average of 5.88% from N, with values between 3.77% (RP1 and EP2) and 9.91% (RP9 and EP2), which were significant only in the black pine stands mixed with Scots pine or in pure pine stands (RP9—Pi.n; RP10—Pi) (Figure 18b,c).
In the pine stands aged over 70 years, from the internal forest-steppe site (Ssd), the moderate vulnerability domain is the most representative one, with a proportion of 52.63% from the total number of Scots pine trees, with a mean basal diameter ( d ¯ ) of 24.97 ± 3.23 cm and with corresponding a mean height ( h ¯ ) of 22.11 ± 3.28 m (EP4 and RP6). The low-vulnerability domain is represented by a proportion of 37.89% from the total number of Scots pine trees, with a mean basal diameter ( d ¯ ) of 32.39 ± 3.94 cm, which corresponds to a mean height ( h ¯ ) of 22.53 ± 2.93 m (RP6). The high-vulnerability domain is represented by a proportion of 9.47% from the total number of Scots pine trees, with a mean basal diameter ( d ¯ ) of 21.17 ± 1.50 cm, which corresponds to a mean height ( h ¯ ) of 24.00 ± 2.05 m (RP6).
In stands of pure black pine (RP9), the low-vulnerability domain is the most representative one, with a proportion of 57.58% from the total number of black pine trees, with a mean basal diameter ( d ¯ ) of 29.28 ± 4.17 cm corresponding to a mean height ( h ¯ ) of 19.95 ± 3.24 m (EP4 and RP9). The moderate-vulnerability domain is represented by a proportion of 36.36% from the total number of black pine trees, with a mean basal diameter ( d ¯ ) of 22.42 ± 2.91 cm corresponding to a mean height ( h ¯ ) of 20.28 ± 2.75 m (RP9). The high-vulnerability domain is represented by a proportion of 6.06% from the total number of black pine trees, with a mean basal diameter ( d ¯ ) of 21.58 ± 0.75 cm corresponding to a mean height ( h ¯ ) of 27.33 ± 4.53 m (RP9).

Pine Stands with Ages of 45 Years (RP5 and RP9-EP1)

The average slenderness index for pine species from the stands’ compositions indicates a high vulnerability towards wind and snow. The high-vulnerability domain (I > 1.00) ranges between the averages of 17.07% (RP5 and EP1) and 29.82% (RP9 and EP1) for the Scots pine species, respectively, and between 17.14% (RP9 and EP1) and 31.58% (RP5 and EP1) for the black pine.
The moderate-vulnerability domain (I between 0.80 and 1.00), with an average interval between 40.00 and 65.85% (RP8, Pi) for the total number of trees, represents the highest percentage occupied by pine trees. For the domain with a low vulnerability (I < 0.80), the average ranges are between 12.28 and 42.86% of N, with the maximum of viable trees obtained from RP9 (Figure 20a,b). The framing within the moderate- and high-vulnerability domains is produced at a value lower than 16 cm in basal diameter compared with the value of the basal diameter of the basal area ( d ¯ g ). The structure of younger stands (45 years), with a larger number of trees per hectare and with a higher consistency (over 0.80), determines the predisposition towards crown or stalk breaks, tiltings and treefalls, as well as interior wood damages. Under a statistical report (Table 7), we analyzed the four cases between which the means and variances were compared for the two populations with different ages but originating from the same phytoclimatic storey. Compared with the harmful abiotic factors (wind, snow, etc.), at different ages, the difference between the means and variances of slenderness index (I) do not differentiate intraspecifically or interspecifically for both Scots pine and black pine species in moderate- and high-vulnerability domains. However, it was found that the differences between the means and variances are significant in the low-vulnerability domain only in black pine stands, with a coverage percentage probability of 95%.

4. Discussion

In some studies, the diversity was improved by using Scots pine as an important element for disturbed stands under the climatic and site conditions. Besides this, as in our research, Scots pine creates specific conditions for hardwood species (oak, beech, etc.), which form populations with homogenous structures. The effects of harmful abiotic factors, analyzed individually or in covariance, correlated with poor environmental characteristics definitive of degraded lands from the Curvature Subcarpathians, creating an imbalance in the resistance–equilibrium relationship. Furthermore, these aspects were observed in past experiments by specialists in ecological reconstruction and degraded land afforestation domains, in which the effects of exogenous factors (wind, snow) were proven after a successive inventory at an interval of 5 or 10 years, based on the evolution of the pine stand structure [32]. As trees advance in age, the ratio between crown diameter (Dc) and base diameter (DBH) decreases, especially when silvicultural interventions are of a weak intensity.
The average tree crown diameter (Dc), determined as the average between crown lengths in two directions (N-S and E-W) on the horizontal plane and the crown relative length (Lc%) on the vertical plane, is considered an important biometric characteristic in expressing stand structure. Generally speaking, the variability of crown diameter is more stable around large diameters of trees from the superior level and situated in superior positional Kraft classes (I, II). Trees framed here have a major advantage in regard to crown development on the horizontal plane.
The research conducted by [33,34] analyzed the wind effect on tree stalks as being dominated by the effect of emitted vibrations as well as by changes that appear in the structure and diversity evolution. Other studies [35,36] from pine stands have justified the fact that tree stability in vulnerability domains is a particularity that can be correlated with the slenderness index. It was observed that as the stand advances in age, the slenderness index decreases together with an increase in diameter, a fact that was also observed in the present study.
The presence of a relatively reduced number of trees in the high-vulnerability domain was produced only in the case of pine stands aged by 55–65 years, a fact that was also demonstrated in the case of pine stands analyzed on degraded lands (RP10 and EP3; RP9 and EP2). The dynamic of the slenderness index values inclines towards a higher stability in the vulnerability domain characteristic for the trees situated in superior diameter classes, where the basal diameter is higher than the mean diameter of the basal area (BA). This explains why trees with low and average diameters do not obtain high stability, as the competition between trees and the dependence on light is not very accentuated.
The tendency is to occupy favorable positions in the stand by evolving on a cenotic scale.
Previous research has found the high stability against wind and snow action of trees situated in the vulnerability domain with slenderness indexes between 0.75 and 0.80, while stands that have reached the exploitability age show a more accentuated negative reaction in regard to stand stability against wind and snow effects [37].
The effects of harmful abiotic factors have caused instability in pine stands located in internal forest-steppe sites [38,39,40,41], and this is evidenced by important losses in the leaf apparatus and drying of the samples present, especially in the superior cenotic classes with very strongly affected stands (over 60% trees affected by drought or breaks or with the consistency under 0.4, pure, and without natural regeneration). In pine stands installed on degraded lands, it was shown that the influence of the dynamics of average diameters can be expressed by using factorial predictors such as age, phytoclimatic zone, and the degradation form.
The relationship between the mean height of the medium tree (hg) and the age of pine stands is significantly influenced by the phytoclimatic storey and the degradation form [37]. From the point of view of production, the analyses showed that wood production (m3·ha−1) recorded in the pine stands on degraded land is different in relation to the shape and intensity of degradation, phytoclimatic storey, age of the stand, and the proportion of pines in the composition of the stand [42,43,44,45]. The development of crowns on the horizontal level offers trees a higher capacity to accumulate wood mass in the transversal section. However, this must take into account the influence of age.
Generally speaking, stands with advanced age show an intensification in diameter growth to the detriment of height growth. In this way, the slenderness index is stabilized due to the dynamic of subunit values, which ensures a higher stand stability in time. Studies [46,47,48,49,50] indicated that dominant trees have a lower maximum foliage density than suppressed trees, which tend to have the bulk of their foliage in the upper half of the crown. On the other hand, the absolute density varied considerably according to crown length and width. Absolute foliage density was greatest in the most dominant trees of the younger stands.
The distribution of the vertical foliage mass from the stems was fitted according to both polynomial and log-linear regression estimation, as in our case. According to this, the best-fit regression was linear (y = a·x + b), where y is the ratio of foliage mass to branch cross-sectional area, and x is the relative distance from the top. By comparing our results, we obtained positive and significant correlations between the crown biometry characteristics (Dc and Lc%) and the basal diameter by applying both linear and logarithmic regression equations.

5. Conclusions

  • The dynamic of structural parameters (diameter and height) in the forest cultures installed on degraded lands from the sessile oak–common beech phyto-climatic storey is significantly influenced by the complex of local harmful abiotic and biotic factors;
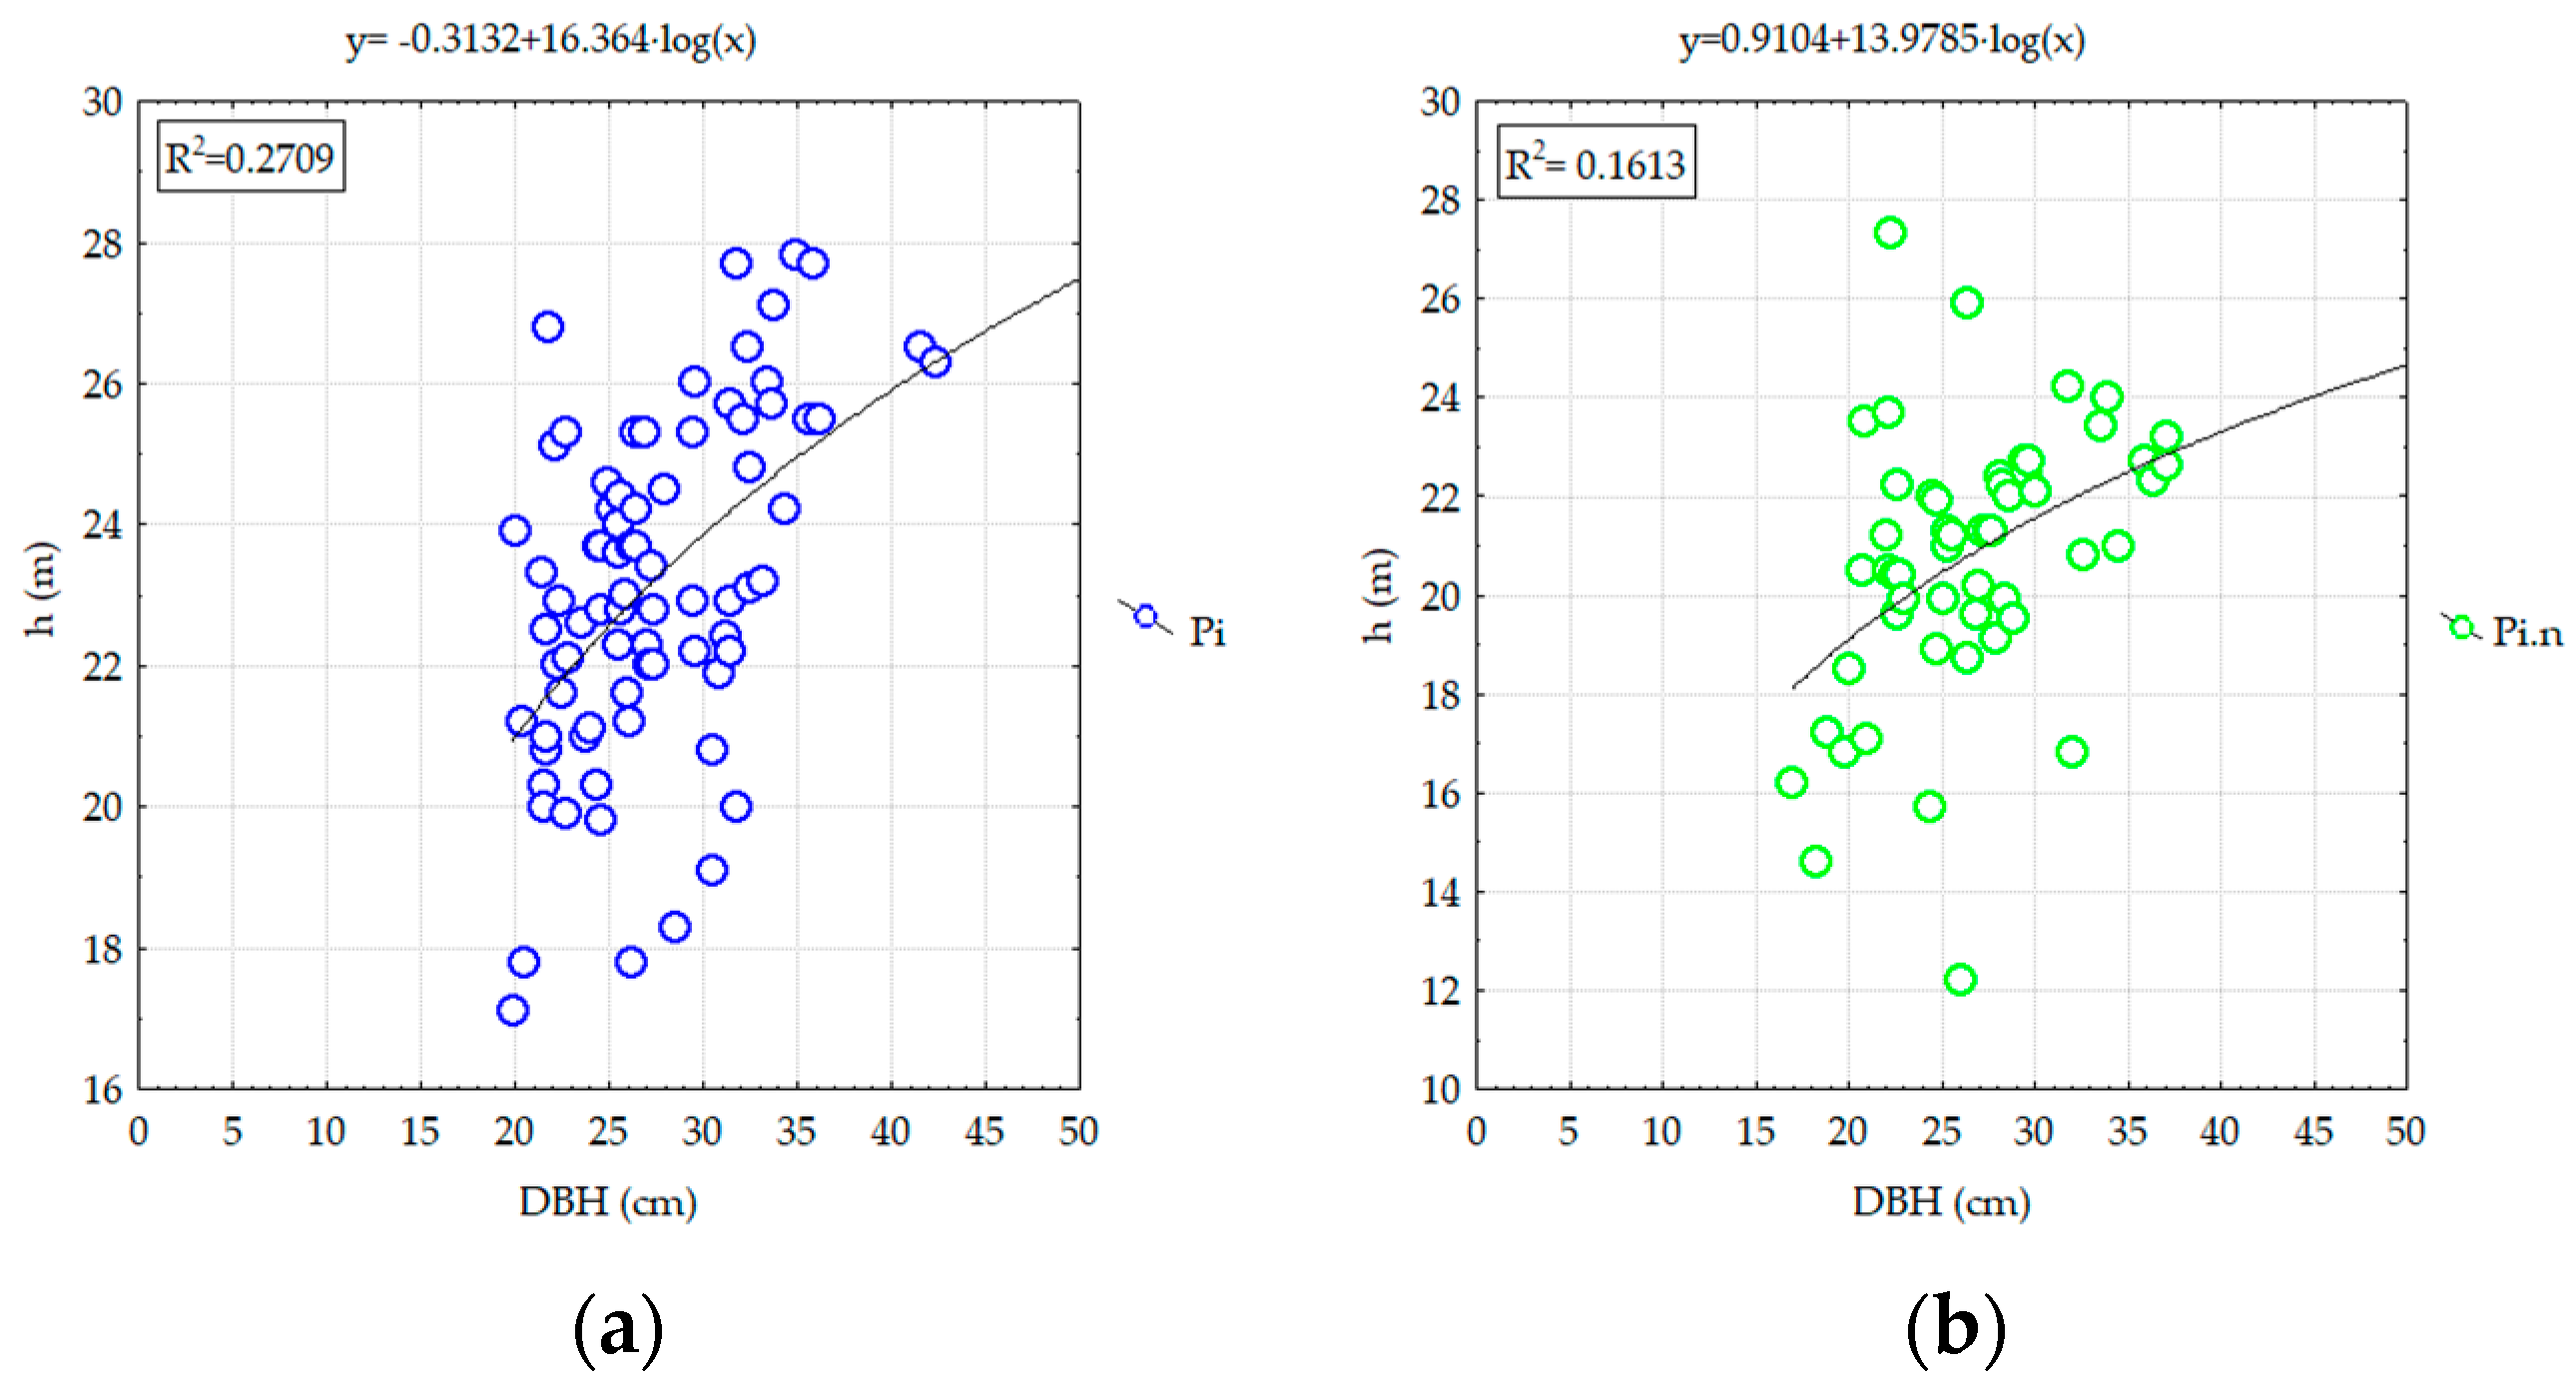
  • The structural characteristics record significant differences firstly between the means of both the diameters and heights of its component species (pine and broadleaved), with the dimensions being superior for pine. Secondly, we found superior structural characteristics for Scots pine compared with black pine in identical environmental conditions;
  • The evolution of stands from degraded lands goes in the direction of their diversification under a structural aspect. Stands composed of more species (mixtures of pine with broadleaved) are more stable than pure pine stands;
  • In the case that we did not note the presence of species other than the ones initially used in creating the cultures, and when the influence of the abiotic factors was insignificant, the experimental distribution of trees into diameter classes followed the normal theoretical distribution and the beta theoretical frequency curve. In the case that more species were noted, the bilevel tendency of pine stands was evident through the observation of a new vegetation storey composed of local broadleaved species installed naturally;
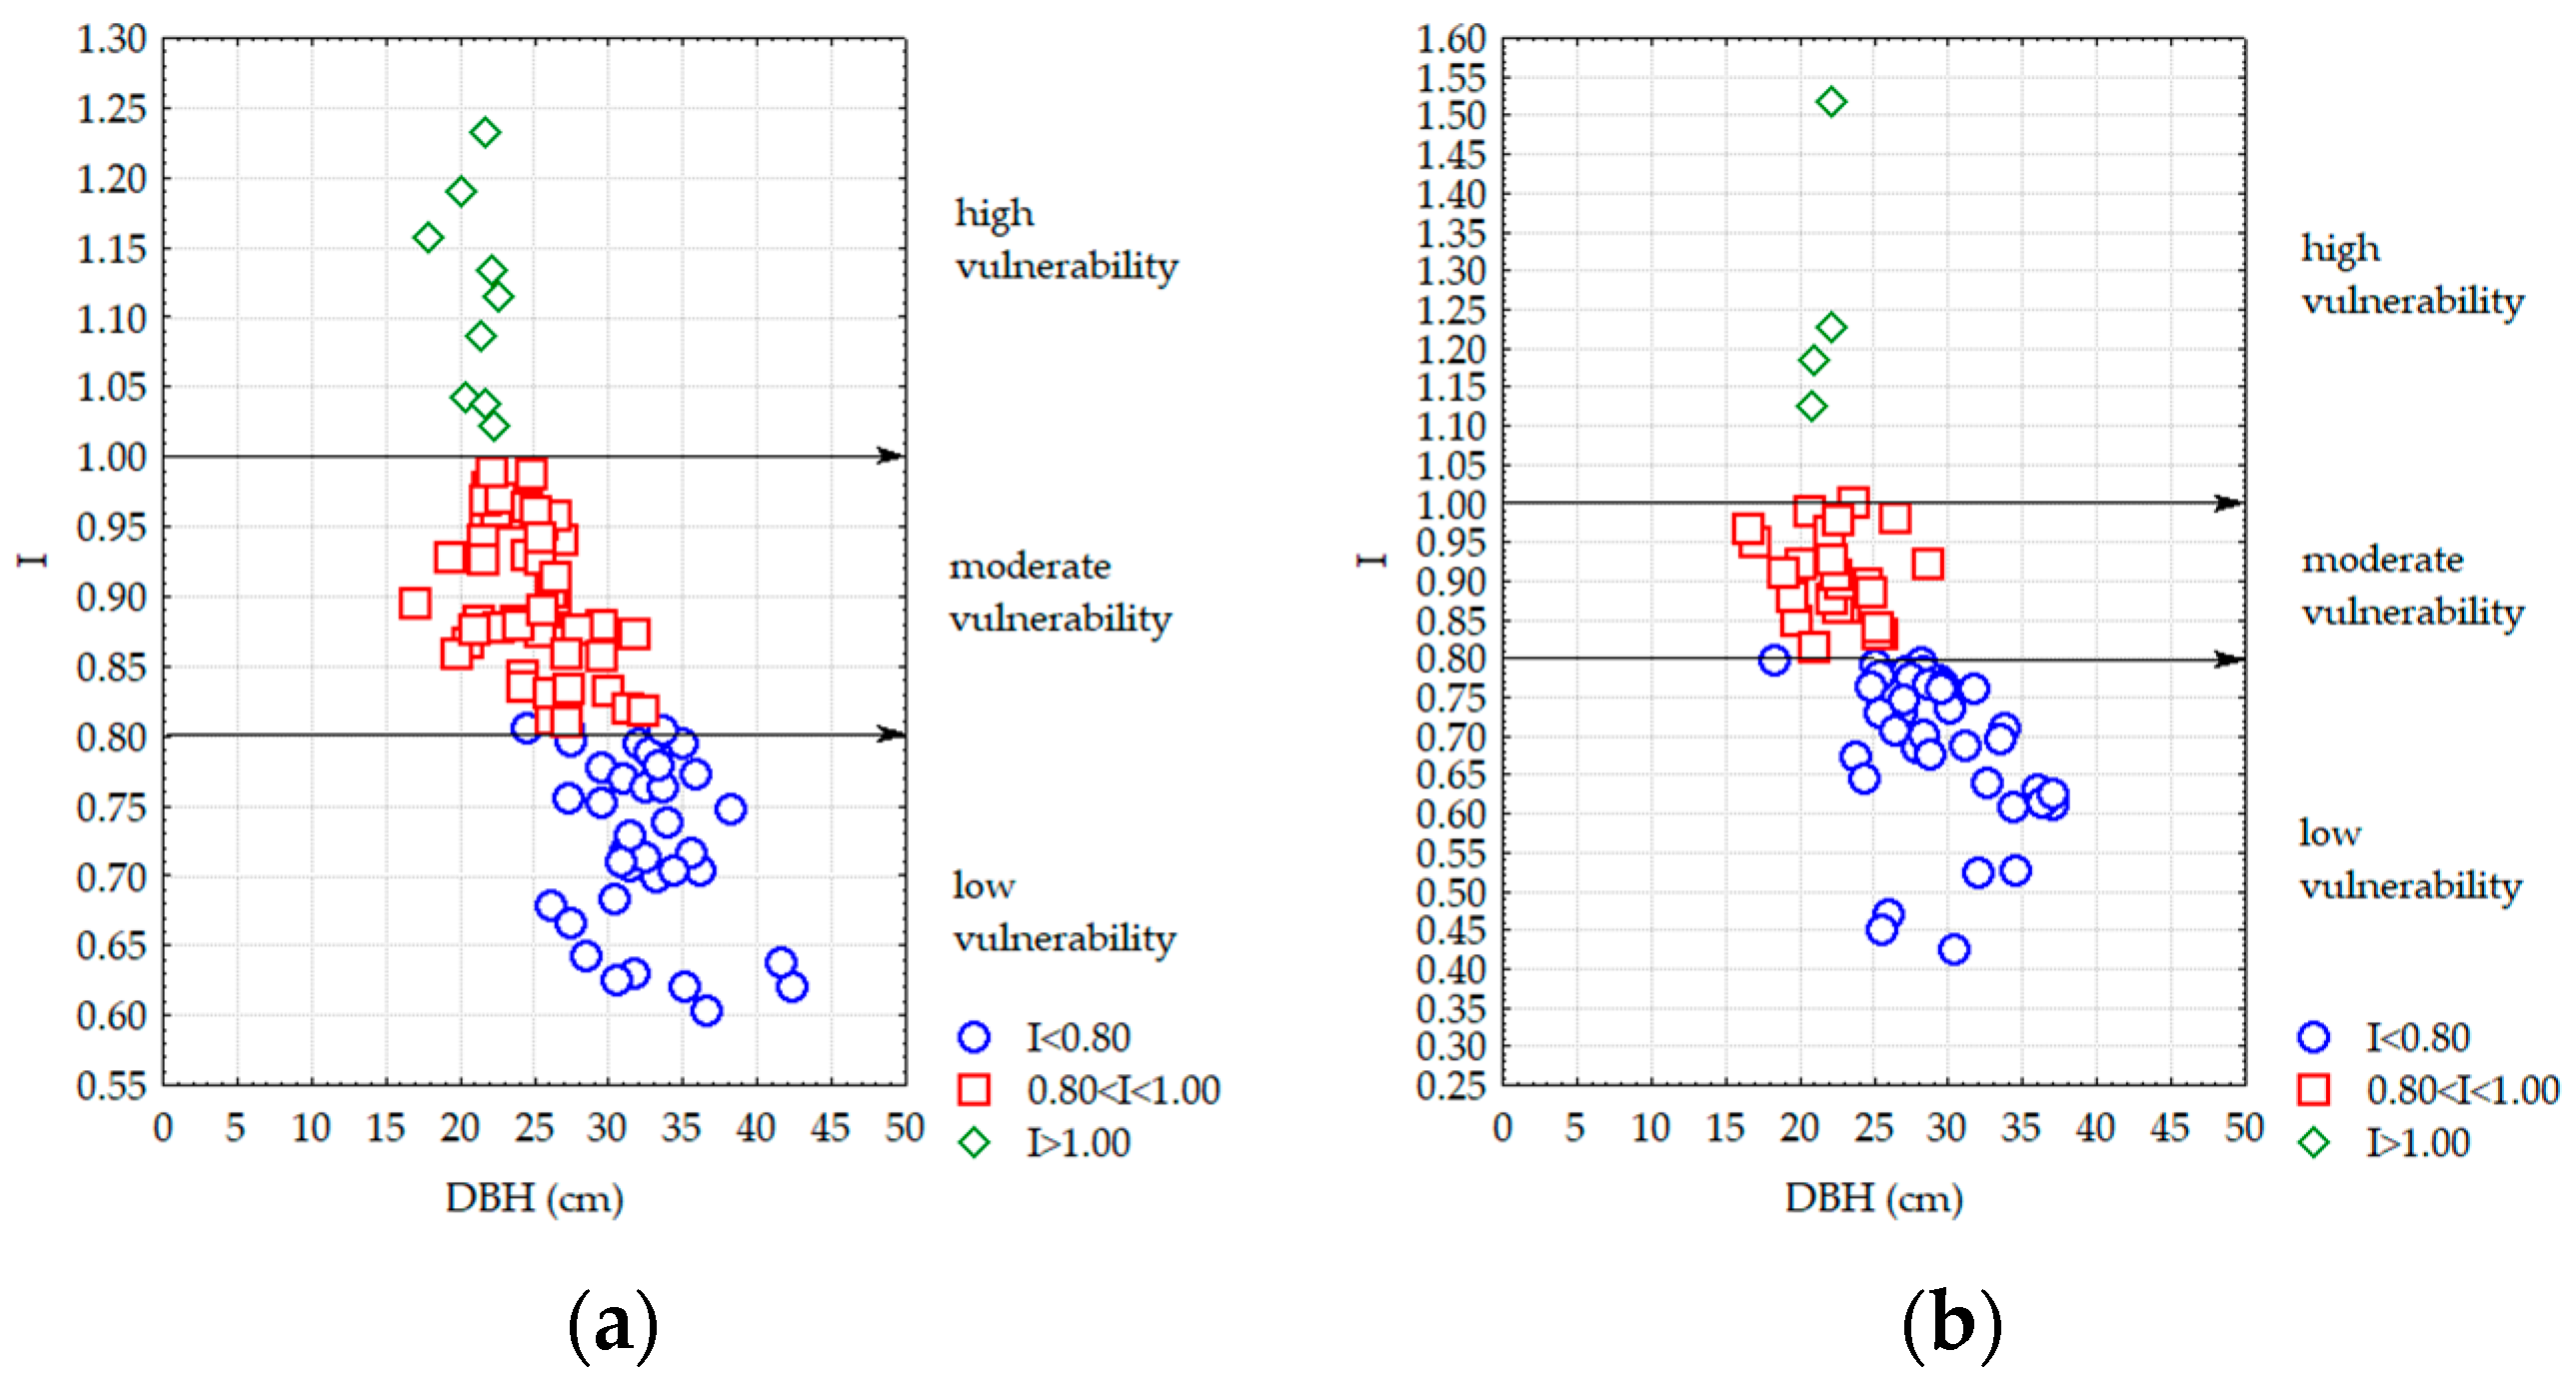
  • From the perspective of stand stability, the main species (Scots pine or black pine) are situated in the moderate-vulnerability and high-vulnerability domain for young stands (40 years), with a high consistency and density. Stands with advanced ages (over 50 years) are characterized by a low vulnerability of pine species towards wind and snow, having reduced consistencies and densities;
  • Much younger pine stands with diameters under 16 cm are situated in the moderate- and high-vulnerability domain due to the fact that they have a larger number of trees and have not yet been affected by wind and snow or other harmful factors;
  • Stands over 50 years in age and with diameters higher than 22 cm are situated in the low-vulnerability domain because during their evolution, most of the pines from the vegetation storey were affected by snow and wind;
  • Taking into account the harmful abiotic factors (wind, snow, etc.), in the moderate- and high-vulnerability domains, there are no significant differences between the means and variances of slenderness indexes. However, the statistical results showed significant differences between the means and variances at low vulnerability;
  • Monitoring the evolution of pine stands by investigating the structure and diversity will lead to establishing the optimal moments for intervention with silvotechnical works in order to ensure the sustainable management of forest ecosystems from degraded lands.

Author Contributions

Conceptualization, C.C., V.R., L.C.D. and T.C.; methodology, C.C., T.C. and L.C.D.; software, T.C.; formal analysis, C.C. and V.R.; investigation, C.C., L.P., V.R. and V.C.; data curation, T.C. and V.R.; writing—original draft preparation, C.C., T.C. and V.R.; writing—review and editing, L.C.D. and V.R. All authors have read and agreed to the published version of the manuscript.

Funding

This research received financed by the Romanian Ministry of Research, Innovation and Digitization, within the Nucleu FORCLIMSOC Programme (Contract no. 12N/2023)/Project PN23090203.

Institutional Review Board Statement

Not applicable.

Informed Consent Statement

Informed consent was obtained from all subjects involved in the study.

Data Availability Statement

The original contributions presented in the study are included in the article, further inquiries can be directed to the corresponding author.

Acknowledgments

This research work carried out with the support of the Romanian Ministry of Research, Innovation and Digitization, within the Nucleu FORCLIMSOC Programme (Contract no. 12N/2023)/Project PN23090203 with the title ”New scientific contributions for the sustainable management of torrent control structures, degraded lands, shelter-belts and other agroforestry systems in the context of climate change”.

Conflicts of Interest

The authors declare no conflicts of interest.

References

  1. Dincă, L.; Achim, F. The management of forests situated on fields susceptible to landslides and erosion from the Southern Carpathians. Sci. Pap. Ser. Manag. Econ. Eng. Agric. Rural Dev. 2019, 19, 183–188. [Google Scholar]
  2. Janis, D.; Renate, S.; Oskars, K.; Edgars, D.; Mara, K.; Aris, J. A Financial Assessment of Windstorm Risks for Scots Pine Stands in Hemiboreal Forests. Forests 2020, 11, 566. [Google Scholar] [CrossRef]
  3. Silvestru-Grigore, C.V.; Dinulică, F.; Spârchez, G.; Hălălișan, A.F.; Dincă, L.; Enescu, R.; Crișan, V. The radial growth behaviour of pines (Pinus sylvestris L. and Pinus nigra Arn.) on Romanian degraded lands. Forests 2018, 9, 213. [Google Scholar] [CrossRef]
  4. Traci, C.; Untaru, E. Behavior and enhancement and consolidation effect of forestry plantation on degraded lands in experimental perimeters. In ICAS; 2nd series; Redacția de propagandă tehnică agricolă publishing House: Bucharest, Romania, 1986; p. 70. [Google Scholar]
  5. Dincă, L.; Murariu, G.; Enescu, C.M.; Achim, F.; Georgescu, L.; Murariu, A.; Timiș-Gânsac, V.; Holonec, L. Productivity differences between southern and northern slopes of Southern Carpathians (Romania) for Norway spruce, silver fir, birch and black alder. Not. Bot. Horti Agrobot. Cluj-Napoca 2020, 48, 1070–1084. [Google Scholar] [CrossRef]
  6. Fedorca, A.; Popa, M.; Jurj, R.; Ionescu, G.; Ionescu, O.; Fedorca, M. Assessing the regional landscape connectivity for multispecies to coordinate on-the-ground needs for mitigating linear infrastructure impact in Brasov—Prahova region. J. Nat. Conserv. 2020, 58, 125903. [Google Scholar] [CrossRef]
  7. Lohmander, P.; Mohammadi, Z.; Kašpar, J.; Tahri, M.; Berčák, R.; Holuša, J.; Marušák, R. Future forest fires as functions of climate change and attack time for central Bohemian region, Czech Republic. Ann. For. Res. 2022, 65, 17–30. [Google Scholar] [CrossRef]
  8. Murariu, G.; Dinca, L.; Tudose, N.; Crisan, V.; Georgescu, L.; Munteanu, D.; Dragu, M.D.; Rosu, B.; Mocanu, G.D. Structural Characteristics of the Main Resinous Stands from Southern Carpathians, Romania. Forests 2021, 12, 1029. [Google Scholar] [CrossRef]
  9. Fedorca, A.; Fedorca, M.; Ionescu, O.; Jurj, R.; Ionescu, G.; Popa, M. Sustainable landscape planning to mitigate wildlife–vehicle collisions. Land 2021, 10, 737. [Google Scholar] [CrossRef]
  10. Portoghesi, L.; Tomao, A.; Bollati, S.; Mattioli, W.; Angelini, A.; Agrimi, M. Planning coastal Mediterranean stone pine (Pinus pinea L.) reforestations as a green infrastructure: Combining GIS techniques and statistical analysis to identify management options. Ann. For. Res. 2022, 65, 31–46. [Google Scholar] [CrossRef]
  11. Chmura, D.J.; Rożkowski, R.; Guzicka, M.; Dorobek, K. Variation in aboveground biomass carbon accumulation in Scots pine seed orchards progeny. Ann. For. Res. 2021, 64, 139–148. [Google Scholar] [CrossRef]
  12. Bigler, C.; Braker, O.U.; Bugmann, H.; Dobbertin, M.; Rigling, A. Drought as an Inciting Mortality Factor in Scots Pine stands of the Valais, Swizerland. Ecosystems 2006, 9, 330–343. [Google Scholar] [CrossRef]
  13. Ilek, A.; Nowak, M.; Błonska, E. Seasonal changes in water absorbability of some litterfall components in Scots pine stands differing in age. Ann. For. Res. 2021, 64, 149–164. [Google Scholar] [CrossRef]
  14. Constandache, C.; Peticilă, A.; Dincă, L.; Vasile, D. The usage of Sea Buckthorn (Hippophae rhamnoides L.) for improving Romania’s degraded lands. AgroLife Sci. J. 2016, 5, 50–58. [Google Scholar]
  15. Dinca, L.; Marin, M.; Vlad, R.; Murariu, G.; Drasovean, R.; Cretu, R.; Georgescu, L.; Timiș-Gânsac, V. Which are the Best Site and Stand Conditions for Silver Fir (Abies alba Mill.) Located in the Carpathian Mountains? Diversity 2022, 14, 547. [Google Scholar] [CrossRef]
  16. Constandache, C.; Dincă, L.; Tudor, C. The bioproductive potential of fast-growing forest species on degraded lands. Sci. Pap. Ser. E Land Reclam. Earth Obs. Surv. Environ. Eng. 2020, IX, 87–93. [Google Scholar]
  17. Tkach, V.; Tarnopilska, O.; Luk’yanets, V.; Musienko, S.; Kobets, O.; Rumiantsev, M.; Bondarenko, V. Density optimisation of pine plantations in the Left-Bank Steppe in Ukraine. Folia For. Pol. Ser. A—For. 2024, 66, 104–117. [Google Scholar] [CrossRef]
  18. Niţescu, C.; Achimescu, C. Technique of Silvicultural Crops. Tending and Management Operations of Stands; Ceres: Bucharest, Romania, 1979; p. 256. [Google Scholar]
  19. Sidor, C.G.; Camarero, J.J.; Popa, I.; Badea, O.; Apostol, E.N.; Vlad, R. Forest vulnerability to extreme climatic events in Romanian Scots pine forests. Sci. Total Environ. 2019, 678, 721–727. [Google Scholar] [CrossRef]
  20. Hanewinkel, M.; Cullmann, D.A.; Schelhaas, M.J.; Nabuurs, G.J.; Zimmemann, N.E. Climate change may cause severe loss in the economic value of European forest land. Nat. Clim. Chang. 2013, 3, 203–207. [Google Scholar] [CrossRef]
  21. Oberhuber, W.; Stumbock, M.; Kofler, W. Climate tree-growth relationships of Scots Pine Stands (Pinus sylvestris, L.), exposed to soil dryness. Trees 1998, 13, 19–27. [Google Scholar] [CrossRef]
  22. Rigling, A.; Waldner, P.O.; Forster, T.; Braker, O.U.; Pouttu, A. Ecological interpretation of tree-ring width and intraannual density fluctuations in Pinus sylvestris on dry sites in the central Alps and Siberia. Can. J. For. Res. 2001, 31, 18–31. [Google Scholar] [CrossRef]
  23. Rebetez, M.; Dobbertin, M. Climate change may already threaten scots pine stands in the Swiss Alps. Theor. Appl. Climatol. 2004, 79, 1–9. [Google Scholar] [CrossRef]
  24. Weber, P.; Bugmann, H.; Rigling, A. Radial growth responses to drought of Pinus Sylvestris and Quercus pubescens in an inner- Alpine dry valley. J. Veg. Sci. 2007, 18, 777–792. [Google Scholar]
  25. Pichler, P.; Oberhuber, W. Radial growth response of coniferous forest trees in inner Alpine environment to heat-wave in 2003. For. Ecol. Manag. 2007, 242, 688–699. [Google Scholar] [CrossRef]
  26. Petrescu, L. Guide for Tending Operations of Stands; Ceres publishing House: Bucharest, Romania, 1971. [Google Scholar]
  27. Petrescu, L.; Haring, P. Periodicity and Intensity of Cleanings and Thinnings in Spruce and Scots Pine Stands; Foresty Publishing: Bucharest, Romania, 1977; pp. 159–164. [Google Scholar]
  28. Zang, C.; Hartl-Meier, C.; Dittmar, C.; Rothe, A.; Menzel, A. Patterns of drought tolerance inmajor European temperate forest trees: Climatic drivers and levels of variability. Glob. Chang. Biol. 2014, 20, 3767–3779. [Google Scholar] [CrossRef]
  29. Szmyt, J.; Dobrowolska, D. Spatial diversity of forest regeneration after catastrophic wind in northeastern Poland. iForest 2015, 9, 414–421. [Google Scholar] [CrossRef]
  30. Schindler, D.; Kolbe, S. Assessment of the Response of a Scots Pine Tree to Effective Wind Loading. Forests 2020, 11, 145. [Google Scholar] [CrossRef]
  31. Leahu, I. Dendrometry; Didactical and Pedagogical Publishing House: Bucharest, Romania, 1994; p. 374. [Google Scholar]
  32. Constandache, C.; Tudor, C.; Popovici, L.; Vlad, R. The state and behavior of some forestry cultures installed on degraded lands in the forest-steppe site. AgroLife Sci. J. Sci. Pap. Ser. E Land Reclam. Earth Obs. Surv. Environ. Eng. 2023, XII, 215–223. [Google Scholar]
  33. Díaz-Yáñez, O.; Mola-Yudego, B.; González-Olabarria, J.R.; Pukkala, T. How does forest composition and structure affect the stability against wind and snow? For. Ecol. Manag. 2017, 401, 215–222. [Google Scholar] [CrossRef]
  34. Castedo-Dorado, F.; Crecente-Campo, F.; Álvarez-Álvarez, P.; Barrio-Anta, M. Development of a stand density management diagram for radiata pine stands including assessment of stand stability. Forestry 2009, 82, 1–16. [Google Scholar] [CrossRef]
  35. Kamimura, K.; Gardiner, B.; Dupont, S.; Guyon, D.; Meredieu, C. Mechanistic and statistical approaches to predicting wind damage to individual maritime pine (Pinus pinaster) trees in forests. Can. J. For. Res. 2016, 46, 88–100. [Google Scholar] [CrossRef]
  36. Brichta, J.; Vacek, S.; Vacek, Z.; Cukor, J.; Mikeska, M.; Bílek, L.; Šimůnek, V.; Gallo, J.; Brabec, P. Importance and potential of Scots pine (L.) in 21 century. Cent. Eur. For. J. 2023, 69, 3–20. [Google Scholar]
  37. Vlad, R.; Constandache, C.; Dincă, L.; Tudose, N.C.; Sidor, C.G.; Popovici, L.; Ispravnic, A. Influence of climatic, site and stand characteristics on some structural parameters of scots pine (Pinus sylvestris) forests situated on degraded lands from East Romania. Range Mgmt. Agrofor. 2019, 40, 40–48. [Google Scholar]
  38. de Wergifosse, L. Simulating Tree Growth Response to Climate Change in Structurally-Complex Oak and Beech Stands across Europe. UCLouvain, Louvain-la-Neuve. 2021. Available online: https://dial.uclouvain.be/pr/boreal/object/boreal%3A250188/datastream/PDF_02/view (accessed on 1 March 2024).
  39. Dang, H.; Han, H.; Chen, S.; Li, M. A fragile soil moisture environment exacerbates the climate change-related impacts on the water use by Mongolian Scots pine (Pinus sylvestris var. mongolica) in northern China: Long-term observations. Agric. Water Manag. 2021, 251, 106857. [Google Scholar] [CrossRef]
  40. Belokopytova, L.V.; Zhirnova, D.F.; Krutovsky, K.V.; Mapitov, N.B.; Vaganov, E.A.; Babushkina, E.A. Species-and age-specific growth reactions to extreme droughts of the keystone tree species across forest-steppe and sub-taiga habitats of South Siberia. Forests 2022, 13, 1027. [Google Scholar] [CrossRef]
  41. Hessburg, P.F.; Miller, C.L.; Parks, S.A.; Povak, N.A.; Taylor, A.H.; Higuera, P.E.; Prichard, S.J.; North, M.P.; Collins, B.M.; Hurteau, M.D.; et al. Climate, environment, and disturbance history govern resilience of western North American forests. Front. Ecol. Evol. 2019, 7, 239. [Google Scholar] [CrossRef]
  42. Pretzsch, H.; del Río, M.; Ammer, C.; Avdagic, A.; Barbeito, I.; Bielak, K.; Brazaitis, G.; Coll, L.; Dirnberger, G.; Drössler, L.; et al. Growth and yield of mixed versus pure stands of Scots pine (Pinus sylvestris L.) and European beech (Fagus sylvatica L.) analysed along a productivity gradient through Europe. Eur. J. For. Res. 2015, 134, 927–947. [Google Scholar] [CrossRef]
  43. Korhonen, K.T.; Ahola, A.; Heikkinen, J.; Henttonen, H.M.; Hotanen, J.P.; Ihalainen, A.; Melin, M.; Pitkänen, J.; Räty, M.; Sirviö, M.; et al. Forests of Finland 2014–2018 and their development 1921–2018. Silva Fenn. 2021, 55, 10662. [Google Scholar] [CrossRef]
  44. Arets, E.J.M.M.; Van der Meer, P.J.; Verwer, C.C.; Hengeveld, G.M.; Tolkamp, G.W.; Nabuurs, G.J.; Van Oorschot, M. Global Wood Production: Assessment of Industrial Round Wood Supply from Forest Management Systems in Different Global Regions; (Alterra-report; No. 1808); Alterra: Wageningen, The Netherlands, 2011; Available online: https://edepot.wur.nl/196265 (accessed on 27 June 2024).
  45. Güner, Ş.T.; Makineci, E. Determination of annual organic carbon sequestration in soil and forest floor of Scots pine forests on The Türkmen Mountain (Eskişehir, Kütahya). J. Fac. For. Istanb. Univ. 2017, 67, 109–115. [Google Scholar]
  46. Mäkelä, A.; Vanninen, P. Vertical structure of Scots pine crowns in different age and size classes. Trees 2001, 15, 385–392. [Google Scholar] [CrossRef]
  47. Pretzsch, H.; Rais, A. Wood quality in complex forests versus even-aged monocultures: Review and perspectives. Wood Sci. Technol. 2016, 50, 845–880. [Google Scholar] [CrossRef]
  48. Andreu, L.; Gutierrez, E.; Macias, M.; Ribas, M.; Bosch, O.; Camarero, J.J. Climate increases regional tree-growth variability in Iberian pine forests. Glob. Chang. Biol. 2007, 13, 804–815. [Google Scholar] [CrossRef]
  49. Pretzsch, H.; Pretzsch, H. Forest Dynamics, Growth, and Yield: A Review, Analysis of the Present State, and Perspective; Springer: Berlin/Heidelberg, Germany, 2009; pp. 1–39. [Google Scholar]
  50. Diaci, J.; Rozenbergar, D.; Anic, I.; Mikac, S.; Saniga, M.; Kucbel, S.; Visnjic, C.; Ballian, D. Structural dynamics and synchronous silver fir decline in mixed old-growth mountain forests in Eastern and Southeastern Europe. Forestry 2011, 84, 479–491. [Google Scholar] [CrossRef]
Figure 1. Location of experimental perimeters: EP1—Caciu–Bârsesti; EP2—Pârâul Sărat–Valea Sării; EP3—Roșoiu–Andreiașu; EP4—Livada–Râmnicu Sărat.
Applsci 14 08127 g001
Figure 2. The correlation between DBH and Dc from EP3 Roșoiu Andreiașu: (a) Scots pine, RP4; (b) European black pine, RP4; (c) Scots pine, RP10; (d) European black pine, RP9.
Applsci 14 08127 g002aApplsci 14 08127 g002b
Figure 3. The correlation between DBH and Dc from EP1 Caciu−Bârsești: (a) Scots pine, RP5; (b) European black pine, RP5; (c) Scots pine, RP9; (d) European black pine, RP9.
Applsci 14 08127 g003
Figure 4. The correlation between DBH x Dc from EP2 Pârâul Sărat−Valea Sării: (a) Scots pine, RP1; (b) black pine, RP9.
Applsci 14 08127 g004
Figure 5. The correlation between DBH x Dc from EP4 Livada-Râmnicu Sărat: (a) Scots pine, RP6; (b) black pine, RP9.
Applsci 14 08127 g005
Figure 6. The correlation between DBH and Lc% from EP3 Roșoiu Andreiașu: (a) Scots pine, RP4; (b) European black pine, RP4.
Applsci 14 08127 g006
Figure 7. The correlation between DBH x Lc% from EP1 Caciu−Bârsești: (a) Scots pine, RP5; (b) Scots pine, RP9.
Applsci 14 08127 g007
Figure 8. The correlation between DBH x Lc% from EP2 Pârâul Sărat−Valea Sării: (a) Scots pine, RP1; (b) black pine, RP1; (c) black pine, RP9.
Applsci 14 08127 g008
Figure 9. The correlation between DBH x Lc% from EP4 Livada-Râmnicu Sărat: (a) Scots pine, RP6; (b) black pine, RP9.
Applsci 14 08127 g009
Figure 10. The composition of pine stands aged 55–65, on moderately and strongly eroded lands in EP2: (a) RP1 and (b) RP9.
Applsci 14 08127 g010
Figure 11. The composition of pine stands studied in EP3: (a) RP9 and (b) RP10.
Applsci 14 08127 g011
Figure 12. The diameter−height relationship in EP2: (a) RP1 and (b) RP9.
Applsci 14 08127 g012
Figure 13. The diameter−height relationship in EP3: (a) RP4 and (b) RP9.
Applsci 14 08127 g013
Figure 14. Composition of pine stands studied in EP1: (a) RP5 and (b) RP9.
Applsci 14 08127 g014
Figure 15. Diameter−height relationship, EP1: (a) RP5, Scots pine; (b) RP9, Scots pine.
Applsci 14 08127 g015
Figure 16. Composition of pine stands studied in EP4: (a) RP6 and (b) RP9.
Applsci 14 08127 g016
Figure 17. Height−diameter relationship, EP4: (a) RP6, Scots pine; (b) RP9, black pine.
Applsci 14 08127 g017
Figure 18. The distribution of the slenderness index in regard to the basal diameter and the distribution of vulnerability domains: (a) RP10, Pi, and EP3; (b) RP9, Pi.n, and EP3; (c) RP1, Pi.n, and EP2; (d) RP9, Pi.n, and EP2.
Applsci 14 08127 g018
Figure 19. The distribution of the slenderness index in regard to the basal diameter and the distribution of vulnerability domains: (a) RP6, Pi, and EP4; (b) RP9, Pi.n, and EP4.
Applsci 14 08127 g019
Figure 20. The distribution of the slenderness index in regard to the base diameter and the distribution of vulnerability domains: (a) RP9, Pi.n, and EP1; (b) RP5, Pi.n, and EP1.
Applsci 14 08127 g020
Table 1. General characteristics of the analyzed perimeters.
Experimental Perimeter (EP)Research Plot (RP)* Degradation FormPlantation Scheme (m)Plantation CompositionAge** Actual Composition
EP15E31.50 × 3.00
0.50 × 3.00
50 Pi (Pi.n)
50 Ct.a
4555 Pi.n + 42 Pi + 3 An.a
9E31.25 × 2.5050 Pi (Pi.n)4573 Pi.n + 26 Pi + 1 Sc
0.33 × 2.5050 Ct.a
EP21E31.00 × 1.0070 Pi (Pi.n)
30 Mj, Ci, arb
6239 Pi + 44 Pi.n + 13 Dt
9E11.00 × 1.0060 Pi.n (Pi)
40 Vi.t, arb
6592 Pi.n + 6 Pi + 2 Vi.t
EP34E21.00 × 1.0070 Pi (Pi.n)
20 Pa 10 arb
5866 Pi + 32 Pi.n + 2 Ci
9E31.00 × 3.0050 Pi.n
50 Ct.a
5874 Pi.n + 13 Ar.t + 8 Pi + 5 Ci
10E31.00 × 3.0050 Pi
50 Ct.a
5783 Pi + 17 Dt
EP46E21.00 × 1.00Pi ± Pi.n, Ul, Lc, Mc7563 Pi + 37 Dt
9E11.00 × 1.00R1 = Pi.n
R2 = Sg
7275 Pi.n + 25 Dt
12E12.00 × 1.00R1 = Pi.n + St.b. (St)
R2 = Mc; R4 = Sg
7395 Pi.n + 5 Dt
Note: * Degradation form meaning: E1—moderate erosion; E2—high erosion; E3—very high erosion; R1, R2, R4—planting rows. ** Species from actual stand compositions: Pi—Scots pine; Pi.n—European black pine; Ci—European sweet cherry; Ar.t—Tartarian maple; Dt—diverse strong species (Tartarian maple and hornbeam); Sc—black locust; Vi.t—mahaleb cherry; Mc—dog rose; Pa—sycamore; Mj—manna ash; Ct.a—sea buckthorn; arb—other shrubs; Ul—elm; Lc—privet; Sg—reg dogwood; St.b—greyish oak; St—common oak.
Table 2. Significance of degrees of soil erosion and changes in soil profiles.
Degree of ErosionEroded Land CategoryChanges to Soils with Type Profile...
Qualifying SymbolA-AC-CA(-AB)-Bv(Bt)-CA-E-EB (E + B)-Bt-C
Moderate erosionE1Moderately eroded landUp to 50% of the A horizon has been erodedUp to 50% of the A horizon has been erodedThe A horizon has partially or totally eroded
High erosionE2Heavily eroded landMore than 50% of the A horizon and up to 50% of the AC horizon has been erodedMore than 50% of the A horizon and up to 50% of the B horizon has been erodedThe E horizon has partially or totally eroded, and the EB or E + B horizon has partially or fully eroded. Parts of horizon B appear above
Very high erosionE3Very heavily eroded landThe erosive action of water takes place in the lower half of the AC transition horizon or at the level of the C horizonThe erosive action takes place in the B horizon or in the C horizonErosion affects B horizon or C horizon
Table 3. Structural indicators and the parameters of stability (EP1, EP2, EP3, and EP4).
EPRPSpd ̅gh ̅g N·ha−1 BA·ha−1COPINIG D c ¯ L c % ¯
15Pi16.4115.14132428.0830.860.822.9345.35
Pi.n15.1613.71171230.8231.120.993.3549.87
9Pi14.1212.785148.0430.420.232.8649.06
Pi.n12.6010.68144818.0541.010.732.6256.29
21Pi24.7617.5936117.3930.380.443.9252.31
Pi.n24.2717.4440518.7030.430.523.6750.61
9Pi30.9522.07896.7140.110.154.2149.54
Pi.n26.0320.40140174.5341.412.023.8846.42
34Pi24.7218.3341519.9230.420.514.3867.49
Pi.n18.0915.522005.1430.200.153.3462.53
9Pi25.0718.99562.7420.100.104.0168.46
Pi.n25.2019.5950024.9220.520.63.7558.05
10Pi28.5220.2938824.7920.450.575.2257.95
46Pi27.7522.9964739.1430.720.932.4739.08
9Pi.n26.7720.7693052.2830.991.392.4341.64
Note: EP—experimental perimeter; RP—research plot; Sp—species; d ̅g—mean of the basal diameter of the basal area; h ̅g—corresponding height of d ̅g; N·ha−1—the number of trees per hectare; BA·ha−1—the basal area per hectare; COP—class of productivity; IN—density index by the number of trees; IG—density index by the basal area; D c ¯ —the mean of crown diameter; L c % ¯ —the mean of relative crown length.
Table 4. General statistic parameters for diameter and height in pine stands with ages between 55 and 65 years.
EP-RP
Species
Statistical Parameters
Basal Diameter (cm)Total Height (m)
d ¯ Medianscv (%)Min Max h ¯ Medianscv (%)Min Max
3–4 total21.7023.308.0737.2273716.3417.904.6428.43624
Pi24.0526.157.2230.0283717.5118.753.9922.81824
Pi.n17.8217.857.5942.6382914.6815.704.7332.23722
3–9 total22.3923.257.7234.4983817.0819.055.5432.46528
Ar.t12.9513.005.0138.678228.807.104.8855.49519
Ci14.4014.405.9441.25101912.3512.354.4536.07916
Pi27.8028.404.1414.90223219.7520.051.969.961722
Pi.n24.7325.106.0524.49123819.0419.703.8220.06628
3–10 total26.7227.806.1523.0593518.7920.404.9726.49625
Pi28.6728.453.5912.55213520.4620.552.6813.101325
Ar.t15.6714.902.9418.7613208.528.301.2314.47710
2–1 total22.9923.106.2027.0093516.2316.703.8723.90823
Mj16.3217.005.2532.209239.229.301.0811.74811
Pi24.4125.455.0220.59153217.1417.653.9322.95823
Pi.n23.8123.106.0325.34133517.0416.802.5314.871222
2–9 total25.6525.106.3324.67134120.0620.903.2316.121029
Pi31.6331.401.655.24303522.6323.252.4710.951825
Pi.n25.4425.106.2524.56134119.9820.803.1815.951029
Table 5. General statistic parameters for diameter and height in pine stands with age of 45 years.
EP-RP SpeciesStatistical Parameters
Basal Diameter (cm)Total Height (m)
d ¯ Medianscv (%)Min Max h ¯ Medianscv (%)Min Max
1–5 total15.1915.103.5723.5562613.8914.402.4917.95417
Pi15.9215.602.9618.58102314.8414.951.7311.69917
Pi.n14.8914.303.7525.2372613.4913.902.4017.85617
An.a14.9015.000.362.42151512.7613.300.927.241213
1–9 total12.6412.703.2125.3762010.8010.952.4322.54516
Pi14.5314.702.3516.1982012.8112.851.6312.72716
Pi.n11.9711.803.1726.5071910.049.852.2322.28515
Table 6. General statistic parameters for diameter and height in pine stands aged over 70 years.
EP-RP SpeciesStatistical Parameters
Basal Diameter (cm)Total Height (m)
d ¯ Medianscv (%)Min Max h ¯ Medianscv (%)Min Max
4–6 total22.8923.808.9639.1695611.1012.704.4740.34218
Pi27.2126.405.2919.44174222.6922.802.7011.931529
Ul14.1213.105.2537.16103911.9512.103.3628.18621
Mj12.2710.553.4027.7592412.9012.901.5411.981015
Pa.m29.2632.2517.8861.12125616.6614.406.3738.25925
4–9 total21.8823.678.9340.8253717.7819.605.3930.35427
Pi.n26.2725.425.1719.69173720.4020.902.3011.321524
Mj7.687.751.9015.4951010.8511.002.5923.90414
Table 7. Independent-samples t-test and F-test for slenderness index (I).
EP3-RP9_Pi.n vs. EP1-RP9_Pi.n
VulnerabilityMean—Group 1Mean—Group 2t-valuedfpStd.Dev.—Group 1Std.Dev.—Group 2F-ratio—Variancesp-Variances
I < 0.800.670.73−3.45790.00 *0.090.052.510.00 *
0.80 < I < 1.000.870.88−0.65600.510.050.051.000.95
I > 1.001.111.12−0.18210.850.070.133.230.26
EP3-RP9_Pi.n vs. EP1-RP5_Pi.n
VulnerabilityMean—Group 1Mean—Group 2t-valuedfpStd.Dev.—Group 1Std.Dev.—Group 2F-ratio—Variancesp-Variances
I < 0.800.670.68−0.29500.760.090.091.010.93
0.80 < I < 1.000.870.88−0.65550.510.050.071.580.27
I > 1.001.111.16−0.98270.330.070.112.330.42
EP3-RP10_Pi vs. EP1-RP9_Pi
VulnerabilityMean—Group 1Mean—Group 2t-valuedfpStd.Dev.—Group 1Std.Dev.—Group 2F-ratio—Variancesp-Variances
I < 0.800.730.681.47320.150.020.076.860.02
0.80 < I < 1.000.890.871.10310.270.050.032.400.33
EP3-RP10_Pi vs. EP1-RP5_Pi
VulnerabilityMean—Group 1Mean—Group 2t-valuedfpStd.Dev.—Group 1Std.Dev.—Group 2F-ratio—Variancesp-Variances
I < 0.800.680.73−1.39320.170.070.061.360.74
0.80 < I < 1.000.870.91−1.91370.060.030.041.870.49
Note: * differences are significant at p-value < 0.05.
Disclaimer/Publisher’s Note: The statements, opinions and data contained in all publications are solely those of the individual author(s) and contributor(s) and not of MDPI and/or the editor(s). MDPI and/or the editor(s) disclaim responsibility for any injury to people or property resulting from any ideas, methods, instructions or products referred to in the content.

