Abstract
The primary objective of this study is to investigate the carbon footprint, resilience levels, and optimal landscape area ratios of various parks. Additionally, it explores the relationships between landscape element proportions (LEP), the normalized difference vegetation index (NDVI), resilience indicators (RI), and the carbon reduction benefits associated with carbon neutrality (CN). Six parks were assessed for resilience, NDVI, LEP, and CN values, with Pearson correlation analysis conducted. The results revealed that parks with or without waterbodies exhibited ideal LEP area ratios of 6.5:2:1.5 (Softscape:Waterbody:Hardscape) and 8.3:1.7 (Softscape:Hardscape), respectively. Enhanced Softscape and reduced Hardscape proportions in parks correlated with increased NDVI and CN. NDVI exhibited a positive correlation with Softscape percentage and a negative correlation with Hardscape percentage. Conversely, CN demonstrated a negative correlation with Hardscape percentage and a positive correlation with Softscape percentage. Suggesting Softscape should constitute over 65%, and Hardscape should be under 15% in parks with water bodies. Waterless parks are advised to maintain a Softscape ratio exceeding 83% and a Hardscape ratio below 17%. Finally, the study extended to assess the LEP of 22 additional parks, validating the suitability of the ideal LEP area ratio.
1. Introduction
According to statistics, carbon dioxide (CO2) accounts for 80% of all greenhouse gases (GHGs) emitted by the European Union [1]. The establishment of comprehensive emissions reduction policies and the implementation of effective Carbon Sequestration methods are essential for reducing GHG emissions [2]. Due to the significant carbon emissions generated during the construction of parks in Taichung City, which have severely impacted the surrounding environment, the Taichung City government has decided to promote low-carbon sustainable development. The Shuinan Economic and Trade Park, including its park areas, has been designated as a key carbon reduction demonstration zone, with the aim of leading other regions’ parks in jointly advancing carbon reduction initiatives [3]. Within urban settings, the most significant public spaces for residents are green areas [4,5], where vegetation plays a critical role in offsetting CO2 emissions. Through the process of photosynthesis during growth, plants store carbon [6]. Previous research has confirmed a correlation between carbon sequestration and urban parks [7]. The greenhouse effect poses severe environmental and disaster-related challenges for cities. Based on statistical data from 1998 to 2017, the two most frequent types of disasters were floods (43.4%) and storms (28.2%) [8]. Enhancing park resilience provides advantages such as increasing soil carbon storage capacity [9] and improving plant diversity [10]. Therefore, enhancing both the carbon sequestration capacity and the resilience of parks not only aids in absorbing CO2 but also strengthens the disaster-prevention capabilities of parks, fostering a healthy ecological environment. These complementary strategies are pivotal in achieving the goal of carbon neutrality for parks.
“Landscape elements” encompass a multitude of natural and human-made features within a landscape, including flora, water features, structures, terrain, paving, artworks, and more. The study of these elements can notably enhance urban aesthetics. Investigating landscape components significantly amplifies a city’s visual appeal [11,12,13]. The harsh urban pavement prevalent in roads and squares negatively impacts both residents and parks, whereas the inclusion of expansive lawns, water features, and diverse vegetation can foster their well-being [13,14]. “Softscape” refers to vegetation integrated within a landscape, such as shrubs and flowers. Conversely, “Hardscape” denotes structural components incorporated into the landscape, including elements like fountains, benches, or gazebos [15,16,17]. The NDVI is defined by its primary calculation of the difference between red and near-infrared reflectance. This index is highly effective in assessing chlorophyll and other pigment contents and serves as an excellent proxy for vegetation density parameters such as Leaf Area Index (LAI) and Fractional Vegetation Cover (FVC) [18,19,20,21]. Remote sensing through the NDVI is a valuable tool to evaluate and monitor vegetation cover [21,22]. Leveraging NDVI-generated remote sensing data offers benefits through time-series insights, broad coverage, and high spatial resolution [23]. The study’s additional focal point concerns the “resilience indicators” (RI), designed to evaluate the resilience of urban parks. These indicators are categorized into indices for flood resilience and wind resilience [24]. This paper will reference the RI formulated in the aforementioned study for several reasons: The system has been applied to Taichung City in Taiwan and has been used to assess numerous parks, affirming its feasibility. RI serves as a vital tool for evaluating the resilience of parks. Initially, the RI employs the Fuzzy Delphi Method to filter indicators, subsequently utilizing the Analytic Network Process to calculate the respective weights of each indicator. Carbon neutrality (CN) involves achieving a balance between carbon emissions and carbon absorption, with the goal of reaching net-zero emissions by using carbon sink mechanisms to absorb atmospheric carbon. Specifically, the process of removing CO2 from the atmosphere and storing it long-term is known as carbon sequestration. To achieve global net-zero emissions, all greenhouse gas emissions must be offset through carbon sequestration and similar methods to mitigate the impacts of climate change [25]. CN refers to reducing or offsetting carbon emissions to bring net carbon emissions to zero as a means of combating climate change and reducing the release of greenhouse gases [26,27,28]. In summary, this study categorizes prominent landscape elements in urban parks into three groups: Softscape (tree cover and green space), Waterbody, and Hardscape (paving, buildings, pavilions, and trellises). These landscape component ratios, referred to as the LEP, will be determined later in the study. Monitoring changes in NDVI allows us to assess plant cover conditions. Employing RI, we will evaluate park resilience and estimate CN potential by assessing carbon sequestration capability.
Previous studies can be classified into four main categories: assessing green spaces’ carbon footprint in parks for carbon neutrality, relevant calculation tools and formulas, strategies to enhance parks’ carbon neutrality through design, and the proportion of green spaces, plantings, and water bodies. The first category encompasses research on the carbon footprint of landscape design, including nursery trees [29], school campuses [30], community landscapes [31], and landscape engineering perspectives [32]. Some studies quantify carbon footprints and evaluate reduction effects. The second category focuses on calculation tools and formulas, such as those for tree carbon uptake, urban green space carbon storage [33], and life cycle carbon footprints [32]. The third category offers strategies for improvement and design, suggesting native plant selection, enhancing three-dimensional greenery, planning rational plant configurations, and reducing construction emissions [34,35,36]. Lastly, the fourth category examines the ratio of park green space, plantings, and water bodies. For instance, Tainan City’s building coverage rate is 12% to 15% [37], and water bodies range from 0% to 52.3% with at least 30% green coverage [38]. Unfortunately, Taichung City has not yet issued specific policies or regulations regarding the proportions of green spaces, vegetation, and water bodies in parks. In the future, this study can only reference relevant policies from other cities in Taiwan as a guide for park design and improvement. Scholars generally employ life cycle assessment for urban park carbon footprint analysis and offer design solutions, with some proposing landscape element proportions. Thus, additional research should explore other attributes of carbon-neutral parks.
This study finds that the five stages proposed by scholar Yang offer greater feasibility and comprehensiveness in the research on park carbon footprints [6]. Notably, it encompasses routine park maintenance and restoration, enhancing the analysis of urban park carbon footprints. Yang’s research yielded the publication of “Carbon Footprint of the Construction Industry—Carbon Management Strategies for Architecture, Landscape, and Interior Decoration” [24]. This book outlines calculation methods, project carbon emission coefficients, and carbon reduction advantages in total carbon footprints and carbon neutrality for landscaping projects. It elucidates the benefits of carbon reduction in achieving carbon neutrality and offers insights into quantifying carbon footprints in landscaping projects. In contrast to other studies, this research evaluates urban park carbon footprints, NDVI, and resilience.
Extensive scholarly research has previously been conducted on carbon sequestration in urban parks. Approaches thus far have included utilizing developed quantitative models for each tree species to estimate the carbon sequestering capabilities of trees in parks [39], adopting established botanical carbon sequestration formulas to assess carbon fixation capacity [1], and measuring various tree attributes—such as tree height, diameter at breast height, aboveground biomass, and age—as well as estimating the carbon fixation amount of turfgrass, thereby calculating the annual carbon sequestration rates of parks [40]. Upon measuring tree characteristics, Wang et al. applied formulas for plant carbon sequestration from the literature to assess carbon fixation capability and referred to the allometric growth equations of biomass cited in references to estimate aboveground biomass [7]. As indicated by the methods employed in the aforementioned literature, field surveys of parks are typically conducted to gather fundamental data on various tree species, attributes of turf grass, areas covered by trees, water bodies, and so forth. This is followed by the application of established formulas or models for plant carbon sequestration and the calculation of the aboveground biomass of the vegetation. These steps ultimately lead to an estimation of the total carbon sequestration capacity of the park. To accurately calculate the carbon emissions over the entire lifecycle of a park, it is critical to incorporate a LCA. For instance, research conducted by scholar Nicese quantifies the carbon emissions during the planting, maintenance, and waste management phases of park development. Following the establishment of a Life Cycle Inventory (LCI), carbon emissions for each component are computed. For example, during the tree planting stage, emissions are calculated for the production and transport of seeds and fertilizers, as well as for the energy consumed by construction equipment (tractors and forklifts). Utilizing this method allows for not only an assessment of environmental impact but also an effective control over the operational costs of park management [5]. The aforementioned analysis details the meticulous calculation of carbon sequestration for each plant species by scholars studying the LCA of urban parks and carbon sequestration. The results, estimated with precision, also showcase certain disadvantages. Firstly, when calculating the aboveground biomass of individual plants, researchers can refer to existing literature for biomass equations; however, they frequently encounter the absence of species-specific equations. While some scholars suggest employing generalized equations as a substitute, such equations carry inherent uncertainties that lack extensive experimental validation. Secondly, following the methods detailed in the literature requires substantial time for data retrieval and calculations [41,42]. Consequently, this study aims to discover a straightforward and rapid assessment method by disregarding the specific traits of plants. In the practice of landscape architecture, a simple and expedient evaluation of the carbon emissions over a park’s full lifecycle becomes a critical step towards achieving carbon neutrality in parks. Crucially, for landscape designers and managers, the ability to estimate carbon emissions at the early stages of park construction or enhancement facilitates more frequent and effortless computation. This, in turn, enables the swift formulation of carbon reduction and design strategies and the rapid monitoring of the progress towards carbon neutrality goals, thus enhancing the resilience of parks.
In summary, this study aims to achieve four objectives: (1) quantify carbon footprints of diverse parks, (2) assess park resilience, (3) propose optimal LEP area ratios, and (4) explore links between LEP, NDVI, and CN. Through these objectives, the study aims to assess parks’ potential for carbon neutrality and resilience while offering recommendations to attain carbon neutrality. Through the fulfillment of these objectives, this study aims to provide landscape architects and managers with a simple and rapid tool for evaluating the carbon neutrality and resilience of parks.
2. Materials and Methods
2.1. Research Process
The study is divided into eight steps, which will be detailed below:
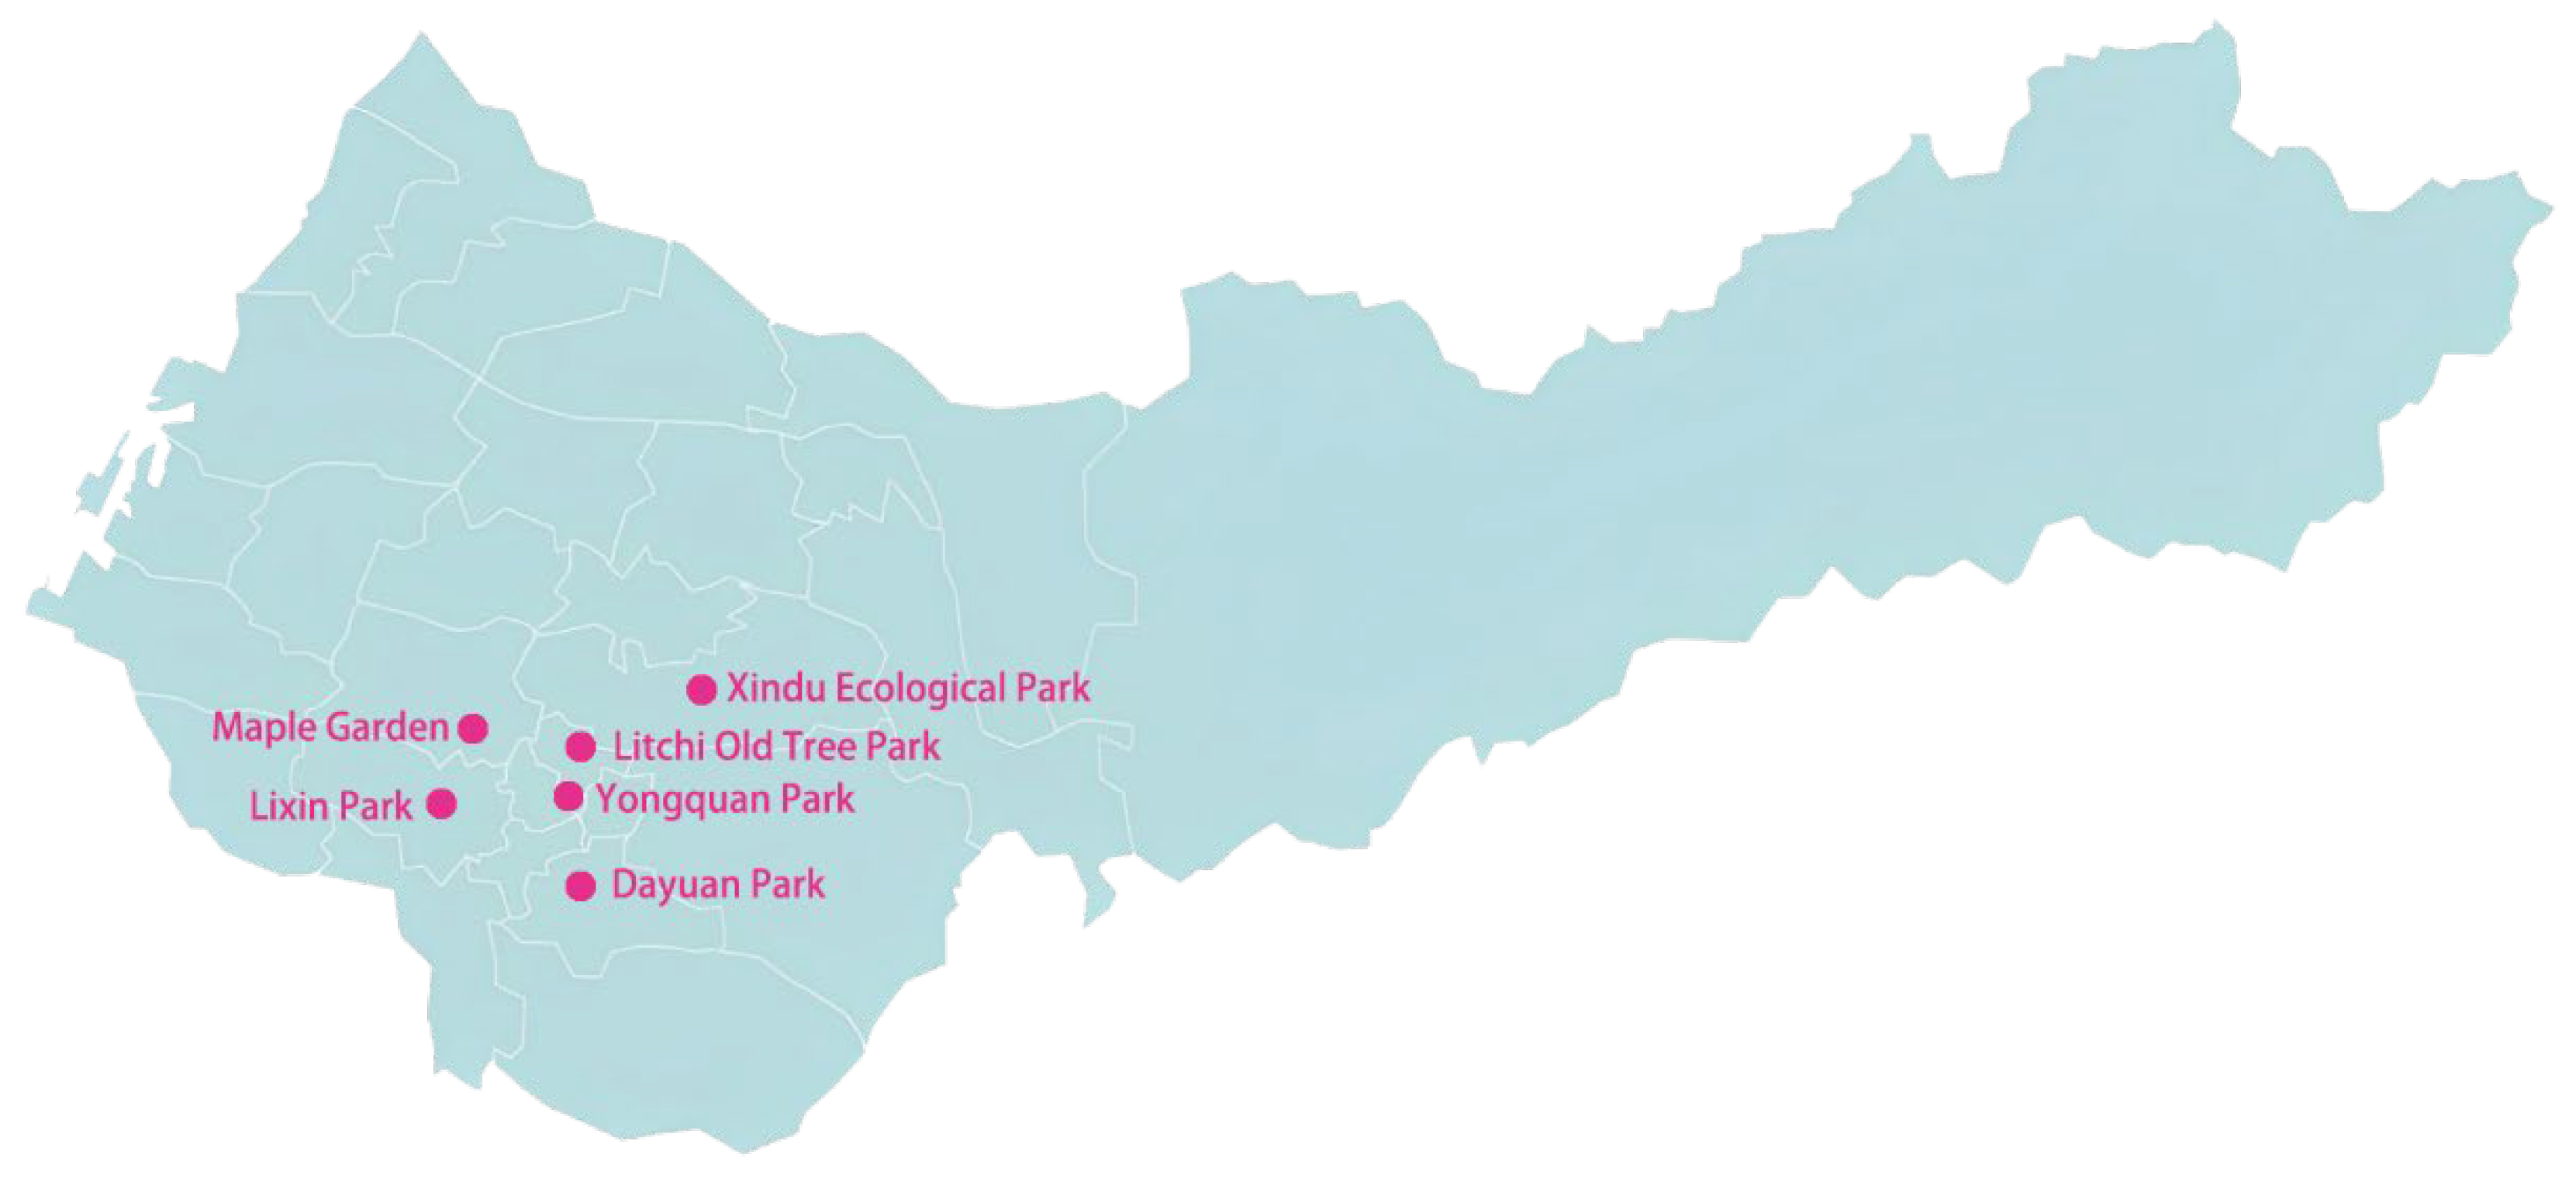
Step 1: Six parks in Taichung City, Taiwan, were selected, varying in size from 0.1 to 6 hectares. These parks include Xindu Ecological Park, Lixin Park, Maple Garden, Yongquan Park, Litchi Old Tree Park, and Dayuan Park. Among these, only the first four include water bodies, enabling a comparison between park types. The locations of the parks are shown in Figure 1. By selecting parks with diverse characteristics, it is possible to compare the performance of different types of parks in terms of CN, ensuring that the study results are representative and scientifically valid.

Figure 1.
Location Map of Six Parks.
Step 2: The orthophoto images of each park were obtained using drones and Landsat 8-OLI satellite imagery. This step significantly influences the selection of study sites, as the choice of parks is largely constrained by the availability of construction budget documents and design plans, which are essential for carbon footprint calculations. Due to the difficulty in obtaining such documents, the study is currently limited to analyzing and processing data from the six parks for which these materials were available. Effectively utilizing tools to obtain orthophotos ensures the provision of precise geographic information and detailed surface features, which are crucial for subsequent carbon footprint and NDVI calculations. Additionally, selecting parks with complete construction budgets and design plans ensures the accuracy of carbon footprint calculations, as these documents form the foundation for conducting carbon footprint analysis.
Step 3: Carbon footprints were determined based on construction materials and elements outlined in the compiled Parks Project Estimates, incorporating cited references for CN calculations. The calculation of the carbon footprint is a crucial step in assessing carbon neutrality efficiency. By conducting an in-depth analysis of the various construction activities involved in park development, the total carbon emissions of the park can be accurately quantified, providing a solid data foundation for subsequent correlation analysis.
Step 4: NDVI values for each park were computed using ENVI 5.3 software between March and April 2023. Calculating NDVI is an indispensable step in assessing a park’s ecological benefits and carbon neutrality potential, as it directly illustrates the critical role of vegetation in the carbon neutrality process.
Step 5: This step is based on the park resilience indicators established in Pan et al.’s study on park resilience [24]. The study divides the indicators into two categories: flood resilience indicators (ratio of lawn to water permeability, drainage capacity grade of different soil types, detention basin grade, and permeable pavement grade) and wind resilience indicators (bearing capacity grade of trunk and root systems, tree height and wind resistance grade, wind resistance grade of tree species, and configuration level of multilayer planting). This park resilience evaluation system is used to assess the resilience levels of the parks. A park’s ability to adapt and withstand floods and windstorms has a profound impact on its long-term carbon neutrality efficiency. Therefore, it is essential to conduct a comprehensive and systematic evaluation of the park’s ecological stability and disaster resilience.
Step 6: LEP percentages for each park were determined, offering insights into the most effective components for achieving carbon-neutral parks. The purpose of calculating LEP is to quantify the contribution of different landscape elements to carbon neutrality efficiency. This provides a basis for optimizing park design and enhancing carbon neutrality performance.
Step 7: Pearson correlation analysis was conducted to confirm interrelationships among LEP, NDVI, and CN variables within the parks. This step helps identify key factors that significantly influence carbon neutrality efficiency, offering guidance for optimizing park design.
Step 8: To validate ideal LEP ratios and extend insights, the LEP of 22 additional parks was calculated alongside the study’s chosen parks. By increasing the number of research samples through this step, the validity of the ideal LEP ratio can be further verified, providing valuable insights for a broader range of parks.
Step 9: Based on the findings from each park, recommendations for enhancing parks’ carbon neutrality were formulated, addressing deficiencies where carbon neutrality standards were not met. Based on improvement recommendations for each park, practical guidelines can be provided for the construction and renovation of future parks, thereby enhancing their carbon neutrality efficiency and achieving the goal of park carbon neutrality.
2.2. Data Collection and Processing
2.2.1. Landscape Engineering’s Carbon Footprint and Carbon Neutrality’s Carbon Savings
This study calculates the total carbon footprint of landscape engineering for each park by referencing the various items listed in the park project budget and consulting major carbon coefficient websites in Taiwan. Given the complexity of the budget items, the study categorizes all work items into four main categories: earthwork, construction materials, labor, and planting. The carbon footprint for each of these categories is then calculated separately to determine the total carbon footprint. Excel software was used to organize and calculate the carbon footprints, yielding the total carbon footprint and CN value for each park. Based on the carbon footprint calculation references and literature mentioned in the introduction, only a few key formulas are listed in Table 1.

Table 1.
The primary formula for calculating carbon neutrality.
2.2.2. Calculation of NDVI Value of Each Park
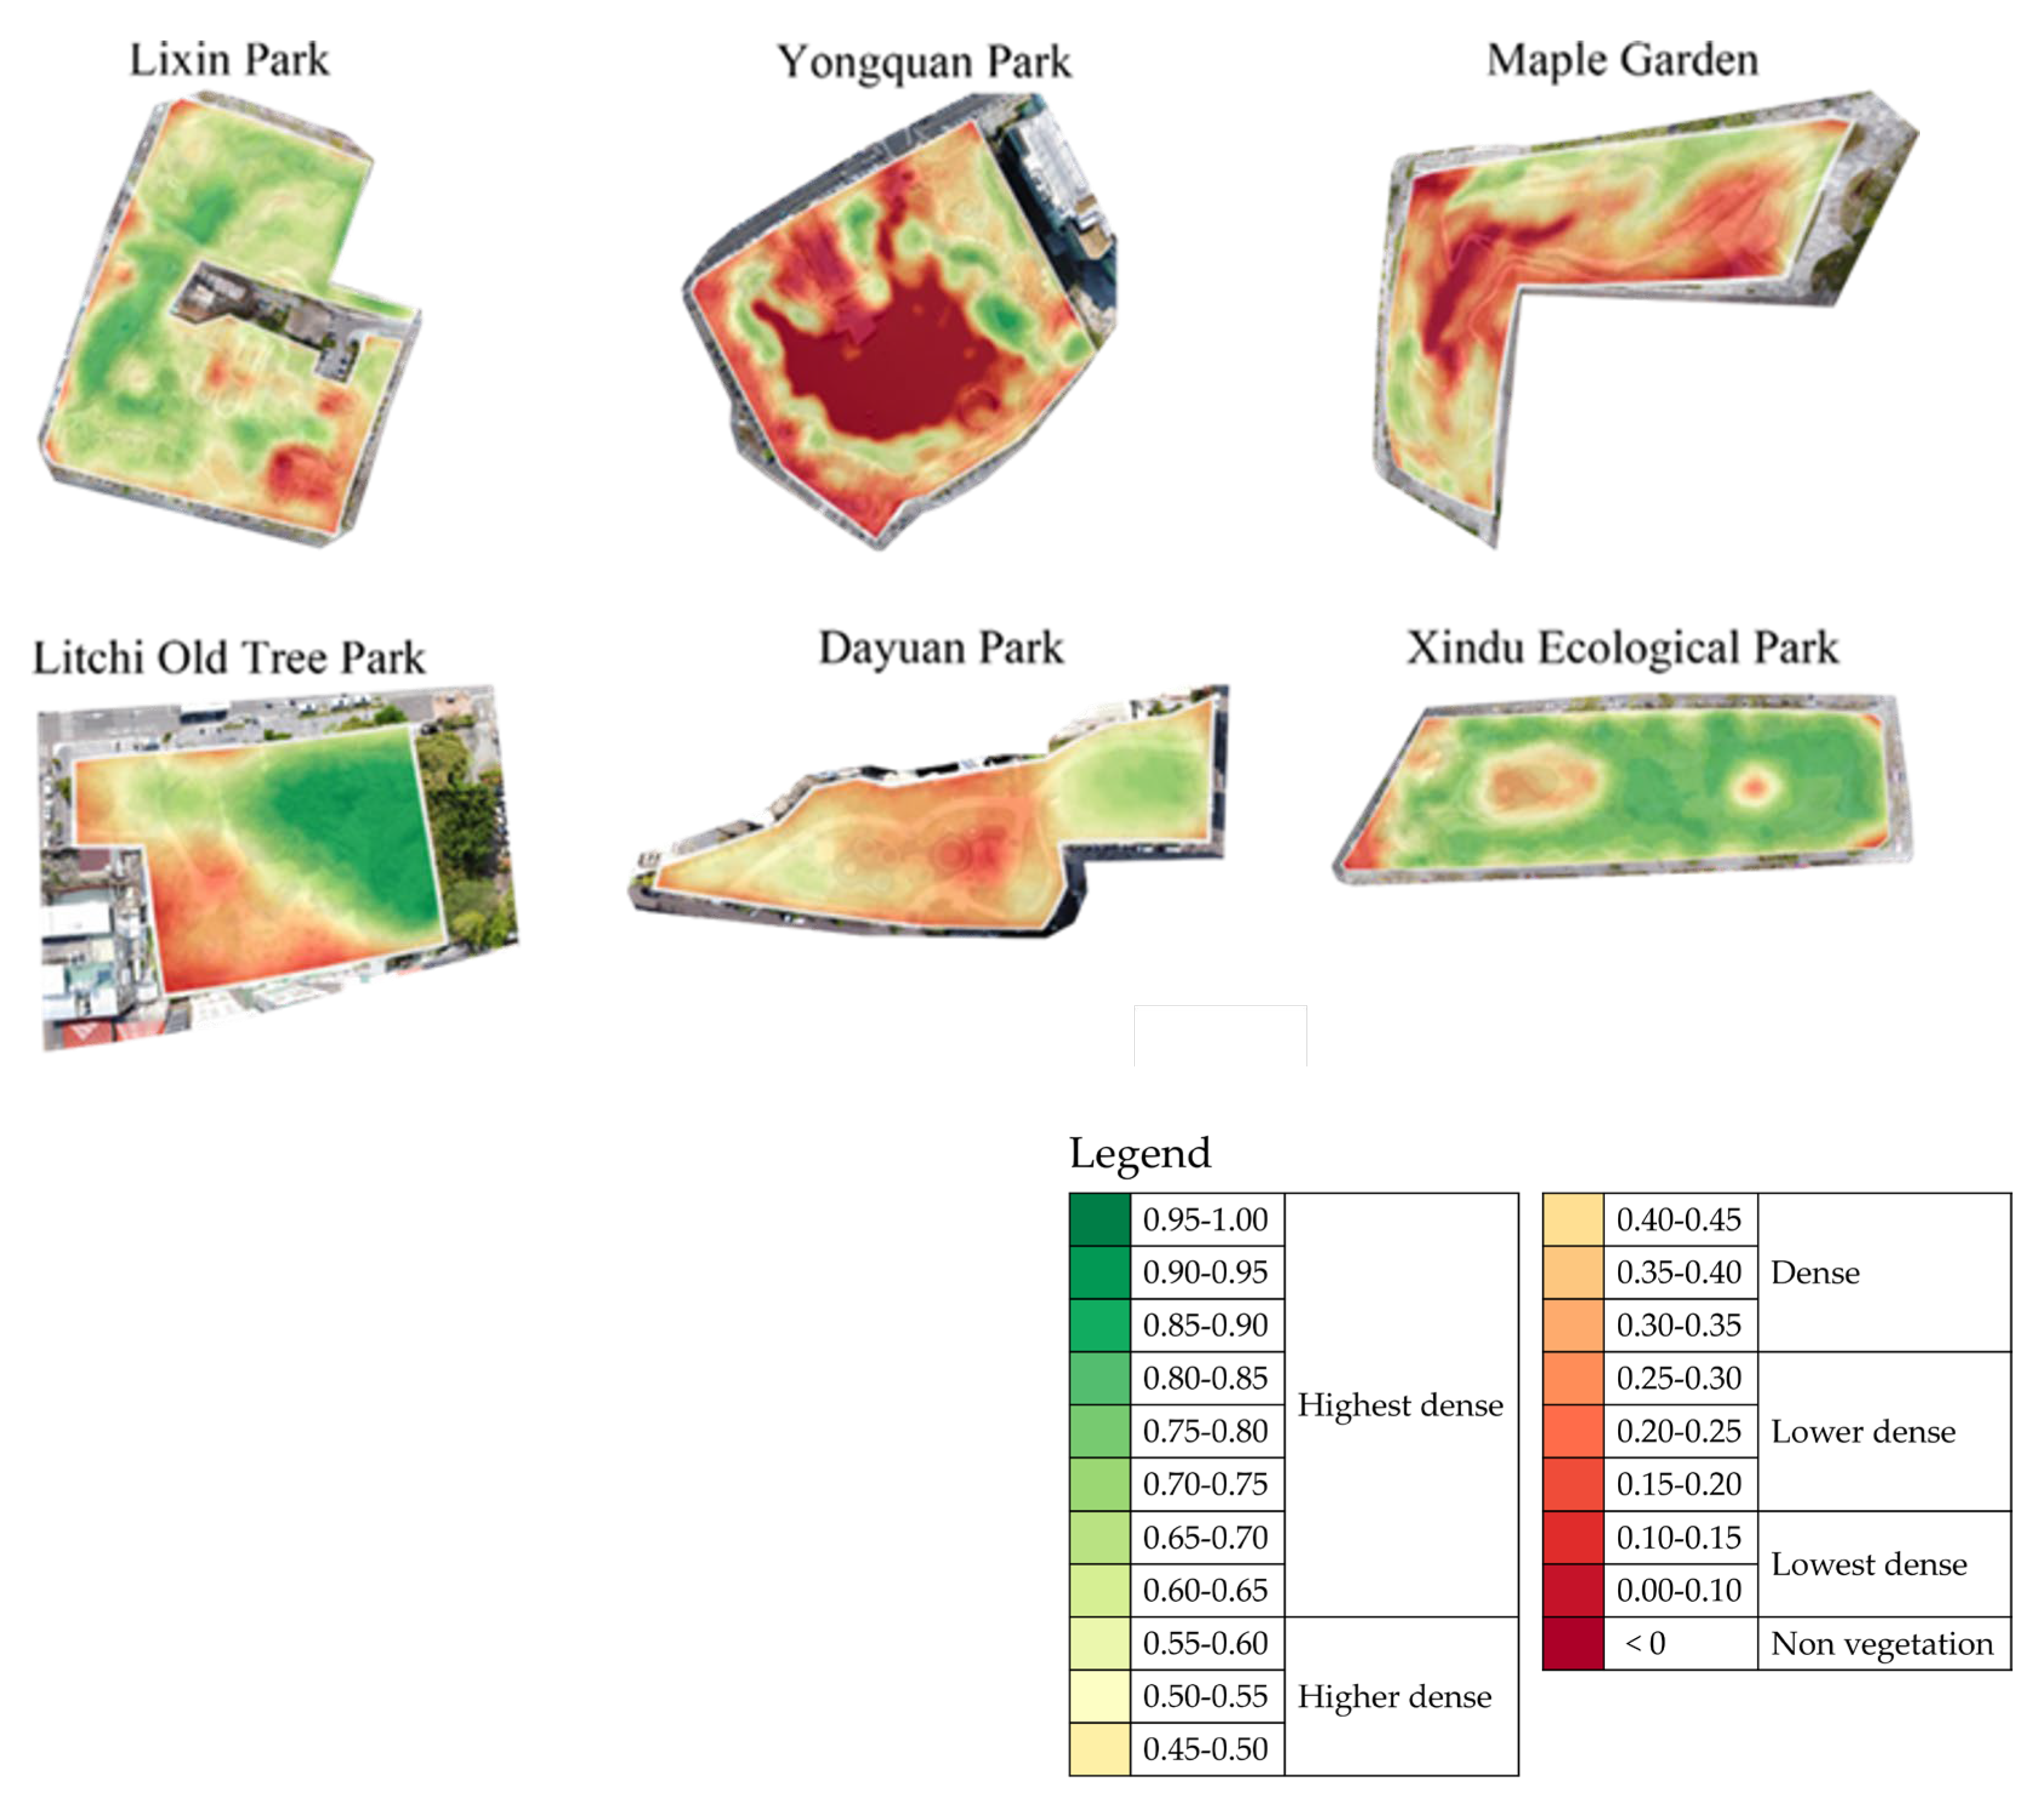
The normalized difference vegetation index (NDVI) is the most commonly used spectral indicator in ecology and agriculture for assessing vegetation conditions [44,45,46]. NDVI values are categorized as follows: 0.60–1.00 indicates the highest density, 0.45–0.60 is high, 0.30–0.45 is medium, 0.15–0.30 is low, 0.00–0.15 is the lowest, and −1 to 0 may represent water [47]. Utilizing ENVI 5.3 software, standardized NDVI values are computed through remote sensing data processing and NDVI value extraction [48,49].
In this study, Landsat 8-OLI satellite images, obtained from the U.S. Geological Survey and covering the entire study area with less than 6% cloud cover [50], were processed using ENVI 5.3 software. First, atmospheric correction was applied to the images, converting the original Digital Number (DN) values to radiance and then to surface reflectance. Each image was subsequently cropped to the appropriate size and extent and extracted using the study area mask in ESRI ArcGIS ArcMap 10.5 software. Based on the Landsat 8-OLI band configuration, bands 2 to 5, corresponding to blue, green, red, and near-infrared (NIR), were selected for spatial subsetting. Vegetation indices for each image were then calculated using the band math tool in ENVI 5.3. The NDVI was computed according to the standard formula (NIR-Red)/(NIR + Red), representing the difference in reflectance between the NIR and red bands [51].
2.2.3. Evaluation of Resilience of Each Park
This study aims to assess the resilience levels of various parks, not only to serve as temporary shelters but also to mitigate the impact of disasters on urban areas. Based on the research by Pan et al., a park resilience index system was established, comprising indicators for flood resilience and wind resilience, each further divided into four sub-indicators. Each indicator is rated on a scale of 1 to 5. After assigning resilience scores to the parks, these scores are multiplied by the respective indicator weights to calculate the total RI [24], as detailed in Table 2. This resilience index system has also been applied to evaluate the resilience of 81 parks in Taichung City, Taiwan, providing targeted recommendations for parks with lower resilience levels.
Table 2.
The resilience index system of flood and wind disasters in the park.
2.2.4. Calculation of the Proportion of LEP in Each Park
AutoCAD 2022 software was utilized to compute tree cover, green space (grass, shrubs), water bodies, and rugged terrain (pavement, structures, pavilions, scaffolding) in each park’s orthophoto. While this approach does not yield absolute precision, it provides relatively accurate data for determining item proportions.
3. Results
3.1. Calculation Result of LEP Proportion of the Park
Based on the LEP distribution and proportions presented in Figure 2 and Table 3, it is evident that among the four parks featuring water bodies, Xindu Ecological Park boasts the largest Softscape portion at 78.96%, while Yongquan Park has the smallest at 19.98%. For parks with water bodies, Yongquan Park holds the highest water proportion at 36.05%. Comparatively, among the two parks lacking water bodies, Litchi Old Tree Park has the larger Softscape portion, making up 86.12%.
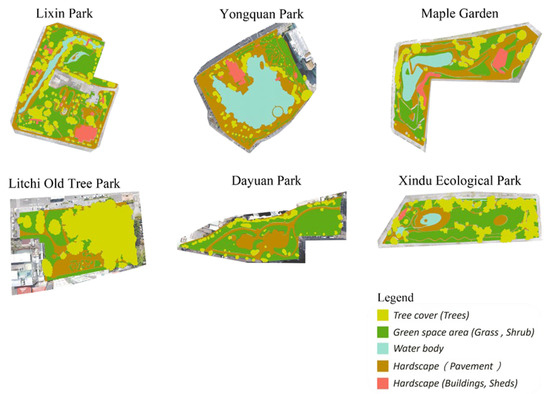
Figure 2.
LEP distribution of each park.
Table 3.
Landscape Element Proportion.
3.2. Calculation Result of NDVI Value
As illustrated in Figure 3 and Table 4, Xindu Ecological Park exhibits the highest NDVI, attributed to consistent plant maintenance and minimal human disturbance, promoting lush vegetation. The park’s abundant trees, lawns, and substantial vegetation coverage contribute to its elevated NDVI. In contrast, Yongquan Park has the lowest NDVI due to extensive rigid pavement hindering plant growth. Furthermore, limited plant coverage results from a small Softscape and expansive Hardscape. Across all parks, the average NDVI stands at 0.48, signifying substantial vegetation density.
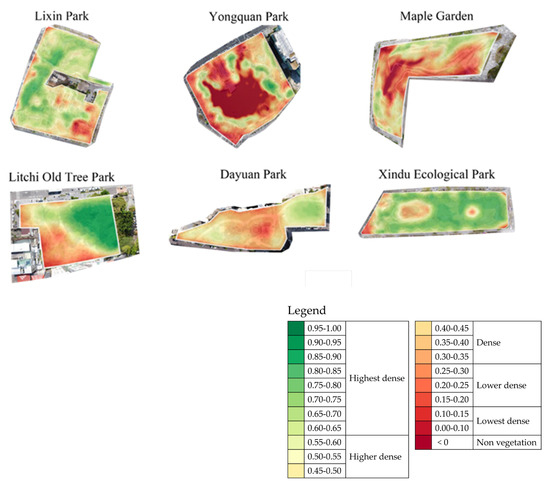
Figure 3.
NDVI index images of each park.
Table 4.
NDVI index of each park.
3.3. Calculation Result of RI Value
Based on the assessment of park resilience presented in the table, Xindu Ecological Park emerges with the highest RI, attributed to its extensive lawns, less intricate pavement, increased permeable surfaces, sizable flood detention capacity, and robust wind resistance. In contrast, Dayuan Park exhibits the lowest RI due to limited permeable surfaces and the absence of a flood detention basin. Moreover, the park’s recent establishment leads to wind-sensitive saplings, as indicated in Table 5.
Table 5.
The resilience index system of flood and wind disasters for six parks.
3.4. Results of CN Value Calculation
Utilizing the reference materials and calculation formulas provided earlier, calculate the budgetary items for each park’s engineering proposal. The CN values for each park are presented in Table 6. Notably, the dominant contributors to carbon emissions across parks are the extent of fill, excavation, and construction materials, with worker count and vegetation playing minor roles. Xindu Ecological Park, Lixin Park, and Litchi Old Tree Park meet the carbon-neutral criteria, attributed to limited fill, excavation, low carbon emissions from construction materials, abundant plantings and trees, and significant carbon sequestration by the vegetation, surpassing the park landscape engineering’s overall carbon footprint. The CN values for Maple Garden, Yongquan Park, and Dayuan Park are negative. A common factor among these parks is that the carbon emissions generated from Cut and Fill operations and Construction materials are significantly high, while the carbon sequestration from vegetation is insufficient to offset these emissions.
Table 6.
Statistical table of the total carbon footprint of each park landscape project.
3.5. Analysis of LEP, NDVI, RI, and CN Values of All Parks
Based on the comprehensive analysis of LEP, NDVI, RI, and CN values presented in Table 7, a prevailing pattern emerges. Parks with a Softscape value exceeding 65% tend to exhibit a reasonable NDVI value and a positive CN value, signifying the potential to offset construction-related carbon emissions through increased planting and vegetation. The NDVI demonstrates an upward trajectory as Softscape percentages rise, with NDVI and RI largely unaffected by water body proportions. Decreasing Hardscape proportions correspond to increased NDVI values. In synthesis, the optimal LEP area ratio (Softscape:Waterbody:Hardscape) for water-containing parks is 6.5:2:1.5, while for waterless parks, it is 8.3:1.7. This ratio, founded on observed trends from referenced data, can serve as both the baseline for carbon-neutral parks’ LEP area ratio and a guideline to ensure satisfactory NDVI and CN values by maintaining Softscape above 65% and Hardscape below 15%.
Table 7.
Statistical table of LEP, NDVI, RI, and CN.
3.6. Results of Pearson Correlation Analysis
In this investigation, Pearson correlation analysis was carried out using IBM SPSS Statistics 26 software to establish relationships among Softscape, Hardscape, NDVI, and CN, as detailed in Table 8. This analysis aimed to validate the earlier conclusions. The results of the correlation analysis revealed the following relationships:
Table 8.
Pearson correlation analysis table.
- NDVI and CN exhibited a strong positive correlation, with a coefficient of 0.965 and p < 0.01, implying that CN increases in tandem with NDVI growth.
- NDVI and Hardscape were inversely correlated, with a coefficient of −0.88 and p < 0.05, indicating that Hardscape proportion decreases as NDVI rises.
- NDVI and Softscape were highly correlated, with a coefficient of 0.994 and p < 0.05, revealing that Softscape proportion increases with NDVI enhancement.
- CN and Hardscape were inversely related, with a coefficient of −0.903 and p < 0.05, illustrating that Hardscape proportion negatively influences CN.
- CN and Softscape were positively correlated, with a coefficient of 0.967 and p < 0.01, signifying that CN is positively associated with Softscape.
- Hardscape and Softscape were inversely correlated, with a coefficient of −0.912 and p < 0.05, indicating that higher Softscape percentages lead to reduced Hardscape proportions.
3.7. Estimating the Carbon Neutrality Capacity of Additional Parks
Given the limited number of parks analyzed, a 5% extrapolation was conducted to assess the feasibility of attaining carbon neutrality. As data on parks’ carbon emissions was scarce, an estimation approach was adopted. This involved estimating 5% of existing parks’ carbon emissions and applying this estimation to other parks based on existing data. This approach aids in managing carbon emissions for parks under construction, potentially reducing emissions for new parks. Nonetheless, the estimation method introduces uncertainty, as it relies on park-specific data for accuracy. For parks with waterbodies, Lixin Park’s area is 4.7 hm2 and its 5% carbon emission is 15,836.65 kgCO2e, while Maple Garden’s area is 3 hm2 and its 5% carbon emission is 14,941.3 kgCO2e. The CN value of each park depends on park size, construction carbon emissions, and other factors. Also, for parks without waterbodies, Litchi Old Tree Park has an area of 0.54 hm2 and a 5% carbon emission of 3623.4 kgCO2e, whereas Dayuan Park has 0.6 hm2 and 5172.4 kgCO2e. To recap, Lixin Park and Maple Garden were selected as reference points for parks featuring water bodies, given their moderate sizes. Conversely, Yongquan Park was deemed unsuitable due to its substantial carbon emissions linked to its sizable water body. For parks without water bodies, Litchi Old Tree Park and Dayuan Park were employed. The data from Litchi Old Tree Park and Dayuan Park served as representative examples for such parks. This study encompassed the evaluation of LEP in 22 Taichung parks, combining green spaces and water bodies, to ascertain their potential for achieving carbon neutrality. Table 9 shows ten parks with water bodies, ranging from 0.6 to 11.4 hm2, while Table 10 shows twelve parks without water bodies, ranging from 0.6 to 2.9 hm2.
Table 9.
Landscape element proportion of 10 parks with waterbody in the validation stage.
Table 10.
Landscape element proportion of 12 parks without waterbody in the validation stage.
The obtained data reveal distinct Softscape, Waterbody, and Hardscape ratios among the parks studied. Among the parks with water bodies, Jingxian Park boasts the highest Softscape ratio (82.46%), while Fengle Sculpture Park records the lowest (51.4%). For Waterbody percentages, Fengle Sculpture Park leads (15.15%), while Jingxian Park has the lowest (0.93%). Regarding Hardscape ratios, Solanaceous Tree Park ranks lowest (15.17%), with Buzi Park having the highest (39.5%). The average ratios across these parks are approximately 6.6:0.6:2.8 (Softscape:Waterbody:Hardscape). In parks without water bodies, Sanfenpu Park exhibits the most substantial Softscape ratio (95.03%) and Shiquan Park the lowest (61.91%), with the highest Hardscape ratio at 38.09%. The Softscape to Hardscape average ratio here is 8:2.
For water body parks, an effective LEP area ratio is approximately 6.5:2:1.5 (Softscape:Waterbody:Hardscape), with Softscape above 65%, Waterbody exceeding 5.5%, and Hardscape kept under 28%. Waterless parks may maintain an LEP ratio of 8.3:1.7 (Softscape:Hardscape) for feasibility. However, the applicability of these findings might be constrained to the context of Taichung City, Taiwan. Parks with water bodies can leverage carbon sinks and aquatic life to achieve carbon neutrality. Specific recommendations include enhancing Softscape in Beitun Children’s Park, introducing vertical greenery and permeable paving, adapting design strategies for Taichung Park and Feng Le Sculpture Park to incorporate more trees and reduce high-carbon facilities, promoting tree planting in Shiquan Park, integrating permeable pavement in Gangxing Park, and considering greening options for Shiquan Park to counterbalance its Hardscape dominance.
4. Discussion
4.1. Interpretation of Findings
The findings of this study underscore a positive relationship between NDVI and CN, wherein higher NDVI corresponds to increased CN. Moreover, CN is positively linked to the proportion of Softscape and inversely correlated with the Hardscape ratio. The study demonstrates that a high NDVI reflects a substantial Softscape percentage and a lesser Hardscape proportion. For instance, Xindu Ecological Park features 78.96% Softscape, an NDVI of 0.62, and 15.19% Hardscape.
Notably, factors like fill, excavation, and carbon-intensive building materials significantly impact CN, with Softscape-rich parks having fewer structures and pavement, resulting in reduced fill, excavation, and material carbon emissions. The role of water bodies warrants separate consideration, as their impact on CN surpasses their impact on resilience due to their association with extensive fill and excavation. While water bodies offer flood mitigation, their construction contributes to CN increase.
The correlation analysis suggests that RI is not strongly linked to LEP, NDVI, and CN. This study advises increasing the Softscape-to-Hardscape ratio and incorporating permeable pavement to enhance CN. Although water bodies play a secondary role, balancing them with tree planting is vital for CN improvement. New parks face challenges in wind resistance due to young trees’ susceptibility and ornamental species’ lack of wind resilience.
The data demonstrates that parks with over 65% Softscape and under 15% Hardscape achieve carbon savings. Previous research aligns with these results, indicating high NDVI in smaller green parks and a negative correlation between NDVI and urban development [52,53,54]. Park size may also influence tree density [55,56]. Parks with irrigation and maintenance tend to have higher NDVI, showcasing well-maintained, shrub-covered parks’ higher NDVI values [52,57]. This study underscores the positive link between Softscape proportion and NDVI magnitude, echoing the idea that lush vegetation is associated with high NDVI. Plant biomass, a key carbon fixer, strongly correlates with NDVI.
According to the statistical results presented in Table 7, four parks have Softscape (Tree cover + Green space) exceeding 65% and Hardscape below 30%, and all of these parks demonstrate positive carbon reduction benefits. This indicates that larger Softscape areas and smaller proportions of built-up surfaces result in lower carbon emissions during park construction, thereby enhancing carbon reduction efficiency. The findings of this study align with previous research. For instance, Dronova et al.’s study on NDVI and local spatial clustering of sensor surface brightness temperature found that small green parks are characterized by high tree cover and high green cover (>69%) with higher NDVI values [58]. Bino et al. explained 84% of the variation in bird species richness through stepwise multiple regression, revealing a strong negative correlation between NDVI and the percentage of roads and built-up areas. Areas with higher paving and building densities tend to have fewer plants [58,59,60]. The findings of Dronova et al.’s study are closely aligned with the data in this study, showing that higher NDVI is associated with lower Hardscape proportions, consistent with the results of Bino et al. and Dronova et al.
According to the site survey and research findings in this study, Yongquan Park covers an area of 6 hectares with 572 trees and an NDVI of 0.21, while Lixin Park spans 4.7 hectares with 433 trees and an NDVI of 0.54. These results do not entirely align with previous research. It is generally assumed that larger parks would have more trees and biomass [61,62]. This study suggests that, aside from the size of the park and the number of trees planted, the density of tree planting may also play a role. Additionally, Bino et al. observed that urban parks tend to have higher NDVI values due to year-round maintenance and irrigation [60]. Consistent with this study’s findings, parks with higher NDVI values are regularly maintained and have more shrubs planted periodically. The results of this study show that higher NDVI correlates with a higher proportion of Softscape, in line with previous research findings. NDVI represents the greenness of a park; a high NDVI indicates a greater amount of vegetation. NDVI is closely related to plant biomass and the carbon fixed through photosynthesis [63,64,65,66].
4.2. Inspiration from Previous Research
Huang et al.’s research focuses on quantifying the carbon footprint of green spaces within parks, and they establish formulae for carbon storage in urban green areas. However, their formulae primarily involve basic engineering calculations and fail to encompass additional carbon footprint factors like demolition, repair, and renewal [19]. This study asserts that while the formulae in Huang et al.’s [33] work lack the comprehensiveness of Yang’s [65] more intricate and time-consuming calculations, they still offer a swift means to estimate a park’s carbon footprint, accounting for both pre-construction and post-construction phases. This attribute makes these formulae useful as a reference for quick estimations in the future.
Numerous scholars have investigated diverse aspects of carbon footprints. Some have computed the entire carbon footprint of construction projects, the carbon footprint associated with landscape upkeep and management, and even the carbon sequestration potential of tree biomass [29]. There exists a choice between calculating carbon sequestration in trees versus plants, sparking a debate on the preferable approach. This study contends that calculating tree biomass aims to precisely evaluate and quantify the mass of biomass stored in trees. Conversely, plant carbon sequestration estimates the carbon accumulated by plants within a specific timeframe. The choice between the two methods hinges on the research’s future objectives, possibly requiring an in-depth exploration of ecosystem dynamics within urban parks. However, it is acknowledged that both approaches face limitations. Tree data scarcity and a restricted sample size are noteworthy constraints identified in the literature review.
4.3. Purpose and Significance of the Study
The current study underscores the significance of assessing the total carbon footprint and resilience as crucial steps toward achieving carbon neutrality in parks. This aids in developing strategies to enhance parks that fall short of carbon neutrality. The study’s four research objectives encompass calculating the carbon footprint of six parks’ landscape engineering, evaluating park resilience, summarizing ideal LEP area ratios, and conducting correlation analysis of LEP, NDVI, and CN. The research successfully fulfilled all these objectives.
Past research on park carbon footprints revealed certain limitations. Strohbach et al. [53] addressed the carbon footprint of entire life cycles but omitted factors like irrigation practices and carbon emissions from certain park facilities. Karuchit et al. [23] focused solely on tree carbon sequestration, neglecting grasslands and other vegetation. Park et al. [42] employed generalized construction material carbon calculations, unlike this study, which localized data for accurate results. Furthermore, while previous studies explored NDVI, RI, and CN in urban parks, none investigated their interconnectedness through field research and data analysis. Thus, this study bridges a crucial research gap.
The study’s significance lies in several aspects: (1) Comprehensive life cycle carbon footprint calculations, encompassing labor, shrubs, and facilities, providing a more holistic assessment. (2) Inclusion of NDVI, RI, and CN, yielding insights into the impact and resilience of carbon-neutral urban parks. (3) Development of ideal LEP ratios tailored to different park types, offering valuable guidance for park construction, enhancement, and carbon neutrality achievement. (4) Provide landscape designers and managers with a tool to assess the carbon neutrality and resilience of parks swiftly and effortlessly, enabling rapid and effective decision-making prior to the design and improvement stages of park projects.
4.4. Research Conclusions
For parks with water bodies, the recommended LEP area ratios are 6.5:2:1.5, and for those without water, the ratios are 8.5:1.5. When the Softscape proportion surpasses 65% and Hardscape remains below 15%, parks with water can achieve satisfactory NDVI and CN values. Similarly, in waterless parks, maintaining a Softscape proportion above 83% and Hardscape under 17% is likely to result in elevated NDVI and CN values. The correlation analysis underscores that NDVI and CN are positively linked, indicating higher NDVI leads to greater CN. Furthermore, a higher NDVI corresponds to a lower Hardscape proportion and a higher Softscape proportion. Elevated CN is associated with reduced Hardscape proportion, while higher Softscape proportion corresponds to higher CN. Conversely, a higher Hardscape proportion is connected to a lower Softscape proportion.
In analyzing the carbon neutrality capabilities of six parks in Taichung City, this study developed a set of evaluation methods for LEP, NDVI, RI, and CN. This method highlights the importance of the interactions among these factors within urban parks and provides actionable recommendations for enhancing park carbon neutrality. However, several key considerations must be addressed to apply and replicate this research framework more broadly.
Firstly, the results of this study indicate a significant correlation between LEP, NDVI, RI, and CN, particularly in parks with higher green space proportions and lower Hardscape ratios. However, these findings are based on a limited sample size and a specific regional context. Therefore, when applying this method to other cities or regions, it is essential to account for differences in local climate conditions, vegetation types, and park management practices.
Secondly, water bodies may play a potentially significant role in park resilience and carbon neutrality. Although this study only included a few parks with water bodies, existing literature suggests that water bodies might make substantial contributions to carbon sequestration. When replicating this research framework, it is recommended to further explore the role of water bodies in various types of parks and consider the integration of facilities such as rainwater management systems. This will contribute to a more comprehensive understanding of the impact of water bodies on park carbon neutrality.
Lastly, this study did not thoroughly investigate the specific effects of different plant species on carbon neutrality efficiency. Future research could involve a detailed assessment of the biomass and carbon sequestration capacity of various tree and shrub species. As research progresses and expands, this study aims to develop more universally applicable methods to provide valuable insights for park planners and other professionals.
4.5. Research Constraints
This study’s scope is restricted to Taichung City, Taiwan. Due to the difficulty in obtaining accurate park project budgets, only six parks were included in the analysis. Future research could gather data from more parks for a more encompassing investigation. Furthermore, as parks were established at different times, comparing newer and older parks will be feasible with a broader dataset. In the calculation of park carbon footprint, this study focuses solely on plant types (tree canopy and shrub/grass coverage). For computational convenience, differences among species, plant cultivation, and related calculations are not considered. Another limitation lies in the seasonal assessment of NDVI, which was only conducted during spring. Data for other seasons is unavailable in this study. This study only included the carbon emissions associated with the construction phase of six newly constructed parks in Taichung City due to the unavailability of data on park maintenance and daily operations, which are typically documented separately. Consequently, the formula for “Landscape Engineering Total Carbon Footprint” includes components like CFrm (maintenance emissions) and CFeu (daily use emissions) that cannot be quantified. Future research will benefit from acquiring detailed data on maintenance and daily operations to provide a more comprehensive assessment of the parks’ carbon footprints.
4.6. Future Research Directions
As previously discussed, achieving carbon neutrality in parks demands a close interrelation among LEP, NDVI, and CN, along with the significance of RI. While this study included a limited number of parks with water bodies, such bodies play a crucial role in both RI and carbon neutrality. When a more extensive park sample is available, incorporating additional water bodies could offer valuable insights. Moreover, future research will concentrate on striking a balance between LEP, NDVI, RI, CN, and the aesthetic quality of parks.
Author Contributions
H.P. Conceptualization, Investigation, Formal analysis, Methodology, Data Curation, Writing—original draft. Y.C. Conceptualization, Methodology, Data Curation. C.H. Data curation, Visualization. F.N. Supervision, Data curation. S.O. Conceptualization, Methodology, Data curation, Supervision, Writing—review and editing. All authors have read and agreed to the published version of the manuscript.
Funding
This research was funded by [National Science and Technology Council of Taiwan] grant number [112-2410-H-324-005-].
Institutional Review Board Statement
Not Applicable.
Informed Consent Statement
This study does not involve humans; hence, this is not applicable.
Data Availability Statement
Data could be available upon reasonable request to the corresponding author.
Conflicts of Interest
The authors declare no conflicts of interest.
References
- Gratani, L.; Varone, L.; Bonito, A. Carbon sequestration of four urban parks in Rome. Urban For. Urban Green. 2016, 19, 184–193. [Google Scholar] [CrossRef]
- Xu, Z.; Zhao, C.; Feng, Z.; Zhang, F.; Sher, H.; Wang, C.; Peng, H.; Wang, Y.; Zhao, Y.; Wang, Y.; et al. Estimating realized and potential carbon storage benefits from reforestation and afforestation under climate change: A case study of the Qinghai spruce forests in the Qilian Mountains, northwestern China. Mitig. Adapt. Strateg. Glob. Change 2013, 18, 1257–1268. [Google Scholar] [CrossRef]
- Development of Low Carbon City. Available online: https://cfp-calculate.tw/cfpc/WebPage/WebSites/docx_detail.aspx?qparentid=61c5ad7f-69aa-4213-9932-cf47660d1330 (accessed on 17 June 2024).
- Nagendra, H.; Gopal, D. Tree diversity, distribution, history and change in urban parks: Studies in Bangalore, India. Urban Ecosyst. 2011, 14, 211–223. [Google Scholar] [CrossRef]
- Nicese, F.P.; Colangelo, G.; Comolli, R.; Azzini, L.; Lucchetti, S.; Marziliano, P.A.; Sanesi, G. Estimating CO2 balance through the Life Cycle Assessment prism: A case—Study in an urban park. Urban For. Urban Green. 2021, 57, 126869. [Google Scholar] [CrossRef]
- Liu, C.; Li, X. Carbon storage and sequestration by urban forests in Shenyang, China. Urban For. Urban Green. 2012, 11, 121–128. [Google Scholar] [CrossRef]
- Wang, Y.; Chang, Q.; Li, X. Promoting sustainable carbon sequestration of plants in urban greenspace by planting design: A case study in parks of Beijing. Urban For. Urban Green. 2021, 64, 127291. [Google Scholar] [CrossRef]
- UNDRR. Disasters Data Pathfinder. Available online: https://www.earthdata.nasa.gov/learn/pathfinders/disasters (accessed on 17 June 2024).
- Lal, R. Soil carbon management and climate change. Carbon Manag. 2013, 4, 439–462. [Google Scholar] [CrossRef]
- Lehmann, S. Growing Biodiverse Urban Futures: Renaturalization and Rewilding as Strategies to Strengthen Urban Resilience. Sustainability 2021, 13, 2932. [Google Scholar] [CrossRef]
- Stigsdotter, U.K.; Corazon, S.S.; Sidenius, U.; Kristiansen, J.; Grahn, P. It is not all bad for the grey city—A crossover study on physiological and psychological restoration in a forest and an urban environment. Health Place 2017, 46, 145–154. [Google Scholar] [CrossRef]
- Wang, R.; Zhao, J.; Meitner, M.J.; Hu, Y.; Xu, X. Characteristics of urban green spaces in relation to aesthetic preference and stress recovery. Urban For. Urban Green. 2019, 41, 6–13. [Google Scholar] [CrossRef]
- Wang, X.; Rodiek, S.; Wu, C.; Chen, Y.; Li, Y. Stress recovery and restorative effects of viewing different urban park scenes in Shanghai, China. Urban For. Urban Green. 2016, 15, 112–122. [Google Scholar] [CrossRef]
- Aspinall, P.; Mavros, P.; Coyne, R.; Roe, J. The urban brain: Analysing outdoor physical activity with mobile EEG. Br. J. Sports Med. 2015, 49, 272. [Google Scholar] [CrossRef]
- Holly. What Is The Difference Between Hardscape and Softscape? Available online: https://paradisescapes.com/what-is-the-difference-between-hardscape-and-softscape/ (accessed on 17 June 2024).
- Huete, A.R.; HuiQing, L.; Leeuwen, W.J.D.v. The use of vegetation indices in forested regions: Issues of linearity and saturation. In Proceedings of the IGARSS’97. 1997 IEEE International Geoscience and Remote Sensing Symposium Proceedings. Remote Sensing—A Scientific Vision for Sustainable Development, Singapore, 3–8 August 1997; Volume 1964, pp. 1966–1968. [Google Scholar]
- Softscape. Available online: https://www.merriam-webster.com/dictionary/softscape (accessed on 17 June 2024).
- Berni, J.A.J.; Zarco-Tejada, P.J.; Suarez, L.; Fereres, E. Thermal and Narrowband Multispectral Remote Sensing for Vegetation Monitoring From an Unmanned Aerial Vehicle. IEEE Trans. Geosci. Remote Sens. 2009, 47, 722–738. [Google Scholar] [CrossRef]
- Haboudane, D.; Miller, J.R.; Pattey, E.; Zarco-Tejada, P.J.; Strachan, I.B. Hyperspectral vegetation indices and novel algorithms for predicting green LAI of crop canopies: Modeling and validation in the context of precision agriculture. Remote Sens. Environ. 2004, 90, 337–352. [Google Scholar] [CrossRef]
- le Maire, G.; François, C.; Soudani, K.; Berveiller, D.; Pontailler, J.-Y.; Bréda, N.; Genet, H.; Davi, H.; Dufrêne, E. Calibration and validation of hyperspectral indices for the estimation of broadleaved forest leaf chlorophyll content, leaf mass per area, leaf area index and leaf canopy biomass. Remote Sens. Environ. 2008, 112, 3846–3864. [Google Scholar] [CrossRef]
- Myneni, R.B.; Hall, F.G.; Sellers, P.J.; Marshak, A.L. The interpretation of spectral vegetation indexes. IEEE Trans. Geosci. Remote Sens. 1995, 33, 481–486. [Google Scholar] [CrossRef]
- León-Tavares, J.; Roujean, J.-L.; Smets, B.; Wolters, E.; Toté, C.; Swinnen, E. Correction of Directional Effects in VEGETATION NDVI Time-Series. Remote Sens. 2021, 13, 1130. [Google Scholar] [CrossRef]
- Cai, Z.; Jönsson, P.; Jin, H.; Eklundh, L. Performance of Smoothing Methods for Reconstructing NDVI Time-Series and Estimating Vegetation Phenology from MODIS Data. Remote Sens. 2017, 9, 1271. [Google Scholar] [CrossRef]
- Pan, H.-Z.; Ou, S.-J.; Hsu, C.-Y. Exploring the Resilience Park Index from the Perspective of Flood and Wind Disasters. Sustainability 2022, 14, 5560. [Google Scholar] [CrossRef]
- What is Carbon Neutrality and How Can It Be Achieved by 2050? Available online: https://www.europarl.europa.eu/topics/en/article/20190926STO62270/what-is-carbon-neutrality-and-how-can-it-be-achieved-by-2050 (accessed on 17 June 2024).
- Pineda, A.C.; Chang, A.; Faria, P. Foundations for Science-Based Net-Zero Target Setting in The 702 Corporate Sector Version 1.0; Science Based Targets: London, UK, 2020. [Google Scholar]
- Rogelj, J.; Schaeffer, M.; Meinshausen, M.; Knutti, R.; Alcamo, J.; Riahi, K.; Hare, W. Zero emission targets as long-term global goals for climate protection. Environ. Res. Lett. 2015, 10, 105007. [Google Scholar] [CrossRef]
- Wei, Y.-M.; Han, R.; Liang, Q.-M.; Yu, B.-Y.; Yao, Y.-F.; Xue, M.-M.; Zhang, K.; Liu, L.-J.; Peng, J.; Yang, P.; et al. An integrated assessment of INDCs under Shared Socioeconomic Pathways: An implementation of C3IAM. Nat. Hazards 2018, 92, 585–618. [Google Scholar] [CrossRef]
- Park, H.-M.; Jo, H.-K.; Kim, J.-Y. Carbon Footprint of Landscape Tree Production in Korea. Sustainability 2021, 13, 5915. [Google Scholar] [CrossRef]
- Karuchit, S.; Puttipiriyangkul, W.; Karuchit, T. Carbon footprint reduction from energy-saving measure and green area of Suranaree University of Technology, Thailand. Int. J. Environ. Sci. Dev. 2020, 11, 174. [Google Scholar] [CrossRef]
- Li, J.; Hong, Y. The Assessment of Carbon Sinks Potential on Landscape Architecture—A Case of House-Style Community Patterns. J. Taiwan Land Res. 2017, 20, 102. [Google Scholar]
- Yang, T. Landscape Construction Carbon Footprint Evaluation System. 2016. [Google Scholar]
- Huang, l.; Zhang, Y.; Deng, Y.; Lin, L.; Liu, X.; Xiao, R. Carbon Footprint Accounting and Evaluation of Urban Green Space. For. Resour. Manag. 2017. [Google Scholar]
- Li, Y.; Yang, W. Discussion on the Application of Low Carbon Concept in Urban Landscape Design. Mod. Hortic. 2019, 132. [Google Scholar]
- Sun, Y.; Hu, Y. Low carbon landscape design under the goal of “carbon peak, carbon neutrality”. Mod. Hortic. 2021, 123. [Google Scholar] [CrossRef]
- Zhao, M.; Feng, Y.; Feng, J. Landscape planning and design of small towns in Kaifeng from the perspective of “double carbon”. Mod. Hortic. 2022, 143. [Google Scholar] [CrossRef]
- Wu, S. Research on the Insufficient Proportion and Coverage of Green Space Layout in Parks. Available online: https://www.ly.gov.tw/Pages/Detail.aspx?nodeid=6590&pid=196797 (accessed on 17 June 2024).
- Wang, Y. The Study on Water Allocation and Area Quantification of Park Waterscape. Chin. Landsc. Archit. 2011, 91. [Google Scholar]
- Jo, H.-K.; Kim, J.-Y.; Park, H.-M. Carbon reduction and planning strategies for urban parks in Seoul. Urban For. Urban Green. 2019, 41, 48–54. [Google Scholar] [CrossRef]
- Shadman, S.; Ahanaf Khalid, P.; Hanafiah, M.M.; Koyande, A.K.; Islam, M.A.; Bhuiyan, S.A.; Sin Woon, K.; Show, P.-L. The carbon sequestration potential of urban public parks of densely populated cities to improve environmental sustainability. Sustain. Energy Technol. Assess. 2022, 52, 102064. [Google Scholar] [CrossRef]
- Park, A. Carbon storage and stand conversion in a pine-dominated boreal forest landscape. For. Ecol. Manag. 2015, 340, 70–81. [Google Scholar] [CrossRef]
- Schwendenmann, L.; Mitchell, N.D. Carbon accumulation by native trees and soils in an urban park, Auckland. New Zealand J. Ecol. 2014, 38, 213–220. [Google Scholar]
- Lin, X. Architectural industry carbon footprint: Carbon management strategies for construction, landscape, and interior decoration. 2018. [Google Scholar]
- Yagci, A.L.; Di, L.; Deng, M. The influence of land cover-related changes on the NDVI-based satellite agricultural drought indices. In Proceedings of the 2014 IEEE Geoscience and Remote Sensing Symposium, Quebec City, QC, Canada, 13–18 July 2014; pp. 2054–2057. [Google Scholar]
- Horning, N.; Robinson, J.A.; Sterling, E.J.; Turner, W.; Spector, S. Remote Sensing for Ecology and Conservation: A Handbook of Techniques; Oxford University Press: Oxford, UK, 2020. [Google Scholar]
- Lee, M.; Lee, S.; Eo, Y.; Pyeon, M.; Moon, K.; Han, S. Analysis on the effect of Landsat NDVI by atmospheric correction methods. 2016, 375–378.
- Zaitunah, A.; Samsuri; Ahmad, A.G.; Safitri, R.A. Normalized difference vegetation index (ndvi) analysis for land cover types using landsat 8 oli in besitang watershed, Indonesia. IOP Conf. Ser. Earth Environ. Sci. 2018, 126, 012112. [Google Scholar] [CrossRef]
- Nejadrekabi, M.; Eslamian, S.; Zareian, M.J. Spatial statistics techniques for SPEI and NDVI drought indices: A case study of Khuzestan Province. Int. J. Environ. Sci. Technol. 2022, 19, 6573–6594. [Google Scholar] [CrossRef]
- Salahi, B.; Behrouzi, M. Modeling of land surface temperature (LST) in Ardabil plain using NDVI index and Bayesian neural network approach. Model. Earth Syst. Environ. 2023, 9, 3897–3906. [Google Scholar] [CrossRef]
- Fern, R.R.; Foxley, E.A.; Bruno, A.; Morrison, M.L. Suitability of NDVI and OSAVI as estimators of green biomass and coverage in a semi-arid rangeland. Ecol. Indic. 2018, 94, 16–21. [Google Scholar] [CrossRef]
- Rouse, J.W.; Haas, R.H.; Schell, J.A.; Deering, D.W. Monitoring vegetation systems in the Great Plains with ERTS. NASA Spec. Publ. 1974, 35, 309. [Google Scholar]
- Dutta, D.; Rahman, A.; Paul, S.K.; Kundu, A. Spatial and temporal trends of urban green spaces: An assessment using hyper-temporal NDVI datasets. Geocarto Int. 2022, 37, 7983–8003. [Google Scholar] [CrossRef]
- Fung, T.; Siu, W.-L. A Study of Green Space and its Changes in Hong Kong Using NDVI. Geogr. Environ. Model. 2001, 5, 111–122. [Google Scholar] [CrossRef]
- Park, J.-H.; Cho, G.-H. Examining the Association between Physical Characteristics of Green Space and Land Surface Temperature: A Case Study of Ulsan, Korea. Sustainability 2016, 8, 777. [Google Scholar] [CrossRef]
- González-Oreja, J.A.; Bonache-Regidor, C.; De La Fuente-Díaz, A.A. Far from the noisy world? Modelling the relationships between park size, tree cover and noise levels in urban green spaces of the city of Puebla, Mexico. Interciencia 2010, 35, 486–492. [Google Scholar]
- Janzen, D.H. No Park Is an Island: Increase in Interference from outside as Park Size Decreases. Oikos 1983, 41, 402–410. [Google Scholar] [CrossRef]
- Dustin, M.C. Monitoring Parks with Inexpensive UAVs: Cost Benefits Analysis for Monitoring and Maintaining Parks Facilities; University of Southern California: Los Angeles, CA, USA, 2015. [Google Scholar]
- Dronova, I.; Friedman, M.; McRae, I.; Kong, F.; Yin, H. Spatio-temporal non-uniformity of urban park greenness and thermal characteristics in a semi-arid region. Urban For. Urban Green. 2018, 34, 44–54. [Google Scholar] [CrossRef]
- Alberti, M.; Booth, D.; Hill, K.; Marzluff, J.; Avolio, C.; Coburn, R.; Coe, S.; Donelly, R.; Spirandelli, D. The impact of urban patterns on ecosystem dynamics. Urban Res. Initiat. NSF PROPOSAL 1999, 2002, 1–3. [Google Scholar]
- Bino, G.; Levin, N.; Darawshi, S.; Van Der Hal, N.; Reich-Solomon, A.; Kark, S. Accurate prediction of bird species richness patterns in an urban environment using Landsat-derived NDVI and spectral unmixing. Int. J. Remote Sens. 2008, 29, 3675–3700. [Google Scholar] [CrossRef]
- Feyisa, G.L.; Dons, K.; Meilby, H. Efficiency of parks in mitigating urban heat island effect: An example from Addis Ababa. Landsc. Urban Plan. 2014, 123, 87–95. [Google Scholar] [CrossRef]
- Shah, A.; Garg, A.; Mishra, V. Quantifying the local cooling effects of urban green spaces: Evidence from Bengaluru, India. Landsc. Urban Plan. 2021, 209, 104043. [Google Scholar] [CrossRef]
- Alexander, C. Normalised difference spectral indices and urban land cover as indicators of land surface temperature (LST). Int. J. Appl. Earth Obs. Geoinf. 2020, 86, 102013. [Google Scholar] [CrossRef]
- Evans, K.L.; Greenwood, J.J.D.; Gaston, K.J. Dissecting the species–energy relationship. Proc. R. Soc. B Biol. Sci. 2005, 272, 2155–2163. [Google Scholar] [CrossRef]
- Kerr, J.T.; Ostrovsky, M. From space to species: Ecological applications for remote sensing. Trends Ecol. Evol. 2003, 18, 299–305. [Google Scholar] [CrossRef]
- Yuan, F.; Bauer, M.E. Comparison of impervious surface area and normalized difference vegetation index as indicators of surface urban heat island effects in Landsat imagery. Remote Sens. Environ. 2007, 106, 375–386. [Google Scholar] [CrossRef]

Disclaimer/Publisher’s Note: The statements, opinions and data contained in all publications are solely those of the individual author(s) and contributor(s) and not of MDPI and/or the editor(s). MDPI and/or the editor(s) disclaim responsibility for any injury to people or property resulting from any ideas, methods, instructions or products referred to in the content. |
© 2024 by the authors. Licensee MDPI, Basel, Switzerland. This article is an open access article distributed under the terms and conditions of the Creative Commons Attribution (CC BY) license (https://creativecommons.org/licenses/by/4.0/).