Abstract
As a critical component of substations, the substation frames are characterized by significant height and span, which presents substantial challenges and risks in conducting dynamic response tests using traditional sensors. To simplify these difficulties, this paper introduces an experimental method utilizing MEMS sensor-based vibration acquisition. In this approach, smartphones equipped with MEMS sensors are deployed on the target structure to collect vibration data under environmental excitation. This method was applied in a dynamic field test of a novel composite substation frame. During the test, the proposed MEMS-based vibration acquisition method was conducted in parallel with traditional ultra-low-frequency vibration acquisition methods to validate the accuracy of the MEMS data. The results demonstrated that the MEMS sensors not only simplified the testing process but also provided reliable data, offering greater advantages in testing convenience compared with traditional contact methods. The modal parameters of the substation frame, including modal frequencies, damping ratios, and mode shapes, were subsequently identified using the covariance-driven stochastic subspace identification method. The experimental methodology and findings presented in this paper offer valuable insights for structural dynamic response testing and the wind-resistant design of substation frames.
1. Introduction
Substation frames are spatial truss structures, characterized by their significant height and large spans, typically arranged in rows within power substations. In engineering practice, it is crucial for substation frames in operation to maintain stable dynamic characteristics, often represented by modal parameters. However, due to the cumulative effects of various environmental factors, such as rain, snow, strong winds, and earthquakes, these structures are susceptible to fatigue, potentially altering their dynamic characteristics [1,2,3,4]. The collapse of a single-row substation frame can initiate a chain reaction, posing a serious threat to the normal operation of the substation. Therefore, conducting dynamic characteristic tests on newly constructed substation frames is essential to ascertain the modal parameters and ensure their reliability in service.
From a structural dynamic perspective, field testing is the most reliable method for obtaining the dynamic response of a structure [5,6,7]. However, collecting dynamic responses from substation frames entails significant risks. Traditional methods of acquiring dynamic responses primarily involve deploying contact-type vibration sensors on the target structure. For instance, the 941b ultra-low-frequency vibration pickups are capable of accurately capturing structural vibrations under various load conditions [8]. Despite their accuracy, these sensors may not perform optimally for certain structures, such as tall steel frames. The need to connect vibration pickups to data acquisition devices via shielded cables introduces challenges, particularly when measurement points are located at considerable heights. Under lateral loads, such as wind, the shielded wire may swing, occasionally causing the solder joint between the shielded wire and the sensor to disconnect. As a result, it is necessary to explore a new experimental method to simplify the testing process.
To address the aforementioned issues, computer vision-based vibration measurement technology has become increasingly popular [9,10,11,12]. This method primarily relies on high-precision visual equipment to capture video footage of the target structure, and then employs computer vision processing techniques to extract the vibration response at specific points. However, this approach is not without challenges. Firstly, as a non-contact measurement method, it introduces the potential for errors due to vibrations from the acquisition equipment itself. Secondly, the method requires calibration at fixed positions on the structure, which may not significantly reduce the experimental complexity. Furthermore, the equipment involved is expensive, and the analysis of vibration responses is heavily dependent on the performance of the computing hardware. Consequently, for certain specialized structures, particularly those where height complicates vibration monitoring, there is a clear need for the development of a more user-friendly and cost-effective vibration acquisition method to advance structural dynamic response research [13,14,15,16,17].
At the same time, the development of micro-electromechanical systems (MEMS) technology offers a new option for vibration monitoring [18]. Firstly, MEMS technology has made it possible to miniaturize traditional sensors into tiny semiconductor components, such as MEMS sensors [19,20]. By simulating the structure of traditional sensors, MEMS can achieve acceleration acquisition. Secondly, the development of MEMS technology has significantly reduced the cost of semiconductor components. These two factors enable the application of MEMS sensors in structural vibration monitoring, although the use of MEMS sensors still requires a carrier. Today, most mobile devices are equipped with built-in MEMS sensors, providing a good means to capture structural acceleration responses using MEMS sensors. Moreover, there are examples where MEMS sensors have been utilized to assess structural and seismic behavior, with the aim of detecting and localizing damage [21,22].
Although the simplicity of tests is an advantage, the limitations of MEMS sensors in application should not be overlooked [23]. Firstly, MEMS are not suitable for long-term monitoring of structures. This is because MEMS sensors require specific carriers, such as portable devices and smartphones, and using such carriers for long-term vibration acquisition is impractical. Secondly, MEMS sensors, being micro semiconductor components, differ from specialized acquisition equipment in that they lack robust durability, which may result in time-history data containing background noise. Therefore, when using MEMS sensor data for parameter identification and analysis, it is advisable to choose identification algorithms with better robustness.
Once the structural dynamic response is obtained, the modal parameters identification approach can be employed to determine the modal parameters of the structure, including modal frequencies, damping ratios, and mode shapes [24,25,26]. These parameters collectively reflect the structure’s vibration characteristics, energy dissipation capacity, and modal deformation patterns [27,28,29,30,31,32]. These parameters also play a significant role in structural engineering, such as in the calibration of numerical models, allowing the physical response of numerical models to better approximate the actual structures, thereby further extending research into damage identification under extreme conditions [33]. In power systems, these parameters are primarily used for wind-resistant design of structures [2,24]. On the other hand, the common methods for structural modal parameter analysis include time-domain and frequency-domain approaches [34,35,36,37,38]. Time-domain methods directly utilize the experimental time-domain responses to identify modal parameters, with techniques such as the AutoRegressive Moving Average Model [39], the Random Decrement Technique [40,41], the Covariance-Driven Stochastic Subspace Identification (SSI-Cov) method [42,43,44], and the Data-Driven Stochastic Subspace Identification method [45,46,47]. In contrast, frequency-domain methods transform the time-domain responses into the frequency domain using Fourier Transform for parameter analysis. Notable examples include the Peak Picking method [48] and Frequency-Domain Decomposition (FDD) [49,50].
Amongst these methods, the SSI-Cov approach offers a robust algorithm. It is based on stochastic theory and is particularly effective for modal parameter identification. It constructs a Toeplitz matrix using the covariance matrix of the structural response signals and then extracts modal parameters through singular value decomposition [51,52]. This method is efficient in processing time-domain response data under ambient excitation, and its parameter identification process is minimally affected by noise. The SSI-Cov method has been widely applied to identify the dynamic characteristics of various civil engineering structures, including bridges, high-rise buildings, and some critical civil infrastructures [44,53,54,55]. Therefore, this study employed the SSI-Cov method to identify the modal parameters from the dynamic response time histories of the substation frame.
In summary, this paper proposes an experimental method for obtaining the dynamic response of substation frames under ambient excitation using MEMS sensors for vibration data acquisition. The method involves the deployment of smartphones equipped with MEMS sensors on the target structure to capture vibration responses. Based on this data, the SSI-Cov method is employed to identify the modal parameters of the structure. The second section of this study introduces the field test using MEMS-based vibration acquisition devices, covering an overview of the structure, the principles of MEMS vibration data acquisition, and the execution of the field test. The third section focuses on analyzing the time–frequency response characteristics of the acquired data, along with wind speed data characteristics, and presents the wind profile results for the structure in both parallel and vertical truss directions. In the fourth section, the SSI-Cov method is used to analyze the vibration responses, identifying the primary modal frequencies, damping ratios, and mode shapes of the structure. The findings from this study offer valuable references for vibration testing of tall steel structures and for the wind-resistant design of substation frames.
2. Field Test of Vibration Data Acquisition with Portable Devices
This section first provides an overview of the new substation frame used in the field vibration test. Given the considerable height and large span of the frame, a novel method utilizing MEMS sensors for vibration response acquisition was proposed to simplify the testing protocol. This method was successfully implemented to acquire the dynamic response of the new substation frame.
2.1. Overview of the Test Substation Frame
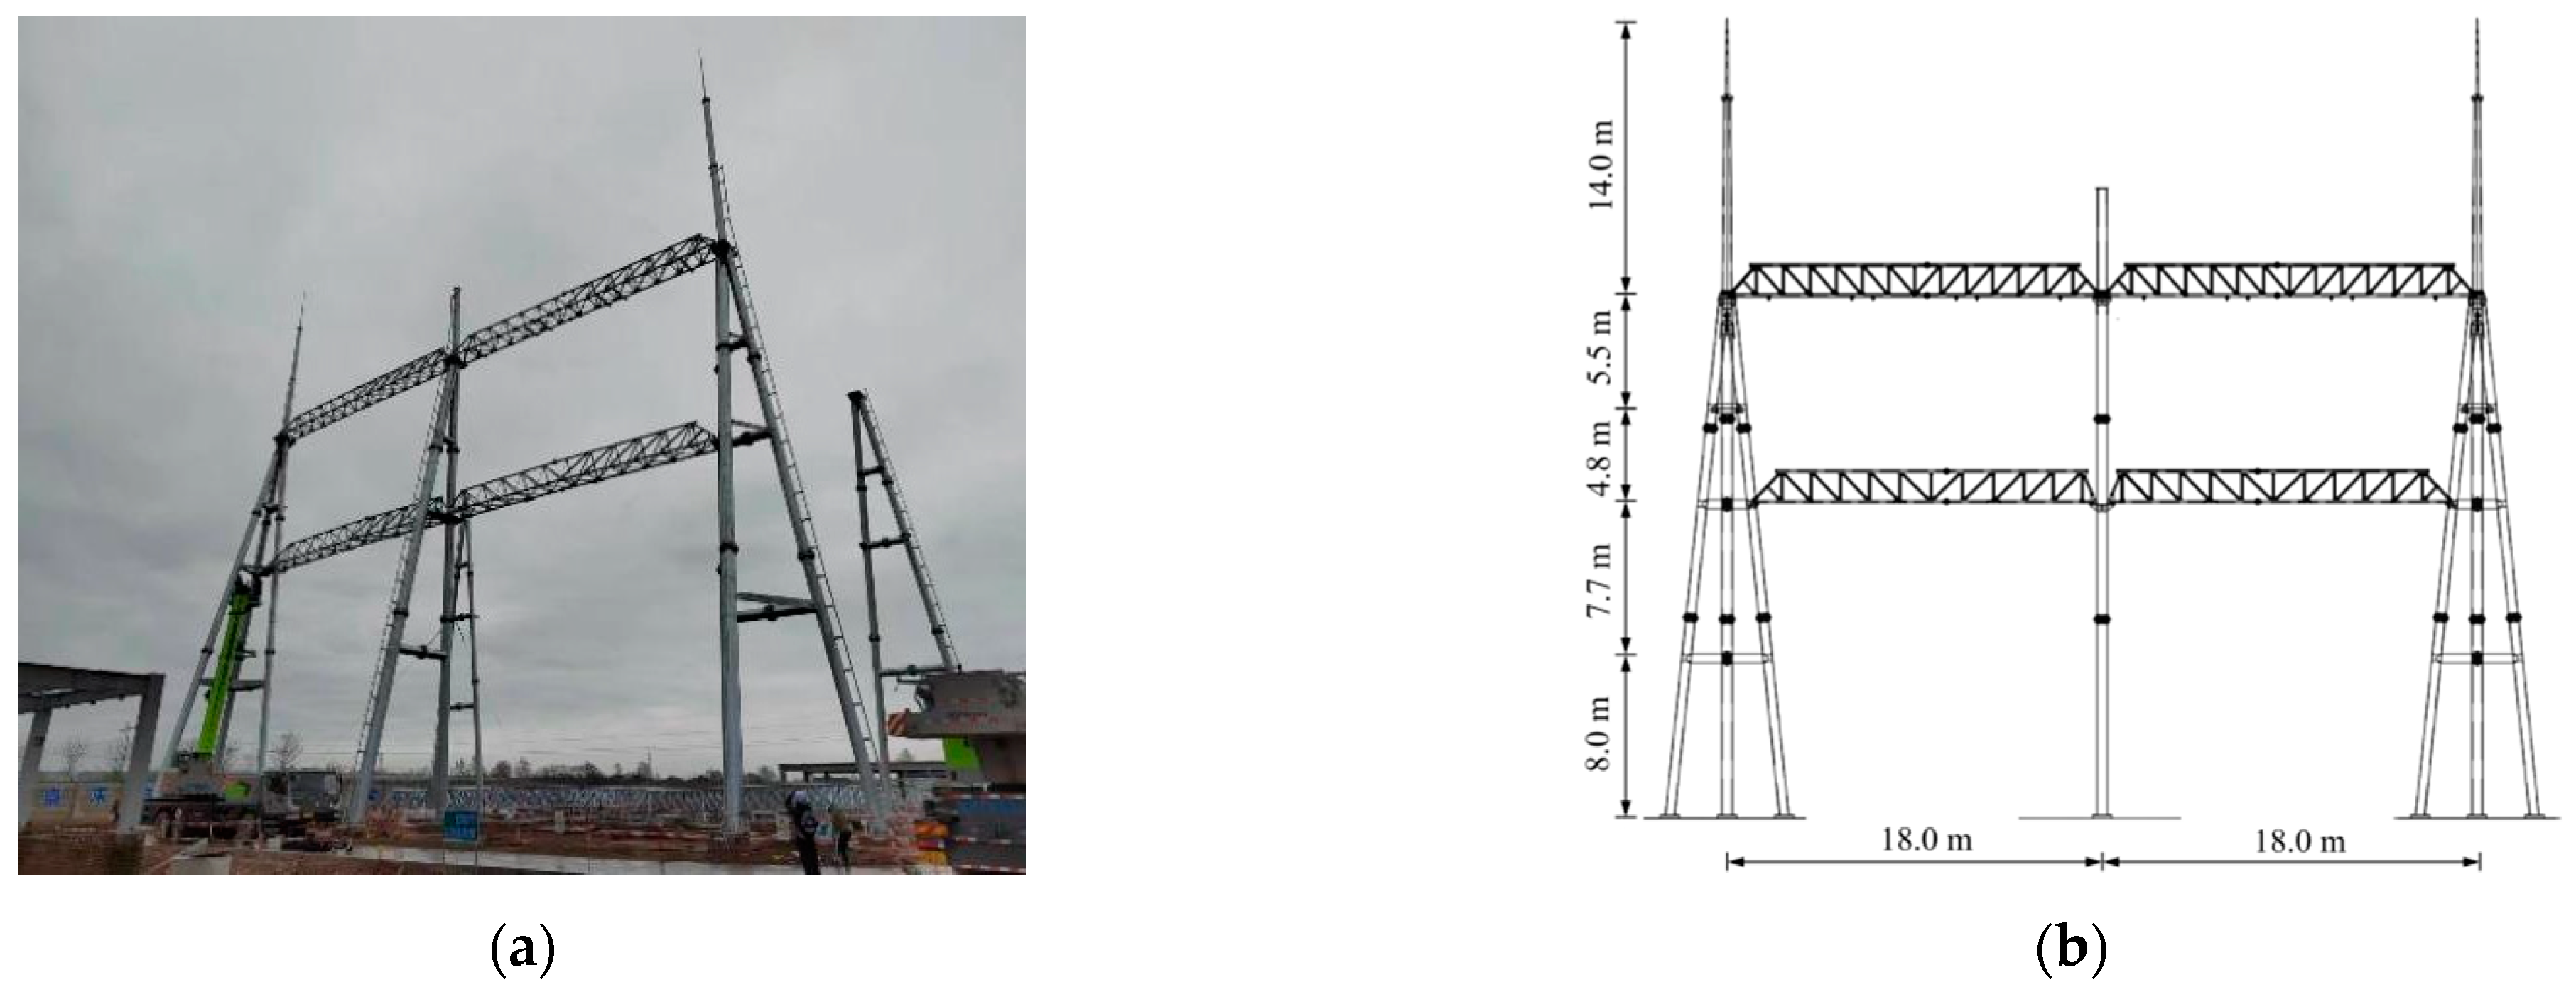
The test substation frame is located in Baoji, Shaanxi Province, and represents the first of a new type of hybrid Gas-Insulated Substation. Due to the compact overall dimensions of this substation, conducting a dynamic response study on its substation frame holds significant engineering value, as shown in Figure 1a. Typically, substations consist of multiple rows of substation frames. To ensure the overall rigidity of the frame while maintaining the flexibility of the outgoing lines, the structural designers retained the central column of the first substation frame in the substation. Figure 1b illustrates the main dimensions of the test substation frame, which is a double-layer truss structure with left-right symmetry. The upper layer is the outgoing line truss, and the lower layer is the busbar truss. The length from the outermost column to the central column is 18 m, the height of the busbar truss is 15.7 m, and the height of the outgoing line truss is 26 m. Despite the relatively compact structure of this substation frame, a lightning protection wire has been installed to enhance its lightning resistance.
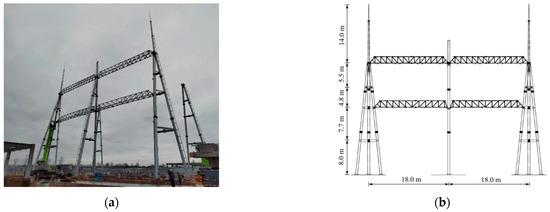
Figure 1.
Substation frame in the field test: (a) substation frame; (b) main dimensions.
2.2. Working Principle of MEMS Sensors
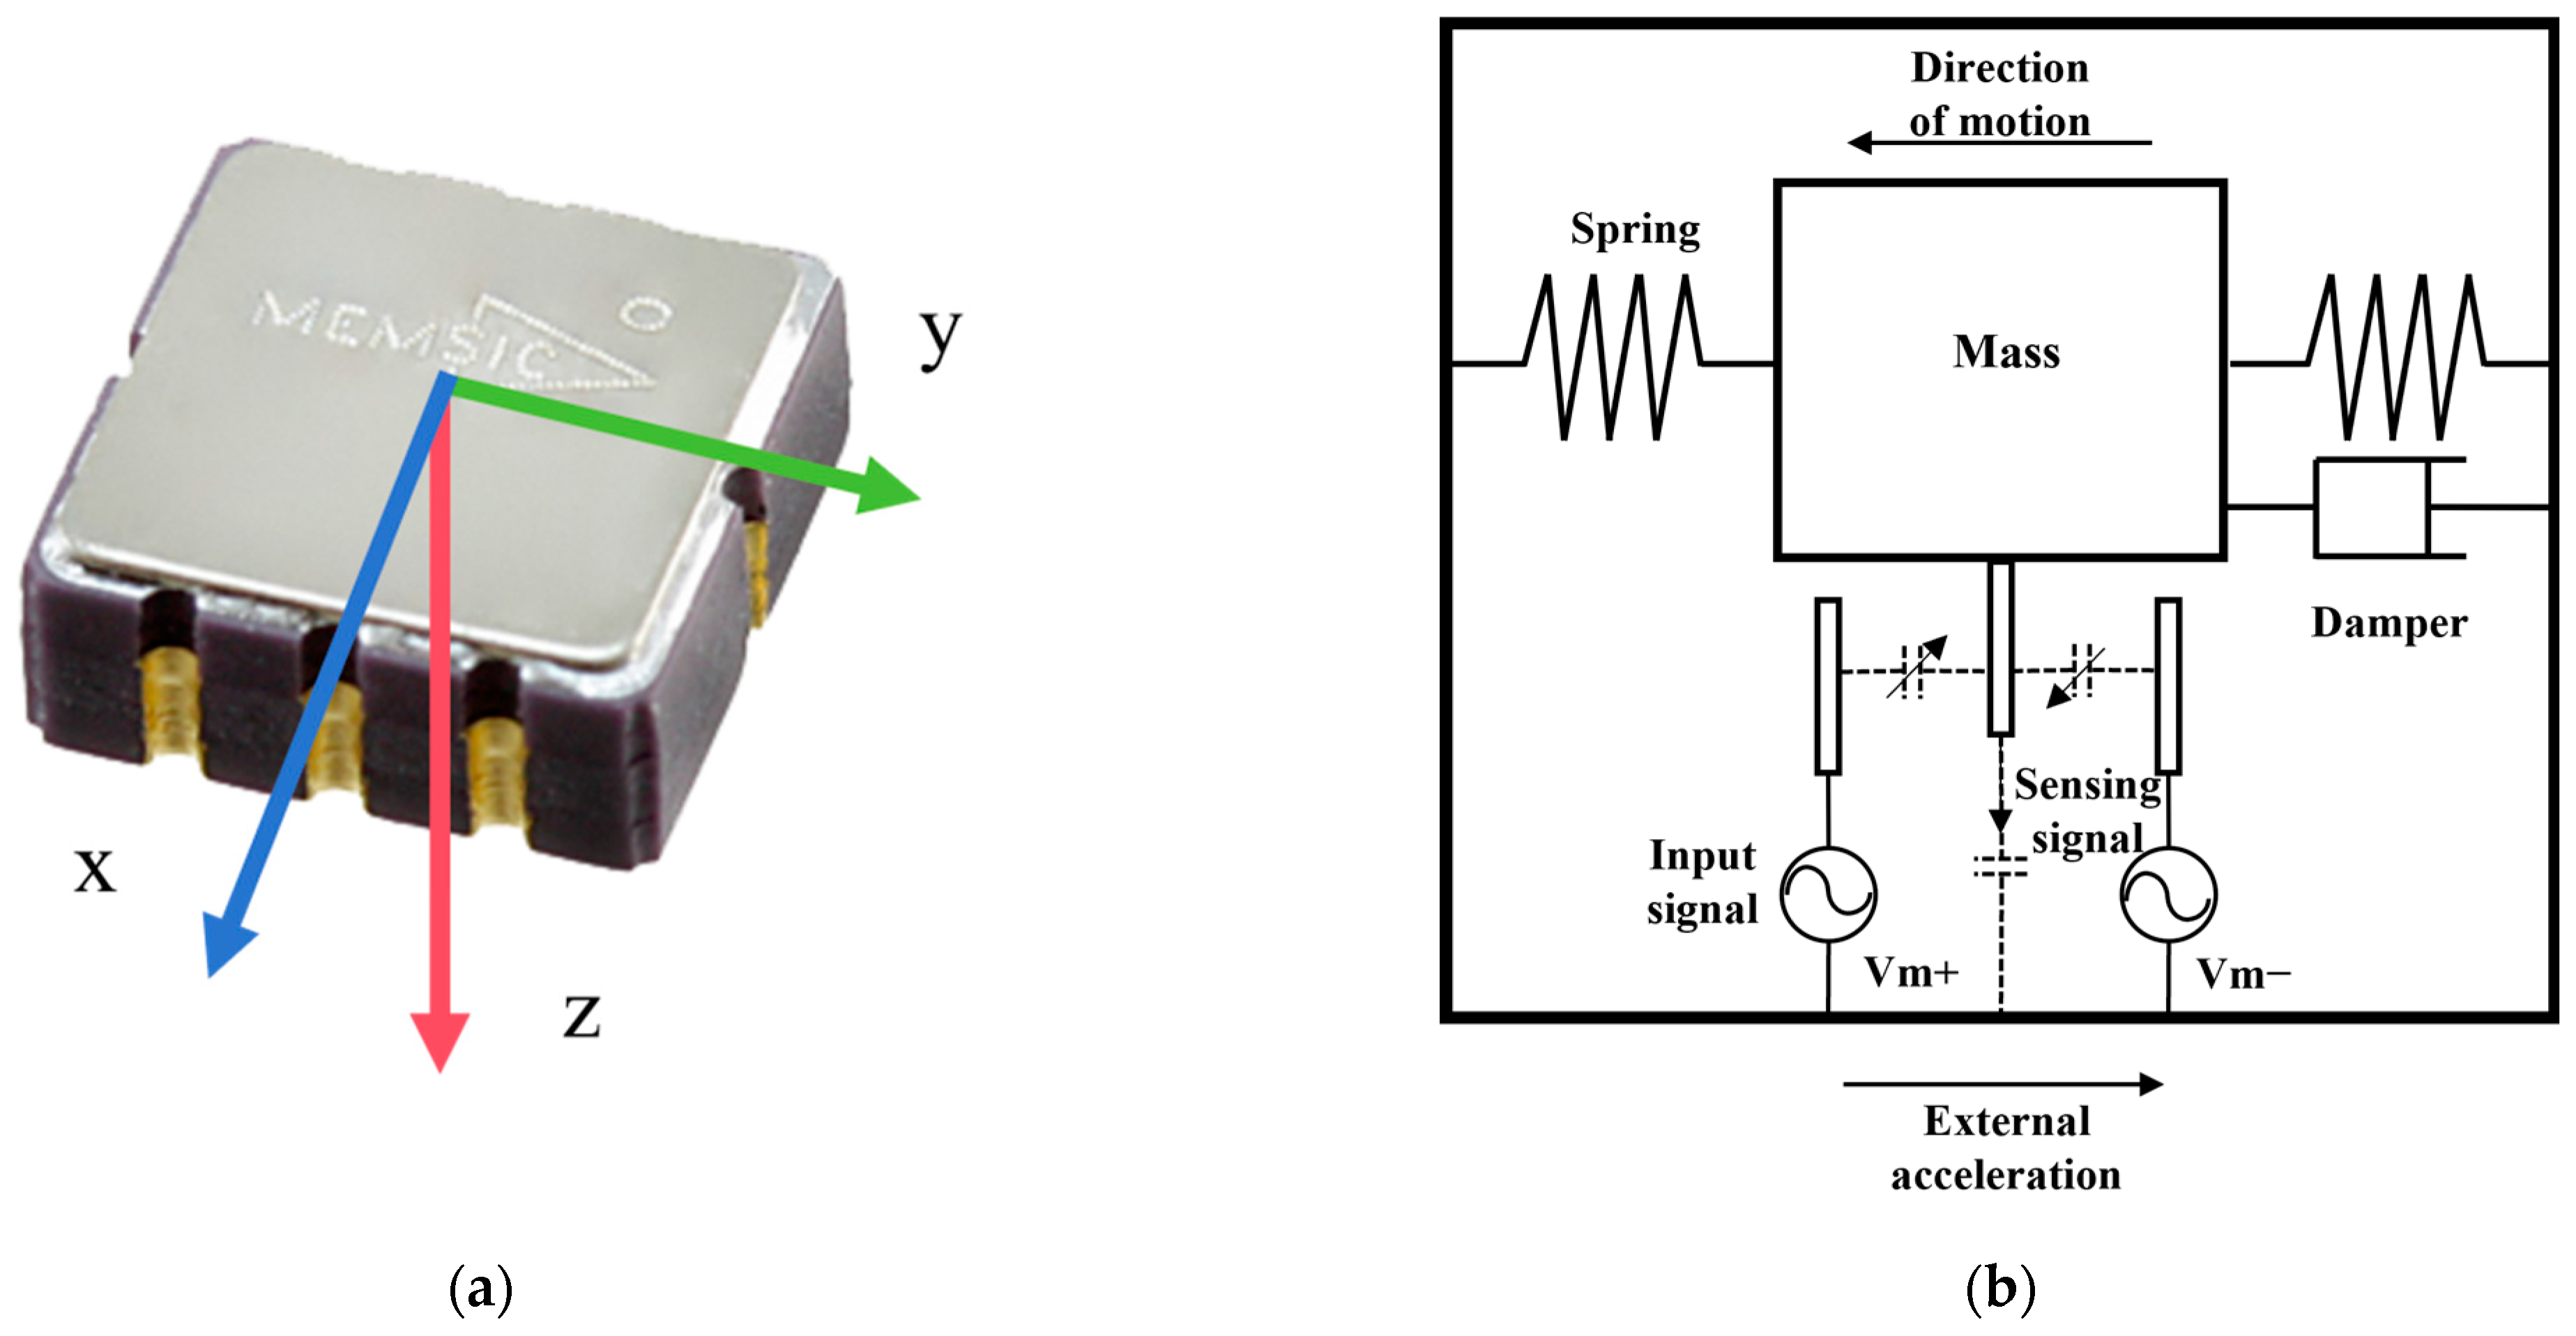
A smartphone was used as the vibration acquisition device, with vibration data primarily collected through the MEMS sensors embedded in the phone. Modern smartphones are typically equipped with built-in MEMS sensors, as illustrated in Figure 2a. A MEMS sensor functions as a gyroscopic accelerometer with three mutually orthogonal axes designed to detect acceleration from different directions. The inclusion of a gyroscope allows the smartphone to approximately measure gravitational acceleration regardless of its orientation, whether placed horizontally or vertically, thereby eliminating the need for sensor calibration.

Figure 2.
MEMS sensor: (a) MEMS sensor; (b) principle of operation.
MEMS sensors operate based on Newton’s second law, functioning as a mass-spring-damper system within a three-dimensional silicon structure. As shown in Figure 2b, the sensor’s core consists of a mass block attached to a movable arm, which is connected to a fixed arm through a capacitive structure. When the sensor experiences acceleration, the mass block moves opposite to the direction of motion, changing the capacitance and, in turn, the sensing voltage. This voltage change enables the detection of external acceleration. Key components such as the mass block, springs, and dampers are mechanical elements made from silicon using advanced processing techniques and play crucial roles in the sensor’s operation.
2.3. Field Test
To collect vibration responses using MEMS sensors, the first step is to select an appropriate acquisition device. In this test, an iPhone 8 smartphone was chosen as the vibration acquisition device. This device is equipped with precise MEMS sensors capable of continuously capturing structural vibration responses within the frequency range of 0–100 Hz. It should be noted that the primary natural frequencies of civil engineering structures are often concentrated in the low-frequency range (below 10 Hz), which means that using a smartphone as a vibration acquisition device can fully meet engineering requirements. Traditional vibration testing methods typically involve either artificial excitation or ambient excitation. Ambient excitation, which utilizes environmental factors such as microseisms and wind loads as excitation sources, requires no special excitation equipment and provides broadband excitation conditions for the test. Given these advantages, ambient excitation was selected as the excitation condition for this experiment.
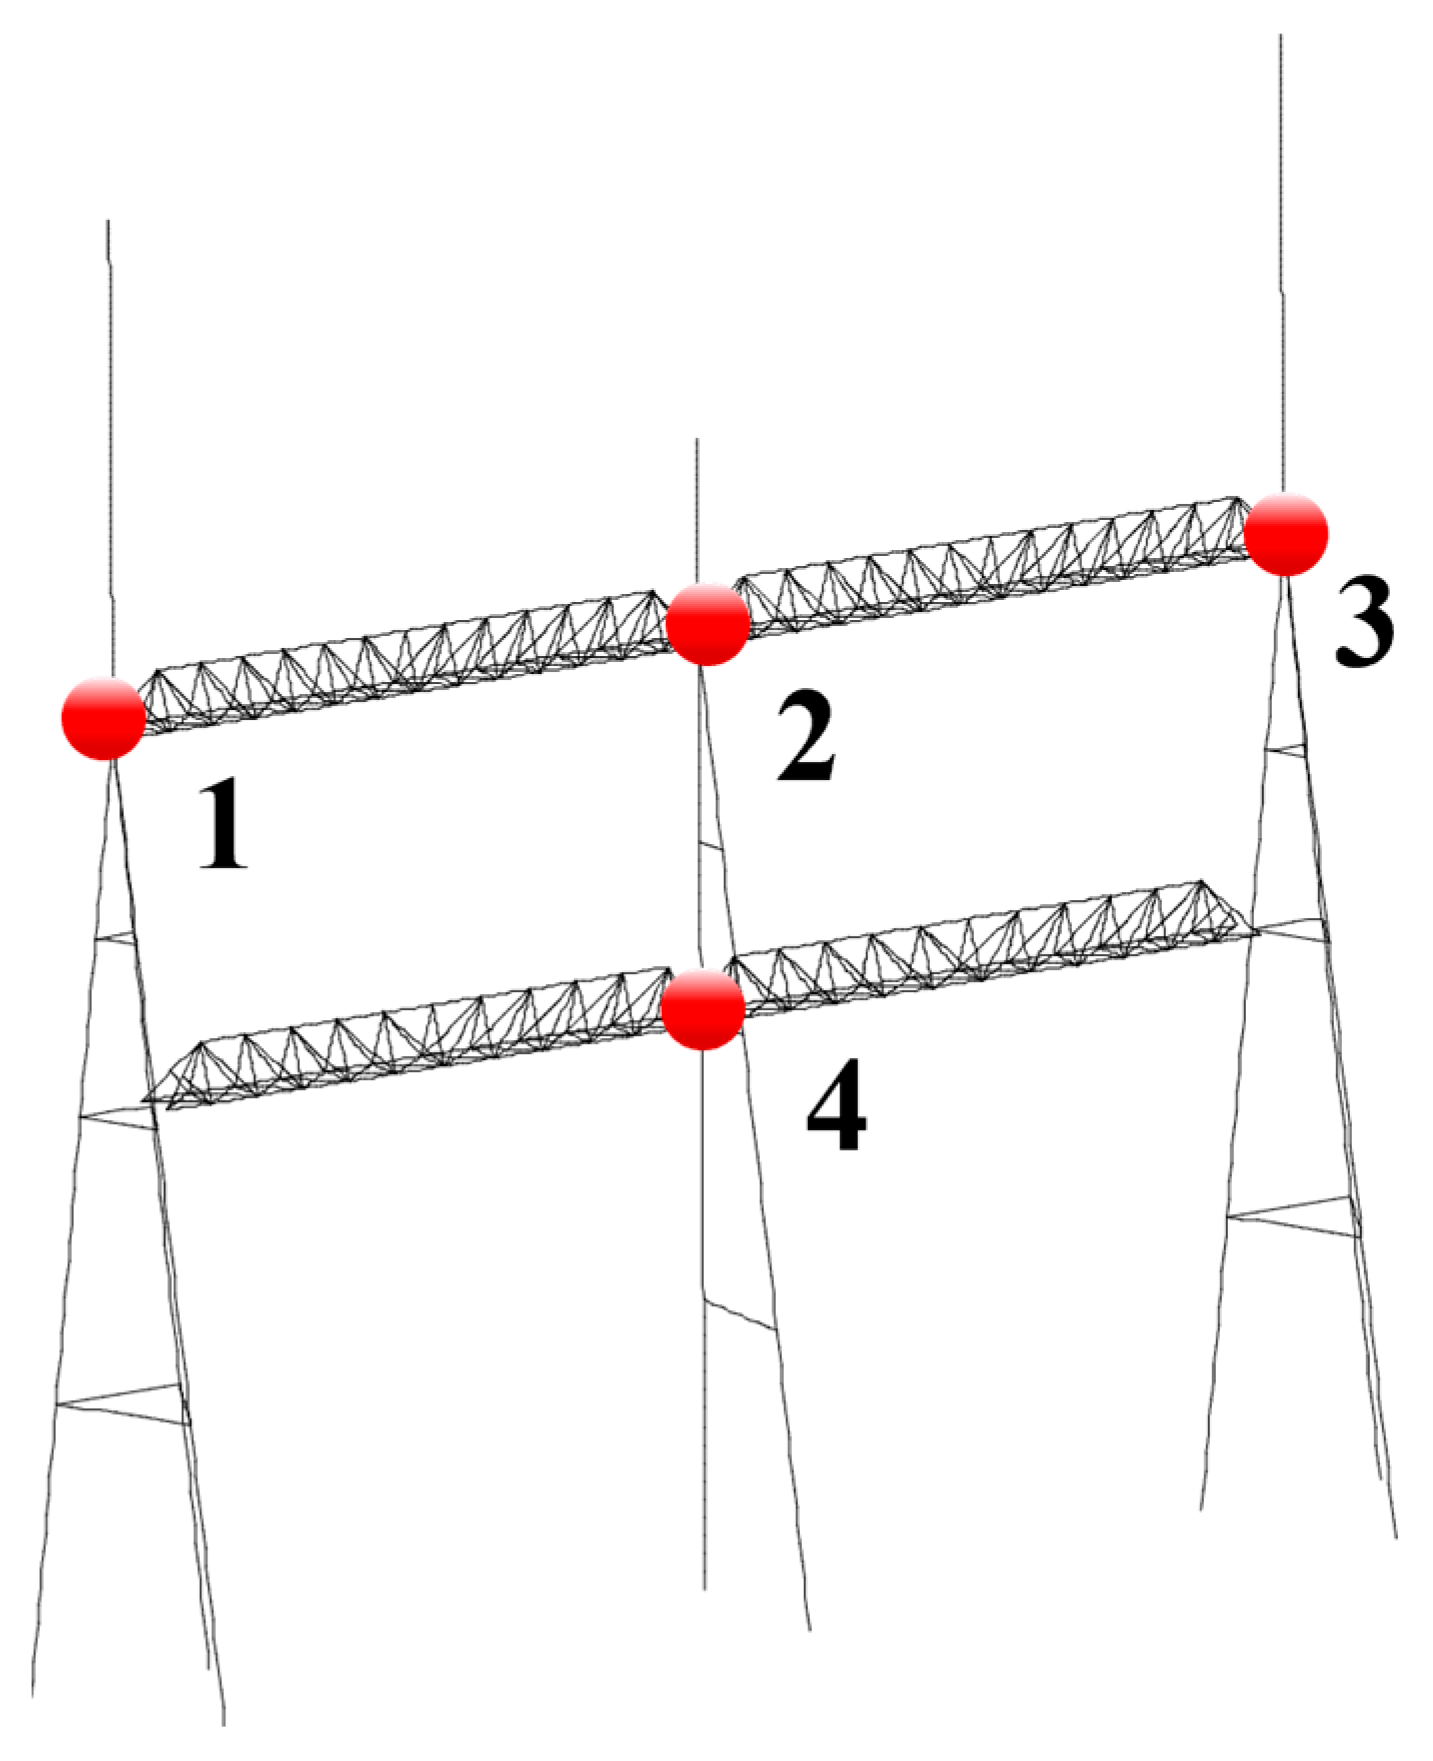
Prior to the test, it was necessary to determine the arrangement of the measurement points. In this test, a total of four measurement points was arranged, with two sensors placed at each point—one aligned with the parallel truss direction and the other aligned with the vertical truss direction. The layout of the measurement points is illustrated in Figure 3, with red dots and numbers denote the measurement points’ location and numbers, respectively. As shown, two accelerometers were placed on the central column to capture overall vibration responses, while the other two points were positioned on either side of the column to collect torsional responses.
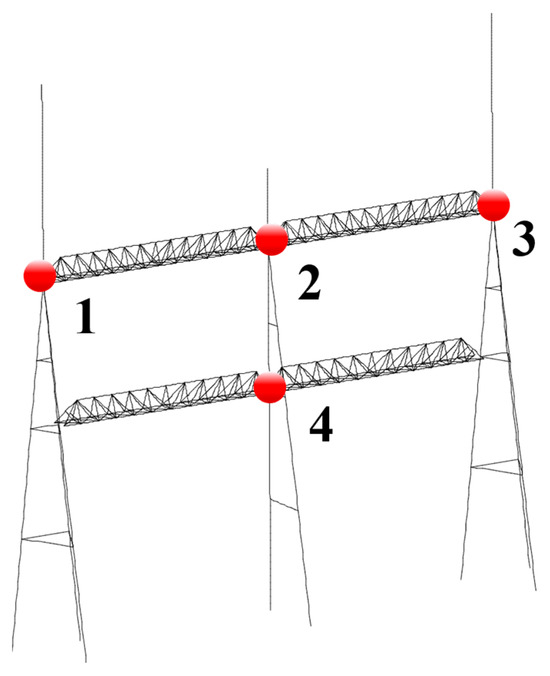
Figure 3.
Layout of the measurement points.
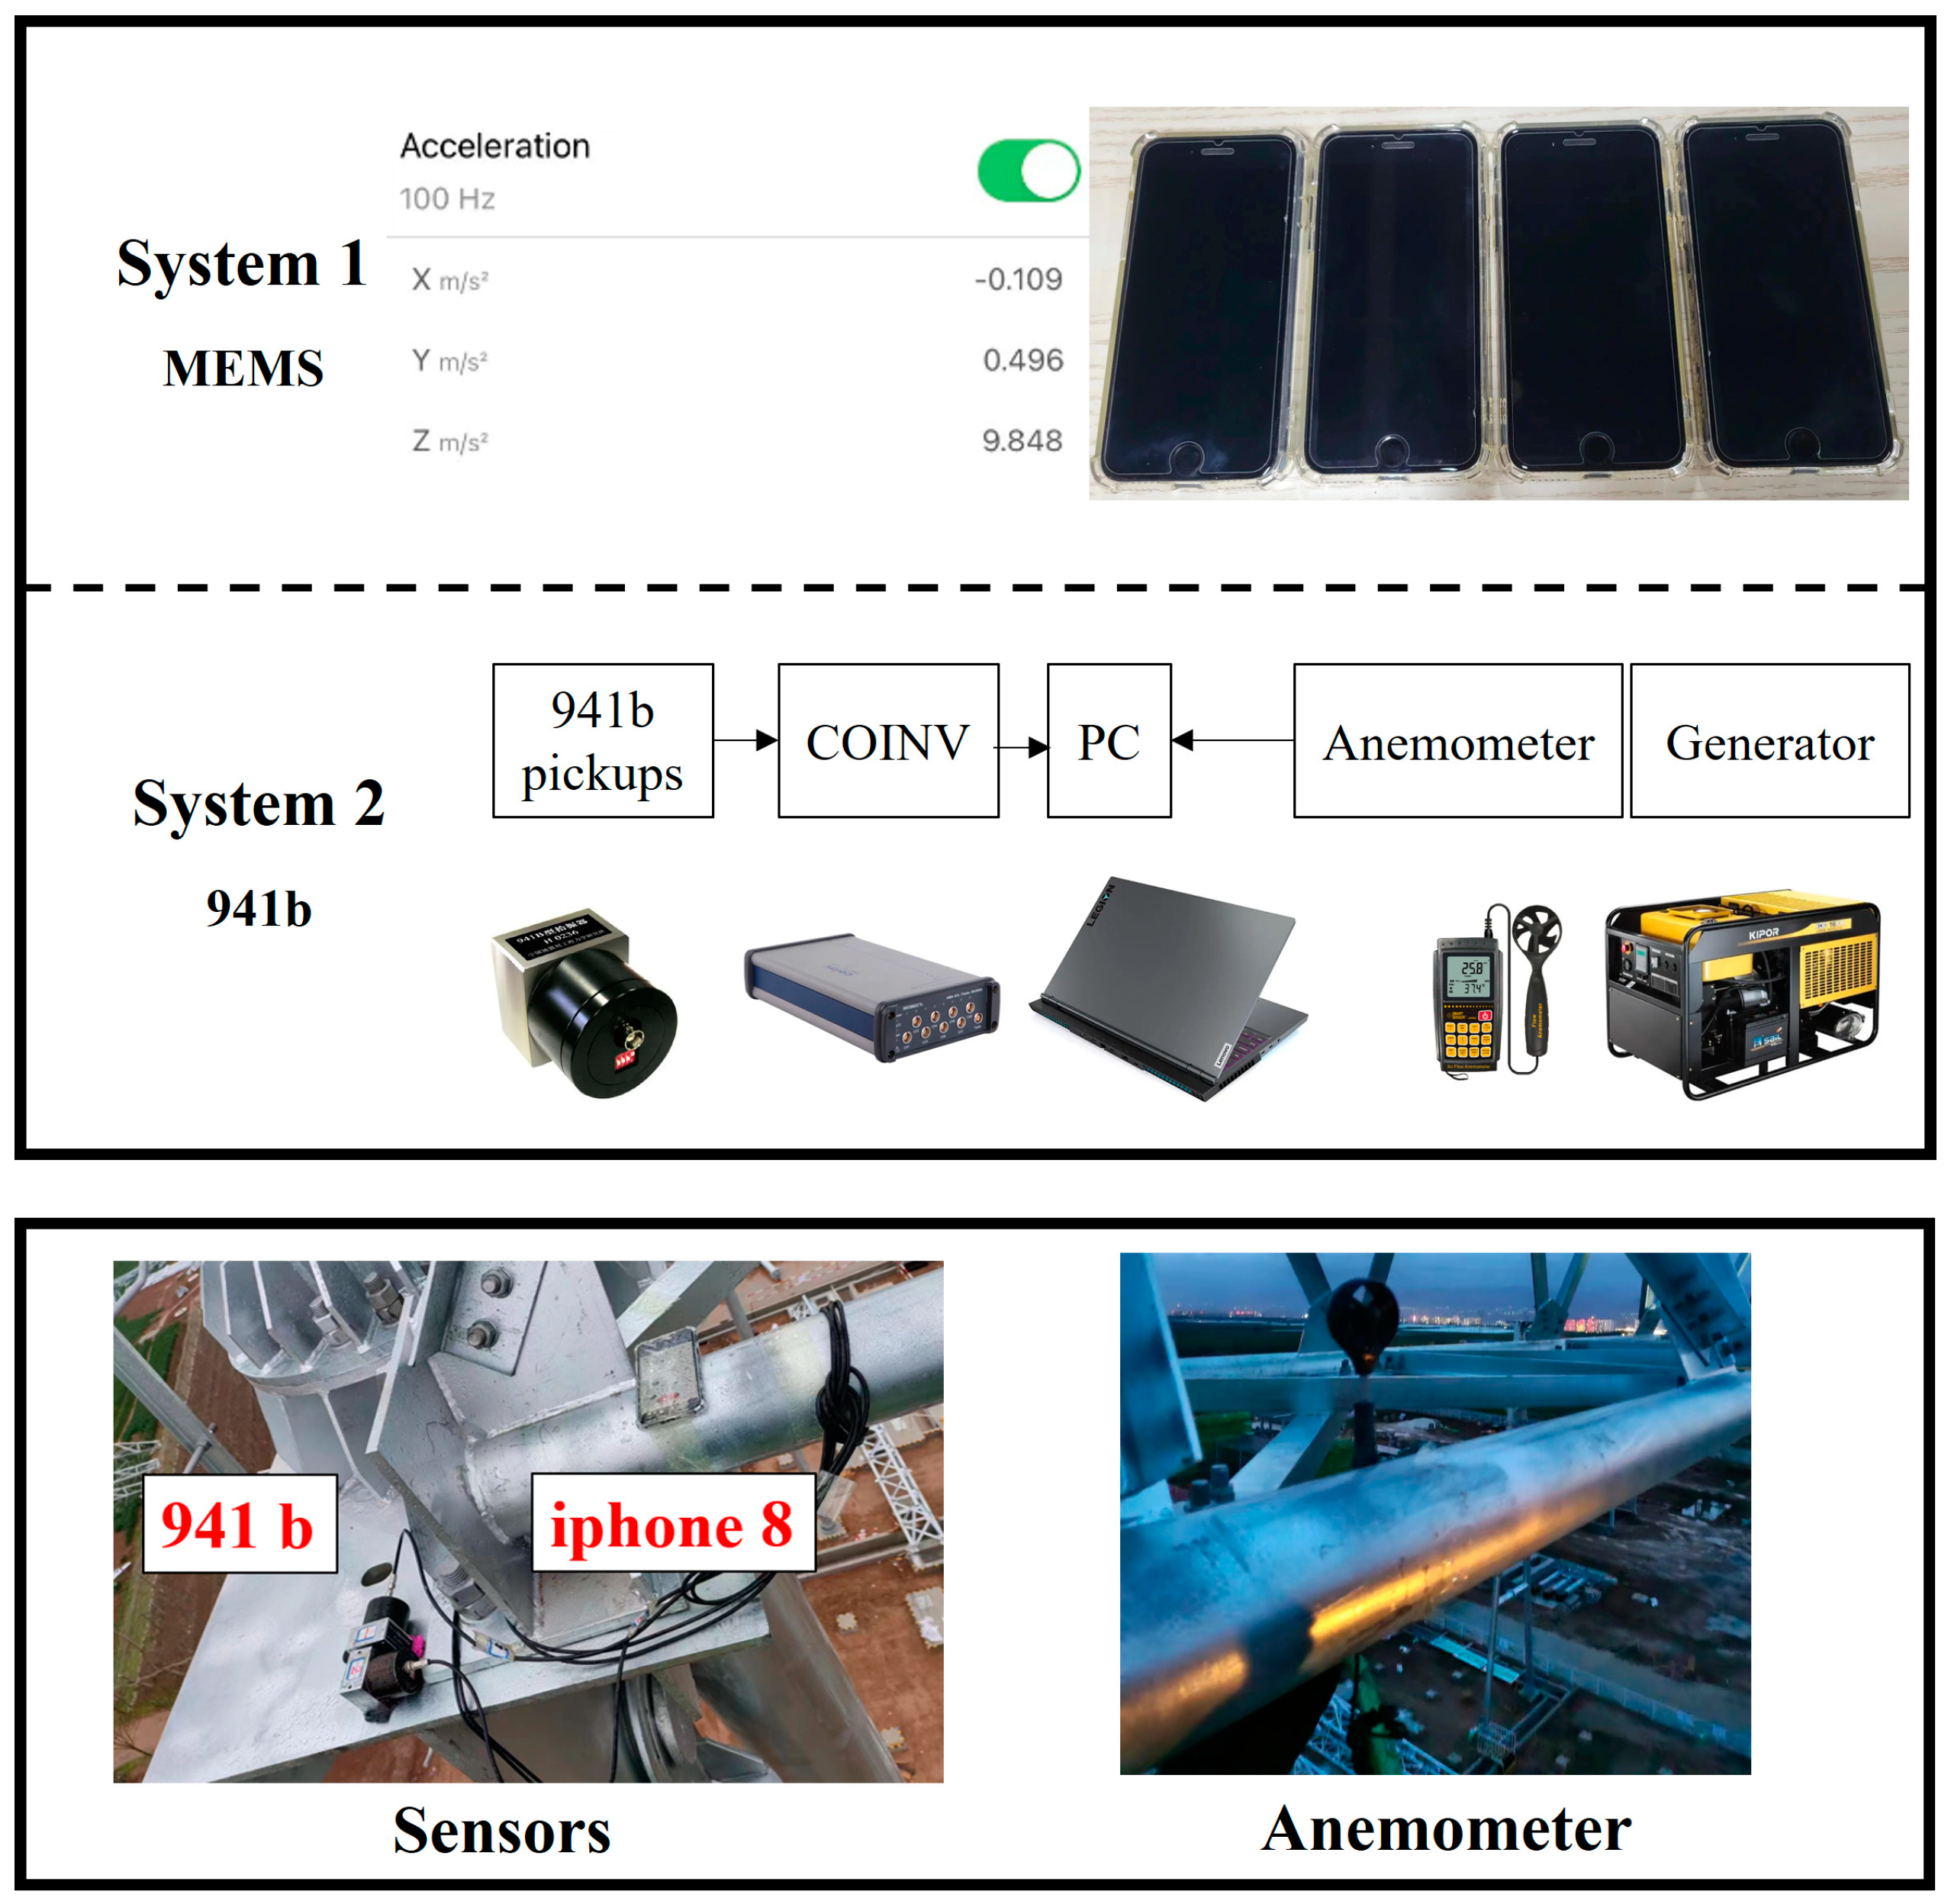
Upon the researchers’ arrival at the test site, the vibration acquisition system was assembled, as shown in Figure 4. In addition to setting up the MEMS acquisition system, a complete 941b vibration pickup system was installed at corresponding locations to serve as a comparison with the MEMS system. Anemometers were also installed at the test site to monitor wind speed variations during the experiment. After the system setup was complete, the sampling frequency was set to 100 Hz, and the acceleration response of the structure under ambient excitation was continuously recorded for 1800 s.

Figure 4.
Vibration collection system and field test.
3. Analysis of Experimental Data Characteristics
This section analyzes the characteristics of the response data obtained from the experiment, with the aim of comparing the data characteristics acquired through the two different collection methods.
3.1. Time–Frequency Characteristics of MEMS Data
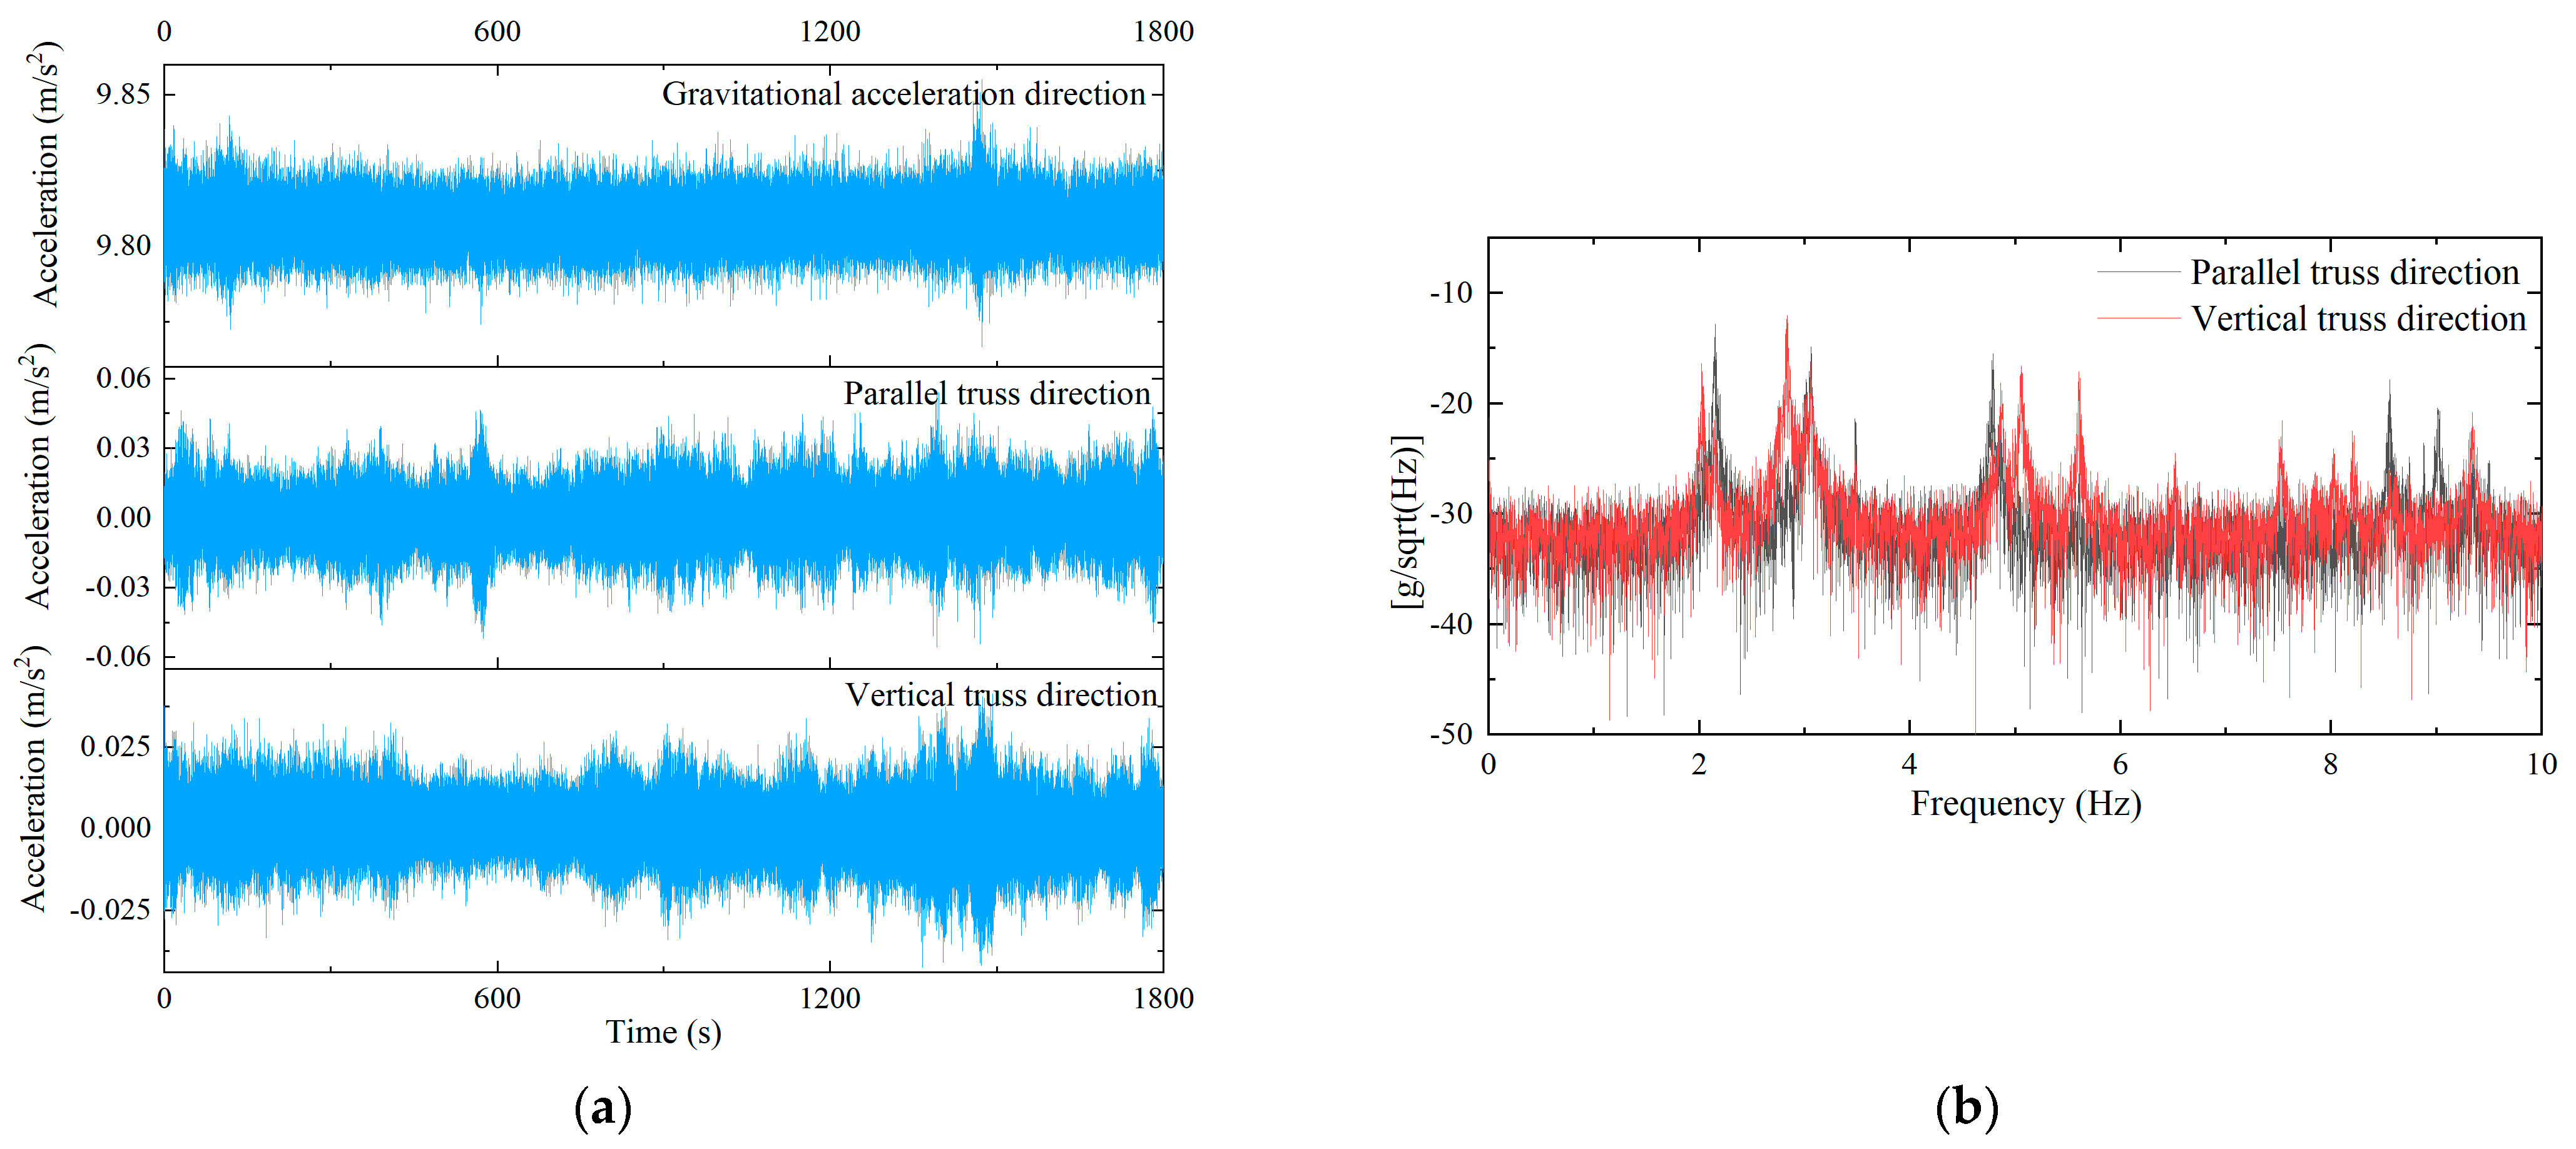
Figure 5a presents the time-domain response data collected by the MEMS sensors at measurement point 1 during the test. It is evident that in the direction of gravitational acceleration, the response signal fluctuates around 9.8 m/s2 as sampling time increases, which is approximately consistent with the expected gravitational acceleration. In both the parallel and vertical truss directions, the response signals fluctuate around a mean value of zero as sampling time progresses. Figure 5b displays the root power spectral density plot for measurement point 1. In the parallel truss direction, distinct peaks appear at frequencies such as 2.14 Hz and 3.05 Hz; similarly, in the vertical truss direction, peaks are observed at 2.14 Hz and 2.82 Hz. These frequency points often correspond to the structure’s potential modal frequencies.
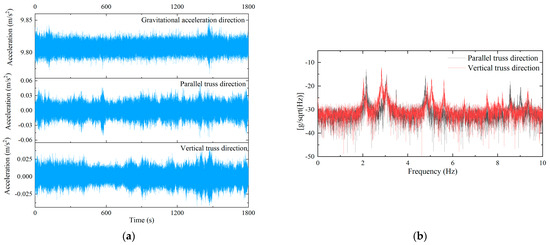
Figure 5.
Time–frequency domain response gathered by MEMS: (a) time-domain response; (b) frequency-domain response.
3.2. Time–Frequency Characteristics of Responses Collected by the 941b System
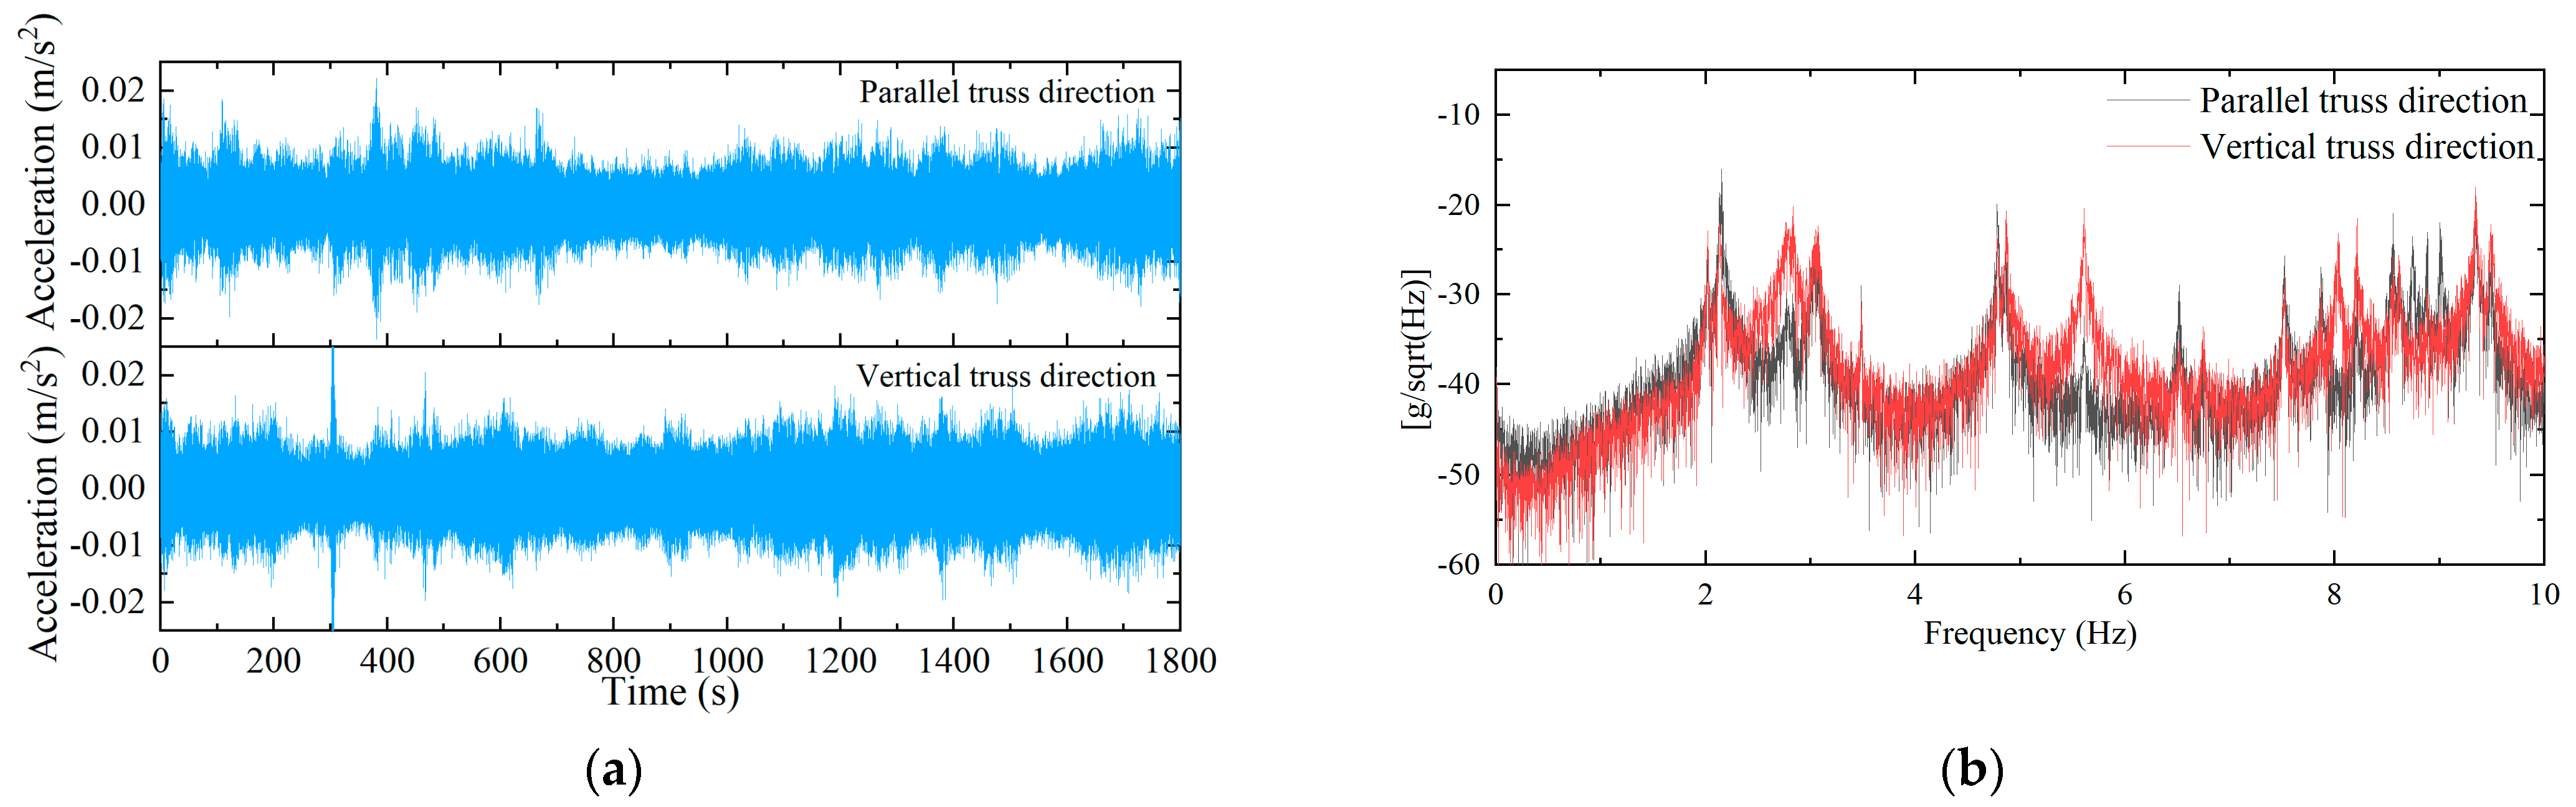
Figure 6a shows the time-history response at measurement point 1, obtained by using the 941b system. Since the MEMS acquisition system and the 941b vibration pickup system are two independent systems, the response signals measured cannot be perfectly synchronized. On the other hand, the time-domain response obtained from the MEMS acquisition system shows slightly higher amplitude than that from the 941b system. This may be because the MEMS system captured some noise during data acquisition, resulting in a slightly higher standard deviation of the data compared with the 941b system. However, this does not alter the modal characteristics of the structure, as these characteristics are inherent to the structure itself. Figure 6b presents the root power spectral density plot obtained using the 941b vibration pickup system. It can be seen that the resonance peaks in this plot are generally consistent with the peak regions observed in the MEMS root power spectral density plot, with similar amplitude in the peak regions. The main difference lies in the amplitude of the frequency-domain response in the non-resonant peak regions, where the frequency-domain information is primarily contributed by noise. The comparison indicates that in the resonance peak regions, the modal characteristics identified by both systems exhibit good consistency.

Figure 6.
Time–frequency domain response gathered by 941b: (a) time-domain response; (b) frequency-domain response.
3.3. Wind Speed Time History
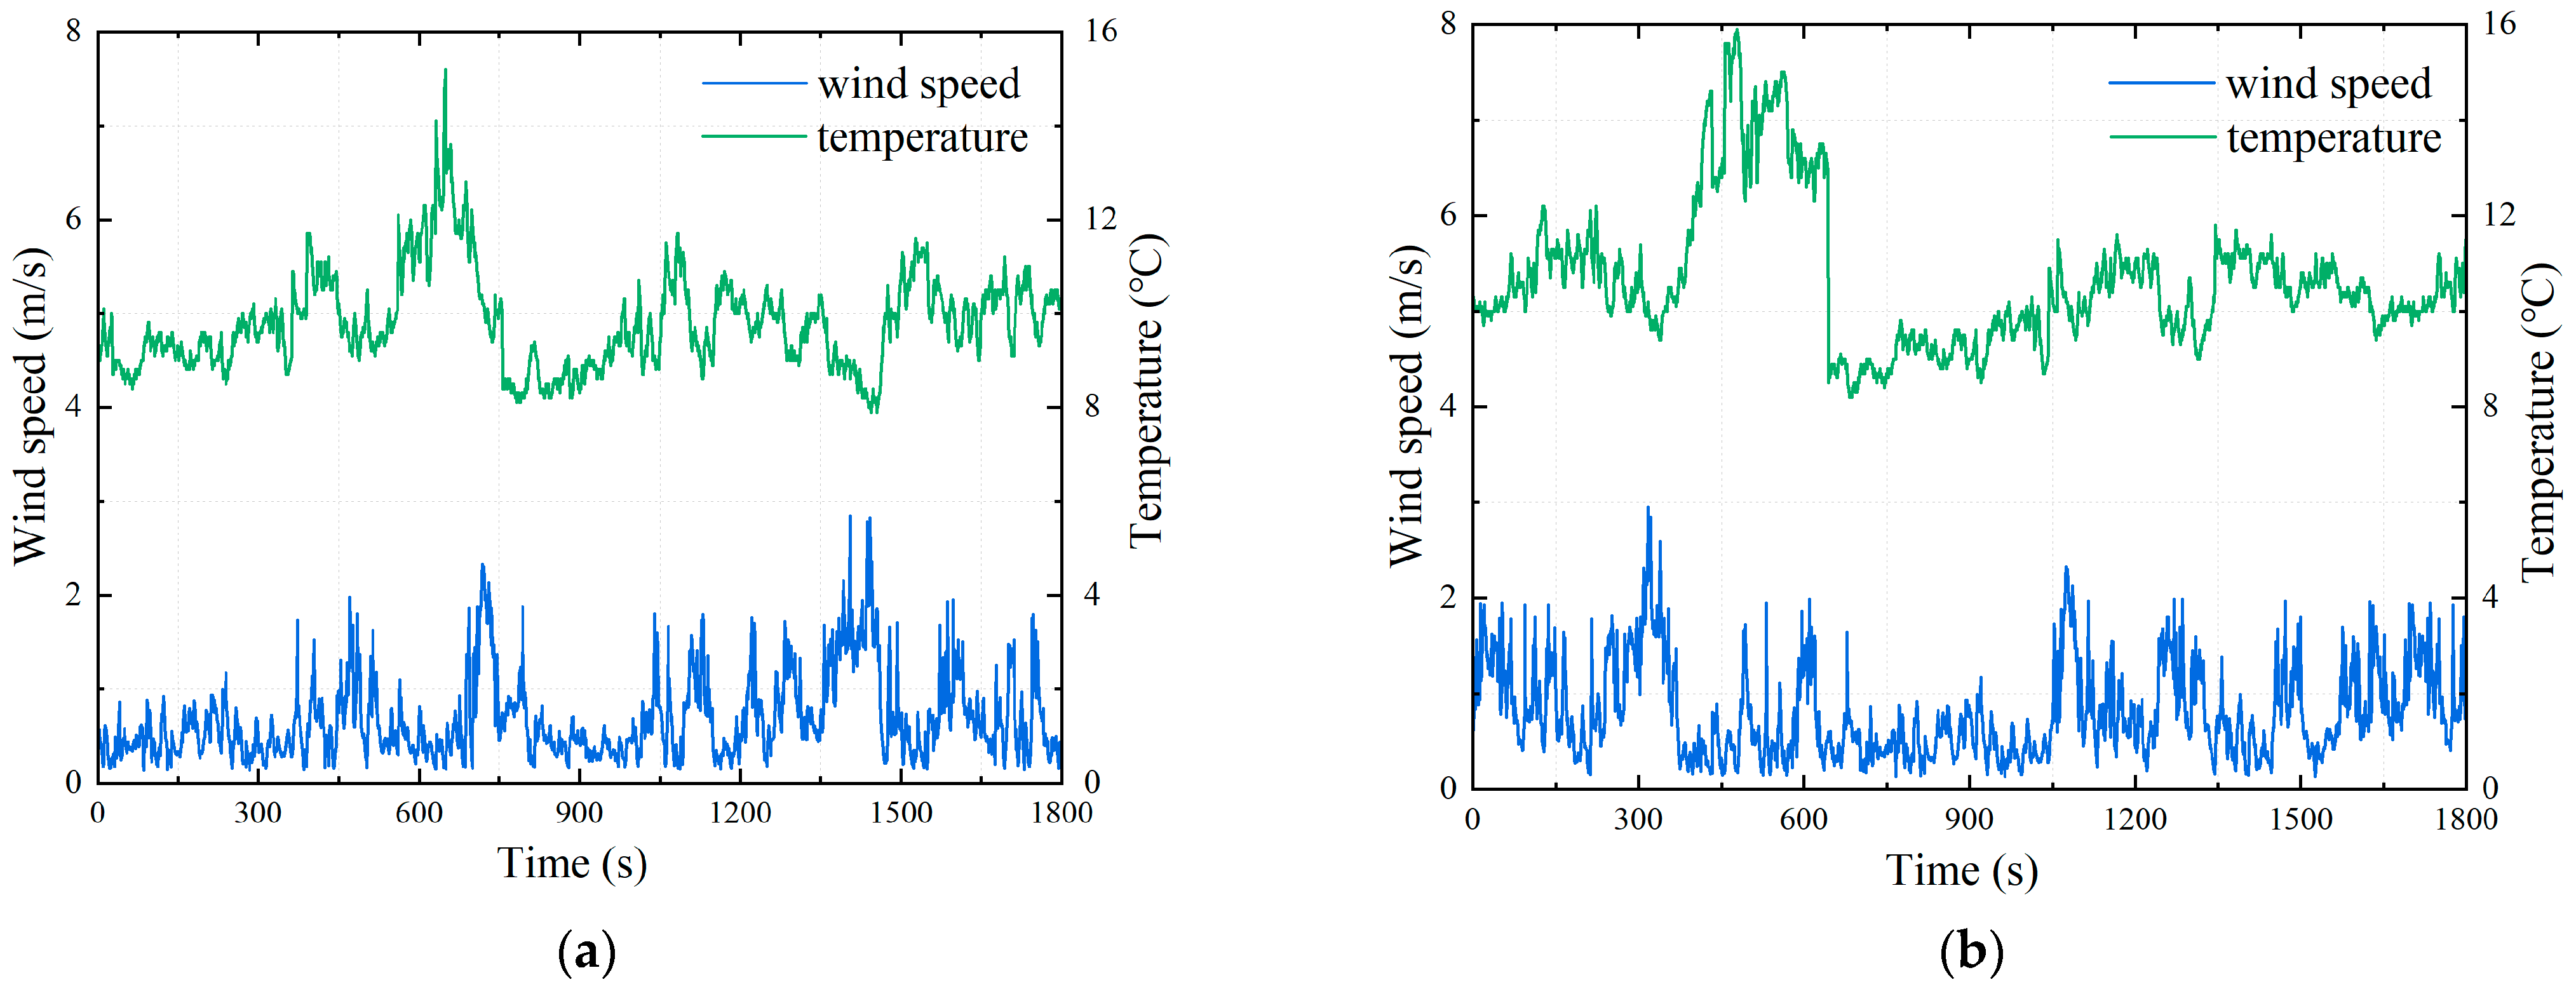
During the test, anemometers were installed on the busbar truss, specifically at the second truss level, to monitor variations in wind speed at that location. It should be noted that while the wind direction and speed varied randomly, the wind loads acting on the structure primarily occurred along the parallel truss and vertical truss directions. Therefore, wind speed was monitored specifically in these two directions. Traditionally, anemometers are placed at a height of 10 m, and the average wind speed over a 10-min period at this height is calculated to compare the operational wind speed of the structure with the design wind speed. In this study, the anemometers were positioned at the busbar truss at a height of 15.7 m to monitor wind speed variations at the truss location, as shown in Figure 7. The recorded wind speeds in both directions during the test are below 4 m/s. According to wind speed statistics, the average wind speed is 0.68 m/s in the parallel truss direction and 0.80 m/s in the vertical truss direction. From an experimental perspective, wind loads act as partial excitations during tests. The wind speed fluctuates randomly within a small range, suggesting that the wind load provides the structure with a near-stationary random excitation. Additionally, the recorded wind speed and temperature variations during the tests can serve as valuable references for future finite element analysis of the structure.
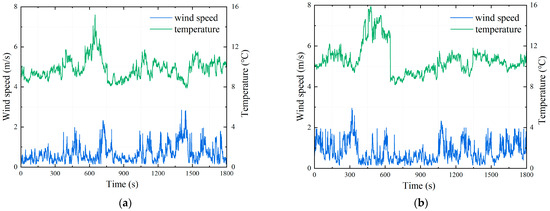
Figure 7.
Wind speed and temperature variations during the test: (a) parallel truss direction; (b) vertical truss direction.
After obtaining the average wind speed at the truss, the Davenport wind speed theory can be applied to calculate the equivalent wind speed at different heights, as shown in the following equation:
where is the equivalent wind speed at height , is the wind speed at the reference height , and is the surface roughness coefficient, typically ranging from 0.1 to 0.3. In this study, was set to 0.2.
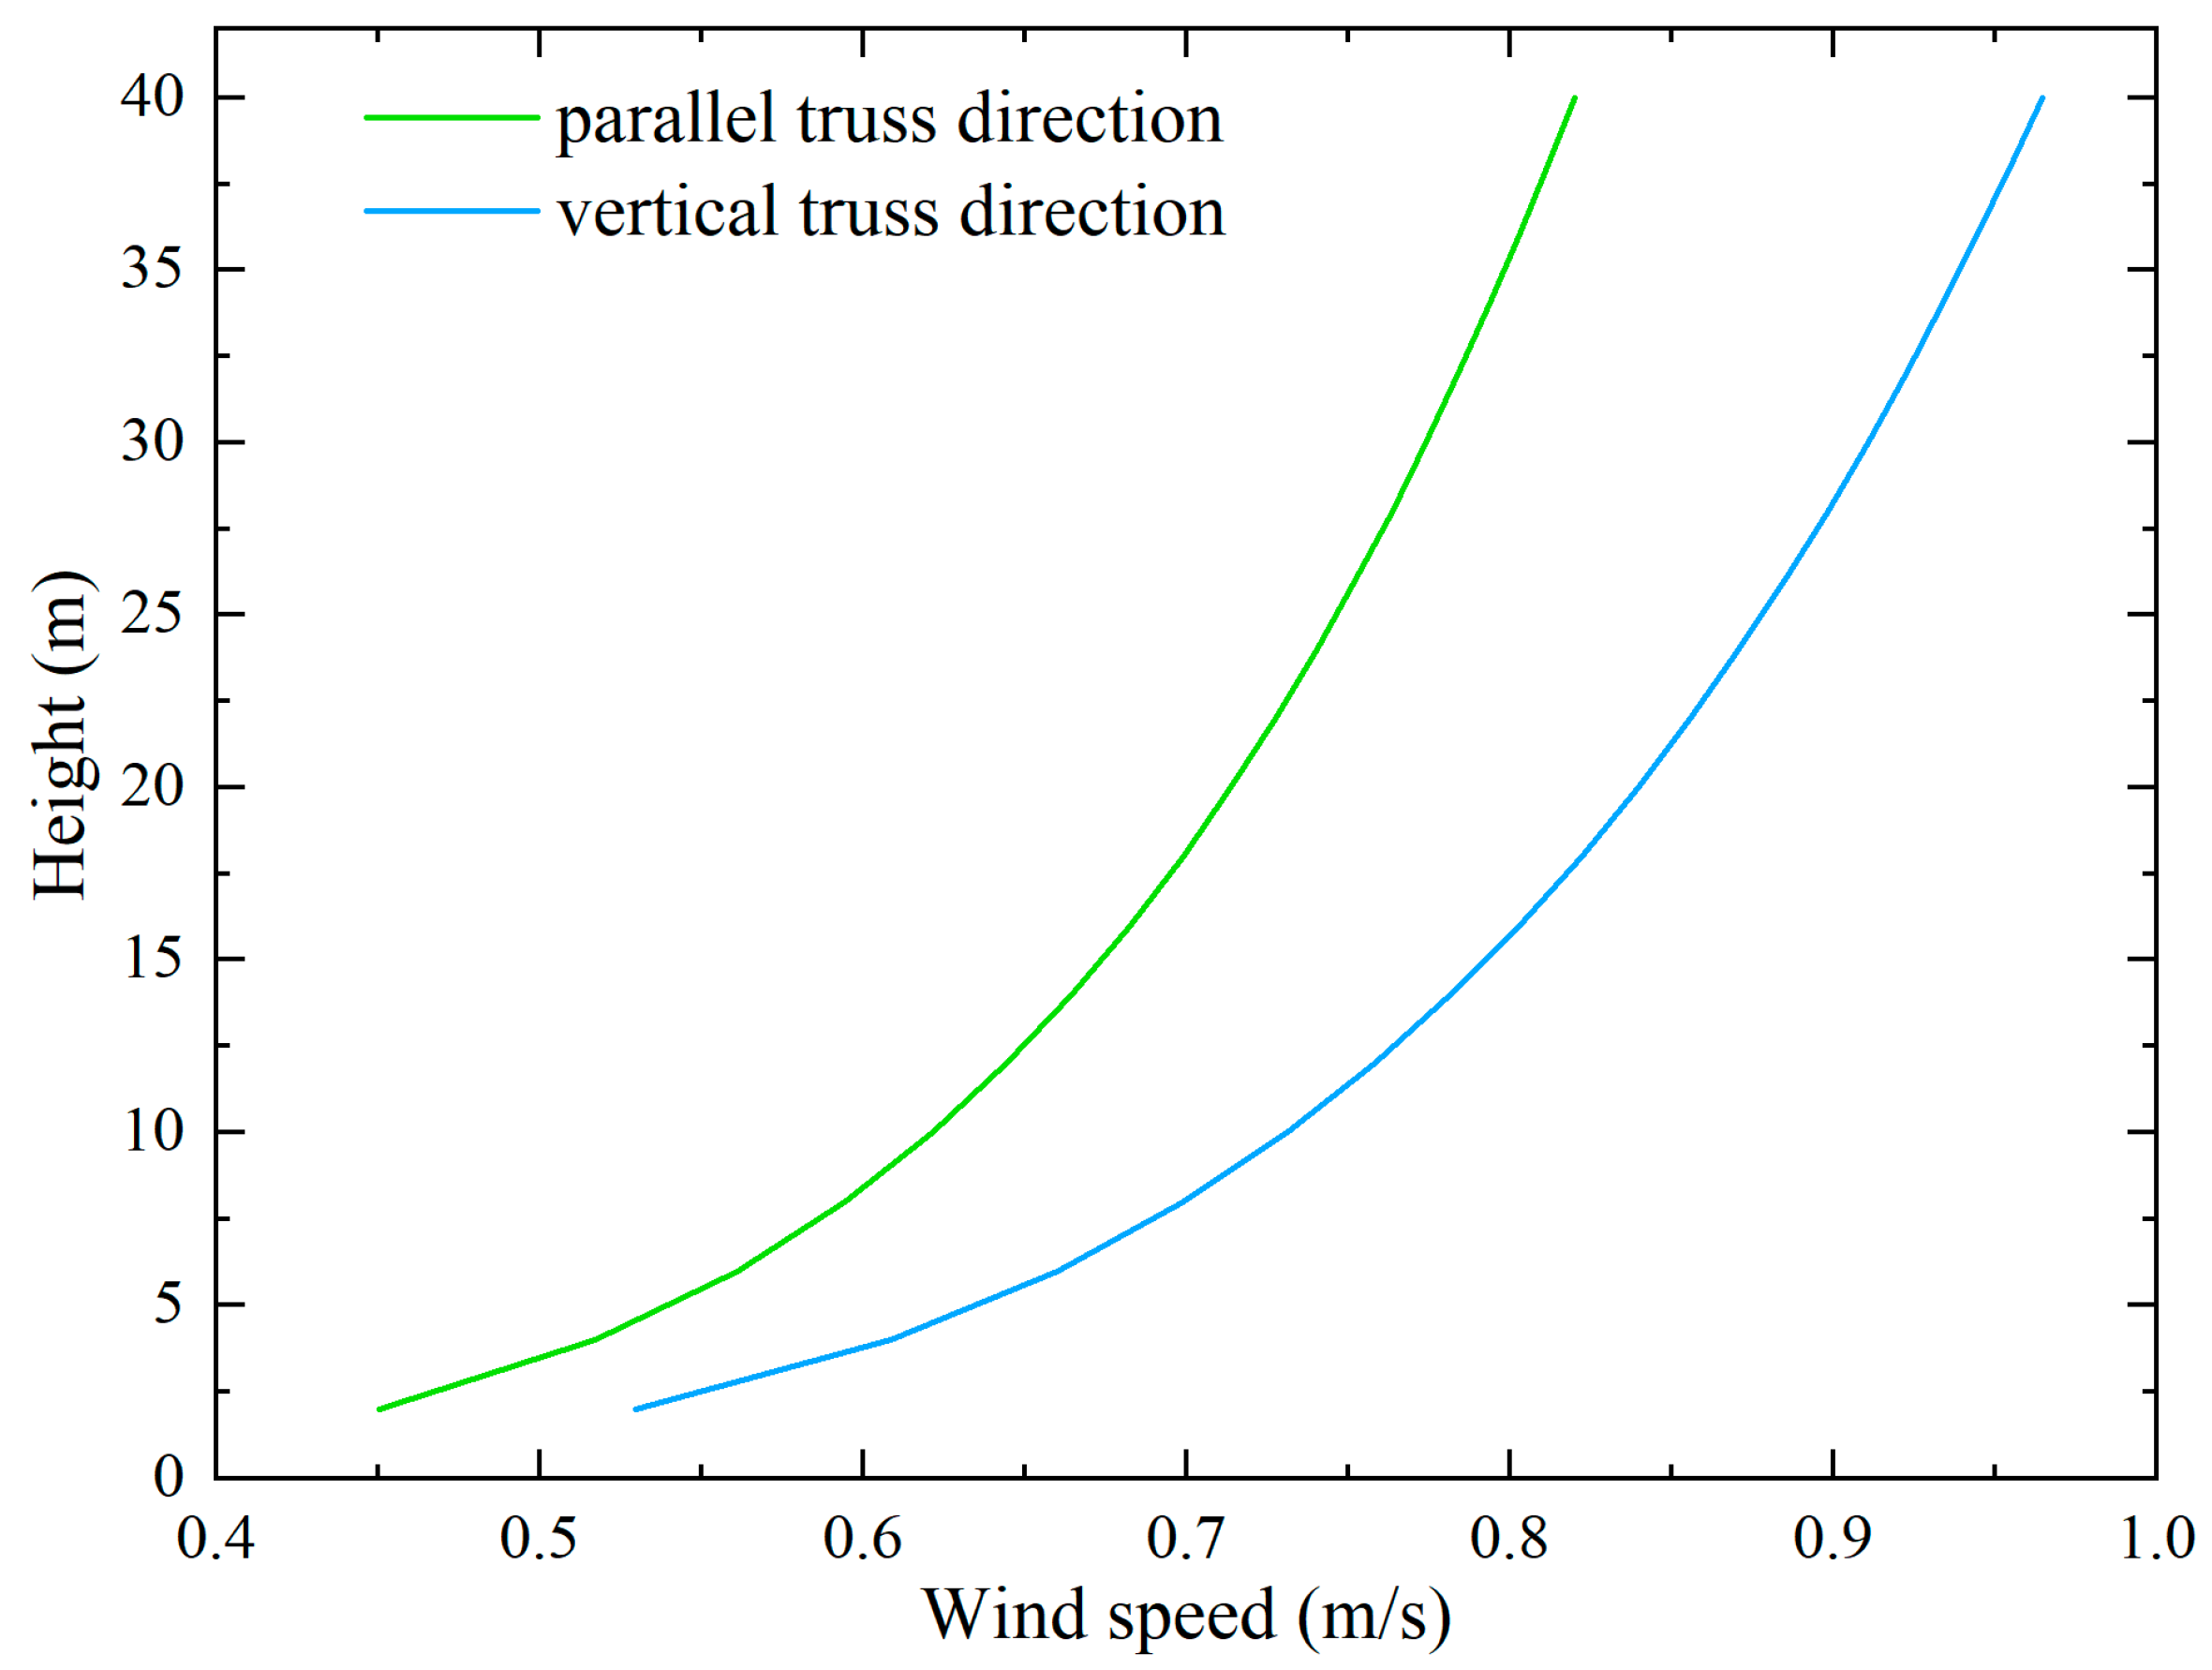
By calculation, the equivalent wind speeds at different heights of the structure are obtained, as illustrated in the wind profile diagram in Figure 8. It can be seen that, at the same height, the average wind speed in the vertical truss direction is consistently higher than in the parallel truss direction; the average wind speeds at the top of the substation frame are 0.80 m/s and 0.96 m/s, respectively. The calculated wind profile results provide a valuable reference for the wind-resistant design of the substation frame from an operational perspective.
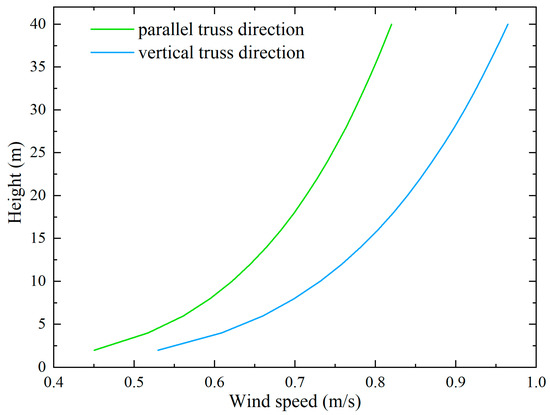
Figure 8.
Wind profile of the test.
4. Modal Analysis of the Substation Frame
4.1. Covariance-Driven Stochastic Subspace Identification
For vibration testing of structures under ambient excitation, the excitation applied to the structure can be considered as stationary white noise. The core of the SSI-Cov method is to project the experimentally obtained responses into the state space of control theory. According to stochastic subspace theory, the discrete state-space model of an n-degree-of-freedom system under white noise excitation can be expressed as:
where is the discrete-time state vector, is the output vector, and represent the state matrix and discrete output matrix, respectively, and and are zero-mean Gaussian white noise.
By further expressing the response as a Hankel matrix and calculating its Toeplitz matrix, the system matrix, observability matrix, and controllability matrix can be obtained. Eigenvalue decomposition of these matrices, combined with the stabilization diagram method, allows for the extraction of the dynamic characteristics of the structure. Figure 9 presents the flowchart for identifying the dynamic characteristics of a structure using the SSI-Cov method. This method is exclusively employed in this study to identify the modal parameters and achieve accurate analysis results. The mathematical framework of the SSI-Cov method can be referenced in the literature [17].
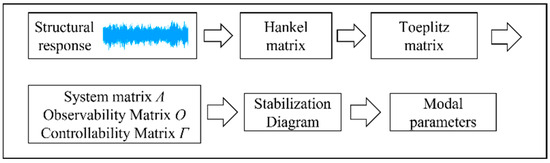
Figure 9.
Flowchart of SSI-Cov modal identification.
It should be noted that the SSI-Cov method exhibits strong robustness against noise when identifying dynamic parameters, primarily due to the following reasons: (1) The SSI-Cov method identifies modal parameters by constructing the covariance matrix of the response time series. In this process, the covariance matrix primarily reflects the statistical characteristics of the stable components of the signal, while noise typically manifests as uncorrelated or high-frequency components. As a result, the noise components are naturally attenuated within the covariance matrix. (2) In the SSI-Cov method, the modal information of the system is obtained through the subspace decomposition of the system’s covariance matrix. This process essentially distinguishes the true dynamic behavior of the system from noise by means of projection. (3) The SSI-Cov method is typically used in conjunction with the stabilization diagram method, which is highly effective in eliminating noise modes from the data.
In addition, the SSI-Cov method assumes stationary excitation, which introduces certain limitations in its application. In contrast, when analyzing time-evolving behavior with the goal of identifying health status related to the rapid evolution of dynamic parameters, time–frequency analysis techniques such as the Short-Time Impulse Response Function [56], Curvature Evolution Method [57], Band Variable Filter [58], and Stockwell Transform are more effective [59].
4.2. Modal Parameter Identification of the Substation Frame
The modal parameters of the substation frame include modal frequencies, damping ratios, and mode shapes. For substation frames, which are non-symmetrical structures, various modal orders exist in the parallel truss direction, vertical truss direction, and torsional direction. Therefore, the SSI-Cov method is employed to identify the modal parameters from the response data obtained in both directions.
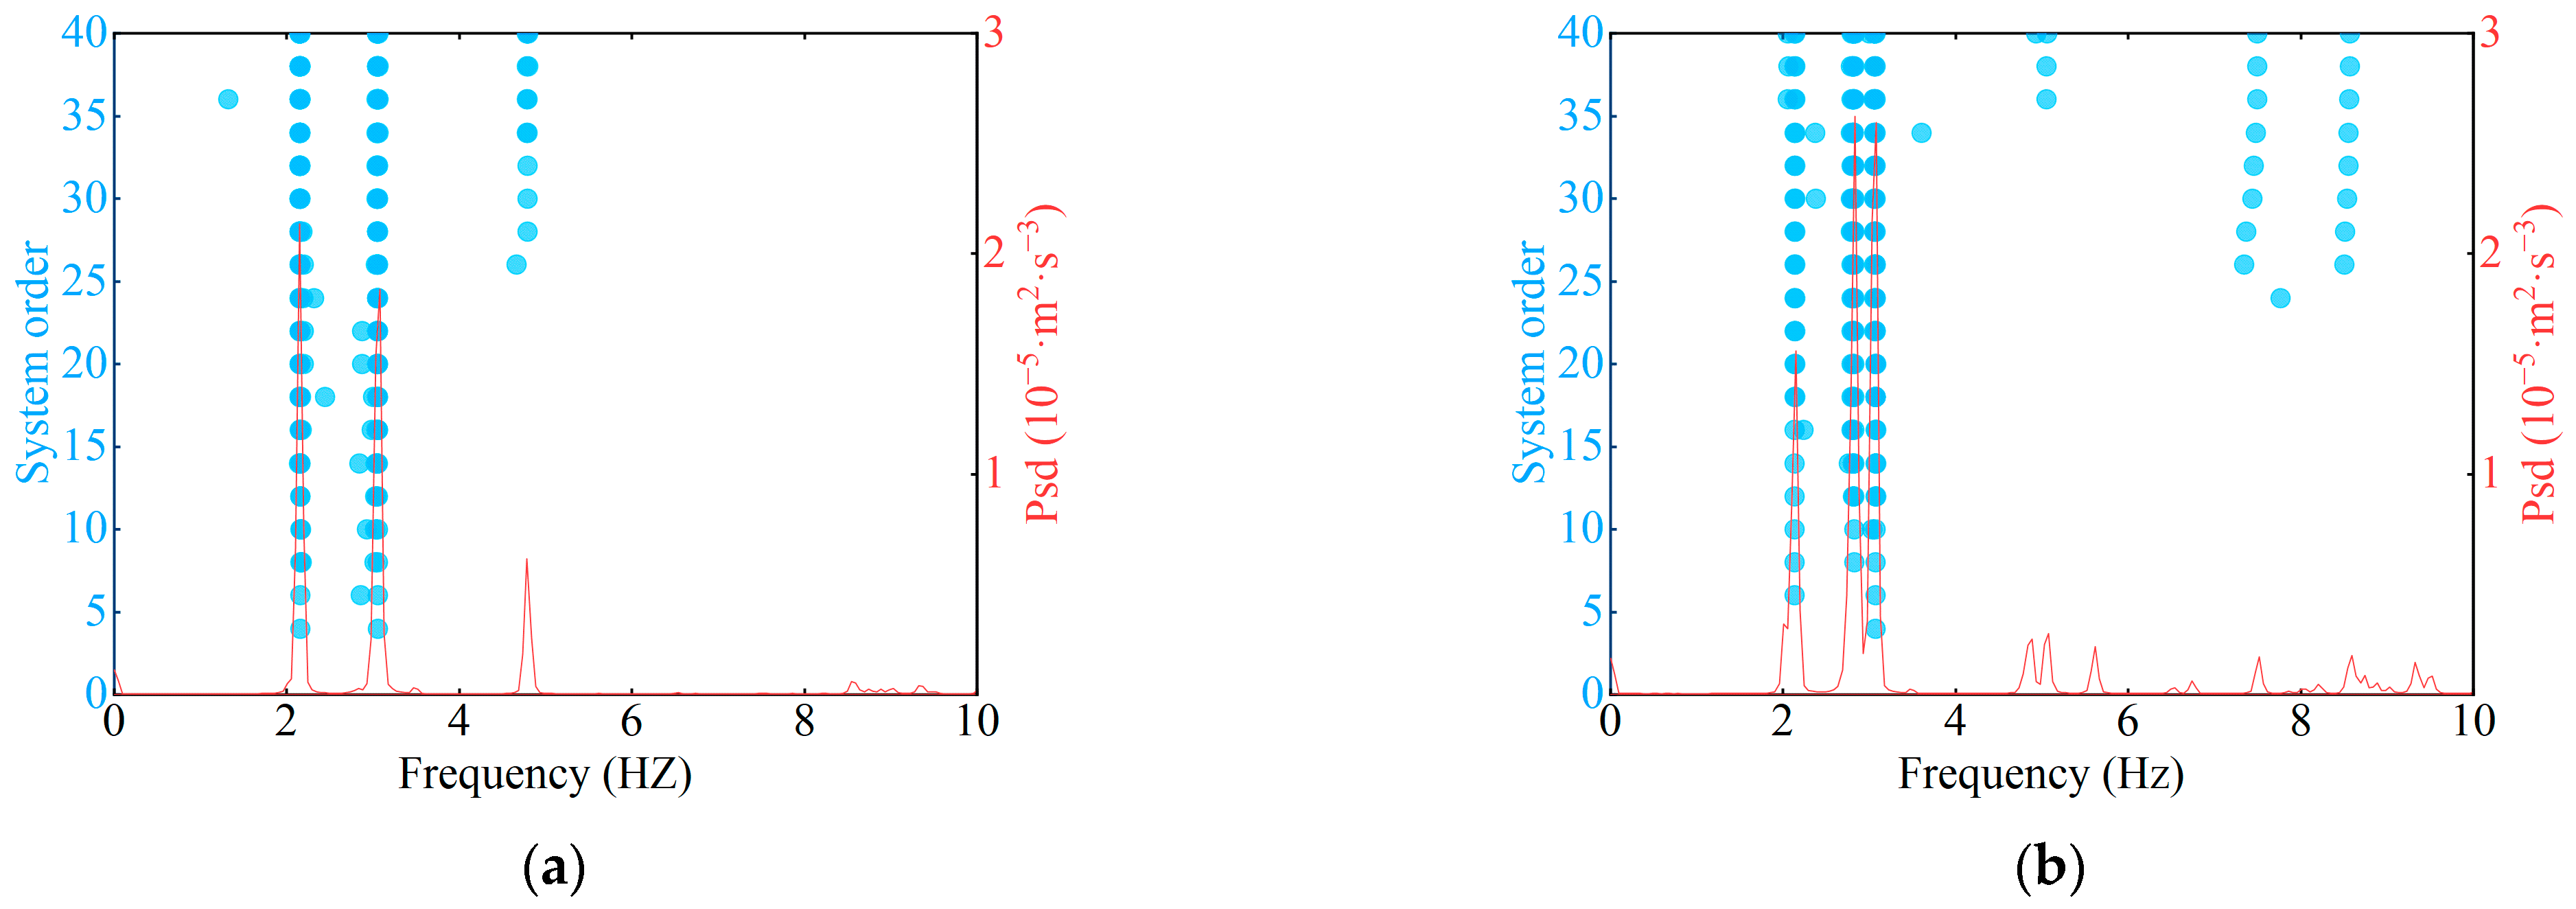
Due to the unique characteristics of structural modes, the stabilization diagram results are first examined, as shown in Figure 10. It can be seen that stable poles with corresponding high energy peaks appear near the frequencies of 2.14 Hz and 3.05 Hz in both stabilization diagrams. This indicates that the structure exhibits vibrations in both directions at these modal frequencies, leading to their initial identification as torsional modes. Additionally, a high-energy peak with a stable pole is observed at 4.78 Hz in the parallel truss direction, identifying it as the first-order mode in the parallel direction. Similarly, a high-energy peak with a stable pole is observed at 2.81 Hz in the vertical truss direction, identifying it as the first-order mode in the vertical direction.
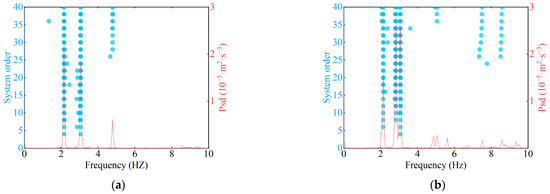
Figure 10.
Stabilization diagram: (a) parallel truss direction; (b) vertical truss direction.
Table 1 lists the identified frequencies and damping ratios for the first four modes of the substation frame. It can be seen that the maximum frequency identification discrepancy between the two methods is 0.02 Hz, occurring in the first-order vertical truss direction, while the maximum damping ratio discrepancy is 0.13%, occurring in the second-order torsional direction. Additionally, the damping ratio for the first-order vertical truss mode is 1.29%, which is significantly higher than that for the first-order parallel truss mode, indicating that the structure exhibits greater energy dissipation capability in the vertical truss direction at the first-order mode.

Table 1.
The identified results of frequencies and damping ratios.
Table 2 provides a comparison of the identification results using the SSI-Cov method and the FDD method. It can be seen that, using the same data, the two time–frequency domain algorithms still exhibit differences in their interpretation of frequency and damping ratio. The frequency identification results are generally consistent, with a maximum discrepancy of 0.02 Hz. However, the damping ratio identification results show some variability, with the largest difference occurring in the first-order vertical truss direction, at 0.41%. The variability in the identification results for the other modes is also slightly higher than the differences observed between datasets obtained from different test methods, primarily due to the different time–frequency domains used in the modeling of the two algorithms.
Table 2.
Comparison of modal identification results from different method.
Nonetheless, an examination of the FDD method’s identification results shows that the damping ratio for the first-order vertical truss mode remains the highest, at 0.88%, indicating a strong energy dissipation capability for this mode. Since each mode shape has a spatial structure, the identification results of the substation frame’s mode shapes will be discussed separately in the next subsection.
4.3. Mode Shapes
Figure 11a shows the first-order torsional mode shape at 2.14 Hz. In this torsional mode, all measurement points, except point 3, vibrate towards the left in the parallel truss direction, while in the vertical truss direction, measurement point 1 vibrates in the opposite direction to the other points. Figure 11b presents the first-order mode shape at 2.81 Hz in the vertical truss direction. It can be seen that, except for measurement point 4 at the center of the second-level busbar truss, which vibrates towards the rear of the substation frame, all other points vibrate towards the front, exhibiting a unidirectional tilt mode shape at the top of the substation frame.
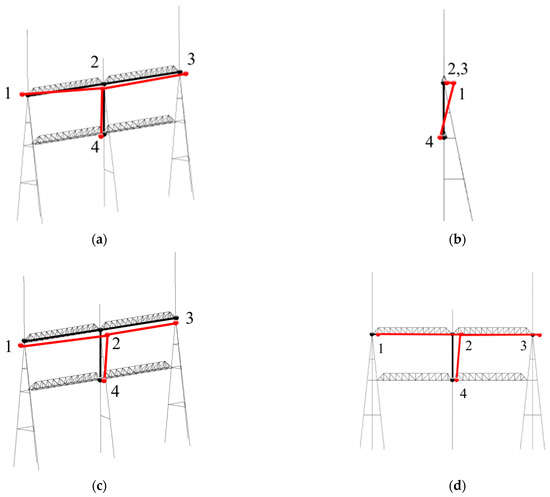
Figure 11.
Mode shapes of the substation frame: (a) 2.14 Hz; (b) 2.81 Hz; (c) 3.05 Hz; (d) 4.78 Hz.
Figure 11c shows the second-order torsional mode shape at 3.05 Hz. In the parallel truss direction, measurement point 2 vibrates out of phase with the other points, while in the vertical truss direction, all points vibrate in the same direction. Figure 11d presents the first-order mode shape at 4.78 Hz in the parallel truss direction, where all measurement points are observed to vibrate in the same direction.
It should be noted that mode shape decomposition is based on the theory of modal superposition, meaning that under actual service conditions, the structure’s mode shapes represent a coupling of multiple modes. However, mode shape decomposition is beneficial for designers seeking to verify construction quality, understand the service state of the structure, and accumulate data and experience for the design of new structures.
5. Conclusions
This study conducted simultaneous MEMS-based and traditional contact-based vibration acquisition on a new substation frame, capturing the dynamic response time histories. Building on this, the modal parameters of the structure under operational conditions were identified using structural dynamics analysis methods. The key conclusions drawn are as follows:
- (1).
- A method based on MEMS technology for acquiring the dynamic response time histories of structures is proposed, and its feasibility is demonstrated through comparison with traditional vibration monitoring methods. The study found that the vibration response captured by MEMS exhibited slightly higher amplitude compared with results from traditional monitoring methods, primarily due to the MEMS system capturing more environmental noise, which increased the overall variance of the data. However, in terms of frequency-domain analysis, the differences between the two methods at the peak regions were minimal, with the main discrepancies occurring in non-modal, non-resonant regions, corresponding to amplitude differences in the time-domain response.
- (2).
- The primary modes of the new substation frame were identified as follows: the first-order torsional mode at 2.14 Hz, the first-order vertical truss mode at 2.81 Hz, the second-order torsional mode at 3.05 Hz, and the first-order parallel truss mode at 4.78 Hz.
- (3).
- The modal parameter identification results indicate minimal frequency identification differences when using different datasets or identification methods, as the structural frequency is an inherent property of the structure. In contrast, the damping ratio identification results show some variability, which is attributed to differences in the data acquisition systems and the identification theories used. Overall, the identification results are relatively stable.
While using MEMS sensors to collect responses in the field test offers significant convenience, it does not fully mitigate their drawbacks, particularly the unavoidable noise components in the collected data. To address the noise issue, three approaches can be considered. The first approach involves processing the collected digital signals directly, such as filtering technique. However, the choice of filtering method and its settings heavily depends on the operator’s experience, introducing a degree of variability in noise reduction. The second approach involves using techniques such as the SSI-Cov algorithm, which leverage covariance matrices to diminish noise effects. The third approach is to directly model the frequency-domain information within the frequency domain. Comparatively, the latter two approaches do not require direct processing of the raw signals and impose fewer demands on the operator. In future research, these two approaches may be more suitable for handling the responses obtained from MEMS sensors.
On the other hand, the SSI-Cov method assumes that the response is driven by a stationary random excitation process. For non-stationary signals, the SSI-Cov method is not appropriate, particularly when analyzing time-evolving behavior with the aim of identifying health status related to the rapid evolution of dynamic parameters. In these cases, time–frequency analysis techniques, such as the Short-Time Impulse Response Function, Curvature Evolution Method, Band Variable Filter, and Stockwell Transform, prove to be more effective.
Additionally, the modal parameter identification results from this study will help researchers monitor the dynamic characteristics of substation frames throughout their life cycle. This will also better support the calibration of numerical models and the wind-resistant design of structures. These areas of research are valuable and merit further exploration in the future.
Author Contributions
Conceptualization, R.Q.; methodology, R.Q. and M.S.; software, M.S.; validation, D.S.; writing—original draft preparation, R.Q.; writing—review and editing, Y.W., X.L. and Q.S.; supervision, Q.S.; funding acquisition, R.Q. and Q.S. All authors have read and agreed to the published version of the manuscript.
Funding
This research was funded by the National Natural Science Foundation of China, grant number 51978570, and State Grid Shaanxi Electric Power Co., Ltd. Science and technology project, grant number 5226JY23000A.
Institutional Review Board Statement
Not applicable.
Informed Consent Statement
Not applicable.
Data Availability Statement
All data included in this study are available upon request by contact with the corresponding author.
Acknowledgments
The authors sincerely thank Caixia Chang from State Grid Shaanxi Electric Power Company for her invaluable support to this research.
Conflicts of Interest
Author Ruochen Qiang was employed by the company State Grid Shaanxi Electric Power Company. The authors declare that this study received funding from State Grid Shaanxi Electric Power Co., Ltd. The remaining authors declare that the research was conducted in the absence of any commercial or financial relationships that could be construed as a potential conflict of interest.
References
- Li, H.N.; Wang, J.X.; Fu, X.; Ren, L.; Zhang, Q. Field measurements of typhoon effects on a transmission tower and its modal parameter identification. Adv. Struct. Eng. 2020, 23, 1548–1561. [Google Scholar] [CrossRef]
- Zhu, Y.M.; Sun, Q.; Zhao, C.; Wei, S.T.; Yin, Y.; Su, Y.H. Operational modal analysis of two typical UHV transmission towers: A comparative study by fast Bayesian FFT method. Eng. Struct. 2023, 277, 115425. [Google Scholar] [CrossRef]
- Liu, D.; Bao, Y.; Li, H. Machine learning-based stochastic subspace identification method for structural modal parameters. Eng. Struct. 2023, 274, 115178. [Google Scholar] [CrossRef]
- Lam, H.F.; Fu, Z.Y.; Adeagbo, M.O.; Yang, J.H. Time-domain structural model updating following the Bayesian approach in the absence of system input information. Eng. Struct. 2024, 314, 118321. [Google Scholar] [CrossRef]
- Zhao, C.; Su, Y.; Zhu, Y.; Sun, Q.; Wei, S.; Wang, X. Enhanced semi-automated Bayesian modal identification approach for Ultra-high voltage transmission towers. Structures 2023, 57, 105247. [Google Scholar] [CrossRef]
- Ni, Y.C.; Alamdari, M.M.; Ye, X.W.; Zhang, F.L. Fast operational modal analysis of a single-tower cable-stayed bridge by a Bayesian method. Measurement 2021, 174, 109048. [Google Scholar] [CrossRef]
- Zhang, F.L.; Yang, Y.P.; Ye, X.W.; Yang, J.H.; Han, B.K. Structural modal identification and MCMC-based model updating by a Bayesian approach. Smart Struct. Syst. Int. J. 2019, 24, 631–639. [Google Scholar]
- Zhu, Y.; Sun, Q.; Zhao, C.; Qi, H.; Su, Y. Bayesian operational modal analysis with interactive optimization for model updating of large-size UHV transmission towers. J. Struct. Eng. 2023, 149, 04023184. [Google Scholar] [CrossRef]
- Shao, Y.; Li, L.; Li, J.; An, S.; Hao, H. Computer vision based target-free 3D vibration displacement measurement of structures. Eng. Struct. 2021, 246, 113040. [Google Scholar] [CrossRef]
- Huang, H.; Kono, D.; Toyoura, M. Vision-based vibration measurement of machine tool. J. Adv. Mech. Des. Syst. Manuf. 2022, 16, JAMDSM0014. [Google Scholar] [CrossRef]
- Yang, R.; Singh, S.K.; Tavakkoli, M.; Amiri, N.; Yang, Y.; Karami, M.A.; Rai, R. CNN-LSTM deep learning architecture for computer vision-based modal frequency detection. Mech. Syst. Signal Process. 2020, 144, 106885. [Google Scholar] [CrossRef]
- Tian, Y.; Zhang, C.; Jiang, S.; Zhang, J.; Duan, W. Noncontact cable force estimation with unmanned aerial vehicle and computer vision. Comput.-Aided Civ. Infrastruct. Eng. 2021, 36, 73–88. [Google Scholar] [CrossRef]
- Zhuang, Y.; Chen, W.; Jin, T.; Chen, B.; Zhang, H.; Zhang, W. A review of computer vision-based structural deformation monitoring in field environments. Sensors 2022, 22, 3789. [Google Scholar] [CrossRef] [PubMed]
- Song, Q.; Wu, J.; Wang, H.; An, Y.; Tang, G. Computer vision-based illumination-robust and multi-point simultaneous structural displacement measuring method. Mech. Syst. Signal Process. 2022, 170, 108822. [Google Scholar] [CrossRef]
- Khuc, T.; Nguyen, T.A.; Dao, H.; Catbas, F.N. Swaying displacement measurement for structural monitoring using computer vision and an unmanned aerial vehicle. Measurement 2020, 159, 107769. [Google Scholar] [CrossRef]
- Jana, D.; Nagarajaiah, S. Computer vision-based real-time cable tension estimation in Dubrovnik cable-stayed bridge using moving handheld video camera. Struct. Control Health Monit. 2021, 28, e2713. [Google Scholar] [CrossRef]
- Ma, Z.; Choi, J.; Liu, P.; Sohn, H. Structural displacement estimation by fusing vision camera and accelerometer using hybrid computer vision algorithm and adaptive multi-rate Kalman filter. Autom. Constr. 2022, 140, 104338. [Google Scholar] [CrossRef]
- Bogue, R. MEMS sensors: Past, present and future. Sens. Rev. 2007, 27, 7–13. [Google Scholar] [CrossRef]
- Algamili, A.S.; Khir, M.H.M.; Dennis, J.O.; Ahmed, A.Y.; Alabsi, S.S.; Ba Hashwan, S.S.; Junaid, M.M. A review of actuation and sensing mechanisms in MEMS-based sensor devices. Nanoscale Res. Lett. 2021, 16, 16. [Google Scholar] [CrossRef]
- Hajare, R.; Reddy, V.; Srikanth, R. MEMS based sensors–A comprehensive review of commonly used fabrication techniques. Mater. Today Proc. 2022, 49, 720–730. [Google Scholar] [CrossRef]
- Hou, Y.; Jiao, R.; Yu, H. MEMS based geophones and seismometers. Sens. Actuators A Phys. 2021, 318, 112498. [Google Scholar] [CrossRef]
- Mustafazade, A.; Pandit, M.; Zhao, C.; Sobreviela, G.; Du, Z.; Steinmann, P.; Zou, X.; Howe, R.T.; Seshia, A.A. A vibrating beam MEMS accelerometer for gravity and seismic measurements. Sci. Rep. 2020, 10, 10415. [Google Scholar] [CrossRef] [PubMed]
- Amami, M.M. The Advantages and Limitations of Low-Cost Single Frequency GPS/MEMS-Based INS Integration. Glob. J. Eng. Technol. Adv. 2022, 10, 018–031. [Google Scholar] [CrossRef]
- Su, Y.H.; Zhu, Y.M.; Zhao, C.; Lam, H.F.; Sun, Q. Bayesian uncertainty quantification of modal parameters and RRF identification of transmission towers with limited measured vibration data. Eng. Struct. 2024, 308, 118019. [Google Scholar] [CrossRef]
- Zhang, F.L.; Au, S.K.; Ni, Y.C. Two-stage Bayesian system identification using Gaussian discrepancy model. Struct. Health Monit. 2021, 20, 580–595. [Google Scholar] [CrossRef]
- Ni, P.H.; Ye, X.W.; Ding, Y. An output-only structural condition assessment method for civil structures by the stochastic gradient descent method. Struct. Control Health Monit. 2022, 29, e3132. [Google Scholar] [CrossRef]
- Feng, Y.; Su, Y.; Zhao, C.; Zhu, Y.; Sun, Q. A two-stage automated OMA framework for transmission towers based on clustering algorithms. Structures 2024, 61, 106023. [Google Scholar] [CrossRef]
- Fu, Z.Y.; Adeagbo, M.O.; Lam, H.F. An efficient dynamic response reconstruction methodology based on model condensation and modal decomposition. Int. J. Struct. Stab. Dyn. 2023, 2450141. [Google Scholar] [CrossRef]
- Diaferio, M.; Foti, D.; Potenza, F. Prediction of the fundamental frequencies and modal shapes of historic masonry towers by empirical equations based on experimental data. Eng. Struct. 2018, 156, 433–442. [Google Scholar] [CrossRef]
- Zhang, F.L.; Gu, D.K.; Li, X.; Ye, X.W.; Peng, H. Structural damage detection based on fundamental Bayesian two-stage model considering the modal parameters uncertainty. Struct. Health Monit. 2023, 22, 2305–2324. [Google Scholar] [CrossRef]
- Ying, Z.G.; Ni, Y.Q. Optimal parameter estimation for uncertain structural systems under unknown random excitations. J. Vib. Control 2024, 10775463241248555. [Google Scholar] [CrossRef]
- Ye, X.W.; Ding, Y.; Ni, P.H. A numerical application of Bayesian optimization to the condition assessment of bridge hangers. Smart Struct. Syst. 2023, 31, 57–68. [Google Scholar]
- Ponzo, F.C.; Auletta, G.; Ielpo, P.; Ditommaso, R. DInSAR–SBAS satellite monitoring of infrastructures: How temperature affects the “Ponte della Musica” case study. J. Civ. Struct. Health Monit. 2024, 14, 745–761. [Google Scholar] [CrossRef]
- Wan, H.P.; Ni, Y.Q. A new approach for interval dynamic analysis of train-bridge system based on Bayesian optimization. J. Eng. Mech. 2020, 146, 04020029. [Google Scholar] [CrossRef]
- Eshkevari, S.S.; Matarazzo, T.J.; Pakzad, S.N. Bridge modal identification using acceleration measurements within moving vehicles. Mech. Syst. Signal Process. 2020, 141, 106733. [Google Scholar] [CrossRef]
- Ni, Y.Q.; Ye, X.W.; Ko, J.M. Monitoring-based fatigue reliability assessment of steel bridges: Analytical model and application. J. Struct. Eng. 2010, 136, 1563–1573. [Google Scholar] [CrossRef]
- Au, S.K. Fast Bayesian ambient modal identification in the frequency domain, Part I: Posterior most probable value. Mech. Syst. Signal Process. 2012, 26, 60–75. [Google Scholar] [CrossRef]
- Bhowmik, B.; Tripura, T.; Hazra, B.; Pakrashi, V. Real time structural modal identification using recursive canonical correlation analysis and application towards online structural damage detection. J. Sound Vib. 2020, 468, 115101. [Google Scholar] [CrossRef]
- Kang, J.; Zeng, S. Uncertainty quantification in operational modal analysis of time-varying structures based on time-dependent autoregressive moving average model. J. Sound Vib. 2023, 548, 117549. [Google Scholar] [CrossRef]
- Shokravi, H.; Shokravi, H.; Bakhary, N.; Rahimian Koloor, S.; Petrů, M. Health monitoring of civil infrastructures by subspace system identification method: An overview. Appl. Sci. 2020, 10, 2786. [Google Scholar] [CrossRef]
- Yu, X.; Dan, D.; Ge, L. Time-domain distributed modal parameter identification based on mode decomposition of single-channel vibration response. Eng. Struct. 2023, 289, 116323. [Google Scholar] [CrossRef]
- Li, S.; Wang, J.T.; Jin, A.Y.; Luo, G.H. Parametric analysis of SSI algorithm in modal identification of high arch dams. Soil Dyn. Earthq. Eng. 2020, 129, 105929. [Google Scholar] [CrossRef]
- Li, J.; Bao, T.; Ventura, C.E. A robust methodology for output-only modal identification of civil engineering structures. Eng. Struct. 2022, 270, 114764. [Google Scholar] [CrossRef]
- Zhou, K.; Li, Q.S.; Han, X.L. Modal identification of civil structures via stochastic subspace algorithm with Monte Carlo–based stabilization diagram. J. Struct. Eng. 2022, 148, 04022066. [Google Scholar] [CrossRef]
- Xu, X.; Zhang, X.; Zhu, W.; Gu, X. Modal parameter identification of a quayside container crane based on data-driven stochastic subspace identification. J. Vib. Eng. Technol. 2021, 9, 919–938. [Google Scholar] [CrossRef]
- Reynders, E.P.B. Uncertainty quantification in data-driven stochastic subspace identification. Mech. Syst. Signal Process. 2021, 151, 107338. [Google Scholar] [CrossRef]
- Shokravi, H.; Shokravi, H.; Bakhary, N.; Rahimian Koloor, S.S.; Petrů, M. A comparative study of the data-driven stochastic subspace methods for health monitoring of structures: A bridge case study. Appl. Sci. 2020, 10, 3132. [Google Scholar] [CrossRef]
- Ren, W.X.; Zong, Z.H. Output-only modal parameter identification of civil engineering structures. Struct. Eng. Mech. 2004, 17, 429–444. [Google Scholar] [CrossRef]
- Tran, T.T.X.; Ozer, E. Synergistic bridge modal analysis using frequency domain decomposition, observer Kalman filter identification, stochastic subspace identification, system realization using information matrix, and autoregressive exogenous model. Mech. Syst. Signal Process. 2021, 160, 107818. [Google Scholar] [CrossRef]
- Qu, C.X.; Yi, T.H.; Yao, X.J.; Li, H.N. Complex frequency identification using real modal shapes for a structure with proportional damping. Comput.-Aided Civ. Infrastruct. Eng. 2021, 36, 1322–1336. [Google Scholar] [CrossRef]
- O’Higgins, C.; Hester, D.; Ao, W.K.; McGetrick, P. A method to maximise the information obtained from low signal-to-noise acceleration data by optimising SSI-COV input parameters. J. Sound Vib. 2024, 571, 118101. [Google Scholar] [CrossRef]
- Zhang, X.L.; Xia, Y. Parameters identification of closely spaced modes with the covariance-drivern stochastic subspace and damping ratio dispersion method. J. Vib. Control 2023, 10775463231197246. [Google Scholar] [CrossRef]
- Zini, G.; Giachetti, A.; Betti, M.; Bartoli, G. Vibration signature effects on damping identification of a RC bridge under ambient vibrations. Eng. Struct. 2024, 298, 116934. [Google Scholar] [CrossRef]
- Fu, S.; Wu, J.; Zhang, Q.; Xie, B. Automated identification and long-term tracking of modal parameters for a super high-rise building. J. Build. Eng. 2024, 95, 110141. [Google Scholar] [CrossRef]
- Zhou, K.; Xie, D.L.; Xu, K.; Zhi, L.-H.; Hu, F.; Shu, Z.-R. A machine learning-based stochastic subspace approach for operational modal analysis of civil structures. J. Build. Eng. 2023, 76, 107187. [Google Scholar] [CrossRef]
- Ditommaso, R.; Ponzo, F.C. Automatic evaluation of the fundamental frequency variations and related damping factor of reinforced concrete framed structures using the Short Time Impulse Response Function (STIRF). Eng. Struct. 2015, 82, 104–112. [Google Scholar] [CrossRef]
- Ditommaso, R.; Iacovino, C.; Auletta, G.; Parolai, S.; Ponzo, F.C. Damage detection and localization on real structures subjected to strong motion earthquakes using the curvature evolution method: The Navelli (Italy) case Study. Appl. Sci. 2021, 11, 6496. [Google Scholar] [CrossRef]
- Ditommaso, R.; Mucciarelli, M.; Ponzo, F.C. Analysis of non-stationary structural systems by using a band-variable filter. Bull. Earthq. Eng. 2012, 10, 895–911. [Google Scholar] [CrossRef]
- Ditommaso, R.; Ponzo, F.C.; Auletta, G. Damage detection on framed structures: Modal curvature evaluation using Stockwell Transform under seismic excitation. Earthq. Eng. Eng. Vib. 2015, 14, 265–274. [Google Scholar] [CrossRef]


Disclaimer/Publisher’s Note: The statements, opinions and data contained in all publications are solely those of the individual author(s) and contributor(s) and not of MDPI and/or the editor(s). MDPI and/or the editor(s) disclaim responsibility for any injury to people or property resulting from any ideas, methods, instructions or products referred to in the content. |
© 2024 by the authors. Licensee MDPI, Basel, Switzerland. This article is an open access article distributed under the terms and conditions of the Creative Commons Attribution (CC BY) license (https://creativecommons.org/licenses/by/4.0/).