
Human–AI Co-Drawing: Studying Creative Efficacy and Eye Tracking in Observation and Cooperation


Abstract
:1. Introduction
2. Literature Review
2.1. AI Generation Applications
2.2. Creative Mapping Visual Perception
2.3. Creative Self-Efficacy
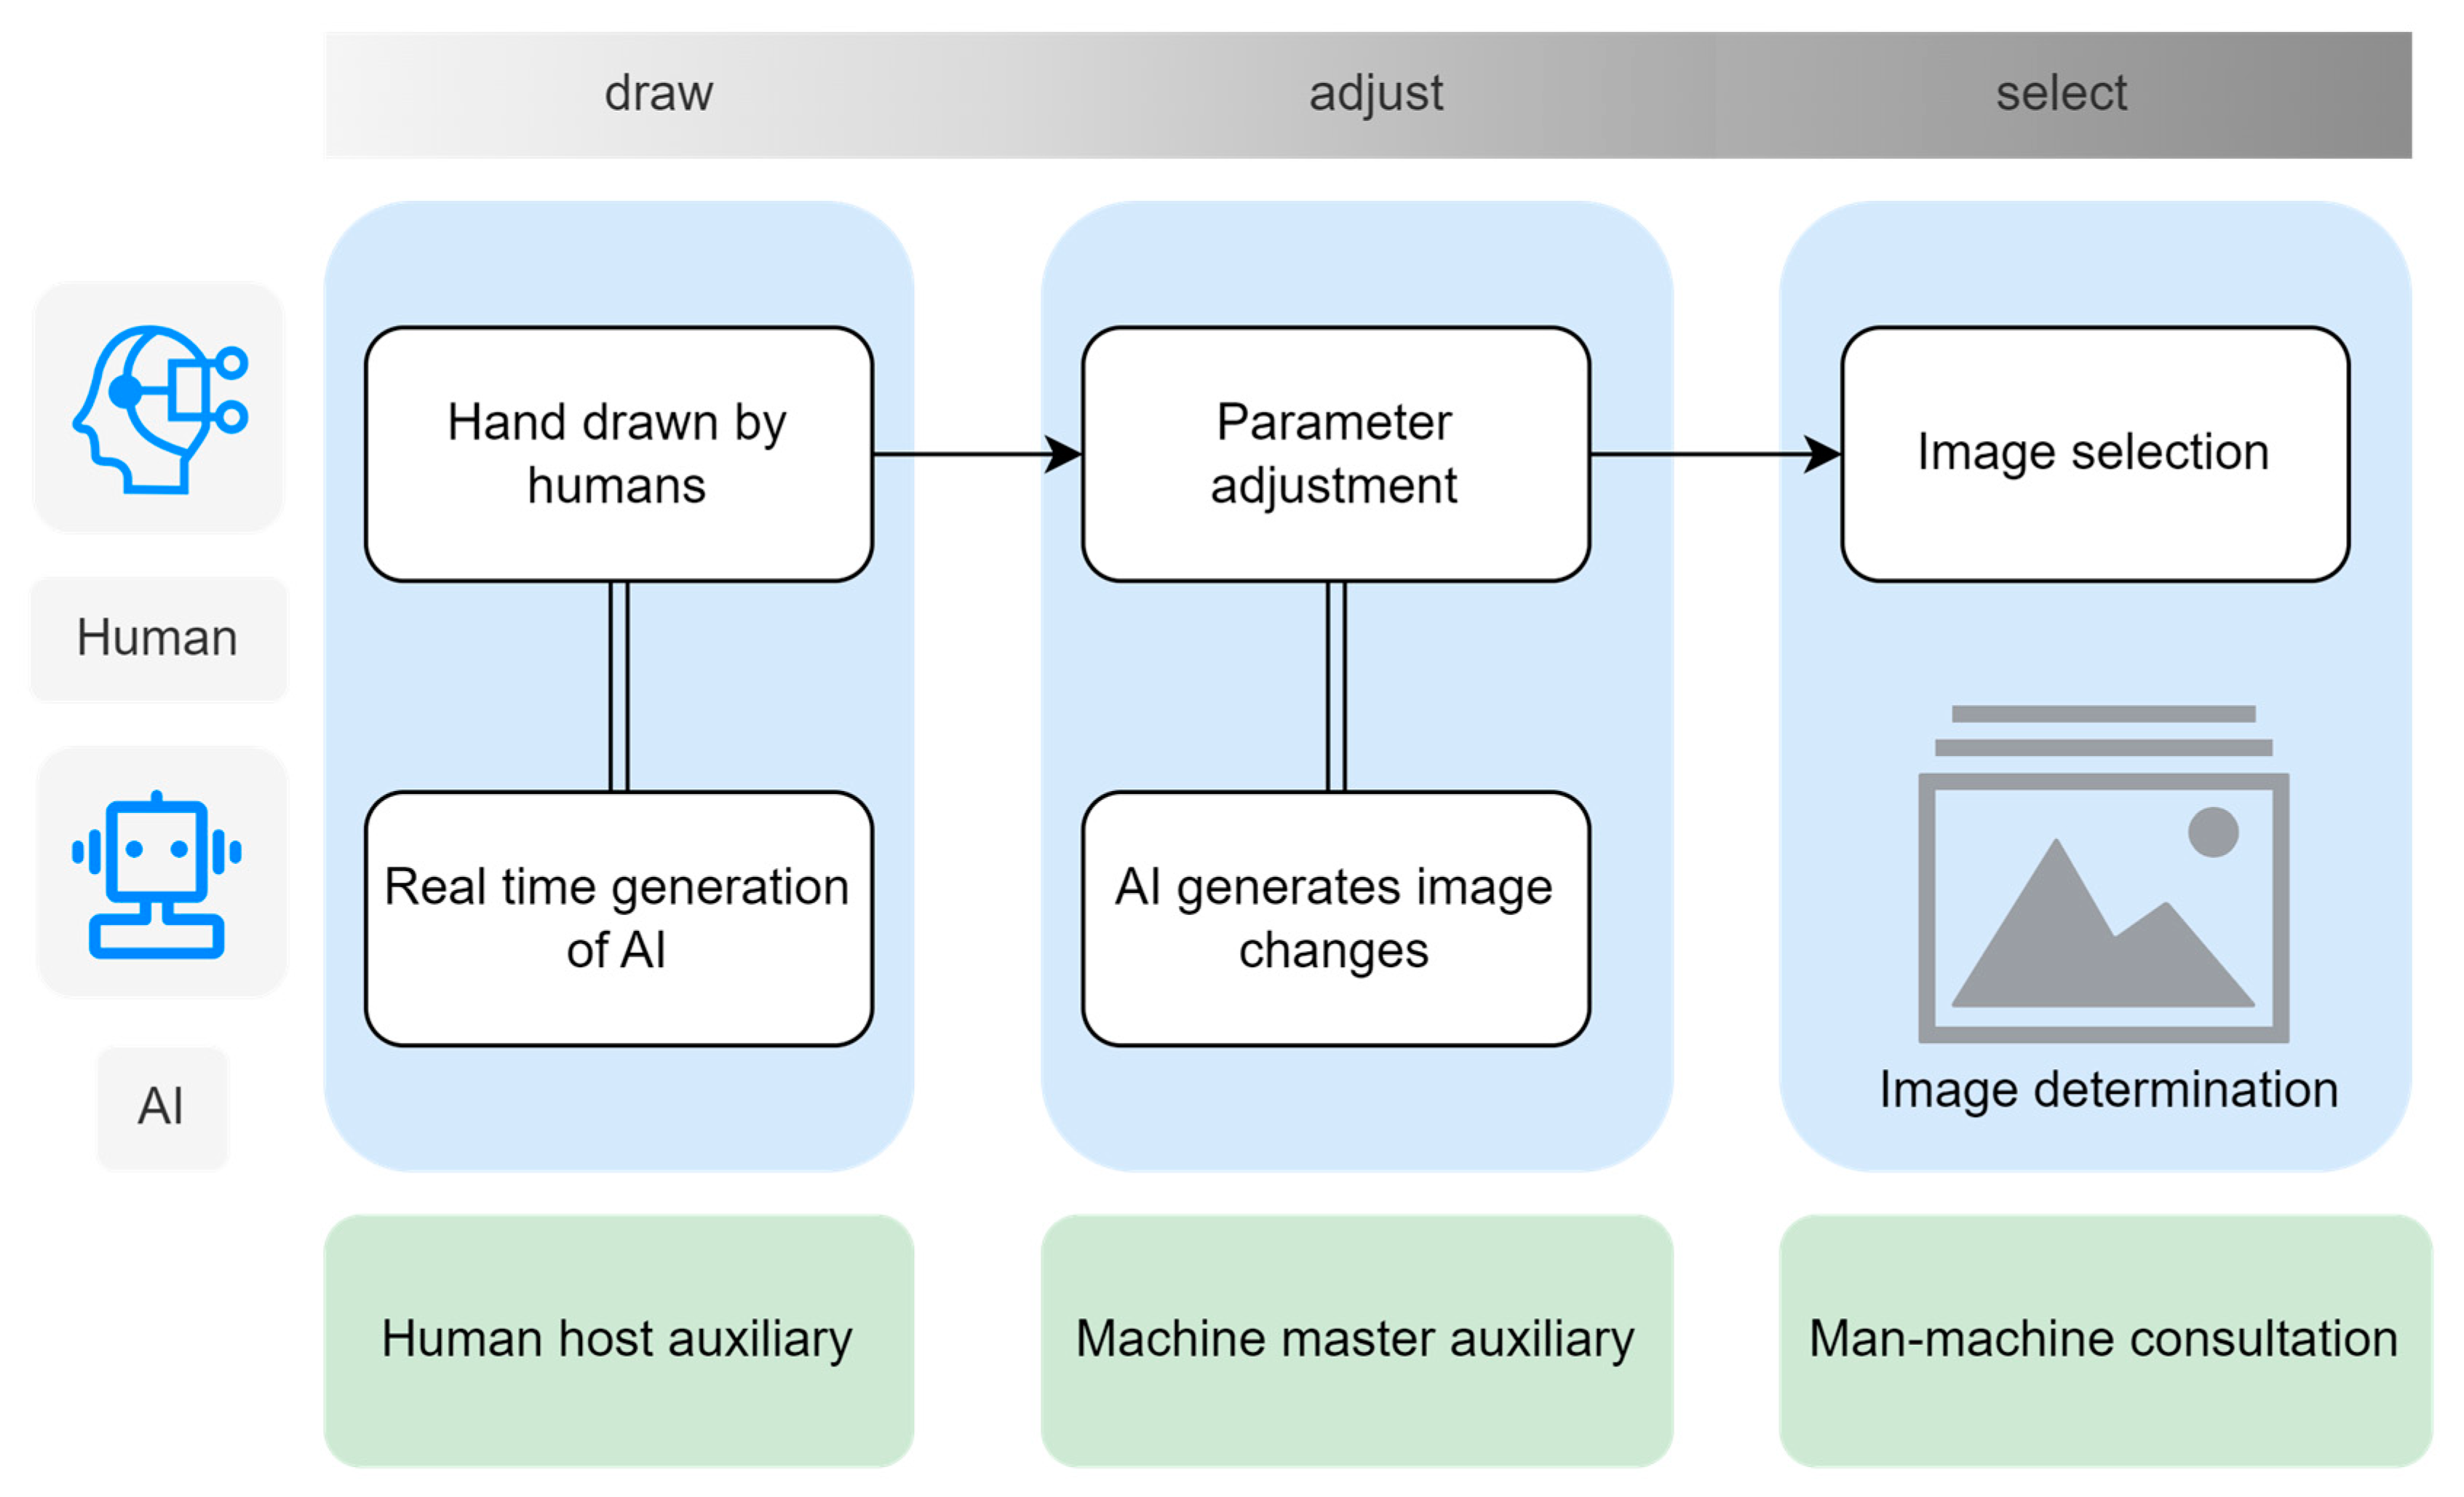
2.4. Human–AI Cooperation Model
2.5. Research Hypothesis
3. Materials and Methods
3.1. Stimuli
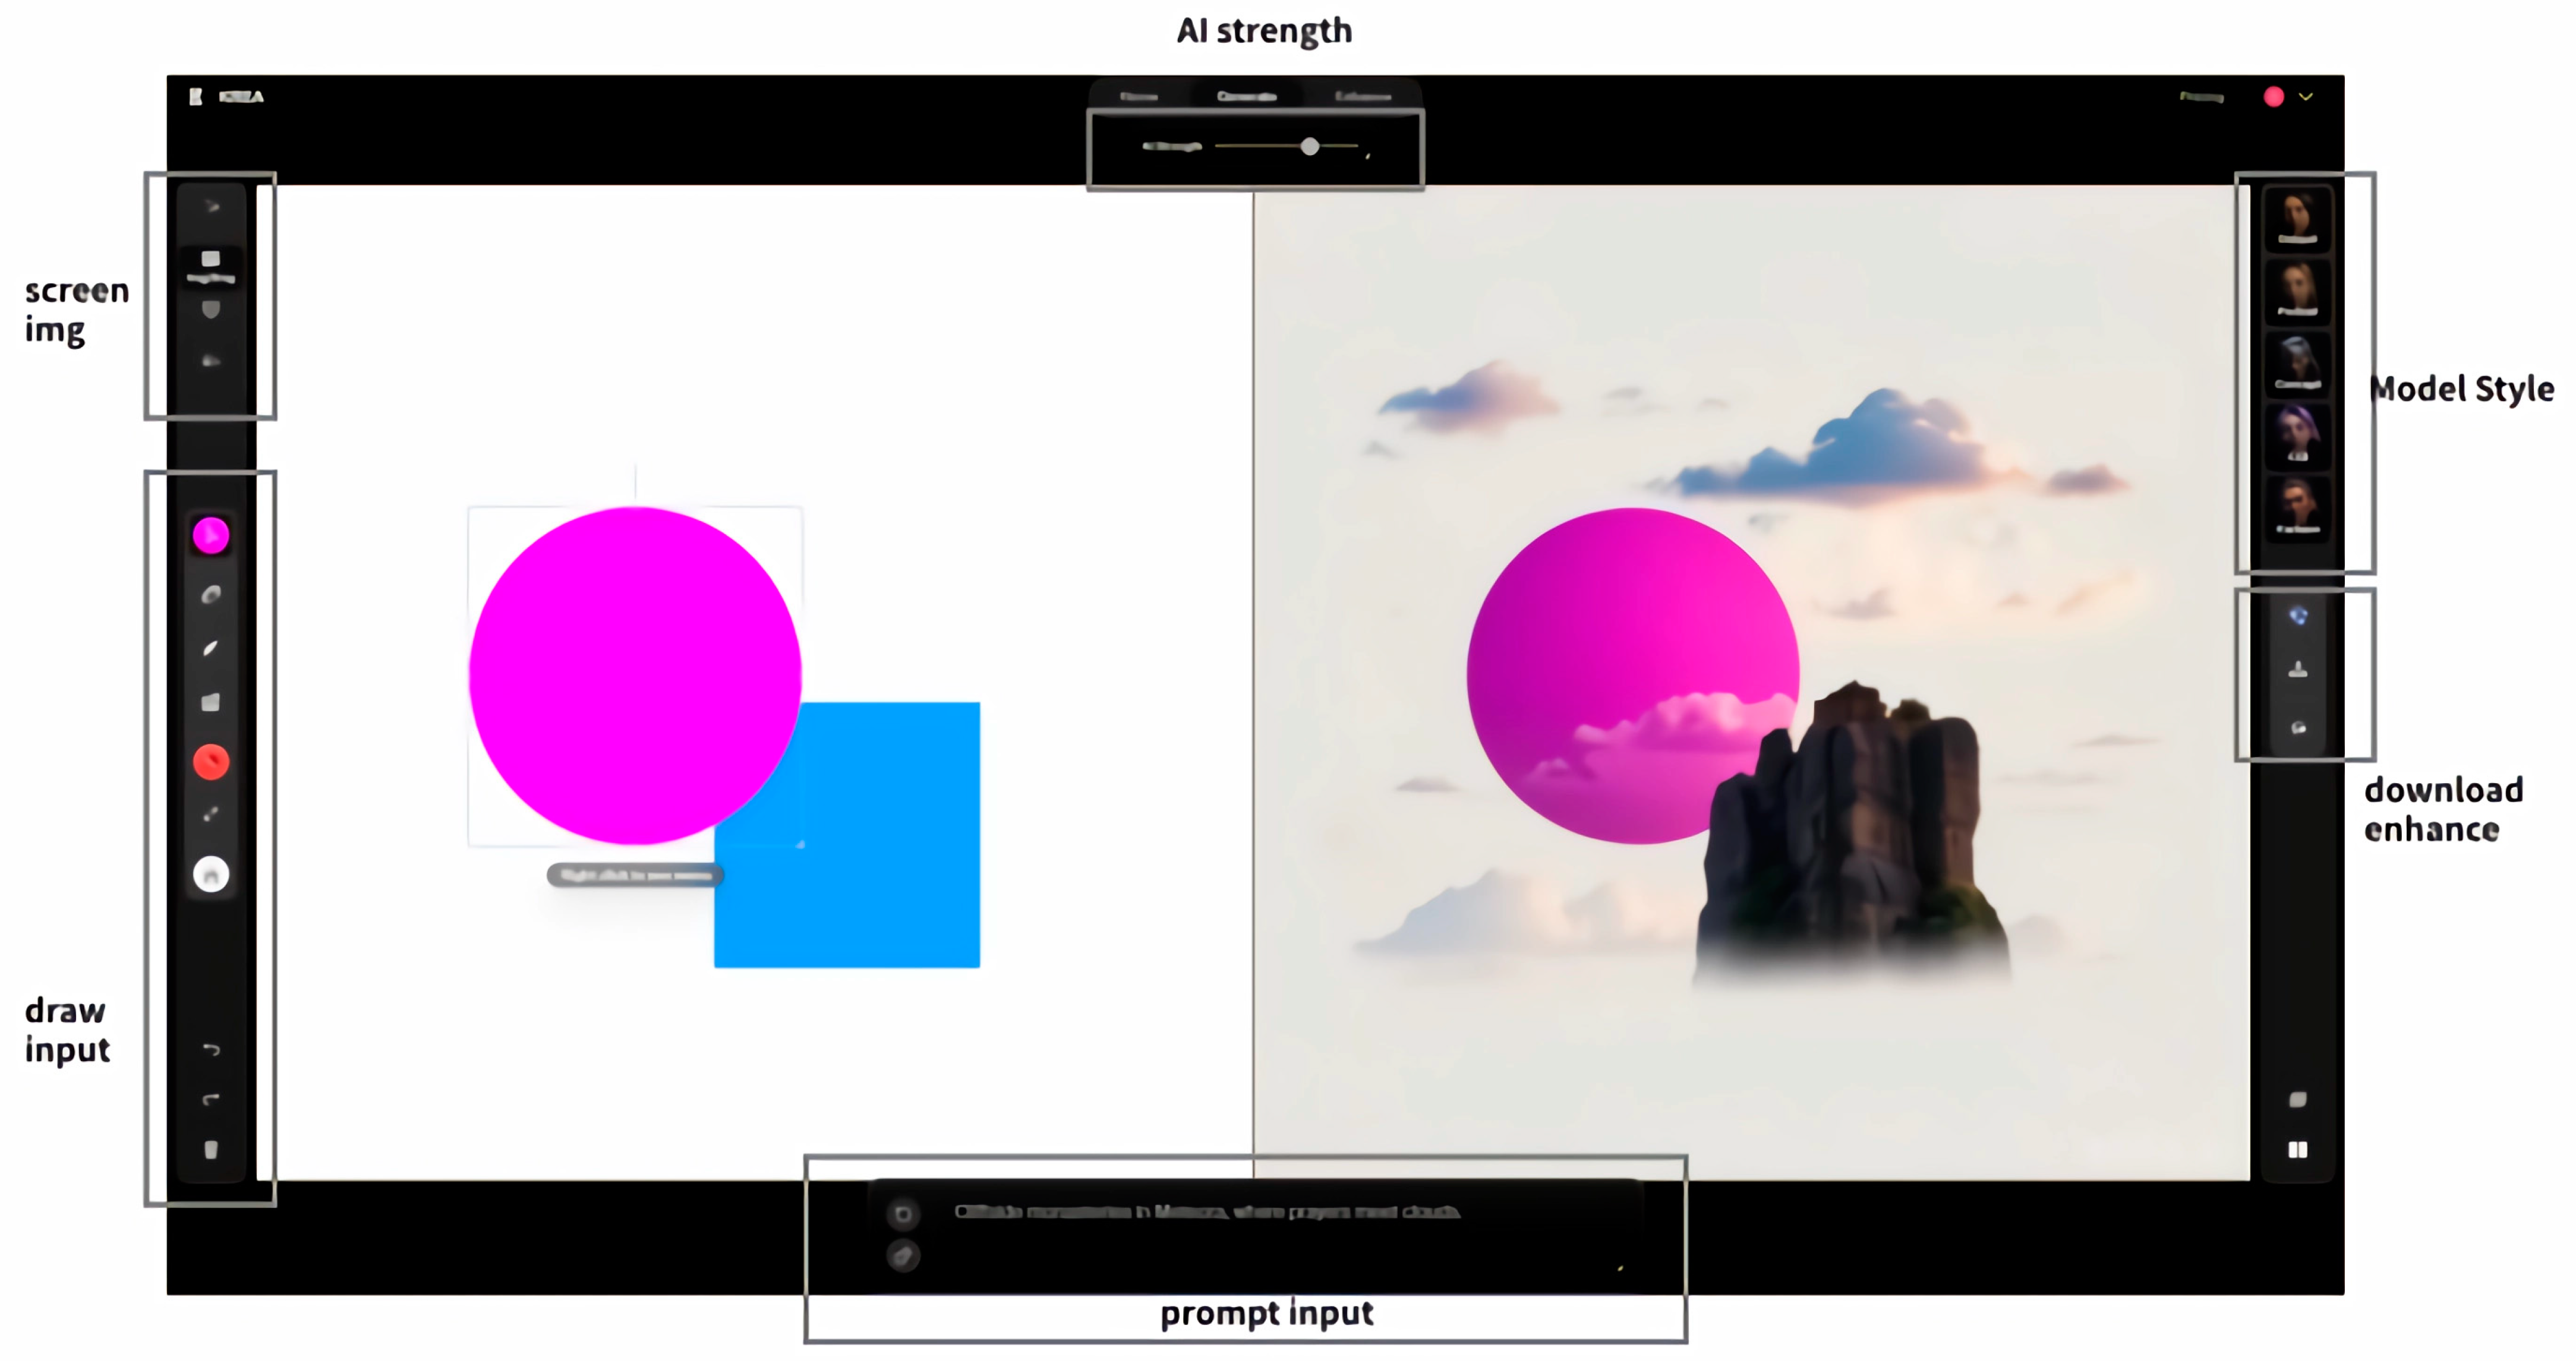
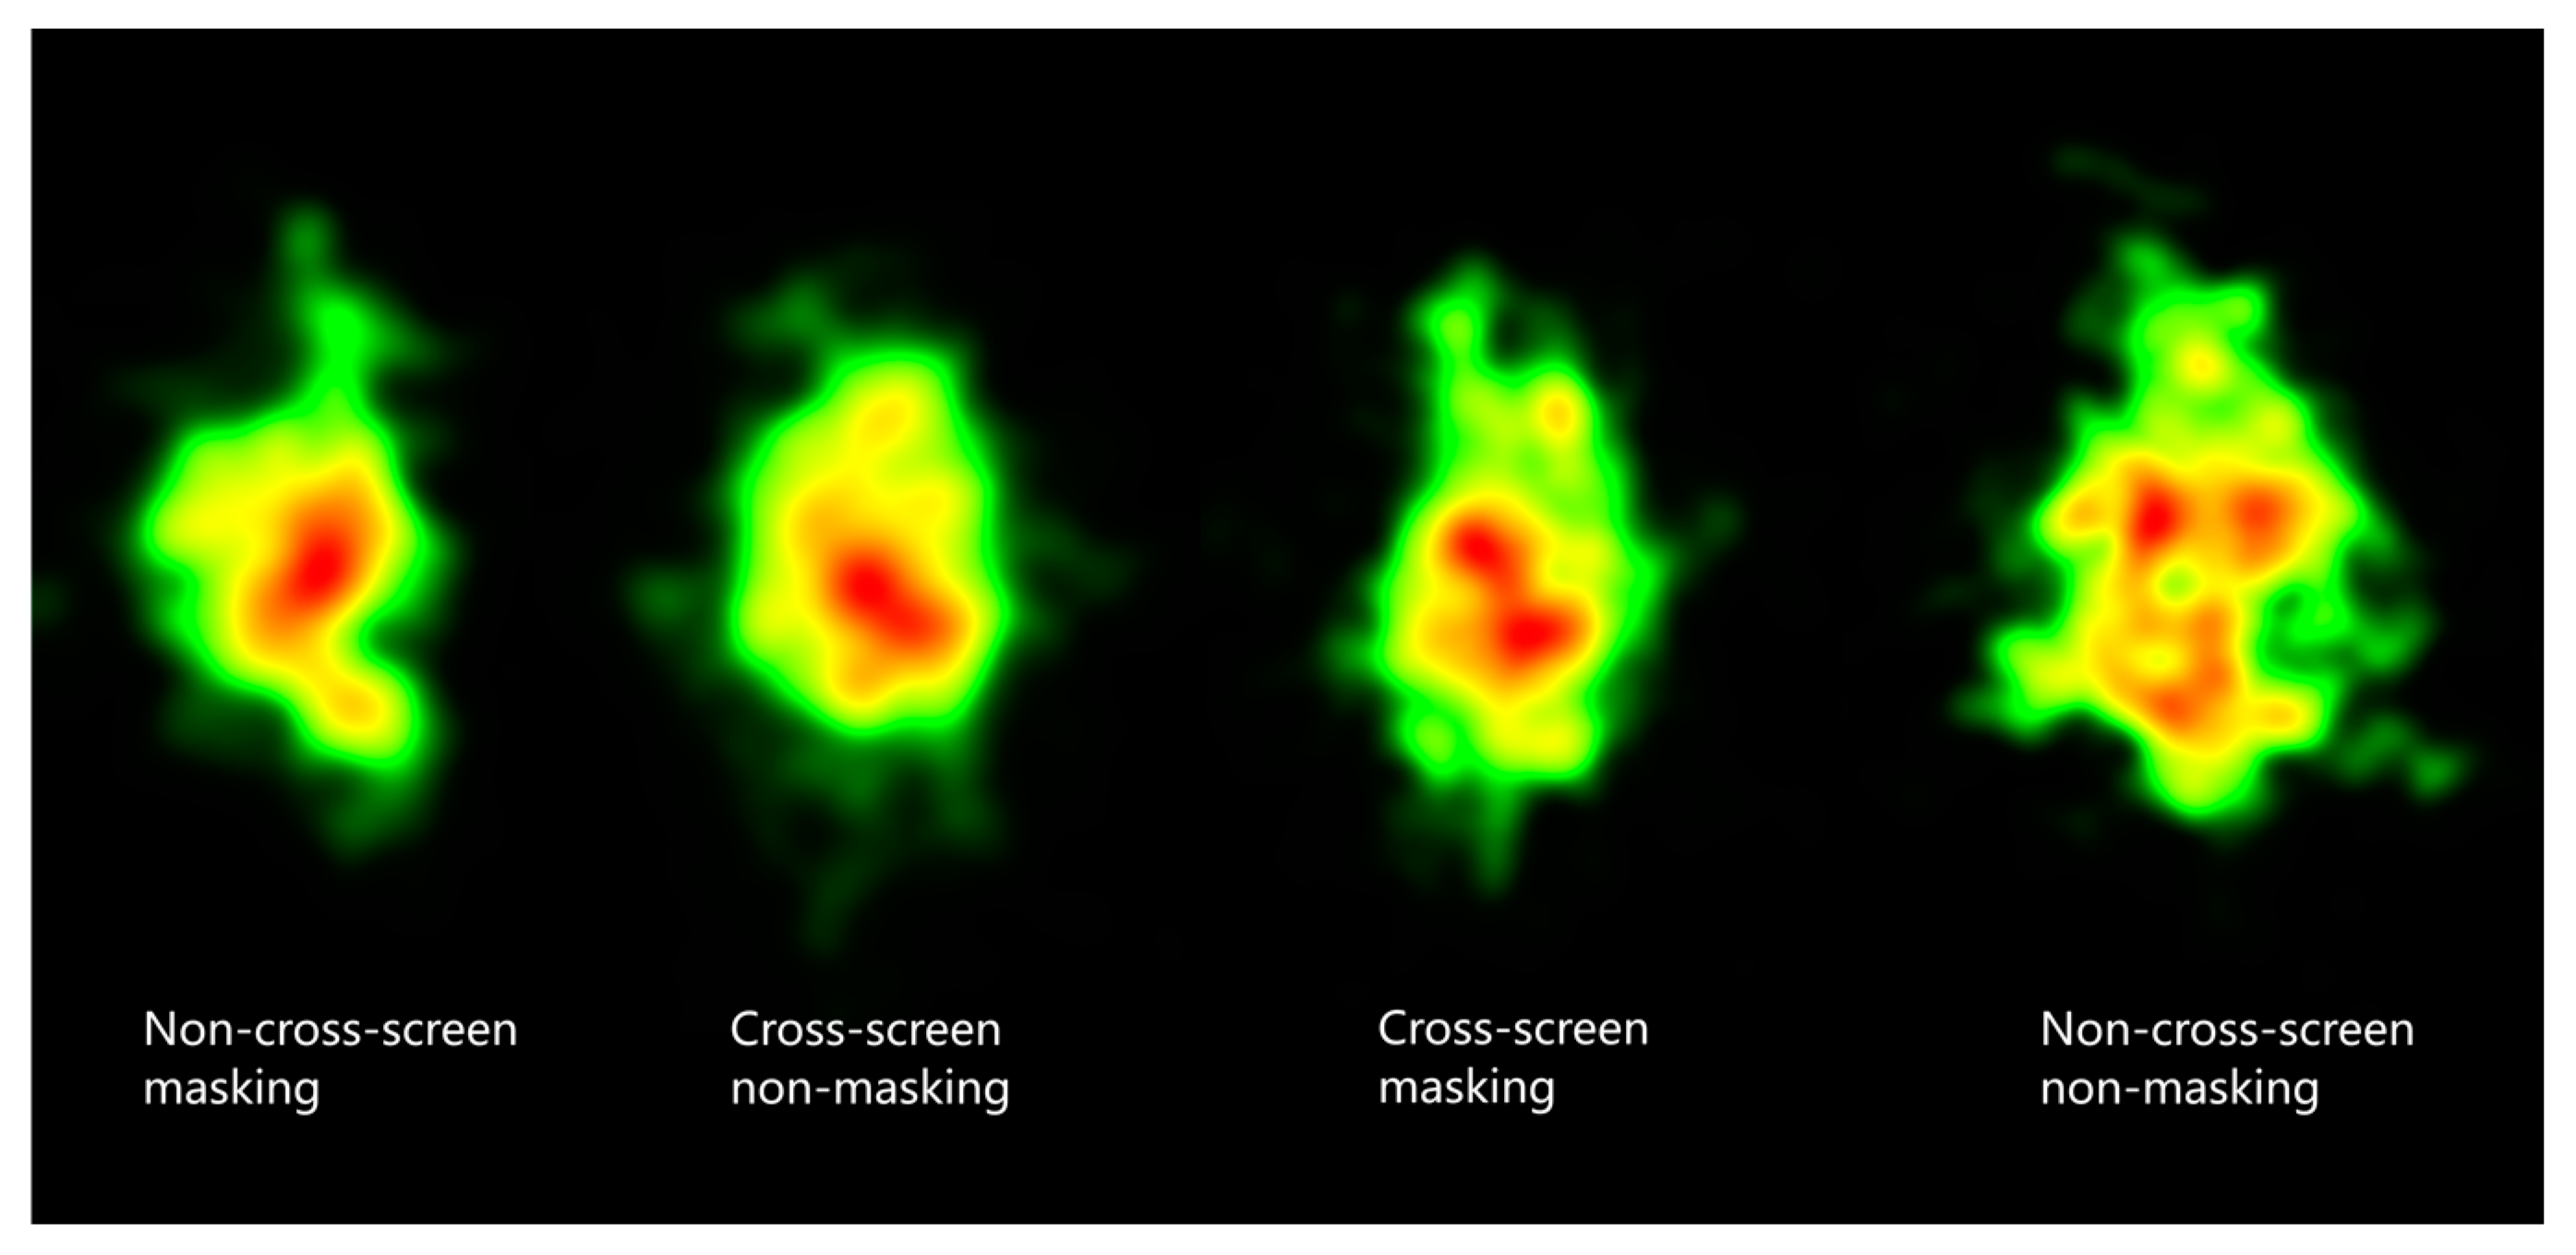
3.1.1. Cross-Screen Mode Setting
3.1.2. Masking Settings for Visual Strategies
3.1.3. Creativity Scale Design
3.2. Experimental Design
3.2.1. Experimental Setup and Subject
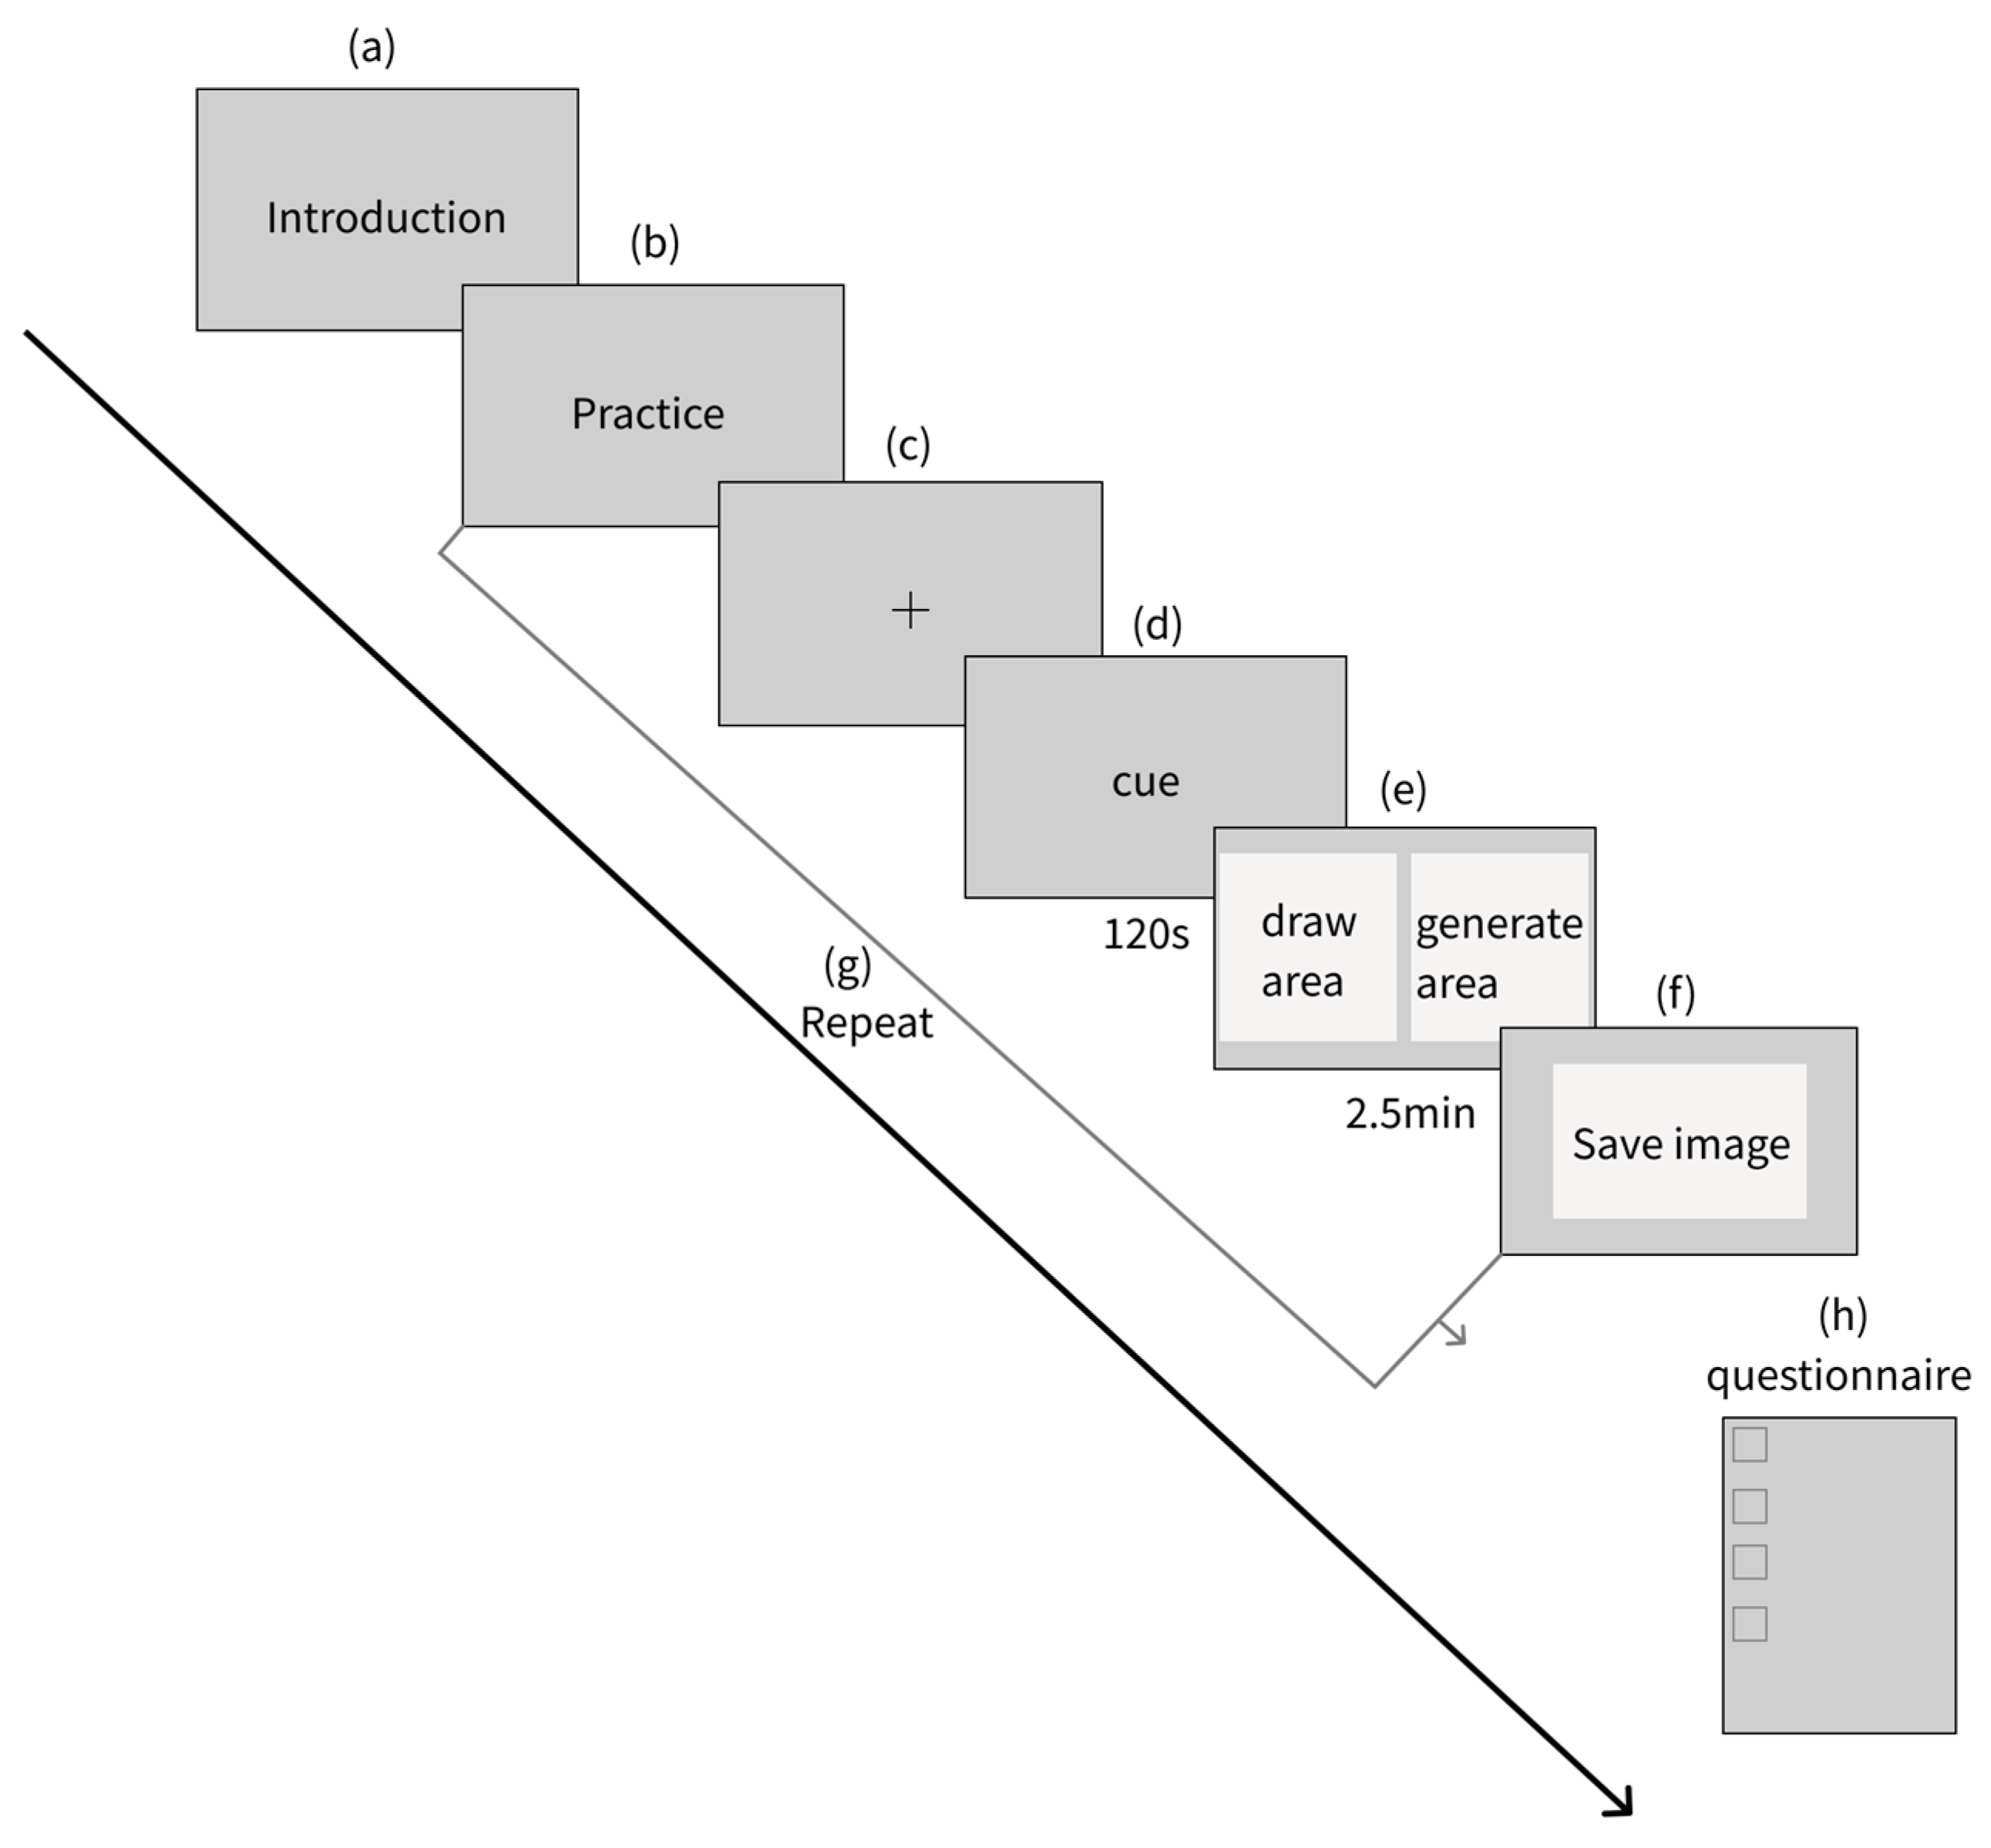
3.2.2. Experimental Procedures
- Show the introduction of the experiment.
- After carefully reading the experimental procedure, participants were asked to perform a practice task.
- The eye-tracker headband was fitted and then a short calibration procedure was carried out. Adjustments were made to keep the participant’s line of sight perpendicular and at a distance of 60 cm from the monitor.
- The cue word was displayed, the cue word was observed for 1 min, and the cue word was entered.
- Participants started drawing for a controlled period of two and a half minutes, during which the eye tracker recorded eye movement data, gaze duration, number of gazes, eye jumps, etc.
- Save the generated image.
- Repeat the operation.
- Fill in the questionnaire.
3.2.3. Selection of Eye Movement Data Metrics
3.2.4. Data Processing and Analysis
Theoretical Basis for Data Processing
Data Analysis Methods and Ideas
4. Results
- Different cross-device collaboration methods have a significant impact on the visual cognition of human–AI collaborative drawing design, and tasks in non-cross-screen environments are more sensitive to visual processing.
- There are different effects of occlusion and non-occlusion on visual attention and cognitive load under cross-screen and non-cross-screen conditions. In non-cross-screen situations, occlusion and non-occlusion have a significant impact on the average gaze duration and pupil diameter. Therefore, different cross-device collaborative visual observation strategies have a significant impact on the visual cognitive load of users and AI collaborative drawing.
- Under different visual observation strategies, the degree to which the AI participates in the designer’s hand-drawn creative process will have a significant impact on the designer’s behaviour in negotiating design ideas with the AI.
- The degree to which the AI participates in the designer’s hand-drawn creative process under the influence of different cross-device collaboration methods will have a significant impact on the designer’s behaviour in negotiating design ideas with AI.
4.1. Analysis of Eye Movement Data
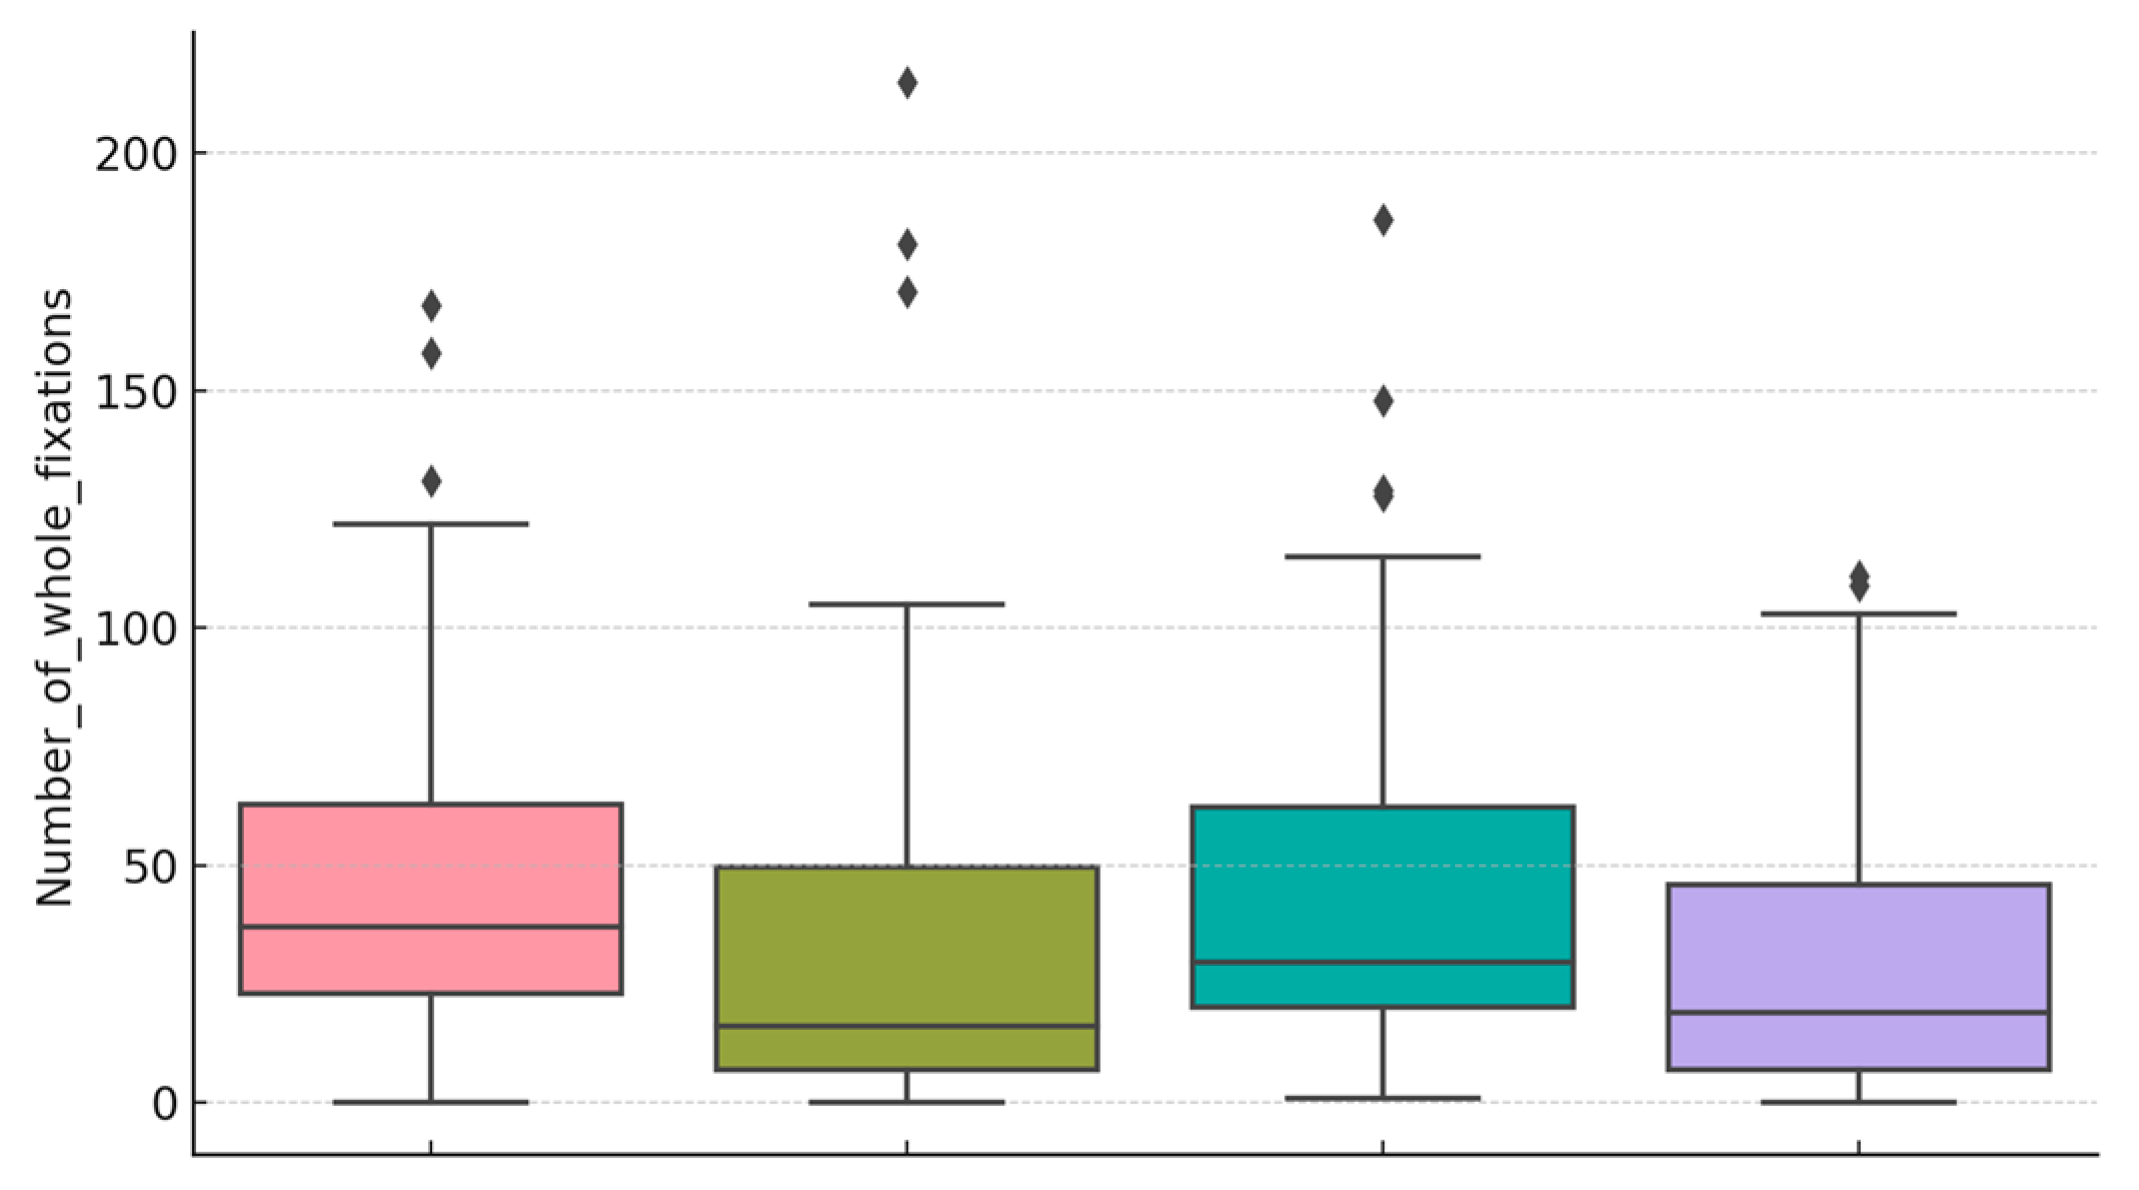
4.1.1. Data Descriptive Statistics
4.1.2. Analysis of Variance of Data
4.1.3. Summary of Eye Movement Data Analysis
4.2. Scale Data Analysis
4.2.1. Reliability Analysis
4.2.2. Validity Analysis
4.2.3. Non-Parametric Tests of Scales
5. Discussion
5.1. Theoretical Implications
5.2. Practical Implications
6. Conclusions
7. Future Research and Prospects
7.1. Further Research on Subjects
7.2. Implications for AI Developers
Author Contributions
Funding
Institutional Review Board Statement
Informed Consent Statement
Data Availability Statement
Acknowledgments
Conflicts of Interest
Appendix A

| Number | Issues | |||||||
|---|---|---|---|---|---|---|---|---|
| 1 | 2 | 3 | 4 | 5 | 6 | 7 | ||
| 01 | 1. I think I am good at coming up with novel ideas | |||||||
| 02 | 2. I have confidence in my creative problem-solving skills | |||||||
| 03 | 3. I have tricks for further refining AI ideas | |||||||
| 04 | 4. I am good at finding new ways to solve problems |
References
- Lyu, Y.; Wang, X.; Lin, R.; Wu, J. Communication in Human–AI Co-Creation: Perceptual Analysis of Paintings Generated by Text-to-Image System. Appl. Sci. 2022, 12, 11312. [Google Scholar] [CrossRef]
- Zhao, Y. Artificial Intelligence-Based Interactive Art Design under Neural Network Vision Valve. J. Sens. 2022, 2022, 3628955. [Google Scholar] [CrossRef]
- Lv, Y. Artificial Intelligence-Generated Content in Intelligent Transportation Systems: Learning to Copy, Change, and Create! [Editor’s Column]. IEEE Intell. Transp. Syst. Mag. 2023, 15, 2–3. [Google Scholar] [CrossRef]
- AIGC: The Rise and Future Prospects of Artificial Intelligence Generated Content—Cloud Community—Huawei Cloud. Available online: https://bbs.huaweicloud.com/blogs/398164?utm_source=zhihu&utm_medium=bbs-ex&utm_campaign=other&utm_content=content (accessed on 20 January 2024).
- Hong, J.-W. Bias in Perception of Art Produced by Artificial Intelligence. In Human-Computer Interaction. Interaction in Context; Kurosu, M., Ed.; Lecture Notes in Computer Science; Springer International Publishing: Cham, Switzerland, 2018; Volume 10902, pp. 290–303. ISBN 978-3-319-91243-1. [Google Scholar]
- Wingström, R.; Hautala, J.; Lundman, R. Redefining Creativity in the Era of AI? Perspectives of Computer Scientists and New Media Artists. Creat. Res. J. 2022, 36, 177–193. [Google Scholar] [CrossRef]
- Sun, L.; Chen, P.; Xiang, W.; Chen, P.; Gao, W.; Zhang, K. SmartPaint: A Co-Creative Drawing System Based on Generative Adversarial Networks. Front. Inf. Technol. Electron. Eng. 2019, 20, 1644–1656. [Google Scholar] [CrossRef]
- Oksanen, A.; Cvetkovic, A.; Akin, N.; Latikka, R.; Bergdahl, J.; Chen, Y.; Savela, N. Artificial Intelligence in Fine Arts: A Systematic Review of Empirical Research. Comput. Hum. Behav. Artif. Hum. 2023, 1, 100004. [Google Scholar] [CrossRef]
- Spering, M. Eye Movements as a Window into Decision-Making. Annu. Rev. Vis. Sci. 2022, 8, 427–448. [Google Scholar] [CrossRef] [PubMed]
- Utz, V.; DiPaola, S. Using an AI Creativity System to Explore How Aesthetic Experiences Are Processed along the Brain’s Perceptual Neural Pathways. Cogn. Syst. Res. 2020, 59, 63–72. [Google Scholar] [CrossRef]
- Guo, Y.; Lin, S.; Acar, S.; Jin, S.; Xu, X.; Feng, Y.; Zeng, Y. Divergent Thinking and Evaluative Skill: A Meta-Analysis. J. Creat. Behav. 2022, 56, 432–448. [Google Scholar] [CrossRef]
- Déguernel, K.; Sturm, B.L.T. Bias in Favour or Against Computational Creativity: A Survey and Reflection on the Importance of Socio-Cultural Context in Its Evaluation. Available online: http://kth.diva-portal.org/smash/get/diva2:1757836/FULLTEXT01.pdf (accessed on 20 January 2024).
- Li, G.; Chu, R.; Tang, T. Creativity Self Assessments in Design Education: A Systematic Review. Think. Skills Creat. 2024, 52, 101494. [Google Scholar] [CrossRef]
- Tamm, T.; Hallikainen, P.; Tim, Y. Creative Analytics: Towards Data-Inspired Creative Decisions. Inf. Syst. J. 2022, 32, 729–753. [Google Scholar] [CrossRef]
- Wammes, J.D.; Roberts, B.R.T.; Fernandes, M.A. Task Preparation as a Mnemonic: The Benefits of Drawing (and Not Drawing). Psychon. Bull. Rev. 2018, 25, 2365–2372. [Google Scholar] [CrossRef]
- Xie, H.; Zhou, Z. Finger versus Pencil: An Eye Tracking Study of Learning by Drawing on Touchscreens. J. Comput. Assist. Learn. 2024, 40, 49–64. [Google Scholar] [CrossRef]
- Pei, Y.; Wang, L.; Xue, C. Research on the Efficiency and Cognition of the Combination of Front Color and Background Color and Color in the Interface of Express Cabinets on the Operation of Human Machine Interface Tasks. In Proceedings of the HCI International 2023—Late Breaking Papers, Copenhagen, Denmark, 23–28 July 2023; Kurosu, M., Hashizume, A., Marcus, A., Rosenzweig, E., Soares, M.M., Harris, D., Li, W.-C., Schmorrow, D.D., Fidopiastis, C.M., Rau, P.-L.P., Eds.; Springer Nature Switzerland: Cham, Switzerland, 2023; pp. 194–212. [Google Scholar]
- Alemdag, E.; Cagiltay, K. A Systematic Review of Eye Tracking Research on Multimedia Learning. Comput. Educ. 2018, 125, 413–428. [Google Scholar] [CrossRef]
- Chang, H.-W.; Bi, X.-D.; Kai, C. Blind Image Quality Assessment by Visual Neuron Matrix. IEEE Signal Process. Lett. 2021, 28, 1803–1807. [Google Scholar] [CrossRef]
- Karran, A.J.; Demazure, T.; Hudon, A.; Senecal, S.; Léger, P.-M. Designing for Confidence: The Impact of Visualizing Artificial Intelligence Decisions. Front. Neurosci. 2022, 16, 883385. [Google Scholar] [CrossRef]
- Braun, I.; Graulich, N. Die Zeichnung im Blick—Nutzung von Eye-Tracking zur Analyse der zeichnerischen Erschließung von Mesomerie-Aufgaben. Chemkon 2022, 29, 261–266. [Google Scholar] [CrossRef]
- Hahm, J.; Kim, K.K.; Park, S.-H. Cortical Correlates of Creative Thinking Assessed by the Figural Torrance Test of Creative Thinking. NeuroReport 2019, 30, 1289–1293. [Google Scholar] [CrossRef] [PubMed]
- Bandi, A.; Adapa, P.V.S.R.; Kuchi, Y.E.V.P.K. The Power of Generative AI: A Review of Requirements, Models, Input–Output Formats, Evaluation Metrics, and Challenges. Future Internet 2023, 15, 260. [Google Scholar] [CrossRef]
- Daviddi, S.; Orwig, W.; Palmiero, M.; Campolongo, P.; Schacter, D.L.; Santangelo, V. Individuals with Highly Superior Autobiographical Memory Do Not Show Enhanced Creative Thinking. Memory 2022, 30, 1148–1157. [Google Scholar] [CrossRef]
- Oldham, G.R.; Cummings, A. Employee Creativity: Personal and Contextual Factors at Work. Acad. Manag. J. 1996, 39, 607–634. [Google Scholar] [CrossRef]
- Lee, Y.K.; Park, Y.-H.; Hahn, S. A Portrait of Emotion: Empowering Self-Expression through AI-Generated Art. arXiv 2023, arXiv:2304.13324. [Google Scholar]
- Shi, Y.; Shang, M.; Qi, Z. Intelligent Layout Generation Based on Deep Generative Models: A Comprehensive Survey. Inf. Fusion 2023, 100, 101940. [Google Scholar] [CrossRef]
- Fan, M.; Yang, X.; Yu, T.T.; Liao, V.Q.; Zhao, J. Human-AI Collaboration for UX Evaluation: Effects of Explanation and Synchronization. arXiv 2021, arXiv:2112.12387. [Google Scholar] [CrossRef]
- Kuang, E.; Jahangirzadeh Soure, E.; Fan, M.; Zhao, J.; Shinohara, K. Collaboration with Conversational AI Assistants for UX Evaluation: Questions and How to Ask Them (Voice vs. Text). In Proceedings of the 2023 CHI Conference on Human Factors in Computing Systems, Hamburg, Germany, 23–28 April 2023; pp. 1–15. [Google Scholar] [CrossRef]
- Sowa, K.; Przegalinska, A.; Ciechanowski, L. Cobots in Knowledge Work: Human—AI Collaboration in Managerial Professions. J. Bus. Res. 2021, 125, 135–142. [Google Scholar] [CrossRef]
- Lindebaum, D.; Vesa, M.; Den Hond, F. Insights From “The Machine Stops” to Better Understand Rational Assumptions in Algorithmic Decision Making and Its Implications for Organizations. Acad. Manag. Rev. 2020, 45, 247–263. [Google Scholar] [CrossRef]
- Ozmen Garibay, O.; Winslow, B.; Andolina, S.; Antona, M.; Bodenschatz, A.; Coursaris, C.; Falco, G.; Fiore, S.M.; Garibay, I.; Grieman, K.; et al. Six Human-Centered Artificial Intelligence Grand Challenges. Int. J. Hum.–Comput. Interact. 2023, 39, 391–437. [Google Scholar] [CrossRef]
- Abbass, H.A. Social Integration of Artificial Intelligence: Functions, Automation Allocation Logic and Human-Autonomy Trust. Cogn. Comput. 2019, 11, 159–171. [Google Scholar] [CrossRef]
- Zhou, Y.; Yang, P.; Xu, X.; Shao, B.; Feng, G.; Liu, J.; Luo, B. FMASketch: Freehand Mid-Air Sketching in AR. Int. J. Hum.–Comput. Interact. 2024, 40, 2142–2152. [Google Scholar] [CrossRef]
- Schindler, M.; Lilienthal, A.J. Students’ Collaborative Creative Process and Its Phases in Mathematics: An Explorative Study Using Dual Eye Tracking and Stimulated Recall Interviews. ZDM—Math. Educ. 2022, 54, 163–178. [Google Scholar] [CrossRef]
- Liu, Y.-L.E.; Lee, T.-P.; Huang, Y.-M. Exploring Students’ Continuance Intention Toward Digital Visual Collaborative Learning Technology in Design Thinking. Int. J. Hum.–Comput. Interact. 2023, 40, 2808–2821. [Google Scholar] [CrossRef]
- Xiang, W.; Sun, L.; Chen, S.; Yang, Z.; Liu, Z. The Role of Mental Models in Collaborative Sketching. Int. J. Technol. Des. Educ. 2015, 25, 121–136. [Google Scholar] [CrossRef]
- Park, S.; Wiliams, L.; Chamberlain, R. Global Saccadic Eye Movements Characterise Artists’ Visual Attention While Drawing. Empir. Stud. Arts 2022, 40, 228–244. [Google Scholar] [CrossRef]
- Yahyaie, L.; Ebrahimpour, R.; Koochari, A. Pupil Size Variations Reveal Information About Hierarchical Decision-Making Processes. Cogn. Comput. 2024, 16, 1049–1060. [Google Scholar] [CrossRef]
- Peng, N.; Xue, C. Experimental study on icon search characteristics based on feature inference. J. Southeast Univ. 2017, 47, 703–709. [Google Scholar]
- Beelders, T. Visual Search Patterns for Multilingual Word Search Puzzles, a Pilot Study. J. Eye Mov. Res. 2023, 16, 6. [Google Scholar] [CrossRef]
- Lin, C.J.; Prasetyo, Y.T.; Widyaningrum, R. Eye Movement Parameters for Performance Evaluation in Projection-Based Stereoscopic Display. J. Eye Mov. Res. 2018, 11, 3. [Google Scholar] [CrossRef]
- Eldar, E.; Felso, V.; Cohen, J.D.; Niv, Y. A Pupillary Index of Susceptibility to Decision Biases. Nat. Hum. Behav. 2021, 5, 653–662. [Google Scholar] [CrossRef]
- Wu, Z. Research on Color Emotion Evaluation of AI Images from the Perspective of Sensory Engineering. Master’s Thesis, Beijing University of Posts and Telecommunications, Beijing, China, 2022. [Google Scholar]
- Chen, X.; Tang, X.; Zhao, Y.; Huang, T.; Qian, R.; Zhang, J.; Chen, W.; Wang, X. Evaluating Visual Consistency of Icon Usage in Across-Devices. Int. J. Hum.–Comput. Interact. 2023, 40, 2415–2431. [Google Scholar] [CrossRef]
- Wu, X.; Chen, Y.; Li, J. Study on Error-Cognition Mechanism of Task Interface in Complex Information System. In Advances in Safety Management and Human Factors; Arezes, P., Ed.; Advances in Intelligent Systems and Computing; Springer International Publishing: Cham, Switzerland, 2018; Volume 604, pp. 497–506. ISBN 978-3-319-60524-1. [Google Scholar]
- Hershman, R.; Henik, A.; Cohen, N. CHAP: Open-Source Software for Processing and Analyzing Pupillometry Data. Behav. Res. Methods 2019, 51, 1059–1074. [Google Scholar] [CrossRef]
- Yadav, S.; Chakraborty, P.; Mittal, P. Designing Drawing Apps for Children: Artistic and Technological Factors. Int. J. Hum.–Comput. Interact. 2022, 38, 103–117. [Google Scholar] [CrossRef]
- Jin, S.V.; Youn, S. Social Presence and Imagery Processing as Predictors of Chatbot Continuance Intention in Human-AI-Interaction. Int. J. Hum.–Comput. Interact. 2023, 39, 1874–1886. [Google Scholar] [CrossRef]
- Zhu, M.; Bao, D.; Yu, Y.; Shen, D.; Yi, M. Differences in Thinking Flexibility between Novices and Experts Based on Eye Tracking. PLoS ONE 2022, 17, e0269363. [Google Scholar] [CrossRef]
- Awano, N.; Hayashi, Y. Object Categorization Capability of Psychological Potential Field in Perceptual Assessment Using Line-Drawing Images. J. Imaging 2022, 8, 90. [Google Scholar] [CrossRef]
- Cheng, S.; Dey, A.K. I See, You Design: User Interface Intelligent Design System with Eye Tracking and Interactive Genetic Algorithm. CCF Trans. Pervasive Comput. Interact. 2019, 1, 224–236. [Google Scholar] [CrossRef]
- Le Guillou, M.; Prévot, L.; Berberian, B. Bringing Together Ergonomic Concepts and Cognitive Mechanisms for Human—AI Agents Cooperation. Int. J. Hum.–Comput. Interact. 2023, 39, 1827–1840. [Google Scholar] [CrossRef]
- Lee, S.; Lee, M.; Lee, S. What If Artificial Intelligence Become Completely Ambient in Our Daily Lives? Exploring Future Human-AI Interaction through High Fidelity Illustrations. Int. J. Hum.–Comput. Interact. 2023, 39, 1371–1389. [Google Scholar] [CrossRef]
- Guo, X.; Qian, Y.; Li, L.; Asano, A. Assessment Model for Perceived Visual Complexity of Painting Images. Knowl.-Based Syst. 2018, 159, 110–119. [Google Scholar] [CrossRef]
- Karimi, P.; Rezwana, J.; Siddiqui, S.; Maher, M.L.; Dehbozorgi, N. Creative Sketching Partner: An Analysis of Human-AI Co-Creativity. In Proceedings of the 25th International Conference on Intelligent User Interfaces, Cagliari, Italy, 17 March 2020; ACM: New York, NY, USA; pp. 221–230. [Google Scholar]
- Jang, W.; Chang, Y.; Kim, B.; Lee, Y.J.; Kim, S.-C. Influence of Personal Innovativeness and Different Sequences of Data Presentation on Evaluations of Explainable Artificial Intelligence. Int. J. Hum.–Comput. Interact. 2023, 40, 4215–4226. [Google Scholar] [CrossRef]
- Bozkir, E.; Özdel, S.; Wang, M.; David-John, B.; Gao, H.; Butler, K.; Jain, E.; Kasneci, E. Eye-Tracked Virtual Reality: A Comprehensive Survey on Methods and Privacy Challenges. Available online: https://arxiv.org/abs/2305.14080v1 (accessed on 1 May 2024).
- Chang, Y.; He, C.; Zhao, Y.; Lu, T.; Gu, N. A High-Frame-Rate Eye-Tracking Framework for Mobile Devices. In Proceedings of the ICASSP 2021–2021 IEEE International Conference on Acoustics, Speech and Signal Processing (ICASSP), Toronto, ON, Canada, 6–11 June 2021; pp. 1445–1449. [Google Scholar]
- Stein, I.; Jossberger, H.; Gruber, H. Investigating Visual Expertise in Sculpture: A Methodological Approach Using Eye Tracking. J. Eye Mov. Res. 2022, 15, 5. [Google Scholar] [CrossRef]
- Turkmen, R.; Pfeuffer, K.; Machuca, M.D.B.; Batmaz, A.U.; Gellersen, H. Exploring Discrete Drawing Guides to Assist Users in Accurate Mid-Air Sketching in VR. In Proceedings of the Extended Abstracts of the 2022 CHI Conference on Human Factors in Computing Systems, CHI 2022, New Orleans, LA, USA, 29 April–5 May 2022; Assoc Computing Machinery: New York, NY, USA, 2022; p. LBW67. [Google Scholar]
- Humphreys, P.; Jones, G. The Decision Hedgehog for Creative Decision Making. Inf. Syst. E-Bus. Manag. 2008, 6, 117–136. [Google Scholar] [CrossRef]


| Cross-Device | Cross-Screen | Non-Cross-Screen |
| Hand–eye coordination | Low level | High degree |
| Visual switching | High degree | Low level |
| Observation Strategies | First Strategy | Second Strategy |
| Look after Draw | Act as Go-between | |
| AI engagement | Not involved in conceptualisation | Involved in conceptualisation |
| Visual switching | Low level | High degree |
| Rank | L1 | L2 | L3 | L4 |
| Collaborative models | Competing or working separately | Supplementing each other | Competing or working separately | Supplementing each other |
| Human–AI |  |  |  |  |
| Mode scene |  | 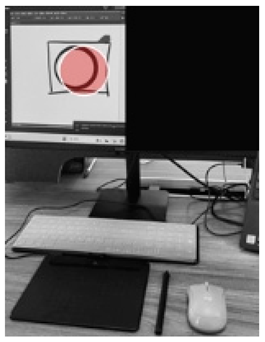 | 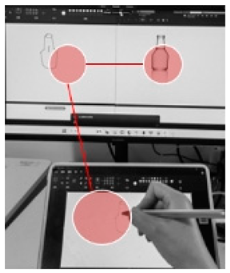 | 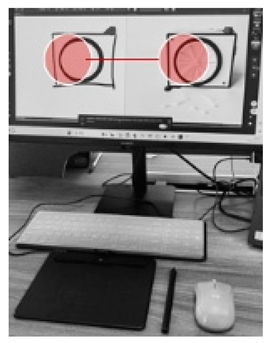 |
| Setting | Cross-screen mask | Non-cross-screen mask | Cross-screen, non-mask | Non-cross-screen, non-mask |
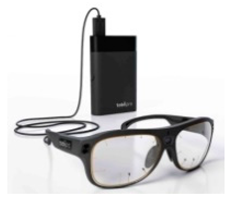
| Tobii glass2 | Dell Computer Monitor | Lenovo Laptop | MatePad Tablet | Wacom Touchpad |
|---|---|---|---|---|
 |  |  |  |  |
| Issue | Correction Line Total Correlation (CITC) | Deleted α | Cronbach α |
|---|---|---|---|
| I think I am good at coming up with novel ideas | 0.653 | 0.451 | 0.635 |
| I am confident in my creative problem-solving skills | 0.452 | 0.539 | |
| I have tricks to further add to the AI ideas | 0.176 | 0.794 | |
| I am good at finding new ways to solve problems | 0.564 | 0.475 |
| KMO | 0.676 | |
|---|---|---|
| Bartlett Sphericity Inspection | approximate chi-square (math.) | 28.888 |
| df | 6 | |
| p | 0.000 | |
| Grouping (Cross-Screen 01, Non-Cross-Screen 02) Median M (P25, P75) | Mann–Whitney Test Statistic U Worth | Mann–Whitney Test Statistic z Worth | p | ||
|---|---|---|---|---|---|
| 1.0 (n = 30) | 2.0 (n = 28) | ||||
| 1. I think I am good at coming up with novel ideas | 5.000 (5.0,5.0) | 5.000 (4.3,6.0) | 361.000 | −1.043 | 0.297 |
| 2. I am confident in my creative problem-solving skills | 5.000 (4.0,5.3) | 5.000 (4.3,6.0) | 339.500 | −1.318 | 0.187 |
| 3. I have tricks to further add to the AI ideas | 5.000 (4.0,5.0) | 5.000 (5.0,6.0) | 294.500 | −2.041 | 0.041 |
| 4. I am good at finding new ways to solve problems | 5.000 (4.8,5.0) | 5.000 (4.3,5.8) | 404.000 | −0.272 | 0.785 |
Disclaimer/Publisher’s Note: The statements, opinions and data contained in all publications are solely those of the individual author(s) and contributor(s) and not of MDPI and/or the editor(s). MDPI and/or the editor(s) disclaim responsibility for any injury to people or property resulting from any ideas, methods, instructions or products referred to in the content. |
© 2024 by the authors. Licensee MDPI, Basel, Switzerland. This article is an open access article distributed under the terms and conditions of the Creative Commons Attribution (CC BY) license (https://creativecommons.org/licenses/by/4.0/).
Share and Cite
Pei, Y.; Wang, L.; Xue, C. Human–AI Co-Drawing: Studying Creative Efficacy and Eye Tracking in Observation and Cooperation. Appl. Sci. 2024, 14, 8203. https://doi.org/10.3390/app14188203
Pei Y, Wang L, Xue C. Human–AI Co-Drawing: Studying Creative Efficacy and Eye Tracking in Observation and Cooperation. Applied Sciences. 2024; 14(18):8203. https://doi.org/10.3390/app14188203
Chicago/Turabian StylePei, Yuying, Linlin Wang, and Chengqi Xue. 2024. "Human–AI Co-Drawing: Studying Creative Efficacy and Eye Tracking in Observation and Cooperation" Applied Sciences 14, no. 18: 8203. https://doi.org/10.3390/app14188203
APA StylePei, Y., Wang, L., & Xue, C. (2024). Human–AI Co-Drawing: Studying Creative Efficacy and Eye Tracking in Observation and Cooperation. Applied Sciences, 14(18), 8203. https://doi.org/10.3390/app14188203