Abstract
Body balancing is a complex task that includes the coordination of muscles, tendons, bones, ears, eyes, and the brain. Imbalance or disequilibrium is the inability to maintain the center of gravity. Perpetuating body balance plays an important role in preventing us from falling or swaying. Biomechanical tests and video analysis can be performed to analyze body imbalance. The musculoskeletal system is one of the fundamental systems by which our balance or equilibrium is sustained and our upright posture is maintained. Electromyogram (EMG) and ground reaction force (GRF) monitoring can be utilized in cases where a rapid response to body imbalance is a necessity. Body balance also depends on visual stimuli that can be either real or virtual. Researchers have used virtual reality (VR) to predict motion sickness and analyze heart rate variability, as well as in rehabilitation. VR can also be used to induce body imbalance in a controlled way. In this research, body imbalance was induced in a controlled way by playing an Oculus game and, simultaneously, EMG and GRF were recorded. Features were extracted from the EMG and were then fed to a machine learning algorithm. Several machine learning algorithms were tested and upon 10-fold cross-validation; a minimum accuracy of 71% and maximum accuracy of 98% were achieved by Gaussian Naïve Bayes and Gradient Boosting classifiers, respectively, in the classification of imbalance and its intensities. This research can be incorporated into various rehabilitative and therapeutic systems.
1. Introduction
Worldwide, falls rank as the second most common cause of fatal accidental injuries. Over 80% of the 684,000 people who die from falls worldwide each year do so in low- and middle-income nations. Most fatal falls occur in adults over the age of 60. Every year, 37.3 million falls happen that are serious enough to need medical care [1,2]. Body balance, also called body equilibrium, is the ability of our body to perpetuate the center of gravity, making our daily life tasks easier to perform and protecting us from injuries. Body equilibrium is maintained through the coordination of complex sensory and motor systems, also called sensorimotor systems [3]. The intricate connections between different sensory inputs, central nervous system processing, and motor responses are part of the sensorimotor systems that keep the body balanced. These systems include the somatosensory system, which incorporates proprioceptors in muscles and joints to provide input on body position; the visual system, which provides spatial orientation; and the vestibular system, which senses head position and movement. While the central nervous system combines sensory data and produces motor orders, the muscular system, especially in the lower limbs and core, reacts to signals from the neurological system [3,4]. Balance is influenced by proprioception and reflexes, and the cerebellum is essential for motor coordination. The proper operation of these elements is guaranteed by the postural control system, which enables people to adapt and stay stable while engaging in a variety of activities. Dysfunction in any of these systems can lead to balance disorders and an increased risk of falls [5].
Electromyography is a method to acquire the electrical activity of muscles, named an electromyogram or EMG. EMG gives crucial insights about the activation patterns of the muscles that contribute to maintaining body balance. Those activation patterns can be monitored using both invasive and non-invasive techniques. Needle electrodes are used in invasive monitoring of EMG, limited to specific motor units, causing pain and discomfort, which may later cause an infection [6]. On the other hand, surface electrodes are easier to apply on the skin and cover a larger area of muscle from the surface. Noise can be effectively removed using filters specific to EMG [7,8]. The use of needle electrodes may cause injury during studies related to human movements [9]. Therefore, using surface electrodes to acquire EMG is the optimal option for conducting studies related to body balancing and movements. By using EMG, one can evaluate muscle activity and neuromuscular control, which is important for determining how the body stabilizes and interacts with imbalance stimuli [8,10,11].
Artificial imbalance can be engineered to replicate real-world conditions, supporting studies on balance problems, sports training, and rehabilitation [12,13,14]. By using virtual spaces to stimulate the sensory and motor systems, people may adjust and enhance their reactions to balance in a supervised and safe environment [15]. This use of VR has the potential to improve postural control evaluation, balance rehabilitation methods, and our knowledge of how the human body adjusts to controlled imbalance situations [16,17,18]. Ground reaction force (GRF) provides information on the strength and direction of forces applied to the ground during actions like walking and standing. Force platforms can be used to estimate the center of pressure (COP) using the values of GRF [19,20]. It can be used along with a head-mounted display to evaluate the changes in COP due to visual stimuli, induced virtually [21,22,23]. It has been observed that using surfacing electromyogram (sEMG) signals along with the data from mechanical sensors improves the overall accuracy of the study compared to using only mechanical sensor data [24]. EMG-powered prosthetics are widely used in the field of rehabilitation. They can be used to control lower limb prosthetics independent of the gait phase [25]. Features extracted from EMG are also being used for classification purposes of locomotion modes and gait phases with the application of machine and deep learning techniques [26,27]. An average accuracy of 87.4% was achieved using artificial neural networks in the classification of stance and swing phases based on EMG signals [28].
In a study, wearing a head-mounted display (HMD) and watching one of the three scenes in a randomized order, participants completed four standing activities in three distinct situations. During their standing duties, they had to keep their arms at their sides and try their best to maintain their stability. A virtual reality-based tracker placed in the lumbar region was used to capture the body wobble. When performing tandem and one-leg standing tasks, the effects of visual sights on postural stability interact considerably. During these tasks, there are larger sway parameters in the VrS and BS conditions compared to the RS condition and lower BS/VrS ratios compared to BS/RS ratios [29]. Similarly, in another study, when the virtual moving room traversed in the participant’s direction and caused an unanticipated movement, it caused noticeably more postural sway than when it moved in the opposite direction and caused an expected movement. The results of the investigation showed a considerable improvement in confidence in balancing without simulator sickness and with genuine immersion. The virtual moving room may create a lifelike virtual reality experience without hurting confidence in balancing or generating VR simulator sickness [30].
To create a VR environment that consistently illustrates the reweighting of sensory information across the vestibular, somatosensory, and visual systems, Virtual Reality Comprehensive Balance Assessment and Training (VR-ComBAT) was used. VR-ComBAT can identify multidirectional shifts in young, healthy participants’ postural control in terms of the center of pressure (COP) under various circumstances. To detect the displacement and velocity of COP, VR-ComBAT is composed of a head-mounted device with integrated VR, two VR tracking sensors, and a force plate connected to the VR headset. For every VR-ComBAT exercise, participants were instructed to tread on the force plate or the foam surface and hold their posture. The study’s objectives were to evaluate VR-ComBAT’s safety, sensation of presence, system use, and face validity in young, healthy subjects [31]. In another study, automated terrain classification in lower limb rehabilitation systems was presented using both the EMG and GRF signals to achieve a high accuracy of 96.8%. The researchers collected EMG and GRF signals from ten healthy subjects and extracted 21 statistical features. A support vector machine (SVM) machine learning model was used for the application of smart neuromuscular-mechanical fusion and machine learning-based terrain classification techniques [32].
Hence, from [27,28,29,30,31,32], a clear research gap can be observed in terms of monitoring GRF and EMG while inducing controlled body imbalance in an immersive environment and then classifying the body imbalance intensity into low, medium, and high. Therefore, using Oculus Quest 2 to induce controlled body imbalance and establish an immersive environment, as well as using a force platform and BIOPAC MP 36 to record resulting variations in the GRF and EMG signals and classify body imbalance and its intensities using machine learning techniques, was considered an optimal option to fill that research gap. Machine learning techniques are used to classify body imbalance into low, medium, and high intensities.
2. Materials and Methods
2.1. Participants
Students at Air University were the participants in this research. A formal consent form was filled out by each participant before data collection. Data were collected from a total of six students. All six of the students were male and aged between 20 and 23 years without any previous history of neuromuscular disorder. They had never undergone balance testing before, ensuring unbiased data collection. The participants were first told about the use of Oculus and its controllers to play the game, electrode placement for recording EMG, and the position of the feet while standing on the force platform to record GRF. Only healthy participants were included in this study by monitoring their physiological parameters like blood pressure, oxygen saturation, and heart rate before starting the data collection. They participants also did not have any hair on their skin to make sure that the EMG signal was free of noise. Participants with a history of psychological problems and general health issues were excluded. As mentioned in Table 1, only participants who had normal values of physiological parameters like blood pressure, oxygen saturation, and heart rate, without any previous history medical complications, were included.

Table 1.
Physiological parameters’ range for inclusion criteria of participants for the data collection.
2.2. Experimental Setup
The BIOPAC MP 36 system was utilized in the investigation to obtain thorough electromyograms (EMGs) from both legs. Surface electrodes were placed on the vastus lateralis muscles of both legs to acquire EMG signals of the left and right legs. Ground reaction force (GRF) measurements were simultaneously acquired with the PASCO force platform. GRFs of both sides of the legs were added up, resulting in only two GRFs, i.e., left leg GRF and right leg GRF. With Oculus Quest 2, immersive settings that induce body imbalance were produced. For this purpose, the Epic Roller Coasters game was selected to induce body imbalance in a controlled way. Figure 1 shows the experimental setup of this research.
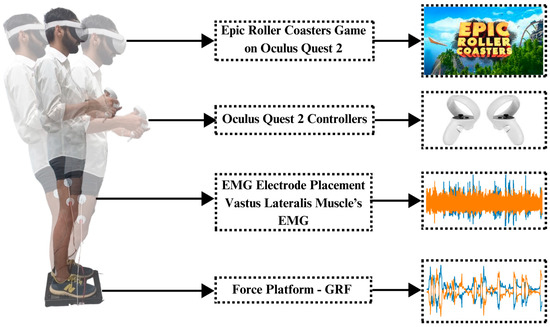
Figure 1.
Experimental setup and paradigm: The subject first stands on the force platform, keeping the distance equal by maintaining the center of gravity. Electrodes are placed on the vastus lateralis muscle of both legs to record EMG signals. Oculus Quest 2 is worn on the head of the subject and controllers are given in the hands of the subject. Controllers are used to control the roller coaster ride in a virtual environment; meanwhile, EMG and GRF are recorded simultaneously using the BIOPAC MP 36 (BIOPAC Systems, Inc., Goleta, CA, USA) and PASCO force platform (PASCO Scientific, Roseville, CA, USA), respectively.
2.3. Procedure
A thorough briefing about the paradigm of the study was given to the participants before starting data collection. The participants were also first given training to use Oculus Quest 2. The Epic Roller Coasters game was used to create controlled body imbalance, and while participants were performing the activities that caused the imbalance, real-time EMG and GRF responses were being collected. The virtual roller coaster ride was very effective in inducing imbalance in the participant’s body as well as ensuring his safety as the controllers were in the hands of the participant; hence, the entire game could be terminated whenever he wanted based on his comfort level. Figure 2 shows the complete workflow of this research.
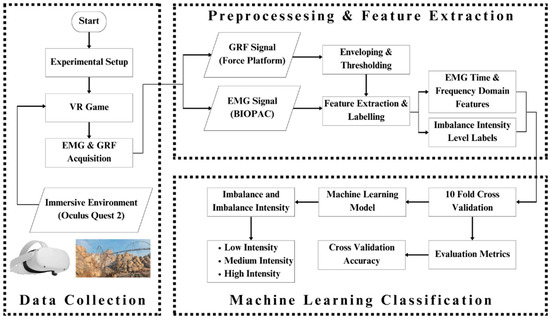
Figure 2.
Complete graphical representation of this research: The whole paradigm of the study has been pictorially represented here. The subject wears the Oculus Quest 2 to play the Epic Roller Coasters game; meanwhile, his EMG and GRF signal for each leg are recorded using BIOPAC MP 36 and PASCO force platform. The acquired data are processed to extract features out of the signals and give them labels. The features and labels are fed to the machine learning classifiers, which classify the body imbalance intensities as high, medium, and low using the EMG and GRF signals. The performance of classifiers is evaluated and compared.
2.4. Data Collection
Throughout the controlled imbalance activities, the targeted lower limb muscles’ EMGs were recorded and compared. Amongst the anterior, posterior, and lateral muscles of the thigh, lateral muscles contribute more towards stabilizing the body during body imbalance. It was observed that the vastus lateralis muscle, the lateral thigh muscle, also had the maximum amplitude of EMG compared to the other muscles of the lower limb, like the gastrocnemius, tibialis anterior, and peroneus muscles. Simultaneously, GRF data were recorded to examine the forces applied to the ground in body imbalance while the participant was playing the virtual game in an immersive environment. The participants played the virtual game for 5 min, or 300 s. It has been observed that the participants gained more control over their body balance in the last one-and-a-half minutes of the gameplay. The BIOPAC MP 36 was set in a frequency range of 30–1000 Hz to acquire the EMG signals from the vastus lateralis muscle of both legs. Also, a band stop or notch filter of 50 Hz was configured in the software to reduce the power line noise. The EMG signals from BIOPAC MP 36 were acquired at a sampling rate of 1000 Hz. GRF signals were acquired using the PASCO force platform at a sampling rate of 1000 Hz, as shown in Figure 3.
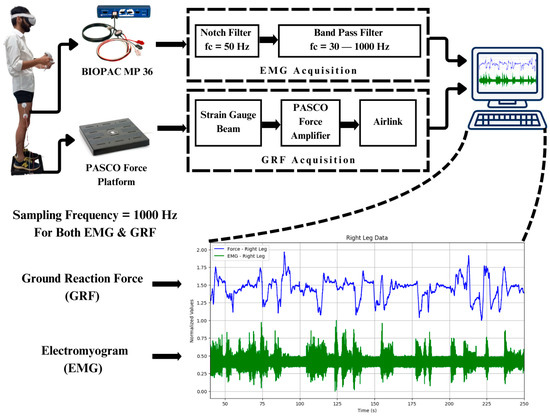
Figure 3.
Data acquisition and filtration: Digital filters of BIOPAC MP 36 are used to filter the EMG signals. The sampling rate of both the BIOPAC MP 36 and PASCO force platform is 1000 Hz.
2.5. Virtual Reality Setup
An immersive virtual world was established using Oculus Quest 2, which also served as a platform for creating regulated body imbalance using the Rock Falls mode of a game named Epic Roller Coasters, as shown in Figure 4. This arrangement made it possible to precisely control the sensory input, closely mimicking actual situations to observe participants’ responses [33].

Figure 4.
Virtual reality immersion: Oculus Quest 2 by Meta is used to create a virtual reality immersive environment for the subject. The game named Epic Roller Coasters is used to make the subject lose his balance in a controlled way. The mode of this game is Rock Falls.
2.6. Feature Extraction
Firstly, the acquired EMG and GRF signals of both legs were normalized [34,35,36]. Both time and frequency domain features were extracted. GRF was used for thresholding the imbalance intensities into low imbalance, medium imbalance, and high imbalance. It can be seen in Figure 5 that both the EMG and GRF change whenever the participant is subjected to induced body imbalance.
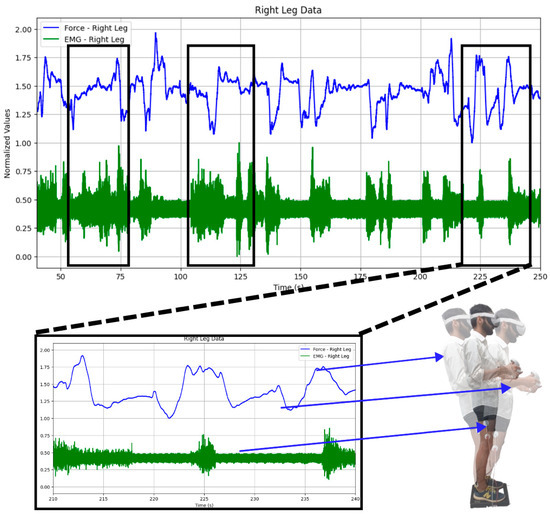
Figure 5.
Changes observed in both the GRF and EMG: While playing the virtual reality game, changes in the GRF and EMG signals can be observed. It can also be observed that both signals vary when the subject sways in any direction, like forward or backward, or when they are still.
Epochs of 2 s were formed and both EMG and GRF were plotted in the process of making an envelope. Six features were extracted for each leg, namely mean, standard deviation, skewness, kurtosis, dominant frequency, and force envelope.
2.6.1. Mean
It is important to find the mean value as it gives insights into the central point of the data. The mean value of the EMG was calculated for each epoch having a time duration of 2 s. The mean value of EMG can be calculated by adding up all the values of EMG in the epoch and dividing it by the total number of the values. Mathematically, mean μ can be calculated as
where Xi is the value of EMG and N is the total number of sample values.
2.6.2. Standard Deviation
Standard deviation shows the variation from the central mean point of the data. It tells us about the dispersion of data concerning the mean. Mathematically, standard deviation σ can be calculated as
where Xi is the value of EMG, μ is the mean value, and N is the total number of sample values.
2.6.3. Skewness
Skewness is the measure of asymmetry within a dataset. Skewness shows the horizontal spread of the data in a normal distribution. It can be calculated as
where Xi is the value of EMG, μ is the mean value, σ is the standard deviation, and N is the total number of sample values.
2.6.4. Kurtosis
Kurtosis shows the normal distribution of data around the mean values. It also refers to the vertical spread of the data in a normal distribution. It can be calculated as
where Xi is the value of EMG, μ is the mean value, σ is the standard deviation, and N is the total number of sample values.
2.6.5. Dominant Frequency
The frequency with maximum energy amongst all the frequencies present in the power spectrum is called the dominant frequency of a signal. We can easily find the dominant frequency by taking the Fourier transform of the time domain signal and then comparing the values of the energies of different frequencies.
2.6.6. Force Envelope
Force envelopes were calculated using the root mean square values of the GRF data. Force envelope (FE) can be calculated as
where GRF is the value of ground reaction force and N is the total number of sample values.
2.7. Machine Learning Classification
After preprocessing and feature extraction, EMG signals can be used for classification through the application of different machine learning classifiers [37]. GRF and EMG data were processed to extract features, and machine learning techniques were used to classify imbalance and its intensity, as shown in Figure 6. K-fold cross-validation is an important method to evaluate the performance of machine learning classifiers. It shows how well the classifiers perform on unseen data. In this study, 10-fold cross-validation was used to assess the accuracy of the trained machine learning model.
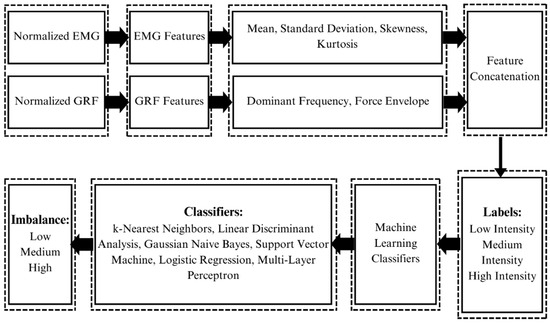
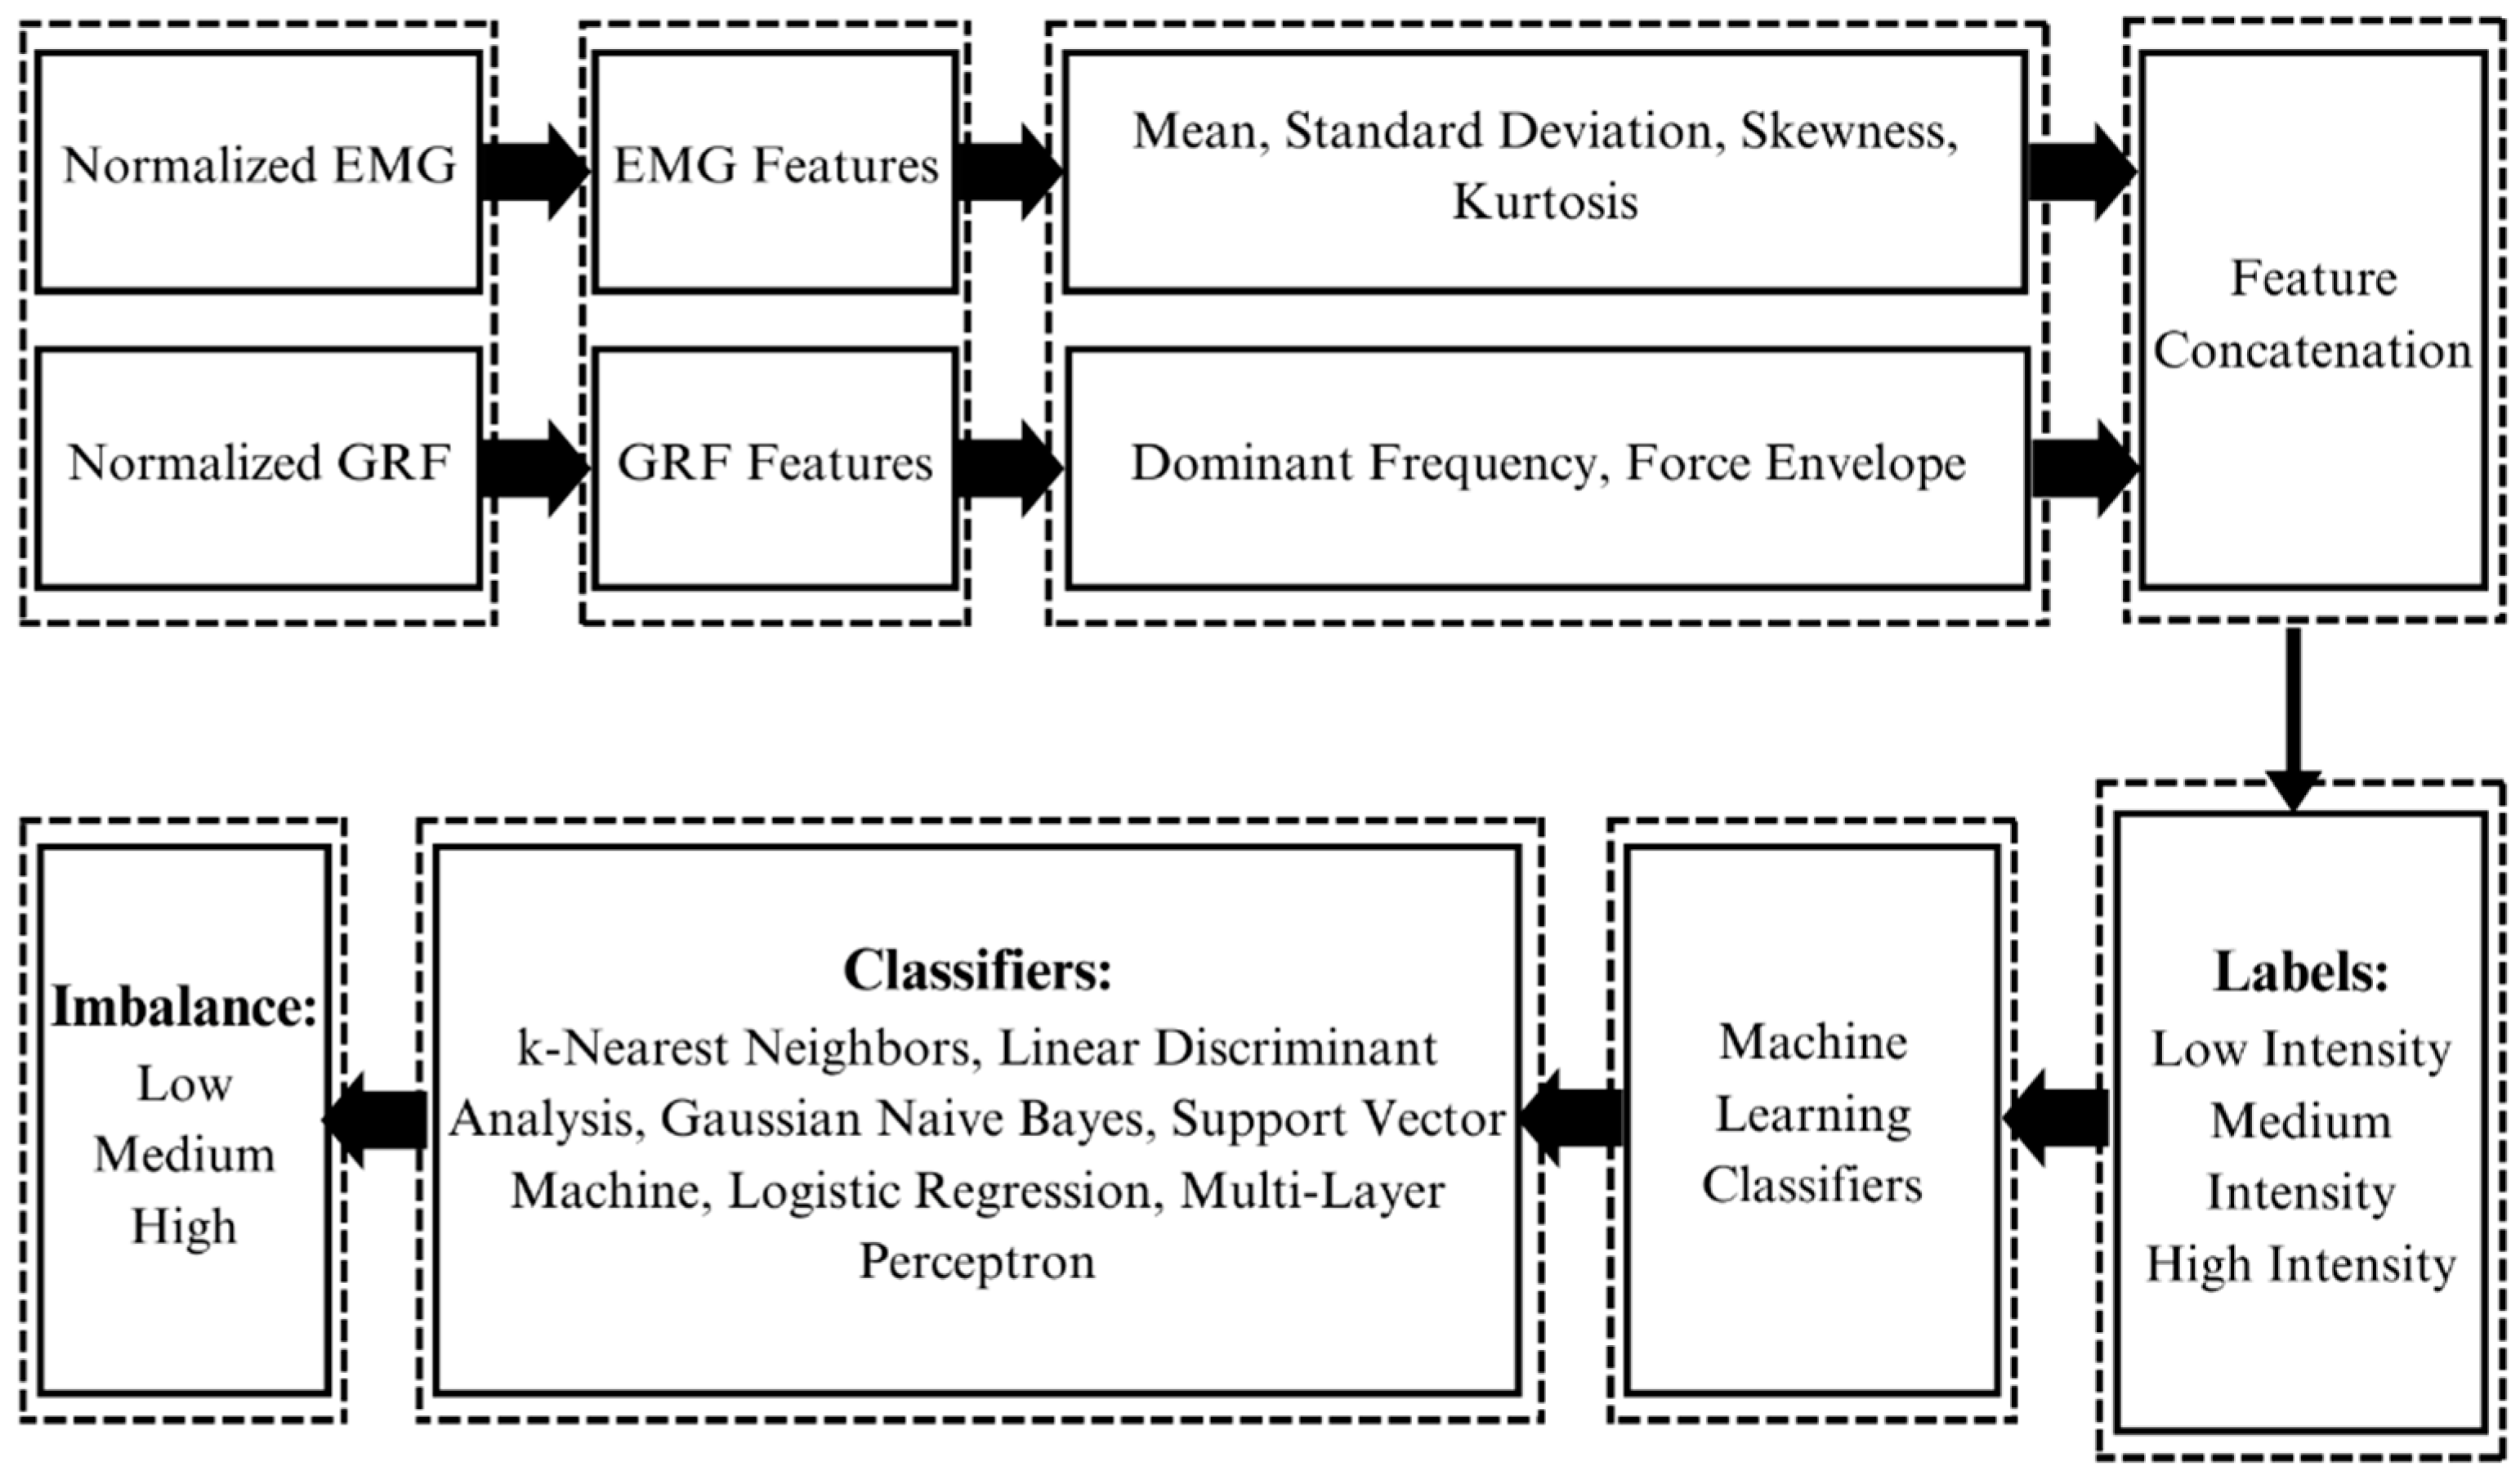
Figure 6.
Feature extraction and machine learning classification: Signals of both modalities, i.e., EMG and GRF, are first normalized. Features are extracted from both signals. Features extracted from EMG are the mean, standard deviation, skewness, and kurtosis. Features extracted from GRF are dominant frequency and force envelope. Features of both modalities are concatenated after extraction along with their labels, i.e., high, medium, and low intensities. Features and labels are then fed to the machine learning classifiers which classify the body imbalance intensities into high, medium, and low using the GRF and EMG signals of the subject.
The opted methodology has been proven to be very effective in the classification of body imbalance and its intensities into low, medium, and high. The results showed this method to have the potential to be integrated into various real-time systems in the domains of rehabilitation, sports medicine, physical therapy, and gaming.
3. Results
3.1. Power Spectral Analysis of EMG
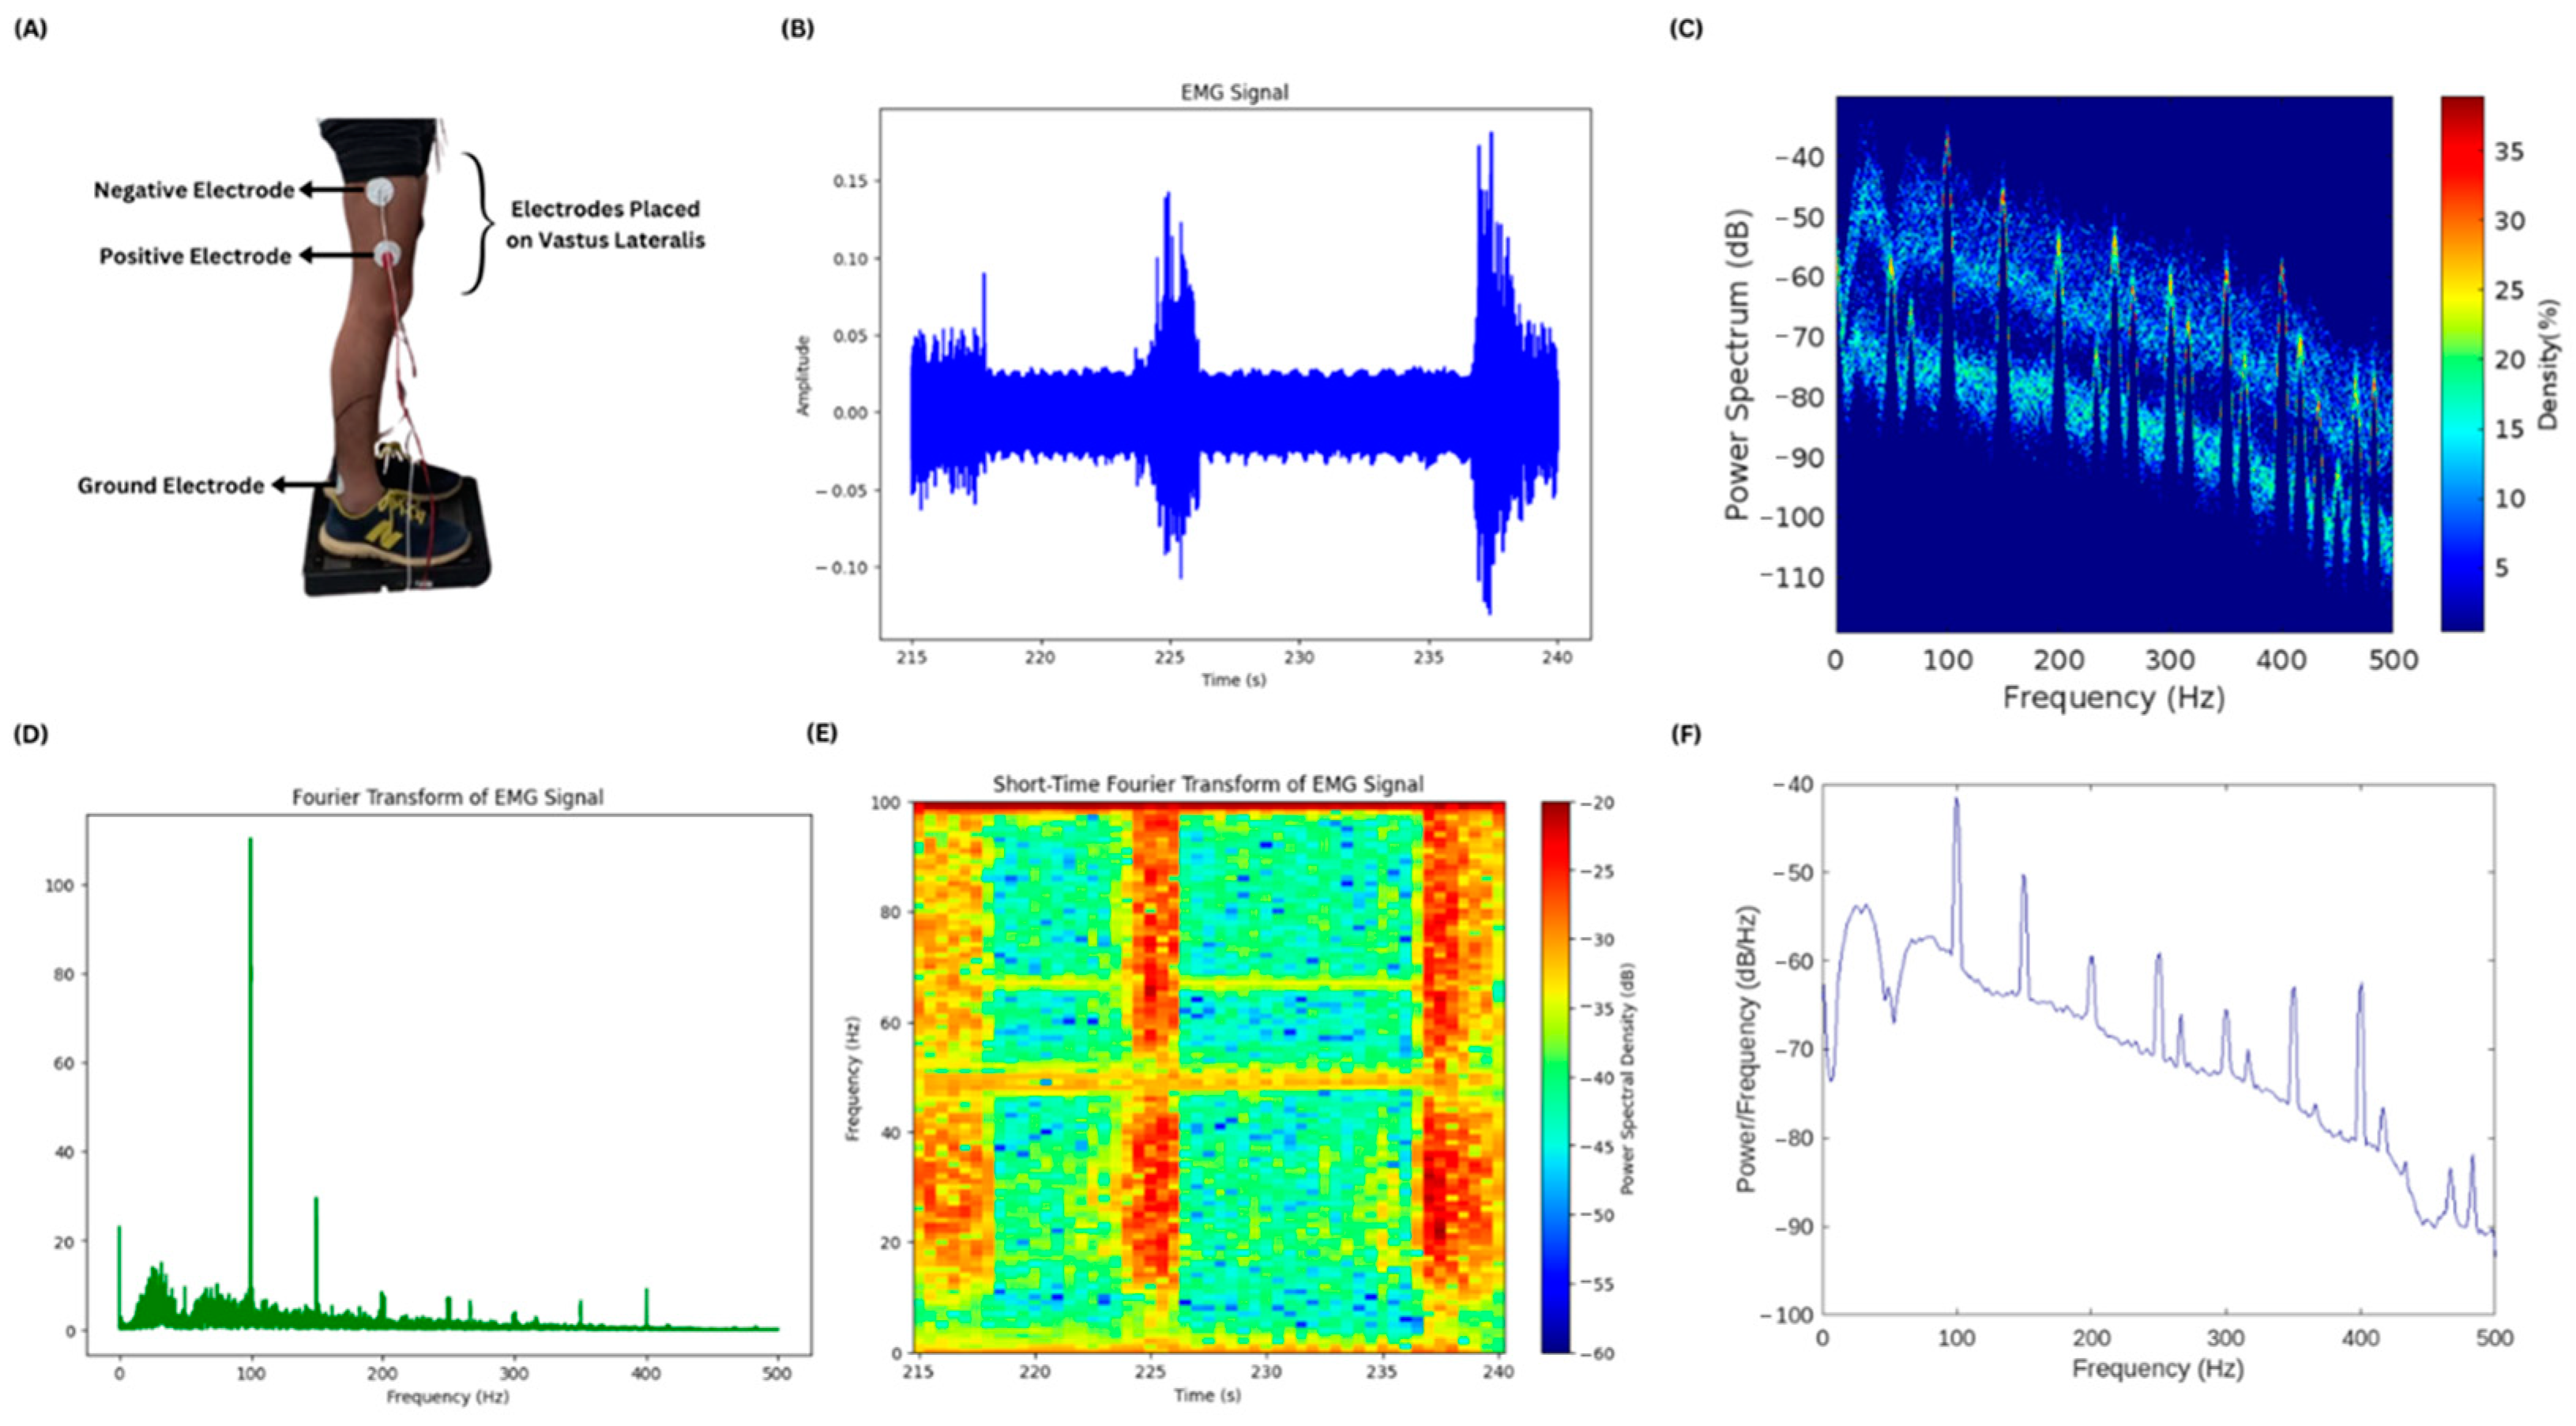
EMG of different muscles of the lower limbs was acquired for testing the muscles that respond with high amplitudes during body imbalance. Four of the muscles were tested, namely vastus lateralis, gastrocnemius, tibialis anterior, and peroneus muscles. It was observed that the vastus lateralis produced EMG signals with high amplitude. The electrode placement, i.e., positive, negative, and ground, is shown in Figure 7A while the subject is standing on the PASCO force platform and electrode leads are connected to the BIOPAC MP 36. A small chunk of the EMG signal is shown in Figure 7B, showing the activity of the vastus lateralis muscle of one of the lower limbs of the subject. Figure 7C–F show the results of different frequency and power spectral analysis techniques, providing insights into the power spectrum and its density of the time domain EMG signal as well as the frequency components of the signal contributing the most during the body imbalance.
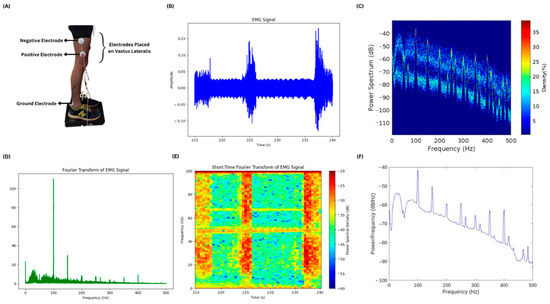
Figure 7.
EMG acquisition and power spectral analysis: (A) The electrode placement at the vastus lateralis muscle to acquire EMG is illustrated. The ground electrode is placed near the ankle of the subject. (B) A small chunk of the acquired EMG signal is plotted. There is time in seconds on the x-axis and amplitude in millivolts on the y-axis. (C) The plot shows the power spectrum and its density mapped against the frequency values of the entire EMG signal. (D) This is a fast Fourier transform plot of the entire EMG signal showing the frequency components in the EMG signal and their magnitudes. (E) Short-Time Fourier Transform of the small chunk of EMG signal is illustrated in the figure. It has frequency and power spectral density plotted against the time in seconds. The high-power spectral density during the action of the vastus lateralis muscle is shown in red color and the low density is shown in blue color. (F) A plot without color mapping is shown in the figure, having the values of power per frequency component plotted against the frequency.
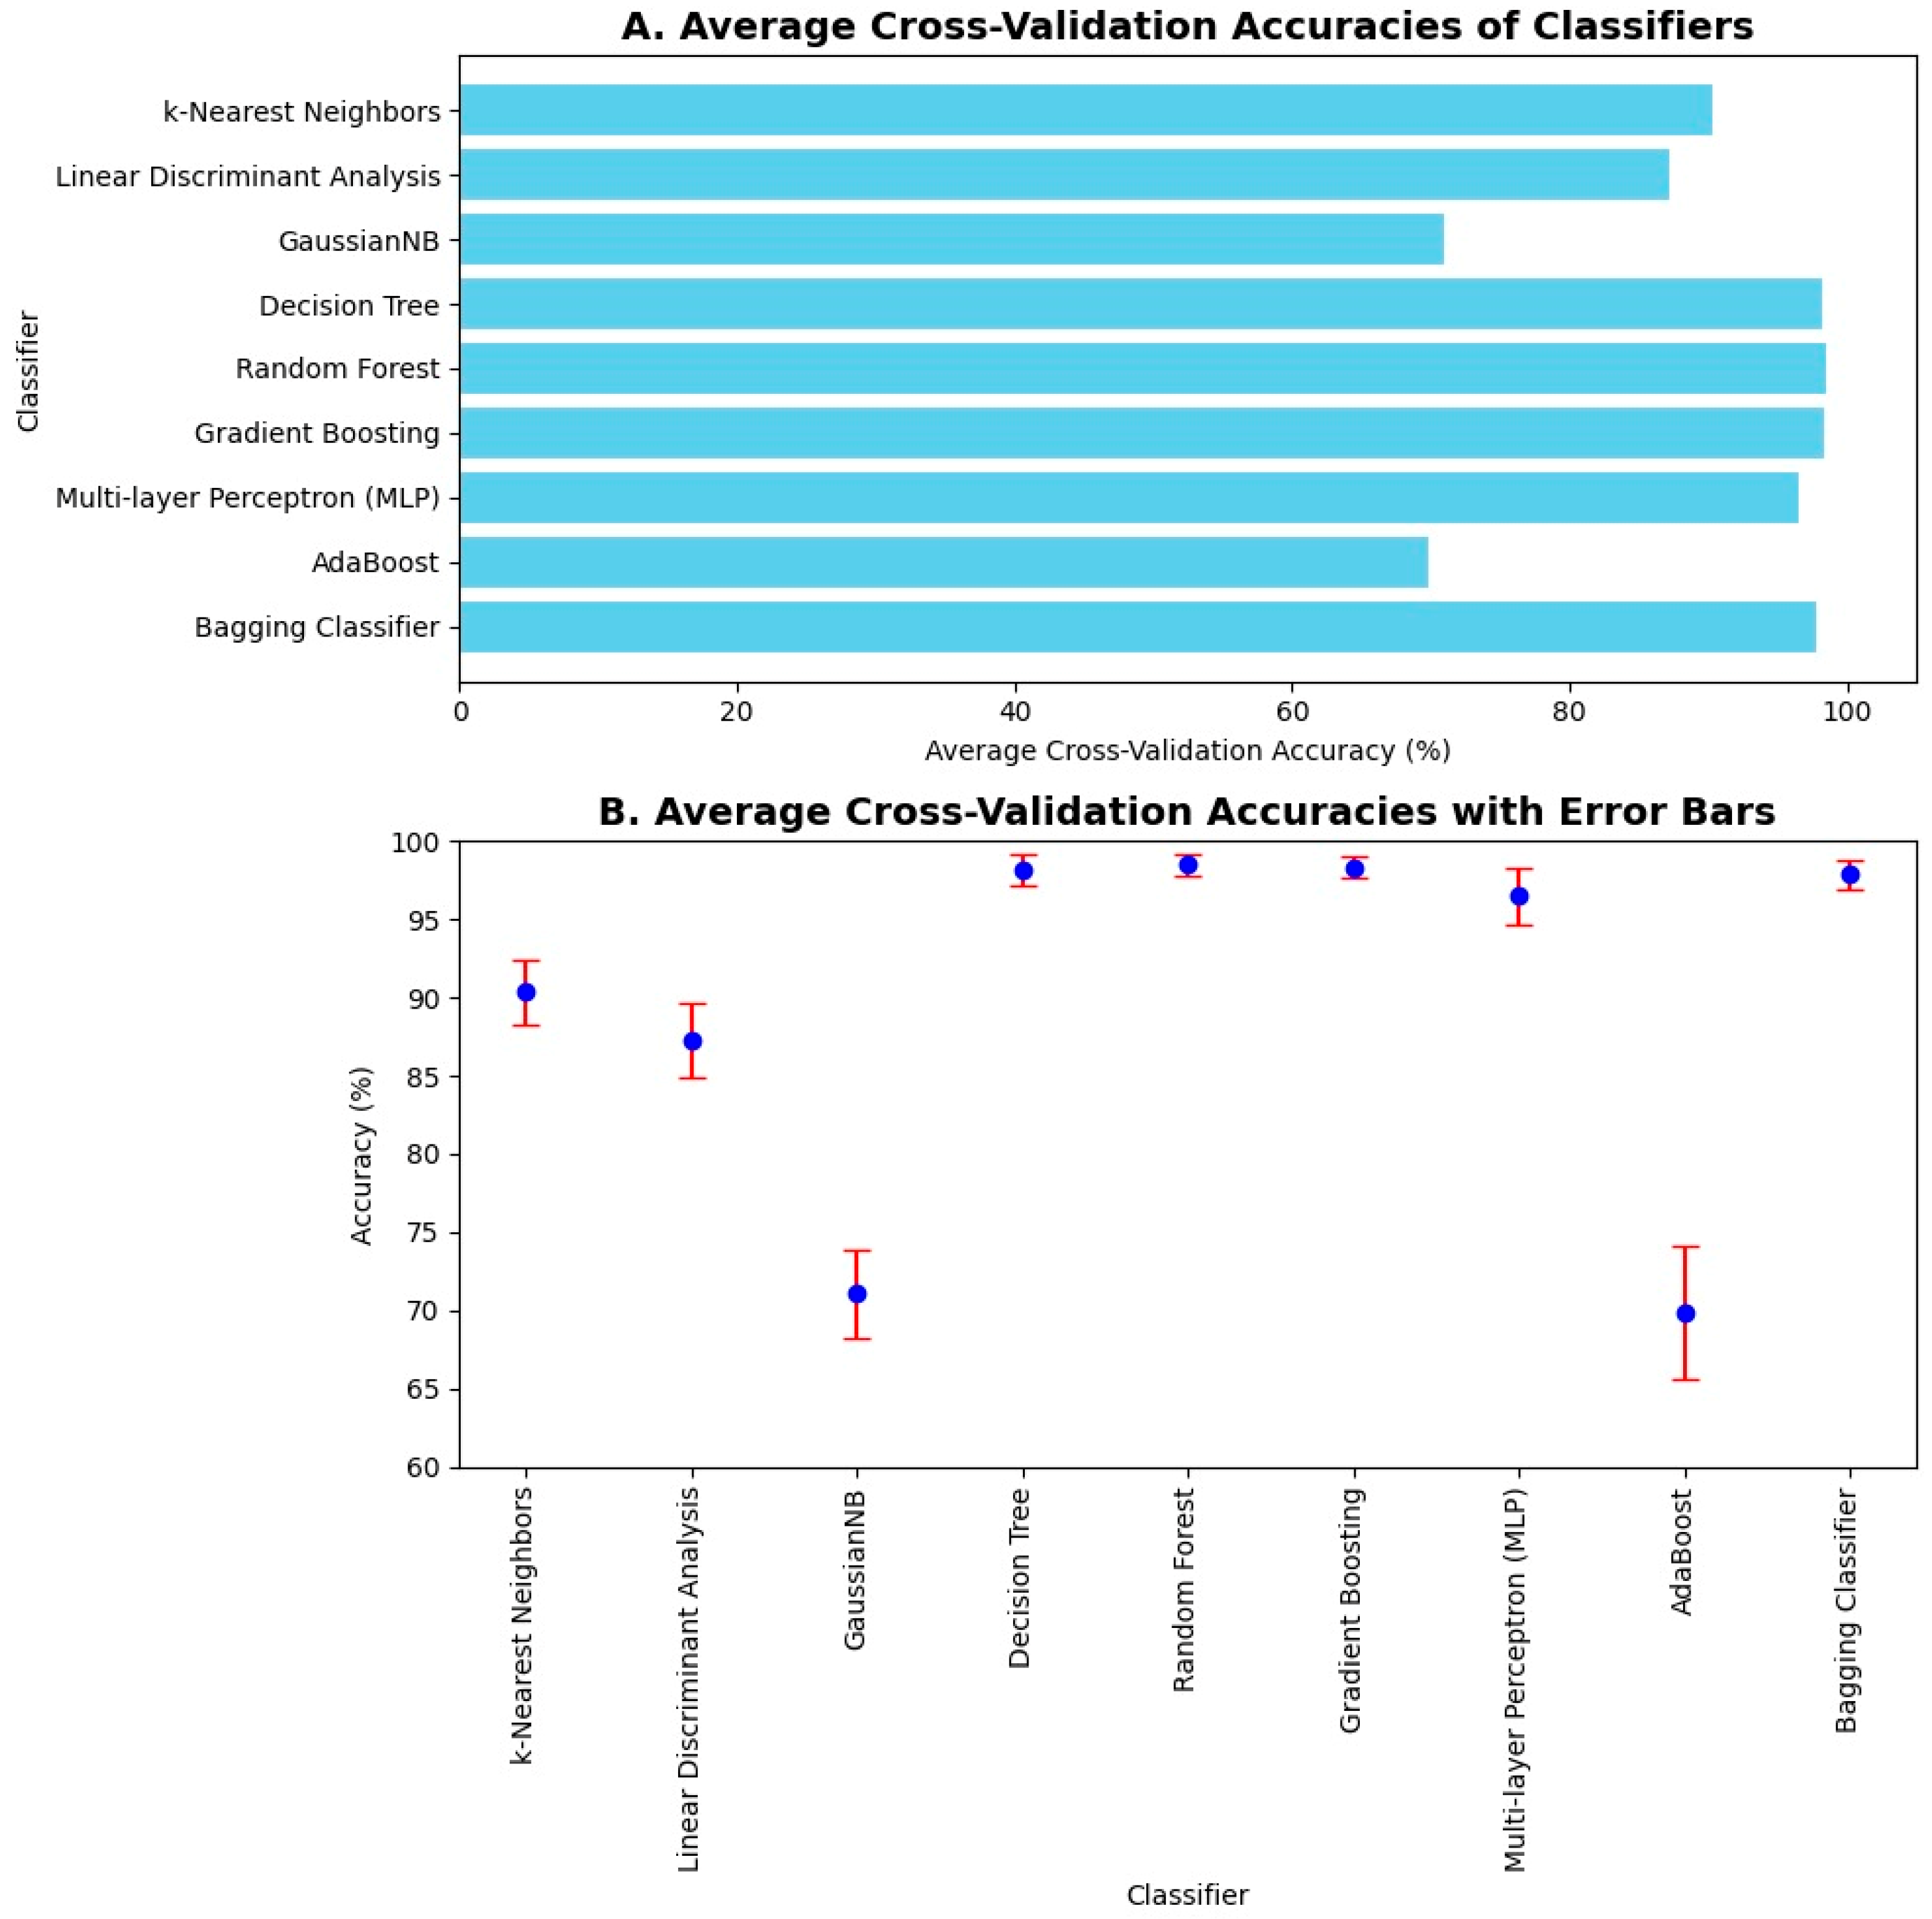
3.2. Ten-Fold Cross Validation
The average 10-fold cross-validation accuracies were computed. K-fold cross-validation is one of the methods to validate the results, as it shows how well the classifier performs on unseen data. Hence, its average accuracy holds importance by showing that the trained model performs well on both the seen and unseen data effectively. The average 10-fold cross-validation accuracies are shown in Figure 8A. Upon 10-fold cross-validation, accuracy of 90%, 87%, 71%, 97%, 98%, 98%, 96%, 69%, and 97% was achieved by k-Nearest Neighbor, Linear Discriminant Analysis, Gaussian Naïve Bayes, Decision Tree, Random Forest, Gradient Boosting, Multilayer Perceptron, AdaBoost, and Bagging classifiers, respectively, in the classification of imbalance and its intensities. The error bars were used to plot the standard deviation of the classifiers in computing average 10-fold cross-validation accuracy. It shows the variation in the data and measures the uncertainty or error in the results. Hence, it can be seen in Figure 8B that the error in computation is negligible in the case of Decision Tree, Random Forest, Gradient Boosting, and Bagging classifiers.
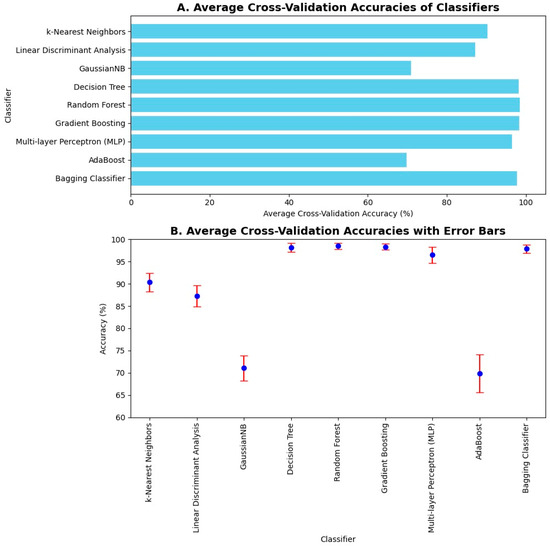
Figure 8.
Average 10-fold cross validation accuracies and error bars: (A) Average cross-validation accuracies of machine learning classifiers are illustrated in a bar chart. The highest 10-fold cross-validation accuracies are achieved by Decision Tree, Random Forest, Gradient Boosting, AdaBoost, and Bagging classifiers. (B) Average cross-validation accuracies are illustrated along with their error bars. Error is negligible in the case of Naïve Bayes, Decision Tree, Random Forest, Gradient Boosting, AdaBoost, and Bagging classifiers.
3.3. Confusion Matrices
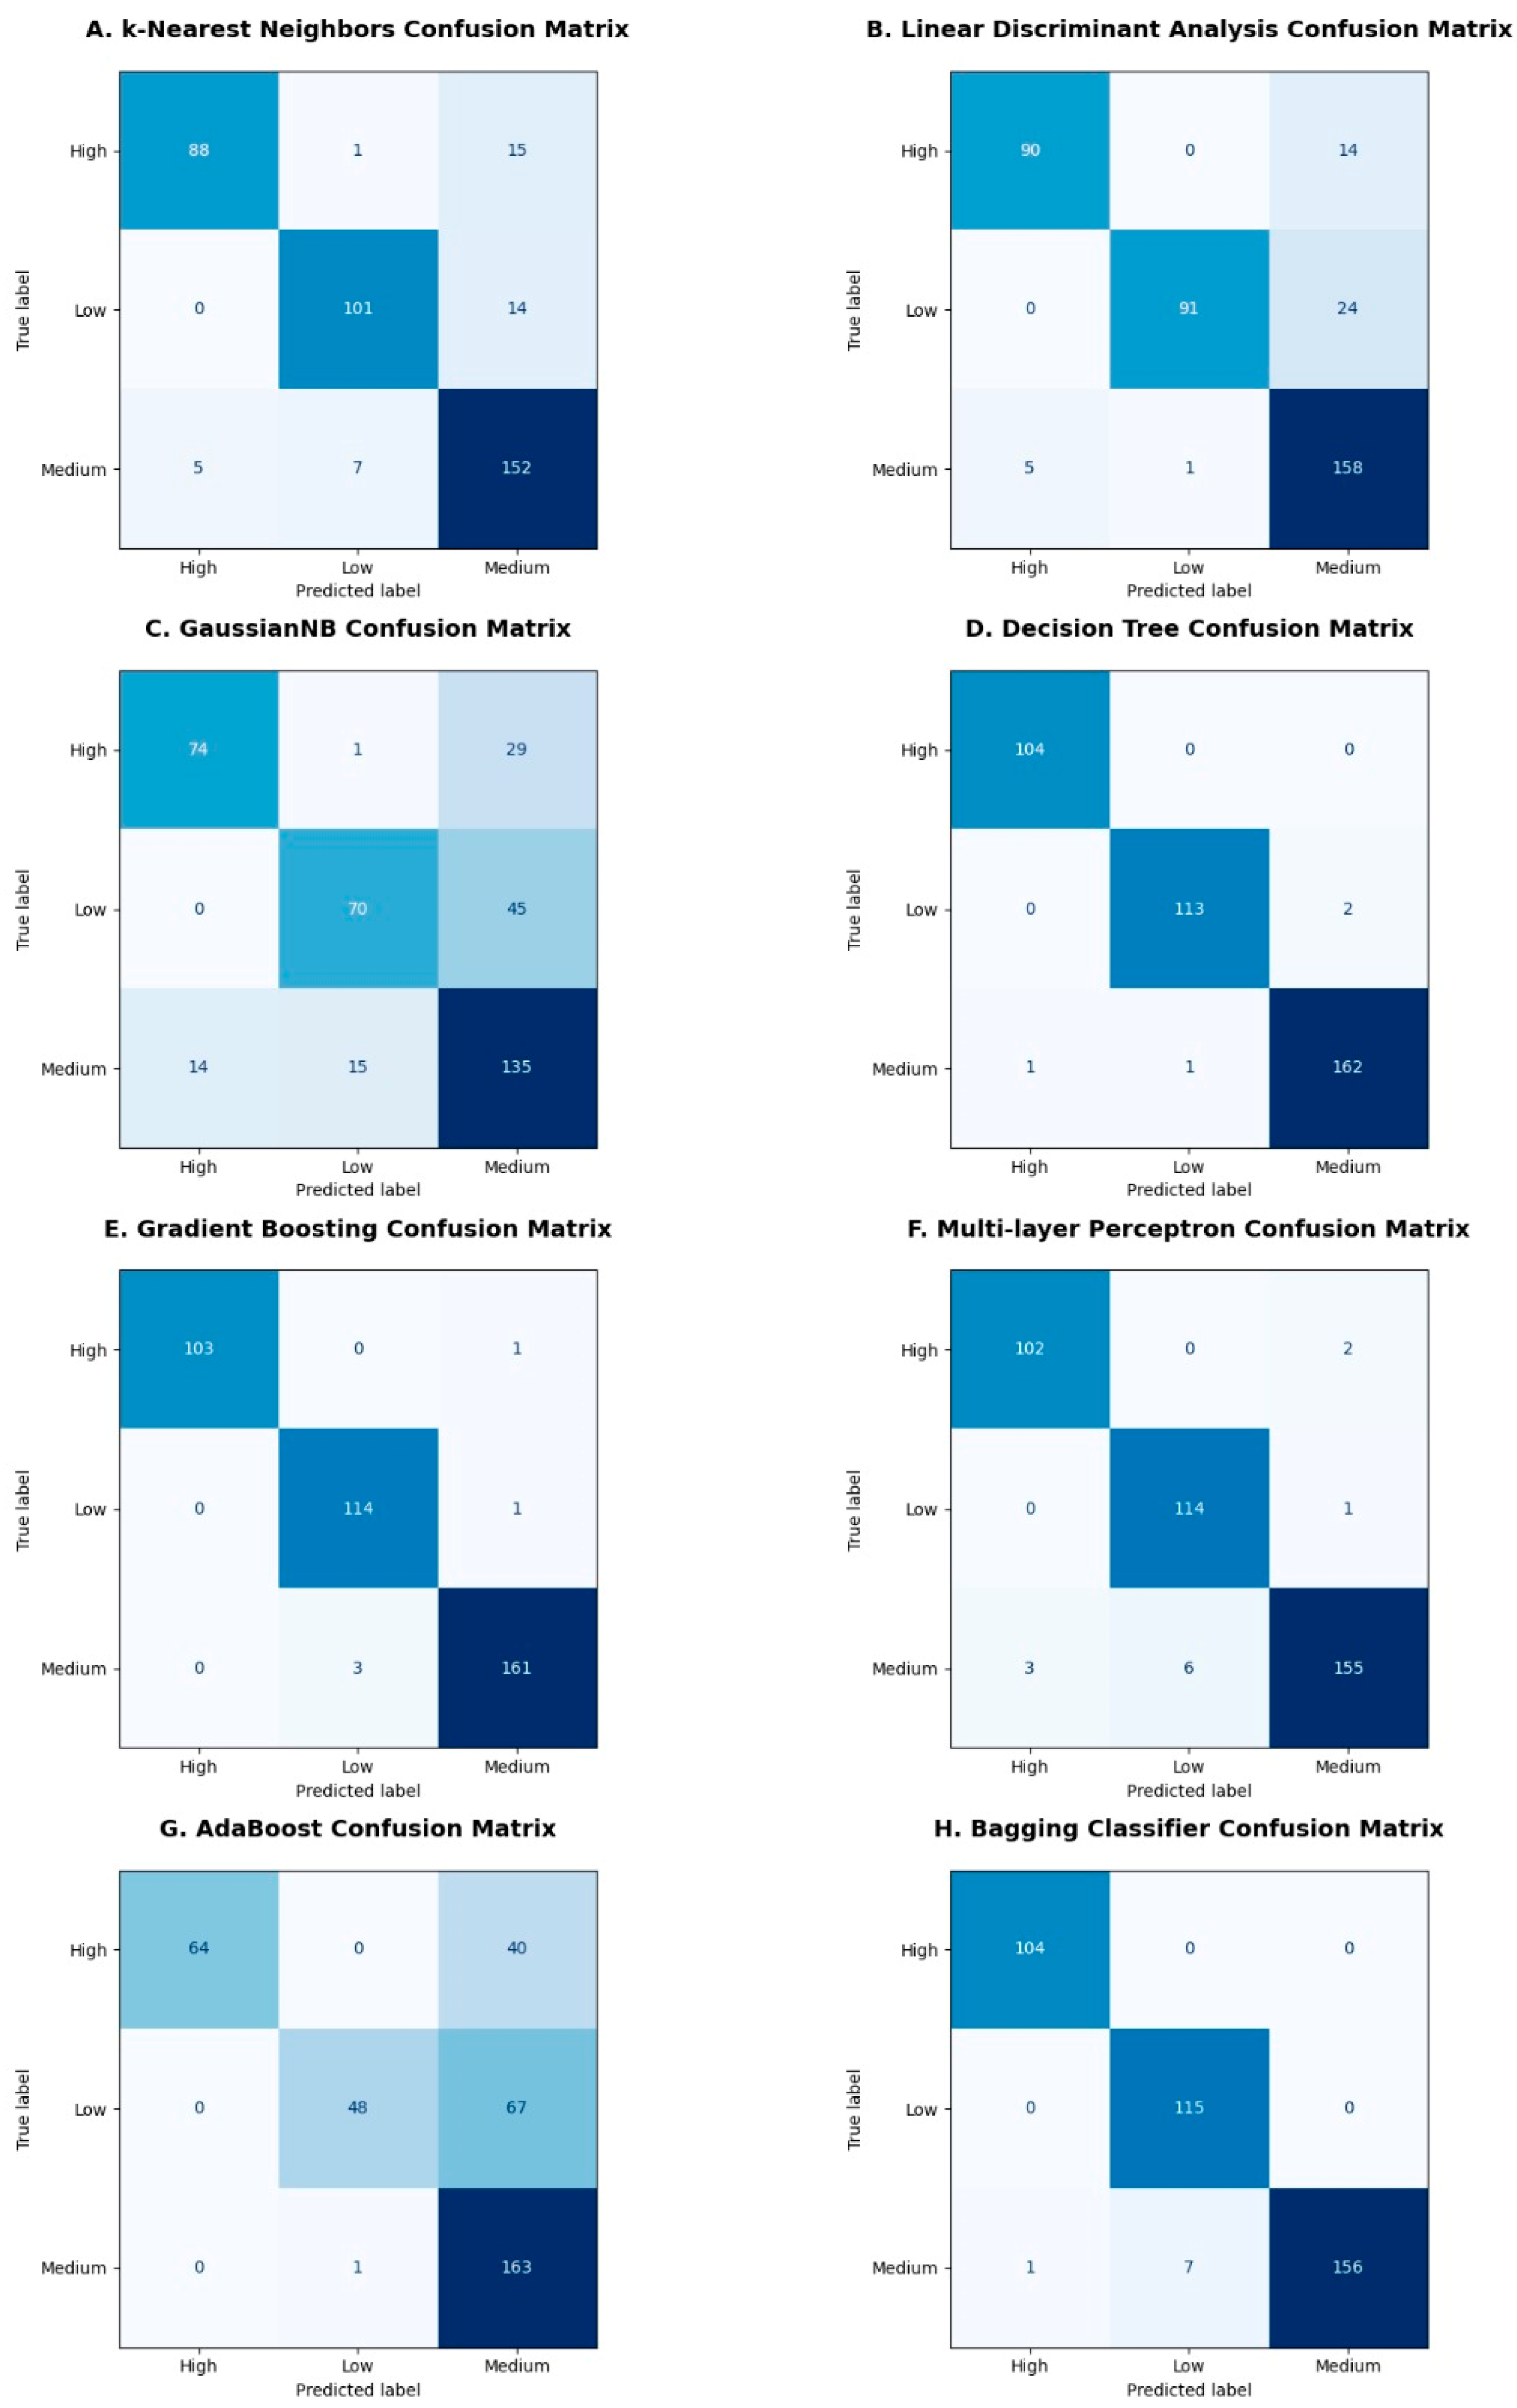
Some of the obtained confusion matrices are shown in Figure 9A–H, where high, medium, and low are the intensities of the body imbalance. The confusion matrix evaluates the performance of a classifier and represents it in the form of a summary by comparing predicted and true labels. In case of body imbalance intensity classification into high, medium, and low, confusion matrices obtained were of multi-class classification. Therefore, all the diagonal values are true positives for the corresponding class. The false positives in the confusion matrices are those that are predicted positive but belong to any of the remaining two classes, whereas the false negatives are those that are predicted negative incorrectly and should have been predicted positive, as shown in Figure 9A–H.
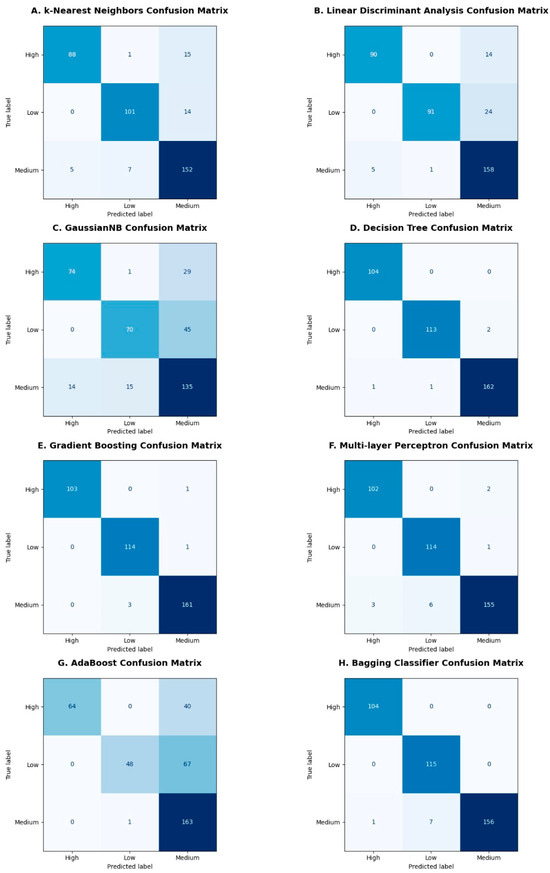
Figure 9.
Confusion matrices obtained after classification: Confusion matrices are illustrated in (A–H) subplots for different machine learning classifiers like k-Nearest Neighbors, Linear Discriminant Analysis, Gaussian Naïve Bayes, Decision Tree, Gradient Boosting, Multilayer Perceptron, AdaBoost and Bagging classifiers, respectively. The diagonal boxes in shades of dark and light blue color represent true values predicted correctly by the classifiers corresponding to the high, medium, and low classes.
3.4. Performance Metrics
Different evaluation metrics like accuracy, precision, recall, and F1 score were computed using the obtained confusion matrices as shown in Figure 10A, and the corresponding p-value obtained from the t-Test between the test accuracies and cross-validation accuracies for each classifier to check the overfitting amongst the classifiers is shown in Figure 10B. Decision Tree, Random Forest, Gradient Boosting, Multilayer Perceptron, and Bagging classifiers achieved maximum accuracy, precision, recall, and F1 score, whereas the Gaussian Naïve Bayes classifier achieved minimum accuracy, precision, recall, and F1 score amongst all other classifiers. The accuracy shown in this graph is without the k-fold cross-validation. A p value less than 0.05 is the indicator of potential overfitting. The p-value in the case of Random Forest is less than 0.05, and hence there is overfitting in that case, whereas there is no overfitting in the case of other classifiers. All the classifiers except Random Forest performed exceptionally well in the classification of body imbalance and its intensities into low, medium, and high.
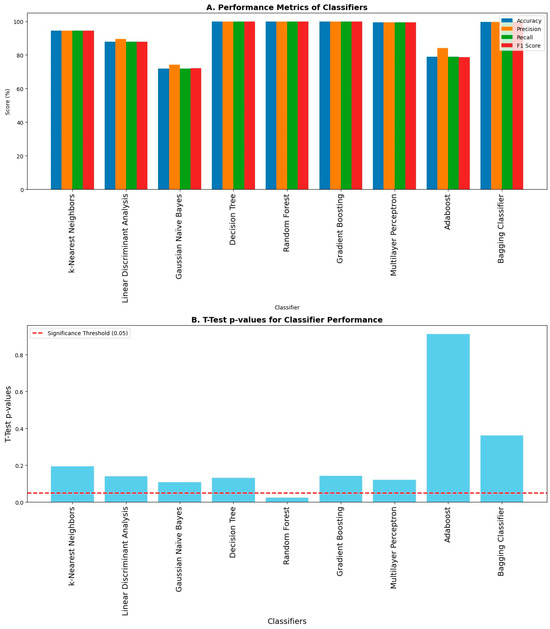
Figure 10.
Evaluation metrics of classifiers upon classification: (A) Different performance metrics like accuracy, precision, recall, and F1 score are shown. The highest values of accuracy, precision, recall, and F1 score are achieved by Decision Tree, Random Forest, Gradient Boosting, Multilayer Perceptron, and Bagging classifiers, respectively, while they are lowest amongst others in the case of the Gaussian Naïve Bayes classifier. (B) There is overfitting in the case of the Random Forest classifier because it has a p-value less than 0.05 upon conducting a statistical test called the t-Test.
4. Discussion
Body imbalance contributes significantly to the variation in the patterns of both the GRF and EMG. Whenever body imbalance is induced, maintaining the center of gravity as well as the activation of muscles responsible for the stabilization of the body with respect to the center of gravity is crucial in avoiding a fall. The vastus lateralis muscle significantly contributes to balancing the body as it was observed that the vastus lateralis muscle had the maximum amplitude of EMG compared to the other muscles of the lower limb, like the gastrocnemius, tibialis anterior, and peroneus muscles, as shown in Figure 7. Oculus Quest 2 was used to induce body imbalance effectively by creating virtual reality immersion using a game called Epic Roller Coasters (Rock Falls Mode), as shown in Figure 4. The variations in GRF and EMG signals occur simultaneously, as shown in Figure 5. Using GRF and EMG to signals simultaneously forms a firm basis to classify imbalance intensities into high, medium, and low. Both normal and 10-fold cross-validation evaluation metrics showed the effectiveness of the machine learning classifiers as shown in Figure 8, Figure 9 and Figure 10.
Upon 10-fold cross validation, it has been observed that the standard deviation shown using the error bar plot in Figure 8B is minimum for Decision Tree, Random Forest, Gradient Boosting, and Bagging classifiers. These classifiers achieved the highest average 10-fold cross validation accuracies. The performance metrics were evaluated using the obtained confusion matrices. The values of true positives, true negatives, false positives, and false negatives from confusion matrices were used to compute accuracy, precision, recall and F1 score for all machine learning classifiers, as shown in Figure 9 and Figure 10.
Higher accuracy does not always indicate optimal performance of any classifier. Some classifiers tend to overfit the data, and when tested on unseen data, their performance drops and they fail perform well in classification. For this purpose, we must check the classifiers for potential overfitting of the data. One of the ways to test the overfitting of the data is to perform a statistical test named the t-Test. This test can be performed between training and test accuracies obtained from the classification of a machine learning classifier. If the p-value after conducting the t-Test is less than 0.05, this indicates that the classifier is overfitting the data. As shown in Figure 10, only the p-value for the Random Forest classifier is less than 0.05, which means the Random Forest classifier is overfitting the data.
This study is only limited to muscles of the lower limb, whereas various muscles of the back can also be used to classify body imbalance and its intensities. Also, this study was conducted on only six healthy and young male subjects. It can also be conducted on both male and female healthy subjects as well as elderly subjects suffering from body imbalance impairments. Different virtual reality immersion environments can be tested to further optimize this work. Other physiological recordings like Electroencephalogram (EEG) and Functional Near Infra-Red Spectroscopy (f-NIRS) can also be incorporated into this experimental setup to compare the efficiency of different modalities in the detection and classification of body imbalance, as well as to enhance the feedback mechanisms in the process of rehabilitation, physical therapy, sports medicine, and patient recovery assessments.
Research of this kind has a lot of potential to be translated into clinical and social applications. From the analysis of the GRF and EMG data, clinicians can proactively treat patients who have impaired balance control. It can be valuable for designing targeted rehabilitation protocols regarding balance and fall prevention in elderly subjects. It is possible to use the classification of the intensities of imbalance to indicate the approaches that can be used in rehabilitation. For instance, patients with high-intensity imbalance can be trained more intensively in terms of strength and stability, whereas patients with medium or low levels of imbalance should be trained less intensively. Its application can be highly beneficial for patients and help physical therapy to be as effective as possible in terms of recovery. The recording of GRF and EMG signals can give clear readings throughout the rehabilitation process of a patient. Health care professionals can monitor the change in balance performance, either in the short or long term, depending on real-time data of muscle activation patterns and ground reaction forces to modify treatment strategies. Likewise, in sports, balance and stability play a major role in a competitor’s performance. GRF and EMG data enable athletes to diagnose motor behaviors, determine their areas of weakness, and plan strategies for improvement. Applications of these kinds of data can go a long way in helping athletes increase their capability and, at the same time, reduce the prevalence of such injuries. Balance analysis using GRF and EMG can help inform ergonomic improvements in the workplace. Employers can increase worker stability and reduce the risk of musculoskeletal injuries by identifying tasks with high imbalance intensities and modifying work settings or implementing training programs. Data from GRF and EMG investigations can help to shape public health campaigns aimed at enhancing balance and mobility in varied populations. For example, community programs aimed at increasing physical activity in older individuals can use the data from these studies to construct effective balance training exercises.
5. Conclusions
Classification of body imbalance and its intensities has the potential to revolutionize adaptive technologies, rehabilitation techniques, exoskeletons, and biomechanical analysis. Visual stimuli using immersive technology like virtual reality can be used to induce controlled body imbalance and, at the same time, electromyogram and ground reaction force signals can be recorded. It is important to note that such hardware and software can be incorporated into real-time rehabilitation systems to enhance their efficiency. Furthermore, it can be used for practical purposes to enhance the stability of athletes going through physical therapy and sports medicine. It can also be used to evaluate the medical procedures and recovery of patients suffering from body imbalance.
Author Contributions
Conceptualization, J.Z.G., Z.M.U.D., M.K., W.Y.K. and M.M.R.; Methodology, J.Z.G., M.O.C., M.K. and M.M.R.; Software, M.O.C.; Validation, J.Z.G., M.O.C. and M.M.R.; Formal analysis, J.Z.G., M.O.C., Z.M.U.D., M.K. and W.Y.K.; Investigation, J.Z.G. and M.O.C.; Resources, W.Y.K.; Data curation, M.O.C.; Writing—original draft, J.Z.G., M.O.C., M.K. and M.M.R.; Writing—review & editing, Z.M.U.D., W.Y.K. and M.M.R.; Supervision, Z.M.U.D.; Project administration, Z.M.U.D.; Funding acquisition, W.Y.K. and M.M.R. All authors have read and agreed to the published version of the manuscript.
Funding
This research was supported by the “Regional Innovation Strategy (RIS)” through the National Research Foundation of Korea (NRF) funded by the Ministry of Education (MOE) (2023-RIS009). This research was also funded by the National Research Foundation of Korea (NRF)—Korea Government (Ministry of Science and ICT), grant number (NRF-2020H1D3A1A04081545).
Institutional Review Board Statement
The study was conducted in accordance with the Declaration of Helsinki and approved by the ethics committee named Institutional Review Board of Air University on 23 November 2023 with approval code AU/EA/2023/606/18.
Informed Consent Statement
Informed consent was obtained from all subjects involved in the study.
Data Availability Statement
Data will be available on reasonable request from the corresponding author.
Acknowledgments
The authors are grateful for the support provided by the Pakistan Science Foundation (CRP-142), NCRA-037, and NCAI-064. They also appreciate the financial assistance for PCB fabrication provided by the Department of Electronic Engineering at Maynooth University. Additionally, the authors acknowledge John Maloco and Denis Buckle from the Electronic Engineering department for their technical support.
Conflicts of Interest
The authors declare no conflicts of interest.
References
- WHO. Within the WHO Global Health Estimates, Fall-Related Deaths and Non-Fatal Injuries Exclude Falls Due to Assault and Self-Harm; Falls from Animals, Burning Buildings, and Transport Vehicles; and Falls into Fire, Water, and Machinery. Available online: https://www.who.int/news-room/fact-sheets/detail/falls (accessed on 10 December 2023).
- WHO. The Disability-Adjusted Life Year (DALY) Extends the Concept of Potential Years of Life Lost Due to Premature Death to Include Equivalent Years of “Healthy” Life Lost by Being in States of Poor Health or Disability. (Global Health Estimates Technical Paper: WHO/DDI/DNA/GHE/2020.3). Available online: https://www.who.int/docs/default-source/gho-documents/global-health-estimates/ghe2019_cod_methods.pdf (accessed on 10 December 2023).
- Wade, M.G.; Jones, G. The role of vision and spatial orientation in the maintenance of posture. Phys. Ther. 1997, 77, 619–628. [Google Scholar] [CrossRef] [PubMed]
- Pavlou, M.; Quinn, C.; Murray, K.; Spyridakou, C.; Faldon, M.; Bronstein, A.M. The effect of repeated visual motion stimuli on visual dependence and postural control in normal subjects. Gait Posture 2011, 33, 113–118. [Google Scholar] [CrossRef] [PubMed]
- Paillard, T.; Noé, F. Techniques and methods for testing the postural function in healthy and pathological subjects. BioMed. Res. Int. 2015, 2015, 891390. [Google Scholar] [CrossRef] [PubMed]
- Péter, A.; Andersson, E.; Hegyi, A.; Finni, T.; Tarassova, O.; Cronin, N.; Grundström, H.; Arndt, A. Comparing Surface and Fine-Wire Electromyography Activity of Lower Leg Muscles at Different Walking Speeds. Front. Physiol. 2019, 10, 1283. [Google Scholar] [CrossRef] [PubMed] [PubMed Central]
- McManus, L.; De Vito, G.; Lowery, M.M. Analysis and Biophysics of Surface EMG for Physiotherapists and Kinesiologists: Toward a Common Language With Rehabilitation Engineers. Front. Neurol. 2020, 11, 576729. [Google Scholar] [CrossRef] [PubMed] [PubMed Central]
- Al-Ayyad, M.; Owida, H.A.; De Fazio, R.; Al-Naami, B.; Visconti, P. Electromyography Monitoring Systems in Rehabilitation: A Review of Clinical Applications, Wearable Devices and Signal Acquisition Methodologies. Electronics 2023, 12, 1520. [Google Scholar] [CrossRef]
- Tamkus, A.; Rice, K. Risk of needle-stick injuries associated with the use of subdermal needle electrodes during intraoperative neurophysiologic monitoring. J. Neurosurg. Anesthesiol. 2014, 26, 65–68. [Google Scholar] [CrossRef] [PubMed]
- Truong Quang Dang, K.; Le Minh, H.; Nguyen Thanh, H.; Vo Van, T. Analyzing surface EMG signals to determine relationship between jaw imbalance and arm strength loss. Biomed. Eng. OnLine 2012, 11, 55. [Google Scholar] [CrossRef]
- Kamavuako, E.N. On the Applications of EMG Sensors and Signals. Sensors 2022, 22, 7966. [Google Scholar] [CrossRef] [PubMed] [PubMed Central]
- Rose, T.; Nam, C.S.; Chen, K.B. Immersion of virtual reality for rehabilitation—Review. Appl. Ergon. 2018, 69, 153–161. [Google Scholar] [CrossRef]
- Saldana, D.; Neureither, M.; Schmiesing, A.; Jahng, E.; Kysh, L.; Roll, S.C.; Liew, S.L. Applications of head-mounted displays for virtual reality in adult physical rehabilitation: A scoping review. Am. J. Occup. Ther. 2020, 74, 7405205060p1–7405205060p15. [Google Scholar] [CrossRef] [PubMed]
- Gotardi, G.C.; Rodrigues, S.T.; Barbieri, F.A.; Brito, M.B.; Bonfim, J.V.A.; Polastri, P.F. Wearing a head-mounted eye tracker may reduce body sway. Neurosci. Lett. 2020, 722, 134799. [Google Scholar] [CrossRef] [PubMed]
- Chiarovano, E.; de Waele, C.; MacDougall, H.G.; Rogers, S.J.; Burgess, A.M.; Curthoys, I.S. Maintaining balance when looking at a virtual reality three-dimensional display of a field of moving dots or a virtual reality scene. Front. Neurol. 2015, 6, 164. [Google Scholar] [CrossRef] [PubMed]
- Menzies, R.J.; Rogers, S.J.; Phillips, A.M.; Chiarovano, E.; De Waele, C.; Verstraten, F.A.; MacDougall, H. An objective measure for the visual fidelity of virtual reality and the risks of falls in a virtual environment. Virtual Real. 2016, 20, 173–181. [Google Scholar] [CrossRef]
- Ferdous, S.M.S.; Chowdhury, T.I.; Arafat, I.M.; Quarles, J. Investigating the reason for increased postural instability in virtual reality for persons with balance impairments. In Proceedings of the 25th IEEE Conference on Virtual Reality and 3D User Interfaces, Reutlingen, Germany, 18–22 March 2018; pp. 1–2. [Google Scholar]
- Robert, M.T.; Ballaz, L.; Lemay, M. The effect of viewing a virtual environment through a head-mounted display on balance. Gait Posture 2016, 48, 261–266. [Google Scholar] [CrossRef]
- Chen, B.; Liu, P.; Xiao, F.; Liu, Z.; Wang, Y. Review of the Upright Balance Assessment Based on the Force Plate. Int. J. Environ. Res. Public Health 2021, 18, 2696. [Google Scholar] [CrossRef]
- Panjan, A.; Sarabon, N. Review of methods for the evaluation of human body balance. Sport Sci. Rev. 2010, 19, 131. [Google Scholar] [CrossRef]
- Luo, H.; Wang, X.; Fan, M.; Deng, L.; Jian, C.; Wei, M.; Luo, J. The effect of visual stimuli on stability and complexity of postural control. Front. Neurol. 2018, 9, 48. [Google Scholar] [CrossRef]
- Chan, Z.Y.; MacPhail, A.J.; Au, I.P.; Zhang, J.H.; Lam, B.M.; Ferber, R.; Cheung, R.T. Walking with head-mounted virtual and augmented reality devices: Effects on position control and gait biomechanics. PLoS ONE 2019, 14, e0225972. [Google Scholar] [CrossRef]
- Liang, H.-W.; Chi, S.-Y.; Chen, B.-Y.; Hwang, Y.-H. Reliability and validity of a virtual reality-based system for evaluating postural stability. IEEE Trans. Neural Syst. Rehabil. Eng. 2021, 29, 85–91. [Google Scholar] [CrossRef]
- Kyeong, S.; Shin, W.; Yang, M.; Heo, U.; Feng, J.-R.; Kim, J. Recognition of walking environments and gait period by surface electromyography. Front. Inf. Technol. Electron. Eng. 2019, 20, 342–352. [Google Scholar] [CrossRef]
- Gupta, R.; Agarwal, R. Electromyographic Signal-Driven Continuous Locomotion Mode Identification Module Design for Lower Limb Prosthesis Control. Arab. J. Sci. Eng. 2018, 43, 7817–7835. [Google Scholar] [CrossRef]
- Afzal, T.; Iqbal, K.; White, G.; Wright, A.B. A method for locomotion mode identification using muscle synergies. IEEE Trans. Neural Syst. Rehabil. Eng. 2016, 25, 608–617. [Google Scholar] [CrossRef] [PubMed]
- Jung, J.Y.; Heo, W.; Yang, H.; Park, H. A Neural Network-Based Gait Phase Classification Method Using Sensors Equipped on Lower Limb Exoskeleton Robots. Sensors 2015, 15, 27738–27759. [Google Scholar] [CrossRef] [PubMed]
- Nazmi, N.; Rahman, M.A.A.; Yamamoto, S.I.; Ahmad, S.A. Walking gait event detection based on electromyography signals using artificial neural network. Biomed. Signal Process. Control 2019, 47, 334–343. [Google Scholar] [CrossRef]
- Liang, H.W.; Chi, S.Y.; Chen, B.Y.; Li, Y.H.; Tai, T.L.; Hwang, Y.H. The effects of visual backgrounds in the virtual environments on the postural stability of standing. IEEE Trans. Neural Syst. Rehabil. Eng. 2021, 29, 1129–1137. [Google Scholar] [CrossRef]
- Freeman, H.R.; Chander, H.; Kodithuwakku Arachchige, S.N.K.; Turner, A.J.; Jones, J.A.; Pan, Z.; Hudson, C.; Knight, A.C. Postural Control Behavior in a Virtual Moving Room Paradigm. Biomechanics 2023, 3, 539–551. [Google Scholar] [CrossRef]
- Moon, S.; Huang, C.K.; Sadeghi, M.; Akinwuntan, A.E.; Devos, H. Proof-of-Concept of the virtual reality comprehensive balance assessment and training for sensory organization of dynamic postural control. Front. Bioeng. Biotechnol. 2021, 9, 678006. [Google Scholar] [CrossRef]
- Gao, S.; Wang, Y.; Fang, C.; Xu, L. A smart terrain identification technique based on electromyography, ground reaction force, and machine learning for lower limb rehabilitation. Appl. Sci. 2020, 10, 2638. [Google Scholar] [CrossRef]
- Lee, D.; Chang, B.; Park, J. Virtual Reality Content Evaluation Visualization Tool Focused on Comfort, Cybersickness, and Perceived Excitement. Available online: https://ssrn.com/abstract=4097287 (accessed on 10 December 2023).
- Barzilay, O.; Wolf, A. A fast implementation for EMG signal linear envelope computation. J. Electromyogr. Kinesiol. 2011, 21, 678–682. [Google Scholar] [CrossRef]
- Yang, J.F.; Winter, D. Electromyographic amplitude normalization methods: Improving their sensitivity as diagnostic tools in gait analysis. Arch. Phys. Med. Rehabil. 1984, 65, 517–521. [Google Scholar] [PubMed]
- Wannop, J.W.; Worobets, J.T.; Stefanyshyn, D.J. Normalization of ground reaction forces, joint moments, and free moments in human locomotion. J. Appl. Biomech. 2012, 28, 665–676. [Google Scholar] [CrossRef] [PubMed]
- Chowdhury, R.H.; Reaz, M.B.I.; Ali, M.A.B.; Bakar, A.A.A.; Chellappan, K.; Chang, T.G. Surface Electromyography Signal Processing and Classification Techniques. Sensors 2013, 13, 12431–12466. [Google Scholar] [CrossRef] [PubMed]


Disclaimer/Publisher’s Note: The statements, opinions and data contained in all publications are solely those of the individual author(s) and contributor(s) and not of MDPI and/or the editor(s). MDPI and/or the editor(s) disclaim responsibility for any injury to people or property resulting from any ideas, methods, instructions or products referred to in the content. |
© 2024 by the authors. Licensee MDPI, Basel, Switzerland. This article is an open access article distributed under the terms and conditions of the Creative Commons Attribution (CC BY) license (https://creativecommons.org/licenses/by/4.0/).