
Seismic Identification and Characterization of Deep Strike-Slip Faults in the Tarim Craton Basin

 , , ,
, , ,
Abstract
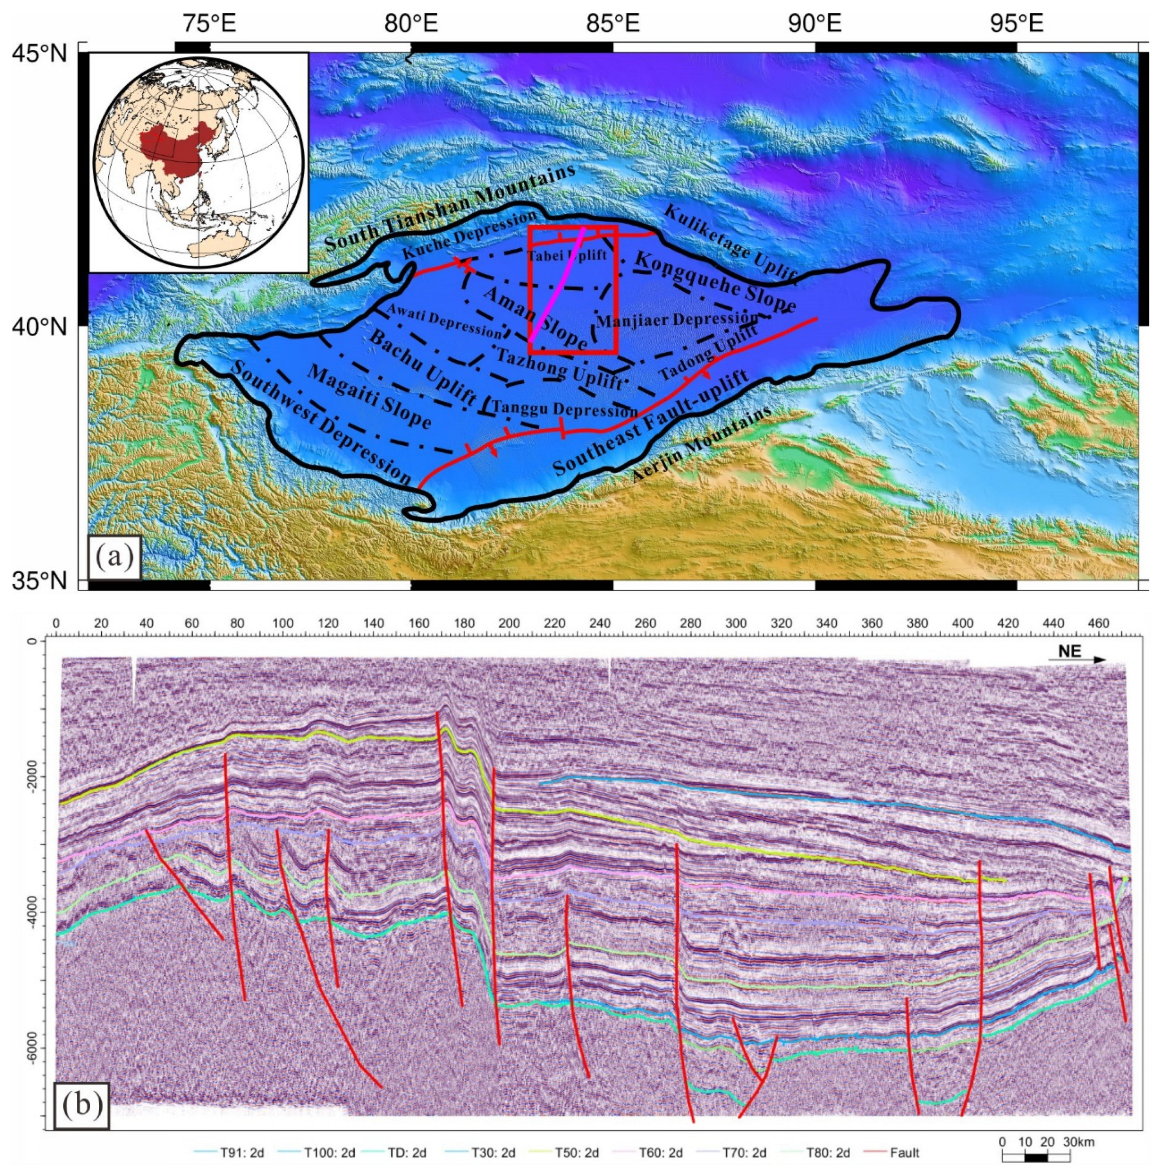
:1. Introduction
2. Geological Structure of Strike-Slip Faults
2.1. Basic Characteristics
2.2. Structural Styles
2.3. Fault-Controlled Reservoir
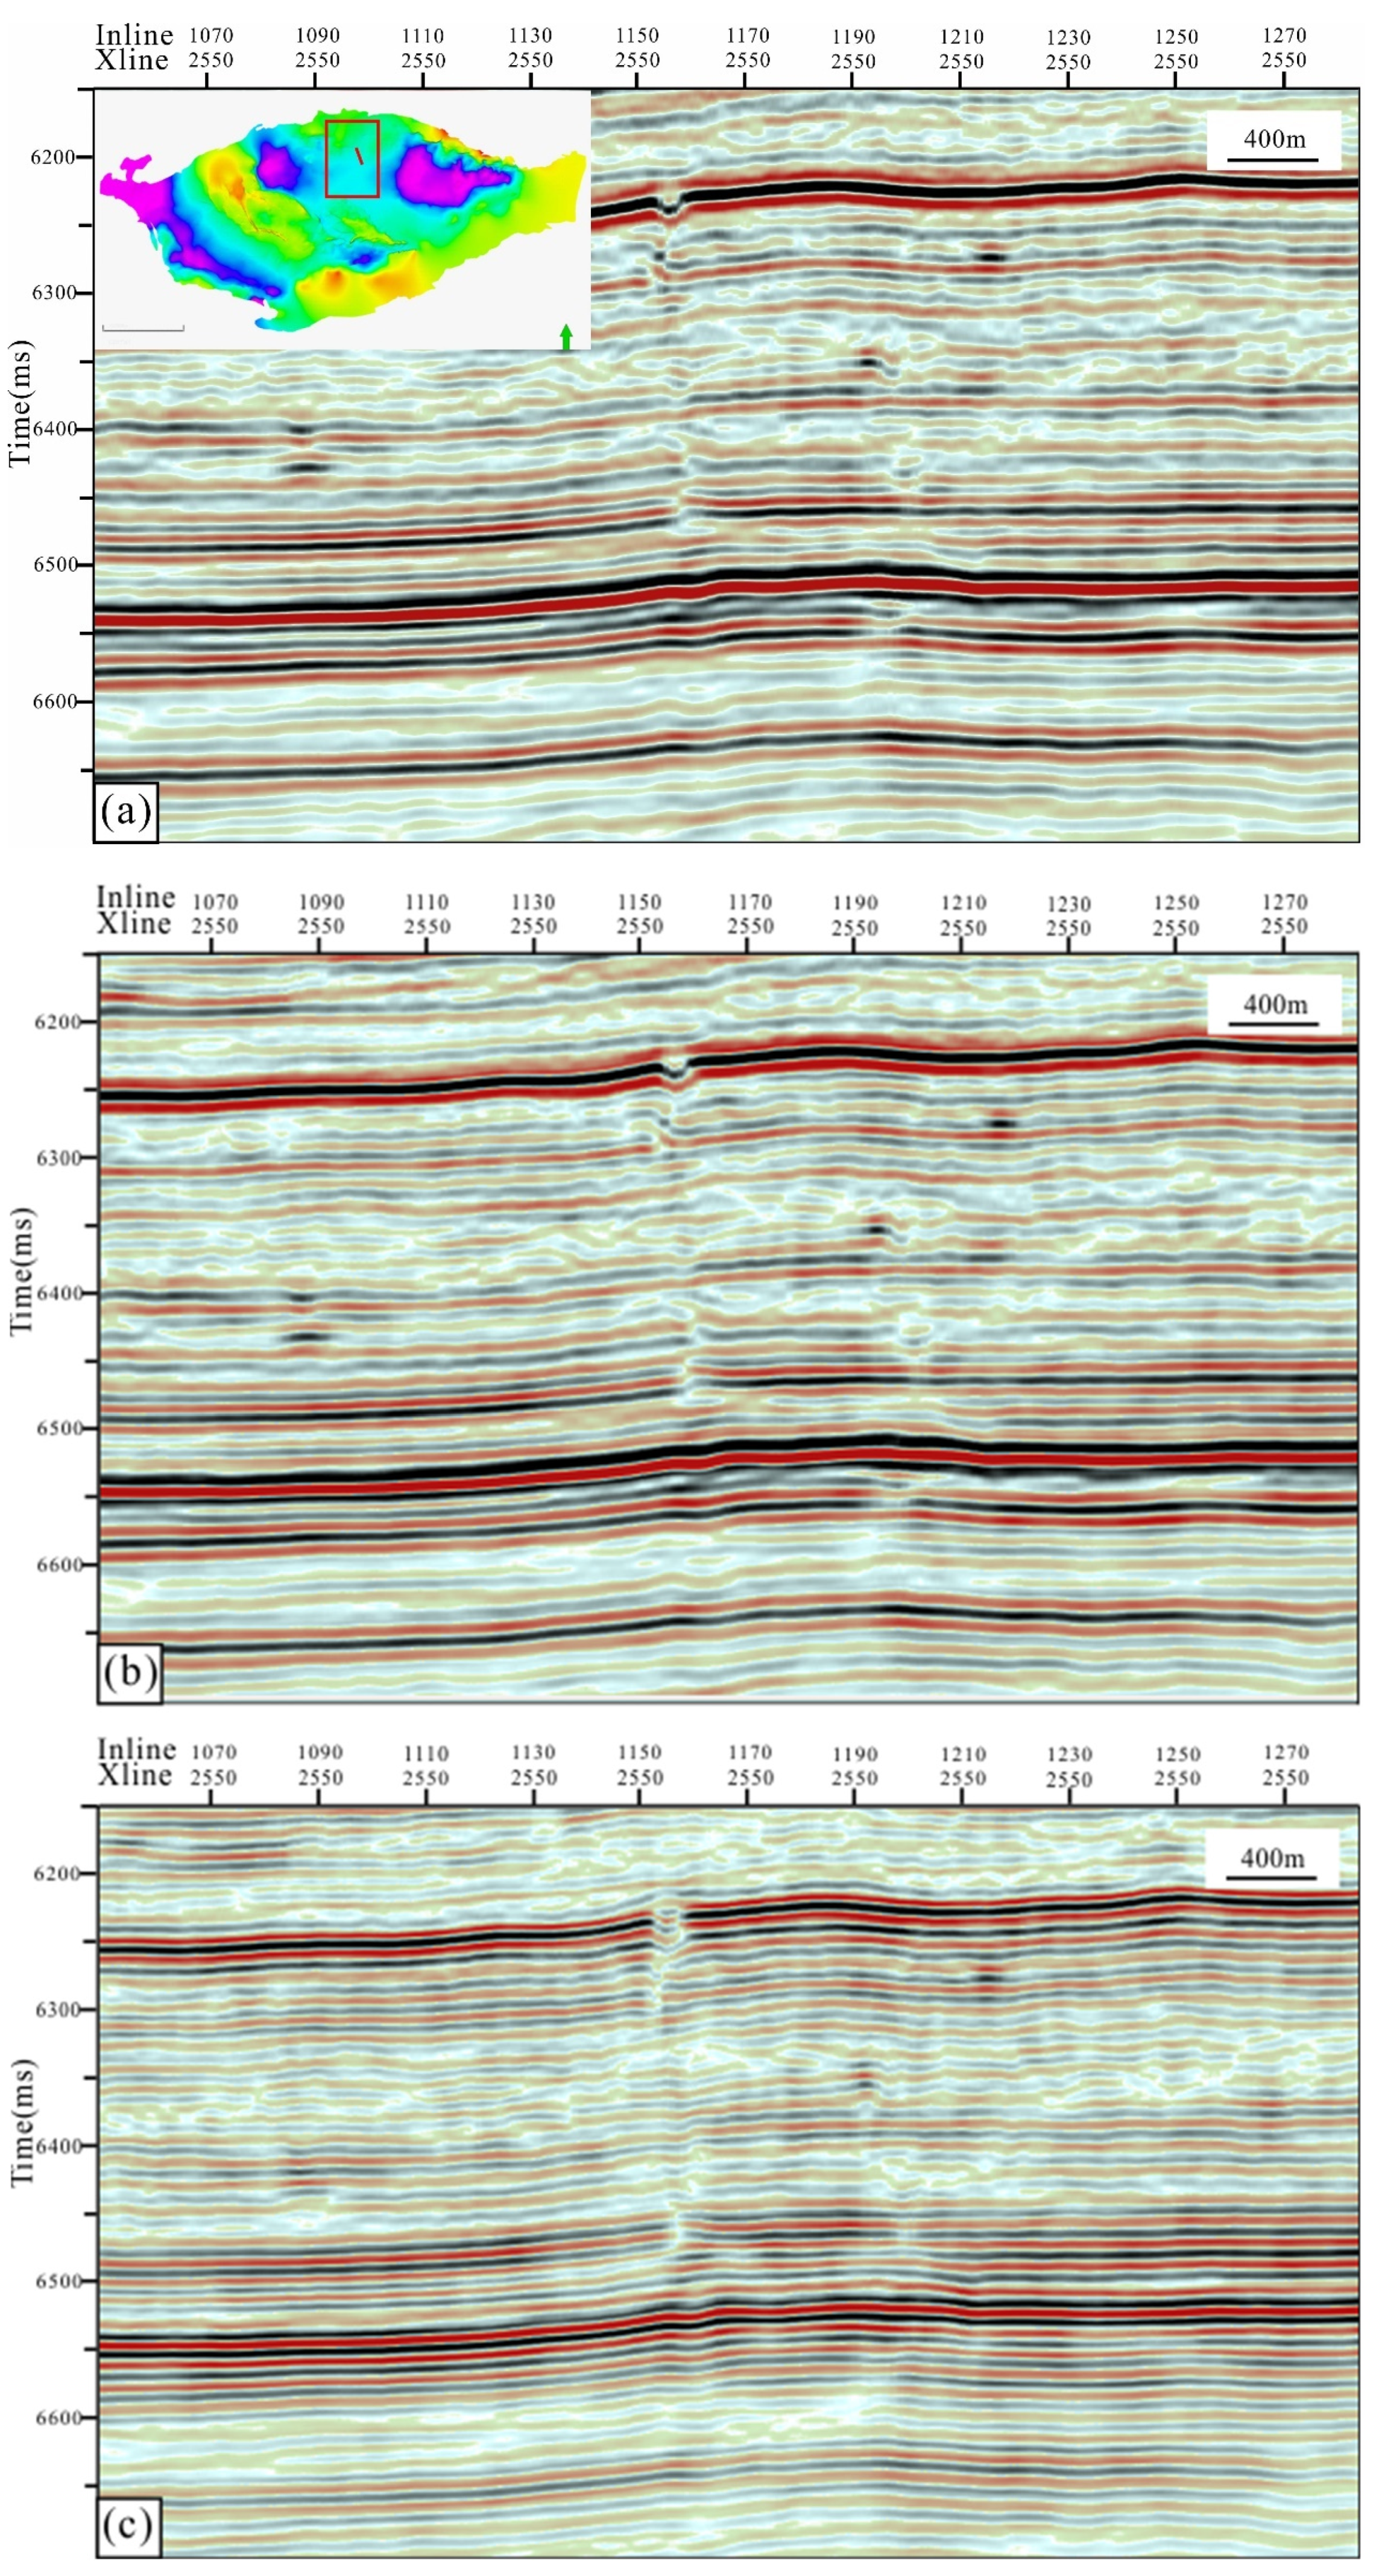
3. Seismic Resolution Improvement
3.1. Principal Component Filtering
3.2. Structure-Oriented Filtering
3.3. Fault-Focused Imaging
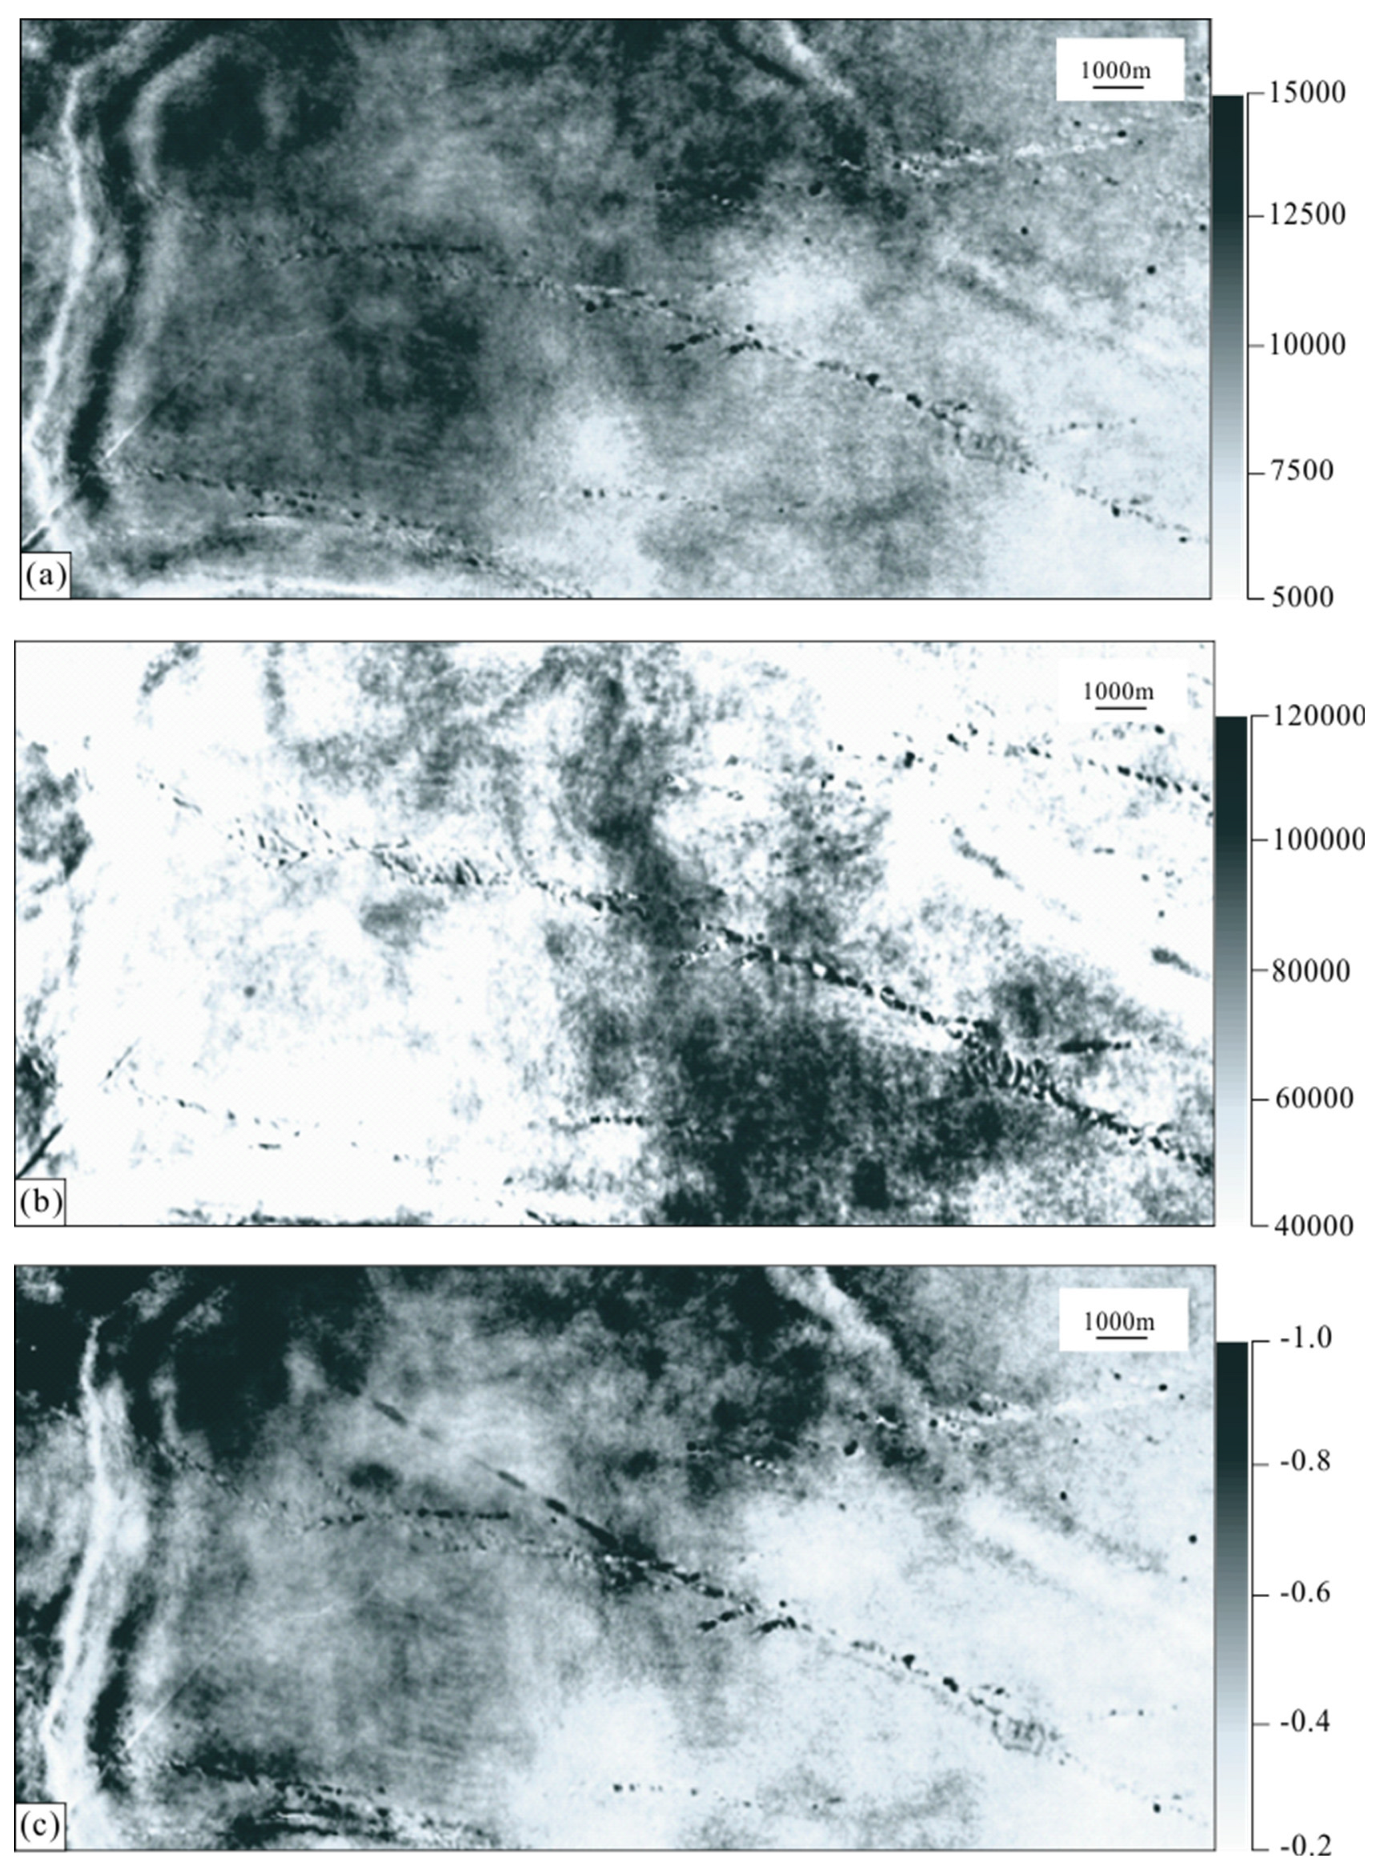
4. Seismic Attribute Generation
4.1. Energy Attributes
- (1)
- Root mean square amplitude
- (2)
- Low-frequency energy and high-frequency attenuation
4.2. Curvature Attributes
- (1)
- Maximum positive curvature and minimum negative curvature
- (2)
- Dip
4.3. Correlation Attributes
- (1)
- Coherent
- (2)
- Likelihood
- (3)
- Ant tracking
- (4)
- AFE
- (1)
- Linear enhancement processing. Strip noise caused by environmental factors is eliminated by a linear filter. Then, the linear contour (fault) is enhanced on the time slice of the data volume to enhance the fault recognition ability.
- (2)
- Direction-weighted processing. The coherent linear characteristics of the favourable direction are retained by the directional filter, and the coherent characteristics of other directions are removed. Combined with other information, such as the logging analysis, the direction of the stress, fault, and fracture development zone can be determined, and the fracture along the favourable direction can be enhanced by the directional filtering method.
- (3)
- Fault enhancement processing. Further denoising and plane enhancement are carried out on the linear enhancement data body generated in the first step. Relevant plane parameters are set through the fault dip angle and azimuth angle, and non-vertical linear strips on the fault time slice are filtered out, thus eliminating the discontinuity caused by non-faults and formation occurrences in the data body. After these two steps of processing, linear reinforced bands reflect the faults and fractures.
- (4)
- Generation and processing of vertical fault seed vectors. Vertical fault profiles are processed with fault enhancement, linear enhancement, and dip enhancement data generated in the first two steps, setting relevant parameters to search for linear structural features with dips greater than 45 degrees and transforming them into seed vectors. The minimum length of the vector is set, and any seed vector smaller than the set value is removed.
- (5)
- The horizontal and vertical fault vectors are connected to form the fault plane. In this step, the vertical vector and the intersecting horizontal vector are searched and connected by setting relevant fault parameters as the new initial fault.
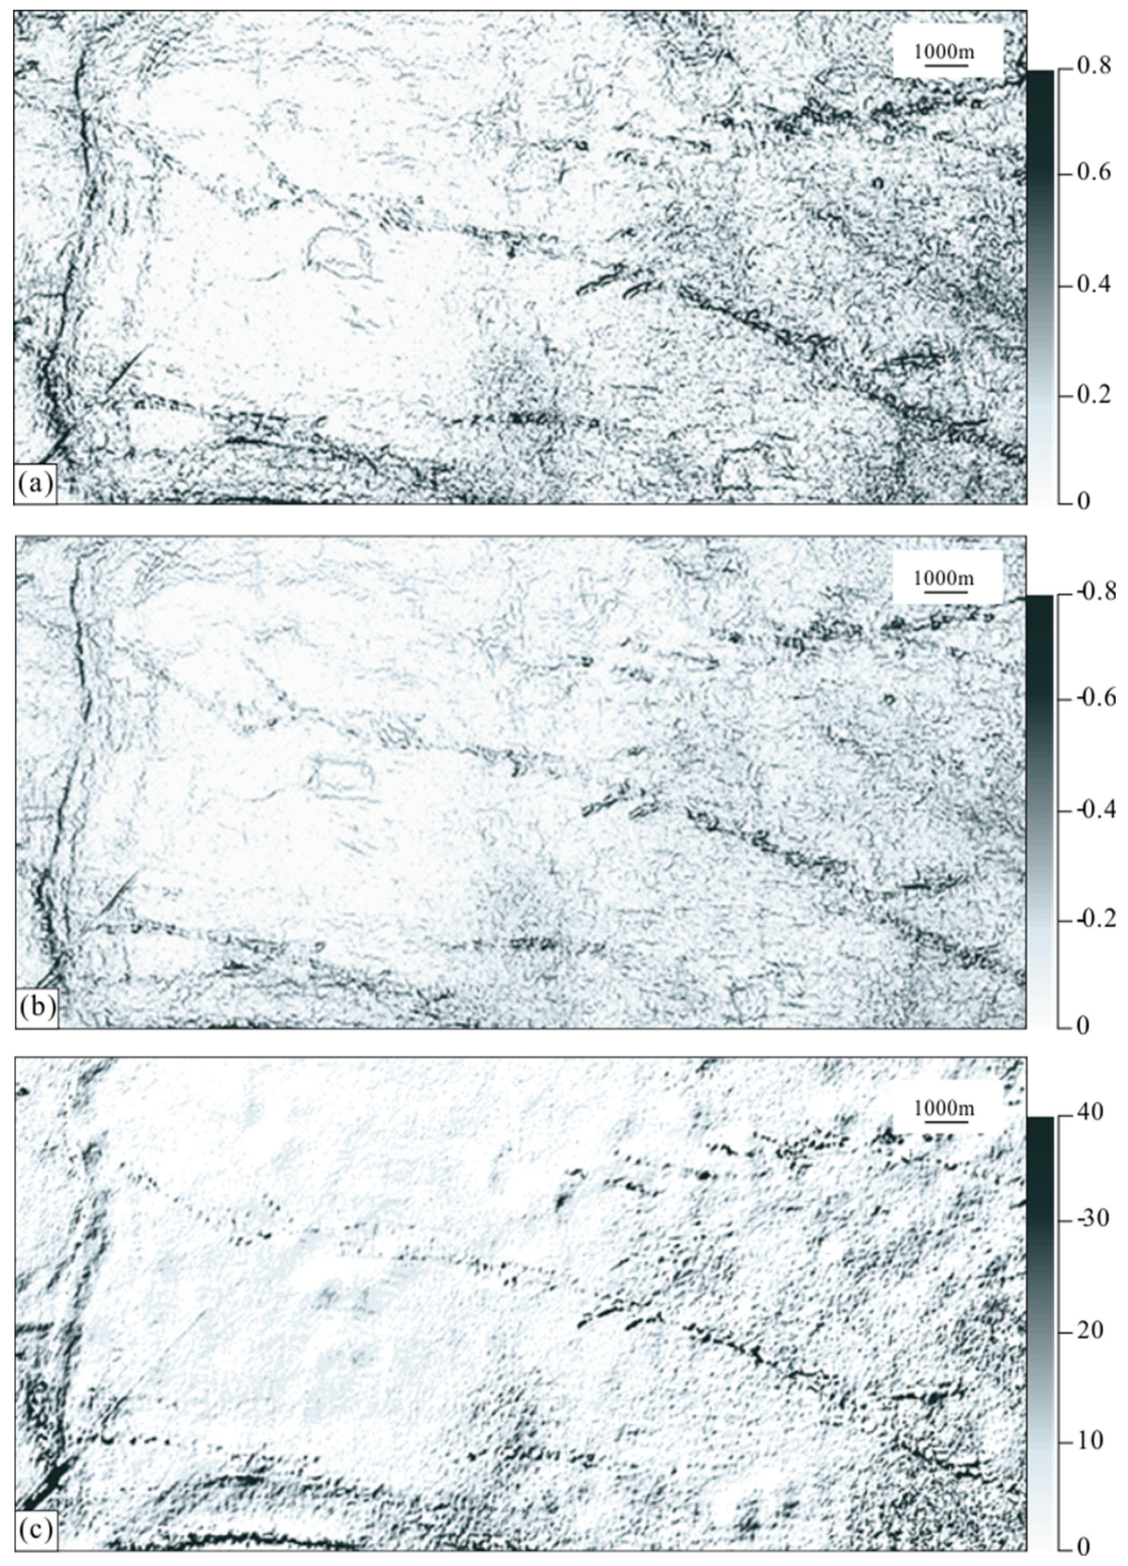
4.4. Gradient Attributes
- (1)
- Amplitude variance
- (2)
- Amplitude gradient
5. Fault Identification through Attribute Fusion
5.1. Fault Identification Comparison of Preferred Attributes
5.2. Attribute Fusion Based on Image Processing
5.3. Comprehensive Characterization of Strike-Slip Faults
- (1)
- Interpretation map of the strike-slip faults
- (2)
- Section interpretation of the strike-slip faults
6. Discussion
6.1. Strike-Slip Fault within the Craton Identification Workflow
6.2. Seismic Attribute Fusion Technology
7. Conclusions
Author Contributions
Funding
Institutional Review Board Statement
Informed Consent Statement
Data Availability Statement
Acknowledgments
Conflicts of Interest
References
- Kitamura, Y.; Sato, K.; Ikesawa, E.; Ikehara-Ohmori, K.; Kimura, G.; Kondo, H.; Ujiie, K.; Onishi, C.T.; Kawabata, K.; Hash-imoto, Y.; et al. Melange and its seismogenic roof decollement: A plate boundary fault rock in the subduction zone—An example from the Shimanto Belt, Japan. Tectonics 2005, 24, 5. [Google Scholar] [CrossRef]
- Sorlien, C.C.; Kamerling, M.J.; Seeber, L.; Broderick, K.G. Restraining segments and reactivation of the Santa Mon-ica-Dume-Malibu Coast fault system, offshore Los Angeles, California. J. Geophys. Res. Solid Earth 2006, 111, B11. [Google Scholar] [CrossRef]
- Yang, F.; Hu, P.; Zhou, X.; Zhang, R.; Peng, Y.; Li, X.; Qiu, D. The Late Jurassic to Early Cretaceous Strike-Slip Faults in the Subei-South Yellow Sea Basin, Eastern China: Constraints From Seismic Data. Tectonics 2020, 39, e2020TC006091. [Google Scholar] [CrossRef]
- Velandia, F.; Acosta, J.; Terraza, R.; Villegas, H. The current tectonic motion of the Northern Andes along the Algeciras Fault System in SW Colombia. Tectonophysics 2005, 399, 313–329. [Google Scholar] [CrossRef]
- Tian, F.; Jin, Q.; Lu, X.; Lei, Y.; Zhang, L.; Zheng, S.; Zhang, H.; Rong, Y.; Liu, N. Multi-layered ordovician paleokarst reservoir detection and spatial delineation: A case study in the Tahe Oilfield, Tarim Basin, Western China. Mar. Pet. Geol. 2016, 69, 53–73. [Google Scholar] [CrossRef]
- Peng, J.; Wei, A.; Sun, Z.; Chen, X.; Zhao, D. Sinistral strike slip of the Zhangjiakou-Penglai Fault and its control on hydrocarbon accumulation in the northeast of Shaleitian Bulge, Bohai Bay Basin, East China. Pet. Explor. Dev. 2018, 45, 215–226. [Google Scholar] [CrossRef]
- Wu, J.E.; McClay, K.; Whitehouse, P.; Dooley, T. 4D analogue modelling of transtensional pull-apart basins. Mar. Pet. Geol. 2009, 26, 1608–1623. [Google Scholar] [CrossRef]
- Tian, F.; Wang, Z.; Cheng, F.; Xin, W.; Fayemi, O.; Zhang, W.; Shan, X. Three-Dimensional Geophysical Characterization of Deeply Buried Paleokarst System in the Tahe Oilfield, Tarim Basin, China. Water 2019, 11, 1045. [Google Scholar] [CrossRef]
- Tomassi, A.; Trippetta, F.; de Franco, R.; Ruggieri, R. How petrophysical properties influence the seismic signature of carbonate fault damage zone: Insights from forward-seismic modelling. J. Struct. Geol. 2023, 167, 104802. [Google Scholar] [CrossRef]
- Jahan, I.; Castagna, J.; Murphy, M.; Kayali, M.A. Fault detection using principal component analysis of seismic attributes in the Bakken Formation, Williston Basin, North Dakota, USA. Interpretation 2017, 5, T361–T372. [Google Scholar] [CrossRef]
- Basir, H.M.; Javaherian, A.; Yaraki, M.T. Multi-attribute ant-tracking and neural network for fault detection: A case study of an Iranian oilfield. J. Geophys. Eng. 2013, 10, 015009. [Google Scholar] [CrossRef]
- Abbasi, S.A.; Asim, S.; Solangi, S.H.; Khan, F. Study of fault configuration related mysteries through multi seismic attribute analysis technique in Zamzama gas field area, southern Indus Basin, Pakistan. Geod. Geodyn. 2016, 7, 132–142. [Google Scholar] [CrossRef]
- Xu, B.; Xiao, A.; Wu, L.; Mao, L.; Dong, Y.; Zhou, L. 3D seismic attributes for structural analysis in compressional context: A case study from western Sichuan Basin. J. Earth Sci. 2014, 25, 985–990. [Google Scholar] [CrossRef]
- Qiu, H.; Deng, S.; Cao, Z.; Yin, T.; Zhang, Z. The Evolution of the Complex Anticlinal Belt With Crosscutting Strike-Slip Faults in the Central Tarim Basin, NW China. Tectonics 2019, 38, 2087–2113. [Google Scholar] [CrossRef]
- Albesher, Z.; Kellogg, J.; Hafiza, I.; Saeid, E. Multi-Attribute Analysis Using Coherency and Ant-Tracking Techniques for Fault and Fracture Detection in La Florida Anticline, Llanos Foothills, Colombia. Geosciences 2020, 10, 154. [Google Scholar] [CrossRef]
- Tian, F.; Luo, X.; Zhang, W. Integrated geological-geophysical characterizations of deeply buried fractured-vuggy carbonate reservoirs in Ordovician strata, Tarim Basin. Mar. Pet. Geol. 2019, 99, 292–309. [Google Scholar] [CrossRef]
- Zheng, W.; Tian, F.; Di, Q.; Xin, W.; Cheng, F.; Shan, X. Electrofacies classification of deeply buried carbonate strata using machine learning methods: A case study on ordovician paleokarst reservoirs in Tarim Basin. Mar. Pet. Geol. 2020, 123, 104720. [Google Scholar] [CrossRef]
- Chen, J.; He, D.; Tian, F.; Huang, C.; Ma, D.; Zhang, W. Control of mechanical stratigraphy on the stratified style of strike-slip faults in the central Tarim Craton, NW China. Tectonophysics 2022, 830, 229307. [Google Scholar] [CrossRef]
- Martin, E.S. The distribution and characterization of strike-slip faults on Enceladus. Geophys. Res. Lett. 2016, 43, 2456–2464. [Google Scholar] [CrossRef]
- Tian, F.; Di, Q.; Jin, Q.; Cheng, F.; Zhang, W.; Lin, L.; Wang, Y.; Yang, D.; Niu, C.; Li, Y. Multiscale geological-geophysical characterization of the epigenic origin and deeply buried paleokarst system in Tahe Oilfield, Tarim Basin. Mar. Pet. Geol. 2019, 102, 16–32. [Google Scholar] [CrossRef]
- Kim, Y.-S.; Peacock, D.; Sanderson, D.J. Mesoscale strike-slip faults and damage zones at Marsalforn, Gozo Island, Malta. J. Struct. Geol. 2003, 25, 793–812. [Google Scholar] [CrossRef]
- Tondi, E.; Blumetti, A.M.; Cicak, M.; Di Manna, P.; Galli, P.; Invernizzi, C.; Mazzoli, S.; Piccardi, L.; Valentini, G.; Vittori, E.; et al. ‘Conjugate’ coseismic surface faulting related with the 29 December 2020, Mw 6.4, Petrinja earthquake (Si-sak-Moslavina, Croatia). Sci. Rep. 2021, 11, 9150. [Google Scholar] [CrossRef]
- Anderson, G.; Aagaard, B.; Hudnut, K. Fault Interactions and Large Complex Earthquakes in the Los Angeles Area. Science 2003, 302, 1946–1949. [Google Scholar] [CrossRef] [PubMed]
- Cheng, X.; Ding, W.; Pan, L.; Zou, Y.; Li, Y.; Yin, Y.; Ding, S. Geometry and Kinematics Characteristics of Strike-Slip Fault Zone in Complex Structure Area: A Case Study From the South No. 15 Strike-Slip Fault Zone in the Eastern Sichuan Basin, China. Front. Earth Sci. 2022, 10, 922664. [Google Scholar] [CrossRef]
- Gong, W.; Wen, X.; Zhou, D. Characteristics and Seismic Identification Mode of Ultra-Deep Carbonate Fault-Controlled Reservoir in Northwest China. Energies 2022, 15, 8598. [Google Scholar] [CrossRef]
- Karson, J.A.; Farrell, J.A.; Chutas, L.A.; Nanfito, A.F.; Proett, J.A.; Runnals, K.T.; Sæmundsson, K. Rift-Parallel Strike-Slip Faulting Near the Iceland Plate Boundary Zone: Implications for Propagating Rifts. Tectonics 2018, 37, 4567–4594. [Google Scholar] [CrossRef]
- Levi, N.; Pittarello, L.; Habermueller, M. Structural characteristics of the curved Königsee-Lammertal-Traunsee fault system in Salzkammergut (Northern Calcareous Alps, Austria). J. Struct. Geol. 2022, 155, 104503. [Google Scholar] [CrossRef]
- Zhang, Y.; Wang, D.; Ding, R.; Yang, J.; Zhao, L.; Zhao, S.; Cai, M.; Han, T. An Intelligent Recognition Method for Low-Grade Fault Based on Attention Mechanism and Encoder–Decoder Network Structure. Energies 2022, 15, 8098. [Google Scholar] [CrossRef]
- Mattei, M.; Cifelli, F.; Alimohammadian, H.; Rashid, H. The role of active strike-slip faults and opposite vertical axis rotations in accommodating eurasia-arabia shortening in central iran. Tectonophysics 2020, 774, 228243. [Google Scholar] [CrossRef]
- Spacapan, J.B.; Galland, O.; Leanza, H.A.; Planke, S. Control of strike-slip fault on dyke emplacement and morphology. J. Geol. Soc. 2016, 173, 573–576. [Google Scholar] [CrossRef]
- Pe’rez-Flores, P.; Cembrano, J.; Sa´nchez-Alfaro, P.; Veloso, E.; Arancibia, G.; Roquer, T. Tectonics, magmatism and paleo-fluid distribution in a strike-slip setting: Insights from the northern termination of the Liquiñe-Ofqui fault System, Chile. Tectonophysics 2016, 680, 192–210. [Google Scholar] [CrossRef]
- Tang, Q.; Tang, S.; Luo, B.; Luo, X.; Feng, L.; Li, S.; Wu, G. Seismic Description of Deep Strike-Slip Fault Damage Zone by Steerable Pyramid Method in the Sichuan Basin, China. Energies 2022, 15, 8131. [Google Scholar] [CrossRef]
- Cao, S.; Neubauer, F. Deep crustal expressions of exhumed strike-slip fault systems: Shear zone initiation on rheological boundaries. Earth Sci. Rev. 2016, 162, 155–176. [Google Scholar] [CrossRef]
- Ramos, A.; García-Senz, J.; Pedrera, A.; Ayala, C.; Rubio, F.; Peropadre, C.; Mediato, J.F. Salt control on the kinematic evolution of the Southern Basque-Cantabrian Basin and its underground storage systems (Northern Spain). Tectonophysics 2021, 822, 229178. [Google Scholar] [CrossRef]
- Smeraglia, L.; Fabbri, O.; Choulet, F.; Jaggi, M.; Bernasconi, S.M. The role of thrust and strike-slip faults in controlling regional-scale paleofluid circulation in fold-and-thrust belts: Insights from the Jura Mountains (eastern France). Tectonophysics 2022, 829, 229299. [Google Scholar] [CrossRef]
- Gao, B.; Tian, F.; Pan, R.; Zheng, W.; Li, R.; Huang, T.; Liu, Y. Hydrothermal Dolomite Paleokarst Reservoir Development in Wolonghe Gasfield, Sichuan Basin, Revealed by Seismic Characterization. Water 2020, 12, 579. [Google Scholar] [CrossRef]
- Smith, J.D.; Avouac, J.-P.; White, R.S.; Copley, A.; Gualandi, A.; Bourne, S. Reconciling the Long-Term Relationship Between Reservoir Pore Pressure Depletion and Compaction in the Groningen Region(Article). J. Geophys. Res. Solid Earth 2019, 124, 6165–6178. [Google Scholar] [CrossRef]
- Molina, D.; Tassara, A.; Abarca, R.; Melnick, D.; Madella, A. Frictional Segmentation of the Chilean Megathrust From a Multivariate Analysis of Geophysical, Geological, and Geodetic Data. J. Geophys. Res. Solid Earth 2021, 126, e2020JB020647. [Google Scholar] [CrossRef]
- Chen, Y.; Zu, S.; Wang, Y.; Chen, X. Deblending of simultaneous source data using a structure-oriented space-varying median filter. Geophys. J. Int. 2020, 222, 1805–1823. [Google Scholar] [CrossRef]
- Guo, Z.; Gao, X. Azimuthally anisotropic seismic ambient noise tomography of South China block. Tectonophysics 2021, 823, 229187. [Google Scholar] [CrossRef]
- Zhou, B.; Pavlova, M.; Sliwa, R.; Sun, W. Seismic Diffraction Imaging for Improved Coal Structure Detection by a Structure-Oriented Moving Average Error Filter. IEEE Trans. Geosci. Remote Sens. 2022, 60, 1–13. [Google Scholar] [CrossRef]
- Qi, L. Structural characteristics and storage control function of the Shun I fault zone in the Shunbei region, Tarim Basin. J. Pet. Sci. Eng. 2021, 203, 108653. [Google Scholar] [CrossRef]
- Wang, J.; Zhang, J.; Yang, Y.; Du, Y. Anisotropic diffusion filtering based on fault confidence measure and stratigraphic coherence coefficients. Geophys. Prospect. 2021, 69, 1003–1016. [Google Scholar] [CrossRef]
- Bruno, P.P.G.; Villani, F.; Improta, L. High-Resolution Seismic Imaging of Fault-Controlled Basins: A Case Study From the 2009 Mw 6.1 Central Italy Earthquake. Tectonics 2022, 41, e2022TC007207. [Google Scholar] [CrossRef]
- Zhao, Q.; Zhu, H.; Zhou, X.; Liu, Q.; Cai, H.; Chang, Y. Tidal sand ridges seismic identification and its application in the Xihu Depression, East China Sea Shelf basin: Enlightenment to hydrocarbon exploration. J. Pet. Sci. Eng. 2022, 212, 110246. [Google Scholar] [CrossRef]
- Maraio, S.; Villani, F.; Bruno, P.; Sapia, V.; Improta, L. Active fault detection and characterization by ultrashallow seismic imaging: A case study from the 2016 Mw 6.5 central Italy earthquake. Tectonophysics 2023, 850, 229733. [Google Scholar] [CrossRef]
- Huang, Y.; Bao, H.; Qi, X. Geological Structure Interpretation of Coalbed Methane Enrichment Area based on VMDC and Curvature Attributes. Energies 2019, 12, 2852. [Google Scholar] [CrossRef]
- Manzi, M.S.; Cooper, G.R.; Malehmir, A.; Durrheim, R.J. Improved structural interpretation of legacy 3D seismic data from Karee platinum mine (South Africa) through the application of novel seismic attributes. Geophys. Prospect. 2019, 68, 145–163. [Google Scholar] [CrossRef]
- Lin, K.; Zhang, B.; Zhang, J.; Fang, H.; Xi, K.; Li, Z. Predicting the azimuth of natural fractures and in situ horizontal stress: A case study from the Sichuan Basin, China. Geophysics 2021, 87, B9–B22. [Google Scholar] [CrossRef]
- Bai, B.; Yang, C.; Sun, W. Simultaneously computing the 3D dip attributes for all the time samples of a seismic trace. J. Geophys. Eng. 2021, 18, 691–699. [Google Scholar] [CrossRef]
- Ray, A.K.; Khoudaiberdiev, R.; Bennett, C.; Bhatnagar, P.; Boruah, A.; Dandapani, R.; Maiti, S.; Verma, S. Attribute-assisted interpretation of deltaic channel system using enhanced 3D seismic data, offshore Nova Scotia. J. Nat. Gas Sci. Eng. 2022, 99, 104428. [Google Scholar] [CrossRef]
- Yu, M.; Gong, X.; Wan, X. Seismic Coherent Noise Removal of Source Array in the NSST Domain. Appl. Sci. 2022, 12, 10846. [Google Scholar] [CrossRef]
- Kamal’deen, O.O.; Alves, T.M. Mass-transport deposits controlling fault propagation, reactivation and structural decoupling on continental margins (Espirito Santo Basin, SE Brazil). Tectonophysics 2014, 628, 158–171. [Google Scholar]
- Méndez, J.N.; Jin, Q.; González, M.; Zhang, X.; Lobo, C.; Boateng, C.D.; Zambrano, M. Fracture characterization and modeling of karsted carbonate reservoirs: A case study in Tahe oilfield, Tarim Basin (western China). Mar. Pet. Geol. 2019, 112, 104104. [Google Scholar] [CrossRef]
- Kim, Y.; Hardisty, R.; Marfurt, K.J. Attribute selection in seismic facies classification: Application to a Gulf of Mexico 3D seismic survey and the Barnett Shale. Interpretation 2019, 7, SE281–SE297. [Google Scholar] [CrossRef]
- Oliveira, K.M.L.; Bedle, H.; Molina, K.L.M. Identification of polygonal faulting from legacy 3D seismic data in vintage Gulf of Mexico data using seismic attributes. Interpretation 2021, 9, C23–C28. [Google Scholar] [CrossRef]
- Zhao, Z.; Kumar, D.; Foster, D.J.; Dralus, D.; Sen, M.K. Frequency-dependent AVO analysis: A potential seismic attribute for thin-bed identification. Geophysics 2021, 86, 1JA-X4. [Google Scholar] [CrossRef]
- Ma, J.; Plonka, G.; Chauris, H. A New Sparse Representation of Seismic Data Using Adaptive Easy-Path Wavelet Transform. IEEE Geosci. Remote Sens. Lett. 2010, 7, 540–544. [Google Scholar] [CrossRef]
- Song, C.; Li, L.; Li, L.; Li, K. Robust K-means algorithm with weighted window for seismic facies analysis. J. Geophys. Eng. 2021, 18, 618–626. [Google Scholar] [CrossRef]
- Adinolfi, G.M.; De Matteis, R.; Orefice, A.; Festa, G.; Zollo, A.; de Nardis, R.; Lavecchia, G. The September 27, 2012, ML 4.1, Benevento earthquake: A case of strike-slip faulting in Southern Apennines (Italy). Tectonophysics 2015, 660, 35–46. [Google Scholar] [CrossRef]
- Huang, Y. Smooth Crustal Velocity Models Cause a Depletion of High-Frequency Ground Motions on Soil in 2D Dynamic Rupture Simulations. Bull. Seism. Soc. Am. 2021, 111, 2057–2070. [Google Scholar] [CrossRef]
- Kim, D.; Keranen, K.M.; Abers, G.A.; Brown, L.D. Enhanced Resolution of the Subducting Plate Interface in Central Alaska From Autocorrelation of Local Earthquake Coda. J. Geophys. Res. Solid Earth 2019, 124, 1583–1600. [Google Scholar] [CrossRef]


| Categories | Types of Attributes | Results | Score |
|---|---|---|---|
| Energy | Root mean square amplitude | Not clear fault | 3 |
| Low-frequency energy | Clear fault with the large noise disturbance of the whole area | 6.5 | |
| High-frequency attenuation | Not clear fault | 4 | |
| Curvature | Maximum positive curvature | Clear fault with the large noise disturbance of the whole area | 6 |
| Minimum negative curvature | Clear fault with the large noise disturbance of the whole area | 7 | |
| Dip | Clear fault with the large noise disturbance of the partial area | 7.5 | |
| Correlation | Coherent | Clear fault with the large noise disturbance of the partial area | 7 |
| Likelihood | Not clear fault | 3 | |
| Ant tracking | Clear main fault with false branch fault | 8.5 | |
| Auto fault extraction (AFE) | Clear fault with the large noise disturbance of the partial area | 7 | |
| Gradient | Amplitude variance | Clear fault with the large noise disturbance of the whole area | 7.5 |
| Amplitude gradient | Clear main fault and clear branch fault | 9 |
Disclaimer/Publisher’s Note: The statements, opinions and data contained in all publications are solely those of the individual author(s) and contributor(s) and not of MDPI and/or the editor(s). MDPI and/or the editor(s) disclaim responsibility for any injury to people or property resulting from any ideas, methods, instructions or products referred to in the content. |
© 2024 by the authors. Licensee MDPI, Basel, Switzerland. This article is an open access article distributed under the terms and conditions of the Creative Commons Attribution (CC BY) license (https://creativecommons.org/licenses/by/4.0/).
Share and Cite
Tian, F.; Zheng, W.; Zhao, A.; Liu, J.; Liu, Y.; Zhou, H.; Cao, W. Seismic Identification and Characterization of Deep Strike-Slip Faults in the Tarim Craton Basin. Appl. Sci. 2024, 14, 8235. https://doi.org/10.3390/app14188235
Tian F, Zheng W, Zhao A, Liu J, Liu Y, Zhou H, Cao W. Seismic Identification and Characterization of Deep Strike-Slip Faults in the Tarim Craton Basin. Applied Sciences. 2024; 14(18):8235. https://doi.org/10.3390/app14188235
Chicago/Turabian StyleTian, Fei, Wenhao Zheng, Aosai Zhao, Jingyue Liu, Yunchen Liu, Hui Zhou, and Wenjing Cao. 2024. "Seismic Identification and Characterization of Deep Strike-Slip Faults in the Tarim Craton Basin" Applied Sciences 14, no. 18: 8235. https://doi.org/10.3390/app14188235