Article

Comprehensive Cost–Energy Evaluation of Wall Insulation for Diverse Orientations and Seasonal Usages

by
Ahmet Serhan Canbolat
Department of Mechanical Engineering, Engineering Faculty, Bursa Uludag University, 16059 Bursa, Türkiye
Appl. Sci. 2024, 14(18), 8239; https://doi.org/10.3390/app14188239
Submission received: 9 August 2024 / Revised: 10 September 2024 / Accepted: 11 September 2024 / Published: 12 September 2024

Abstract

:
An optimization study on thermal insulation applied to building exteriors has been performed in this research. Solar radiation has been considered while obtaining optimum insulation thicknesses for various directions. Analyses have been conducted not only for the cardinal directions (south, north, west, and east) but also for the intermediate directions (southeast, northeast, northwest, and southwest). Solar radiation received by vertical walls and cooling and heating degree day values have been computed according to directions. This research examines the most suitable insulation thicknesses for different seasonal usage scenarios, considering cooling, heating, and annual energy demands. Variations in energy cost savings, savings rates, payback periods, seasonal energy demands, and optimum insulation thicknesses for various wall orientations have been presented. Additionally, correlations providing the total cost based on the applied insulation thickness for each direction and various building usage scenarios have been determined. The results indicate that incoming solar radiation varies from 52.08 W/m2 to 111.82 W/m2 across different wall orientations, while energy cost savings range from 23.48 USD/m2 to 24.56 USD/m2, with savings rates between 69.8% and 70.3%. Payback periods range from 5.94 to 6.05 years. Depending on the wall orientation, optimum insulation thicknesses vary between 4.52 and 5.02 cm for heating, 1.56 and 2.09 cm for cooling, and 5.92 and 6.08 cm for annual energy requirements. The heating energy demands ranged from 54.8 MJ/m2 to 58.38 MJ/m2, while the cooling energy demands varied between 10.91 MJ/m2 and 12.08 MJ/m2, depending on the wall orientation. It has been concluded that the ideal insulation thicknesses for meeting cooling, heating, and annual energy demands vary depending on the wall orientation and the building’s use purpose.

1. Introduction

Energy conservation is becoming an indispensable topic around the world. Especially in recent years, this issue has gained more importance due to the increase in energy unit prices. Several factors, notably the quick resurgence of the economy after the COVID pandemic contributed to the tightening of energy markets in 2021. Natural gas prices experienced sharp increases, reaching record highs in 2022, followed by significant fluctuations, as seen in Figure 1 [1]. Because of these elevated and volatile prices, the cost of electricity generation is expected to remain unpredictable, making it crucial to improve energy efficiency [2]. Due to these adverse developments experienced worldwide, what needs to be done is to use the existing energy as efficiently as possible.
Thermal insulation applications on buildings’ external walls are frequently used for energy conservation. There are some studies on this topic in the literature. Kaynakli [3] conducted a study to investigate various factors affecting the determination of the optimal insulation thickness. These factors included cooling and heating loads, energy costs, discount and inflation rates, lifetime, and physical properties of the insulation material. The study utilized a comprehensive life cycle cost analysis approach to determine the most appropriate thickness. In the study by Ozel [4], an investigation was conducted in order to acquire the most suitable insulation thickness for a construction situated in a warm climatic region. The outcomes of the study, acquired through dynamic thermal assessments, were compared with those obtained from the degree-hour and degree-day approaches. The results show that in the summer season, the north-facing wall is found to be the most economical wall direction, which has an insulation thickness of 3 cm. Canbolat et al. [5] carried out a detailed statistical analysis to obtain the optimal insulation thickness, considering factors, such as the insulation cost, present worth factor, electricity cost, fuel cost, coefficient of cooling system performance, heating system efficiency, and heating-cooling degree days, by using the Taguchi method. The study revealed that the key factors influencing the determination of the ideal insulation thickness were heating degree days, insulation cost, and the present worth factor. Kurekci [6] conducted an examination to obtain the optimal insulation thicknesses for Türkiye’s 81 provinces. Analyses were carried out for various fuels, which were LPG, fuel oil, coal, and natural gas. Furthermore, they examined five distinct insulation materials, including expanded polystyrene, rock wool, polyurethane, extruded polystyrene, and glass wool. According to the results of the study, the ideal insulation thickness for buildings that require both cooling and heating is typically higher than that for buildings that only require heating. While this difference is more pronounced in warm climates, it is a practically negligible degree in cold climates. Ozel [7] conducted a parametric study on the optimum insulation thickness under dynamic thermal conditions by changing the indoor design temperatures. The outcomes of this research demonstrate that the indoor design temperature and wall direction have an impact on cooling, heating, and annual transmission loads. Kaynakli [8] conducted a literature review on thermal insulation applications for buildings’ external walls, with particular emphasis on establishing an economically viable insulation thickness. He summarized the insulation applications in the literature based on the purposes (emission reduction or cost reduction), methods for determining heating/cooling loads in buildings, financial analysis methods, types of insulation materials, fuel types, climate regions where insulation is applied, and optimum insulation thicknesses in tabular form. The study determined that insulation applications were conducted with a focus on either cost or environmental considerations. It was noted that the degree-day or degree-hour methods were utilized in determining heating/cooling energy loads, while financial analysis methods such as life cycle cost analysis, simple payback period, and the P1–P2 method were employed. Various insulation materials, including extruded polystyrene, stone wool, fiberglass, wood wool, mineral wool, rock wool, polyethylene, and polyurethane, among others, were used. Additionally, as a fuel source, variety of fuels such as diesel, coal, natural gas, electricity, LPG, and fuel oil were utilized. Verichev et al. [9] investigated the effect of degree-day methods on the optimum thermal insulation thickness in life cycle cost analysis (LCCA). Their goal was to illustrate the variations and uncertainties in the LCCA results, considering different base temperatures for heating degree days and cooling degree days for two different methods (UKMO and ASHRAE) in Andalusia, Spain. They concluded that, on average, the heating degree days computed by using the UKMO method were greater, by 12.5%, than those computed by using the ASHRAE method. Albatayneh [10] analyzed the key design factors in a building situated in a cool climate zone. The parameters were categorized into two groups: a group of highly significant factors—including the flat roof design, window blind type, ground floor type, window–wall proportion, nearby shading and glazing type, passive ventilation, air infiltration rate, and window shading management plan—and a group of less critical factors, including the exterior wall construction, site orientation, and partition construction. The study revealed that, in the case of insulation under the most suitable conditions, there were energy savings of 88.1%, 94.2%, and 78.5% observed for the overall energy consumption, cooling load, and heating load, respectively. Onan et al. [11] determined the ideal insulation thickness of exterior walls for the heating season by continuously measuring the indoor and outdoor temperatures using thermocouples. They recorded the values in four different directions throughout the year. The findings of their research suggested that considering variations in solar radiation exposure across different orientations, the ideal insulation thickness for walls facing the north, south, west, and east should be 6.47, 2.87, 6.97, and 6.98 cm, respectively. Vincelas et al. [12] examined the insulation thicknesses in the exterior walls of a structure situated in a tropical climate region in Cameroon by changing the insulation type and wall structure. Based on the ideal thermal insulation thickness, they determined the payoff durations and energy expenditure reductions. They contrasted the outcomes of their research with those of other studies in the literature. As et al. [13] conducted a study to enhance energy efficiency during the design phase of hospital buildings in Türkiye and to develop an energy-efficient hospital model considering CO2 emissions using software named Green Building Studio (2023). They noted that the lack of insulation in the walls resulted in a substantial increase of 10.09% in CO2 emissions. Furthermore, it was observed that CO2 emissions increased by 4.43%, 8.24%, 17.10%, and 12.05% for walls facing the east, west, north, and south orientations, respectively. Altun [14] performed a dynamic modeling analysis to assess both the thermal and financial aspects of a specific area, aiming to identify the optimal facade factors such as window types and insulation thicknesses. The findings of the study underscored the importance of design considerations in enhancing energy efficiency and economic viability, encompassing factors like the glazing type, window area, orientation, and insulation thickness. Yuan et al. [15] contributed to the literature about thermal insulation applications by utilizing up-to-date data to determine the optimum insulation thickness and CO2 emissions for various climatic zones. Based on the findings, climatic regions that are extremely hot and extremely cold are much more suitable for applying thermal insulation for energy saving. Gigasari et al. [16] determined the carbon payback time through a life cycle assessment method, taking into account the global warming potential of nine different insulation materials at their ideal thicknesses. The findings showed that among the four cardinal orientations (north, south, east, and west), aerogel exhibited the longest carbon payback time of 2.34 years, while glass wool had the shortest carbon payback time of only 0.09 years. Xu et al. [17] evaluated the impact of different insulation materials like perlite, expanded polystyrene, foamed polyvinyl chloride, and rock wool on ideal thermal insulation thickness for a greenhouse, which is a unique construction unlike a standard building. Although foamed polyvinyl chloride has lower thermal conductivity than others, they did not recommend it as an energy-saving material because of its high price. Akan [18] conducted research on determining the ideal thermal insulation thickness for all cities in Türkiye through life cycle cost analysis. Polyurethane foam, extruded polystyrene, expanded polystyrene, and rock wool as insulation materials were considered due to their common usage. Natural gas was chosen for heating the buildings, while electricity was chosen for cooling purposes. In this research, a regression model was developed utilizing MATLAB v.2024a to determine the ideal insulation thickness, yielding results closely aligned with theoretical findings. Bademlioglu et al. [19] investigated the condensation effect on insulation applications, considering the water vapor diffusion resistance factor. In addition to insulation thickness minimization, they performed heat and mass transfer calculations for different relative humidity values and indoor–outdoor temperatures. They concluded that when employing insulation materials with low vapor diffusion resistance factors, the thermal conductivity of the insulation material does not significantly impact the minimum required insulation thickness to prevent condensation. Canbolat [20] performed a multiple optimization study considering the total cost and CO2 emissions for four climatic regions, three heating sources, four insulation materials, and three scenarios of seasonal usage. He determined ideal insulation thicknesses, energy cost savings, energy saving rates, payback periods, carbon savings, and carbon saving rates for numerous cases. It was found that when the primary aim of applying insulation is to reduce CO2 emissions, the determined ideal thicknesses of insulation tend to be greater than those determined when the focus is primarily on minimizing overall costs. Omle et al. [21] performed a transient simulation to determine the ideal insulation thickness, life cycle energy savings, and payback period considering the orientation of the outer walls and solar radiation effect for a building in Miskolc City, Hungary. They found that for the north-oriented wall, the ideal insulation thicknesses were 17 cm for EPS, 22 cm for glass wool, and 12 cm for rock wool. Correspondingly, the life cycle energy savings were 142.5 kWh/m2 for EPS, 153 kWh/m2 for glass wool, and 132.12 kWh/m2 for rock wool.
As seen from the literature review, many studies have been conducted lately, focusing on different factors and using different approaches to the optimum insulation thickness. Correlatively, due to the energy crisis we have been through, energy efficiency in buildings will continue to be a priority in the foreseeable future and will remain relevant.
In the existing literature, studies on insulation thickness optimization have often been limited to considering only the cardinal directions (south, north, east, and west), without examining the impact of intermediate directions, which can significantly affect energy performance due to variations in solar irradiance. Additionally, most studies focus on either heating or cooling scenarios separately, rather than a comprehensive analysis encompassing multiple seasonal usage scenarios. Moreover, there has been a lack of detailed evaluations that utilize visual tools such as radar graphs to effectively convey the variation in solar radiation, insulation thicknesses, and associated energy demands and costs across different orientations. This study addresses these gaps by providing a comprehensive analysis that includes all cardinal and intermediate directions, offering a complete understanding of how solar irradiance influences optimal insulation thicknesses. Additionally, it introduces three alternative scenarios (cooling-only, heating-only, and both cooling and heating) to assess insulation performance under varying conditions. Correspondingly, the ideal thermal insulation thickness for each scenario is determined. Seasonal energy demands, payback periods, energy cost savings, savings rates, and optimum insulation thicknesses are also determined for various wall orientations. By developing new correlations for the total cost based on the insulation thickness for each direction and usage scenario, this work also provides a practical guidance, which has not been previously available in the literature.

2. Mathematical Model

2.1. Degree-Day Approach and Solar Radiation Effect

Various methods are available for calculating the annual energy consumption. The degree-day approach is the most reasonable and essential approach to obtain a building’s annual energy consumption [6,20,22,23]. According to this approach, a building’s energy requirement is correlated with the deviation from the base temperature (Tb) and the daily mean outdoor temperature. The base temperature represents the outdoor temperature, below or above which heating or cooling is required [24]. By accounting for the impact of solar irradiance on the building exterior, the annual heating degree days (HDDs) is formulated as [24]
H D D = d = 1 365 ( T b T s o l a i r ) +
where T b and T s o l a i r are the base temperature and solar air temperature, respectively. The + symbol above the parenthesis states that values exceeding zero should be included in the count; therefore, in the case of T s o l a i r > T b , the temperature variance should be considered zero. Similarly, cooling degree days (CDDs) is calculated using Equation (2):
C D D = d = 1 365 ( T s o l a i r T b ) +
This time, the variance in temperature should be considered zero in the case of T b > T s o l a i r in Equation (2).
In place of the average outdoor temperature for the day, solar air temperature ( T s o l a i r ) is used to account for the thermal load generated by solar irradiance when calculating the cooling and heating degree days. The term “solar air temperature” relates to both the solar radiative flux and the external ambient air temperature [25].
T s o l a i r = T 0 + α s q ˙ s h 0 ε σ T 0 4 T s u r r 4 h 0
In this equation, α s represents the surface’s solar absorption rate, T 0 is the outdoor air temperature, h 0 is the combined radiation and convection coefficient of the exterior surface, q ˙ s is the solar irradiance reaching the surface, σ is the Stefan Boltzmann constant, ε is radiative emission coefficient of surface, and T s u r r is the sky and surrounding surface temperature. The second term denotes the heat from solar exposure impact on the opaque surface in Equation (3). If T s u r r is not equal to T 0 , a correction factor for heat transfer via radiation between the surface and its surroundings is added to the equation, which is the last term.
The solar irradiance received by a surface is contingent upon its orientation and slope. Solar irradiance received by vertical exterior walls can be determined using the following equations [26].
Firstly, the clearness index ( K T ) is determined through Equation (4):
K T = q ˙ h q ˙ 0 , h = a + b S S 0
Here, q ˙ 0 , h is the monthly mean daily extraterrestrial radiation, q ˙ h is the monthly mean daily global solar radiation, a and b are the empirical parameters relating to the zone, S / S 0 is the relative sunshine duration. The a and b parameters are determined depending on the declination angle ( δ ), altitude ( Z ), and latitude angle ( ) with the following equations [27]:
a = 0.103 + 0.000017 Z + 0.198 cos δ
b = 0.533 0.165 cos δ
The monthly mean daily extraterrestrial radiation can be computed using the following equation [28]:
q ˙ 0 , h = G s , c π 1 + 0.033 c o s n 360 365 c o s c o s δ s i n ω s + 2 π ω s 360 s i n s i n δ
Here, n is the day of the year, ω s is the month’s sunset hour angle, and G s , c is the solar constant taken as 1367 W/m2 [28].
The incidence’s angle of direct solar irradiance ( θ ) in terms of other angles in the most general form is expressed below [28]:
c o s θ = s i n δ s i n c o s β s i n δ c o s s i n β c o s γ + c o s δ c o s c o s β c o s ω + c o s δ s i n s i n β c o s γ c o s ω + c o s δ s i n β s i n γ s i n ω
Here, β is the inclination angle of the surface, and Equation (8) can be simplified for the vertical surfaces ( β = 90°) as shown in Equation (9). This equation is valid for all directions, namely south, north, west, east, southeast, northeast, northwest, and southwest [28]:
c o s θ = s i n δ c o s c o s γ + c o s δ s i n c o s γ c o s ω + c o s δ s i n γ s i n ω
Considering the direction of the vertical surface, Equation (9) is reproduced according to the surface’s azimuth angle ( γ ). For the south, north, west, east, southeast, northeast, northwest, and southwest directions, the azimuth angle is taken as γ = 0°, γ = 180°, γ = 90°, γ = 270°, γ = 315°, γ = 225°, γ = 135°, and γ = 45°, respectively.
For the horizontal surfaces ( β = 0°), the angle of incidence of solar radiation, which is called the zenith angle ( θ z ) , can be calculated as follows [28]:
c o s θ z = c o s δ c o s c o s ω + s i n δ s i n
R b values can be calculated separately for each direction by proportioning the c o s θ and c o s θ z values, as shown in Equation (11).
R b = c o s θ c o s θ z
Based on the clearness index ( K T ), which is mentioned earlier, the average daily diffuse radiation for the horizontal surface ( q ˙ h , d ) is expressed as follows [29].
q ˙ h , d = q ˙ h 0.703 0.414 K T 0.428 K T 2
Incoming solar radiation on vertical surfaces, equal to the sum of the direct, diffuse, and reflected solar radiations, can be determined using the following equation. In this equation, ρ is the reflectance of the ground, and it is assumed to be 0.2 [28].
q ˙ s = q ˙ h 1 q ˙ h , d q ˙ h R b + q ˙ h , d 1 + c o s β 2 + q ˙ h ρ 1 c o s β 2

2.2. Heating and Cooling Energy Demands on an Annual Scale

To compute the yearly cooling and heating energy demands, in addition to the H D D and C D D , some essential parameters, such as overall heat transfer coefficient ( U ) , cooling system performance coefficient (COP), and heating system efficiency (η), should be determined. The wall structure considered in the analysis consists of interior and exterior plaster, hollow bricks, and insulation material, as shown in Figure 2. In this study, it is presupposed that heating relies on natural gas, while cooling is powered by electricity, and the required values are detailed in Table 1. The selection of financial parameters for this study is based on published data from the Central Bank of Türkiye [30].
The following equation is used to establish the overall heat transfer coefficient. Here, R w represents the wall’s thermal resistance in the absence of insulation, h i corresponds to the heat transfer coefficient on the interior side, h d corresponds to the heat transfer coefficient on the exterior side, k stands for the insulation material’s thermal conductivity, and x represents its thickness. The assumed heat transfer coefficients for the interior and exterior are 8.29 W/m2K and 28.35 W/m2K, respectively.
U = 1 1 h i + R w + x k + 1 h d
Suppose a wall’s total thermal resistance without insulation is called ( R t , w ). In that case, the equation of the wall’s overall heat transfer coefficient with insulation can be simplified as [3]:
U = 1 R t , w + x k
The yearly energy demand for heating per unit area because of heat loss through the wall may be computed using the following equation [31].
q A , H = 86,400   H D D   U / η
Here, η is the heating system’s efficiency, and it is usually accepted as 0.93 for natural gas heating systems [31]. Likewise, the annual energy demand for cooling per unit area because of heat gain through the wall is found as follows [31]:
q A , C = 86,400   C D D   U / C O P
Here, C O P is the coefficient of cooling system performance and depends on operational factors. However, it is commonly considered to be 2.5 [24].

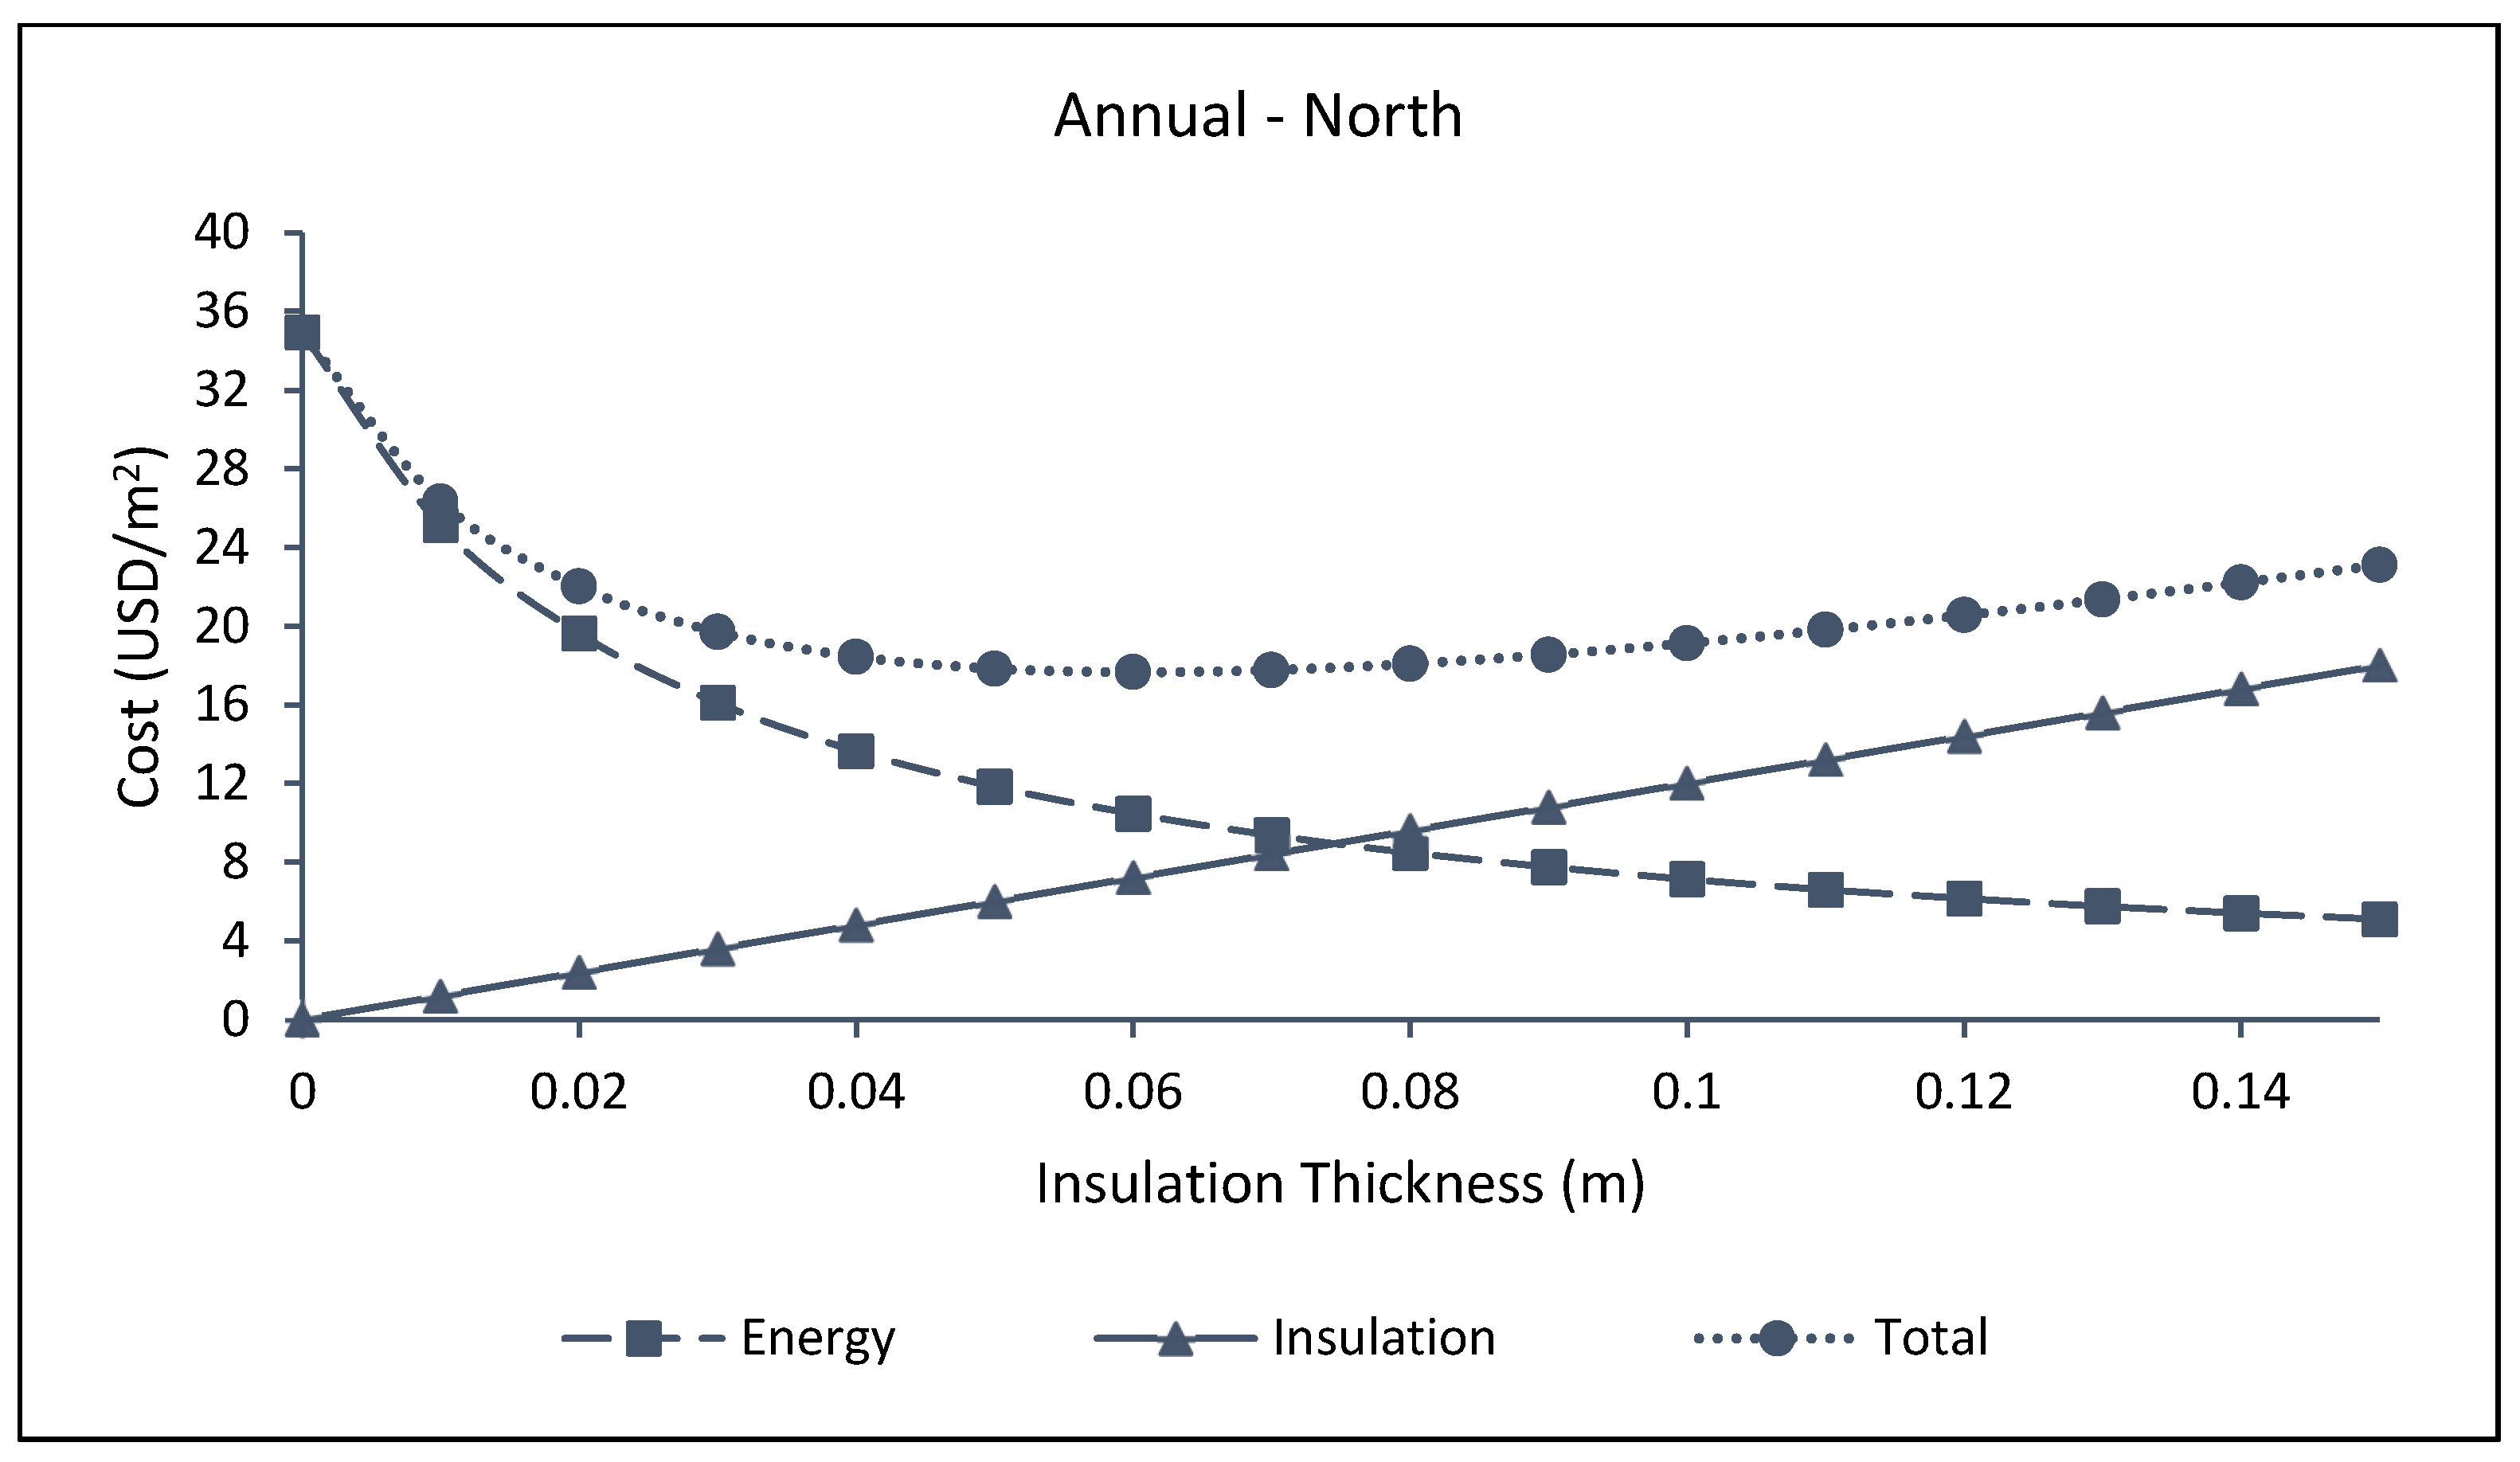
2.3. Economic Evaluation of Insulation Thickness

This investigation employs life cycle cost analysis, a commonly favored approach [31,32,33,34], to ascertain the overall expenses associated with heating and cooling throughout a building’s lifespan.
It is certain that a thicker insulation material results in higher insulation costs but a decrease in heating/cooling loads and energy expenses. As the insulation thickness augments, there is a corresponding increase in material costs, requiring a balance between the added cost and reduced heating/cooling expenses. The lowest overall cost is attained when using the optimal insulation thickness. Deviating from this optimal thickness results in a higher overall cost.
The expense of insulating external walls varies based on the thickness of the material.
C t , i n s = C i n s x
Here, the cost per unit volume of the insulation material is represented by C i n s . The total cost is computed by combining the insulation cost with the present value of cooling and heating expenses throughout the building’s lifespan.
The present worth factor ( P W F ) is a financial metric used to estimate the value of a cash flow stream in today’s money, given a specified discount rate and time horizon. It is based on the principle of discounting future cash flows to present values by considering the time value of money. The P W F is calculated using the discount rate ( g ), inflation rate ( i ), and expected building lifetime ( L T ) as follows [8]:
P W F = 1 + i g i 1 1 + i 1 + g L T
The building’s expected lifetime ( L T ) is set at 20 years [4]. As a result, the total heating cost can be computed using the following equations [20]:
C t , H = C i n s x + C H , p v
C t , H = C i n s x + 86,400 H D D C f P W F R t , w + x k H u η
Here, C f is the fuel cost, H u is the lower heating value of natural gas, which has been selected as the heating fuel due to its growing usage for space heating globally in recent years. Table 1 includes information on specific values associated with natural gas.
The C t , H equation must be minimized to find the ideal insulation thickness for the heating season. The derivative of the C t , H equation concerning the insulation thickness is calculated and equated to zero, yielding the ideal insulation thickness for the heating degree day as shown below [20]:
x o p t , H = 86,400 H D D C f P W F k H u η C i n s 0.5 R t , w k
In the same manner, the total cost and the ideal insulation thickness for the cooling season are represented as follows [20]:
C t , C = C i n s x + C C , p v
C t , C = C i n s x + 86,400 C D D C e P W F R t , w + x k C O P
The electricity cost used by the cooling system is represented by C e , expressed in USD per kilowatt-hour, as shown in Table 1. Similarly, the ideal insulation thickness for the cooling season is calculated by minimizing Equation (24) as demonstrated below [20]:
x o p t , C = 86,400 C D D C e P W F k C O P C i n s 0.5 R t , w k
The equations mentioned above can be used for only one specific target. While the x o p t , H equation can be used for a building heated but not cooled, x o p t , C can be used for a building cooled but not heated. For this reason, it is necessary to compute the annual total cost ( C t , A ) and determine the optimal insulation thickness considering the annual total cost ( x o p t , A ) for a building both cooled and heated [20]:
C t , A = C i n s x + 86,400 H D D C f P W F R t , w + x k H u η + 86,400 C D D C e P W F R t , w + x k C O P
x o p t , A = 86,400 P W F ( C f H D D / H u η + C e C D D / C O P ) k C i n s 0.5 R t , w k
The energy cost savings ( E C S s ) for cooling and heating throughout the system’s lifespan are figured by comparing the expenses for heating and cooling in insulated versus uninsulated structures. The E C S is computed using the following equation [20].
E C S = C H , p v + C C , p v x = 0 C H , p v + C C , p v x = x o p t , A
The payback period is determined by dividing the cost of insulation by the yearly savings in energy costs. The payback period represents the time needed to recoup the initial investment and can be calculated using the following equation [20].
P a y b a c k   P e r i o d = ( C i n s x o p t , A ) E C S / L T
The savings rate is determined by dividing the energy cost savings by the annual total cost without insulation, and it can be expressed as follows [32]:
S a v i n g s   R a t e = E C S C t , A x = 0

3. Results and Discussion

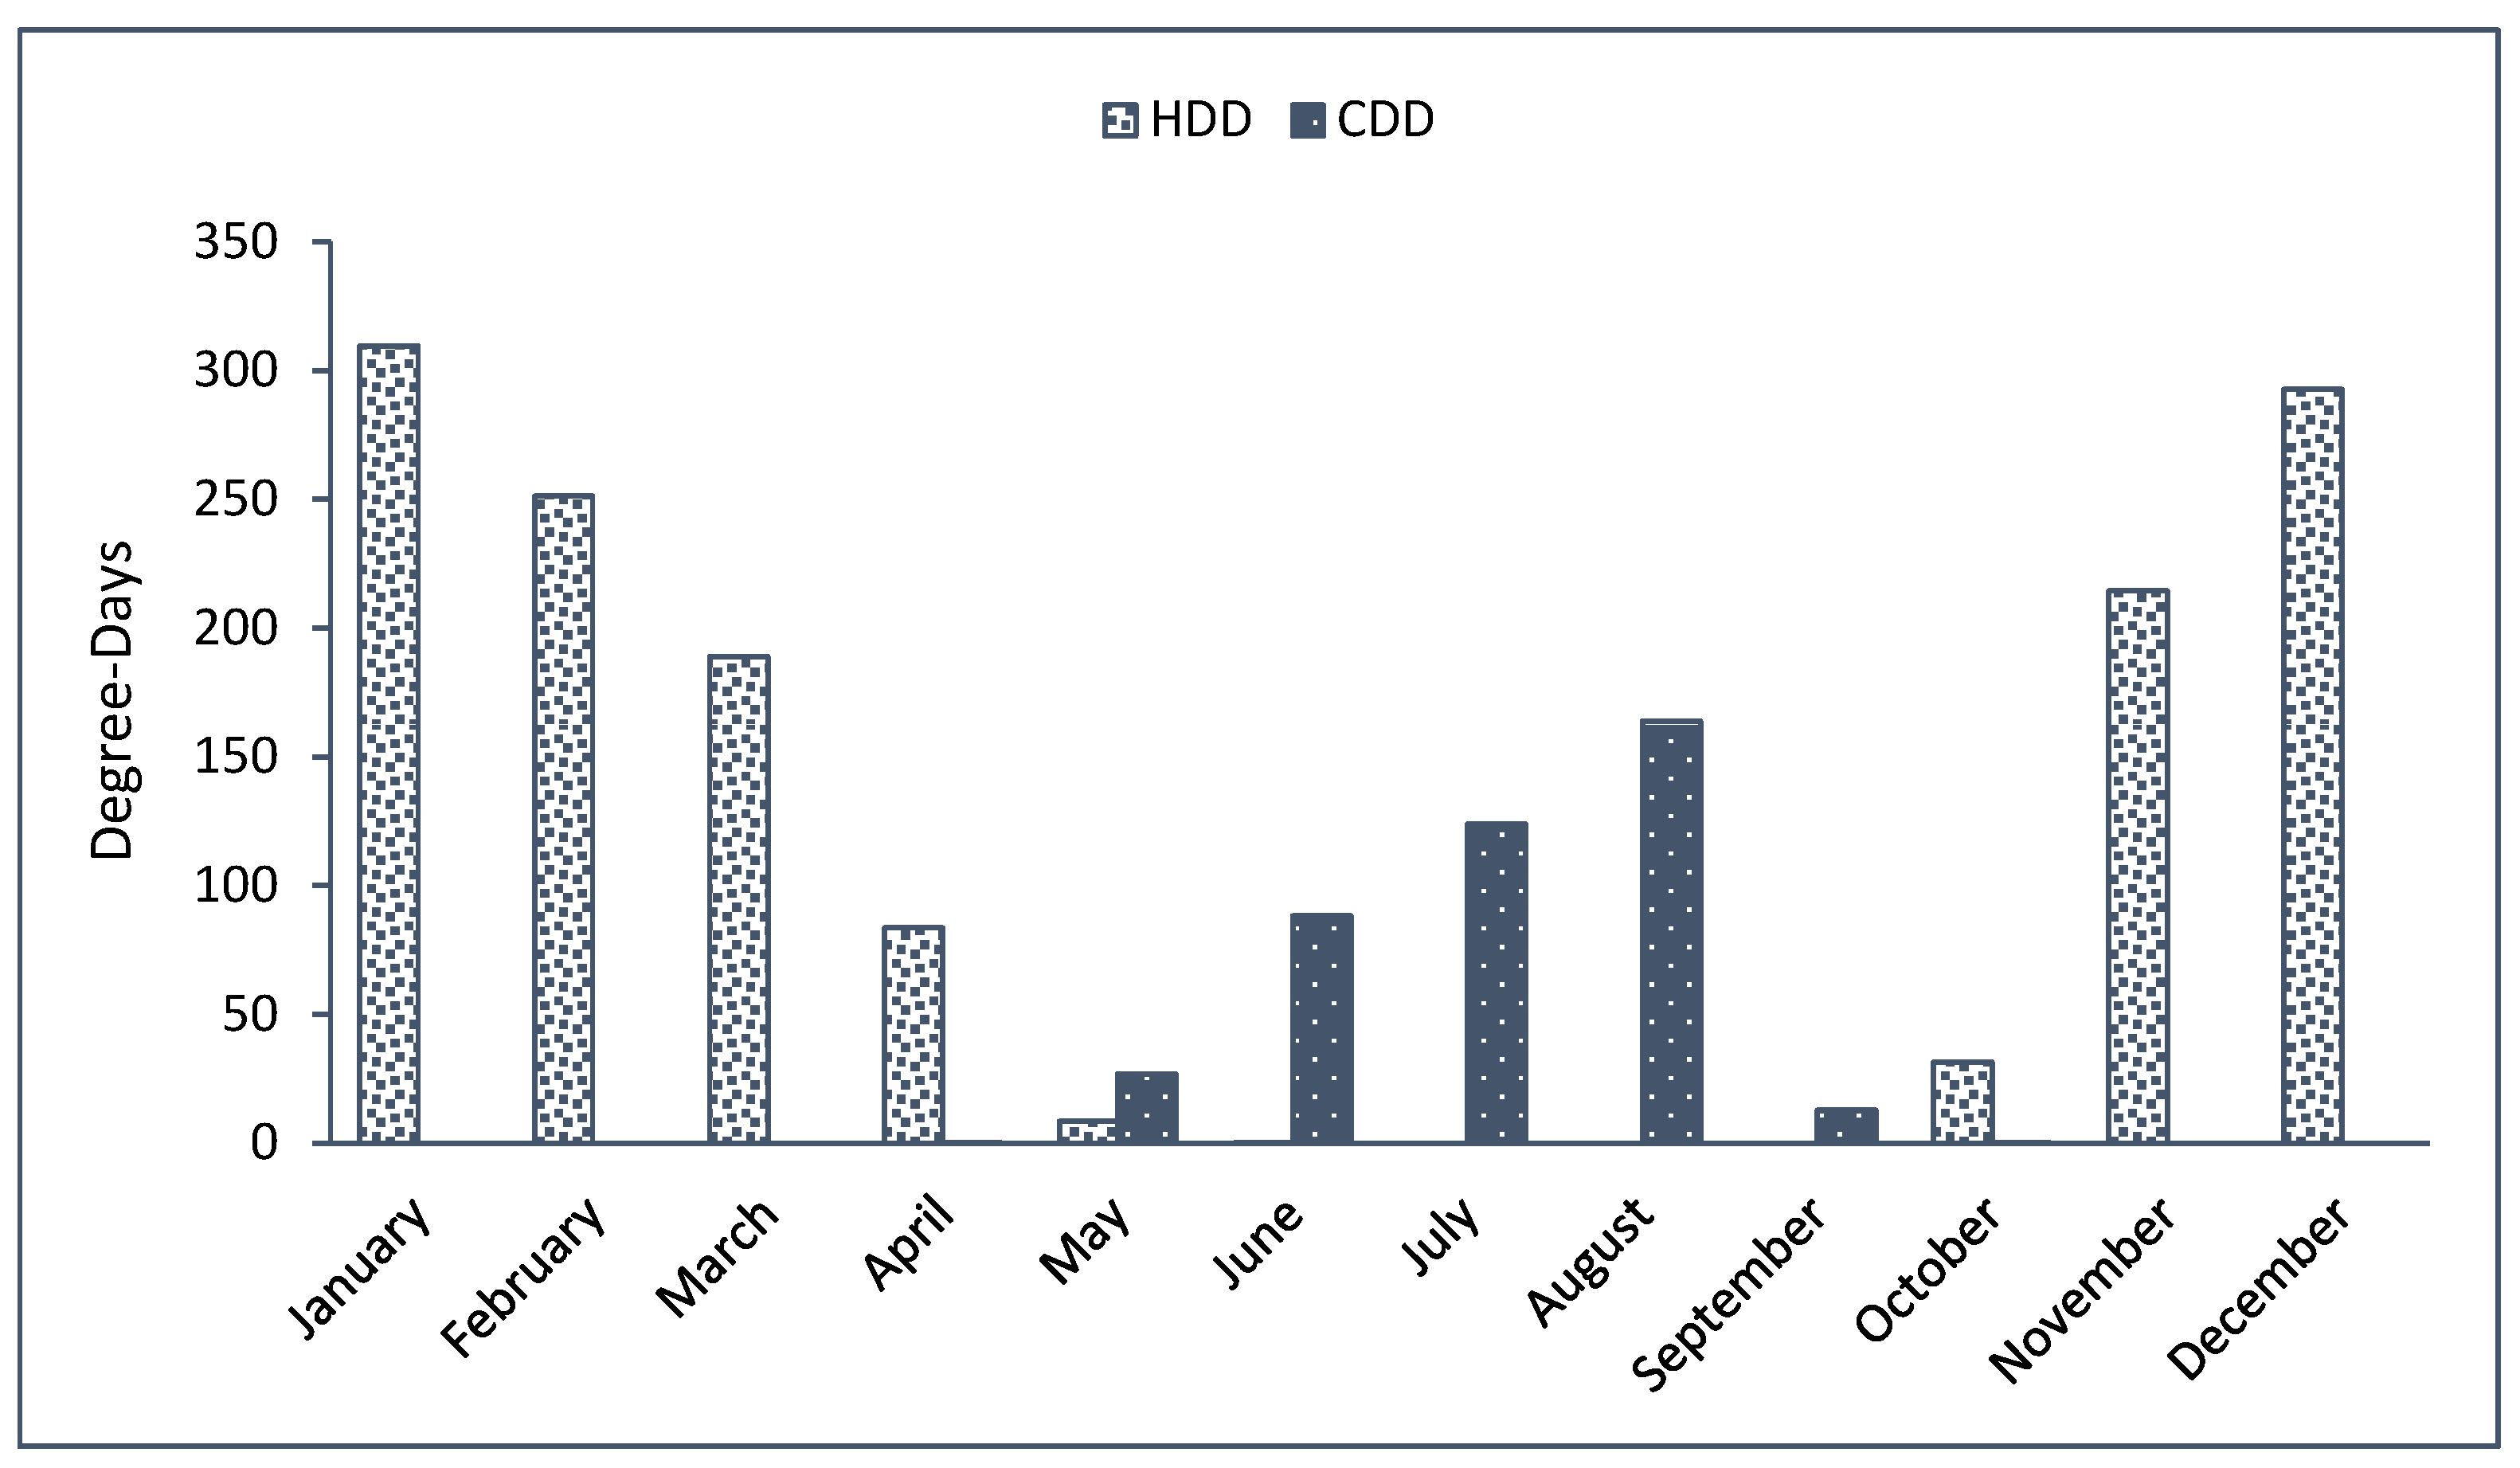
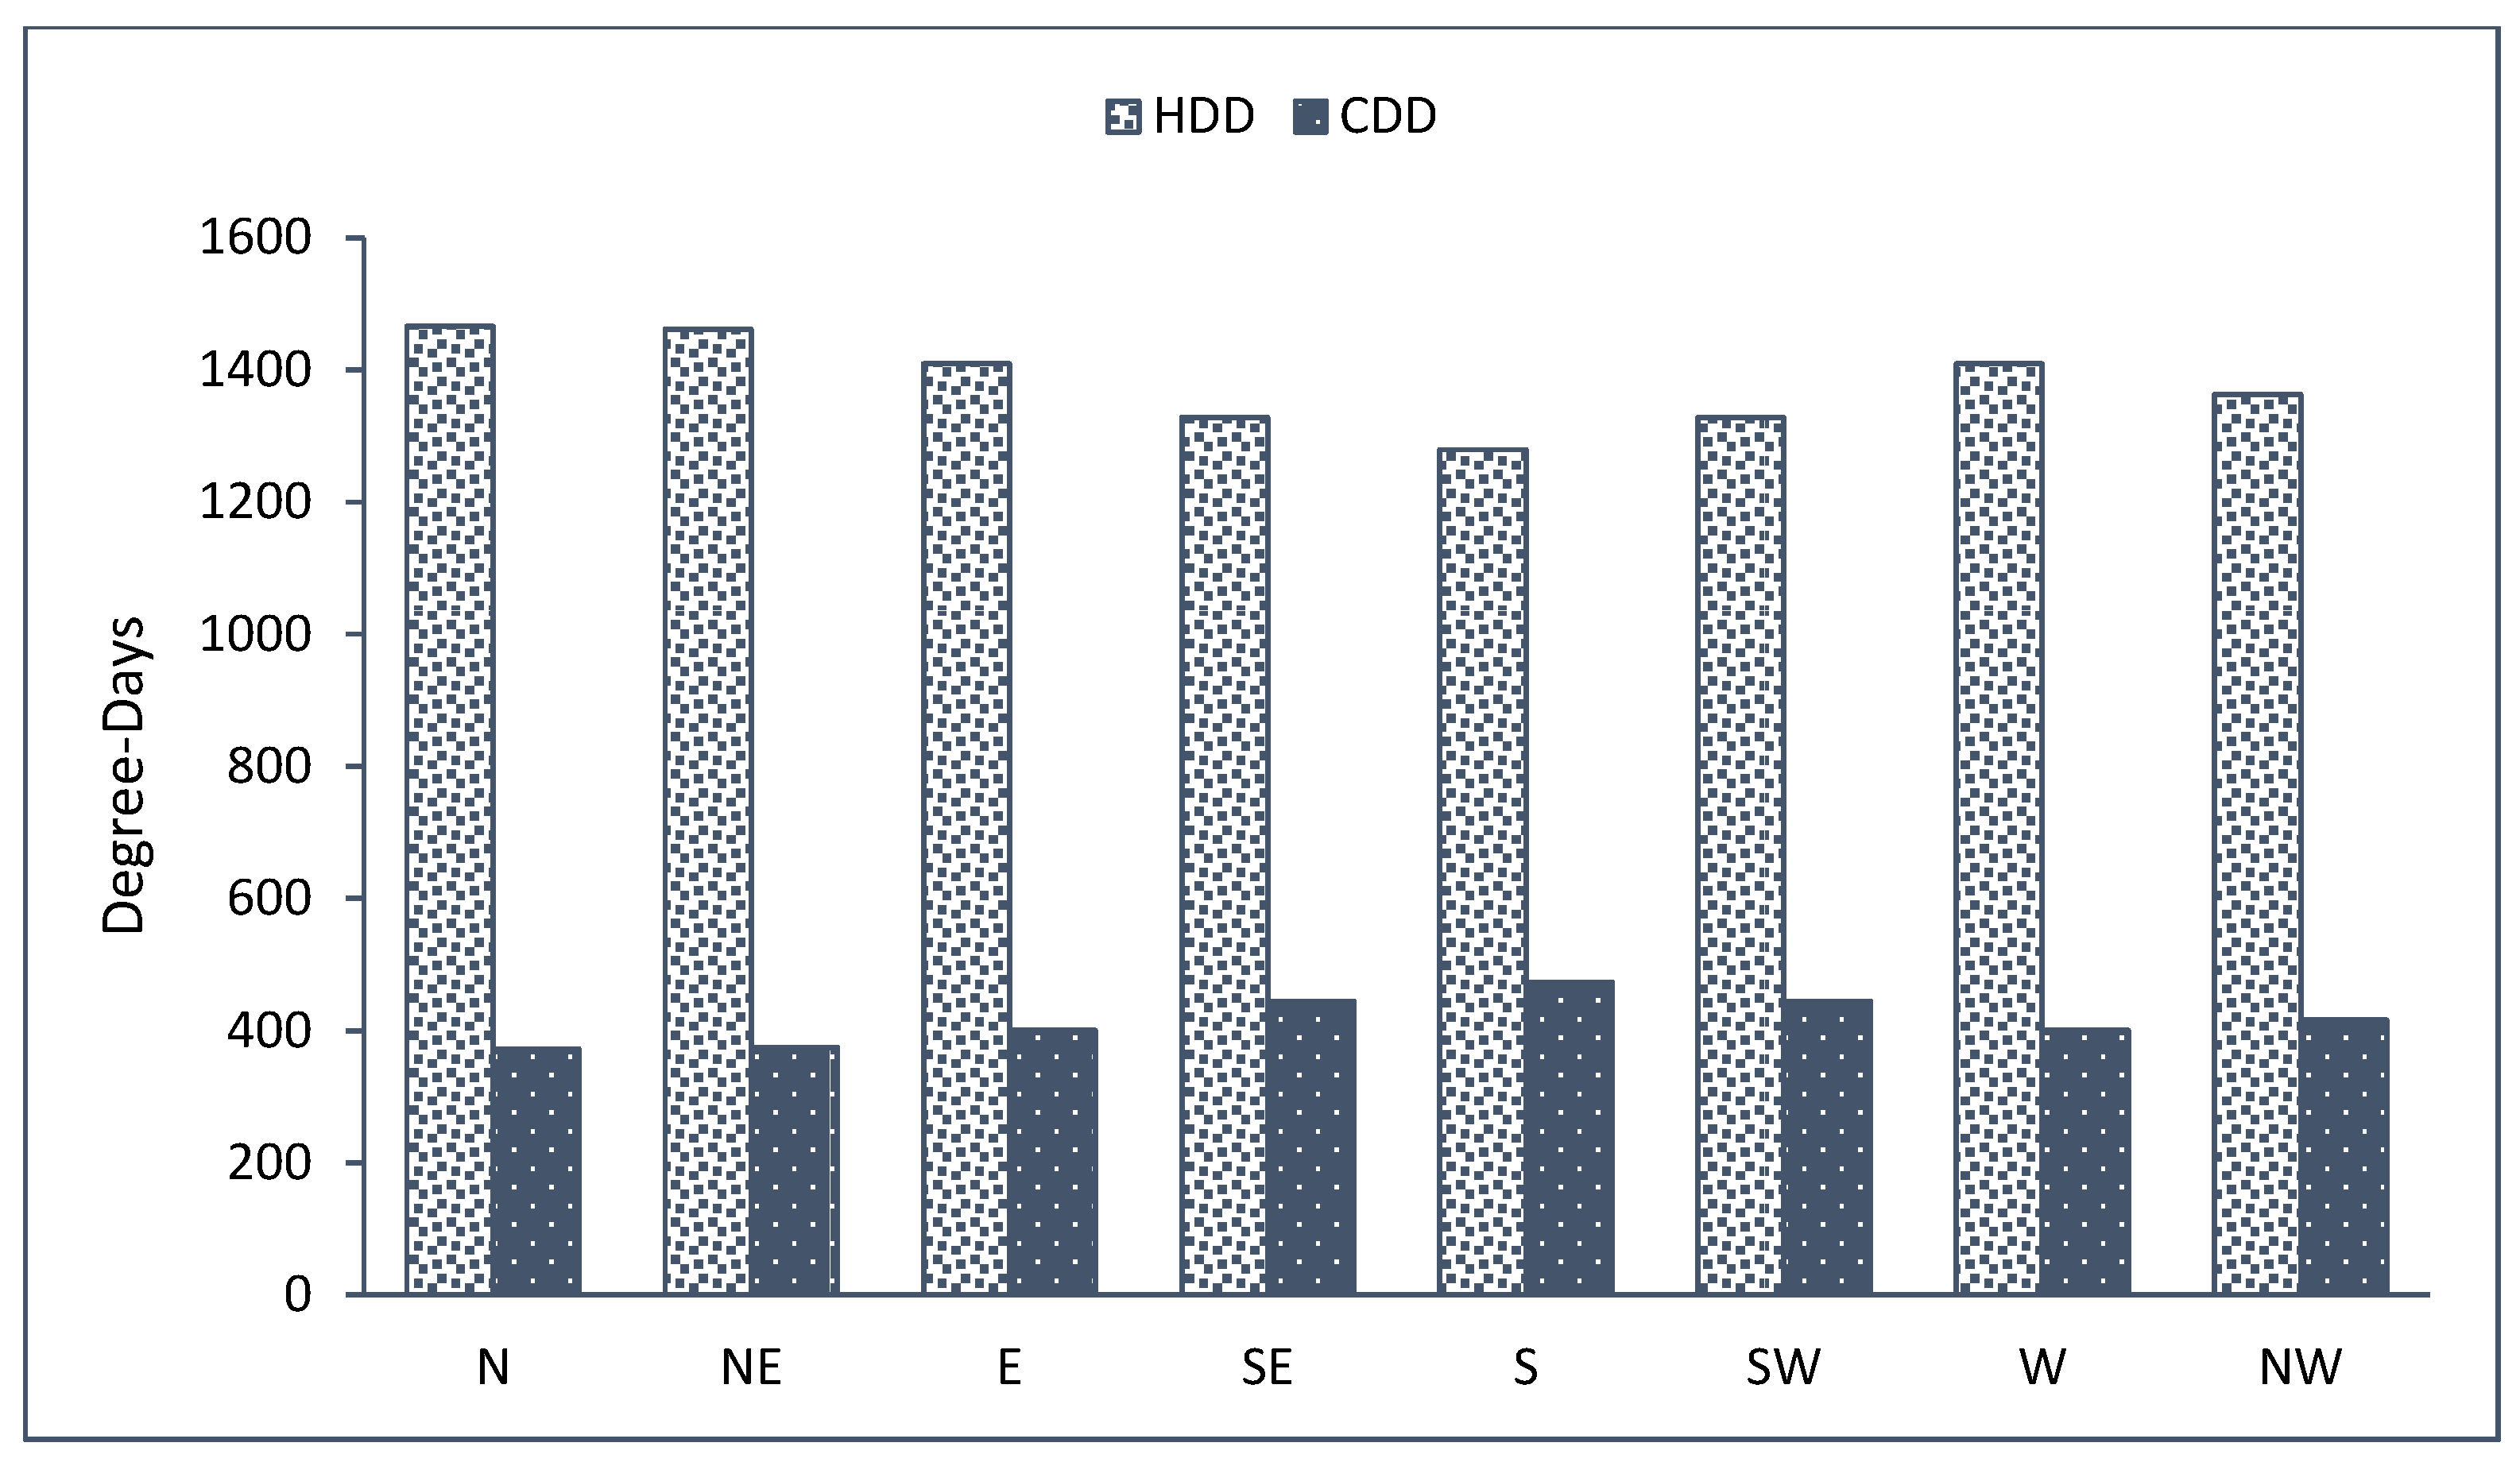
3.1. Heating and Cooling Degree Days

In this study, Bursa, one of the biggest cities located in the second-degree day region (climatic zone) in Türkiye, has been selected for the analysis [35]. Figure 1 reveals substantial differences in the HDD and CDD values from month to month due to variations in temperature and incoming solar radiation. As shown in Figure 3, January, February, and December are the months with the highest HDD values, while June, July, and August have the highest CDD values. The requirement for heating energy during a particular month increases with a higher HDD value. Likewise, a high CDD value signifies a strong need for energy to be devoted to cooling during the corresponding month. For example, August, with a CDD value of 163, needs approximately six times more cooling energy than May, with a CDD value of 26.
Figure 4 presents the yearly average HDD and CDD values for cardinal directions, which are the north (N), south (S), east (E), and west (W), as well as intermediate directions, including the northeast (NE), southeast (SE), southwest (SW), and northwest (NW). When HDD and CDD values are examined depending on the directions, the north- and northeast-facing walls are notable with their high HDD values, 1465 and 1461, respectively. As mentioned before, the HDD is a unit used to quantify the demand for heating a building in a specific location. Therefore, it is understood that these particular walls necessitate a higher amount of heating energy. When direction-based inspection is examined regarding cooling, it is evident from Figure 4 that the south-facing wall has the maximum CDD value of 473. Since the CDD is a metric used to quantify the amount of cooling needed to maintain indoor comfort in buildings during warm weather, it is determined that the relevant wall needs more cooling energy compared to walls oriented in alternative directions.

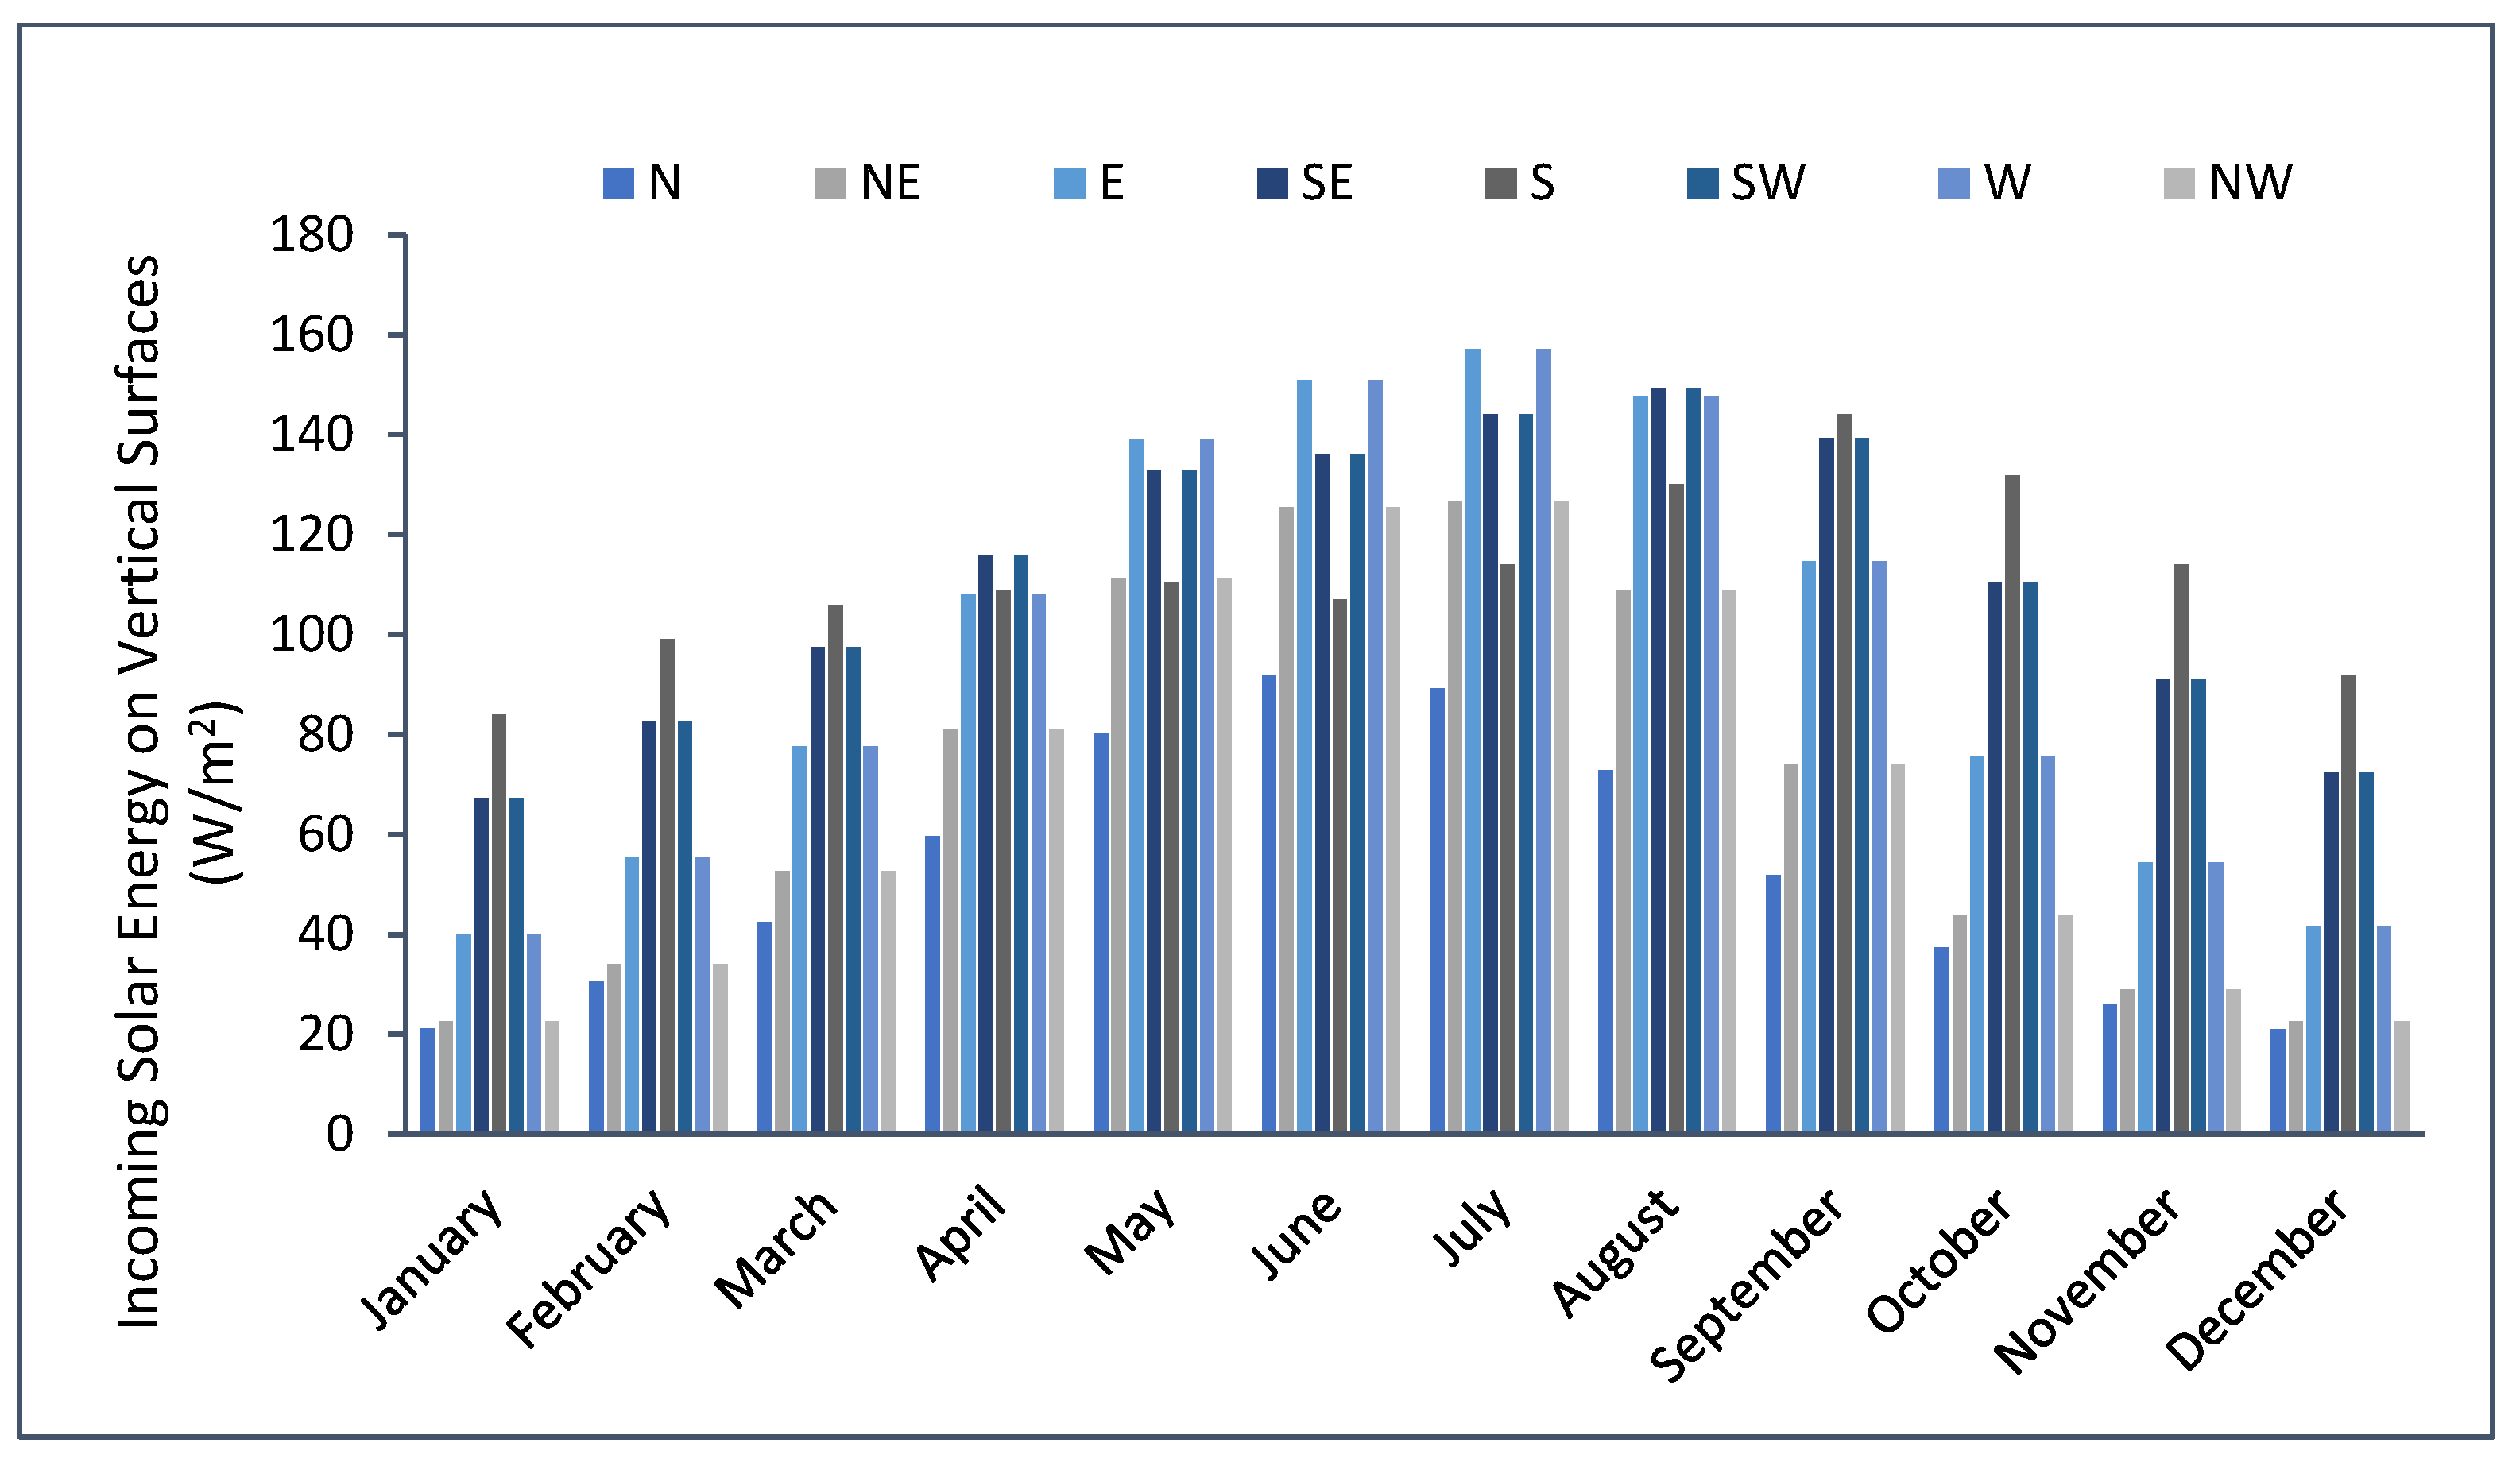
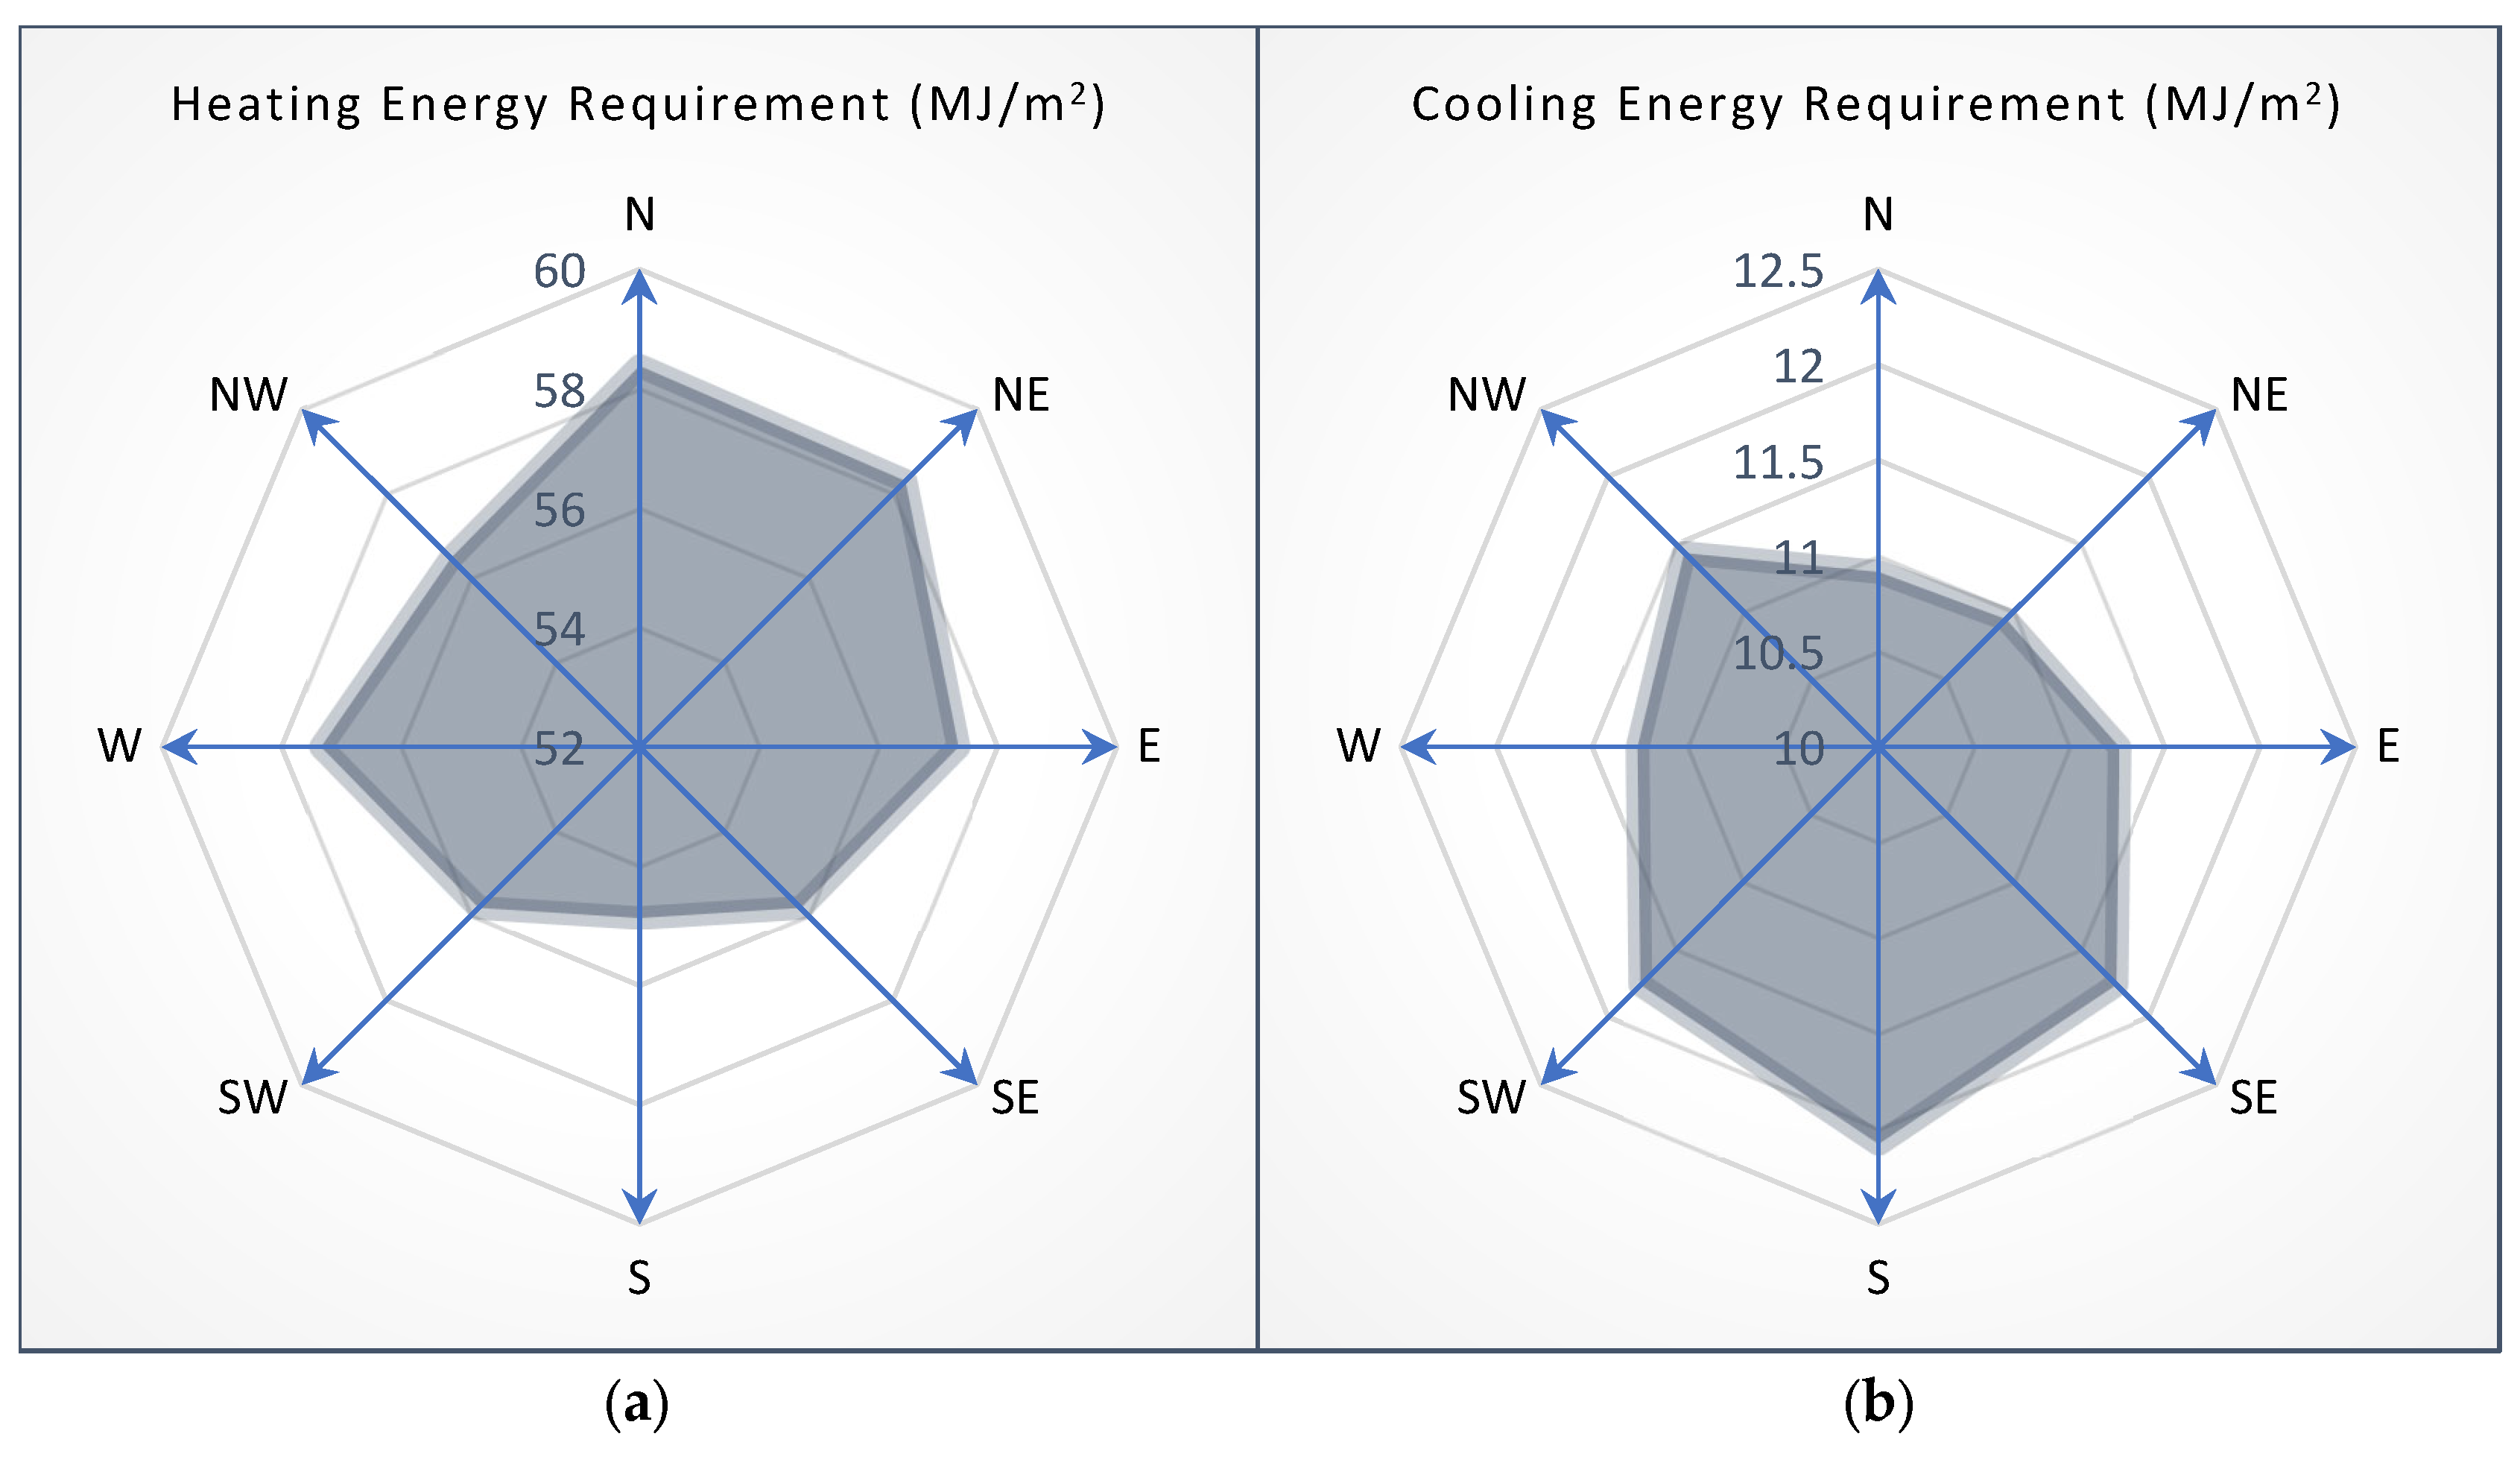
3.2. Solar Radiation and Energy Requirements

The variation of incoming solar radiation on vertical surfaces according to the months is presented in Figure 5 for all directions. It is seen that the solar irradiance originating from the west and east orientations are maximum during months with high air temperature, such as May, June, and July, while the solar radiation coming from the south direction is at the top during months with relatively low air temperatures, including September, October, November, December, January, February, and March. Moreover, it is found that the solar radiation coming from the southeast and southwest directions are higher compared to other directions during April and August, which are the months of seasonal transitions. When the solar radiation variation is analyzed based on the months, January and July are months exposed to minimum and maximum solar radiation with the levels of 45.7 W/m2 and 132.4 W/m2, respectively. These differences in incoming solar radiation values are not solely dependent on the air temperature. Incoming solar radiation on vertical surfaces is equal to the sum of the direct, diffuse, and reflected solar radiations. Direct solar radiation is related to the inclination angle of the surface and the zenith angle. Diffuse solar radiation is determined using the declination angle, relative sunshine duration, altitude angle and latitude angle. Lastly, reflected solar radiation is calculated using the value of reflectance of the ground and the inclination angle of the surface. Consequently, meteorological and geographical conditions of the area where the building is located affect the incoming solar radiation value on vertical surfaces.
An examination of the annual average solar radiation according to directions reveals that the north-facing wall receives the minimum amount of radiation, with 52.1 W/m2. In contrast, the walls oriented towards the south, southeast, and southwest receive the highest solar radiation exposure, with values of 111.8 W/m2, 111.6 W/m2, and 111.6 W/m2, respectively. These results indicate that the quantity of solar radiation incident at the surface can vary by over two-fold, based on the wall’s orientation, as seen in Figure 6.
Heating and cooling energy requirements are determined considering the solar radiation impact for various wall orientations, as shown in Figure 7. When the average heating energy requirements are calculated (by summing the heating energy requirements for each direction and dividing by the number of directions), the average heating energy is determined to be 56.8 MJ/m2. Similarly, the average cooling energy requirement is calculated as 11.4 MJ/m2. It is clearly seen that the average heating energy requirement is approximately five times higher than the average cooling energy requirement. The heating energy requirement variation graph shows that the north and south directions have the highest and lowest energy demands with values of 58.3 MJ/m2 and 54.8 MJ/m2, respectively. On the contrary, the south and north directions have the highest and lowest cooling energy requirements with values of 12.1 MJ/m2 and 10.9 MJ/m2, respectively.

3.3. Optimum Insulation Thicknesses for Different Directions and Seasonal Usages

As an example, with respect to the applied insulation thickness, the variation of energy, insulation, and total cost for the north-facing wall is presented in Figure 8, considering the annual energy requirements. It is observed that when there is an augmentation in insulation thickness, the insulation cost follows a linear upward trend, while energy costs experience a decline. Accordingly, it is understood from the figure that there is an ideal insulation thickness that minimizes the total cost. Using this approach, optimum insulation thicknesses for the cardinal and intermediate directions are obtained for three scenarios, including cooling-only, heating-only, and both cooling and heating.
Ideal insulation thicknesses for each scenario are determined for the cardinal and intermediate directions, taking into account cooling, heating, and annual energy demands, as shown in Figure 9. As seen from the visualized data, different patterns are obtained for each scenario. The analysis results reveal that depending on the wall orientation, ideal insulation thicknesses vary between 4.52 and 5.02 cm for heating, 1.56 and 2.09 cm for cooling, and 5.92 and 6.08 cm for annual energy requirements, respectively. Figure 9a illustrates the optimum insulation thickness required for various wall orientations when the primary goal is to minimize heating energy demand. It is evident that the north-facing wall requires the greatest insulation thickness of 5.02 cm due to receiving the least amount of solar radiation, which leads to higher heating requirements. Conversely, the south-facing wall, which receives more solar radiation during the heating season, necessitates the minimum insulation thickness of 4.52 cm. This variation in insulation requirements across different orientations highlights the impact of solar radiation and building orientation on heating energy demand. For insulation to be applied to a house intended for summer use (considering cooling energy requirement), it is understood from Figure 9b that the wall facing the south requires the thickest insulation. While the optimum insulation thickness calculated for the north-facing wall is 1.56 cm, the ideal insulation thickness for the south-facing wall is 2.09 cm (see Figure 9b). Figure 9c presents the optimum insulation thicknesses for different wall orientations when considering both heating and cooling demands throughout the year. The results indicate that the required insulation thicknesses are relatively similar across all orientations, ranging from 5.92 cm to 6.08 cm. The north-facing wall demands the highest thickness (6.08 cm), which is slightly more than the other directions due to its high heating demand and relatively low cooling requirement. However, the variation in thicknesses across all orientations is minimal, with only a 0.16 cm difference between the maximum and minimum values. This suggests that when a building is used year-round for both heating and cooling, the optimal insulation thickness is not significantly affected by wall orientation, and a uniform insulation strategy can be effectively applied.
The optimum insulation thicknesses to be applied for all directions are presented in Table 2 for three scenarios of seasonal usage. When considering the purpose of use of the building and the wall directions, it is seen that there is a difference of approximately 4.52 cm between the minimum (1.56 cm) and maximum (6.08 cm) optimum insulation thicknesses. Furthermore, in cases where a building is used year-round, requiring both heating and cooling, it has been observed that the wall orientation does not significantly impact the insulation thickness. The calculated disparity between the wall necessitating the thickest insulation (6.08 cm) and the one demanding the thinnest (5.92 cm) is merely 0.16 cm. Conversely, in scenarios where a building is exclusively heated or cooled, the impact of wall direction on the required insulation thickness becomes more pronounced. Calculations reveal a notable 0.50 cm disparity in insulation thicknesses for heating purposes between the wall demanding the thickest insulation (5.02 cm) and the one necessitating the thinnest (4.52 cm). Moreover, calculations show a noticeable difference of 0.53 cm in how thick the insulation needs to be for cooling. This distinction exists between the wall needing the thickest insulation, at 2.09 cm, and the one needing a thinner layer, at 1.56 cm.
In addition, correlations providing the total cost based on the applied insulation thickness for each direction and various building usage scenarios have been determined and presented in Table 3.

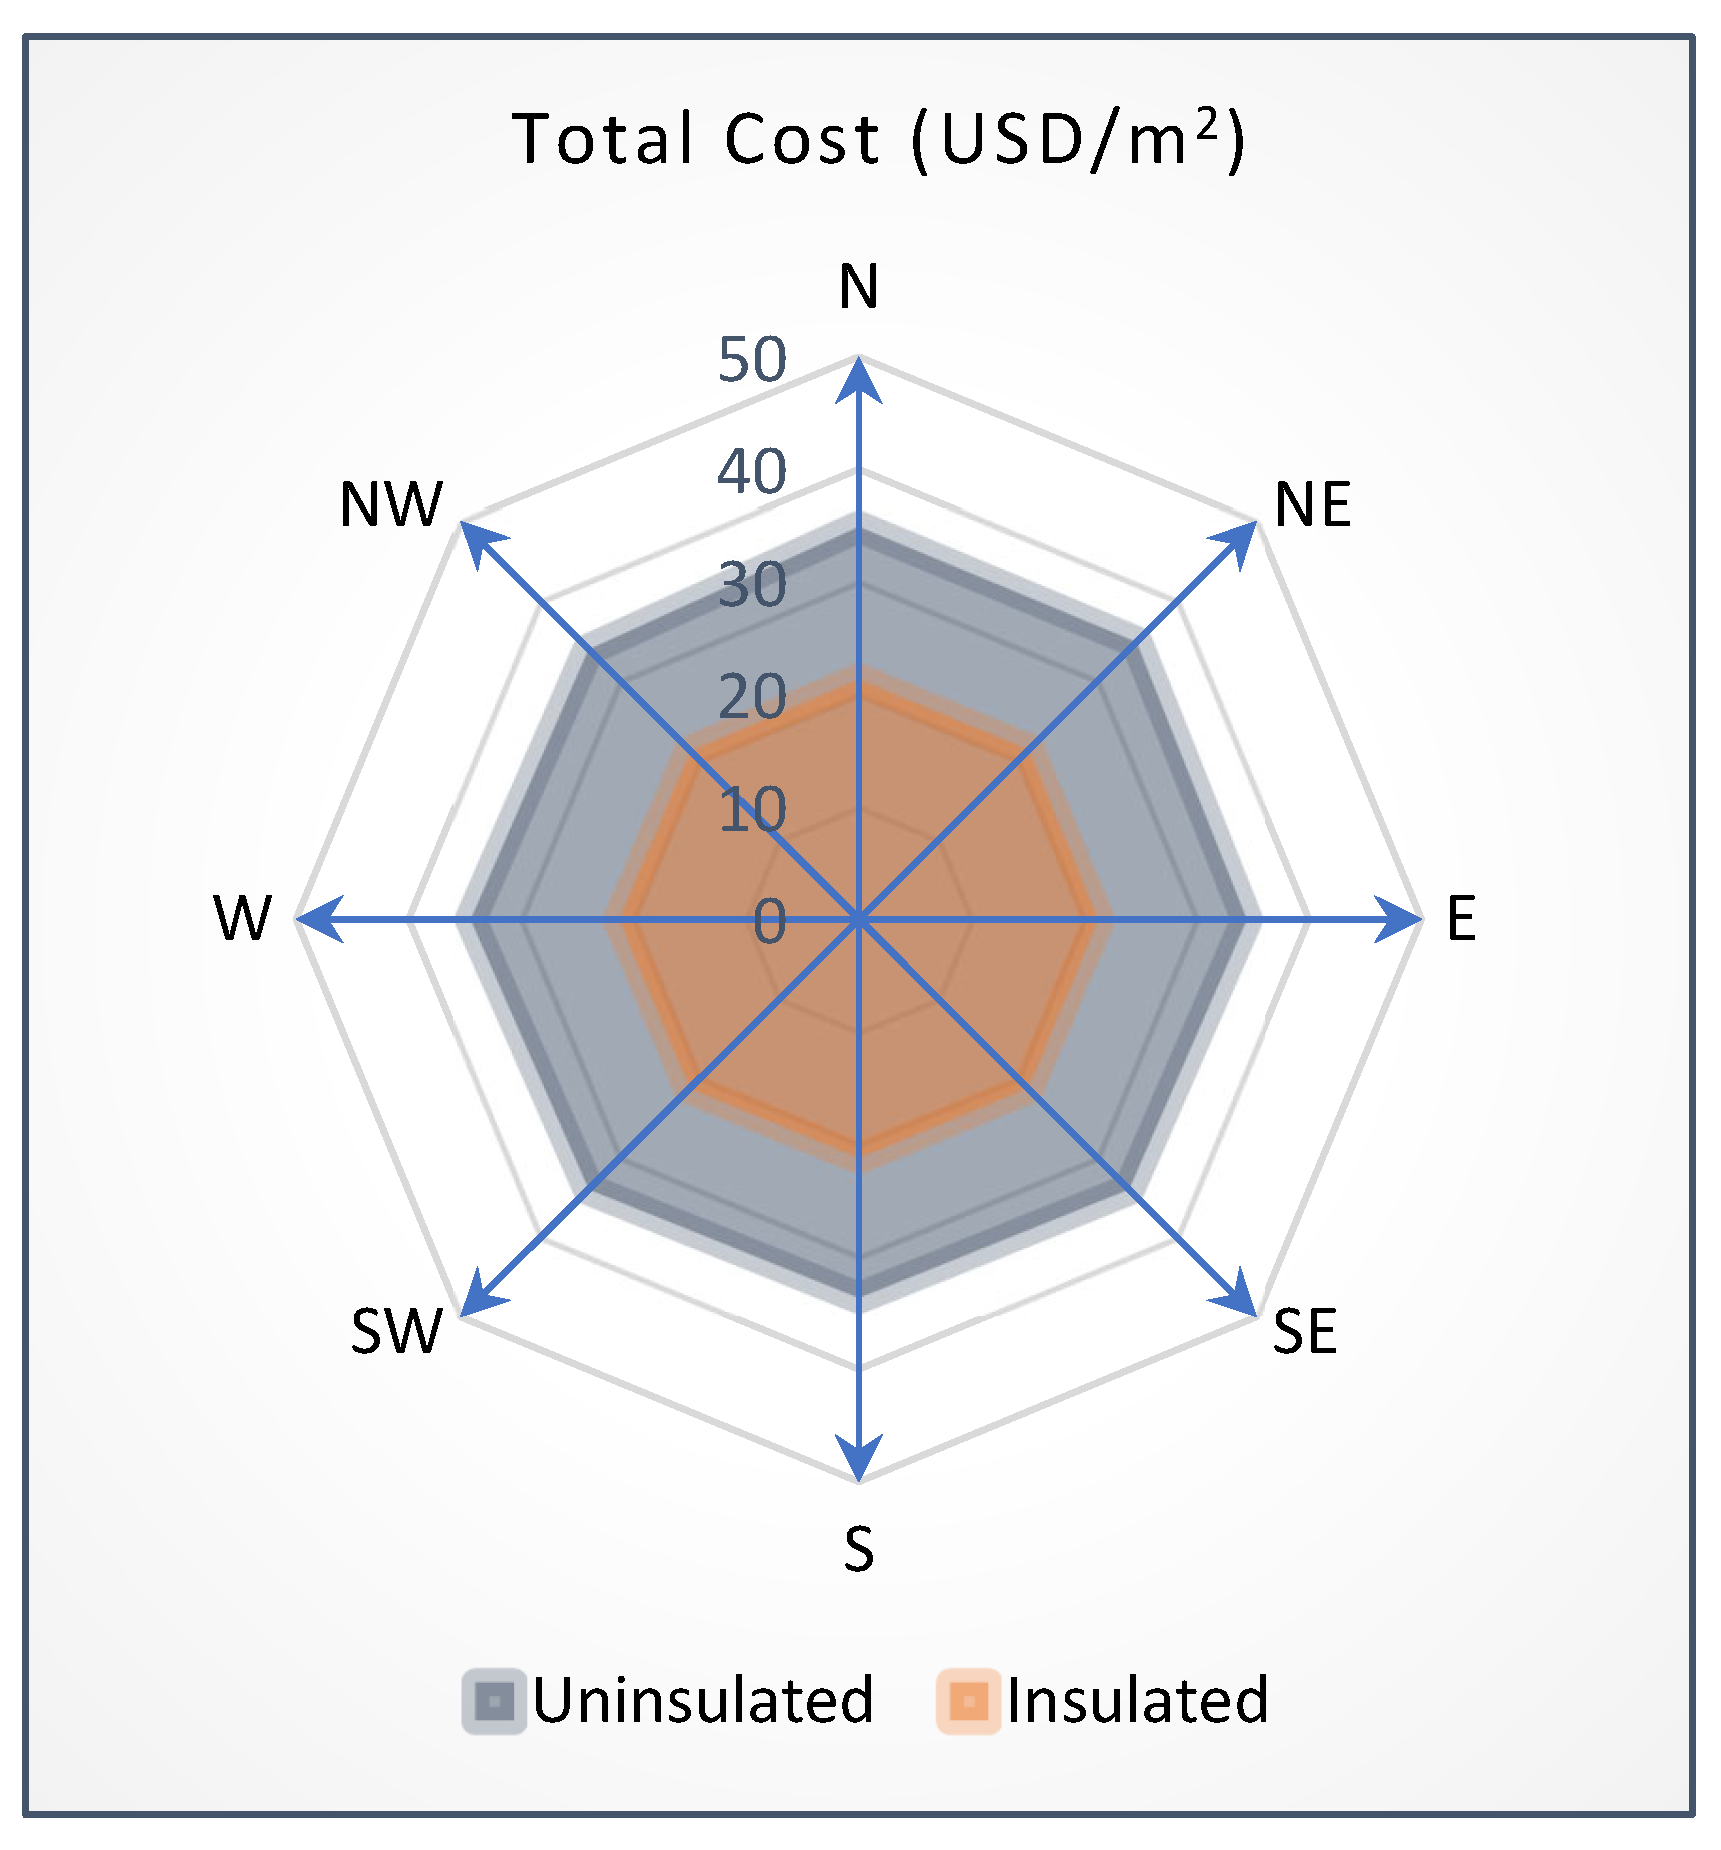
3.4. Comparative Analysis

No study is found in the literature that calculates heating and cooling degree days taking into account solar radiation impact, considers all directions, including intermediate directions (south, north, west, east, southeast, northeast, northwest, and southwest), and examines three different building usage scenarios (cooling-only, heating-only, and both cooling and heating). However, a study by Kaynakli et al. [36] is found to be useful for the comparative analysis. They have taken into account solar radiation, but they have only examined the heating season and conducted analyses for only the main directions (south, north, west, east). They carried out analyses for Istanbul, which is different from the province examined in this study but is located in the same degree-day region. The results related to the jointly reviewed parameters are presented in Table 4. It can be observed that the results are close to each other. When examined directionally, for example, the ordering of insulation thicknesses is determined as follows in both studies: xnorth > xeast ≥ xwest > xsouth.

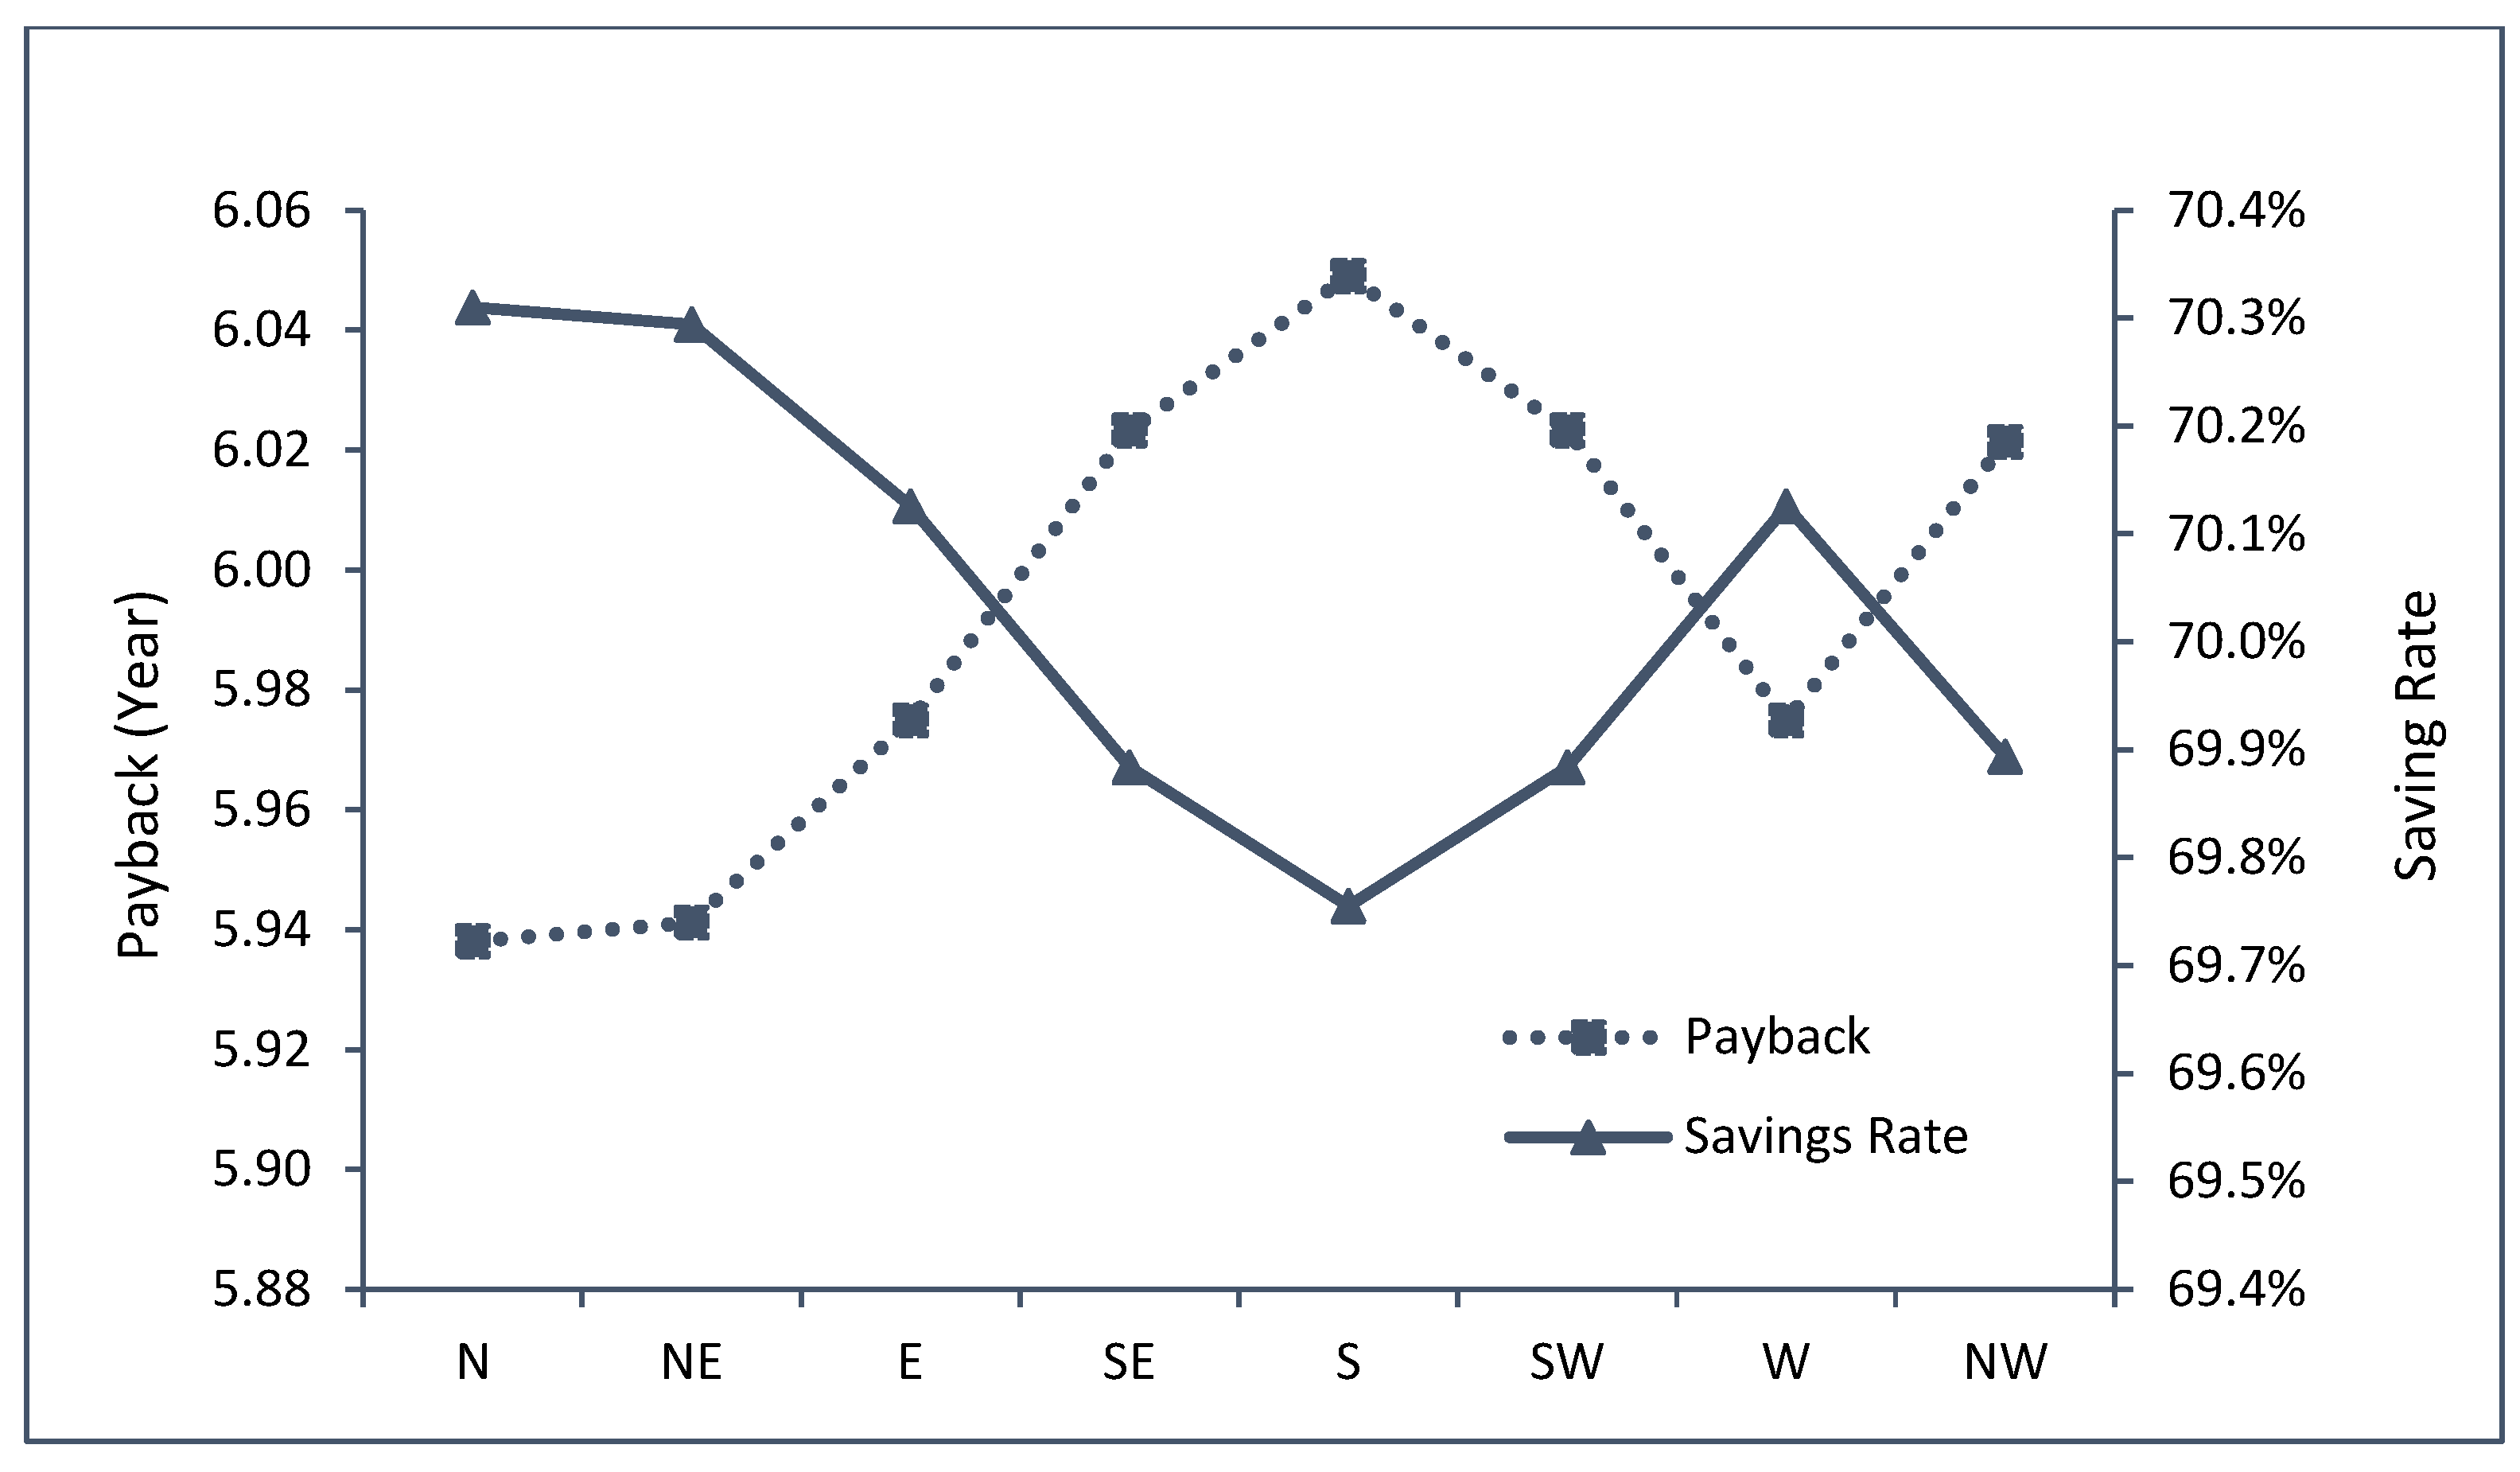
3.5. Cost Saving Rates with Payback Period

The total lifetime cost of walls with and without insulation across different orientations are illustrated in Figure 10. The results clearly show that insulating the walls significantly reduces the total cost over the building’s lifetime, regardless of directions. The north-facing wall, which experiences the lowest amount of solar radiation and consequently the highest heating demand, achieves the most substantial cost reduction of 38.9%. Conversely, the south-facing wall, which receives the highest solar radiation and benefits more from natural heating, shows the lowest cost reduction of 37.0%.
Overall, the average cost reduction across all directions is approximately 38.0%, demonstrating the financial benefits of applying optimum insulation. Figure 10 highlights that while there are slight variations in cost savings depending on the wall orientation, the implementation of insulation leads to considerable long-term economic advantages for all orientations. This suggests that applying an appropriate insulation thickness is a cost-effective strategy for improving energy efficiency in buildings, regardless of their specific orientation.
Energy cost savings (ECSs) values are calculated for all directions as shown in Figure 11. It is evident that north- and northeast-facing walls have the greatest ECSs with 24.56 and 24.52 USD/m2, respectively. These orientations receive the least amount of solar radiation, resulting in higher heating demands, which in turn leads to greater energy savings when insulation is applied. On the other hand, the south-facing wall shows the lowest energy cost savings of 23.48 USD/m2 as it benefits from the highest amount of solar radiation, thereby reducing its heating requirements and the potential savings from insulation.
Savings rates and payback periods have been determined according to the energy cost savings for cooling and heating throughout the building’s lifespan and utilizing ideal insulation thicknesses based on the annual energy demands. The energy savings rate and payback period variations for each direction are presented in Figure 12. Payback periods, which demonstrate how many years are required to recover the investment, vary between 5.94 and 6.05 years. In addition, the average energy saving rate is found to be 70%. As can be seen in Figure 12, the walls that have greater savings rates, payback periods are shorter, such as north- and northeast-facing walls. A short payback period means that the investment recoups its costs in a shorter time, which is financially beneficial. From this perspective, it can be concluded that investing in insulation for walls facing north and northeast directions is more advantageous than investing in other walls, as the investment recoups itself in a shorter period of time.

4. Conclusions

In this study, analyses have been conducted for three different house usage scenarios: a house that is cooled but not heated (summer house), a house that is heated but not cooled (winter house), and a house that is both cooled and heated (all-season house). A summer house is typically located by the sea, in a resort area, and is occupied only during the summer. In contrast, a winter house is usually situated at the foothills of a mountain and is used only in the winter. An all-season house is located in the city center and is used throughout all four seasons.
This study has clearly demonstrated that the periods of the year during which the building is used lead to significant differences in the ideal insulation thickness. For example, according to the results obtained for the north direction, the optimum insulation thicknesses are as follows: 5.02 cm when considering only heating energy requirements, 1.56 cm when considering only cooling energy requirements, and 6.08 cm when considering both cooling and heating (annual) energy requirements. It is observed that the aim of the building’s use (summer house, winter house, or all-season house) is a significant factor in deciding the insulation thickness to be applied.
In buildings both cooled and heated throughout the year, it is evident that the difference between the ideal insulation thicknesses determined for different directions reaches a maximum of 0.16 cm. It is found that the variation in the insulation thickness required for different wall orientations is limited and does not exceed 3%. For this reason, it has been concluded that for a building to be used throughout the year, different wall orientations do not greatly affect the ideal insulation thickness, and a single thickness could be preferred for all walls in insulation application. On the contrary, for a building that is only heated or only cooled, it has been observed that there is a difference of up to 0.53 cm between the ideal insulation thicknesses on the walls oriented in other directions. When examined in percentage terms, a significant difference of 35% is observed between the wall direction requiring the thickest insulation and the wall direction requiring the thinnest insulation. Hence, it would be fitting to utilize different insulation thicknesses for different directions in a seasonally used building, such as a summer or winter house. Consequently, it is found that the wall orientation has a greater impact on insulation thickness in buildings used only in summer or winter, and it is recommended that the appropriate insulation thickness be decided upon after conducting a directional analysis.
When walls are insulated using optimum thicknesses obtained for each direction, there is a reduction in the total cost as expected. The most notable cost reduction is observed on the north-facing wall, showing a substantial decrease of 38.9%, whereas the south-facing wall exhibits the lowest cost decrease at 37.0%. The average decrease in the life cycle cost for all directions is calculated to be 38.0%.
Under these analysis conditions, it is seen that such an investment would pay for itself in approximately six years, and the energy saving rate is found to be 70%. Moreover, a correlation is evident whereby walls with higher savings rates, notably those facing the north and northeast, correspond to shorter payback periods. Consequently, applying insulation in these directions is more advantageous.
The most important thing that can be said about practical applications of thermal insulation according to wall directions is this: the south-facing walls of a building tend to receive more sunlight, leading to increased heating during the summer months. In such cases, applying additional insulation to these walls can help maintain cooler indoor temperatures. Similarly, north-facing walls typically receive less sunlight and are cooler, requiring more heating during the winter months. Insulating all walls, including those facing intermediate directions, with appropriate insulation thicknesses can increase energy efficiency, enhance indoor comfort, and lead to long-term savings on energy costs.
This study has been conducted for Bursa, one of the biggest cities in Türkiye and located in the second-degree day region. The findings are directly applicable to practical applications in Bursa and may also serve as a guide for similar calculations in other cities within the second-degree day region. These results may differ according to different climatic conditions and locations. However, it has been clearly seen that the analyses should be carried out individually for all directions and seasonal usage scenarios in insulation applications.

Funding

This research received no external funding.

Institutional Review Board Statement

Not applicable.

Informed Consent Statement

Not applicable.

Data Availability Statement

The original contributions presented in the study are included in the article, further inquiries can be directed to the corresponding author.

Conflicts of Interest

The author declares no conflict of interest.

Nomenclature

Ccost or price, [USD/m2 or USD/m3]
CDDscooling degree days
COPcoefficient of cooling system performance
Eeast
E C S s energy cost savings
gdiscount rate [%]
G s , c solar constant
HDDsheating degree days
hheat transfer coefficient, [W/m2°C]
iinflation rate [%]
kthermal conductivity, [W/m°C]
K T clearness index
LCCAlife cycle cost analysis
Hulower heating value, [J/m3]
LTlifetime, [year]
Nnorth
NEnortheast
NWnorthwest
PWFpresent worth factor
q ˙ s solar radiation incident, [W/m2]
Rt,wtotal wall thermal resistances excluding the insulation layer, [m2°C/W]
Ssouth
SEsoutheast
SWsouthwest
Ttemperature, [°C]
Uoverall heat transfer coefficient, [W/m2°C]
Wwest
xthermal insulation thickness, [m]
Zaltitude
α solar absorption rate
εradiative emission coefficient of surface
ρ reflectance of the ground
βinclination angle of the surface
γ azimuth angle
σ Stefan-Boltzmann constant, [W/m2°C4]
θ incidence’s angle of direct solar irradiance
δ declination angle
latitude angle
ωsunset hour angle
ηheating system efficiency
Subscript
bbase
Ccooling
eelectricity
ffuel
Hheating
iinside
insinsulation material
ooutside
optoptimum
sol-airsolar air
surrsky and surrounding surface

References

  1. Trading Economics. Available online: https://tradingeconomics.com/commodity/natural-gas (accessed on 8 September 2024).
  2. International Energy Agency. Available online: https://www.iea.org/topics/global-energy-crisis (accessed on 15 May 2024).
  3. Kaynakli, O. Parametric investigation of optimum thermal insulation thickness for external walls. Energies 2011, 4, 913–927. [Google Scholar] [CrossRef]
  4. Ozel, M. Determination of optimum insulation thickness based on cooling transmission load for building walls in a hot climate. Energy Convers. Manag. 2013, 66, 106–114. [Google Scholar] [CrossRef]
  5. Canbolat, A.; Bademlioglu, A.; Saka, K.; Kaynakli, O. Investigation of parameters affecting the optimum thermal insulation thickness for buildings in hot and cold climates. Therm. Sci. 2019, 24, 2891–2903. [Google Scholar] [CrossRef]
  6. Kurekci, N.A. Determination of optimum insulation thickness for building walls by using heating and cooling degree-day values of all Turkey’s provincial centers. Energy Build. 2016, 118, 197–213. [Google Scholar] [CrossRef]
  7. Özel, M. Determination of Indoor Design Temperature, Thermal Characteristics and Insulation Thickness Under Hot Climate Conditions. J. Therm. Sci. Technol. 2022, 42, 49–64. [Google Scholar] [CrossRef]
  8. Kaynakli, O. A review of the economical and optimum thermal insulation thickness for building applications. Renew. Sustain. Energy Rev. 2012, 16, 415–425. [Google Scholar] [CrossRef]
  9. Verichev, K.; Serrano-Jiménez, A.; Carpio, M.; Barrios-Padura, Á.; Díaz-López, C. Influence of degree days calculation methods on the optimum thermal insulation thickness in life-cycle cost analysis for building envelopes in Mediterranean and Semi-Arid climates. J. Build. Eng. 2023, 79, 107783. [Google Scholar] [CrossRef]
  10. Albatayneh, A. Optimising the Parameters of a Building Envelope in the East Mediterranean Saharan, Cool Climate Zone. Buildings 2021, 11, 43. [Google Scholar] [CrossRef]
  11. Onan, C.; Erdem, S.; Ozkan, D.B.; Baykal, C. Analysis of optimum insulation thickness for external walls at different orientations based on real-time measurements. Therm. Sci. 2020, 24, 2035–2046. [Google Scholar] [CrossRef]
  12. Cyrille Vincelas, F.F.; Ghislain, T. The determination of the most economical combination between external wall and the optimum insulation material in Cameroonian’s buildings. J. Build. Eng. 2017, 9, 155–163. [Google Scholar] [CrossRef]
  13. As, M.; Bilir, T. Enhancing energy efficiency and cost-effectiveness while reducing CO2 emissions in a hospital building. J. Build. Eng. 2023, 78, 107792. [Google Scholar] [CrossRef]
  14. Altun, A.F. Determination of Optimum Building Envelope Parameters of a Room concerning Window-to-Wall Ratio, Orientation, Insulation Thickness and Window Type. Buildings 2022, 12, 383. [Google Scholar] [CrossRef]
  15. Yuan, J.; Farnham, C.; Emura, K. Optimum insulation thickness for building exterior walls in 32 regions of China to save energy and reduce CO2 Emissions. Sustainability 2017, 9, 1711. [Google Scholar] [CrossRef]
  16. Gigasari, A.R.; Cárcel-Carrasco, J.; Palermo Iglesias, L.M.; Amani, N. Evaluating carbon payback time by optimizing insulation materials for different orientations: A cradle-to-gate life cycle assessment. Energy Environ. 2023. [Google Scholar] [CrossRef]
  17. Xu, H.; Ding, J.; Li, T.; Mu, C.; Gu, X.; Wang, R. A Study on Optimum Insulation Thickness in Walls of Chinese Solar Greenhouse for Energy Saving. Agronomy 2022, 12, 1104. [Google Scholar] [CrossRef]
  18. Akan, A.E. Determination and Modeling of Optimum Insulation Thickness for Thermal Insulation of Buildings in All City Centers of Turkey; Springer: New York, NY, USA, 2021; Volume 42, ISBN 0123456789. [Google Scholar]
  19. Bademlioğlu, A.H.; Kaynakli, Ö.; Yamankaradeniz, N. The effect of water vapor diffusion resistance factor of insulation materials for outer walls on condensation. J. Therm. Sci. Technol. 2018, 38, 15–23. [Google Scholar]
  20. Canbolat, A.S. An integrated assessment of the financial and environmental impacts of exterior building insulation application. J. Clean. Prod. 2023, 435, 140376. [Google Scholar] [CrossRef]
  21. Omle, I.; Kovács, E.; Bolló, B. Applying recent efficient numerical methods for long-term simulations of heat transfer in walls to optimize thermal insulation. Results Eng. 2023, 20, 101476. [Google Scholar] [CrossRef]
  22. Canbolat, A.S.; Albak, E.İ. Multi-Objective Optimization of Building Design Parameters for Cost Reduction and CO2 Emission Control Using Four Different Algorithms. Appl. Sci. 2024, 14, 7668. [Google Scholar] [CrossRef]
  23. Kaynakli, O. A study on residential heating energy requirement and optimum insulation thickness. Renew. Energy 2008, 33, 1164–1172. [Google Scholar] [CrossRef]
  24. Bolattürk, A. Optimum insulation thicknesses for building walls with respect to cooling and heating degree-hours in the warmest zone of Turkey. Build. Environ. 2008, 43, 1055–1064. [Google Scholar] [CrossRef]
  25. Cengel, Y. Heat Transfer: A Practical Approach, 2nd ed.; McGraw-Hill: New York, NY, USA, 2002. [Google Scholar]
  26. Duffie, J.A.; Beckman, W.A.; Blair, N. Solar Engineering of Thermal Processes; John Wiley & Sons: Hoboken, NJ, USA, 1991. [Google Scholar]
  27. Kilic, A.; Ozturk, A. Solar Energy; Kipas Distribution Inc.: Istanbul, Turkey, 1983. (In Turkish) [Google Scholar]
  28. Yiğit, A.; Atmaca, İ. Solar Energy; Alfa Aktüel: Bursa, Turkey, 2010. (In Turkish) [Google Scholar]
  29. Tiris, M.; Tiris, Ç.; Türe, I.E. Diffuse solar radiation correlations: Applications to Turkey and Australia. Energy 1995, 20, 745–749. [Google Scholar] [CrossRef]
  30. Central Bank of Türkiye. Available online: https://www.tcmb.gov.tr (accessed on 5 April 2024).
  31. Bolattürk, A. Determination of optimum insulation thickness for building walls with respect to various fuels and climate zones in Turkey. Appl. Therm. Eng. 2006, 26, 1301–1309. [Google Scholar] [CrossRef]
  32. Kaynakli, Ö. Optimum Thermal Insulation Thicknesses and Payback Periods for Building Walls in Turkey. J. Therm. Sci. Technol. 2013, 33, 45–55. [Google Scholar]
  33. Bektas Ekici, B.; Aytac Gulten, A.; Aksoy, U.T. A study on the optimum insulation thicknesses of various types of external walls with respect to different materials, fuels and climate zones in Turkey. Appl. Energy 2012, 92, 211–217. [Google Scholar] [CrossRef]
  34. Guven, S. Calculation of optimum insulation thickness of external walls in residential buildings by using exergetic life cycle cost assessment method: Case study for Turkey. Environ. Prog. Sustain. Energy 2019, 38, e13232. [Google Scholar] [CrossRef]
  35. TS 825; Thermal Insulation Requirements for Buildings. Turkish Standards Institution: Ankara, Turkey, 2013.
  36. Kaynakli, O.; Ozdemir, S.; Karamangil, I. Determinatıon of Optimum Thermal Insulation Thickness Considering Solar Radiation and Wall Orientation. J. Fac. Eng. Archit. Gazi Univ. 2012, 27, 367–374. [Google Scholar]
Figure 1. Natural gas price in recent years.
Applsci 14 08239 g001
Figure 2. The wall components.
Applsci 14 08239 g002
Figure 3. Heating and cooling degree days for each month.
Applsci 14 08239 g003
Figure 4. Yearly average heating and cooling degree days for various direction.
Applsci 14 08239 g004
Figure 5. Incoming solar radiation on vertical surfaces for each month.
Applsci 14 08239 g005
Figure 6. Incoming annual average solar radiation on vertical surfaces for various directions.
Applsci 14 08239 g006
Figure 7. Variation of heating (a) and cooling (b) energy requirement for various directions.
Applsci 14 08239 g007
Figure 8. Typical variation of costs with changing insulation thicknesses (for the north-facing wall).
Applsci 14 08239 g008
Figure 9. Heating (a), cooling (b), and annual (c) optimum insulation thickness variations for various directions.
Applsci 14 08239 g009
Figure 10. Variations of total costs of insulated and uninsulated walls for various directions.
Applsci 14 08239 g010
Figure 11. Variations of energy cost savings for various directions.
Applsci 14 08239 g011
Figure 12. Payback periods and energy saving rates for various directions.
Applsci 14 08239 g012
Table 1. Wall composition, insulation material’s properties, heating and cooling sources, and financial parameters.
ParametersValue
x cmInsulation materialk = 0.03 W/mK
3 cmExterior plasterk = 0.87 W/mK
2 cmInterior plasterk = 0.87 W/mK
20 cmHollow brickk = 0.45 W/mK
Heat transfer coefficient (Inside)hi = 8.29 W/m2K
Heat transfer coefficient (Outside)ho = 28.35 W/m2K
Expanded polystyrene (EPS)
Material costCins = 120 $/m3
Conductivityk = 0.039 W/mK
Densityρ = 20 kg/m3
Natural gas
PriceCf = 0.29 $/m3
Lower heating valueHu = 34526.103 J/m3
Heating system’s efficiencyη = 93%
Electricity
PriceCe = 0.0947 $/kWh
Coefficient of cooling system performanceCOP = 2.5
Discount rateg = 20%
Inflation ratei = 17%
LifetimeLT = 20
Present worth factorPWF = 15.5
Table 2. Optimum insulation thicknesses for different directions and seasonal usages.
NNEESESSWWNW
Only Heated, xopt,H (cm)5.025.014.884.664.524.664.884.75
Only Cooled, Xopt,C (cm)1.561.581.721.952.091.951.721.80
Both Heated and Cooled, Xopt,A (cm)6.086.076.025.955.925.956.025.96
Table 3. Correlations for different directions and seasonal usages.
Only Heated, xopt,H (cm)
NCost = 26.43997 − 622.0711*x + 11259.94*x2 − 79956.95*x3 + 208548.9*x4
NECost = 26.35419 − 619.6636*x + 11223.41*x2 − 79697.54*x3 + 207872.3*x4
ECost = 25.41728 − 593.3679*x + 10824.41*x2 − 76864.23*x3 + 200482.3*x4
SECost = 23.96003 − 552.4683*x + 10203.81*x2 − 72457.36*x3 + 188988.0*x4
SCost = 23.07432 − 527.6099*x + 9826.619*x2 − 69778.91*x3 + 182001.9*x4
SWCost = 23.96003 − 552.4683*x + 10203.81*x2 − 72457.36*x3 + 188988.0*x4
WCost = 25.41728 − 593.3679*x + 10824.41*x2 − 76864.23*x3 + 200482.3*x4
NWCost = 24.58018 − 569.8737*x + 10467.92*x2 − 74332.77*x3 + 193879.6*x4
Only Cooled, xopt,C (cm)
NCost = 7.828451 − 99.71533*x + 3333.880*x2 − 23673.97*x3 + 61747.98*x4
NECost = 7.877767 − 101.0994*x + 3354.890*x2 − 23823.10*x3 + 62136.96*x4
ECost = 8.430012 − 116.5989*x + 3590.074*x2 − 25493.15*x3 + 66492.88*x4
SECost = 9.345131 − 142.2829*x + 3979.794*x2 − 28260.55*x3 + 73711.00*x4
SCost = 9.948581 − 159.2194*x + 4236.784*x2 − 30085.44*x3 + 78470.79*x4
SWCost = 9.345131 − 142.2829*x + 3979.794*x2 − 28260.55*x3 + 73711.00*x4
WCost = 8.430012 − 116.5989*x + 3590.074*x2 − 25493.15*x3 + 66492.88*x4
NWCost = 8.746919 − 125.4933*x + 3725.034*x2 − 26451.50*x3 + 68992.52*x4
Both Heated and Cooled, Xopt,A (cm)
NCost = 34.26842 − 841.7864*x + 14593.83*x2 − 103630.9*x3 + 270296.9*x4
NECost = 34.23196 − 840.7630*x + 14578.30*x2 − 103520.6*x3 + 270009.3*x4
ECost = 33.84729 − 829.9668*x + 14414.48*x2 − 102357.4*x3 + 266975.1*x4
SECost = 33.30516 − 814.7511*x + 14183.61*x2 − 100717.9*x3 + 262699.0*x4
SCost = 33.02290 − 806.8294*x + 14063.40*x2 − 99864.35*x3 + 260472.7*x4
SWCost = 33.30516 − 814.7511*x + 14183.61*x2 − 100717.9*x3 + 262699.0*x4
WCost = 33.84729 − 829.9668*x + 14414.48*x2 − 102357.4*x3 + 266975.1*x4
NWCost = 33.32710 − 815.3670*x + 14192.95*x2 − 100784.3*x3 + 262872.1*x4
Table 4. Comparative analysis with another study.
StudyCityInsulation Thickness (cm)
NESW
Present StudyBursa5.024.884.524.88
Kaynakli et al. [36]Istanbul5.154.794.334.77
Heating Degree Days (HDDs)
NESW
Present StudyBursa1466140913271409
Kaynakli et al. [36]Istanbul1719163315351628
Incoming Solar Radiation (W/m2)
NESW
Present StudyBursa529711297
Kaynakli et al. [36]Istanbul509010994
Disclaimer/Publisher’s Note: The statements, opinions and data contained in all publications are solely those of the individual author(s) and contributor(s) and not of MDPI and/or the editor(s). MDPI and/or the editor(s) disclaim responsibility for any injury to people or property resulting from any ideas, methods, instructions or products referred to in the content.

