
The Influence of Vibration Frequency and Vibration Duration on the Mechanical Properties of Zhanjiang Formation Structural Clay

Abstract
:1. Introduction
2. Experimental Investigation of Disturbance Effects and Mechanical Properties of Zhanjiang Formation Structural Clay
2.1. Test Soil
2.2. Preparation of Vibration Disturbance Samples
2.3. Evaluation of Soil Disturbance
3. Orthogonal Experimental Design and Analysis of Disturbance Degree in Zhanjiang Formation Structural Clay
3.1. Experimental Design
3.2. Experimental Variance Analysis
4. Grey Relational Analysis of Disturbance Sources in Zhanjiang Formation Structural Clay
4.1. Analysis Principle
4.2. Grey Relational Analysis
5. Analysis of Influence Mechanisms
6. Conclusions
- 1.
- Both the disturbance factor , defined by strength, and the disturbance factor , defined by deformation, exhibit a linear increasing trend with the increase of vibration duration and vibration frequency. As vibration duration and vibration frequency increase, so does the degree of soil disturbance. These two parameters are important factors in the vibrational disturbance of soil.
- 2.
- Vibration duration and vibration frequency both disturb the structural integrity of clay. Through a two-factor, three-level orthogonal experiment assessing disturbance degrees, whether defined by strength as disturbance degree or by deformation as , range analysis reveals , indicating a greater impact of vibration duration on disturbance compared to vibration frequency. Grey relational analysis indicates that the relational degrees of the vibration duration and vibration frequency factors are quite close, both significantly impacting disturbance, with the duration having a greater effect than frequency. The grey relational analysis results align with the patterns observed in the orthogonal experiment.
- 3.
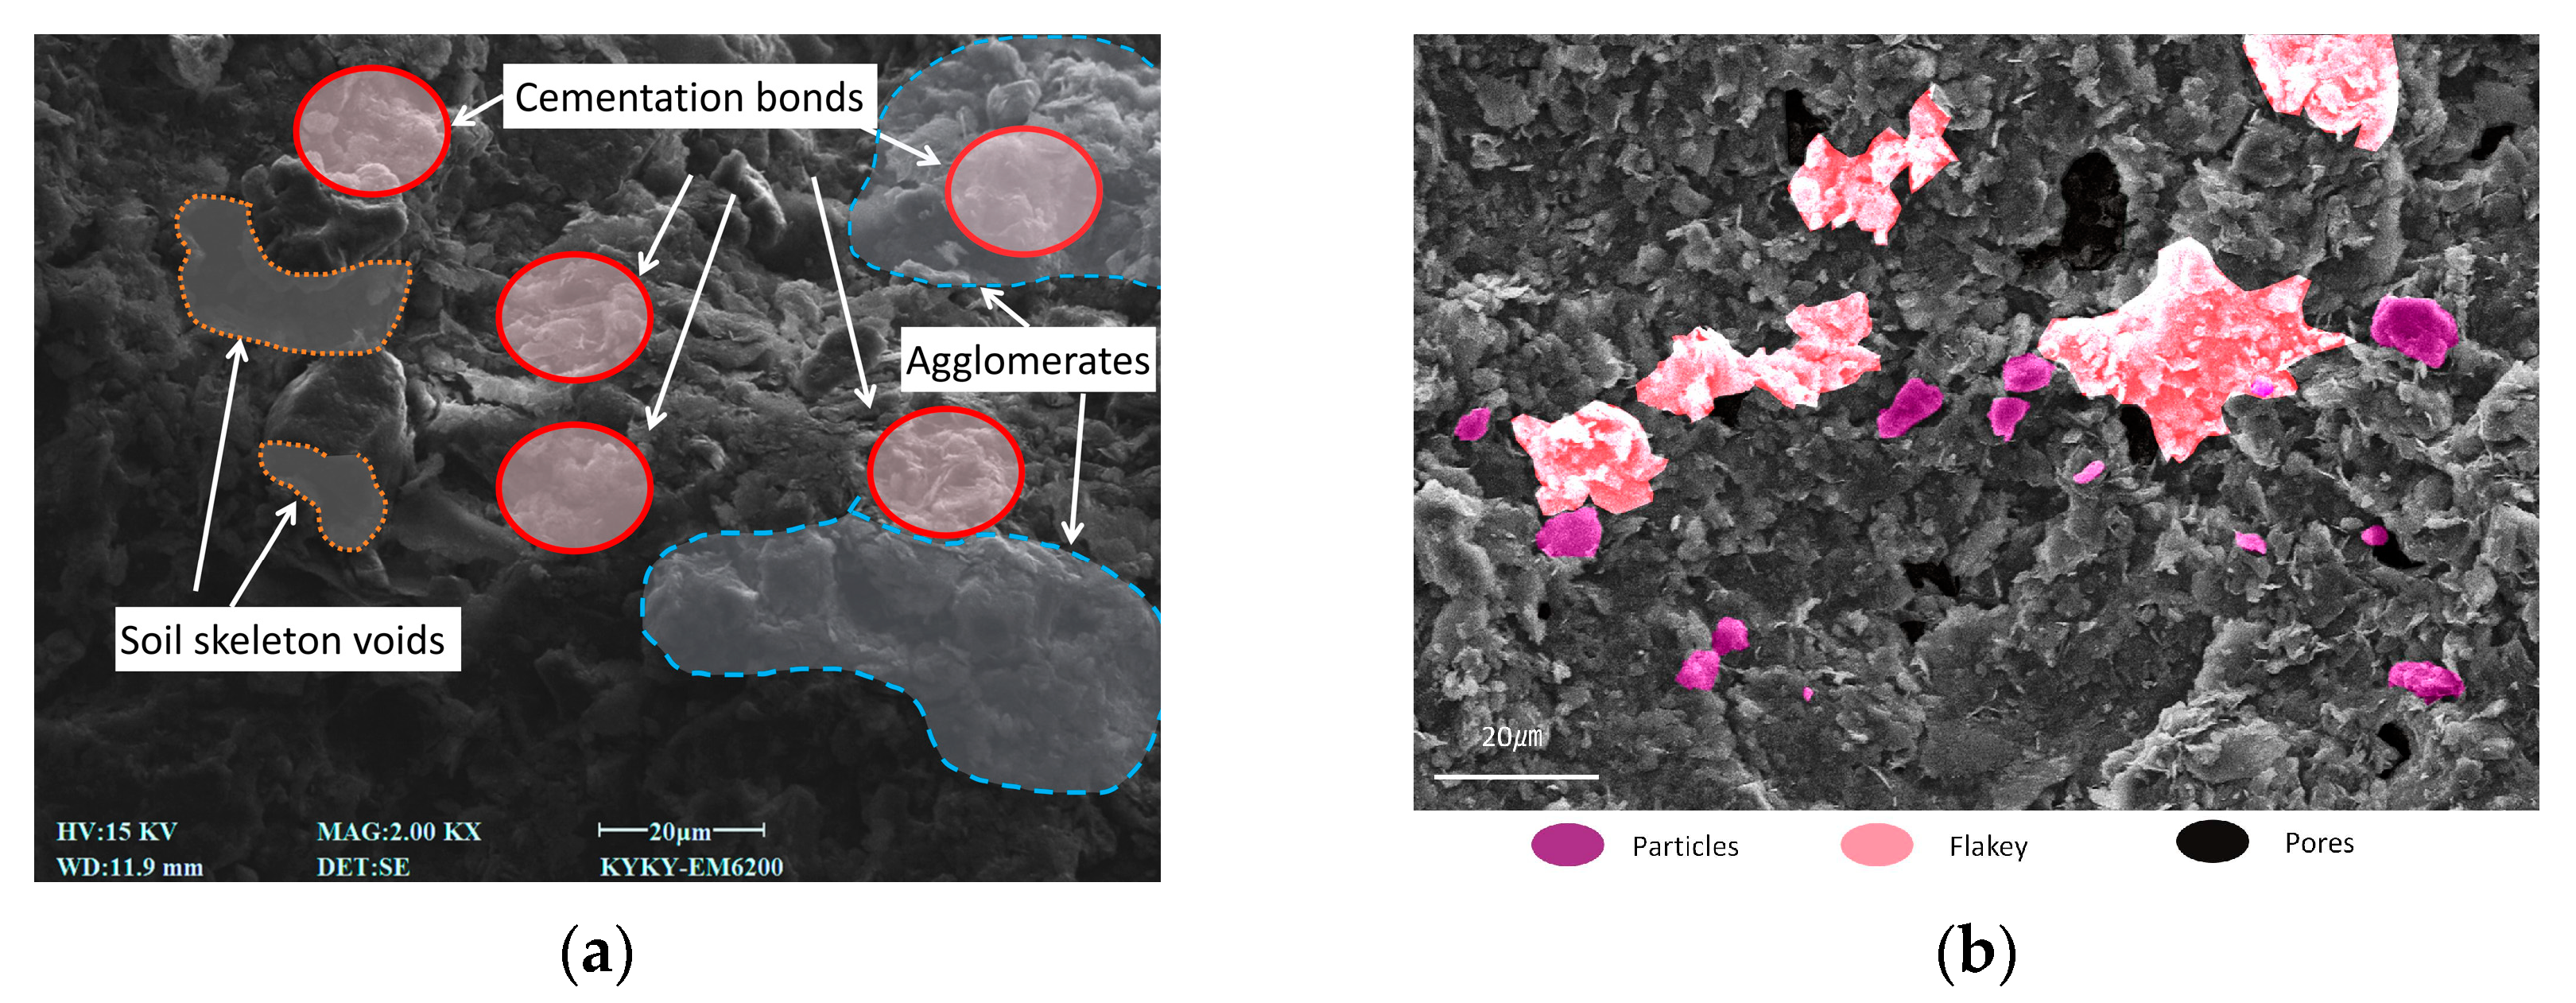
- Zhanjiang Formation structural clay, characterized by its strong cementation, is not easily destroyed. However, external vibration can gradually weaken and even destroy the cementation bonds between soil particles. Moreover, vibration disturbance functions as a “fatigue damage effect”, wherein prolonged exposure weakens the cemented bonds between soil particles due to “cumulative” energy, eventually causing fracture and destruction. Both frequent small-scale and large-scale vibrations can destroy the cemented bonds between soil particles, contingent upon sufficient duration.
Author Contributions
Funding
Institutional Review Board Statement
Informed Consent Statement
Data Availability Statement
Conflicts of Interest
References
- Tang, B.; Zhou, B.; Xie, L.; Yin, J.; Zhao, S.; Wang, Z. Strength Recovery Model of Clay during Thixotropy. Adv. Civ. Eng. 2021, 2021, 8825107. [Google Scholar] [CrossRef]
- Tang, B.; Zhou, B.; Xie, L.; Yin, J. Evaluation Method for Thixotropy of Clay Subjected to Unconfined Compressive Test. Front. Earth Sci. 2021, 9, 683454. [Google Scholar] [CrossRef]
- Zhang, C.H. The effect of structural clay on the displacement of Zhangjiang NO.1 quay. Nanjing Hydraul. Res. Inst. 1985, 13, 123–132. [Google Scholar]
- Tang, B.; Yao, Z.; Kang, J.S. Effect of disturbance degree on thixotropy of structural clay in Zhangjiang formation. Sci. Technol. Eng. 2021, 21, 9059–9066. [Google Scholar]
- Zang, M.; Tai, J.; Wang, W.W. Experimental study on dynamic characteristics of structured clay under cyclic loading. Sci. Technol. Eng. 2020, 20, 13348–13354. [Google Scholar]
- Deng, Y.F.; Liu, S.Y. Effect of sample disturbance on soft soil strength. Chin. J. Rock Mech. Eng. 2007, 26, 1940–1944. [Google Scholar]
- Miao, Y.H.; Fan, J.Q.; Yin, J. Influence of vibration frequency and time on compression characteristics of soft clay under dis-turbance. J. Univ. Jinan (Sci. Technol.) 2022, 36, 261–266. [Google Scholar]
- Liu, J.J.; Zeng, G.H.; Meng, L.S.; He, W.B. Study on the Effect of Disturbance on the Thixotropic Strength Increasing of silt. Chin. J. Undergr. Space Eng. 2016, 12, 1294–1299. [Google Scholar]
- Zhang, B.H.; Liu, S.Y.; Xie, Y.H.; Tang, B.; Han, W.C. Study on the Mechanical Properties and Microscopic Mechanism of Structural Clay of Zhanjiang Formation under the Action of Vibration Disturbance. Water Resour. Hydropower Eng. 2024. Available online: http://kns.cnki.net/kcms/detail/10.1746.TV.20240128.1432.002.html (accessed on 13 July 2024).
- Xu, Y.F. Quantitative determination of disturbance degree of soils influenced by construction. Dam Obs. Geotech. Tests 2000, 24, 8–10. [Google Scholar]
- Li, T.; Qian, S.Y. Evaluation of soil sample disturbance and determination of its preconsolidation pressure. Chin. J. Geotech. Eng. 1987, 9, 21–30. [Google Scholar]
- Hvorslev, M.J. Surface Exploration and Sampling of Soils for Civil Engineering Purposes; Waterways Experiment Station: Vicksburg, MS, USA, 1949. [Google Scholar]
- Ladd, C.C.; Lambe, T.W. The strength of undisturbed clay determined from undrained test. Lab. Shear. Test. Soils 1963, 85, 361–365. [Google Scholar]
- Raymond, G.P. The effect of sampling on the undrained soil properties of a Leda clay. Can. Geotech. J. 1971, 8, 546–557. [Google Scholar] [CrossRef]
- Nagaraj, M.; Chung, S.G. Analysis and assessment of sampling disturbance of soit senstitive clays. Geotechnique 2003, 53, 679–683. [Google Scholar] [CrossRef]
- Hong, Z.; Onitsuka, K. A Method of Correcting Yield Stress and Compression Index of Ariake Clays for Sample Disturbance. Soils Found. 1998, 38, 211–222. [Google Scholar] [CrossRef] [PubMed]
- Butterfield, R. A natural compression law for soils (an advance on e-lgp’). Geotechnique 1979, 29, 469–480. [Google Scholar] [CrossRef]
- Zhao, S.N.; Huo, Y.L.; Tang, B. Thixotropic experiment and thixotropic strength prediction model of structural clay in Zhan-jiang Formation. Rock Soil Mech. 2023, 44 (Suppl. S1), 197–205. [Google Scholar]
- Wang, Q.Z.; Liu, J.K.; Tian, Y.H.; Fang, J.H.; Zhu, X.X. A study of orthogonal design tests on frost-heaving characteristics of graded crushed rock. Rock Soil Mech. 2015, 36, 2825–2830+2836. [Google Scholar]
- Gong, L.L.; Liu, D.R.; Yang, N.; Wang, Y.; Zhang, Y. Comprehensive analysis on frost heave factors of subgrade soil in seasonally frozen ground region. Hydro-Sci. Eng. 2019, 41, 28–34. [Google Scholar]
- Xi, H.P.; Li, H.X.; Yan, C.G.; Wang, R.; Lu, D. Analysis on factors controlling shallow failures of the cut slopes and its prevention by bio-engineering measures: A case study of the cut slopes along the highway from Shuangcheng to Dajial. Chin. J. Geol. Hazard Control. 2024, 35, 70–79. [Google Scholar]
- Huang, W.J.; Mao, X.S.; Wu, Q. Experimental investigation on the shear strength of freeze-thaw inferface in fine-grained soil grey relational analysis. J. Eng. Geol. 2022, 30, 1477–1484. [Google Scholar]
- Zhang, Y.F.; Ci, J.; Xiao, J. Application of grey link advantage analysis in frozen soil. J. Water Resour. Arch.-Tural Eng. 2006, 16, 12–14. [Google Scholar]
- Zhang, X.W.; Kong, L.W.; Guo, A.G.; Tu, Y. Physical and mechanical indexes and correlation analysis of clay with noticeable structures in Zhanjhiang area. J. Eng. Geol. 2011, 19, 447–454. [Google Scholar]
- Zhang, X.W.; Kong, L.W.; Li, J.; Yang, A.W. Microscopic mechanism of strength increase of clay during thixotropic process. Chin. J. Geotech. Eng. 2014, 36, 1407–1413. [Google Scholar]
- Zhang, X.W.; Kong, L.W.; Chen, C.; Li, K.K.; Li, Y. Effects of hydrochemistry on structural strength of Zhanjiang formation clay. Chin. J. Geotech. Eng. 2017, 39, 1967–1975. [Google Scholar]
- Su, R.J.; Kong, L.W.; Shi, W.Z.; Liu, B.H.; Li, C.S. Effects of loading rate on SBPT responses of Zhanjiang structured clay. Rock Soil Mech. 2021, 42, 1557–1567. [Google Scholar]


| Water Content () | Natural Density () | Dry Density () | Specific Gravity | Plasticity Index | Liquid Index | Void Ratio | Sensitivity |
|---|---|---|---|---|---|---|---|
| 47.22 | 1.74 | 1.18 | 2.72 | 25.83 | 0.81 | 1.29 | 4.01 |
| Vibration Frequency/Hz | Unconfined Compressive Strength (kPa) | ||
|---|---|---|---|
| 30 min | 60 min | 90 min | |
| 20 Hz | 187.57 | 173.24 | 174.35 |
| 35 Hz | 166.79 | 148.15 | 137.19 |
| 50 Hz | 139.89 | 116.89 | 101.94 |
| Condition | P/kPa | ||||||||||
|---|---|---|---|---|---|---|---|---|---|---|---|
| 12.5 | 25 | 50 | 100 | 200 | 400 | 800 | 1600 | 3200 | |||
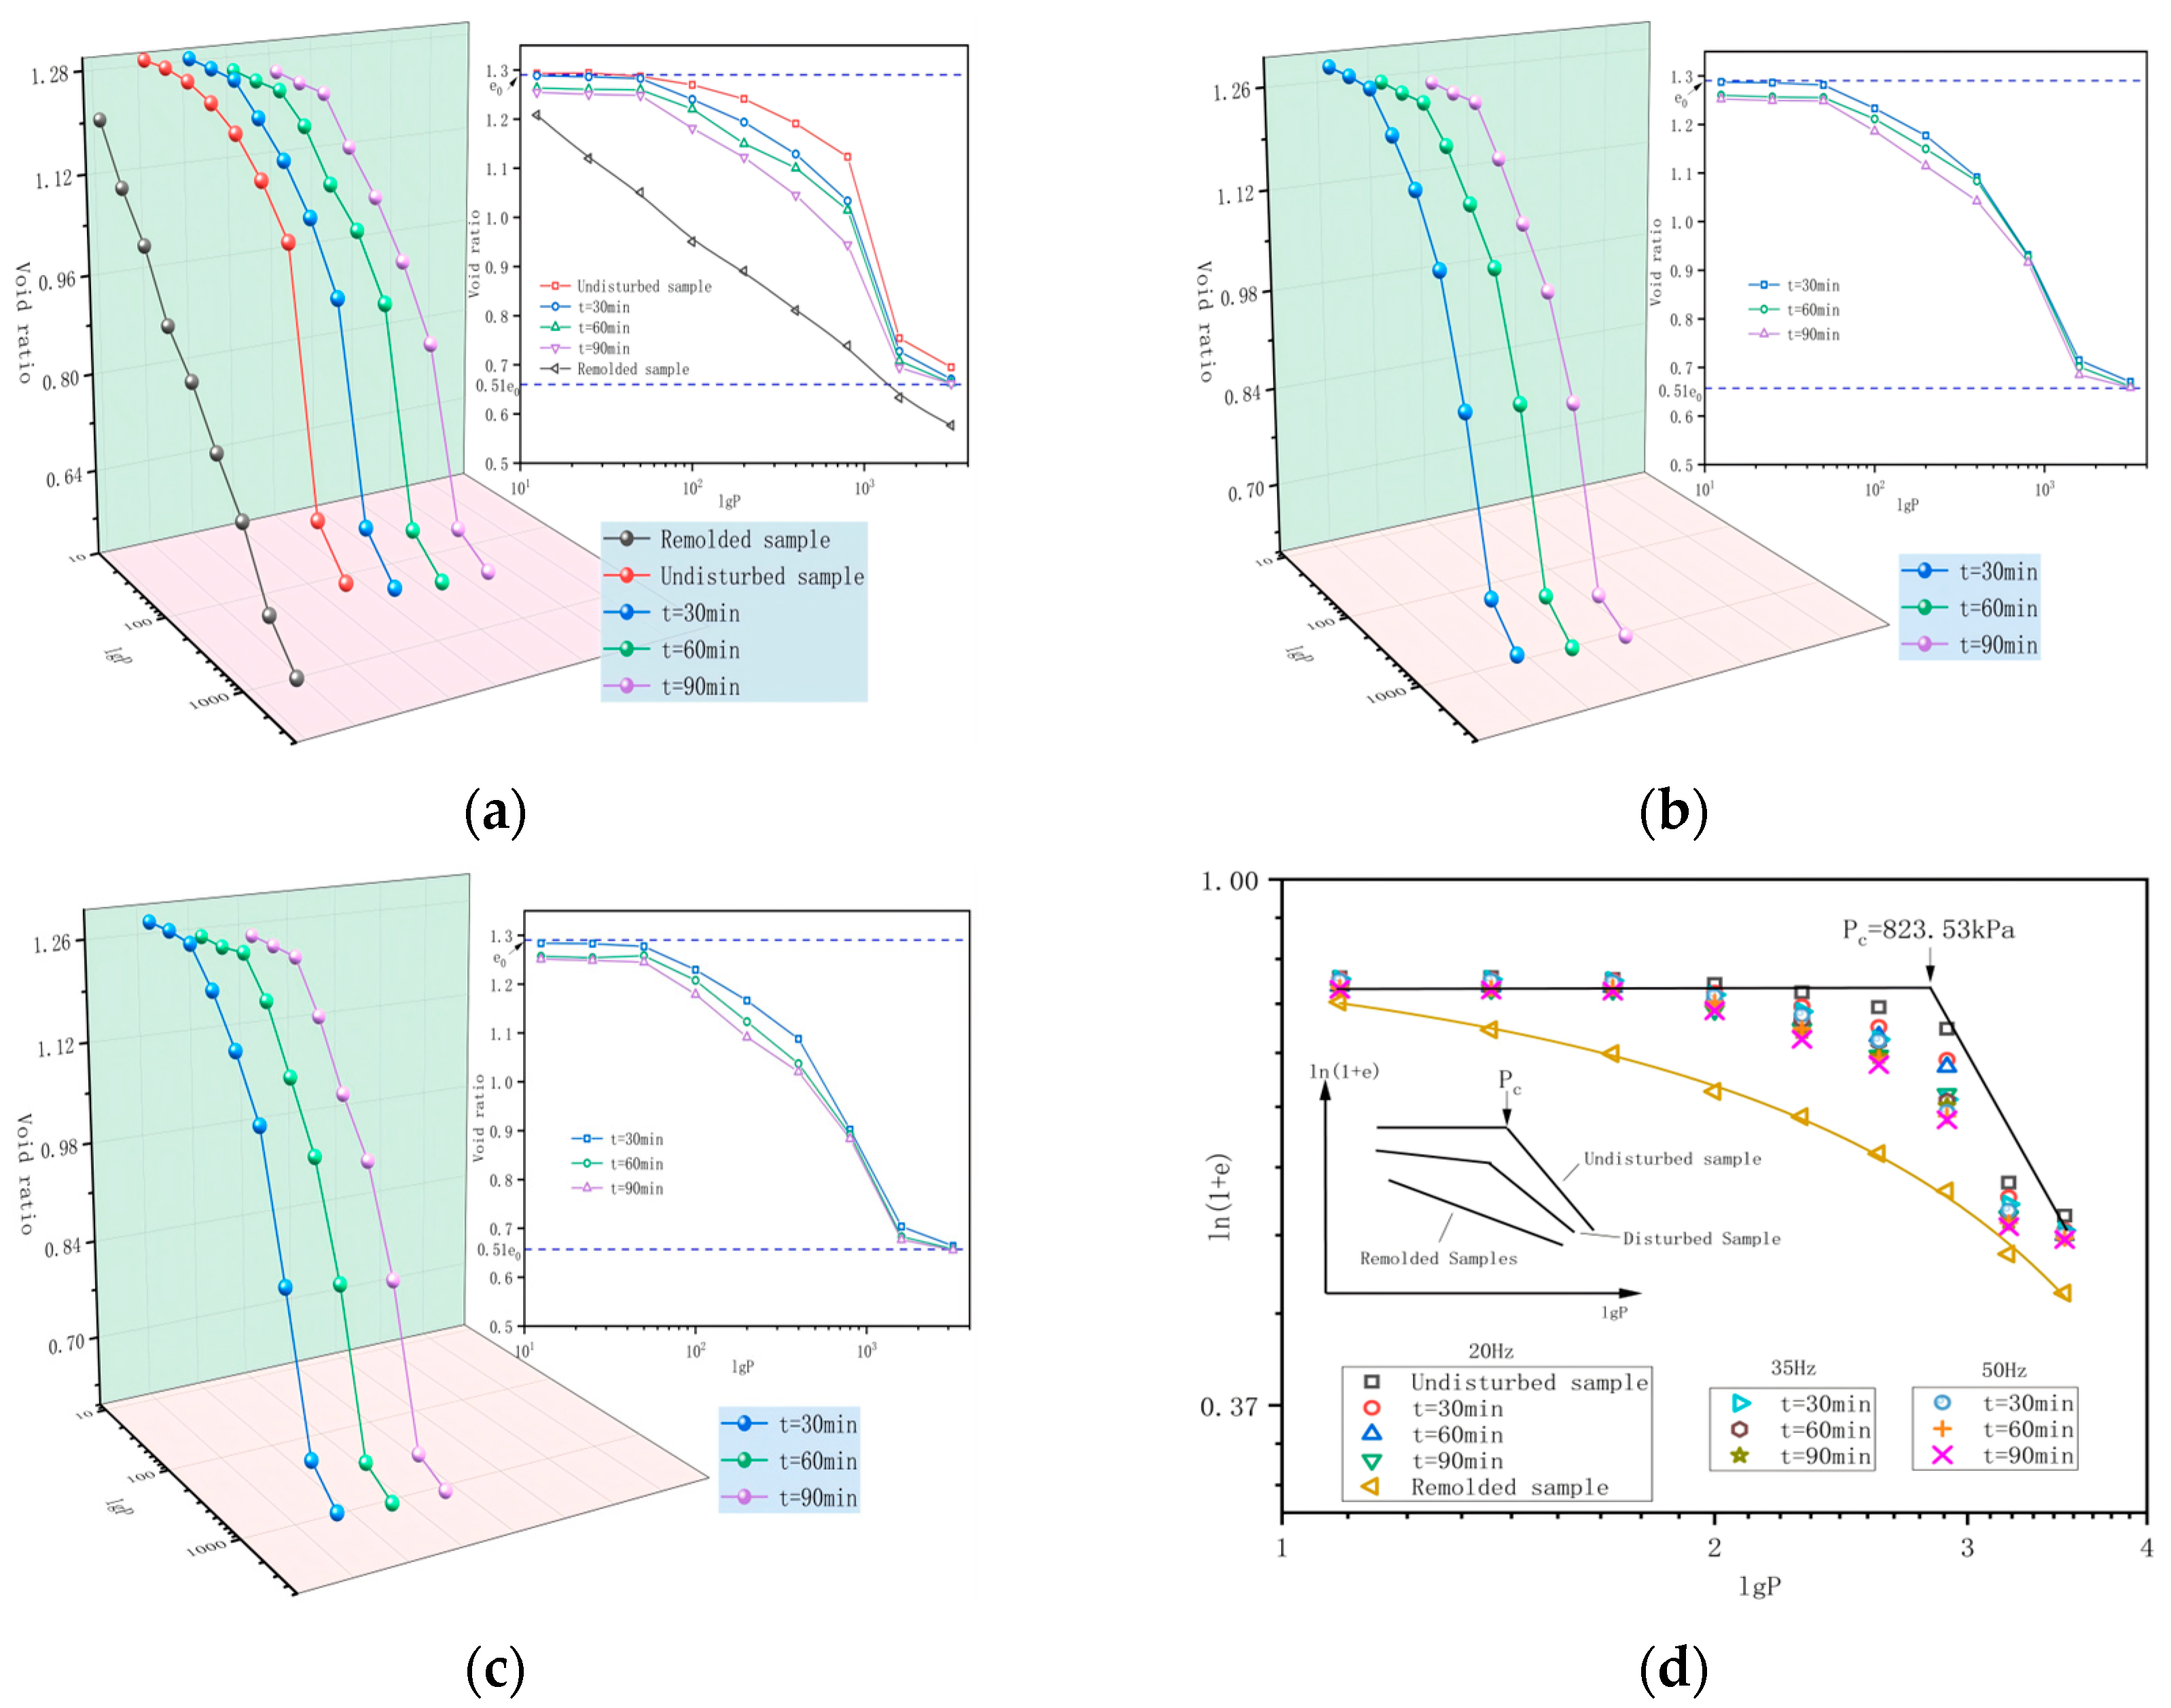
| Undisturbed | 1.2929 | 1.294 | 1.2871 | 1.2697 | 1.2409 | 1.1909 | 1.1233 | 0.7539 | 0.6950 | ||
| Disturbed | 20 Hz | 30 min | 1.2885 | 1.2861 | 1.2827 | 1.2401 | 1.1938 | 1.1287 | 1.0335 | 0.7272 | 0.6707 |
| 60 min | 1.2632 | 1.2605 | 1.2596 | 1.2205 | 1.1502 | 1.1005 | 1.0147 | 0.7081 | 0.6629 | ||
| 90 min | 1.2545 | 1.2505 | 1.2482 | 1.1812 | 1.1223 | 1.0445 | 0.9443 | 0.6943 | 0.6613 | ||
| 35 Hz | 30 min | 1.2873 | 1.2858 | 1.2812 | 1.2329 | 1.1772 | 1.0913 | 0.9313 | 0.7149 | 0.6703 | |
| 60 min | 1.2600 | 1.2565 | 1.2552 | 1.2111 | 1.1497 | 1.0835 | 0.9278 | 0.7011 | 0.6610 | ||
| 90 min | 1.2524 | 1.2492 | 1.2484 | 1.1862 | 1.1148 | 1.0425 | 0.9160 | 0.6851 | 0.6586 | ||
| 50 Hz | 30 min | 1.2836 | 1.2828 | 1.2772 | 1.2292 | 1.1662 | 1.0877 | 0.9022 | 0.7037 | 0.6640 | |
| 60 min | 1.2570 | 1.2541 | 1.2582 | 1.2075 | 1.1229 | 1.0371 | 0.8922 | 0.6832 | 0.6579 | ||
| 90 min | 1.2512 | 1.2486 | 1.2452 | 1.1790 | 1.0914 | 1.0204 | 0.8835 | 0.6767 | 0.6557 | ||
| Remolded | 1.2082 | 1.1198 | 1.0506 | 0.9506 | 0.89056 | 0.8105 | 0.7385 | 0.6331 | 0.5768 | ||
| Vibration Duration/min | Slope of the Compression Curve | |||||
|---|---|---|---|---|---|---|
| 20 Hz | 35 Hz | 50 Hz | 20 Hz | 35 Hz | 50 Hz | |
| 30 | −0.0423 | −0.0439 | −0.0466 | −0.1400 | ||
| 60 | −0.0445 | −0.0501 | −0.0598 | |||
| 90 | −0.0466 | −0.0562 | −0.0714 | |||
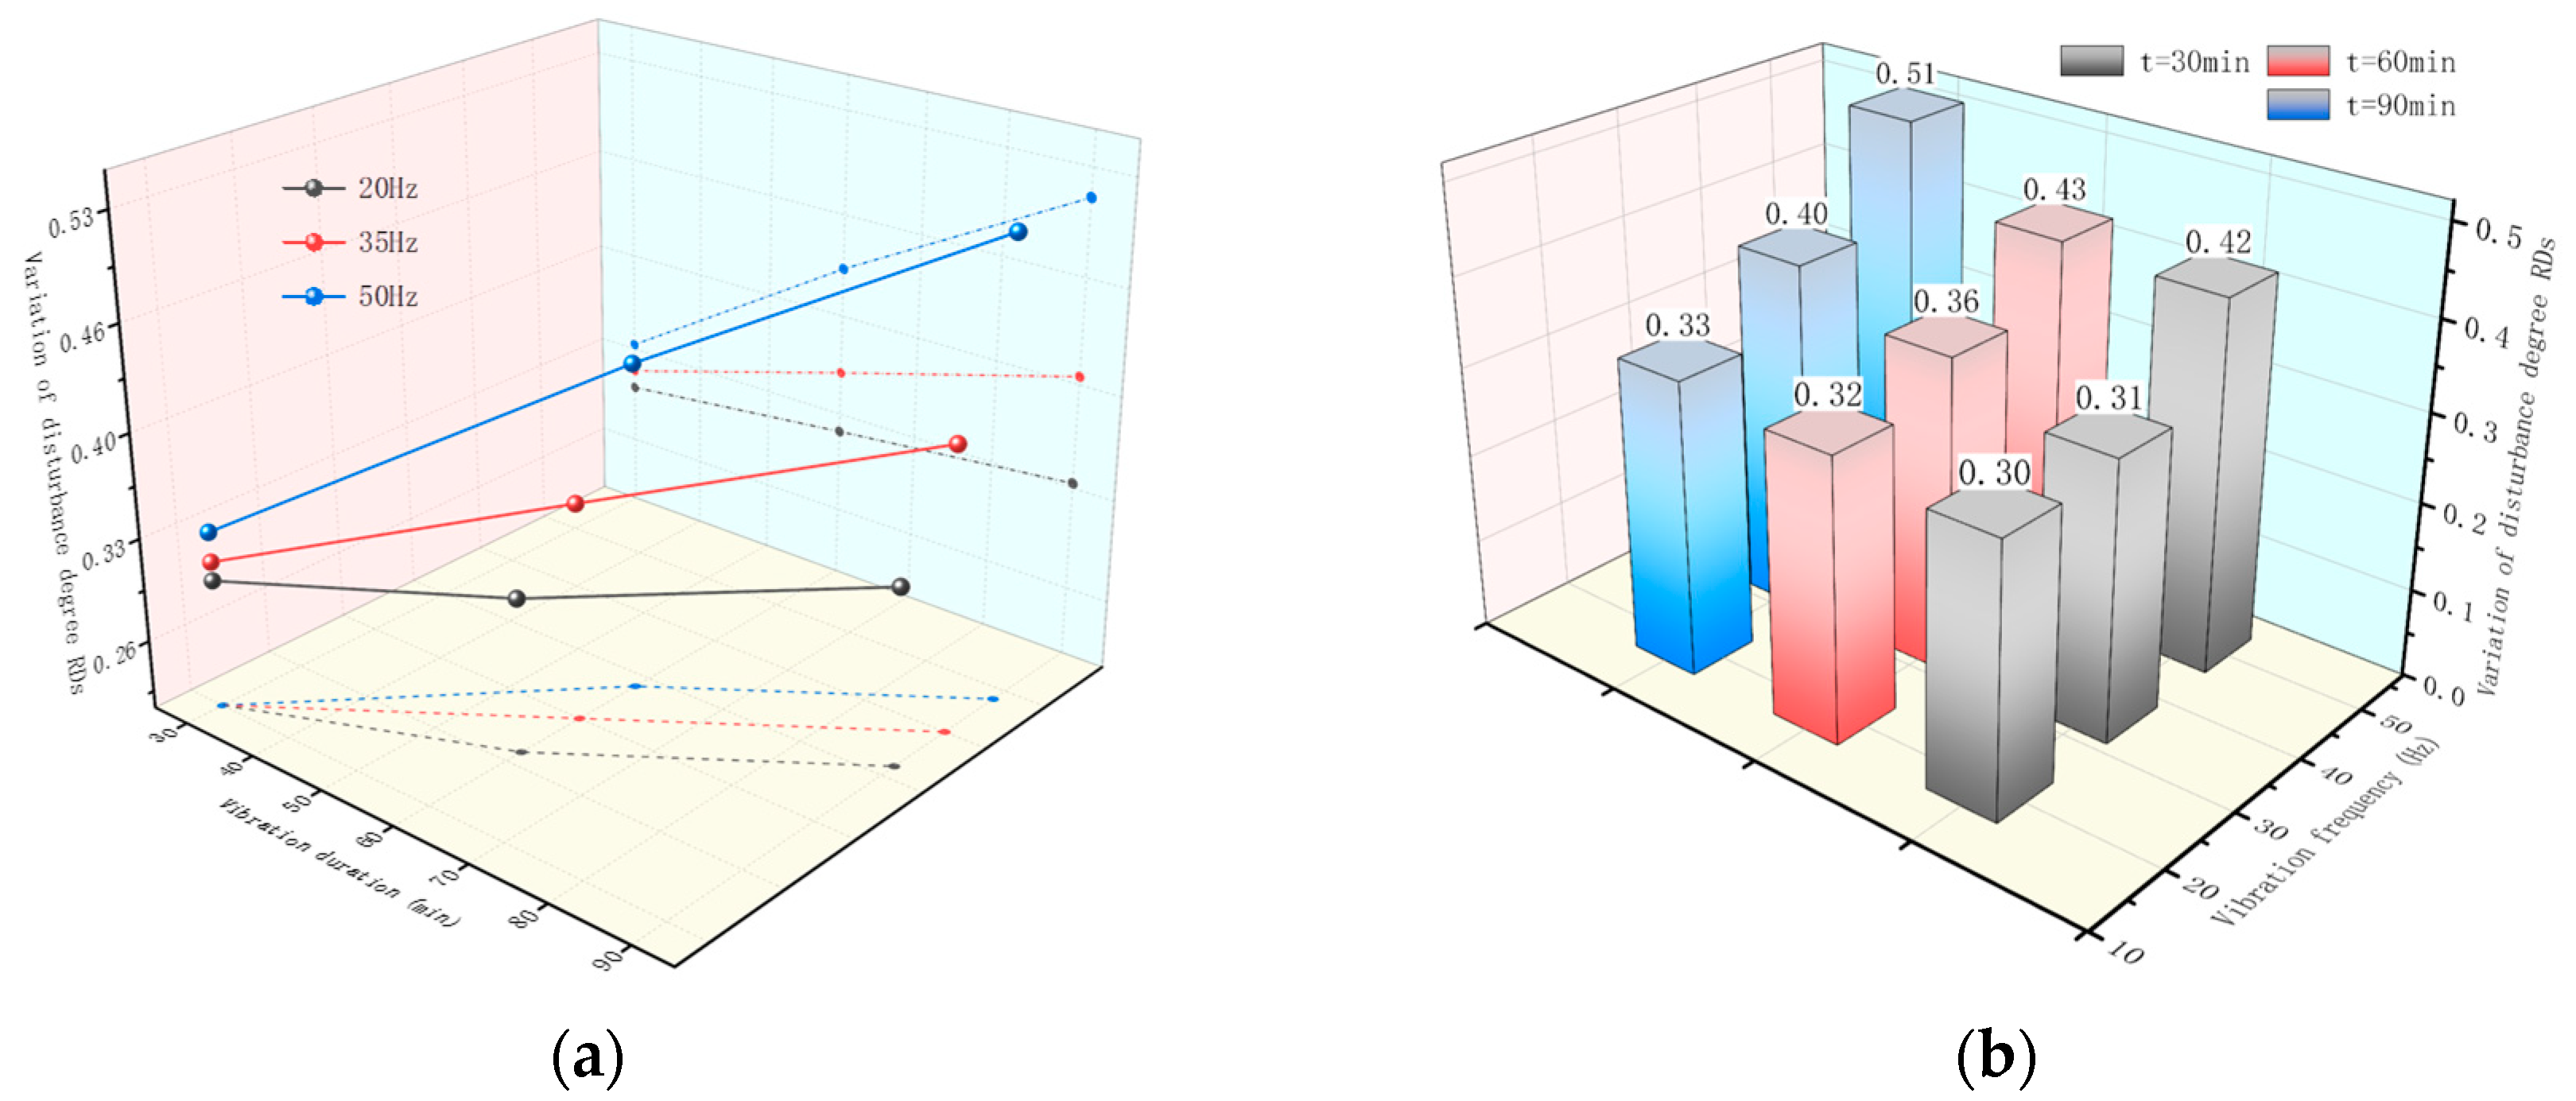
| Mechanical Properties | Vibration Duration/min | Vibrating Frequency/Hz | ||
|---|---|---|---|---|
| 20 | 35 | 50 | ||
| Strength () (Reprinted from Ref. [9]) | 30 | 0.22 | 0.31 | 0.42 |
| 60 | 0.28 | 0.39 | 0.52 | |
| 90 | 0.28 | 0.43 | 0.58 | |
| Deformation () | 30 | 30.2% | 31.4% | 33.3% |
| 60 | 31.8% | 35.8% | 42.7% | |
| 90 | 33.3% | 40.1% | 51% | |
| Factor Level | Horizontal | ||
|---|---|---|---|
| 1 | 2 | 3 | |
| Duration (min) | 30 | 60 | 90 |
| Frequency (Hz) | 20 | 35 | 50 |
| Experiment No. | Duration (min) | Frequency (Hz) | Experimental Results | ||
|---|---|---|---|---|---|
| 1 (t) | 2 (f) | Disturbance Degree | Disturbance Degree (%) | ||
| 1 | 1 | 1 | 0.22 | 30.2 | |
| 2 | 1 | 2 | 0.28 | 31.8 | |
| 3 | 1 | 3 | 0.28 | 33.3 | |
| 4 | 2 | 1 | 0.31 | 31.4 | |
| 5 | 2 | 2 | 0.39 | 35.8 | |
| 6 | 2 | 3 | 0.43 | 40.1 | |
| 7 | 3 | 1 | 0.42 | 33.3 | |
| 8 | 3 | 2 | 0.52 | 42.7 | |
| 9 | 3 | 3 | 0.58 | 51 | |
| Horizontal sum | 0.78 | 0.95 | 95.3 | 94.9 | |
| 1.13 | 1.19 | 107.3 | 110.3 | ||
| 1.52 | 1.29 | 127 | 124.4 | ||
| Horizontal mean | 0.26 | 0.317 | 31.767 | 31.633 | |
| 0.377 | 0.397 | 35.767 | 36.767 | ||
| 0.507 | 0.430 | 42.333 | 41.467 | ||
| Range | 0.247 | 10.567 | |||
| 0.113 | 9.833 | ||||
Disclaimer/Publisher’s Note: The statements, opinions and data contained in all publications are solely those of the individual author(s) and contributor(s) and not of MDPI and/or the editor(s). MDPI and/or the editor(s) disclaim responsibility for any injury to people or property resulting from any ideas, methods, instructions or products referred to in the content. |
© 2024 by the authors. Licensee MDPI, Basel, Switzerland. This article is an open access article distributed under the terms and conditions of the Creative Commons Attribution (CC BY) license (https://creativecommons.org/licenses/by/4.0/).
Share and Cite
Xie, Y.; Tang, B.; Shi, Y.; Liu, S.; Hu, J.; Zhang, B. The Influence of Vibration Frequency and Vibration Duration on the Mechanical Properties of Zhanjiang Formation Structural Clay. Appl. Sci. 2024, 14, 8262. https://doi.org/10.3390/app14188262
Xie Y, Tang B, Shi Y, Liu S, Hu J, Zhang B. The Influence of Vibration Frequency and Vibration Duration on the Mechanical Properties of Zhanjiang Formation Structural Clay. Applied Sciences. 2024; 14(18):8262. https://doi.org/10.3390/app14188262
Chicago/Turabian StyleXie, Yanhua, Bin Tang, Yansong Shi, Shuaiyu Liu, Jiankun Hu, and Binghui Zhang. 2024. "The Influence of Vibration Frequency and Vibration Duration on the Mechanical Properties of Zhanjiang Formation Structural Clay" Applied Sciences 14, no. 18: 8262. https://doi.org/10.3390/app14188262