Article

Analysis of Flow Field Characteristics in the Three-Phase Jet Fire Monitor Head

College of Mechanical and Electronic Engineering, Shandong University of Science and Technology, Qingdao 266590, China
*
Author to whom correspondence should be addressed.
Appl. Sci. 2024, 14(18), 8300; https://doi.org/10.3390/app14188300
Submission received: 27 August 2024 / Revised: 12 September 2024 / Accepted: 12 September 2024 / Published: 14 September 2024

Abstract

:
To enhance the jet performance of the three-phase jet fire monitor (TPJFM), an analysis was conducted on the internal flow field (IFF) characteristics of the monitor head. Using the volume of fluid method, the impact of key structural parameters, such as the powder-pipe bending angle and the supporting blade length, on the turbulent kinetic energy (TKE) of the IFF, the velocity distribution uniformity at the nozzle outlet, and the pressure drop (PD) between the inlet and outlet of the internal flow field, was analyzed. The study revealed that increasing the bending angle of the powder pipe will lead to a significant improvement in the uniformity of velocity distribution in the IFF. Extending the supporting blade length helps reduce the average TKE at the nozzle outlet but has a minimal impact on the velocity distribution uniformity and the PD between the inlet and outlet. Reasonable design of the distance between the supporting blades and the bending section of the powder pipe can improve the IFF characteristics, reducing local pressure losses and peak TKE. The research results can effectively improve the IFF characteristics, enhance jet performance, and provide theoretical basis and technical support for the design and optimization of the TPJFM.

1. Introduction

Fire is one of the major disasters that threaten public safety and cause significant property damage [1]; urban fires alone result in over 3 million deaths globally each year [2]. As a crucial firefighting apparatus, the performance of fire monitors directly affects firefighting efficiency and firefighter safety. In recent years, three-phase jet fire extinguishing technology has been widely applied in various fields such as forestry and chemical industries due to its high extinguishing efficiency and strong re-ignition resistance. The three-phase jet fire monitor (TPJFM), with its advantages of long range, large water volume, and strong adjustability, has become a research hotspot in the firefighting field. The internal flow field (IFF) is the key component of the TPJFM, converting the pressure energy of the water or other extinguishing agents into jet kinetic energy. The TPJFM typically consists of water, compressed air, and powdered extinguishing agents. The powder pipe is inserted into the center of the IFF, with compressed air propelling the powder out, and water being ejected in an annular shape to envelop the air and powder, carrying them to the fire source. Compared to traditional fire monitors, its complex IFF structure significantly affects the flow characteristics, thereby determining the performance of the TPJFM.
Su et al. [3] used Fluent software for the numerical simulation of nozzles on fire trucks, analyzing performance indicators such as flow rate and velocity for different nozzle structures, revealing the impact of various nozzle designs on water jet performance. Song et al. [4] conducted finite element analysis on nozzle selection based on high-pressure water jet technology, studying the effects of different nozzle structures on jet performance. Wen et al. [5] investigated the structure and hydraulic performance of typical straight nozzles, revealing the internal flow characteristics. Zhang et al. [6] conducted structural optimization and numerical simulation studies on high-pressure water jet nozzles, proposing optimized design schemes and verifying their effectiveness. Hou et al. [7] analyzed the structural strength and stability of liquid nitrogen fire monitors using computational fluid dynamics (CFD) methods and improved performance and efficiency through optimized structural design, demonstrating that numerical simulation can effectively guide structural optimization. Additionally, other studies have shown the importance of CFD methods in understanding and optimizing the IFF of fire monitors. Yuan et al. [8,9] used CFD simulations to study the detailed effects of jet angle, velocity, and flow rate on the dynamic behavior of jet systems, finding that jet angle significantly impacts system stability. These studies have revealed the complex dynamic behavior within the flow field, providing a theoretical basis for further optimization design. Min et al. [10] investigated the internal shape design of fire nozzles to reduce recoil force, with the optimized design significantly improving jet performance. Zhou et al. [11] studied optimization schemes for liquid fire monitors with self-swing devices through simulation and experiments, with optimized designs significantly improving jet characteristics. Hu et al. [12] analyzed the jet characteristics of hydraulic fire monitors with self-swing mechanisms using CFD and conducted structural optimization. The optimized design significantly improved jet velocity, angle, and spray patterns. Khan et al. [13] found that the modification of the inner surface of the nozzle can significantly improve the flow performance of the IFF, and then affect the high-pressure wave peak of the outer jet. Yue Pan et al. [14] took self-operated water jet nozzles as the research object and adopted a k-ε turbulence model based on Fluent to simulate nozzle jets with different nozzle sizes and arrangements in the pipeline, and compared the distribution of jet flow field and the changes in velocity and displacement of nozzles with different parameters in the pipeline. These studies indicate that different nozzle and fire monitor structures can significantly affect the internal flow characteristics, with improved nozzle structures effectively enhancing jet performance.
In closed fluid domains, straighteners, as crucial components of the IFF structure, can significantly influence flow characteristics. Xiang et al. [15] performed multi-objective optimization on straighteners in large fire monitors’ IFFs using CFD simulations to maximize flow uniformity and minimize pressure loss. The optimized rectifier design significantly improved flow uniformity and reduced pressure loss. Yuan et al. [16] studied the effects of various IFF structures, such as different curvature radius bends, guide plates or straighteners, and the position and number of guide vanes, on the flow characteristics of fire monitors, finding that IFF structures have a significant role in eliminating vortices and achieving constant flow. Eliminating vortices and crossflows within the pipe can effectively increase the range of the fire monitor. Seo et al. [17] found that in HVAC systems’ square ducts, reducing the hydraulic diameter of the flow straightener decreased turbulence intensity, which helps achieve uniform airflow distribution. In addition, Yin et al. [18] found in the study of the vortex pump that optimizing the length of the inclined blade in the internal flow passage can effectively reduce the gradient of velocity, reduce the cavitation phenomenon, and improve the flow characteristics of the IFF. A reasonable combination of straightener structure and suitable IFF mechanisms can effectively reduce turbulent kinetic energy (TKE) within the pipe, improve outlet velocity uniformity, and enhance flow characteristics.
The volume of fluid (VOF) method proposed by Hirt et al. [19] has been widely used for dynamic simulations of free boundaries. This method accurately simulates interface behavior in multiphase flows by tracking fluid interface changes. The VOF method plays a crucial role in analyzing the IFF characteristics of fire monitors, improving simulation accuracy by precisely modeling the interface behavior between liquids and gases during jetting. Yu et al. [20] used the VOF method to study the impact of geometric variations on nozzle internal flow, conducting three-dimensional steady-state incompressible turbulent flow analysis on five different nozzle geometries, and found significant effects were produced by geometric changes on the flow patterns and nozzle outlet velocity distribution. Zou et al. [21] adopted the Euler–VOF model, a CFD simulation method, to solve the air–water multiphase flow in the abrasive water jet. Due to the invisibility of internal fluid dynamics, analyzing the IFF of fire monitors is limited. The VOF method effectively addresses invisibility issues, maximally restoring flow states and providing insights into fluid characteristics.
Research on the TPJFM is scarce. Jia [22] designed a TPJFM and individually optimized its main structural parameters, resulting in an optimal set of parameters. However, this study only considered the influence of parameters on jet performance without analyzing the flow characteristics within the IFF. Further analysis is needed to understand the impact of specific structural parameter changes on flow characteristics. Zhang et al. [23] studied the nozzle of a TPJFM, combining the Kriging surrogate model with NSGA-II for multi-objective optimization of the main structural parameters of the nozzle’s IFF. The results showed that the optimized nozzle’s IFF reduced the inlet and outlet pressure drop (PD) by 3.48%, and the average TKE at the outlet decreased by 29.38%. The optimized nozzle’s IFF exhibited a more uniform outlet velocity distribution, with a 6.25% increase in jet range. Zhang et al. [24], using numerical simulations based on Fluent, analyzed the internal flow characteristics of a TPJFM, studying the effects of different straightener installation positions, angles, and structures on the IFF’s velocity, TKE, pressure, velocity uniformity, and outlet performance. The results indicated that the flow field structure significantly influences the IFF. Reasonable straightener parameters can enhance the flow characteristics and improve jet performance. These studies, however, are limited to specific parts of the TPJFM. The monitor head, connecting the nozzle and the bend pipe, has many IFF design parameters, making the flow characteristics complex. Therefore, analyzing the flow characteristics of the IFF of the monitor head is crucial.
To enhance the jet performance of the TPJFM and increase its jet range, this study focuses on the TPJFM head. Based on the VOF method, the IFF characteristics of the TPJFM head are studied. The effects of important structural parameters such as the powder-pipe bending angle, supporting blade length, and the distance between the supporting blades and the powder-pipe bend on TKE, nozzle outlet velocity distribution uniformity, and the PD of the IFF are analyzed. The study aims to explore the influence of structural parameters on the flow characteristics of the IFF, providing a theoretical basis for improving the flow characteristics and optimizing the structural parameters of the monitor head.

2. Materials and Methods

2.1. Modeling of the TPJFM Head

The head of the TPJFM consists of the barrel wall, powder pipe, supporting blades, powder nozzle, and nozzle outer wall. The powder pipe is inserted from the outside of the barrel wall, bent, and extends along the head’s axis. The nozzle outer wall features a “straight-conical” design, with a cylindrical straight section at the end of the conical contraction segment. The powder nozzle is mounted at the head of the powder pipe, with a conical expansion section and a cylindrical straight section at the front end. Three rectangular supporting blades, spaced 120° apart, are positioned between the powder pipe and the nozzle outer wall. The barrel wall connects to the body, allowing water to flow in from the barrel wall and be annularly ejected, constrained by the nozzle outer wall and the powder pipe. The powder extinguishing agent is injected through the end of the powder pipe and ejected from the powder nozzle at the head of the powder pipe. The main structural parameters of the TPJFM head are shown in Figure 1 and Table 1.

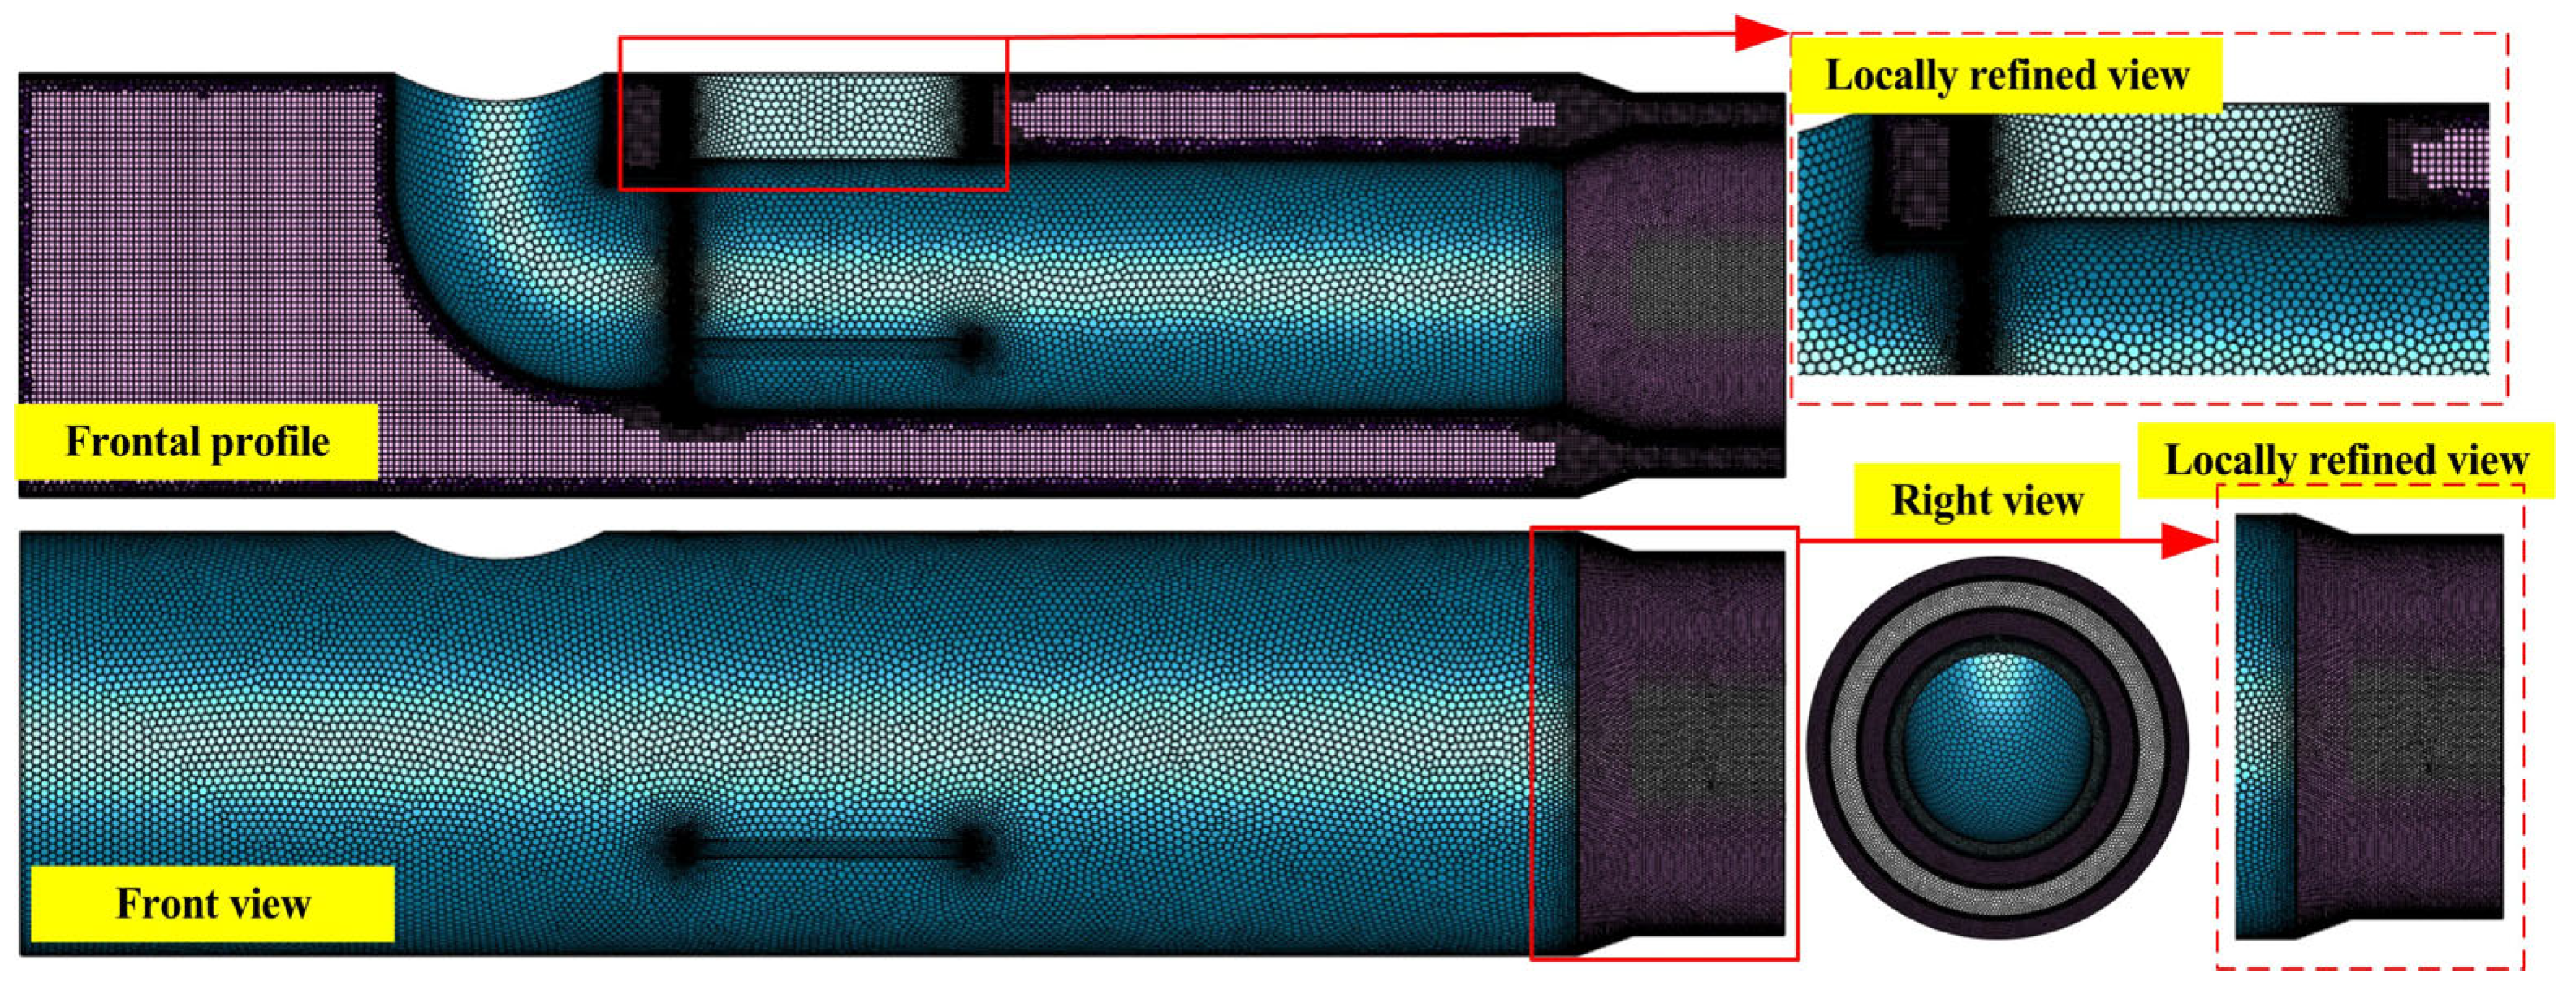
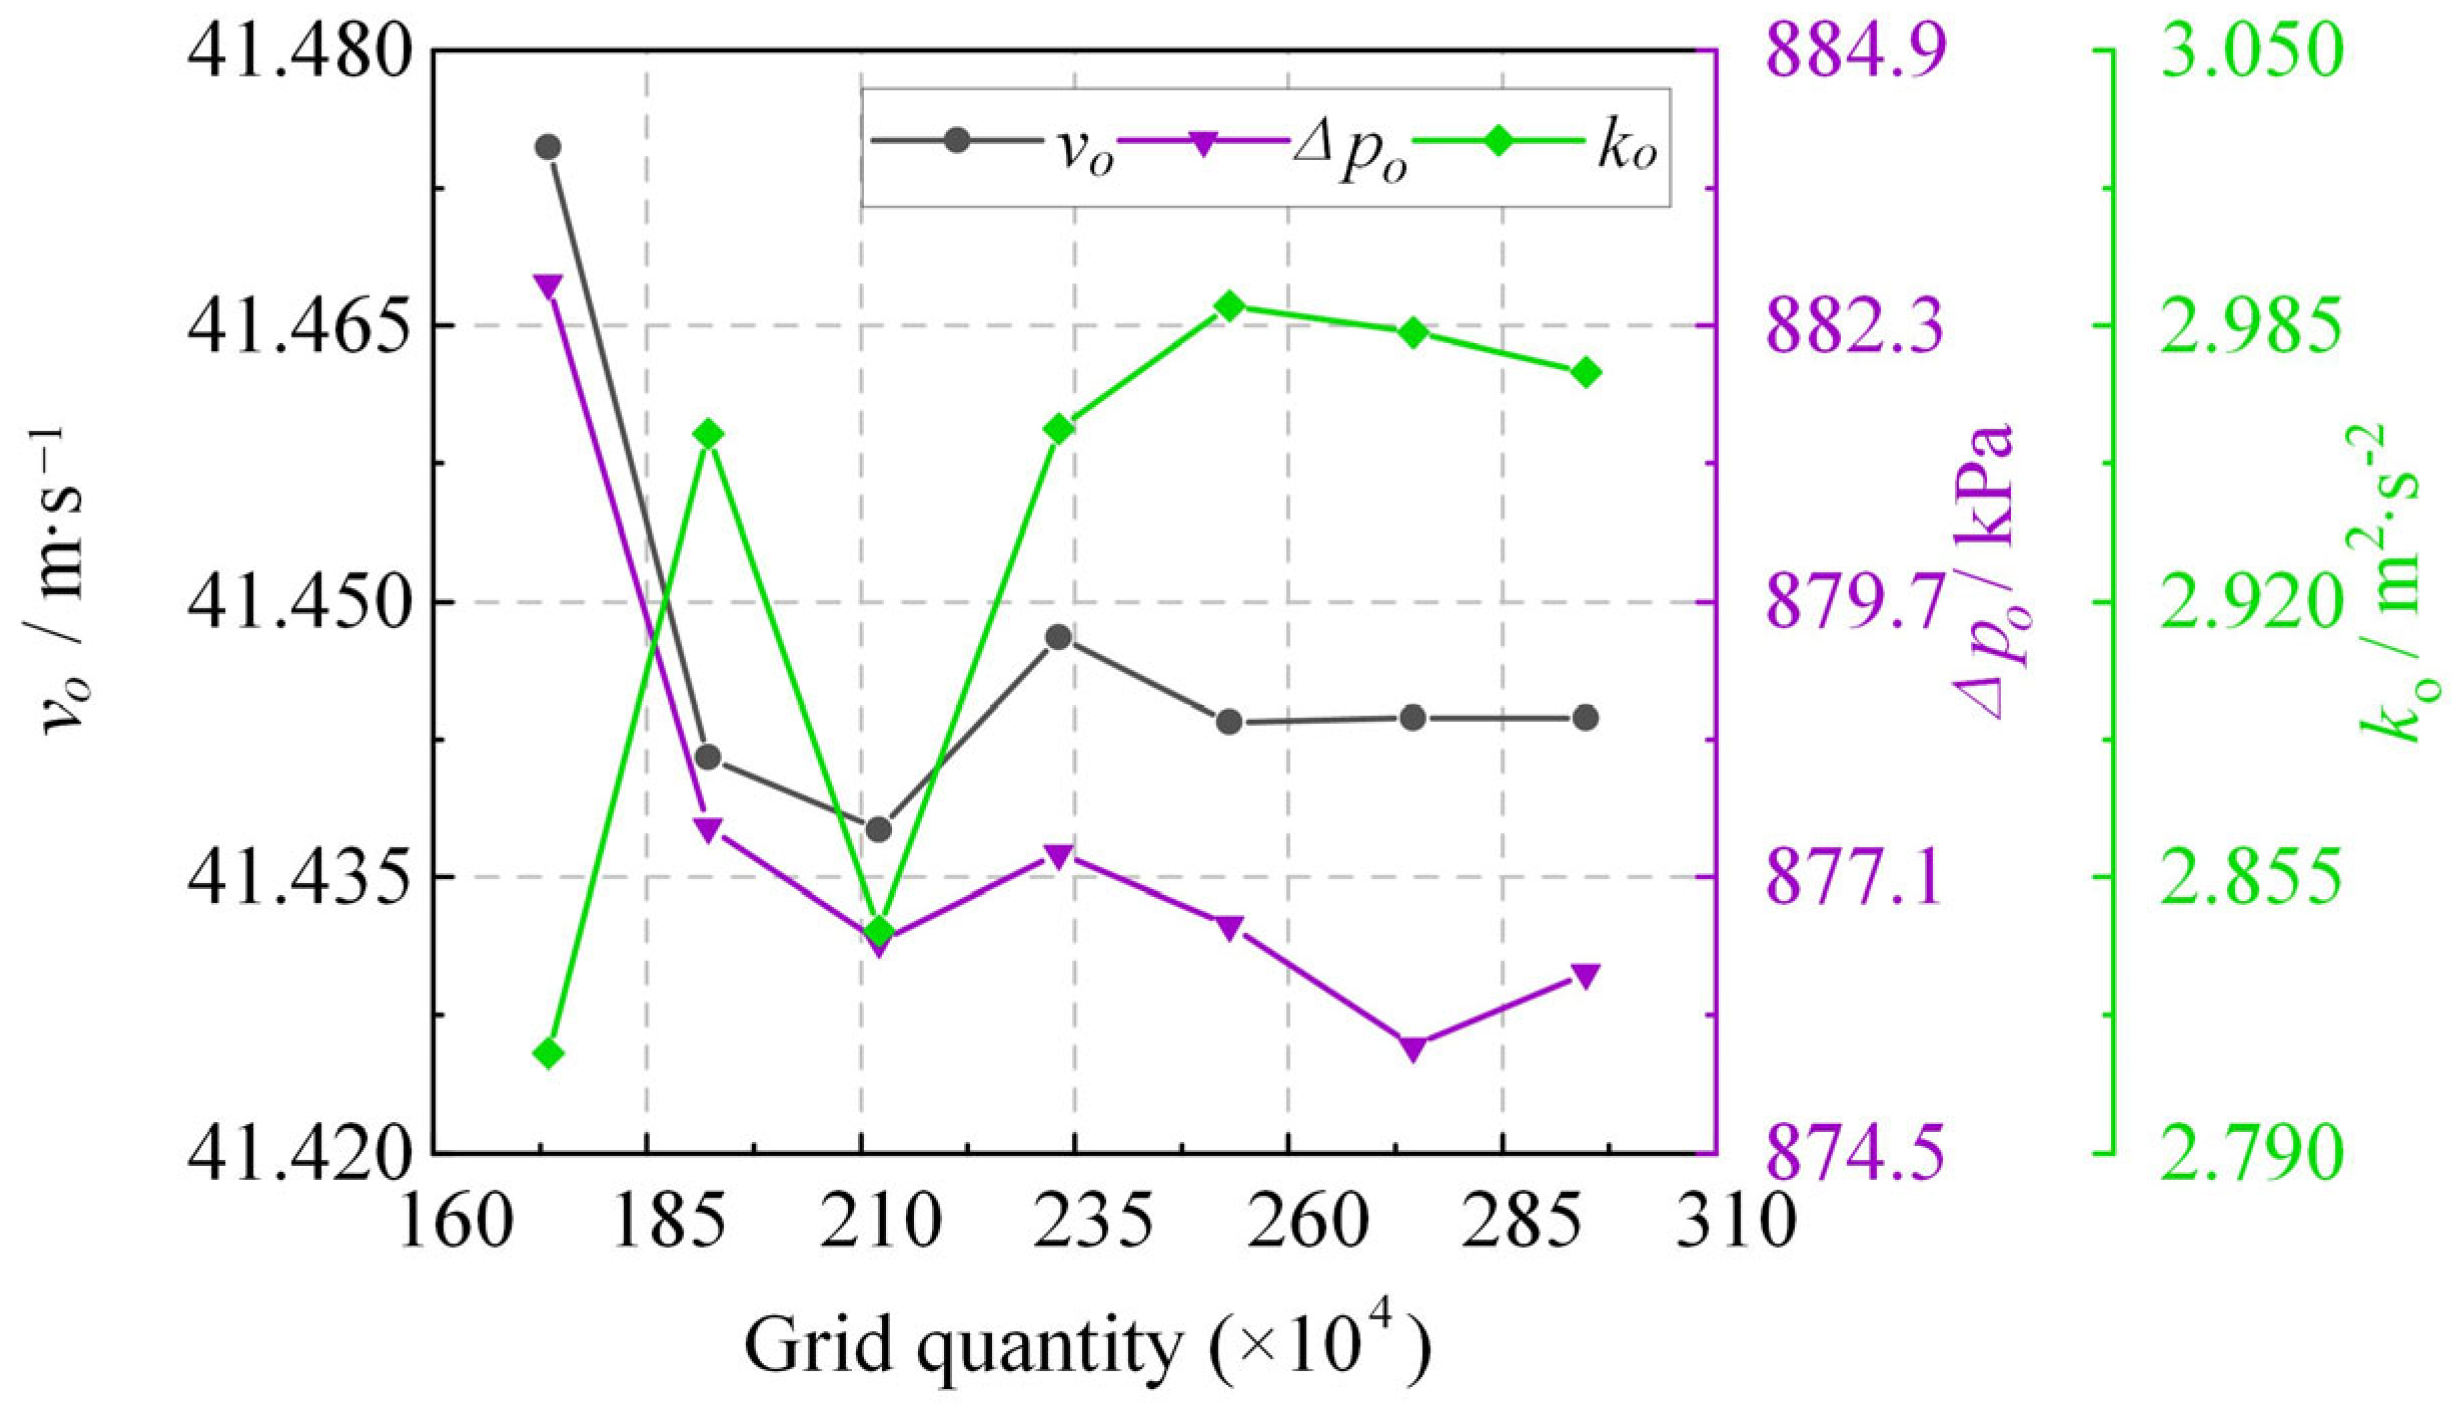
2.2. Numerical Simulation Methods

The study of the fire monitor jet and part of the IFF flow involves the two-phase flow of air and water, so it is necessary to use the VOF model under a fixed Eulerian mesh to track the air–water interface, and the VOF transport equations are as follows:
γ t + ( u · ) γ = 0
where γ is the fractional function, γ = 0 indicates that the flow field does not contain air, γ = 1 indicates that there is only air in the flow field, 0 < γ < 1 indicates that the flow field contains both air and water phases, and there is a gas–liquid interface in the grid.
The VOF model solves a single momentum equation over the entire solution domain, and the velocity field of the solution is shared by two phases, air and water, with the following mass and momentum equations:
ρ ¯ t + ( ρ ¯ u ) = 0
t ( ρ ¯ u ) + ( ρ ¯ u u ) = p + [ μ ¯ ( u + u T ) ] + ρ ¯ g + F s
where g is the gravitational acceleration, m/s2; p is the pressure, Pa; ρ ¯ is the equivalent density, kg/m3; μ ¯ is the equivalent viscosity, Pa·s. F s is the interfacial force at the gas–liquid interface generated by the interfacial tension, N/m3.
ρ ¯ and μ ¯ are denoted as follows:
ρ ¯ = γ ρ a + ( 1 γ ) ρ w
μ ¯ = γ μ a + ( 1 γ ) μ w
where ρ a is the density of air, kg/m3, μ a is the viscosity of air, Pa·s; and μ w is the viscosity of water, Pa·s.
F S is denoted as the following:
F S = σ f κ n
where σf denotes the two-phase interfacial tension, N/m; κ denotes the interfacial curvature, m−1; and n denotes the unit vector perpendicular to the two-phase interface.
The internal water flow field of the TPJFM head is extracted as the computational domain. The head’s water inlet is selected as the computational domain’s inlet, and the nozzle outlet is the outlet. All other surfaces of the computational domain are considered wall surfaces. The polyhexcore mesh division method is used, with local densification applied to regions such as the nozzle outer wall, powder nozzle, and supporting blade fillets. The grid division of the IFF of the TPJFM head is shown in Figure 2.
In Fluent 2020R2, boundary conditions are set as follows: velocity inlet at 12.8 m/s, pressure outlet at atmospheric pressure, and wall surfaces set as no-slip walls. A pressure-based steady-state calculation model is used, with the realizable k-epsilon model and enhanced wall functions. The VOF model is employed, setting air and water as the two phases. Convergence residuals for each variable are set at 1 × 10⁻⁵, and iterations stop when all parameters converge below the set residual values.
The standard turbulent kinetic energy k and its dissipation rate ε are obtained by the following transport equation:
t ( ρ k ) + x i ( ρ k u i ) = x j [ ( μ + μ t σ k ) k x j ] + G k + G b ρ ε Y M + S k
t ( ρ ε ) + x i ( ρ ε u i ) = x j [ ( μ + μ t σ ε ) ε x j ] + C 1 ε ε k ( G k + C 3 ε G b ) C 2 ε ρ ε 2 k + S ε
where Gk represents the turbulent kinetic energy generation term generated by the average velocity gradient, Gb is the turbulent kinetic energy generation term caused by buoyancy, YM represents the contribution of pulsation expansion to the total dissipation rate in compressible turbulence, and C1ε, C2ε, and C3ε are constants. σk and σε are the turbulent Prandtl numbers of k and ε, respectively. Sk and Sε are user-defined source entries.
The turbulent (or eddy) viscosity, μt, is calculated by combining k and ε as follows:
μ t = C μ ρ k 2 ε
where Cμ is a constant. C1ε = 1.44, C2ε = 1.92 and Cμ = 0.09, σk = 1.0 and σε = 1.3. These default values are experimentally determined and apply to fundamental turbulent flows including common shear flows such as boundary layers, mixed layers, and jets, as well as attenuated isotropic grid turbulence.
Ensuring the mesh quality, calculations were performed for seven different mesh quantities ranging from 1.7 to 3 million. The average TKE at the nozzle outlet (ko), the PD between the inlet and outlet of the IFF (Δpo), and the average velocity at the nozzle outlet (vo) were selected as indicators to evaluate mesh quality. The results, shown in Figure 3, indicate that when the mesh quantity reached 2.53 million, ko changed by less than 0.3%, Δpo changed by less than 0.2%, and vo changed by less than 5 × 10⁻⁶. With increasing mesh quantity, changes in these indicators were negligible, indicating that a mesh quantity of 2.53 million met the requirements for mesh independence. Therefore, a mesh model with a quantity of 2.53 million was used.

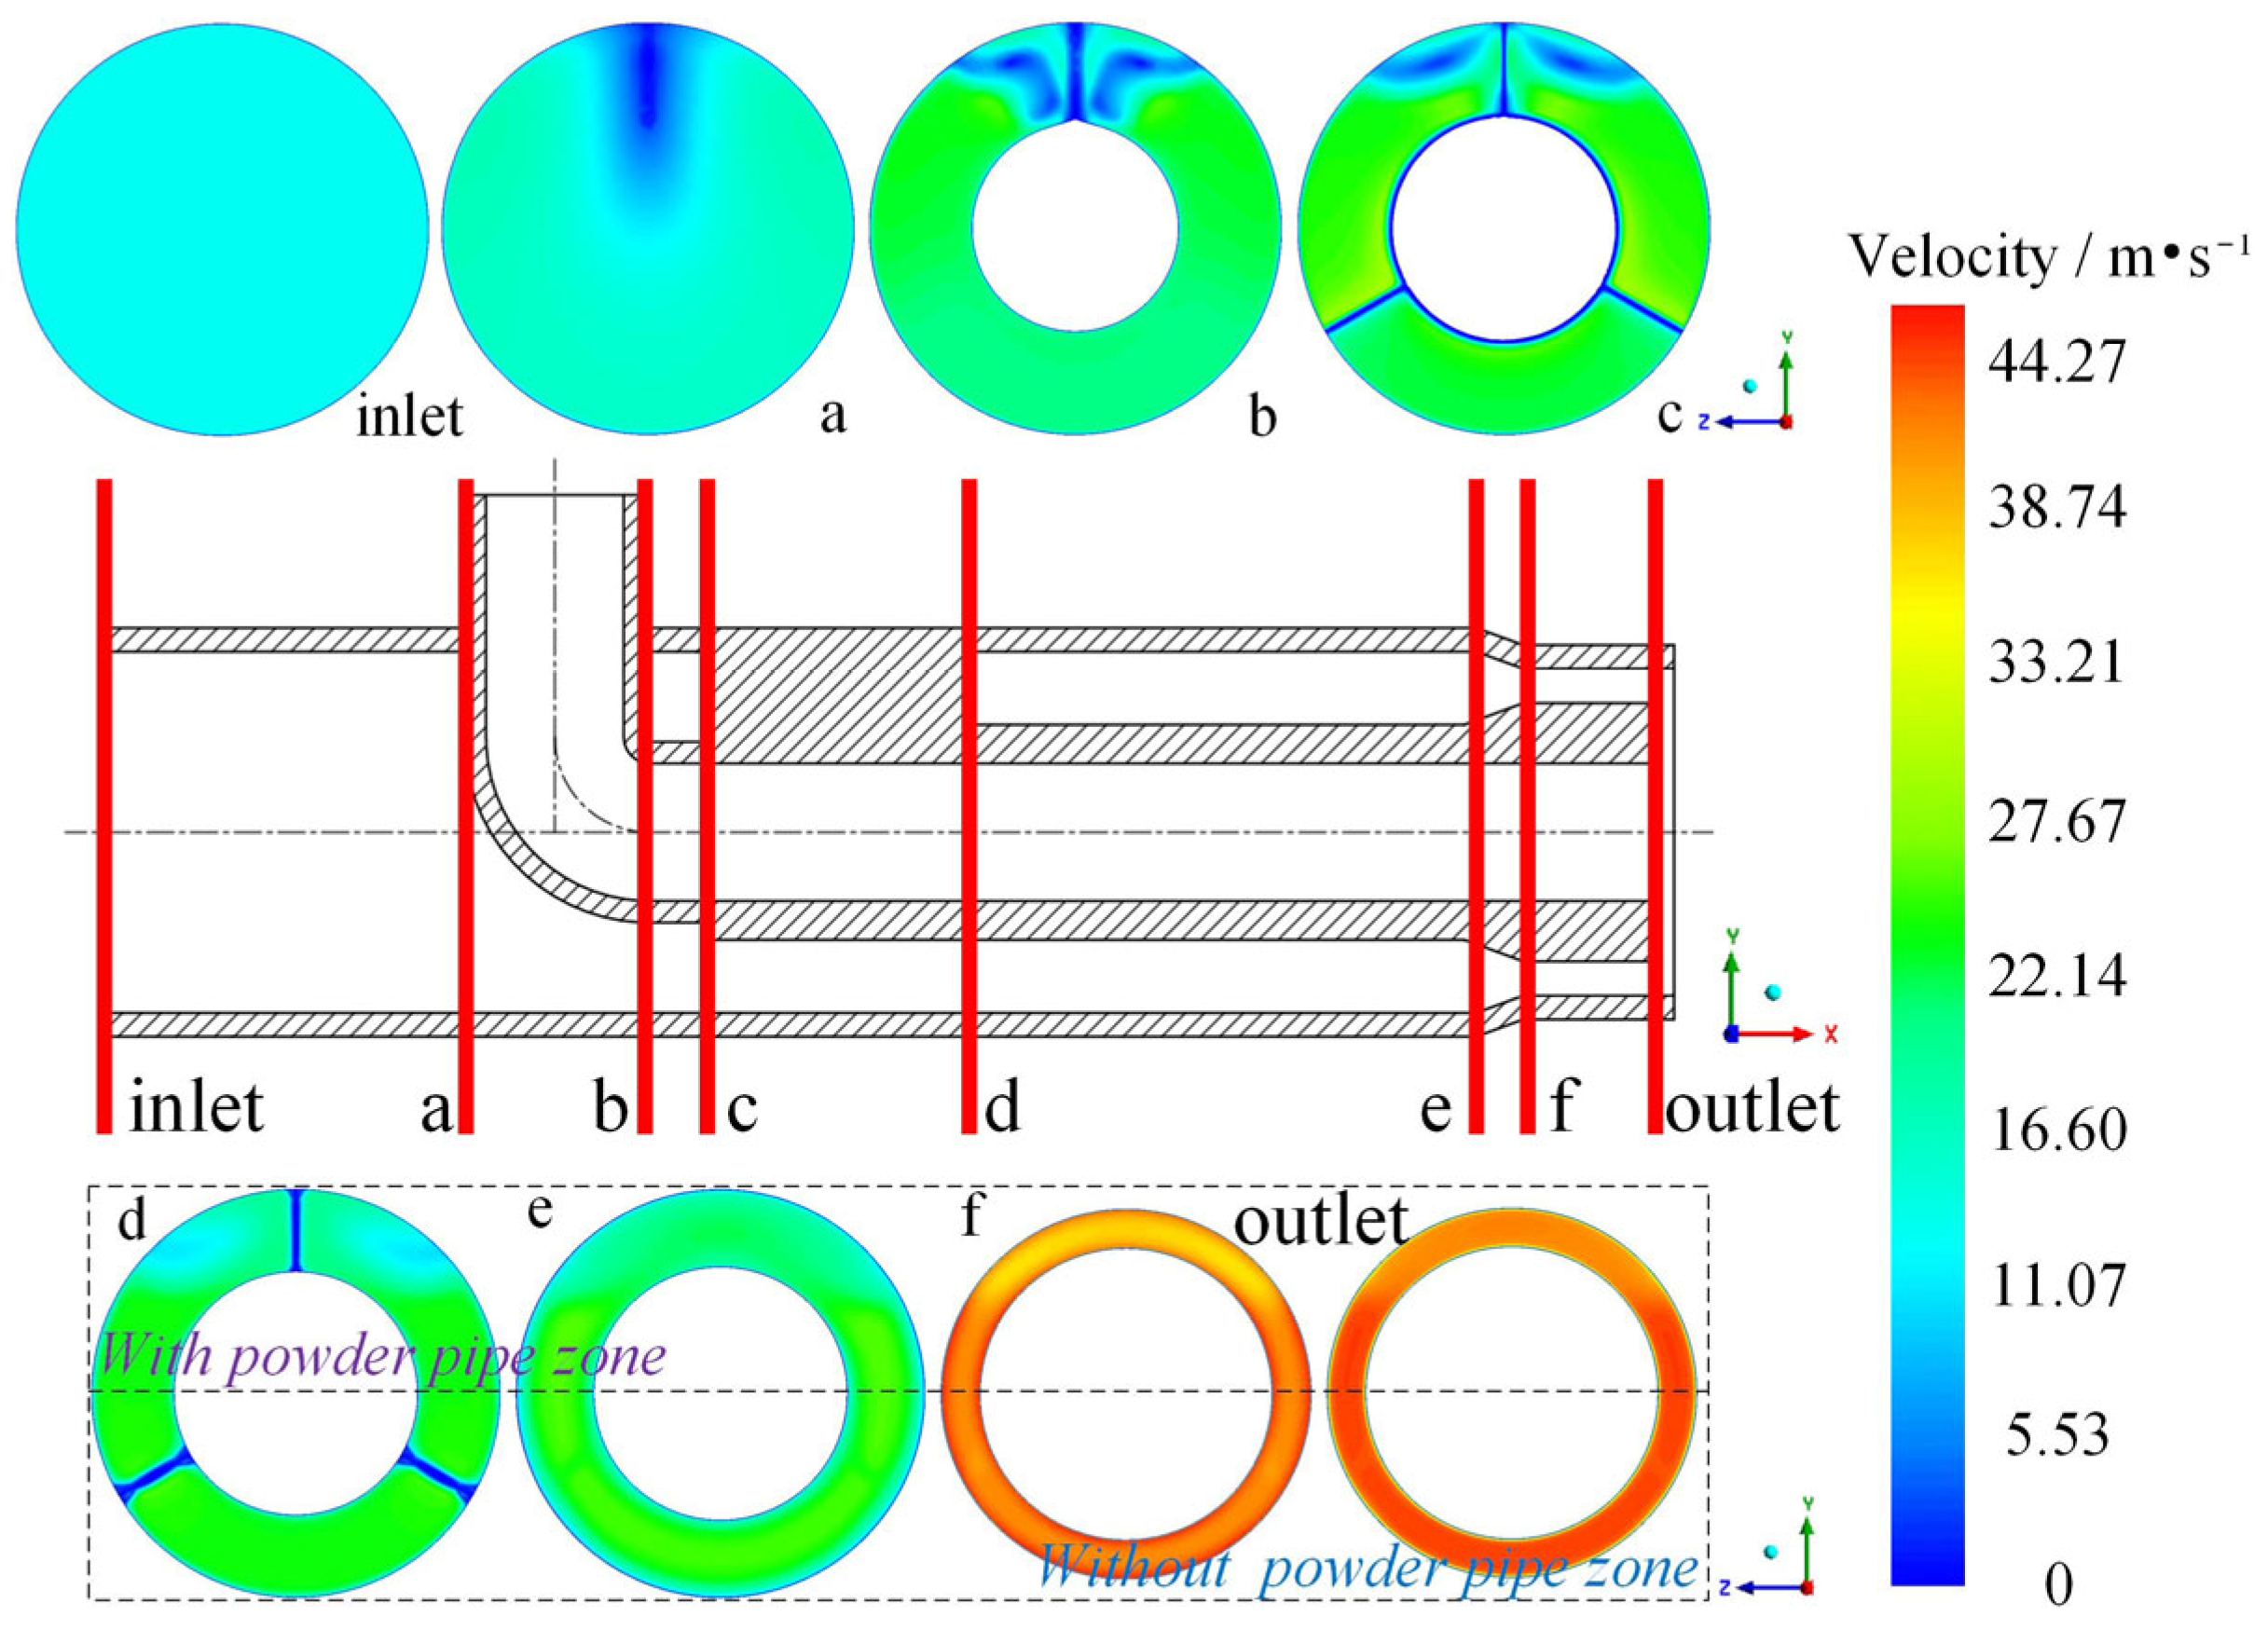
2.3. Analysis of Characteristics of the IFF of TPJFM Head

As shown in Figure 4, numerical simulation data were extracted from multiple cross-sections perpendicular to the axis of the fire monitor head. In section a, the obstruction caused by the bend in the powder pipe leads to an uneven velocity distribution, with lower velocities near the bend and the wall. In section b, the fluid is affected by the blunt body flow around the powder pipe, resulting in vortices on both sides of the upper section negatively impacting the axial flow. Section c, being close to the powder-pipe bend, still experiences significant uneven velocity distribution and local energy loss due to the blunt body flow. Section d shows an improvement in velocity distribution uniformity compared to section c. Section e further improves in velocity distribution uniformity, although it exhibits lower velocities at the top and higher velocities at the bottom. The velocity distribution at the outlet is consistent with section f but higher than at section f.
To further study the IFF characteristics of the TPJFM head, velocity vector diagrams and TKE of the IFF at planes Z = 0 mm, Z = 10 mm, Z = 20 mm, and Z = 30 mm are shown in Figure 5a. Before the water flows through the powder-pipe bend, the velocity distribution is uniform and flows along the axial direction of the head. As the water approaches the powder-pipe bend, its flow direction changes due to the obstruction. At the Z = 0 mm section, the water flow direction shifts from the axial direction to a downward flow along the outer wall of the powder pipe. When the water flows through the area between the powder pipe bend and the supporting blades, the flow becomes more turbulent. At the Z = 10 mm section, recirculation occurs, with local flow directions opposing the main flow. At the Z = 30 mm section, further from the powder-pipe bend, turbulence is less pronounced than at the Z = 10 mm and Z = 20 mm sections, but the upper flow speed near the nozzle outlet remains lower than the lower flow speed.
As shown by the TKE distribution in Figure 5b, turbulence is minimal before the water flows through the powder-pipe bend. Due to the disturbance from the powder-pipe bend, high TKE regions appear from the upper supporting blade to the powder pipe near the nozzle outlet. As the water flows through the connection between the powder pipe and the supporting blade, the flow direction changes and collides with the axial flow, increasing TKE in this small area with minimal impact on subsequent flow. The contraction of the nozzle outer wall and the expansion of the powder pipe increase local resistance and TKE at the nozzle’s straight section entrance. The peak TKE at sections Z = 0 mm, Z = 10 mm, and Z = 20 mm is located near the powder-pipe bend to the upper supporting blade area. The Z = 30 mm section, further from the powder-pipe bend, shows the peak TKE shifted towards the nozzle outlet, located at the middle of the upper supporting blade.
The velocity distribution uniformity index γa is selected to measure the velocity distribution uniformity of the flow field section. γa is calculated by Equation (10) as follows.
γ a = i = 1 n [ ( | v i v a ¯ | ) A i ] 2 | v a ¯ | i = 1 n A i
where A i is the area of the i th grid in the cross-section, v i is the value of the parameter v in the i th grid, m/s, and v a ¯ is the average value of the parameter v in the cross-section.
The uniformity index γa for each section is shown in Figure 6. The velocity distribution uniformity is highest at the inlet. Sections a and b show a sharp decrease in velocity distribution uniformity due to the powder-pipe bend, with section c having the worst uniformity (γa = 0.8912). Sections d, e, and f show progressively improved uniformity, with section f having a uniformity index of 0.9792. The uniformity at the outlet slightly decreases to 0.9736 due to the nozzle’s straight section, a 0.6% reduction. However, the average velocity at the outlet is 41.44 m/s, 0.8% higher than the 41.10 m/s at section f, indicating that the increase in velocity leads to a slight decrease in uniformity at the outlet.

3. Results and Discussion

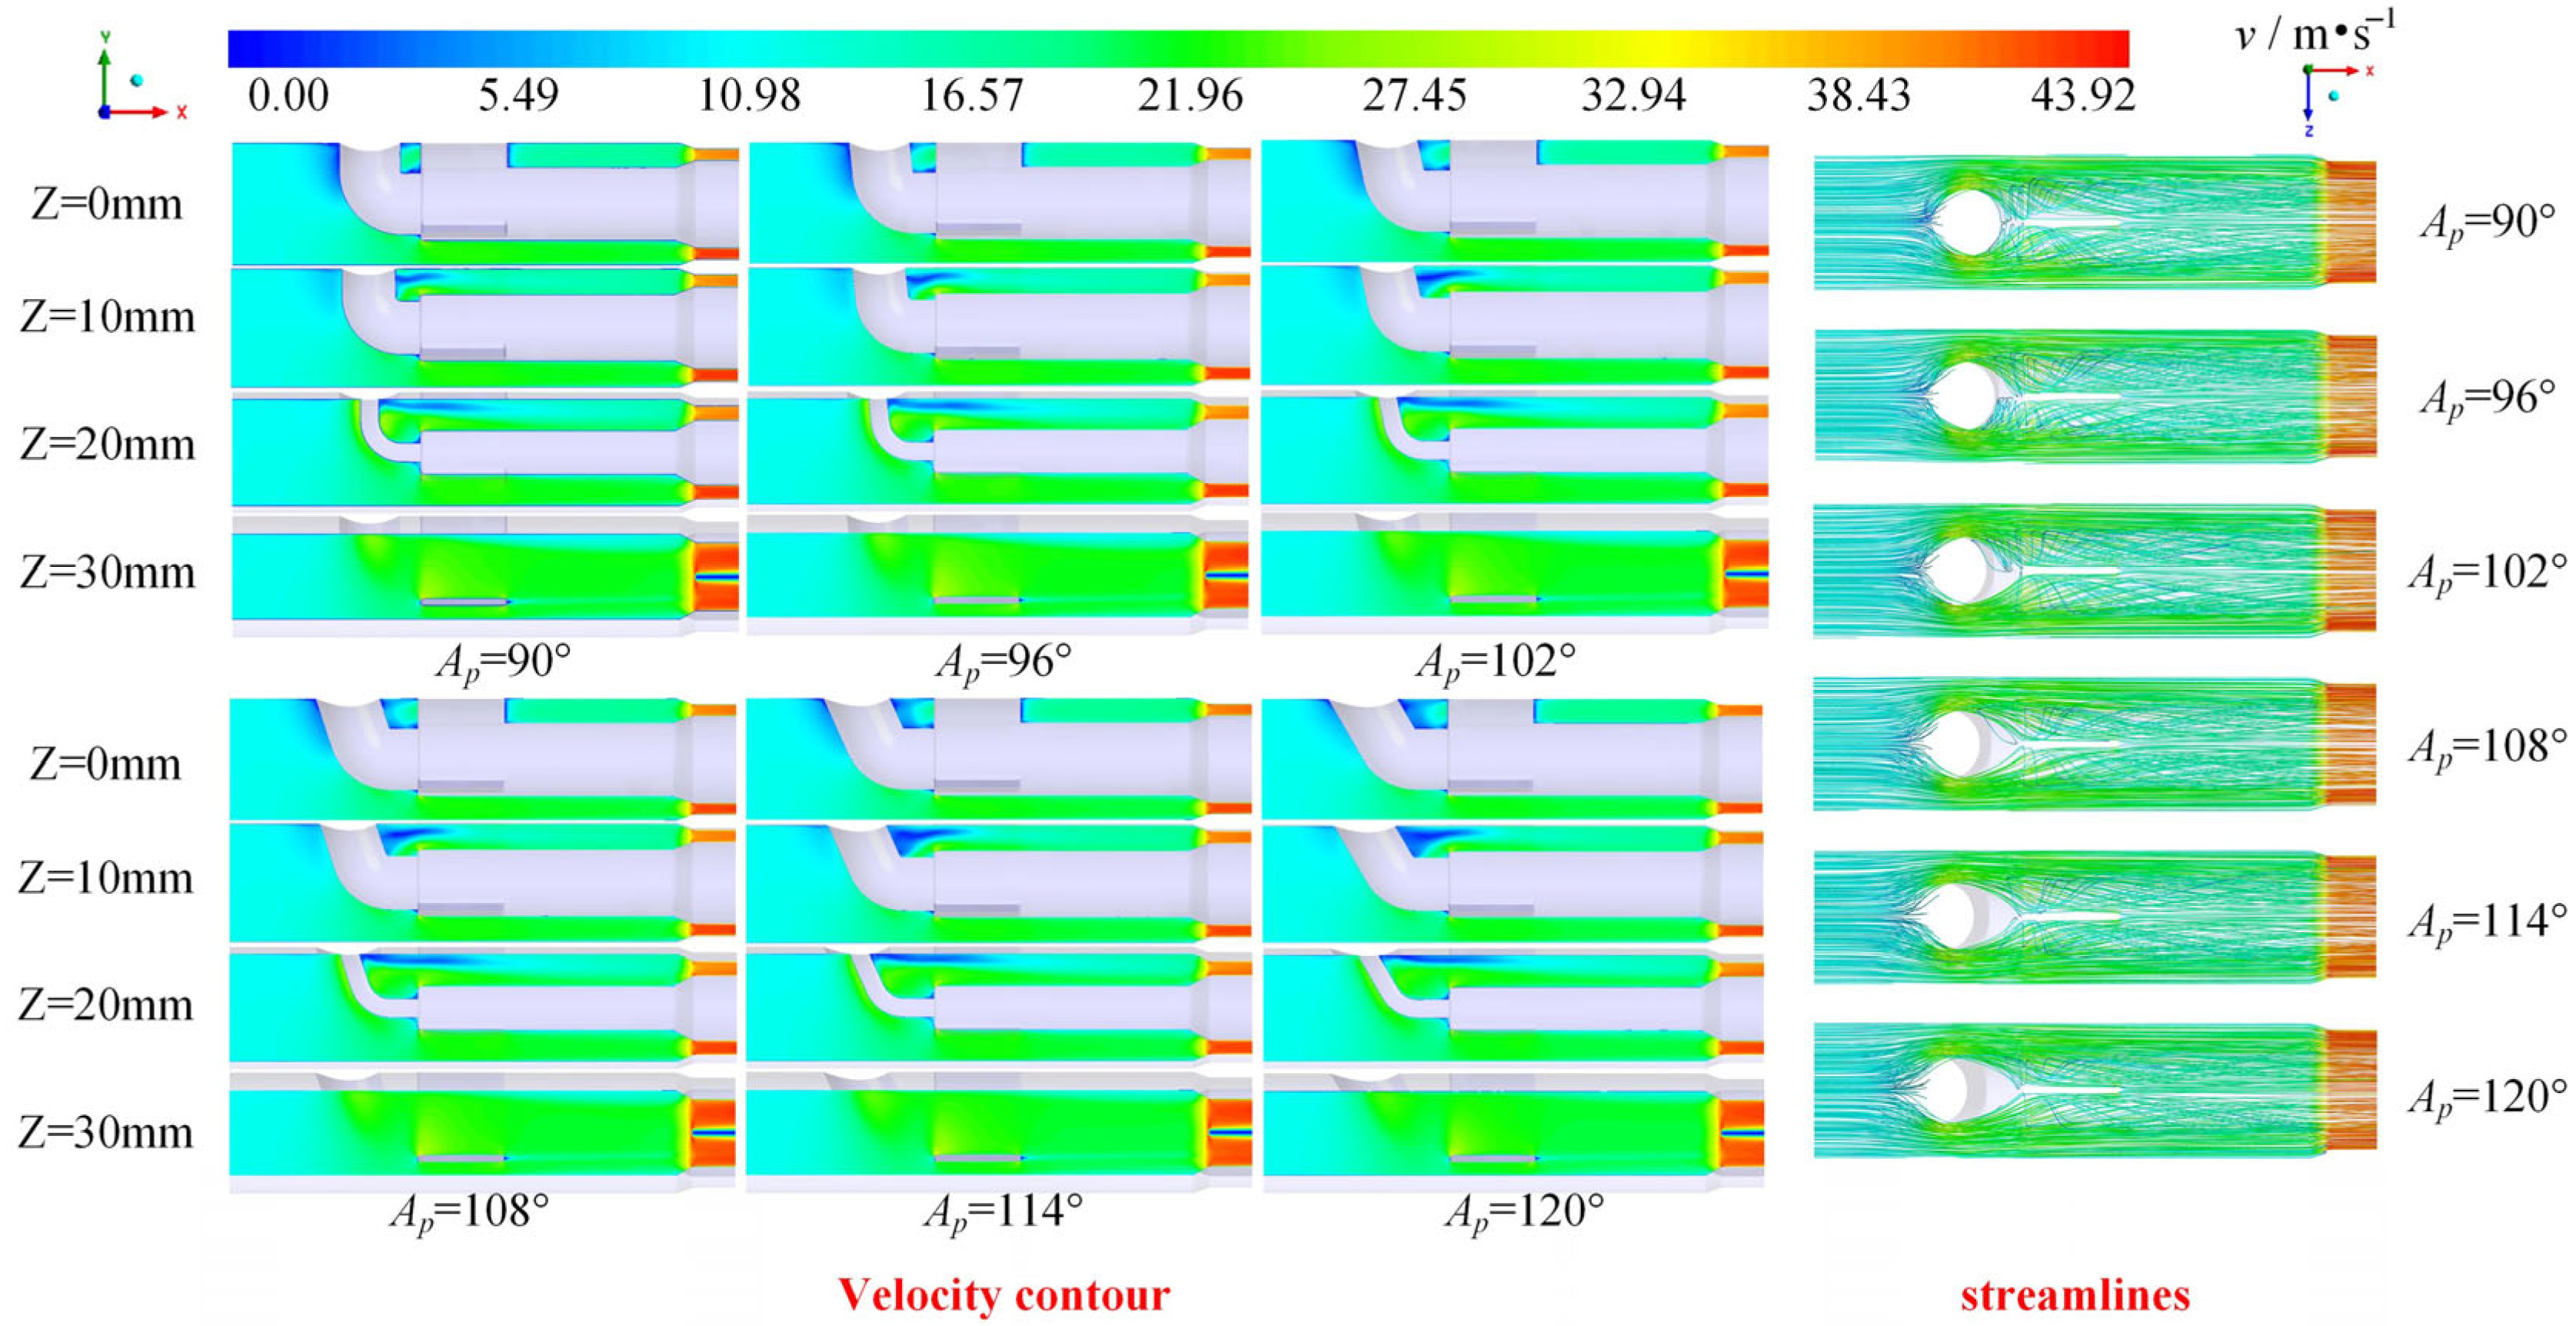
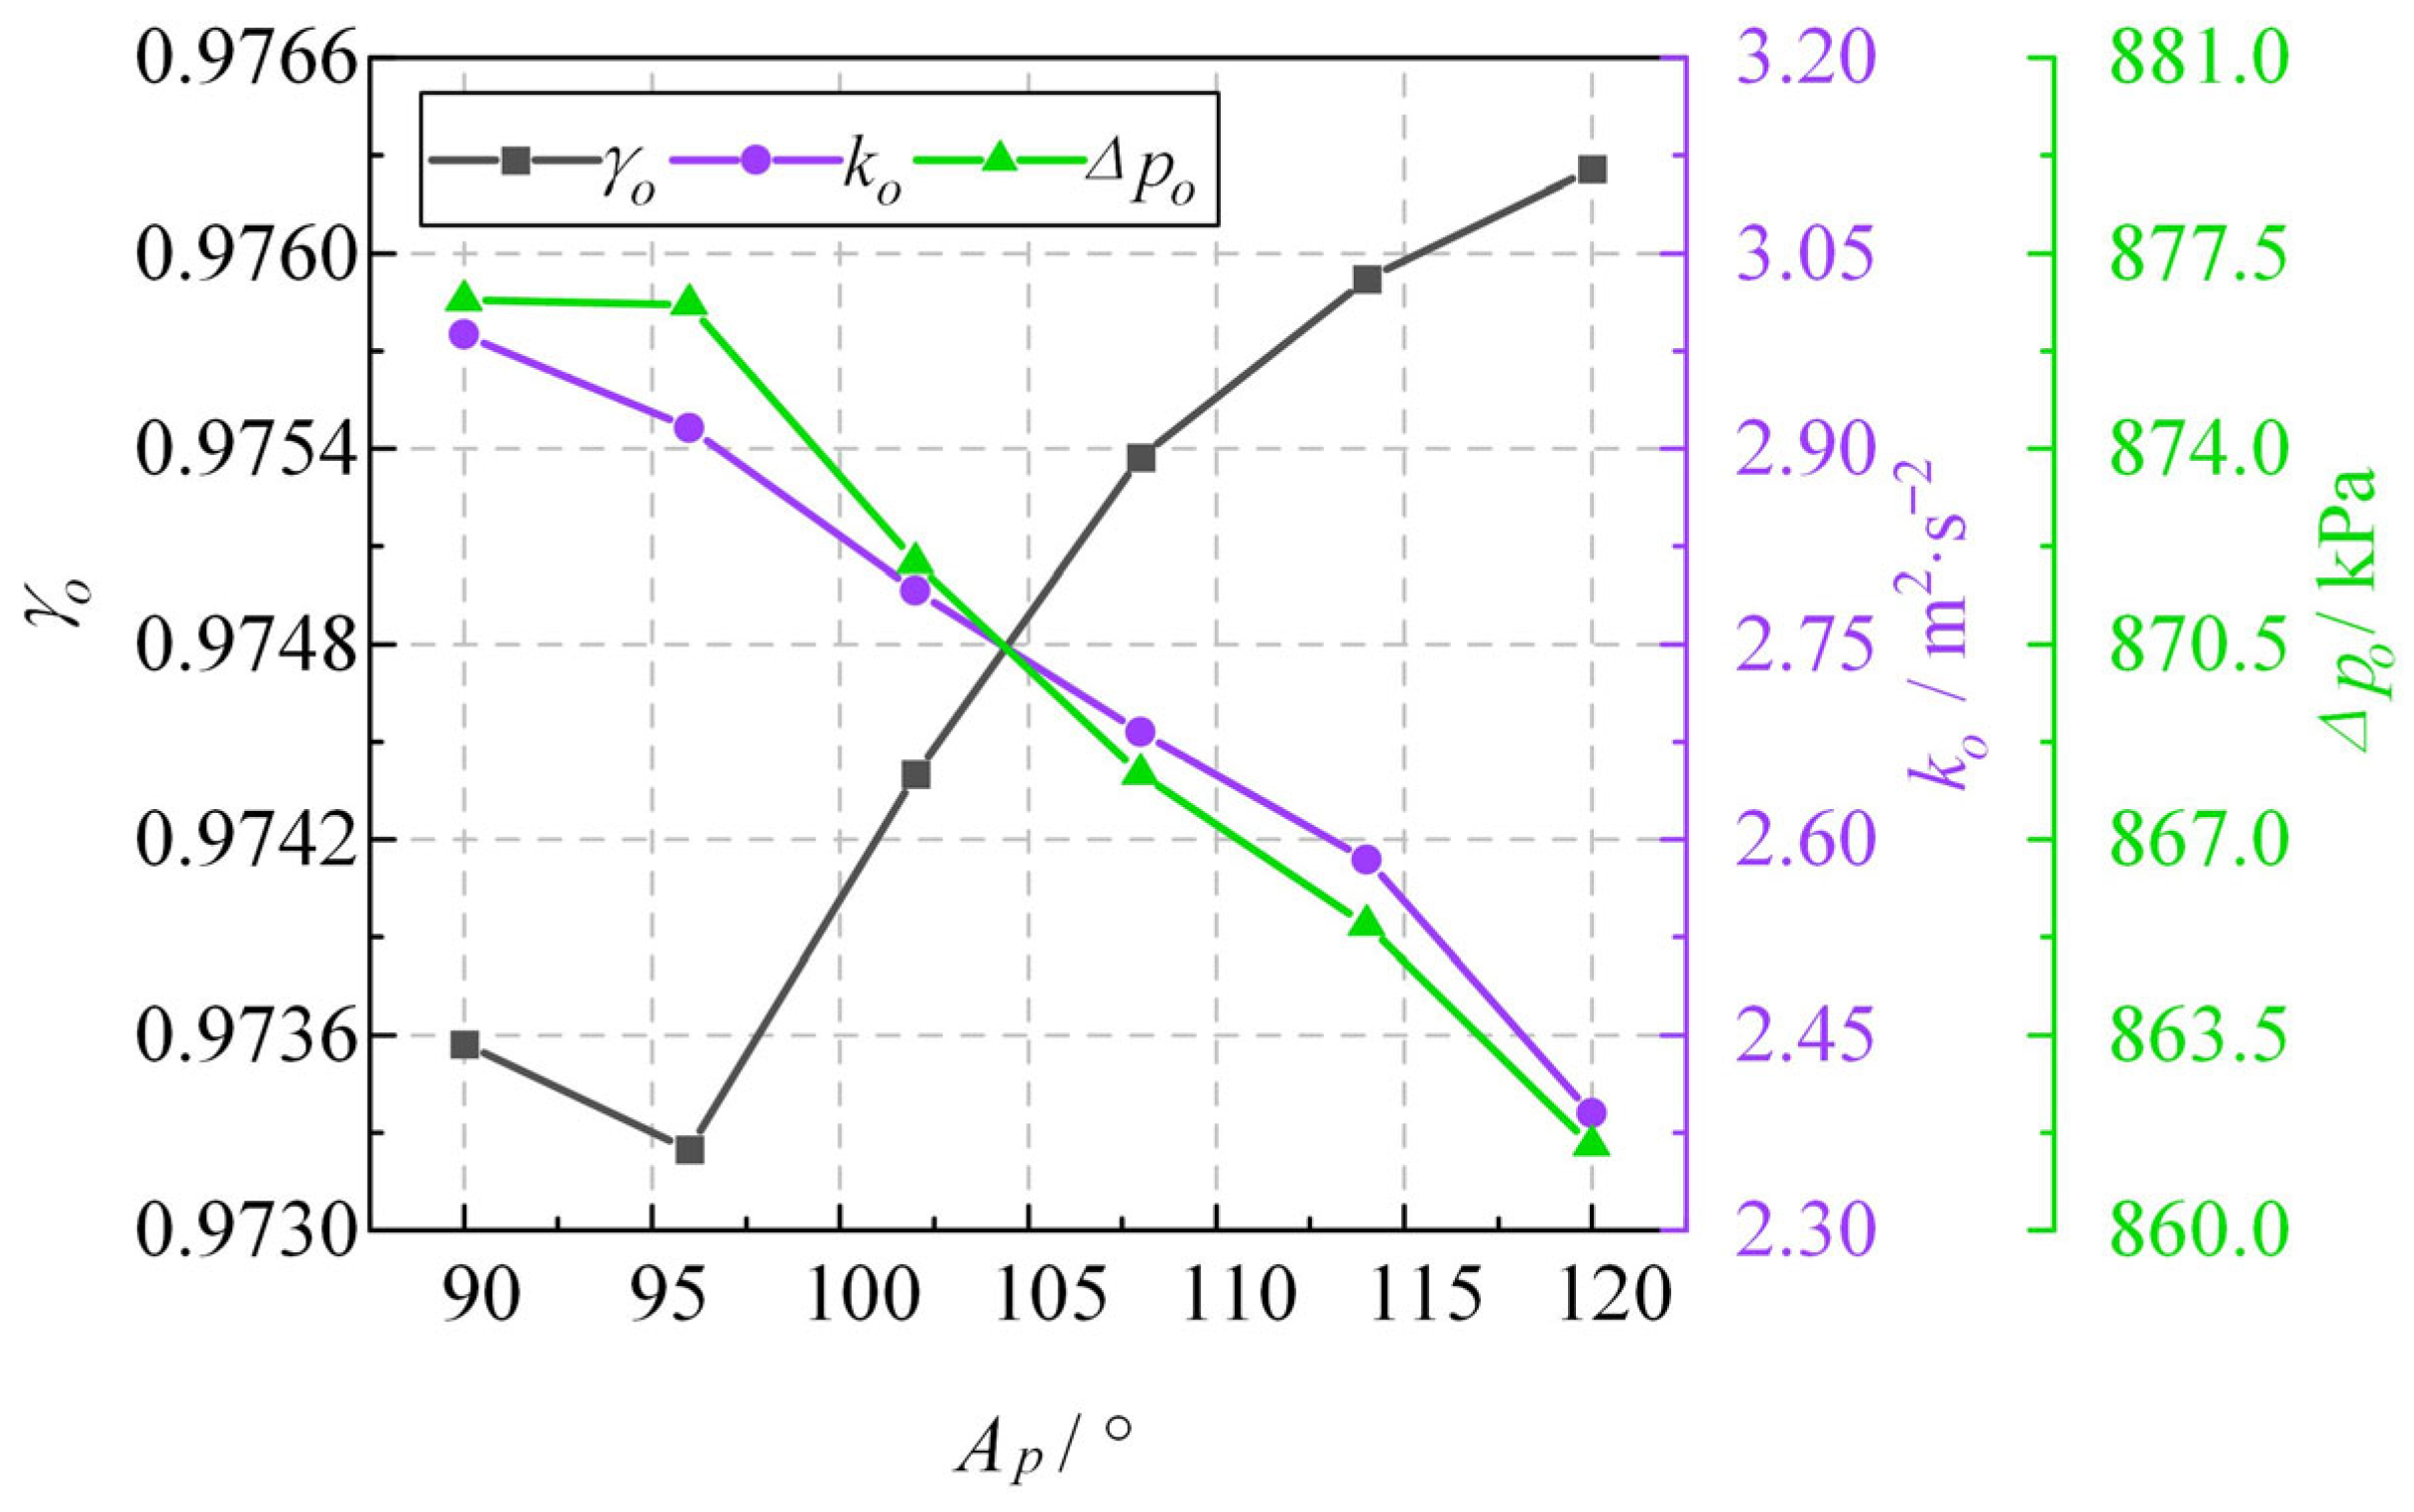
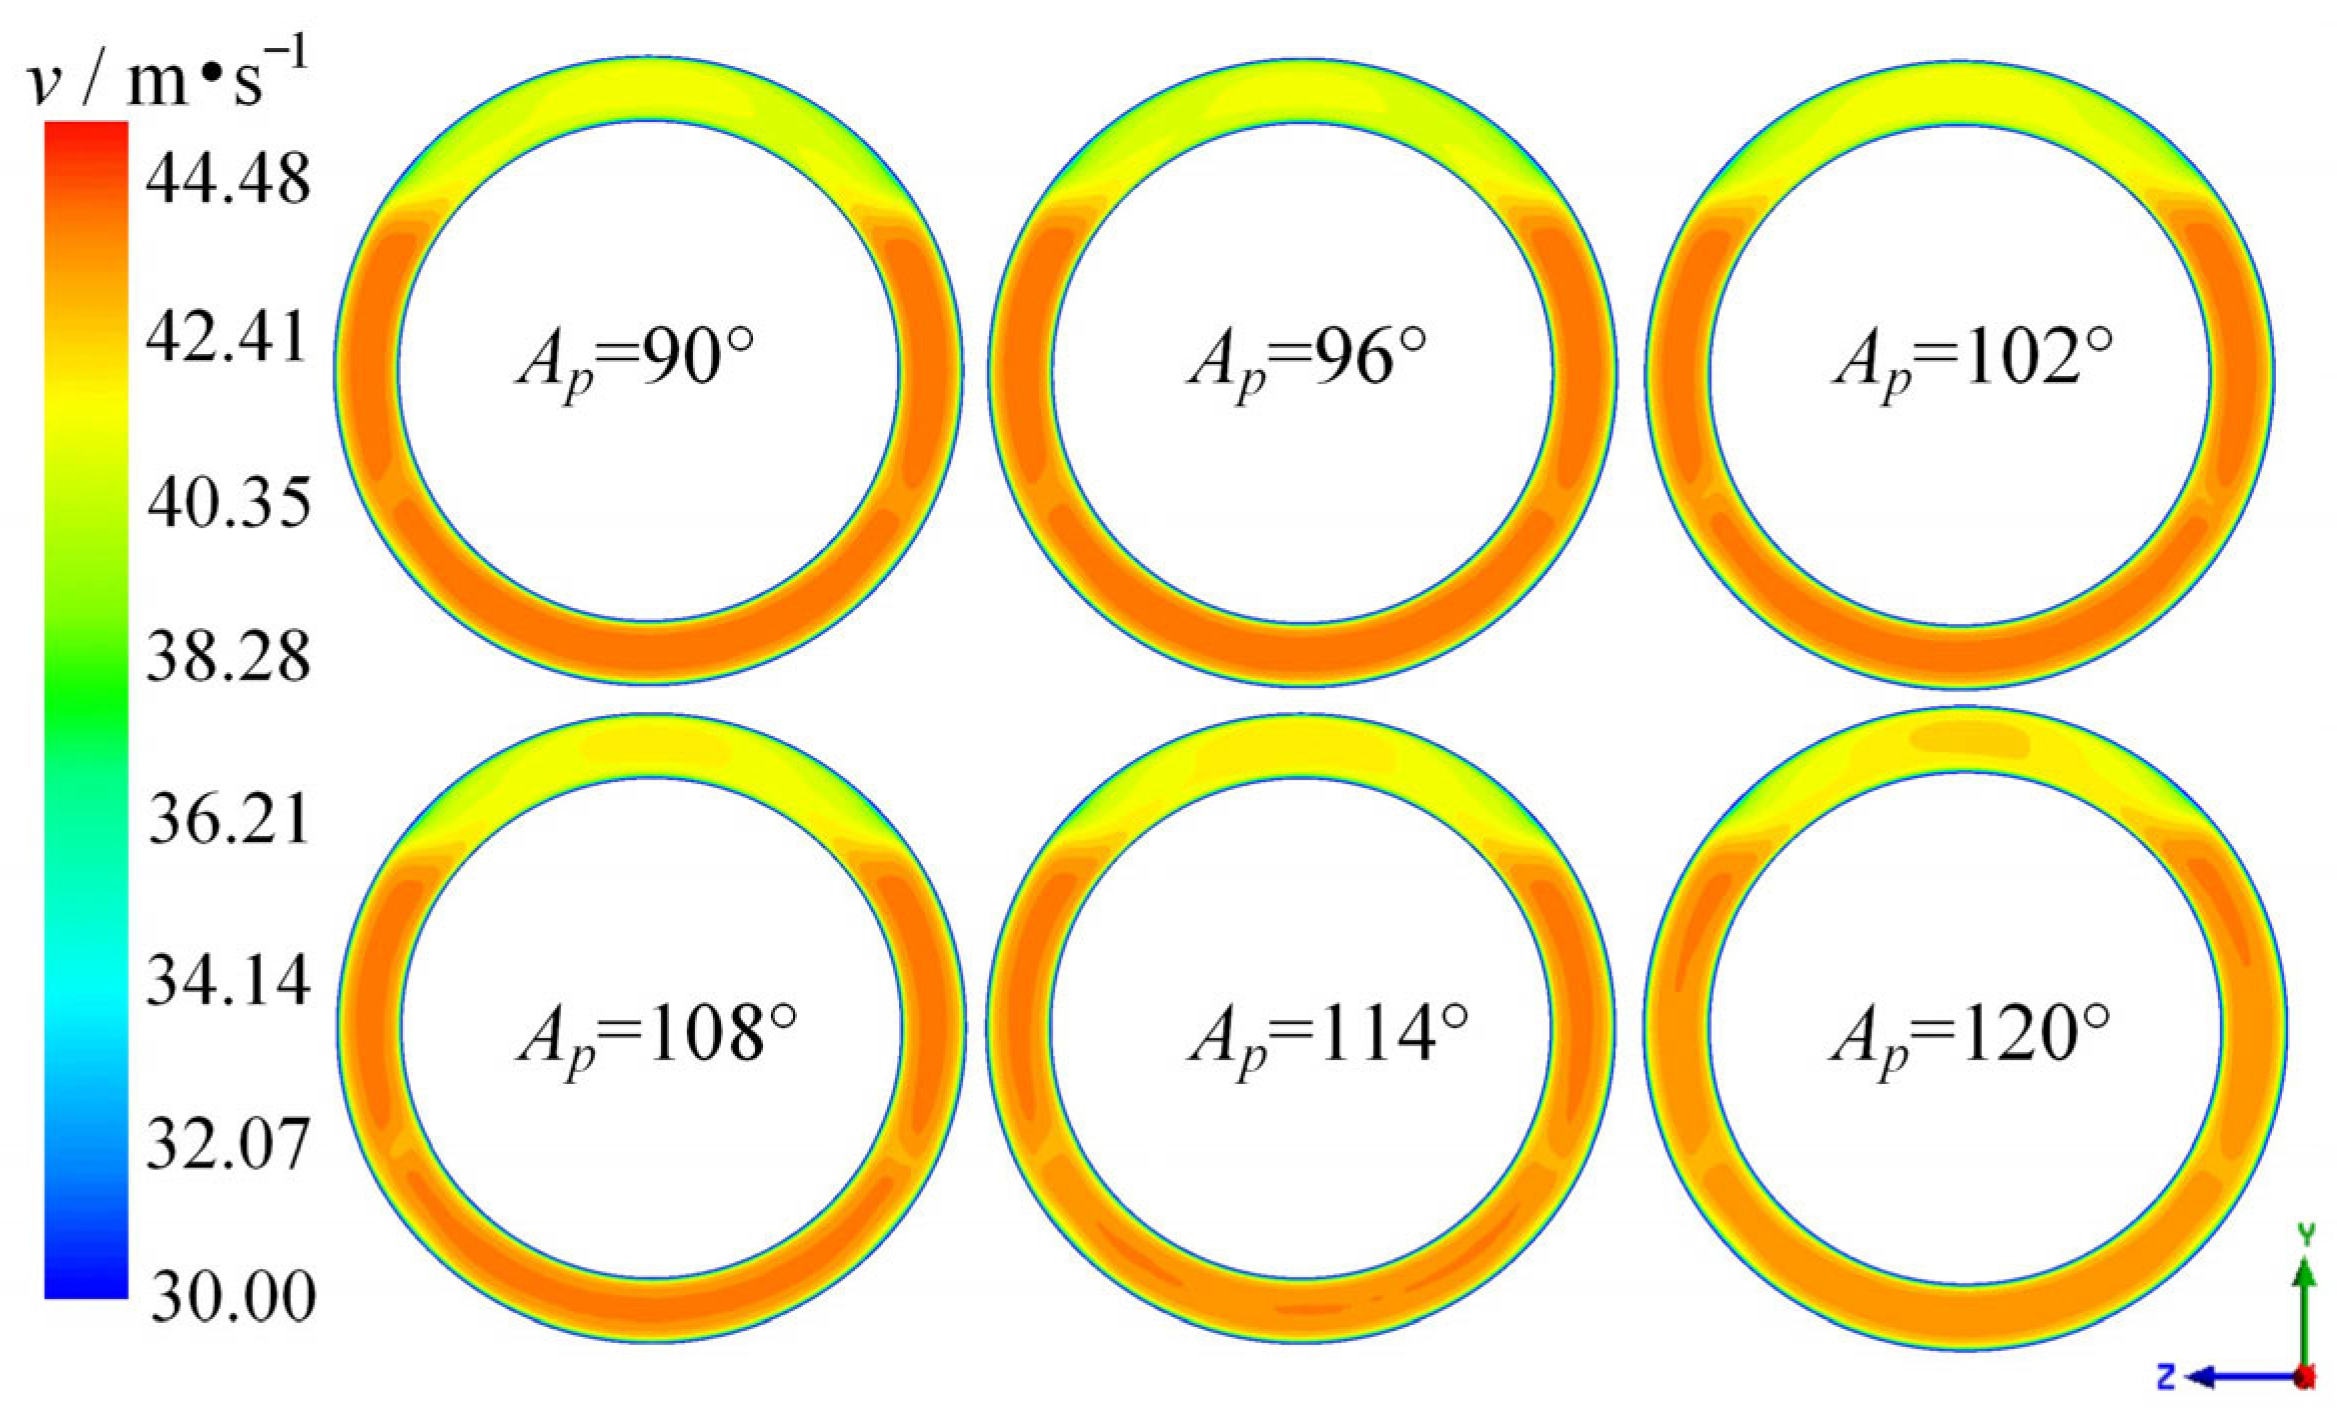
3.1. Analysis of the Influence of the Powder-Pipe Bending Angle on the TPJFM IFF

We conducted numerical simulations on the IFF of the TPJFM head for six groups within the Ap range of 90° to 120°, keeping other parameters unchanged. The water flow rate through the monitor head was 70 L/s. Cross-sectional data at Z = 0 mm, Z = 10 mm, Z = 20 mm, and Z = 30 mm were extracted to analyze the impact of Ap on the IFF of the monitor head.
As shown in the velocity and streamlines contour maps in Figure 7, with the increase in Ap, the cross-section of the powder pipe along the XZ plane changes from a circular shape to an ellipse with the major axis along the flow direction of the monitor head. This accelerates the flow velocity near the inlet side of the powder-pipe bend. The increase in Ap also reduces the width of the wake region behind the powder-pipe bend, decreasing the disturbance effect on the IFF. After the water flows through the powder-pipe bend, the curvature of the streamlines decreases, and the flow loss along the bend side of the monitor head is reduced. As Ap increases, the velocity difference between the upper and lower sides of the monitor nozzle decreases, improving the velocity distribution uniformity in the IFF of the monitor head.
The TKE contour maps in Figure 8 show that at Ap = 90°, the sections at Z = 0 mm, Z = 10 mm, and Z = 20 mm have higher TKE near the inlet edge from the powder-pipe bend to the supporting blades, extending to the nozzle outlet, resulting in an average TKE of 2.99 m2/s2 at the nozzle outlet. As Ap increases, the flow space between the powder-pipe bend and the supporting blades changes, resulting in significant differences in the flow state and TKE distribution. Apart from this area, the TKE distribution in other sections remains similar to that of the Ap = 90° model. With the increase in Ap, the peak TKE in the IFF of the monitor head gradually decreases, and the area of high TKE significantly reduces. At the Z = 30 mm section, the high TKE near the upper supporting blade is significantly lower for the Ap = 120° model compared to the Ap = 90° model. The results indicate that increasing Ap from 90° to 120° significantly reduces the peak TKE in the IFF and at the nozzle outlet.
The parameters at the nozzle outlet and the PD across the IFF of the monitor head directly impact the jet performance of the fire monitor. More uniform velocity distribution, lower TKE, and lower PD across the IFF enhance the fire monitor’s jet coherence and stability, improving its range. The outlet flow parameters for different Ap are shown in Figure 9. As the powder-pipe bend angle Ap increases from 90° to 120°, the velocity uniformity index γo at the nozzle outlet increases from 0.973 to 0.976, the ko at the nozzle outlet decreases from 2.99 m2/s2 to 2.39 m2/s2, and the Δpo across the IFF decreases from 876.65 kPa to 861.53 kPa. At Ap = 120°, the velocity distribution at the nozzle outlet is the most uniform, and the TKE is the lowest. Additionally, the increase in Ap reduces local resistance within the monitor head. As Ap increases, the flow velocity difference between the upper and lower parts is reduced and uniformity is increased. The PD is reduced because the water flow is subjected to less resistance when passing through the inclined powder tube. The degree of turbulence in a vertical pipeline is larger than that in an inclined pipeline, and the TKE is also larger.
As shown in the velocity distribution at the outlet in Figure 10, with the increase in Ap, the velocity at the upper part of the nozzle outlet gradually increases, and the overall velocity distribution becomes more uniform. At Ap = 90°, there is a significant velocity difference between the upper and lower parts of the nozzle outlet. Calculating the average velocity along the straight line through the XY plane of the nozzle outlet cross-section shows that at Ap = 90°, the average upper velocity is 38.72 m/s, and the average lower velocity is 39.97 m/s, with a difference of 1.25 m/s. At Ap = 120°, the velocity difference between the upper and lower regions decreases significantly, with the upper velocity averaging 39.37 m/s and the lower velocity averaging 39.58 m/s, a difference of 0.21 m/s. The velocity difference reduces by 83.2%, significantly improving the uniformity of the velocity distribution at the nozzle outlet.
As Ap increases from 90° to 120°, the cross-section of the powder pipe along the XZ plane changes from circular to elliptical, accelerating the flow velocity near the inlet side of the powder-pipe bend and reducing the width of the wake region. The average TKE at the nozzle outlet decreases by 20%, and the Δpo across the IFF decreases from 876.65 kPa to 861.53 kPa, a reduction of 1.73%. Thus, within a certain range, increasing Ap can effectively reduce flow losses. Although the increase in Ap results in a small increase in the uniformity index γo of the nozzle, the velocity difference between the upper and lower parts of the IFF decreases from 1.25 m/s to 0.21 m/s, an 83.2% reduction, significantly improving the uniformity of the velocity distribution in the IFF.

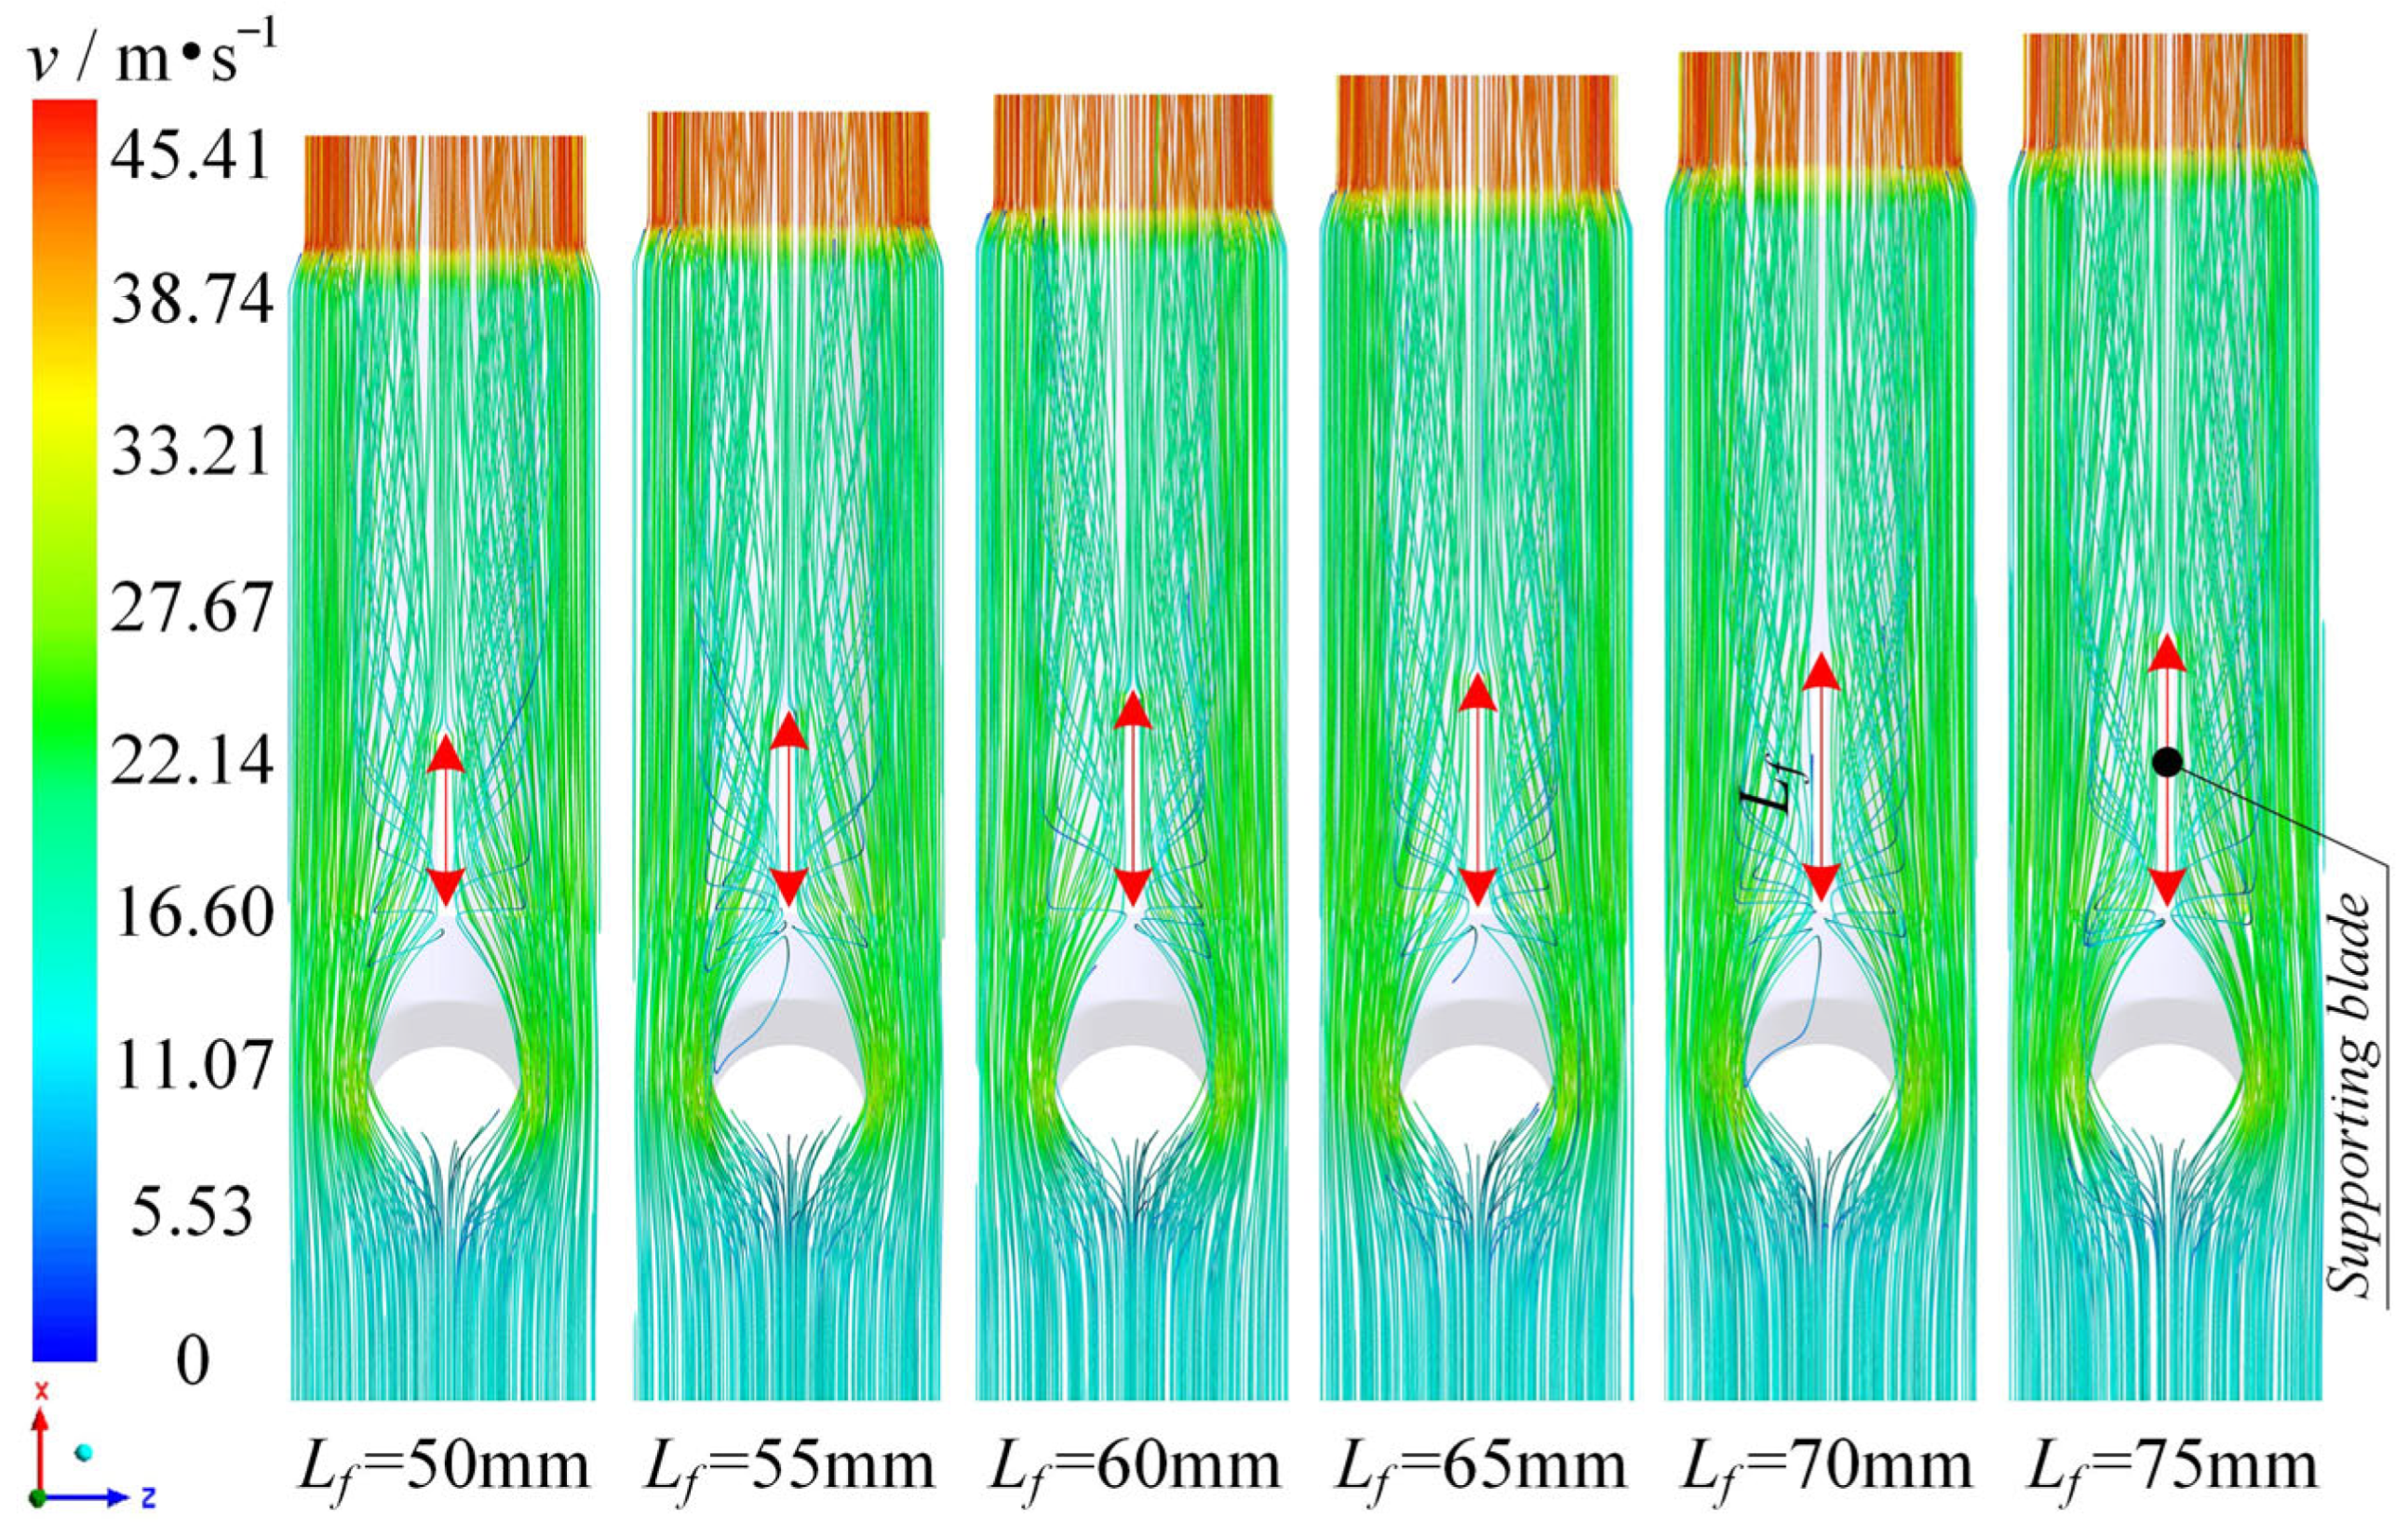
3.2. Analysis of the Influence of Supporting Blade Length on the Flow Field inside the TPJFM Head

Numerical simulations on the IFF of the TPJFM head were conducted for six groups with Lf as the design variable, keeping other parameters at their initial values. The range of Lf is from 50 mm to 75 mm. The impact of Lf on the IFF characteristics of the monitor head was analyzed.
The streamlines on the side of the monitor head with the powder-pipe bend are shown in Figure 11. The results indicate that the supporting blades are aligned with the main flow direction and have rounded edges, minimizing flow obstruction. Increasing the supporting blade length from 50 mm to 75 mm has a minimal impact on the axial flow within the monitor head.
Cross-section d is located near the nozzle outlet edge by the supporting blades, where changes in Lf directly affect the velocity distribution and average TKE. This section serves as the entry to the annular water jet nozzle, with transverse velocity (perpendicular to the monitor head axis) directly affecting the flow smoothness into the nozzle. Therefore, the transverse velocity distribution contour map at cross-section d is shown in Figure 12. As Lf increases from 50 mm to 75 mm, both the X and Y direction velocity components near the upper supporting blade at cross-section d decrease significantly. The increased distance from cross-section d to the powder-pipe bend allows further flow rectification, converting more radial and tangential velocities into axial velocity. As the flow direction along the non-powder-pipe bend side is along the monitor head axis, the transverse velocity components before reaching the supporting blade near the nozzle outlet are minimal. The peak transverse velocity near the supporting blades at the without powder-pipe zone side is due to the water reconverging after passing the supporting blades. Hence, with increasing Lf, the transverse velocity components near the supporting blades in the without powder-pipe zone remain unchanged.
The line charts of average TKE and average axial velocity at cross-section d for different Lf are shown in Figure 13. At cross-section d, the main flow direction is along the monitor head axis, and high transverse velocity regions are small. The transverse velocity is much lower than the axial velocity. Thus, although the transverse velocity decreases with increasing Lf, the impact on the average axial velocity in this section is minimal. The average axial velocity at cross-section d fluctuates slightly, being lowest at 19.79 m/s for Lf = 50 mm and highest at 19.81 m/s for Lf = 65 mm. However, the reduction in local transverse velocity at cross-section d with increasing Lf leads to a significant decrease in average TKE, from 3.817 m2/s2 at Lf = 50 mm to 2.964 m2/s2 at Lf = 75 mm.
As shown in Figure 14, with Lf increasing from 50 mm to 75 mm, the velocity uniformity index γo at the nozzle outlet fluctuates slightly. The maximum γo = 0.97626 occurs at Lf = 60 mm, and the minimum γo = 0.97617 occurs at Lf = 75 mm, with negligible variation. Changing the supporting blade length does not significantly improve the velocity distribution uniformity at the nozzle outlet. With increasing Lf, the ko at the nozzle outlet decreases from 2.51 m2/s2 to 2.28 m2/s2. The increased supporting blade length reduces the local turbulence caused by the powder-pipe bend, lowering the transverse velocity components before the nozzle inlet, providing the smoothest inflow at Lf = 75 mm, and minimizing TKE at the nozzle outlet. As Lf increases, the Δpo across the IFF shows a fluctuating upward trend, peaking at 864.19 kPa for Lf = 70 mm and dropping to a minimum of 861.32 kPa for Lf = 50 mm. Overall, increasing Lf tends to increase the PD across the monitor head, with local fluctuations.
Increasing the Lf causes the area after the flow has passed through the powder tube to be completely divided into different areas by the support blade. Due to the disturbance of the powder pipe, the kinetic energy of the water flow at the powder pipe is not the same, and the subsequent kinetic energy exchange is not possible, resulting in the decline in uniformity at the outlet.
In summary, increasing Lf does not significantly improve the velocity distribution uniformity at the nozzle outlet, and the PD across the monitor head varies slightly. However, the significant reduction in X and Y direction velocity components at cross-section d lowers the average TKE from 3.817 m2/s2 to 2.964 m2/s2, a 22.37% reduction, indicating a notable decrease in local TKE. Extending the supporting blades within the limited space can reduce local pressure losses to some extent.

3.3. Analysis of the Influence of the Distance between the Supporting Blade and the Bending Section of the Powder Nozzle on the Flow Field inside the TPJFM Head

A numerical simulation of the IFF of a TPJFM head was conducted by varying Lpf = 25~75 mm, while keeping other parameters at their initial values. The impact of Lpf on the IFF was analyzed.
According to Figure 15, at the Z = 0 mm cross-section, as Lpf increases, the water flow near the edge of the upper supporting blades shifts from a direction perpendicular to the nozzle axis to one along the nozzle axis, reducing the radial and tangential velocity components. At the Z = 10 mm cross-section, a vortex forms between the bent section of the powder injection pipe and the upper supporting blades. As Lpf increases, the vortex area remains largely unchanged, but the vortex core moves towards the nozzle inlet, smoothing the flow around the upper supporting blades. At the Z = 20 mm cross-section, the influence of the powder injection pipe persists, and vortices are visible. With increasing Lpf, the upper vortex zone shifts from a smaller flow area near the upper supporting blades to a larger flow area, increasing the proportion of flow along the nozzle axis and reducing radial and tangential velocity components. At the Z = 30 mm cross-section, the distance from the nozzle’s bent section reduces the impact on flow, and the flow speed distribution and streamlines remain largely unchanged with varying Lpf.
From the TKE cloud diagram at the Z = 0 mm cross-section in Figure 16, it is observed that with increasing Lpf, the area of the high TKE region from the bending section of the powder pipe to the upper supporting blade increases gradually, but the peak TKE value in the region decreases significantly. At the Z = 10 mm cross-section, as Lpf increases, the high TKE region gradually moves from the upper supporting blade to the bending section of the powder pipe, and the TKE intensity decreases. At the Z = 20 mm cross-section, the high TKE region shifts similarly, and the peak TKE decreases. When Lpf = 25 mm, the local TKE near the nozzle outlet edge of the upper supporting blade reaches 13 m2/s2, while at Lpf = 75 mm, the local TKE at the same position decreases to 7 m2/s2, a reduction of 46%. At the Z = 30 mm cross-section, the structural influence of the powder-pipe bending section is minimal, and the overall TKE intensity is significantly lower than that in the Z = 0 mm, Z = 10 mm, and Z = 20 mm planes. Near the upper and lower blades and the straight section wall of the nozzle at the Z = 20 mm plane, local TKE is higher. With increasing Lpf, the TKE near the upper blade at this cross-section gradually decreases.
The flow field parameters of cross-section c and d are shown in Figure 17. According to Figure 17a, as Lpf increases, the mean velocity vc of cross-section c decreases gradually from 20.41 m/s to 19.35 m/s, while the mean velocity vd of cross-section d fluctuates slightly, with a change of only 0.07 m/s. According to Figure 17b, despite the minor changes in mean flow velocity, the mean TKE of both cross-sections decreases significantly. Specifically, the mean TKE kc of cross-section c decreases linearly from 4.99 m2/s2 to 3.95 m2/s2, a reduction of 21%, and the mean TKE kd of cross-section d decreases from 3.40 m2/s2 to 1.78 m2/s2, a reduction of 48%. This indicates that increasing Lpf significantly improves the TKE within the flow channel, resulting in smoother flow, even though the change in flow velocity in the latter part of the nozzle is minimal.
The TKE distributions for cross-section c, cross-section d, and the nozzle outlet are shown in Figure 18. Regardless of the Lpf value, the TKE distribution patterns for these sections remain consistent. The TKE is higher near the supporting blade of cross-section c and is less affected by changes in Lpf. As Lpf increases, both the area of the high TKE region and the peak TKE of cross-sections c and d decrease, leading to smoother incoming flow and a significant reduction in the high TKE region and peak TKE at the upper part of the nozzle outlet. Figure 17 and Figure 18 together demonstrate that increasing Lpf reduces the nozzle inlet TKE substantially, which in turn decreases the nozzle outlet TKE and enhances the performance of the TPJFM jet.
As shown in Figure 19, when Lpf is gradually increased from 25 mm to 75 mm, the γo initially increases and then decreases. Specifically, as Lpf increases from 25 mm to 35 mm, γo increases from 0.9756 to 0.9762. Between 35 mm and 55 mm, γo exhibits minor changes, indicating a more uniform flow velocity distribution. The optimal uniformity (γo = 0.9763) occurs at Lpf = 45 mm. Beyond this point, γo decreases, reaching 0.9756 at 75 mm. With increasing Lpf, the ko at the nozzle outlet decreases consistently from 2.41 m2/s2 to 1.88 m2/s2, representing a 22% reduction. The peak TKE within the nozzle and the local pressure loss both decrease. Although the axial size of the internal passage increases, causing higher along-travel resistance, this increase is outweighed by the reduction in local pressure loss. Consequently, the Δpo across the inlet and outlet of the internal flow passage decreases from 866.06 kPa to 858.53 kPa, a reduction of 0.9%.
In summary, the supporting blade can correct the direction of water flow to a certain extent, but it also affects the exchange of kinetic energy inside the water flow to a certain extent, so that the velocity is divided into regions. With the increase in Lpf, the second half of the automatic rectification of the water flow is divided, and the water flow has reached the outlet before it has time to interact with the other part, resulting in a decline in the uniformity of the outlet velocity.
Furthermore, as Lpf increases from 25 mm to 75 mm, the radial and tangential velocity components at the upper support vane decrease. The vortex area remains stable but gradually shifts towards the gun head inlet, and the TKE decreases. The average TKE in cross-sections c and d decreases by 21% and 48%, respectively. The nozzle outlet flow γo peaks at 0.9763 when Lpf is 45 mm. The ko at the nozzle outlet decreases from 2.41 m2/s2 to 1.88 m2/s2, a 22% reduction, and the Δpo decreases by 0.9%. Considering the effects of Lpf on flow velocity distribution uniformity, PD, and average TKE, it is concluded that an Lpf = 65 mm provides the optimal balance of high flow velocity distribution uniformity and low TKE while maintaining a low PD across the gun head flow channel.

4. Conclusions

Numerical simulations were conducted to investigate the effects of varying the main structural parameters of the fire monitor head on the IFF under a water flow rate of 70 L/s. The main findings are as follows:
  • As Ap increases from 90° to 120°, the peak value of TKE in the IFF decreases significantly. The average TKE at the nozzle outlet decreases by 20%, and the PD at the inlet and outlet of the flow passage in the monitor head decreases by 1.73%. This indicates that increasing Ap within a certain range can effectively reduce energy losses. Although the uniformity index γo of the nozzle increases slightly with the increase in Ap, the velocity difference between the upper and lower parts of the IFF decreases by 83.2%, and the velocity difference between the upper and lower sides of the nozzle outlet decreases significantly. The velocity distribution uniformity of the IFF is significantly improved. Increasing the powder-pipe bending angle is beneficial for improving the stability of the nozzle jet under the premise of ensuring the processability of the TPJFM head.
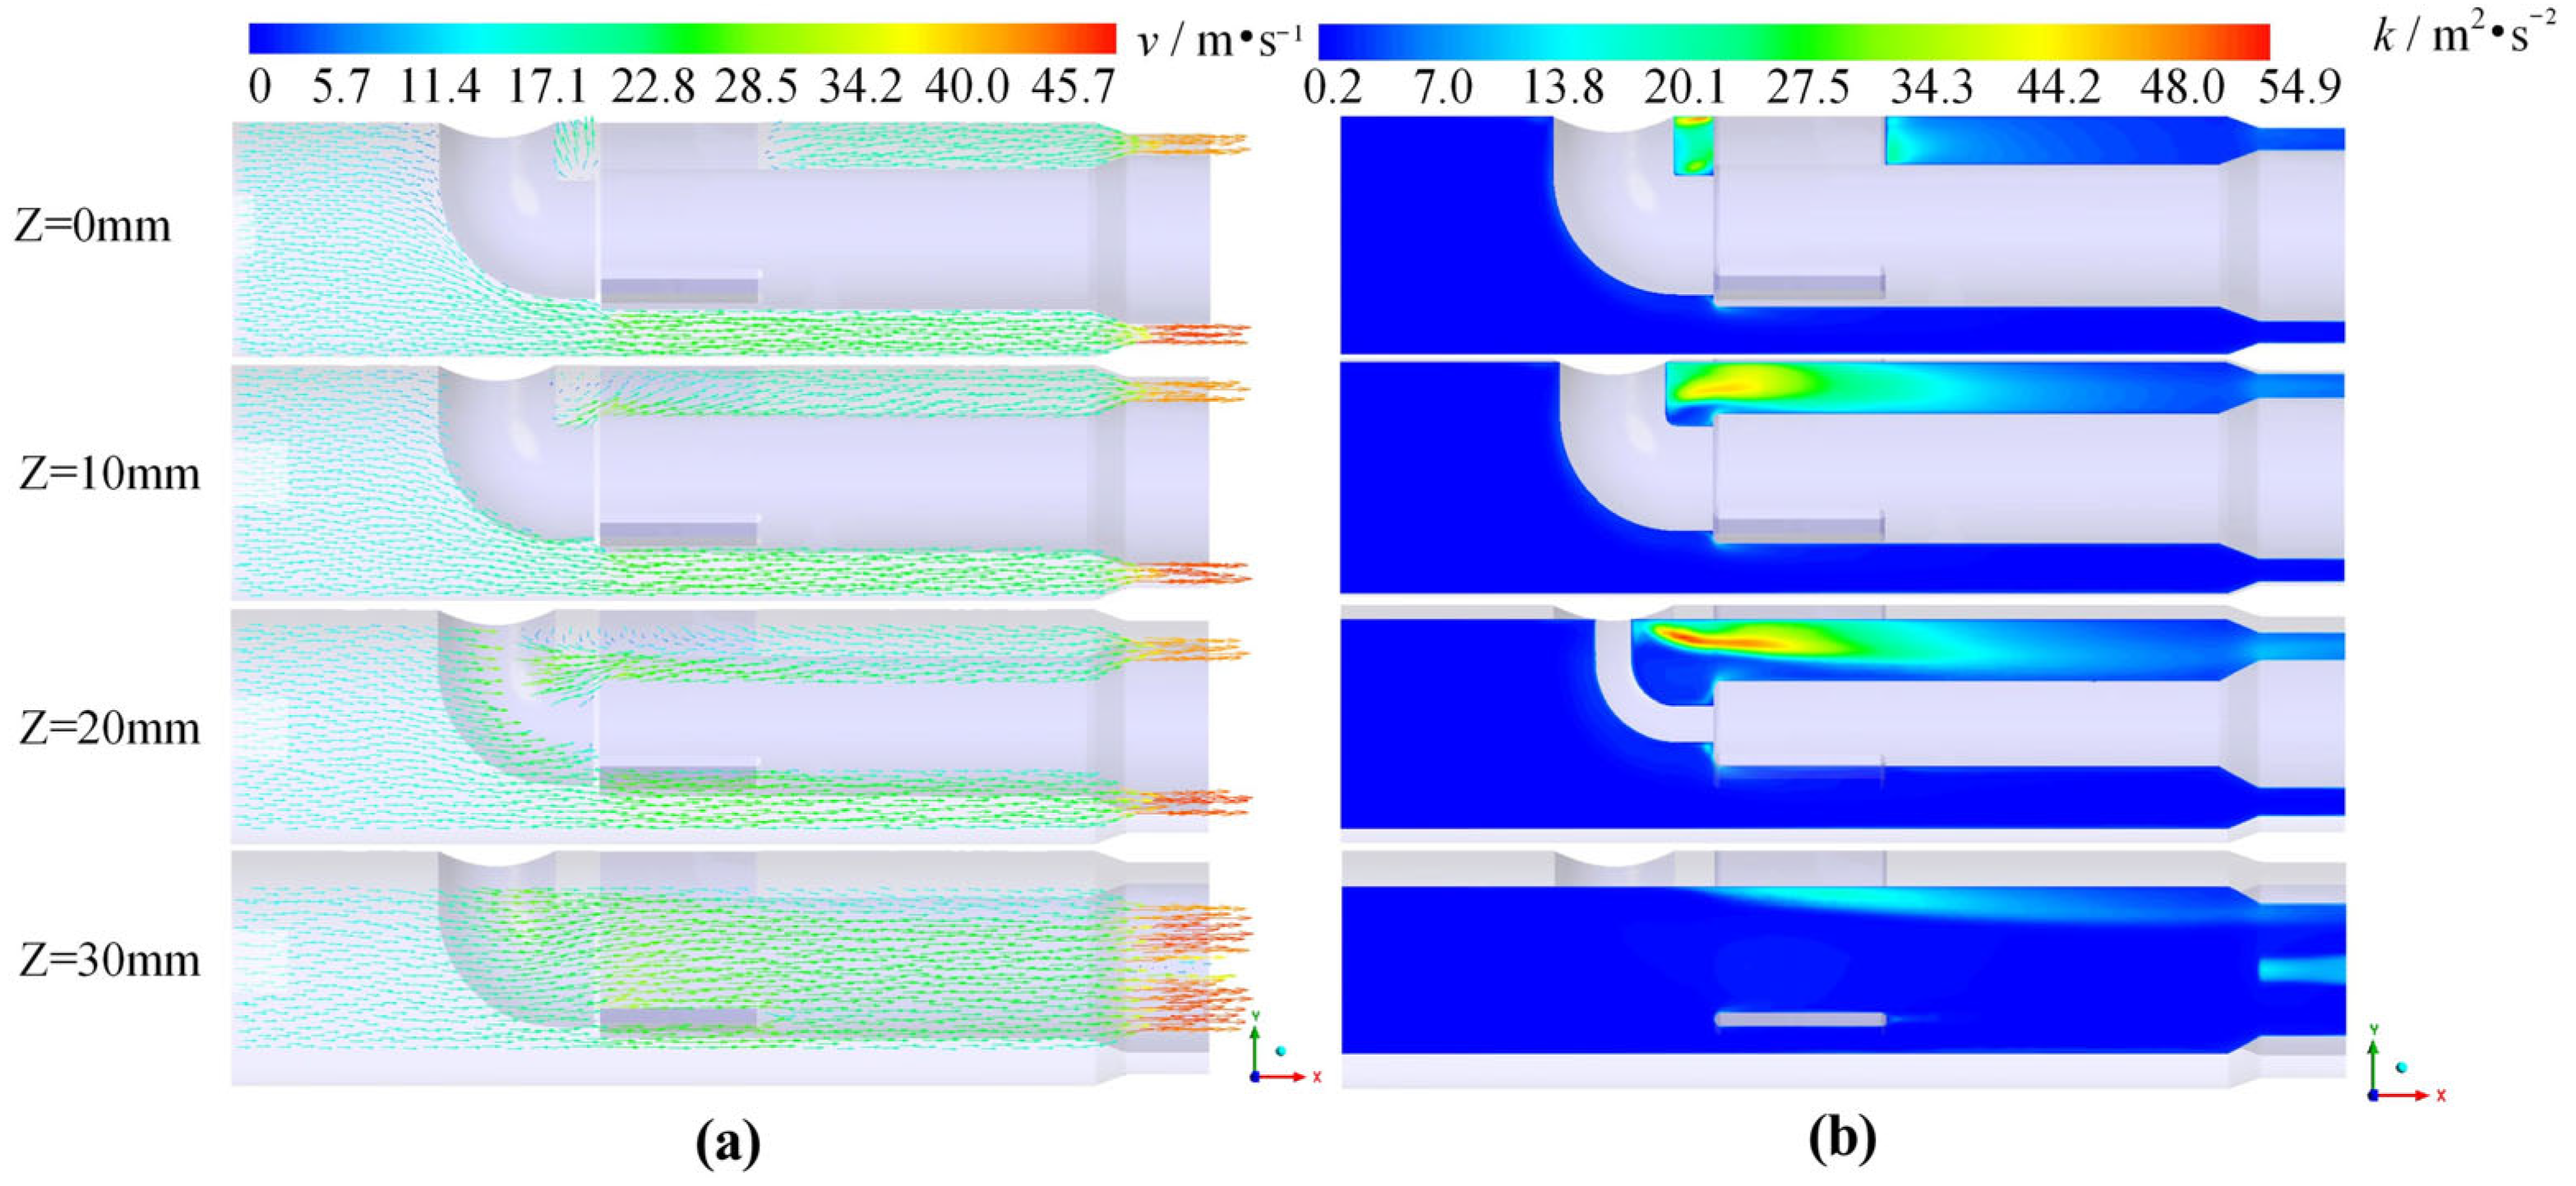
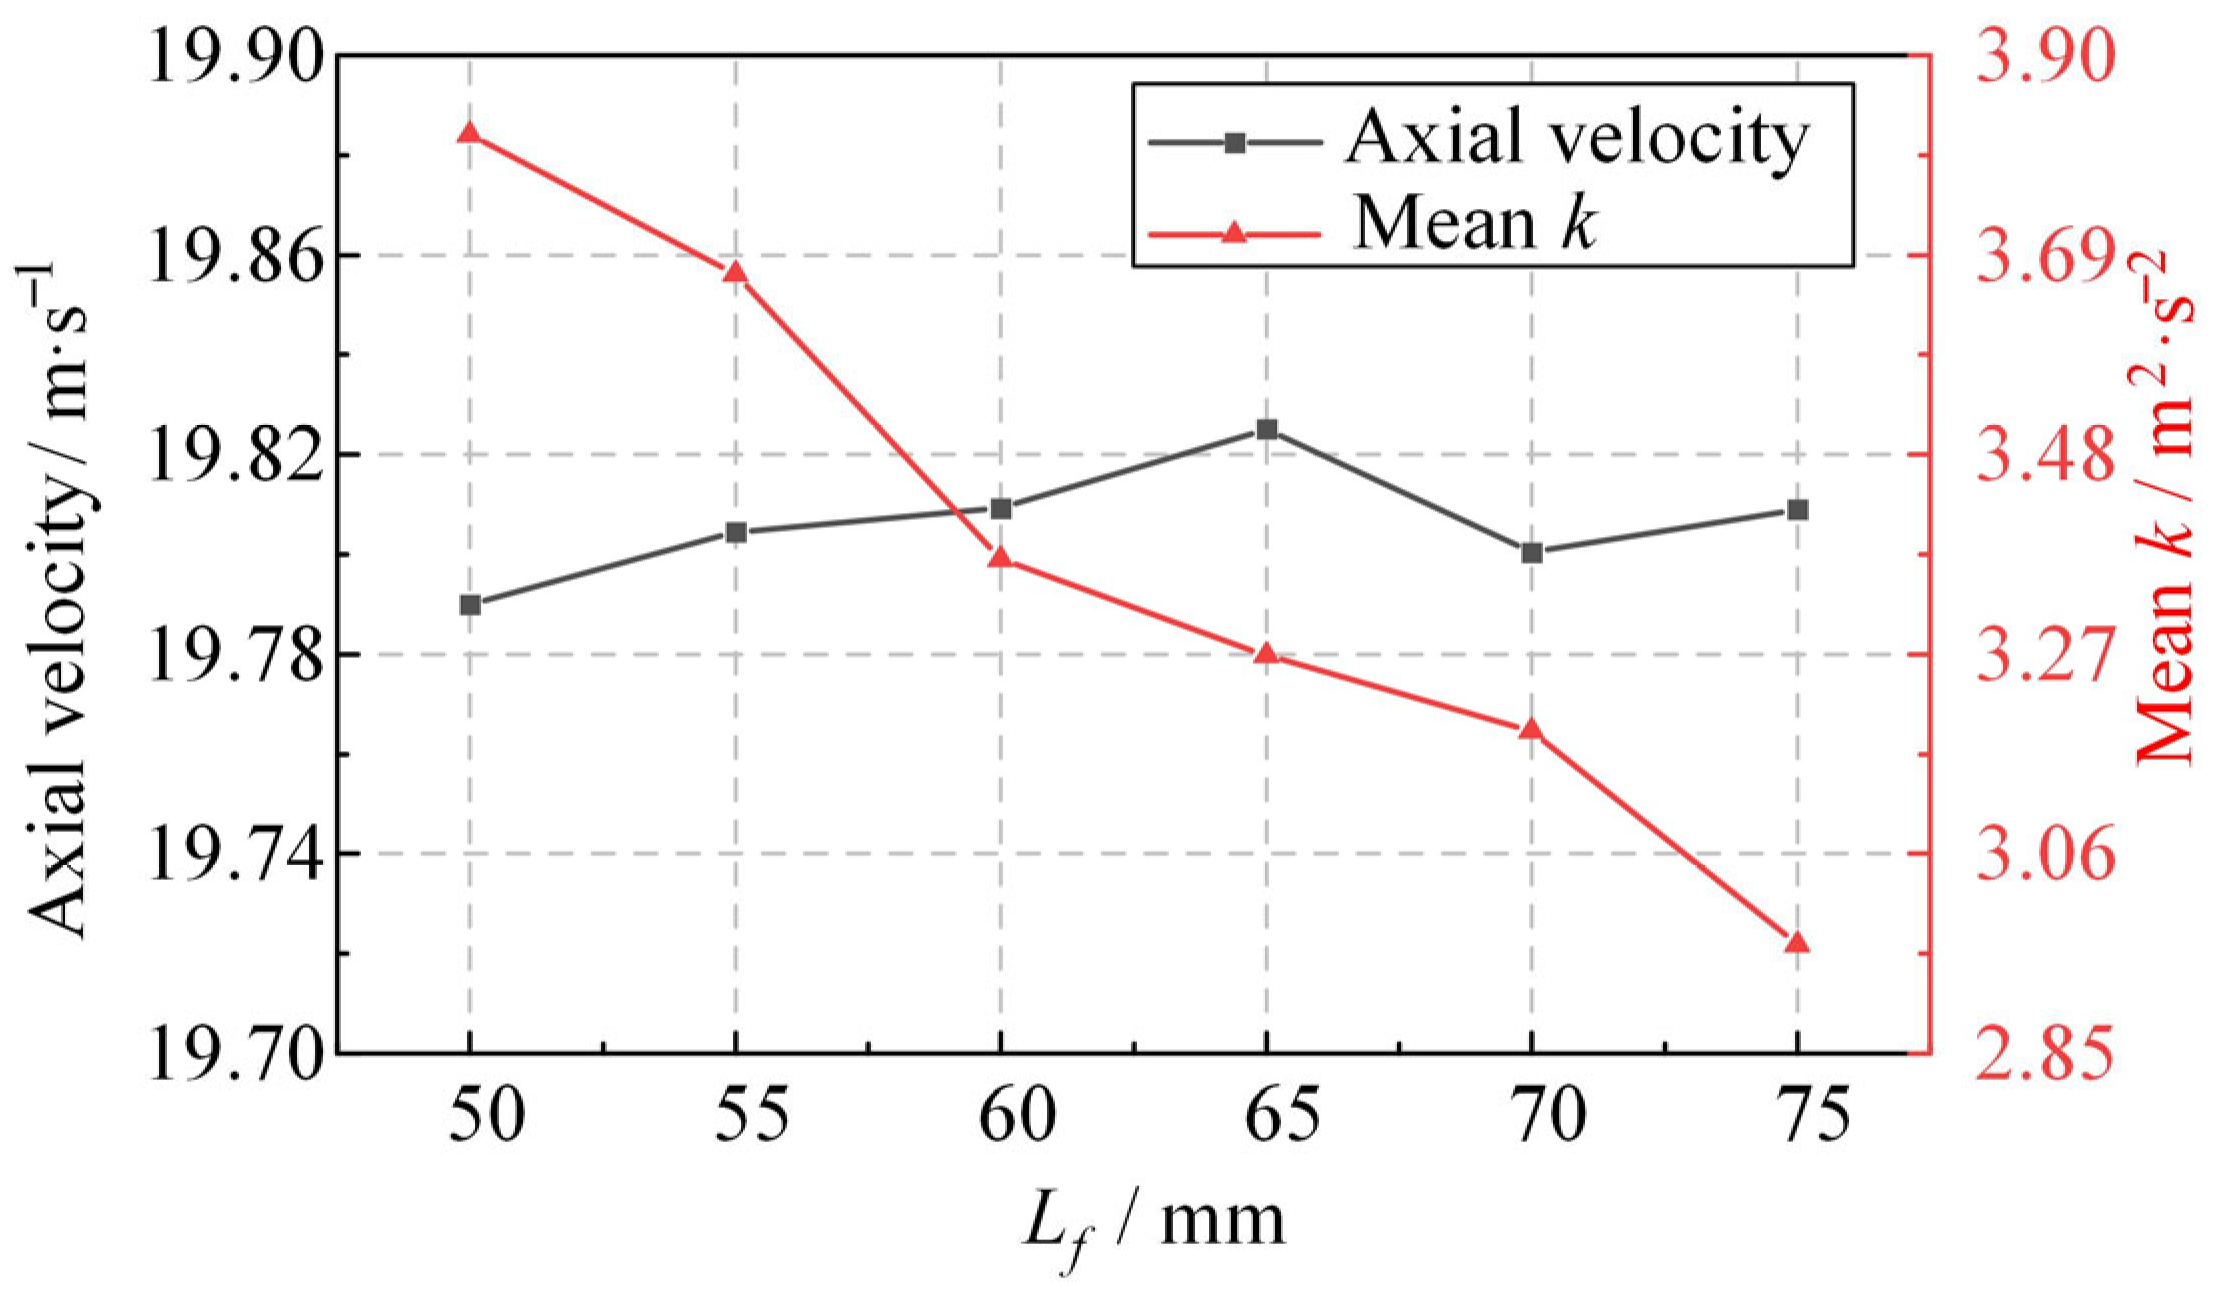
  • Increasing the length of the supporting blade is beneficial for reducing the average TKE at the nozzle outlet, but has little effect on the uniformity of the velocity distribution at the nozzle outlet and the PD at the inlet and outlet of the TPJFM head. With the increase in Lf, the velocity components in the X and Y directions at the cross-section d decrease significantly, and the average TKE at this location decreases by 22.37%. The local TKE in the IFF decreases significantly. Within the limited space of the supporting blade, increasing its length can reduce local pressure loss to a certain extent.
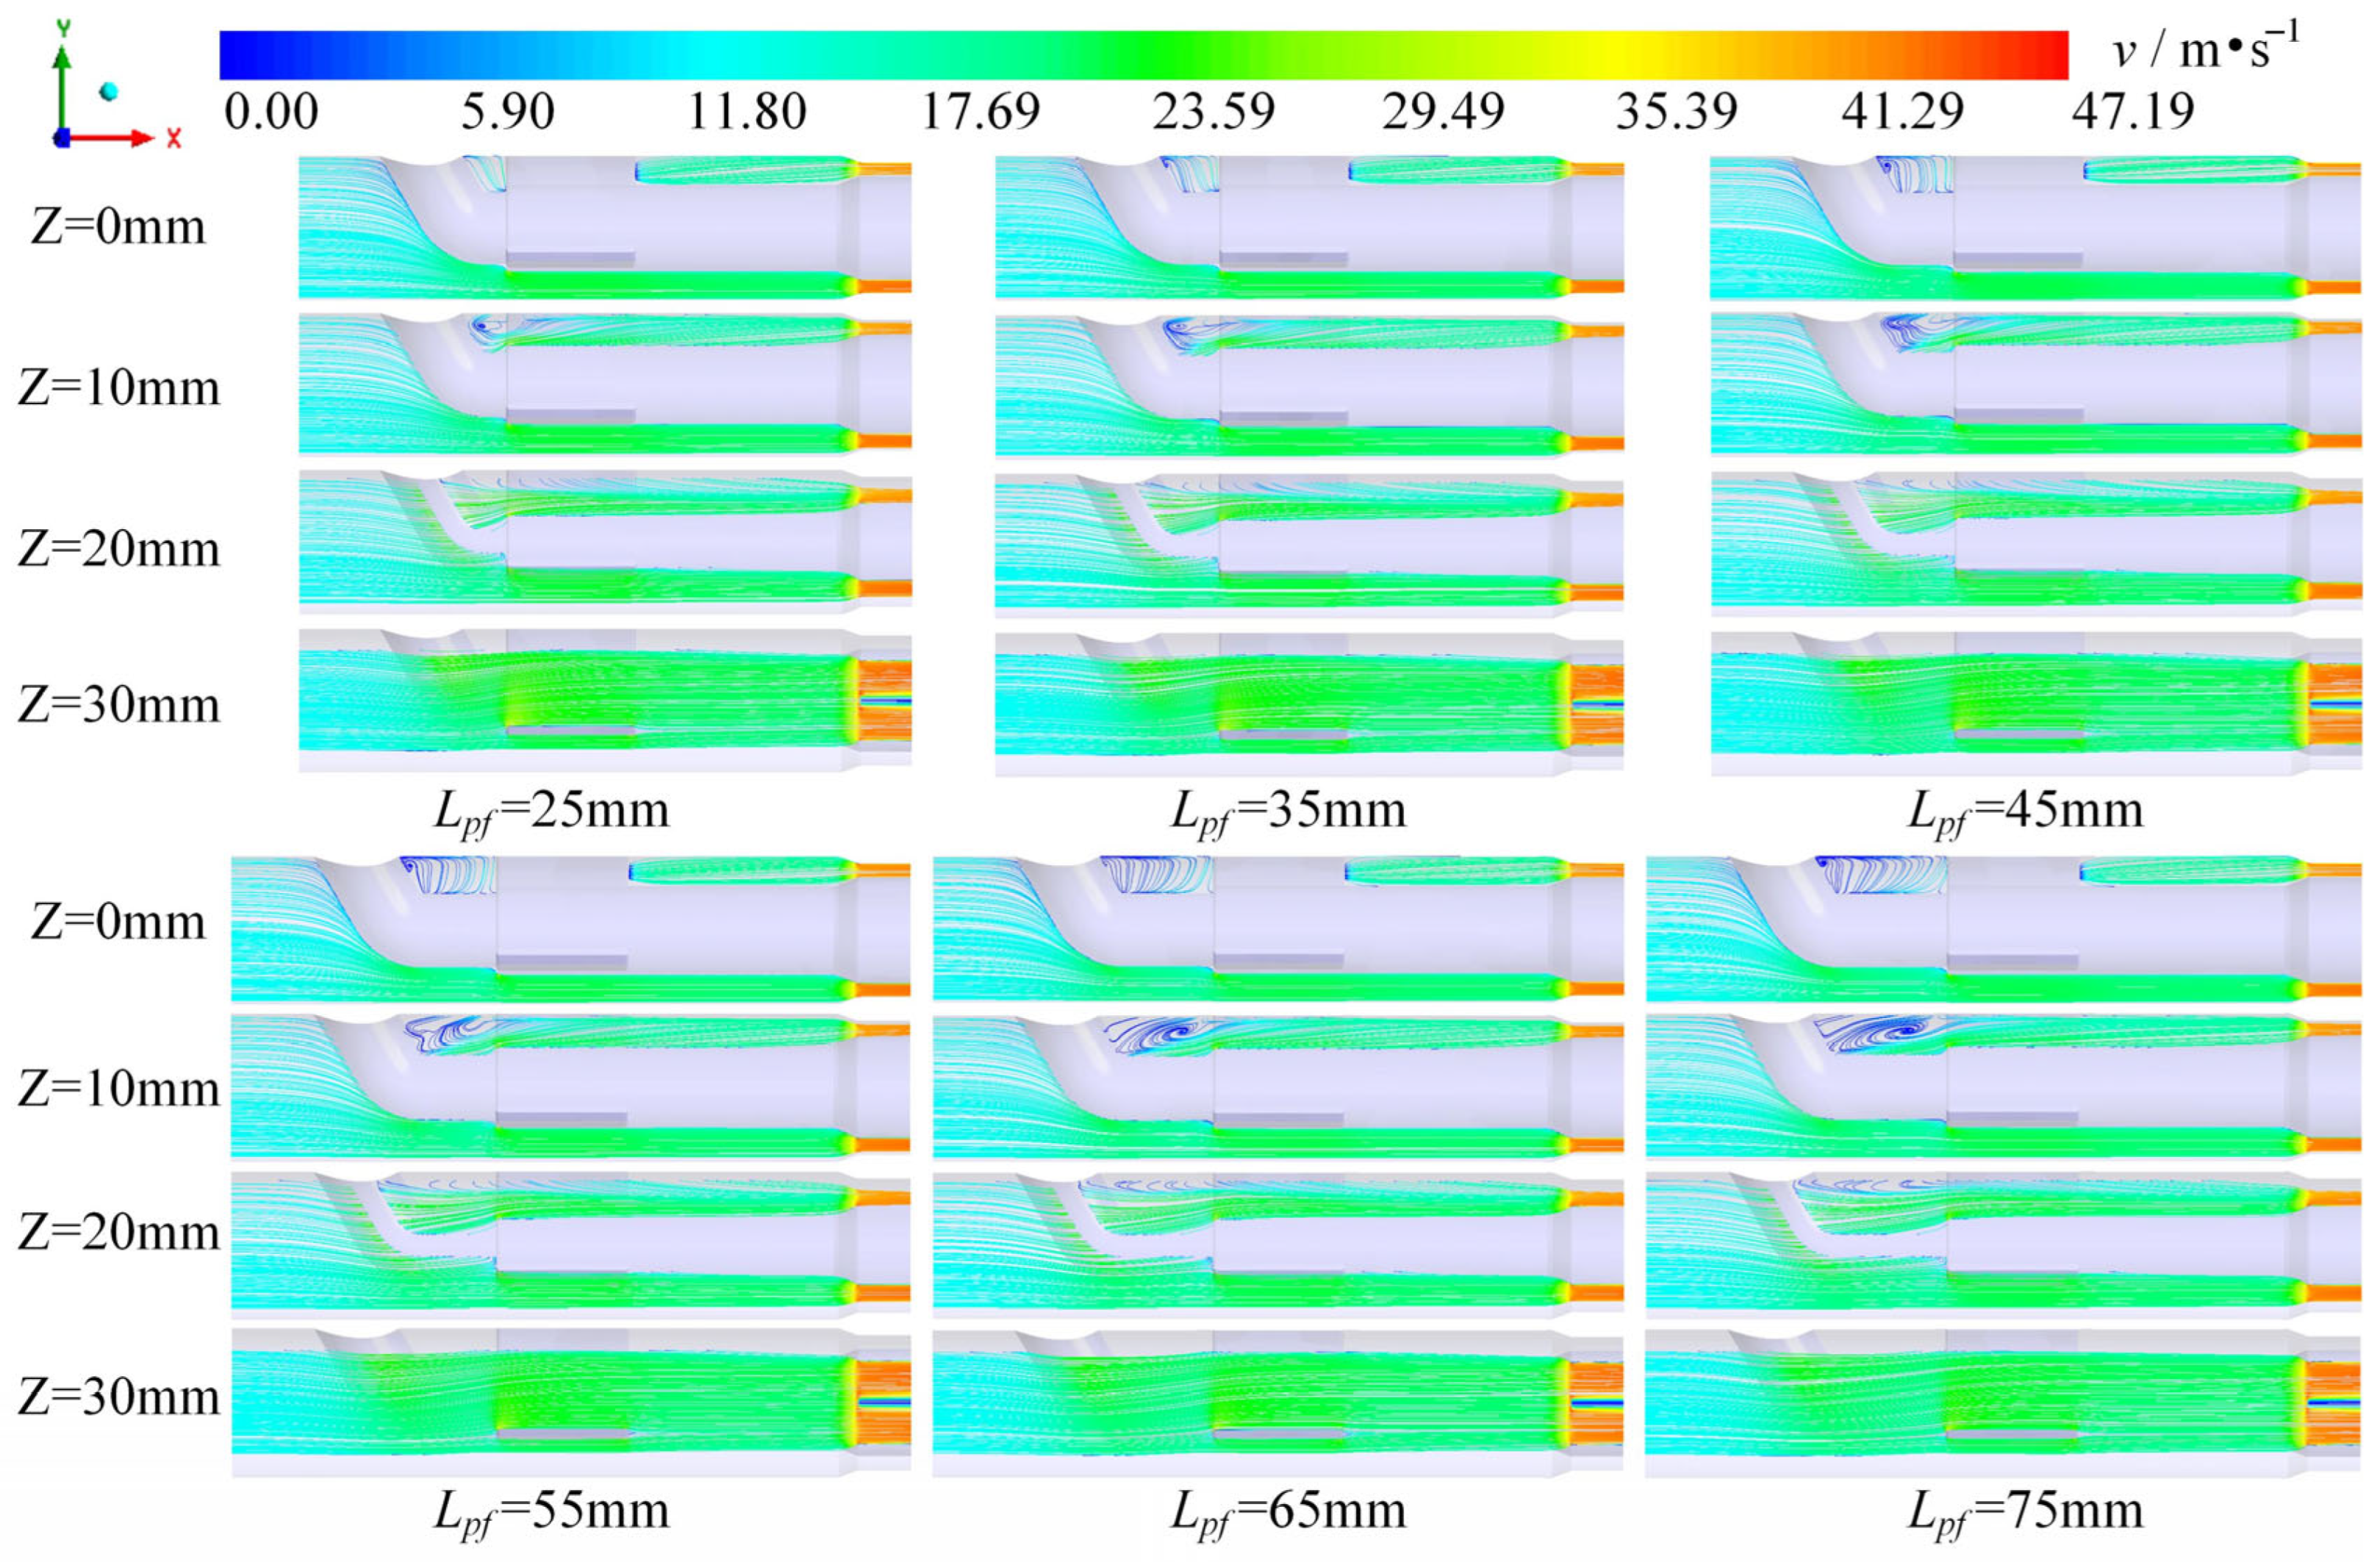
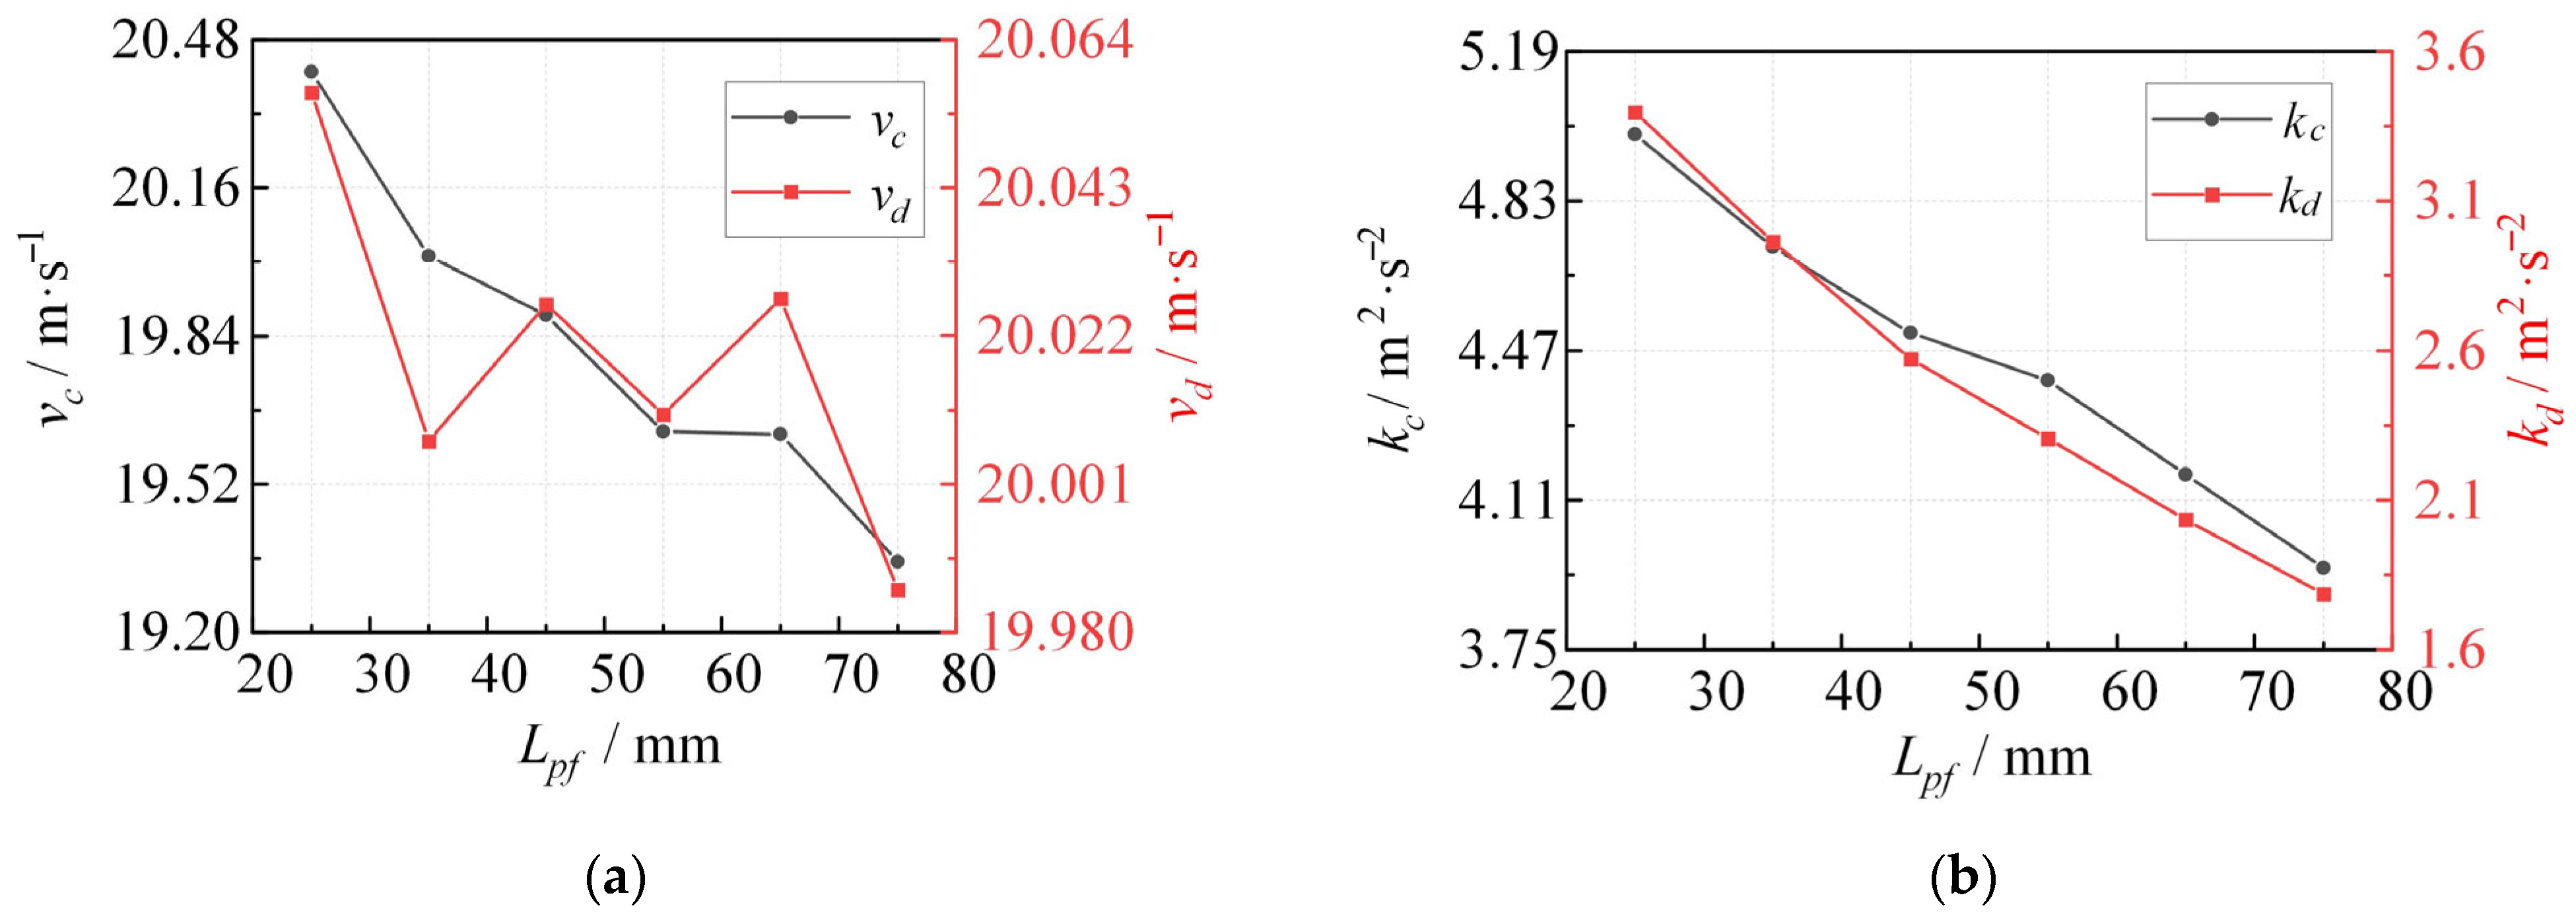
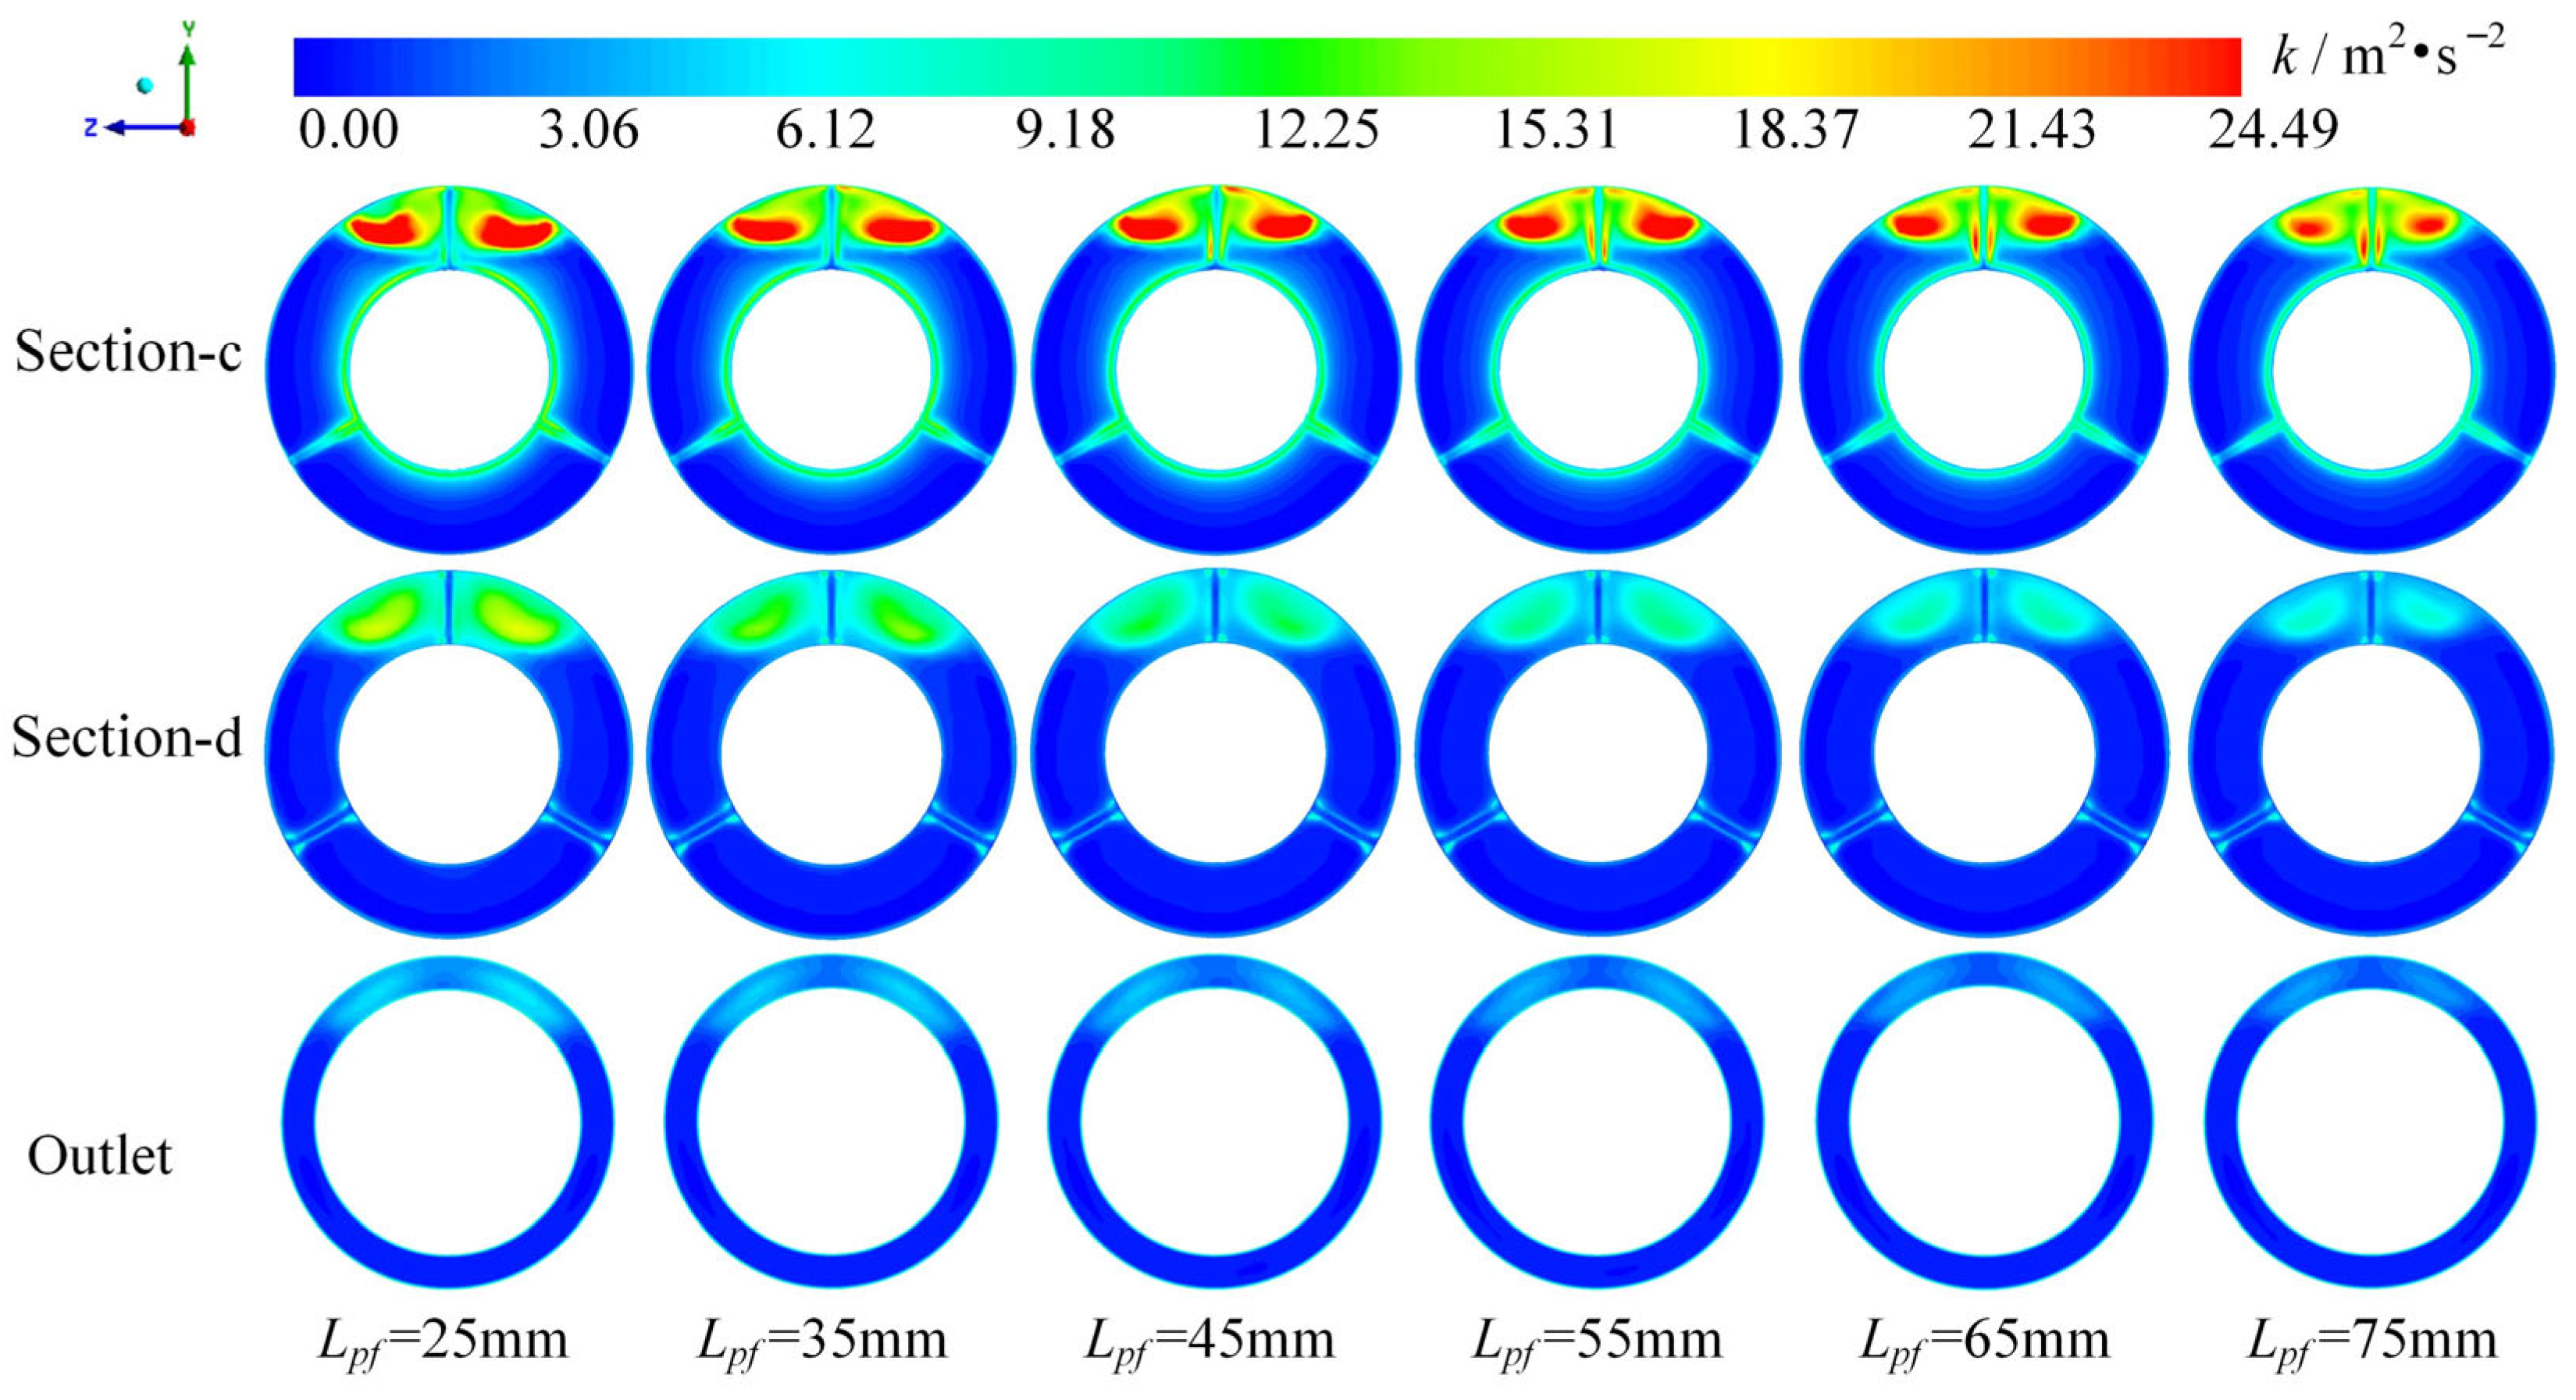
  • As Lpf increases from 25 mm to 75 mm, the TKE gradually decreases. The average TKE of cross-section c and cross-section d decreases by 21% and 48%, respectively. The nozzle outlet velocity distribution uniformity index reaches its optimum when Lpf = 45 mm. The average TKE at the nozzle outlet decreases by 22%, and the PD at the inlet and outlet of the flow passage in the TPJFM head decreases by 0.9%. Comprehensive analysis shows that when Lpf = 65 mm, the nozzle outlet can obtain a higher velocity distribution uniformity and lower TKE, while keeping the PD at the inlet and outlet of the flow passage in the monitor head at a low level.
Within certain ranges, reasonable increases in Ap and Lpf improve the flow characteristics of the IFF, reduce local pressure losses and peak TKE, thereby lowering the average TKE at the nozzle outlet and the PD across the monitor head inlet and outlet. Increasing the supporting blade length helps enhance the flow characteristics of the IFF, promoting smoother flow.

Author Contributions

Conceptualization, H.G. and L.Z.; methodology, H.G.; software, L.Z.; validation, H.G., L.J. and L.Z.; formal analysis, L.J.; investigation, H.G.; resources, H.G.; data curation, H.G.; writing—original draft preparation, H.G.; writing—review and editing, H.G.; visualization, H.G.; supervision, X.Z.; project administration, H.G.; funding acquisition, X.Z. All authors have read and agreed to the published version of the manuscript.

Funding

This research was funded by the key research and development of Shandong province, China, grant number 2019SDZY01.

Institutional Review Board Statement

Not applicable.

Informed Consent Statement

Not applicable.

Data Availability Statement

The original contributions presented in the study are included in the article, further inquiries can be directed to the corresponding author.

Acknowledgments

I would like to thank Chunyang, Guo for supporting this research and Rui, Sun for her strong support and encouragement for the research work.

Conflicts of Interest

The authors declare no conflicts of interest.

References

  1. Liu, Z.F.; Xu, Z.S.; Fan, C.G. Chuangang Predictive Analysis of Fire Frequency Based on Daily Temperatures. Nat. Hazards 2019, 97, 1175–1189. [Google Scholar] [CrossRef]
  2. Bispo, R.; Vieira, F.G.; Bachir, N.; Espadinha-Cruz, P.; Lopes, J.P.; Penha, A.; Marques, F.J.; Grilo, A. Spatial Modelling and Mapping of Urban Fire Occurrence in Portugal. Fire Saf. J. 2023, 138, 103802. [Google Scholar] [CrossRef]
  3. Su, D.; Jing, H.; Wang, Y. Simulation Study of Nozzle in Fire Engine Based on Fluent. Appl. Mech. Mater. 2013, 318, 231–234. [Google Scholar] [CrossRef]
  4. Song, G.; Zheng, H.; Wang, Y.; Zheng, Y.; Zhou, Y.; Yao, B. Finite Element Analysis of Nozzle Selection Based on High Pressure Water Jet Technology. IOP Conf. Ser. Earth Environ. Sci. 2019, 267, 042053. [Google Scholar] [CrossRef]
  5. Wen, J.; Qi, Z.; Behbahani, S.S.; Pei, X.; Iseley, T. Research on the Structures and Hydraulic Performances of the Typical Direct Jet Nozzles for Water Jet Technology. J. Braz. Soc. Mech. Sci. Eng. 2019, 41, 570. [Google Scholar] [CrossRef]
  6. Zhang, S.; Tao, X.; Lu, J.; Wang, X.; Zeng, Z. Structure Optimization and Numerical Simulation of Nozzle for High Pressure Water Jetting. Adv. Mater. Sci. Eng. 2015, 2015, 732054. [Google Scholar] [CrossRef]
  7. Hou, Y.; Yang, X.; Ren, F.; Liu, Y. Structural Analysis and Optimization of Liquid Nitrogen Fire Monitor Based on FLUENT. In Proceedings of the 2018 3rd International Conference on Electrical, Automation and Mechanical Engineering (EAME 2018), Xi’an, China, 24–25 June 2018; Atlantis Press: Xi’an, China, 2018. [Google Scholar]
  8. Yuan, X.; Zhu, X.; Wang, C.; Zhang, L.; Zhu, Y. Research on the Dynamic Behaviors of the Jet System of Adaptive Fire-Fighting Monitors. Processes 2019, 7, 952. [Google Scholar] [CrossRef]
  9. Yuan, X.; Zhu, X.; Wang, C.; Zhang, L. Research on Dynamic Modeling and Parameter Influence of Adaptive Gun Head Jet System of Fire-Fighting Monitor. IEEE Access 2020, 8, 121182–121196. [Google Scholar] [CrossRef]
  10. Min, D.L.; Cho, H.Y. Fire Nozzle Internal Shape Design to Reduce Anti Repulsive Force. Trans. Korean Soc. Mech. Eng. A 2021, 45, 699–707. [Google Scholar] [CrossRef]
  11. Zhou, J.; Li, G.R. Study and Simulation for Optimization Plan of the Liquamatic Fire Water Cannon with Self-Swinging Device. AMR 2012, 468–471, 944–948. [Google Scholar] [CrossRef]
  12. Hu, J.; Shu, X.M.; Xie, S.T.; Tang, S.Y.; Wu, J.J.; Deng, B.Y. Socioeconomic Determinants of Urban Fire Risk: A City-Wide Analysis of 283 Chinese Cities from 2013 to 2016. Fire Saf. J. 2019, 110, 102890. [Google Scholar] [CrossRef]
  13. Khan, A.; Sanaullah, K.; Konstantinovich, S.E.; Viktorovich, P.A.; Fedorovna, K.D.; Algarni, M.; Ullah, A. Experimental Investigation of Inner Nozzle Surface Modifications on the Flow Regimes in Steam/Water Flow. Arab. J. Sci. Eng. 2022, 47, 5555–5565. [Google Scholar] [CrossRef]
  14. Pan, Y.; Geng, Z.; Yuan, H.; Zhai, S.; Huo, F. Numerical Simulation and Flow Field Analysis of Porous Water Jet Nozzle Based on Fluent. Appl. Sci. 2024, 14, 7075. [Google Scholar] [CrossRef]
  15. Xiang, Q.; Xue, L.; Kim, K.-Y.; Shi, Z. Multi-Objective Optimization of a Flow Straightener in a Large Capacity Firefighting Water Cannon. J. Hydrodyn. 2019, 31, 137–144. [Google Scholar] [CrossRef]
  16. Yuan, D.; Shi, R.; Cong, X.; Ji, M. Performance Analysis of Guide Vane in Long-Range Fire- Fighting Water Cannon. Paiguan Jixie Gongcheng Xuebao/J. Drain. Irrig. Mach. Eng. 2017, 35, 333–339. [Google Scholar] [CrossRef]
  17. Seo, Y. Effect of Hydraulic Diameter of Flow Straighteners on Turbulence Intensity in Square Wind Tunnel. HVAC&R Res. 2013, 19, 141–147. [Google Scholar] [CrossRef]
  18. Yin, Z.; Gu, Y.; Fan, T.; Li, Z.; Wang, W.; Wu, D.; Mou, J.; Zheng, S. Effect of the Inclined Part Length of an Inclined Blade on the Cavitation Characteristics of Vortex Pumps. Machines 2023, 11, 21. [Google Scholar] [CrossRef]
  19. Hirt, C.W.; Nichols, B.D. Volume of Fluid (VOF) Method for the Dynamics of Free Boundaries. J. Comput. Phys. 1981, 39, 201–225. [Google Scholar] [CrossRef]
  20. Yu, Y.; Shademan, M.; Barron, R.M.; Balachandar, R. CFD Study of Effects of Geometry Variations on Flow in a Nozzle. Eng. Appl. Comput. Fluid Mech. 2012, 6, 412–425. [Google Scholar] [CrossRef]
  21. Zou, X.; Fu, L.; Wu, L.; Zuo, W. Research on Multiphase Flow and Nozzle Wear in a High-Pressure Abrasive Water Jet Cutting Head. Machines 2023, 11, 614. [Google Scholar] [CrossRef]
  22. Jia, C.D. Structural Design and Performance Study of the Three-Phase Jet Fire Monitor. Master’s Thesis, China University of Mining and Technology, Beijing, China, 2019. [Google Scholar]
  23. Zhang, X.; Jiao, L.; Ge, H. Multi-Objective Optimization of Three-Phase Jet Fire Monitor Nozzle Based on Kriging and NSGA-II. IEEE Access 2024, 12, 51115–51129. [Google Scholar] [CrossRef]
  24. Zhang, X.; Ge, H.E.; Liu, Z.; Liu, Y.Q. Analysis of Flow Straightener on the Internal Flow Field of Three-Phase Jet Fire Monitors. Int. J. Simul. Model. 2024, 23, 101–112. [Google Scholar] [CrossRef]
Figure 1. Diagram of TPJFM head dimensions: (a) three-phase jet fire-fighting vehicle; (b) three-phase jet fire monitor; (c) three-phase jet fire monitor head model; (d) diagram of three-phase jet fire monitor head dimensions.
Applsci 14 08300 g001
Figure 2. Meshing diagram of the IFF of the nozzle of the TPJFM by Fluent Meshing.
Applsci 14 08300 g002
Figure 3. Grid independence verification.
Applsci 14 08300 g003
Figure 4. Schematic diagram of cross-sections and velocity contour map. a, b, c, d, e and f are the cross sections of the IFF.
Applsci 14 08300 g004
Figure 5. Velocity vector and TKE contour map of cross-sections: (a) velocity vector contour; (b) TKE contour.
Applsci 14 08300 g005
Figure 6. Line graph of uniformity of velocity distribution of cross-sections.
Applsci 14 08300 g006
Figure 7. Velocity and streamlines contour map of cross-sections with different Ap.
Applsci 14 08300 g007
Figure 8. TKE contour map of cross-sections with different Ap.
Applsci 14 08300 g008
Figure 9. Line chart of changes in boundary parameters of IFF with different Ap.
Applsci 14 08300 g009
Figure 10. Velocity contour map of nozzle outlet with different Ap.
Applsci 14 08300 g010
Figure 11. Streamlines with different Lf.
Applsci 14 08300 g011
Figure 12. Transversal velocity contour map of cross-section d.
Applsci 14 08300 g012
Figure 13. Line chart of changes in flow field parameters of cross-section d with different Lf.
Applsci 14 08300 g013
Figure 14. Line chart of changes in boundary parameters of IFF with different Lf.
Applsci 14 08300 g014
Figure 15. Streamlines of cross-sections with different Lpf.
Applsci 14 08300 g015
Figure 16. TKE contour map of cross-sections with different Lpf.
Applsci 14 08300 g016
Figure 17. Flow field parameters of section c and section d: (a) mean velocity; (b) mean TKE.
Applsci 14 08300 g017
Figure 18. TKE contour map of section c, section d and outlet.
Applsci 14 08300 g018
Figure 19. Line chart of changes in boundary parameters of IFF with different Lpf.
Applsci 14 08300 g019
Table 1. Structural parameters of TPJFM head.
SymbolStructure NameSize
ApPowder-pipe bending angle90°
AcNozzle contraction angle20°
LfSupporting blade length60 mm
LpfDistance between the supporting blade and the bending section of the powder nozzle35 mm
Disclaimer/Publisher’s Note: The statements, opinions and data contained in all publications are solely those of the individual author(s) and contributor(s) and not of MDPI and/or the editor(s). MDPI and/or the editor(s) disclaim responsibility for any injury to people or property resulting from any ideas, methods, instructions or products referred to in the content.

