
Sensitivity Analysis of Fatigue Life for Cracked Carbon-Fiber Structures Based on Surrogate Sampling and Kriging Model under Distribution Parameter Uncertainty


Abstract
1. Introduction
2. Fatigue Life Prediction and Reliability of Cracked Carbon-Fiber Structures under Uncertain Parameters
2.1. Sensitivity Analysis of Cracked Carbon-Fiber Structures Using ALK Model and Surrogate Sampling
2.2. Sensitivity Index Analysis Process Based on the Kriging Model and Surrogate Sampling
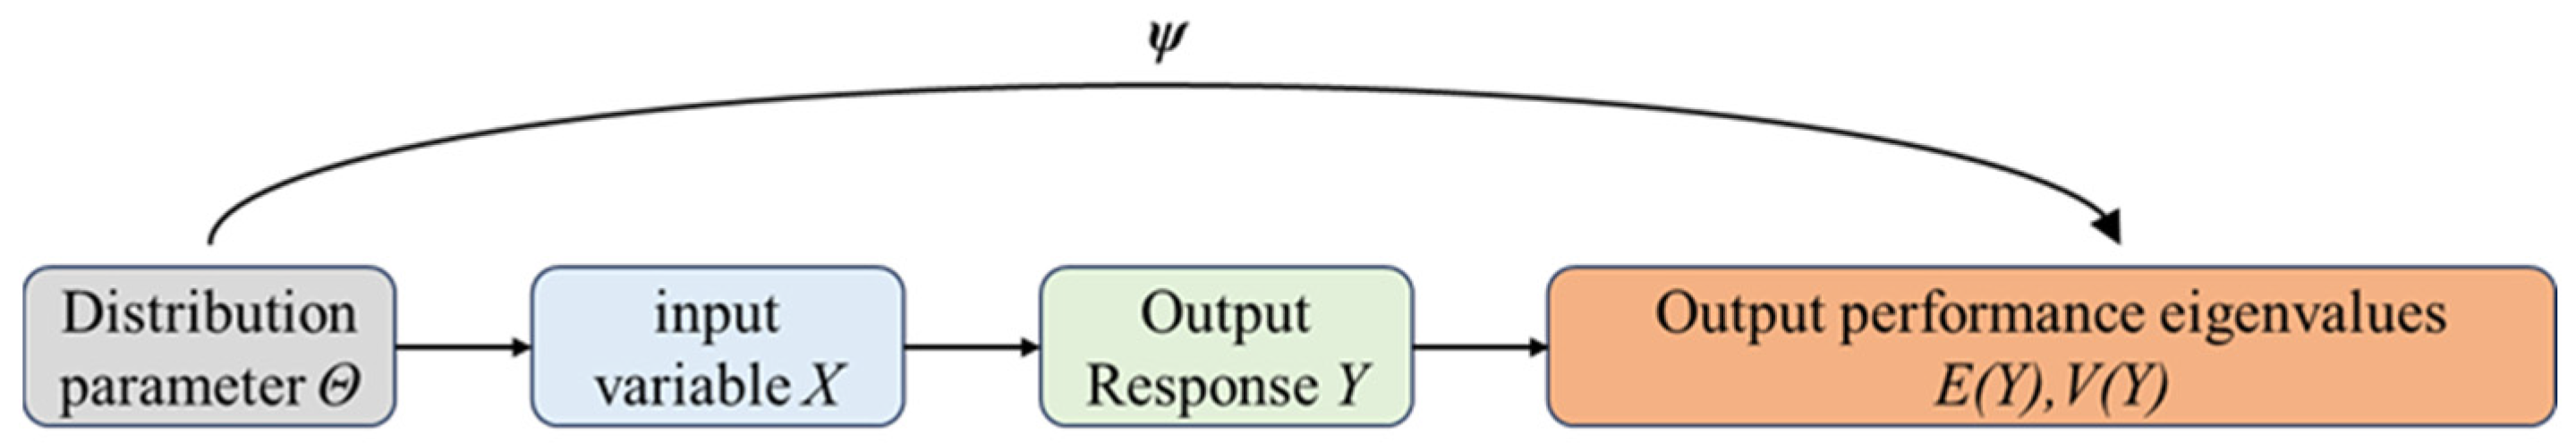
- Generate samples in the distribution parameter sample space according to the marginal probability density function , forming a sample pool ;
- Extract distribution parameter samples according to the surrogate sampling probability density function , and substitute them into the simulation model to obtain the corresponding output statistical characteristic values ;
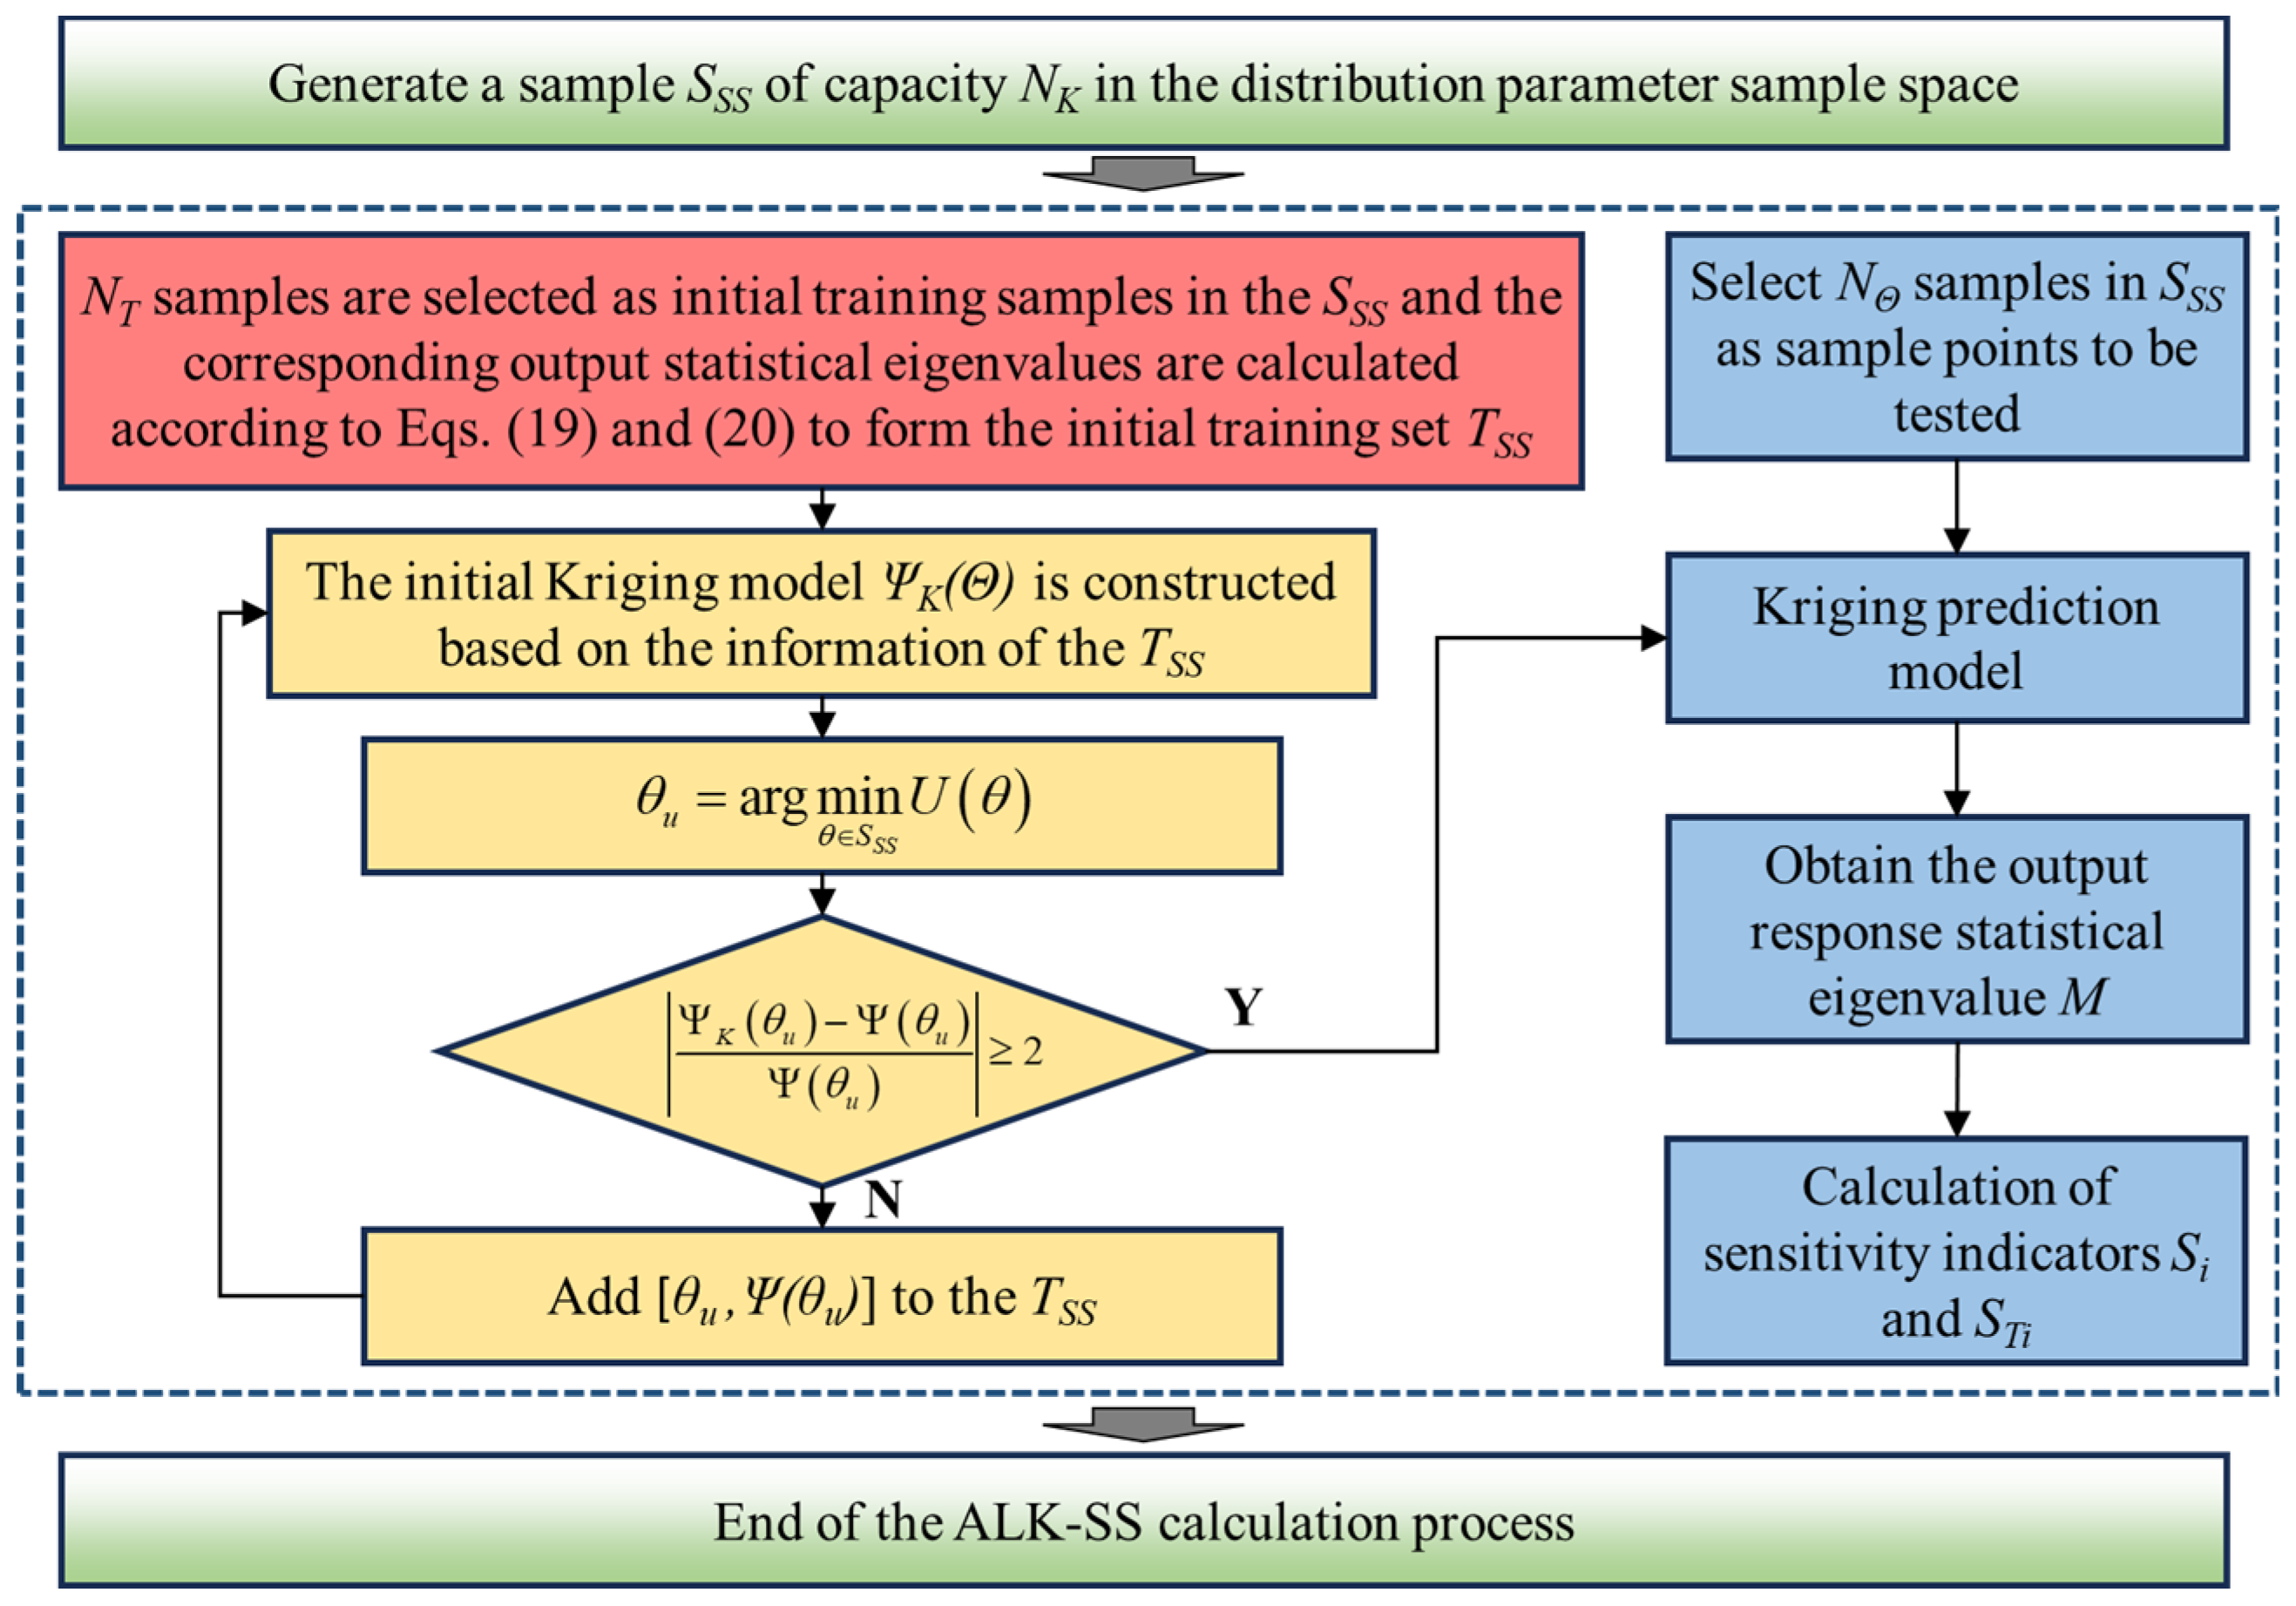
- Randomly extract distribution parameter samples from the sample pool . For each distribution parameter sample point , calculate the corresponding output statistical characteristic values based on and according to Equations (19) and (20), forming the initial training sample set ;
- Establish the initial Kriging surrogate model based on the current ;
- Select the update sample point from as:Calculate the predicted value and the true response value . Stop the active learning process and proceed to step 6 when Equation (21) is satisfied; otherwise, add to the training set and return to step 4;
- Randomly extract test distribution parameter samples from the sample pool , and substitute them into the Kriging model to obtain the corresponding output performance characteristic value samples , from which the total variance can be calculated;
- Fix the distribution parameter at its sample point . Combine it with other distribution parameter samples and, based on the established Kriging model, solve the conditional output statistical characteristic values to obtain their conditional mean . Traverse to obtain sample values of under the -th dimension distribution parameter conditions . Calculate the variance in the conditional expectation of the output performance characteristic values , and use Equation (5) to obtain the primary sensitivity index of the distribution parameter ;
- Fix the distribution parameter at its sample point . Combine it with other distribution parameter samples and, based on the established Kriging model, solve the conditional output statistical characteristic values to obtain its conditional mean . Traverse to obtain sample values of under the -th dimension distribution parameter conditions . Calculate the variance in the conditional expectation of the output performance characteristic values , and use Equation (6) to obtain the total sensitivity index of the distribution parameter .
3. Experiments and Simulation
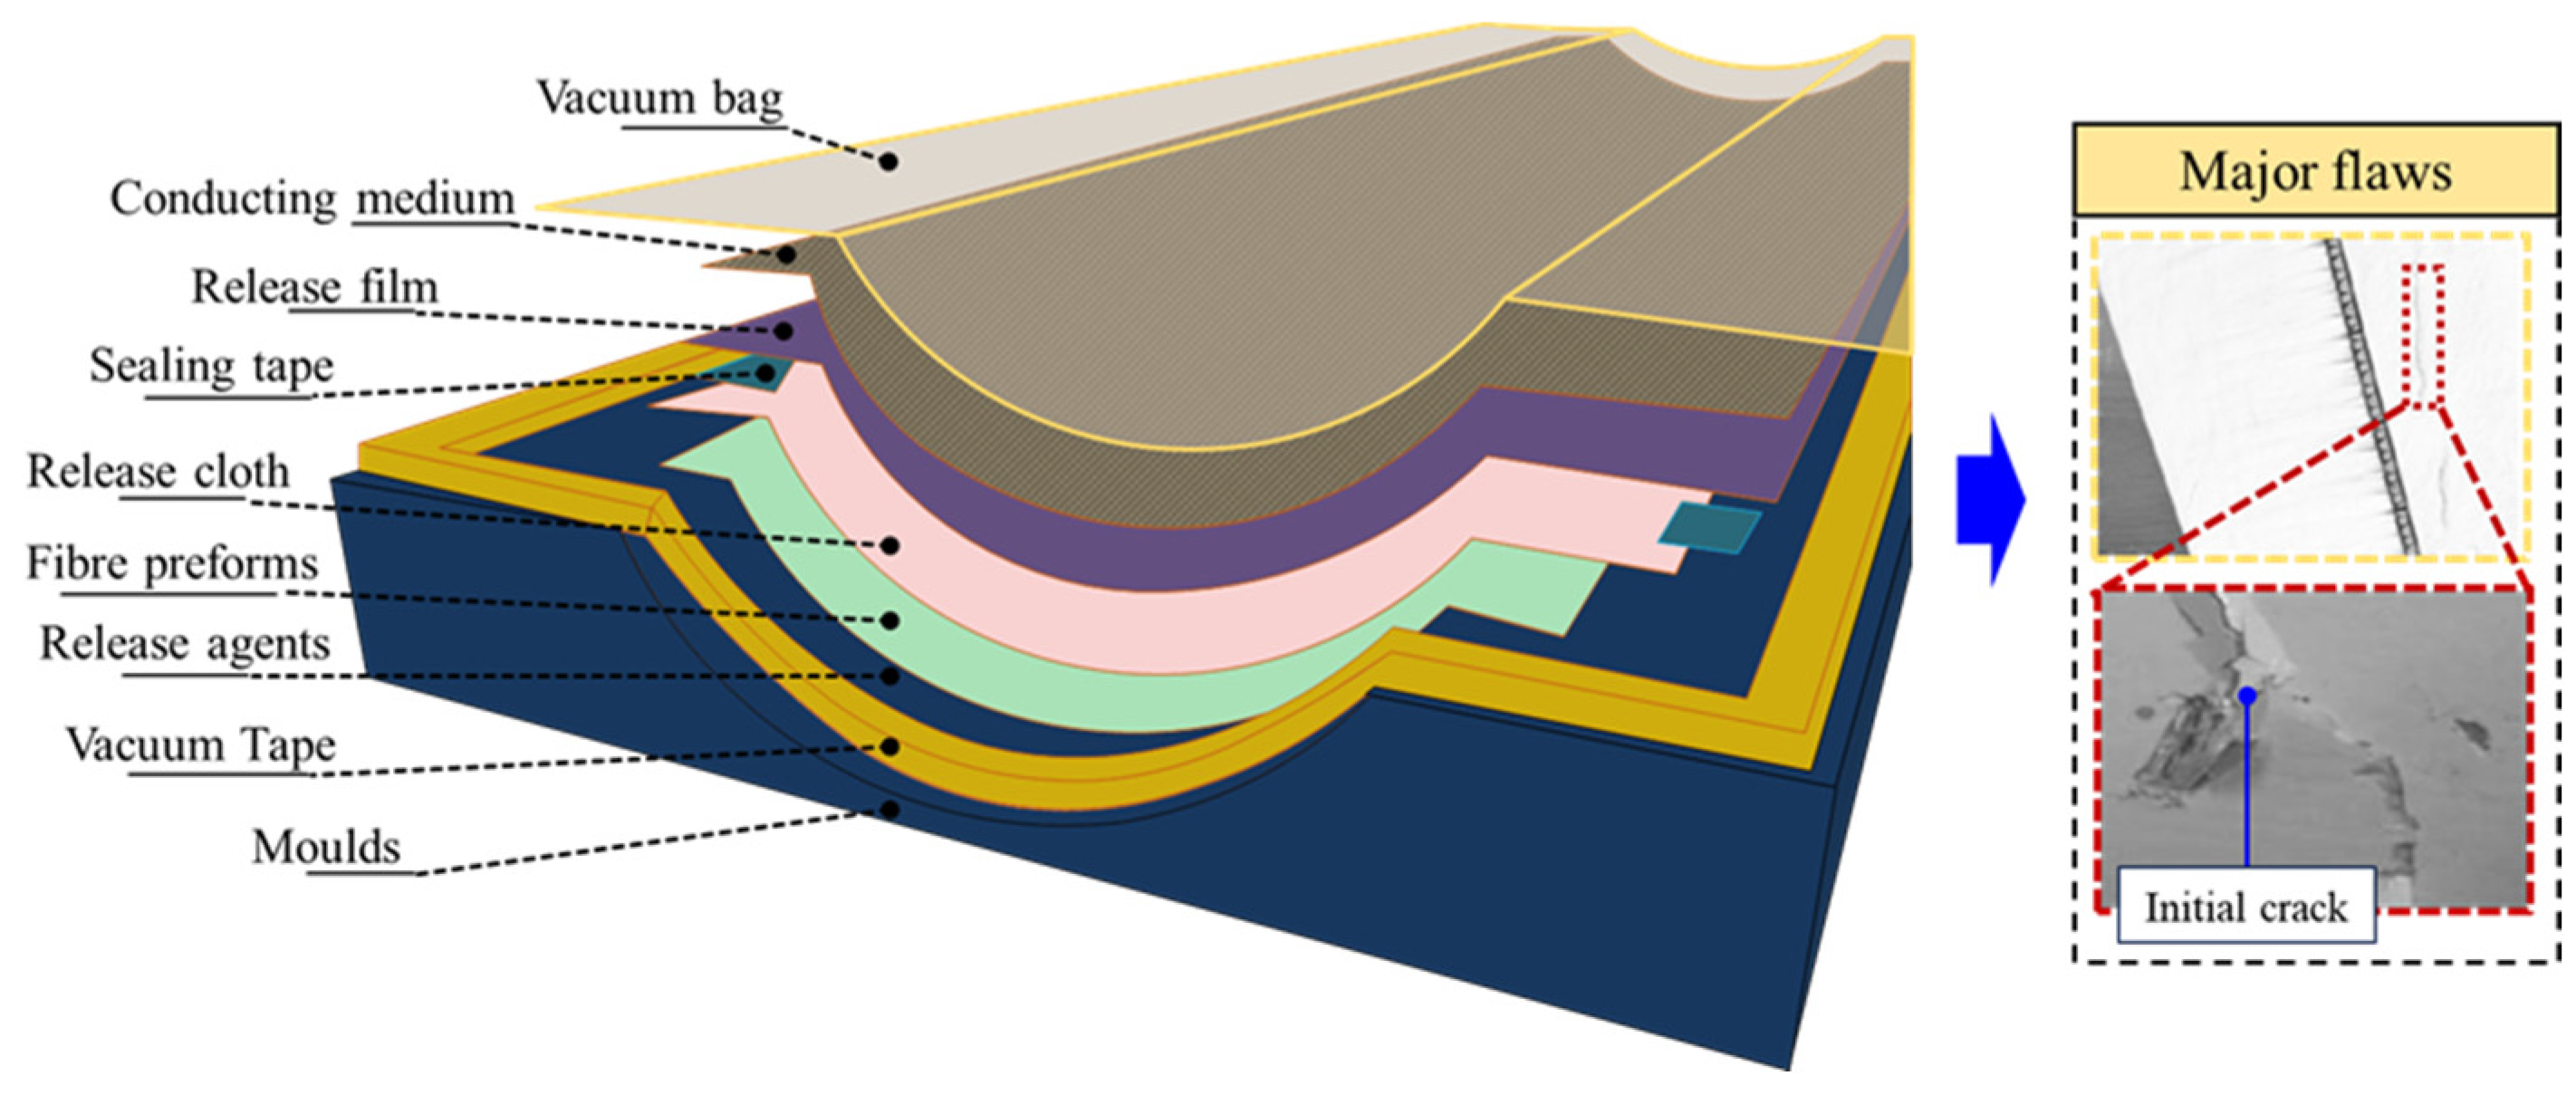
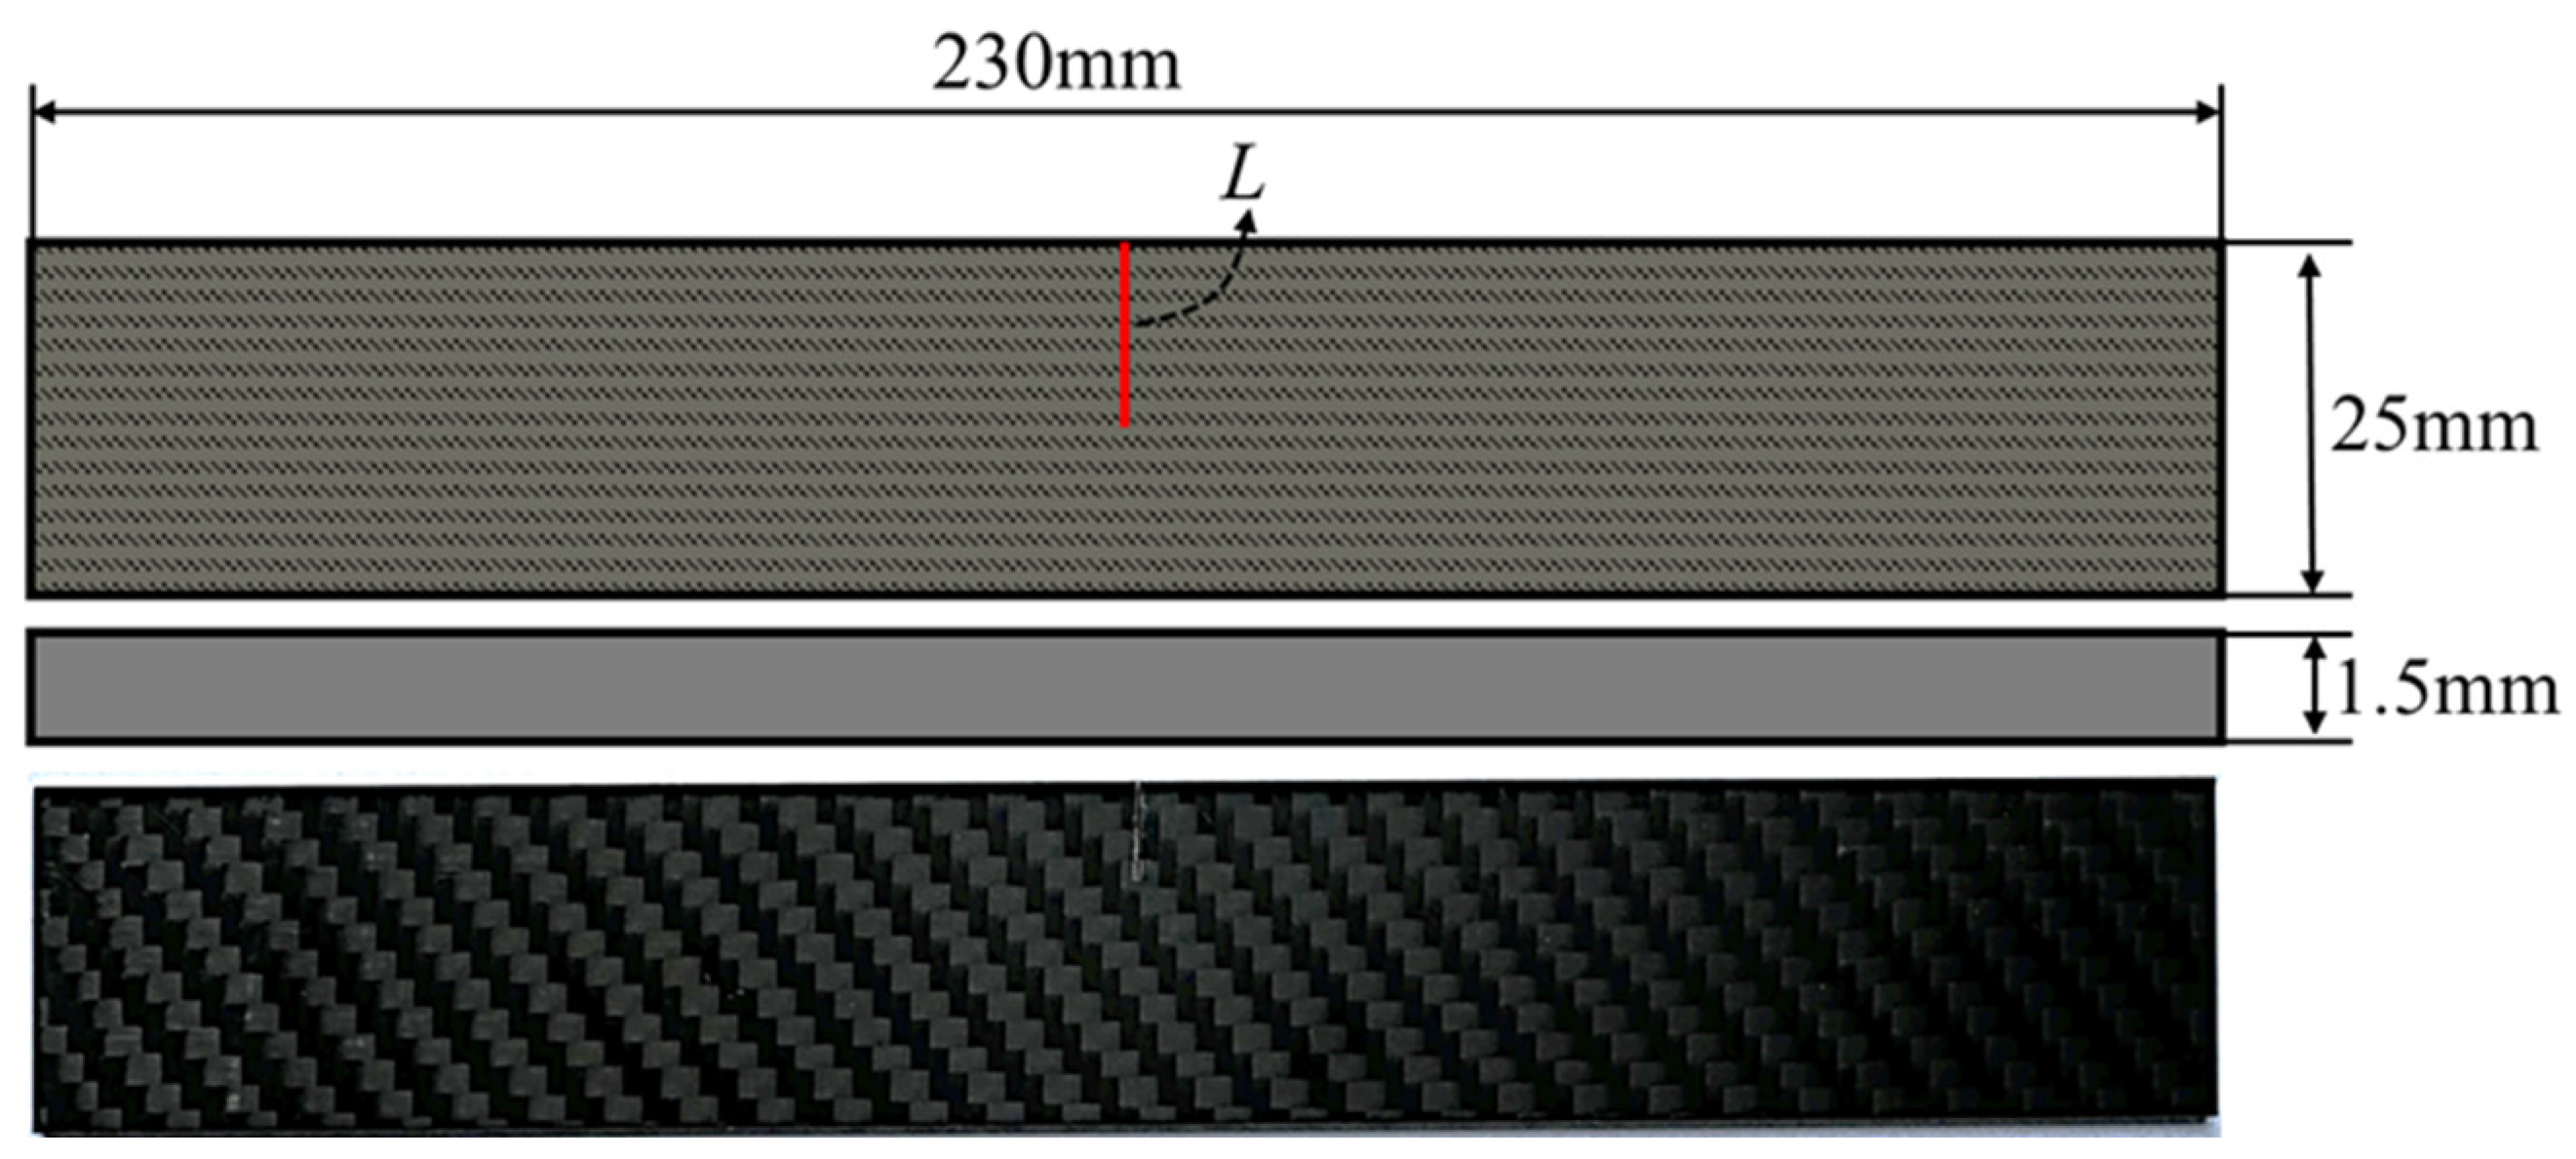
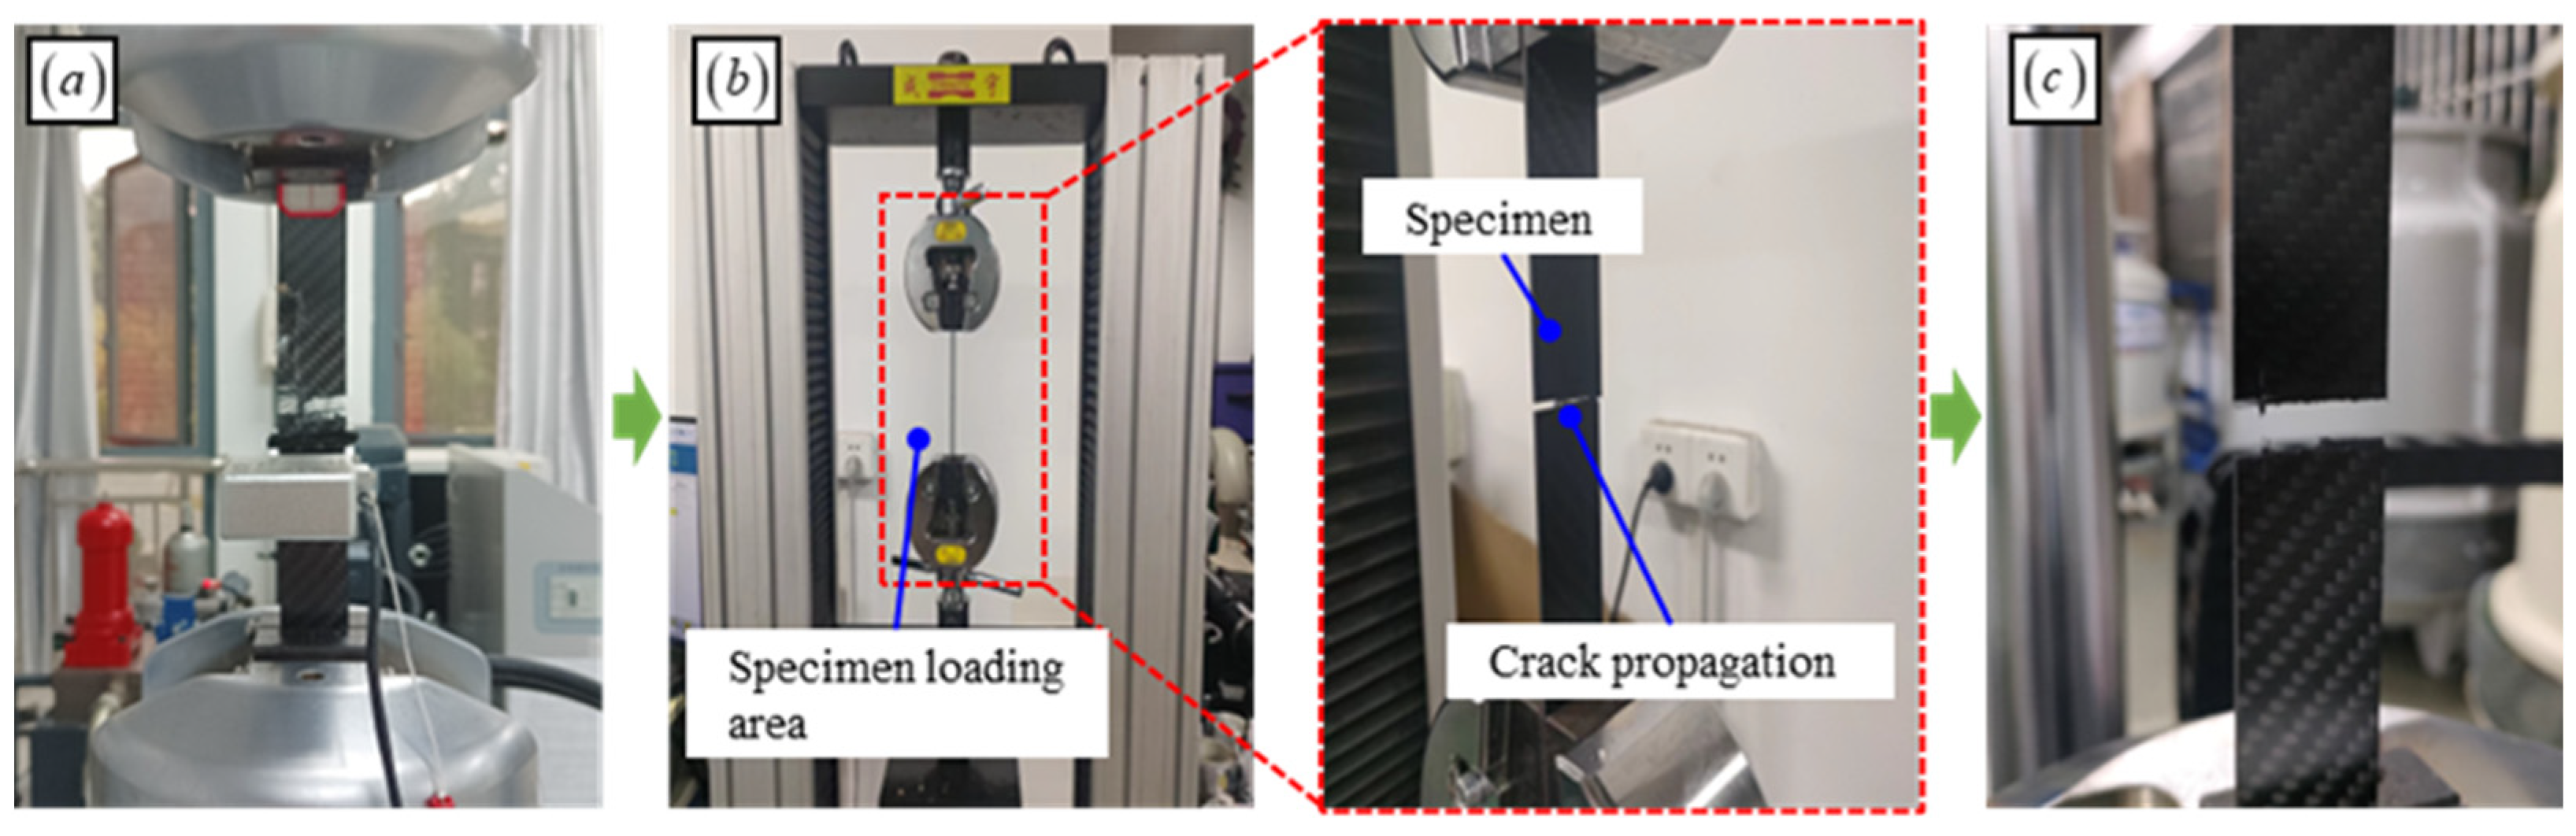
3.1. Experimental Method
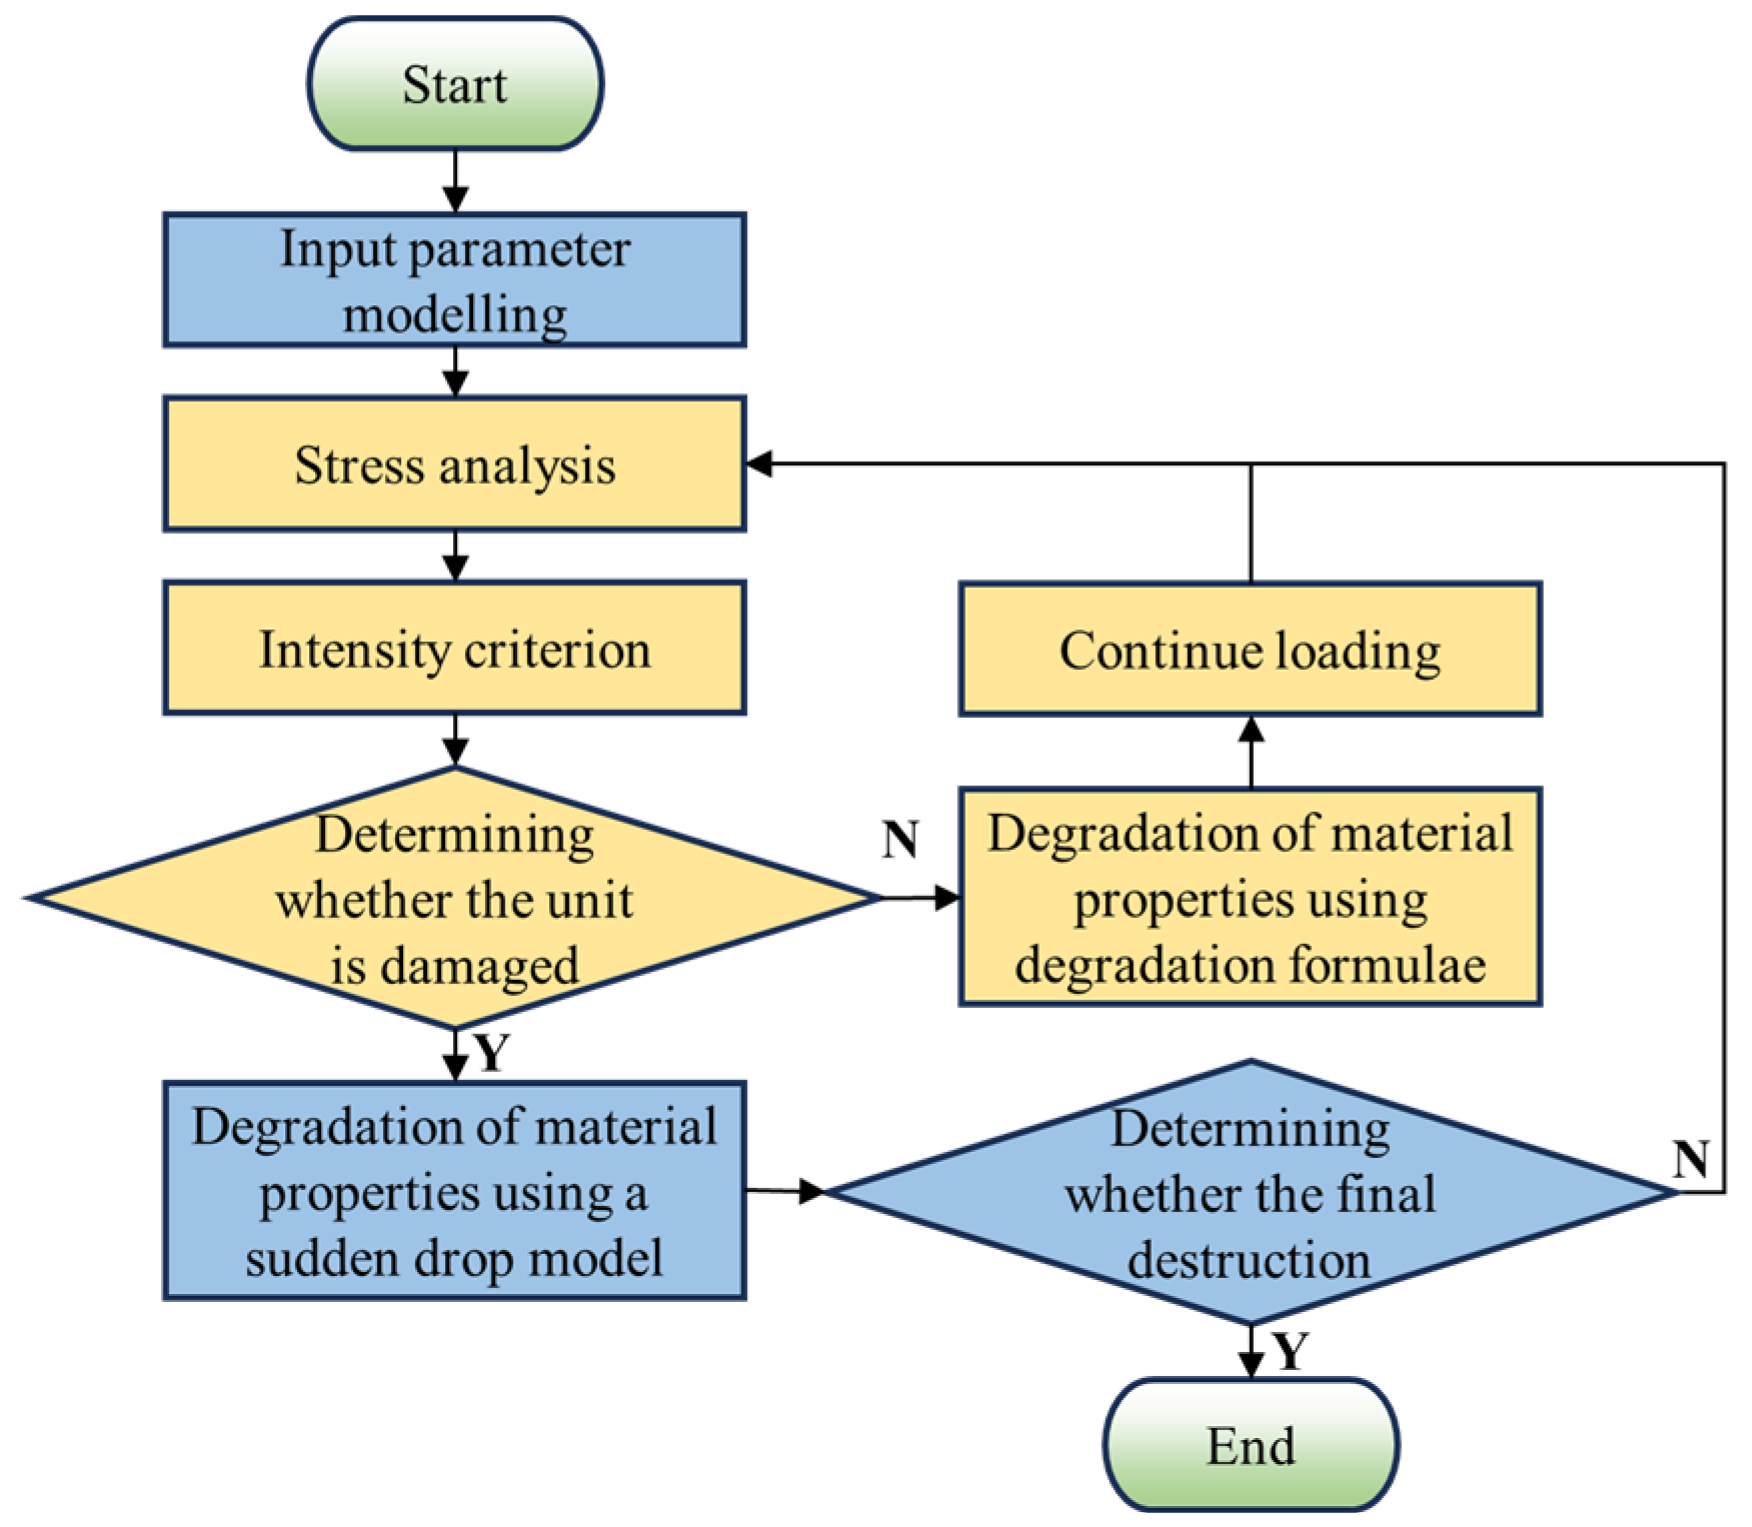
3.2. Simulation Method
- At the start of the increment step, the ABAQUS main program transfers the initial material properties, stress, strain, strain increment, and state variables to the UMAT;
- The UMAT subroutine calculates the stress at the end of the increment step based on the user-provided material constitutive model and updates the stress, strain, and state variables accordingly;
- At the end of the increment step, the UMAT transfers the stress, strain, and state variables back to the main program and provides the Jacobian matrix of the constitutive relationship to the ABAQUS main program to form the global stiffness matrix of the structure and determine whether the system has reached equilibrium;
- If the system is not balanced, the iteration is considered non-convergent, and the next iteration is performed until convergence is achieved, at which point the next increment step calculation begins.
3.3. Comparison and Discussion
4. Reliability Analysis of Carbon-Fiber Structures Based on Surrogate Sampling and Kriging Model
4.1. Uncertainty Analysis
4.2. Fatigue Life Prediction Method Based on Surrogate Model
4.3. Fatigue Reliability Modeling and Assessment
5. Sensitivity Analysis of Carbon-Fiber Structures Based on Surrogate Sampling and Kriging Model
6. Conclusions
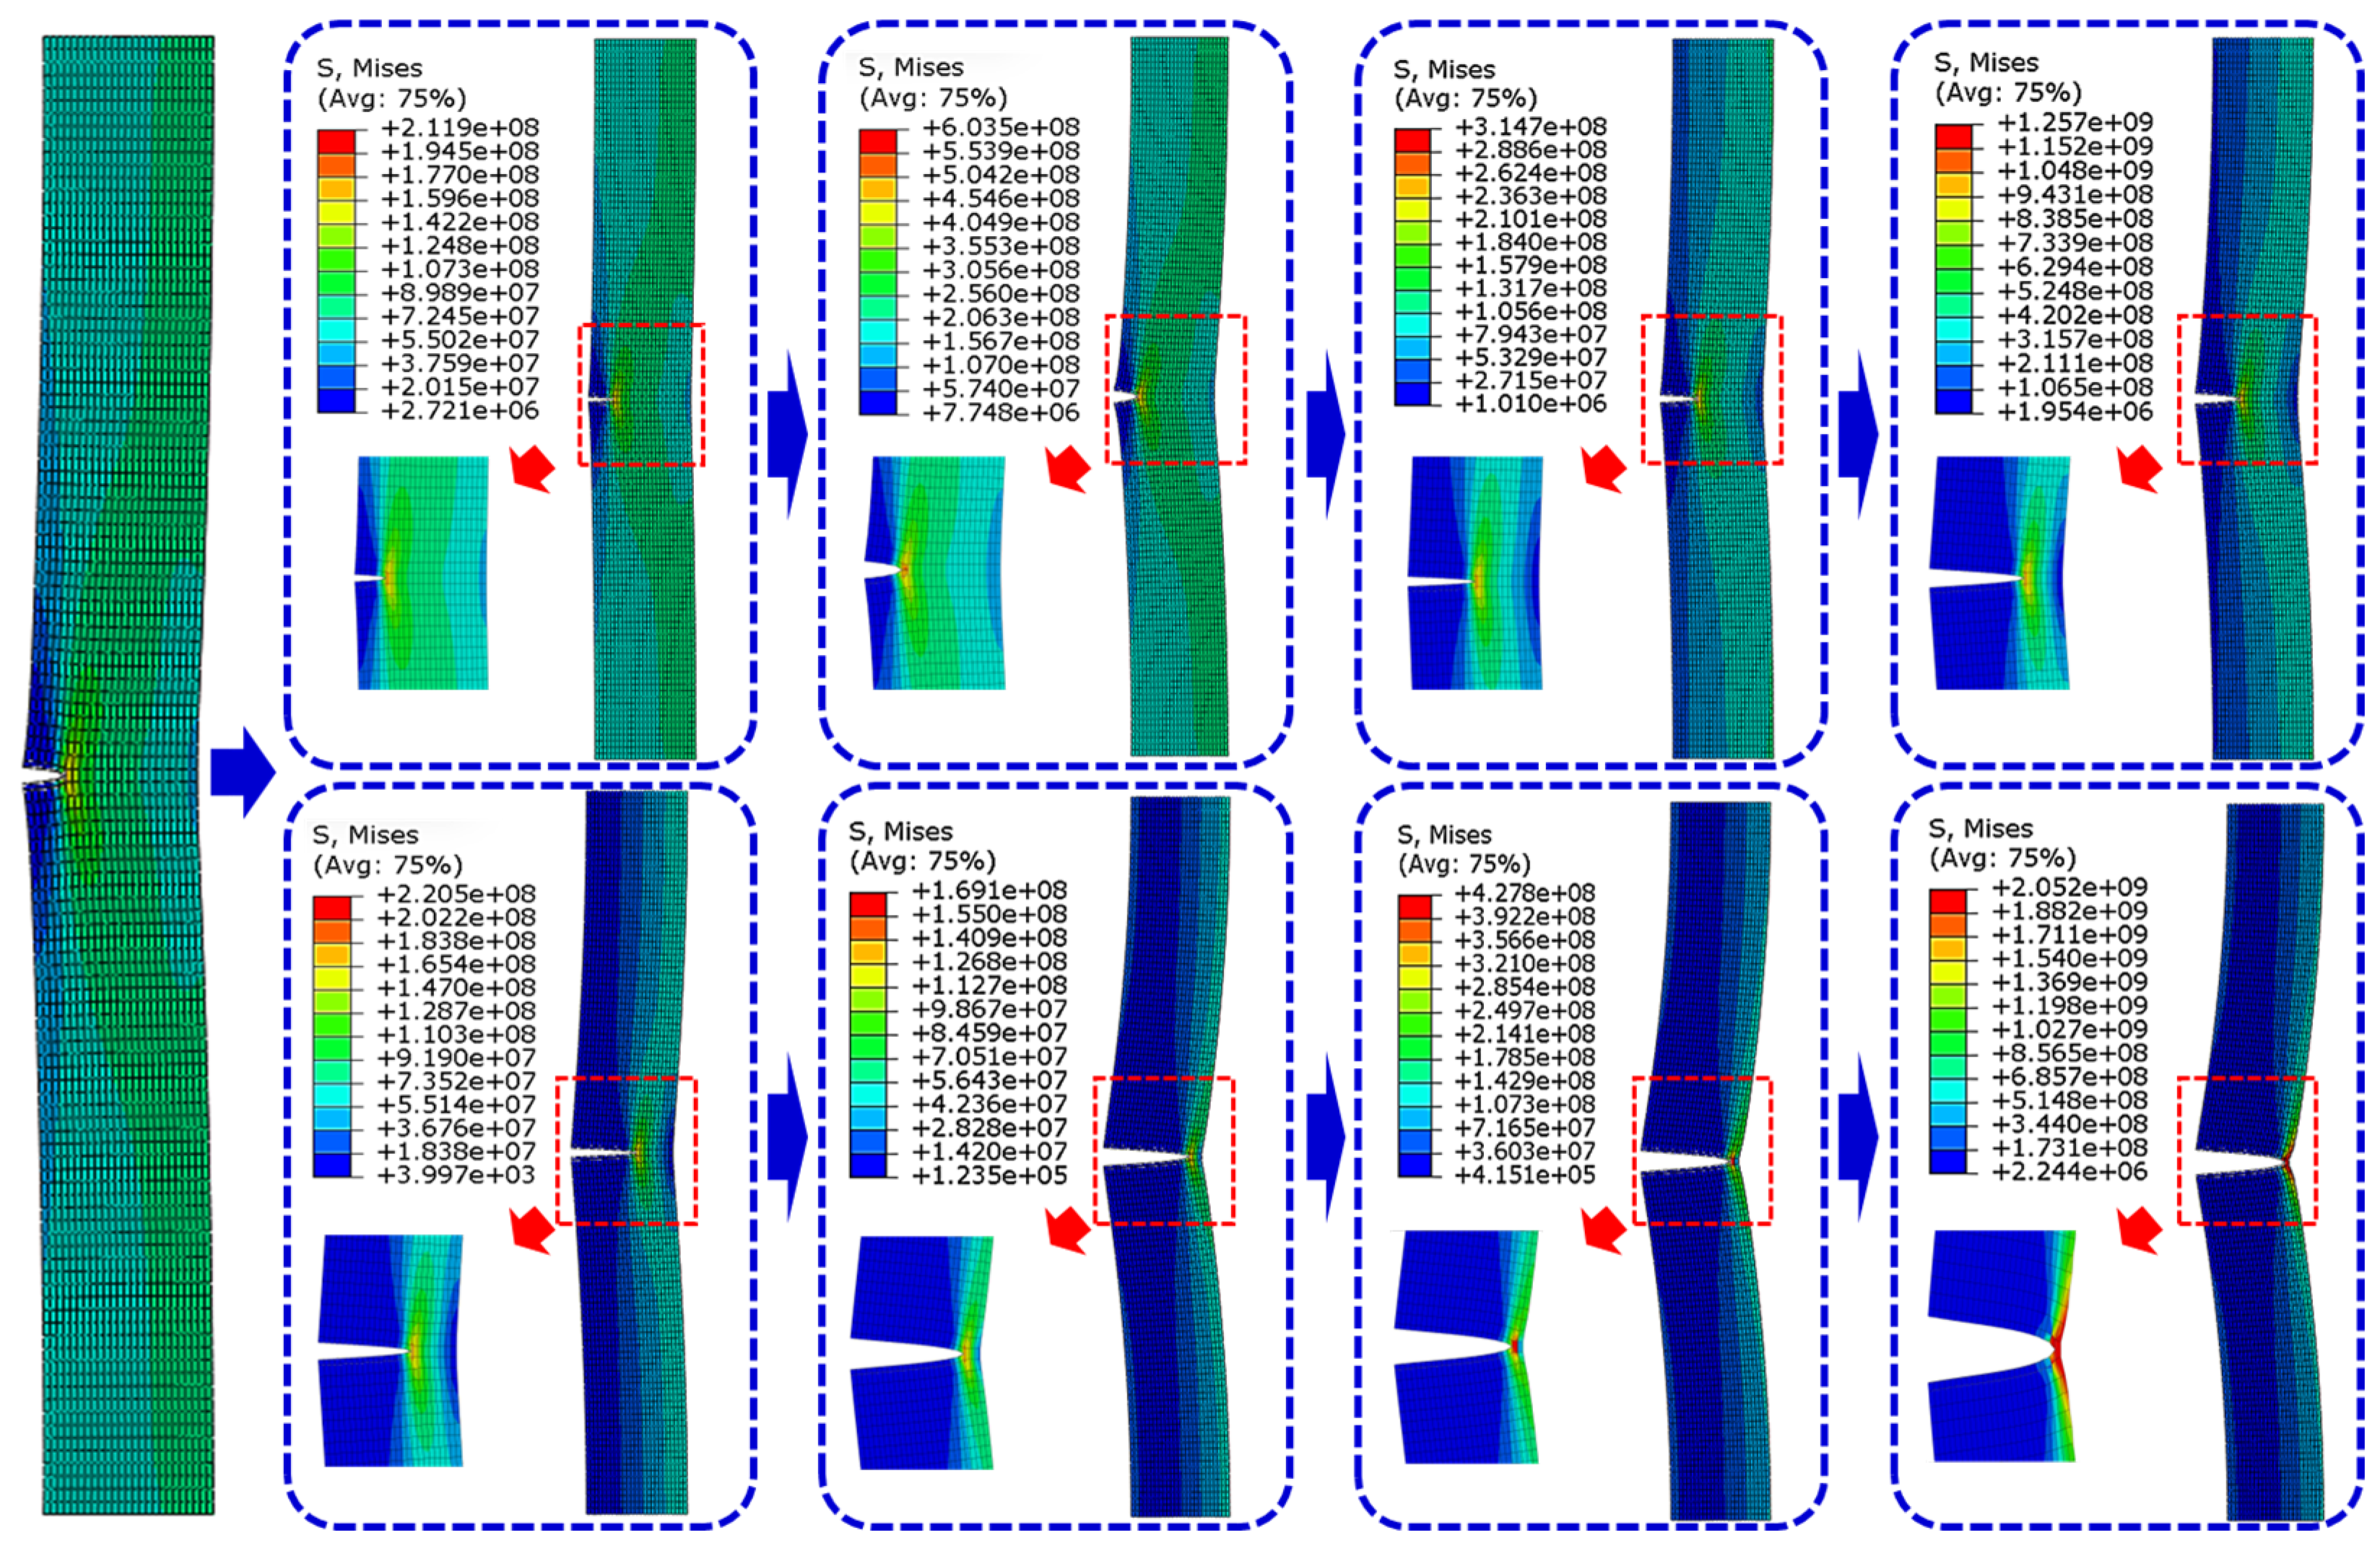
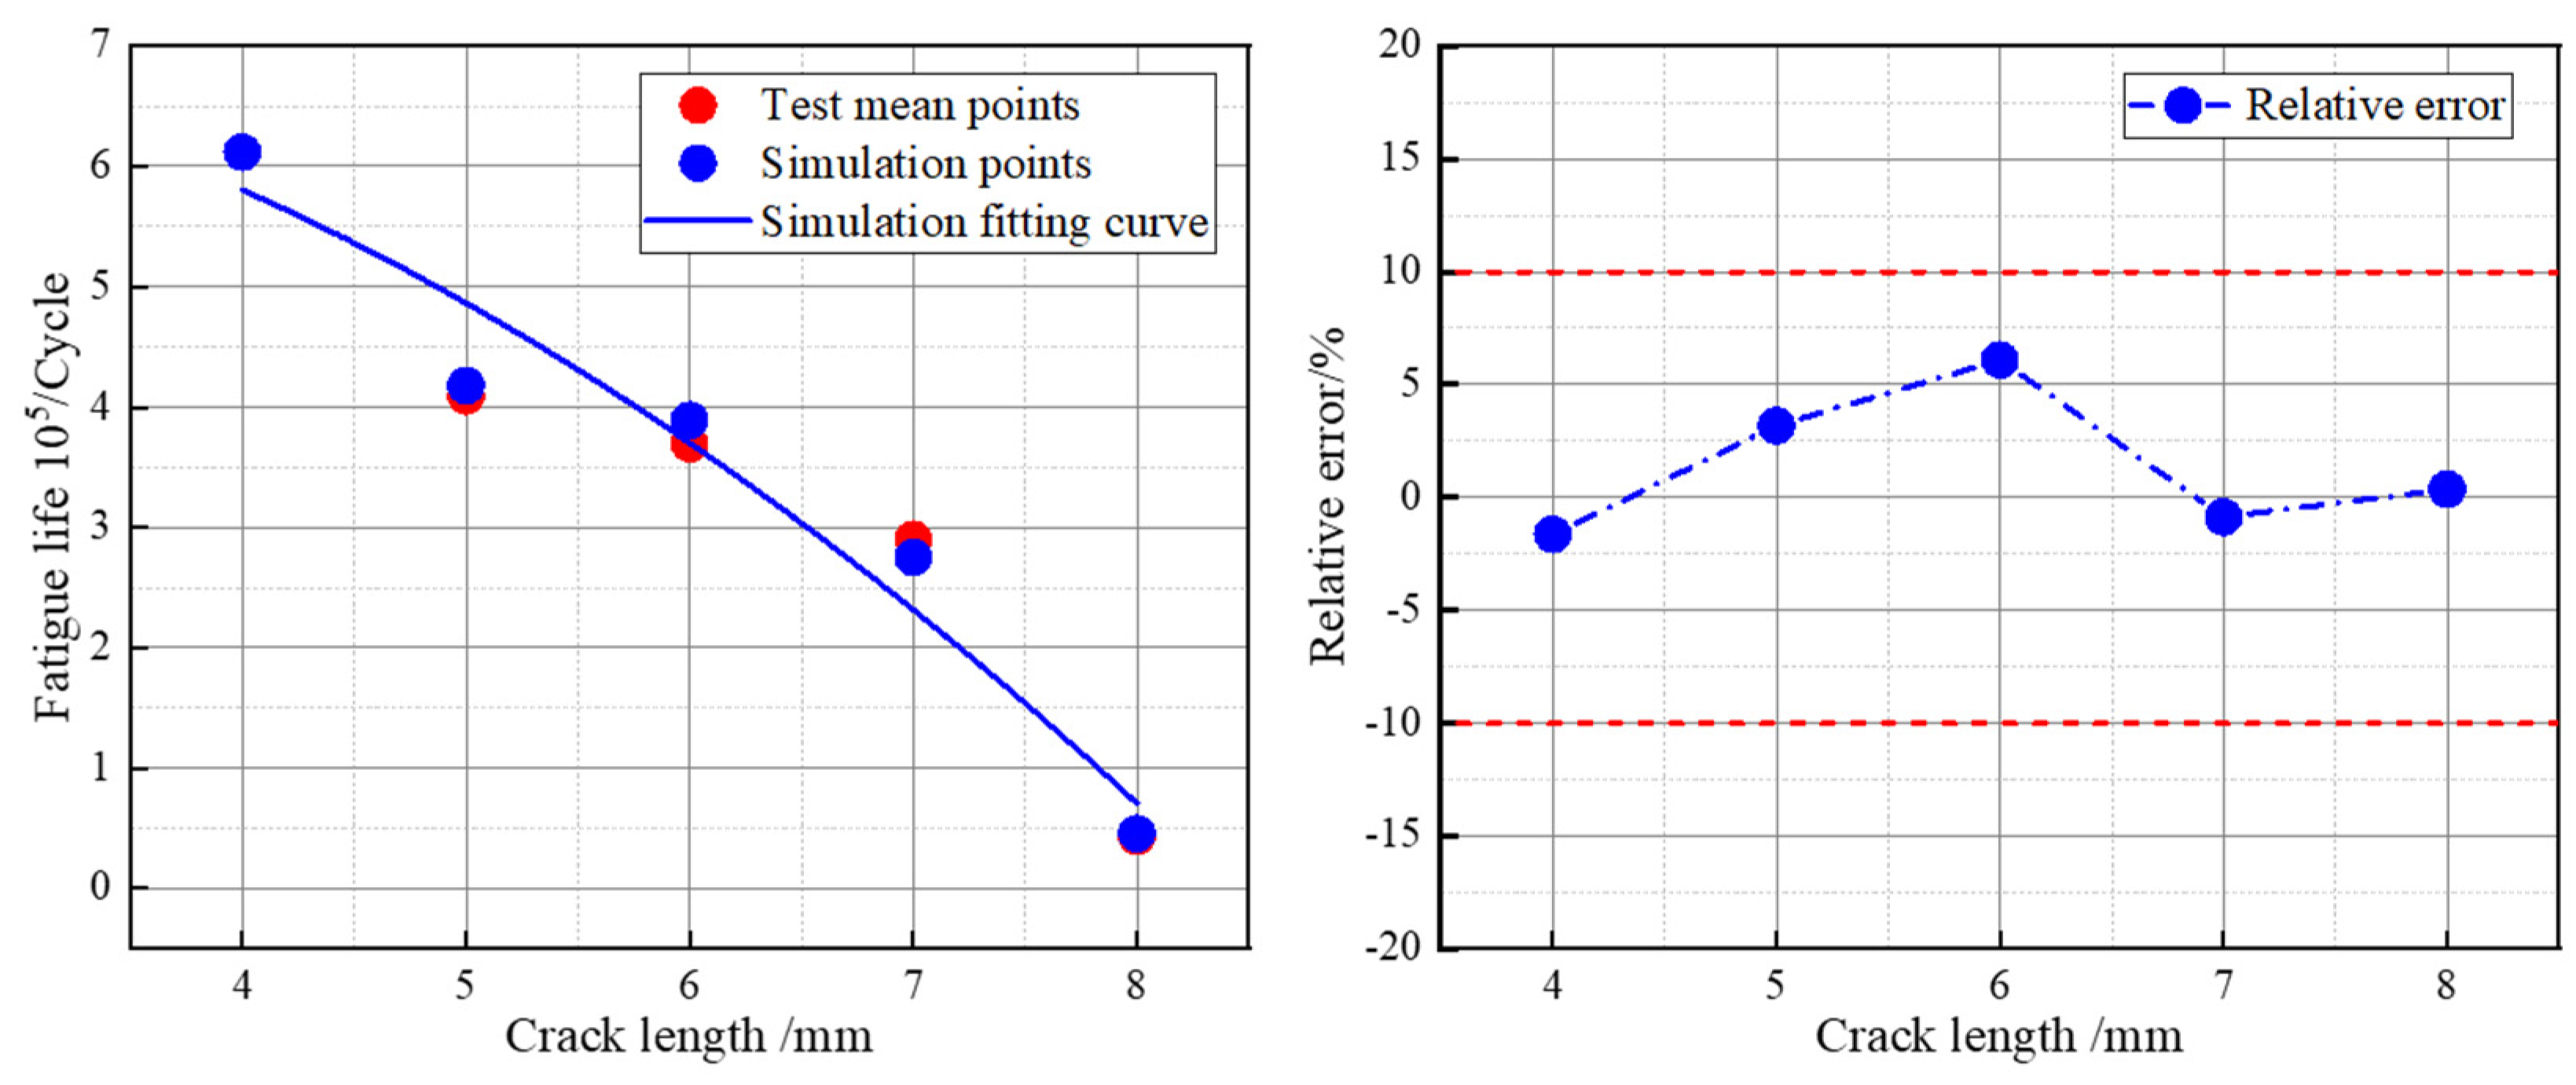
- Finite element simulations were conducted on cracked carbon-fiber laminates with a [0/90]4 ply sequence using simulation software and a UMAT subroutine. The results showed that stress concentration at the crack tip is the key reason for the failure of the carbon-fiber laminate. Comparative experiments indicated that the error in fatigue life prediction obtained from the simulation model is within 10%, demonstrating that the finite element simulation model can generate reliable response values for the training sample set, providing an accurate data foundation for subsequent sensitivity analysis.
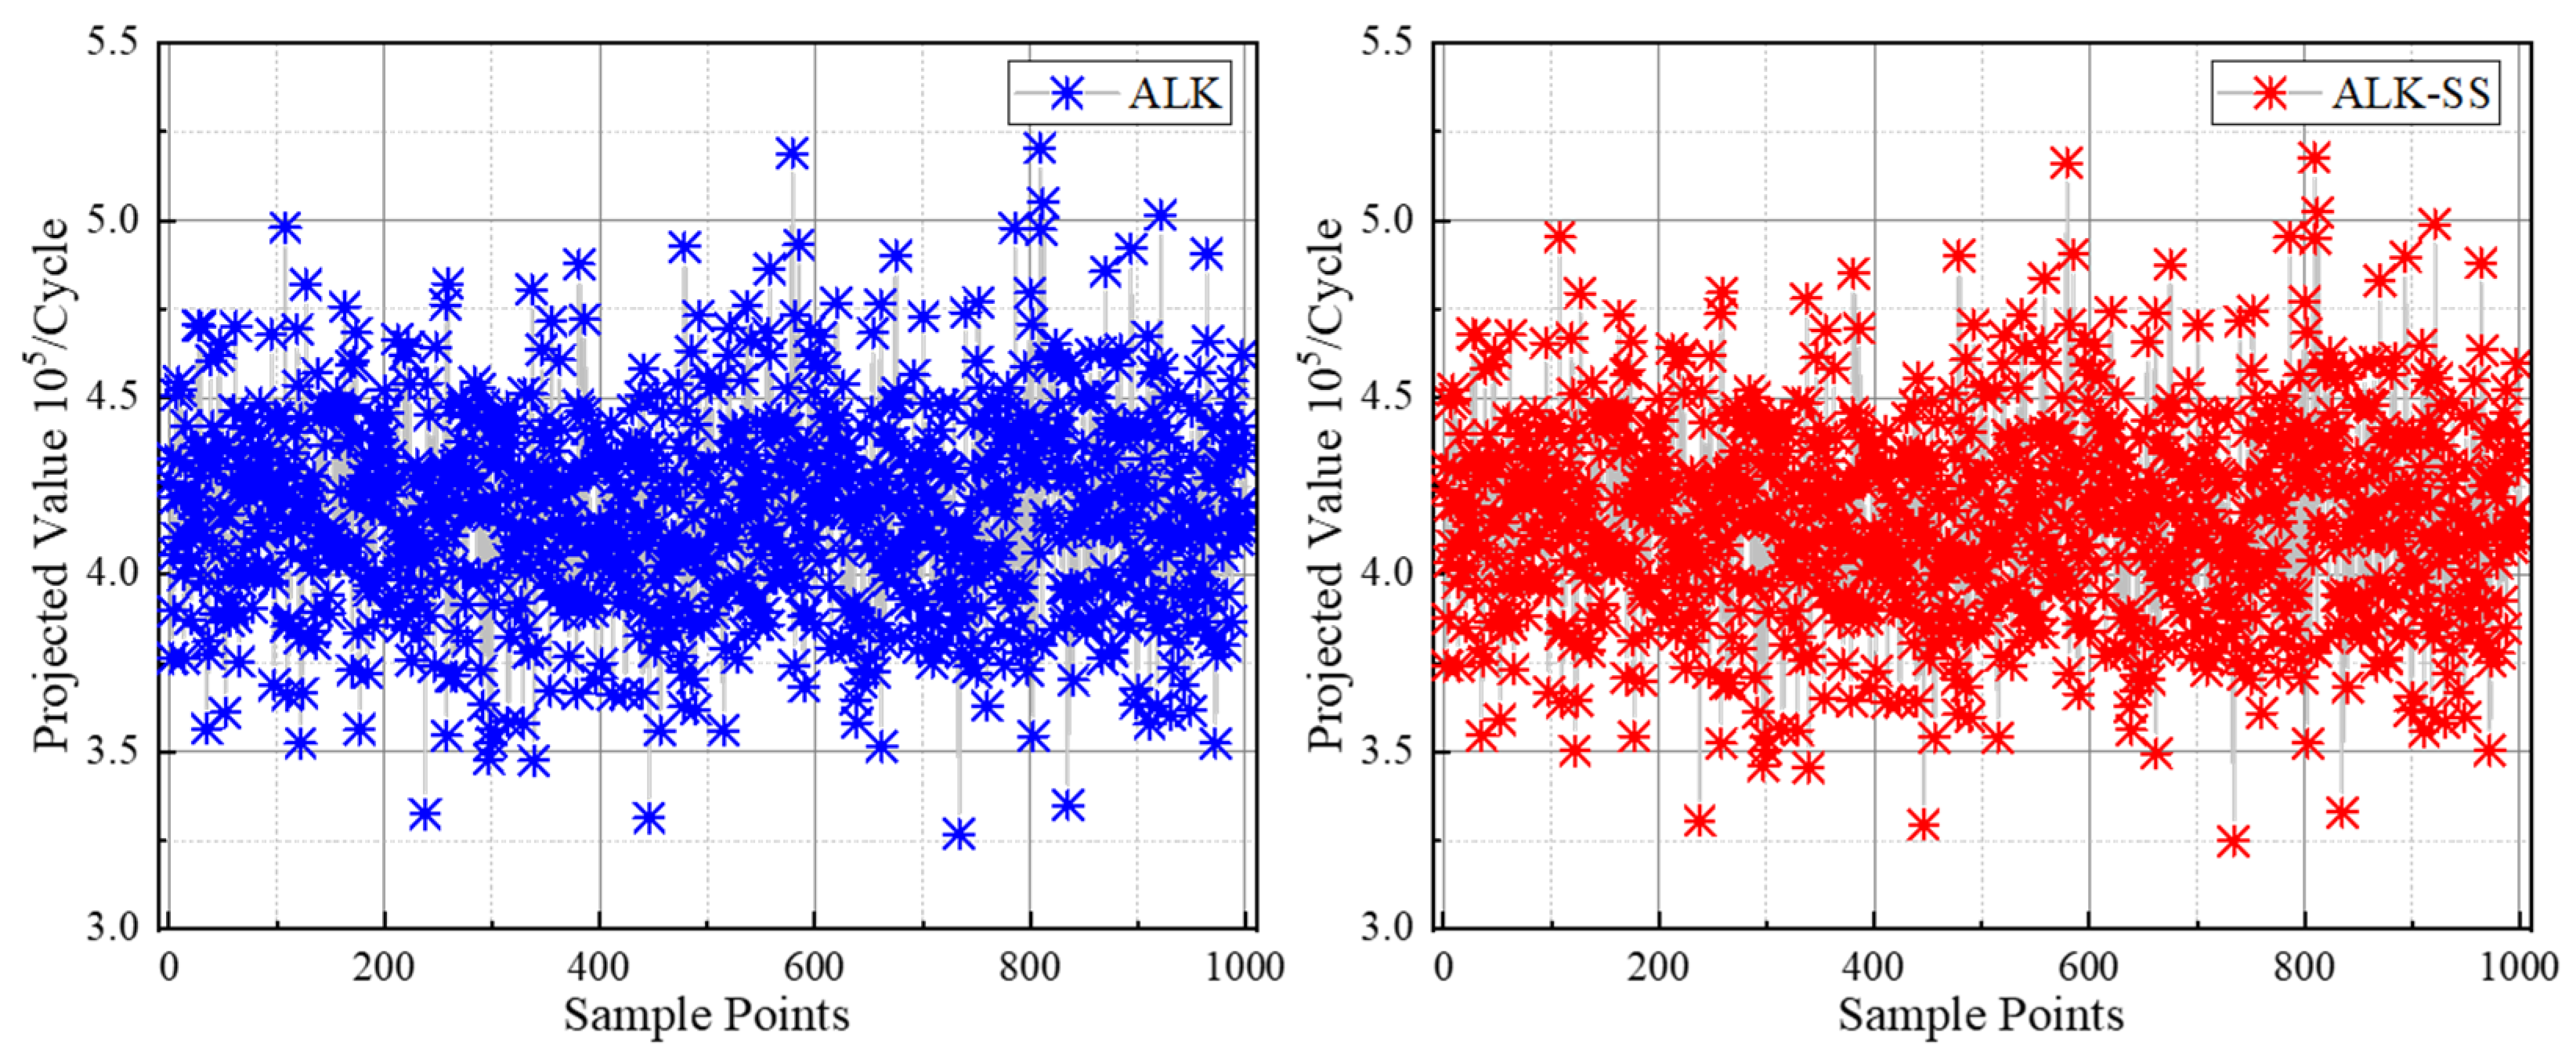
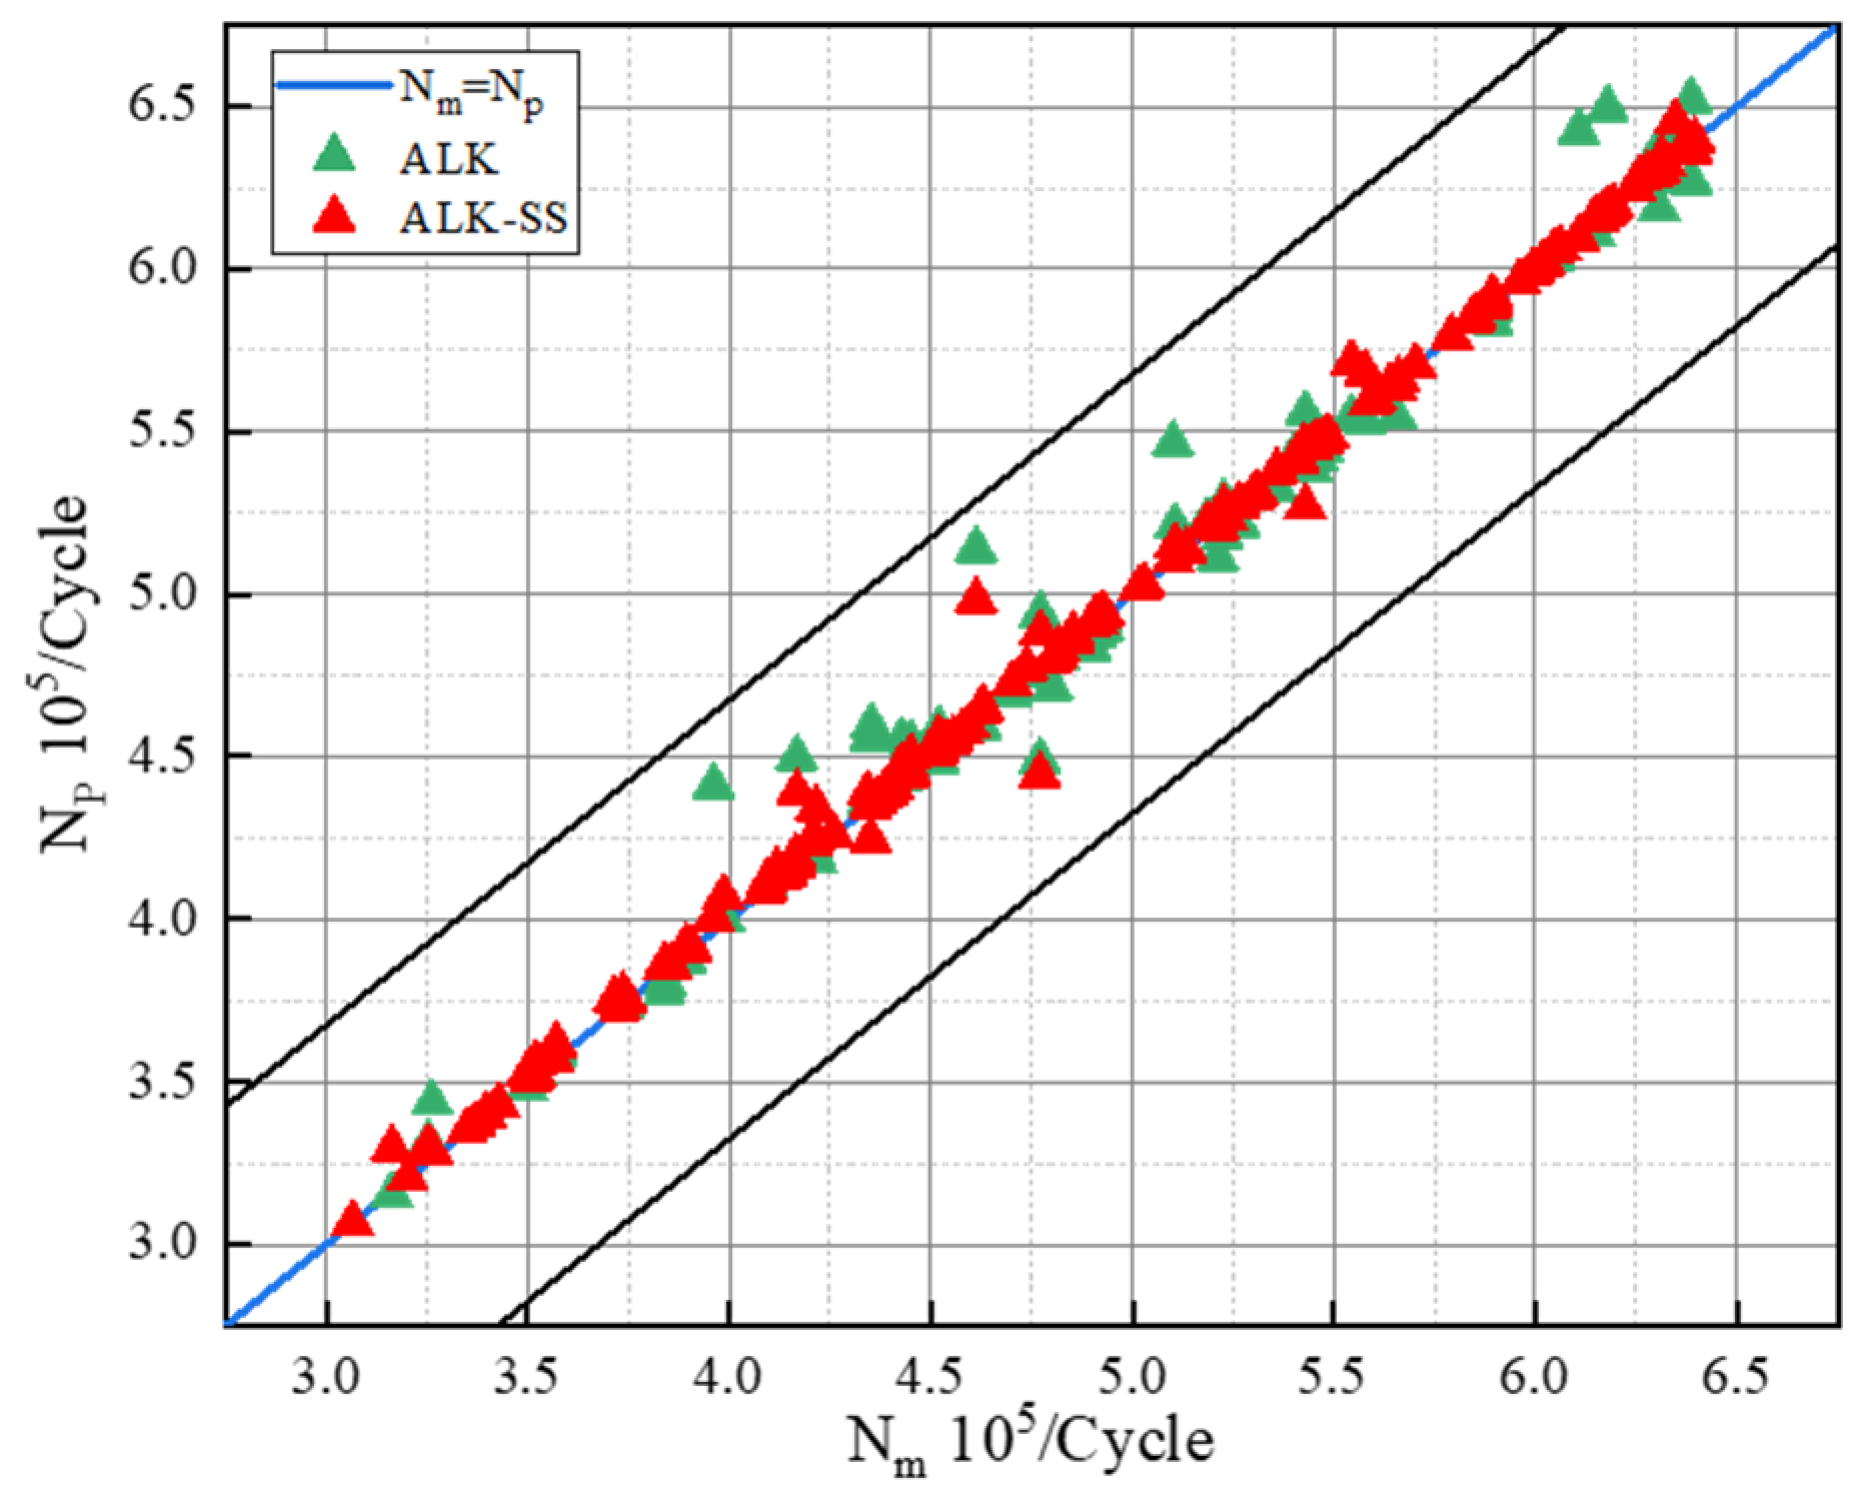
- By obtaining the true response values of the training samples from the simulation model, a fatigue life prediction model for cracked carbon-fiber structures based on the active learning Kriging (ALK) model was established. Combining surrogate sampling and the Kriging model to predict fatigue life data, the reliability function expression of cracked carbon-fiber structures was derived, and the reliability modeling and assessment of the fatigue life of cracked carbon-fiber structures were performed.
- Compared with traditional experimental and simulation methods, the ALK model improves the computational efficiency by introducing an active learning function while ensuring accuracy, overcoming the high computational cost of directly solving indices. The ALK method can establish a Kriging surrogate model between the distribution parameters and the output statistical characteristics using a small number of distribution parameter sample points, reducing the number of function calls. Based on this framework, the ALK-SS method further introduces the SS-PDF, improving the utilization rate of inner-layer input variable samples and significantly reducing the computational load of parameter sensitivity analysis while ensuring computational accuracy. As discussed in Appendix A, the proposed method not only incorporates uncertainties in both parameters and distributions but also significantly reduces computational costs by using Kriging with proxy sampling, making it more suitable for large-scale applications compared to previous works. Despite the advantages of this study, incorporating a broader variety of comparison models to further enhance the robustness of the conclusions, improve the fitting accuracy, and reduce the computational workload is a direction for future research.
Author Contributions
Funding
Institutional Review Board Statement
Informed Consent Statement
Data Availability Statement
Conflicts of Interest
Notations
| Output response | |
| Basic random input variables | |
| Subjective variables | |
| Probability density function | |
| Distribution parameters | |
| Probability density function | |
| Mean of the output | |
| Variance in the output | |
| Statistical characteristics | |
| First-order sensitivity coefficient | |
| Total first-order sensitivity coefficient | |
| The Kriging model to be determined | |
| Linear regression part | |
| Regression coefficient | |
| Normally distributed stochastic process | |
| Number of samples | |
| The correlation parameters | |
| Correlation function vector | |
| Learning function | |
| Update sample point | |
| Predicted value | |
| Actual response value | |
| The surrogate sampling probability density function | |
| The sample pool | |
| The initial training sample set | |
| Test distribution parameter samples | |
| The total variance | |
| The conditional output statistical characteristic values | |
| The conditional mean | |
| The variance in the conditional expectation | |
| E11, E22, E33 | Young’s modulus |
| v12, v13, v23 | Poisson’s ratio |
| G12, G13, G23 | Shear modulus |
| XT, XC; YT, YC; ZT, ZC | Strength |
| S12, S13, S23 | Fracture energy |
| L | Crack length |
| P | Load |
| SD | The standard deviation |
| The reliability expression | |
| The cumulative failure distribution function |
Appendix A
| Previous Works | Current Work |
| Reliable fatigue life prediction under stochastic loading, without considering distribution parameter uncertainties | The method proposed in this paper incorporates uncertainties in both parameters and distributions, thereby enhancing its predictive power. |
| High computational cost. | The method proposed in this paper reduces computational costs by combining Kriging with proxy sampling, making it suitable for large-scale applications. |
References
- Huang, H.Z.; Liu, Z.J.; Murthy, D.N.P. Optimal reliability, warranty and price for new products. IIE Trans. 2007, 39, 819–827. [Google Scholar] [CrossRef]
- Jureczko, M.; Mrówka, M. Multiobjective optimization of composite wind turbine blade. Materials 2022, 15, 4649. [Google Scholar] [CrossRef] [PubMed]
- Davis, M.; Dejesus, E.N.N.; Shekaramiz, M.; Zander, J.; Memari, M. Identification and localization of wind turbine blade faults using deep learning. Appl. Sci. 2024, 14, 6319. [Google Scholar] [CrossRef]
- Li, Y.F.; Huang, H.Z.; Mi, J.; Peng, W.; Han, X. Reliability analysis of multi-state systems with common cause failures based on Bayesian network and fuzzy probability. Ann. Oper. Res. 2019, 311, 195–209. [Google Scholar] [CrossRef]
- Ge, X.Y.; Bi, J.X.; Ma, H.; Wang, Y.; Jiao, J.M.; Wang, G.F. Reliability analysis of wind turbine blades based on numerical analysis and multi-fault competition failure. In Advances in Mechanical Design. ICMD 2023. Mechanisms and Machine Science; Springer: Singapore, 2024; pp. 1293–1311. [Google Scholar]
- Nie, Y.; Liu, Q.; Xiang, Z.; Zhong, S.; Huang, X. Performance and modification mechanism of recycled glass fiber of wind turbine blades and SBS Composite-Modified asphalt. Appl. Sci. 2023, 13, 6335. [Google Scholar] [CrossRef]
- Cao, Z.; Li, S.; Li, C.; Li, P.; Ko, T.J. Formation mechanism and detection and evaluation methods as well as repair technology of crack damage in fiber-reinforced composite wind turbine blade: A review. Int. J. Adv. Manuf. Technol. 2022, 120, 5649–5672. [Google Scholar] [CrossRef]
- Qian, H.M.; Huang, T.; Huang, H.Z. A single-loop strategy for time-variant system reliability analysis under multiple failure modes. Mech. Syst. Signal Process. 2021, 148, 107159. [Google Scholar] [CrossRef]
- Li, H.; Diaz, H.; Soares, C.G. A developed failure mode and effect analysis for floating offshore wind turbine support structures. Renew. Energy 2021, 164, 133–145. [Google Scholar] [CrossRef]
- Zhang, Y.; Zhang, Y.; Li, H.; Yan, L.; Wen, X.; Wang, H. Wind Turbine Blade Cracking Detection under Imbalanced Data Using a Novel Roundtrip Auto-Encoder Approach. Appl. Sci. 2023, 13, 11628. [Google Scholar] [CrossRef]
- Li, H.; Huang, C.G.; Soares, C.G. A real-time inspection and opportunistic maintenance strategies for floating offshore wind turbines. Ocean Eng. 2022, 256, 111433. [Google Scholar] [CrossRef]
- Babba, R.; Hebbache, K.; Douadi, A.; Boutlikht, M.; Hammouche, R.; Dahmani, S.; Del Serrone, G.; Moretti, L. Impact of silica sand on mechanical properties of epoxy resin composites and their application in CFRP–Concrete bonding. Appl. Sci. 2024, 14, 6599. [Google Scholar] [CrossRef]
- Kumar, P.K.A.V.; Dean, A.; Reinoso, J.; Paggi, M. A multi phase-field-cohesive zone model for laminated composites: Application to delamination migration. Compos. Struct. 2021, 276, 114471. [Google Scholar] [CrossRef]
- Esfarjani, A.A.; Nazari, M.B.; Bayat, S.H. Dynamic crack propagation in variable stiffness composite laminates under thermal shock. Theor. Appl. Fract. Mech. 2024, 130, 104325. [Google Scholar] [CrossRef]
- Pournoori, N.; Rodera, O.; Jokinen, J.; Hokka, M.; Kanerva, M. Failure prediction for high-strain rate and out-of-plane compression of fibrous composites. Compos. Sci. Technol. 2022, 218, 109141. [Google Scholar] [CrossRef]
- Xie, C.; Cao, M.; Guan, J.; Liu, Z.; Khan, M. Improvement of boundary effect model in multi-scale hybrid fibers reinforced cementitious composite and prediction of its structural failure behavior. Compos. Part B Eng. 2021, 224, 109219. [Google Scholar] [CrossRef]
- Al-Fasih, M.Y.; Kueh, A.B.H.; Ibrahim, M.H.W. Failure behavior of sandwich honeycomb composite beam containing crack at the skin. PLoS ONE 2020, 15, e0227895. [Google Scholar]
- Pan, C.; Dai, Y.; Li, Y. Simulation study of crack parameters’ effects on the vibration characteristics of a bladed disk system. J. Vibroeng. 2023, 25, 1273–1284. [Google Scholar] [CrossRef]
- Chen, Z.; Dai, Y.; Liu, Y. Crack propagation simulation and overload fatigue life prediction via enhanced physics-informed neural networks. Int. J. Fatigue 2024, 186, 108382. [Google Scholar] [CrossRef]
- Ferrarese, A.; Niutta, C.B.; Ciampaglia, A.; Paolino, D.S. A statistical mesoscale approach to model the size effect on the tensile strength of notched woven composites. Appl. Sci. 2024, 14, 3467. [Google Scholar] [CrossRef]
- Antoniadis, A.; Lambert-Lacroix, S.; Poggi, J.M. Random forests for global sensitivity analysis: A selective review. Reliab. Eng. Syst. Saf. 2021, 206, 107312. [Google Scholar] [CrossRef]
- Lamboni, M.; Kucherenko, S. Multivariate sensitivity analysis and derivative-based global sensitivity measures with dependent variables. Reliab. Eng. Syst. Saf. 2021, 212, 107519. [Google Scholar] [CrossRef]
- Fei, C.W.; Li, H.; Lu, C.; Han, L.; Keshtegar, B.; Taylan, O. Vectorial surrogate modeling method for multi-objective reliability design. Appl. Math. Model. 2022, 109, 1–20. [Google Scholar] [CrossRef]
- Khorramian, K.; Oudah, F. New learning functions for active learning Kriging reliability analysis using a probabilistic approach: KO and WKO functions. Struct. Multidiscip. Optim. 2023, 66, 177. [Google Scholar] [CrossRef]
- Yang, S.; Lee, M.; Lee, I. A new sampling approach for system reliability-based design optimization under multiple simulation models. Reliab. Eng. Syst. Saf. 2023, 231, 109024. [Google Scholar] [CrossRef]
- Li, H.; Soares, C.G. Assessment of failure rates and reliability of floating offshore wind turbines. Reliab. Eng. Syst. Saf. 2022, 228, 108777. [Google Scholar] [CrossRef]
- Wang, Z.; Jia, G. Augmented sample-based approach for efficient evaluation of risk sensitivity with respect to epistemic uncertainty in distribution parameters. Reliab. Eng. Syst. Saf. 2020, 197, 106783. [Google Scholar] [CrossRef]
- Meng, X.; Liu, J.; Cao, L.; Yu, Z.; Yang, D. A general frame for uncertainty propagation under multimodally distributed random variables. Comput. Methods Appl. Mech. Eng. 2020, 367, 113109. [Google Scholar] [CrossRef]
- He, J.; Guan, X. Uncertainty Sensitivity Analysis for Reliability Problems with Parametric Distributions. IEEE Trans. Reliab. 2017, 66, 712–721. [Google Scholar] [CrossRef]
- Nannapaneni, S.; Mahadevan, S. Reliability analysis under epistemic uncertainty. Reliab. Eng. Syst. Saf. 2016, 155, 9–20. [Google Scholar] [CrossRef]
- Brockhoff, D.; Tušar, T.; Auger, A.; Hansen, N. Using Well-Understood Single-Objective functions in multiobjective Black-Box optimization test suites. Evol. Comput. 2022, 30, 165–193. [Google Scholar] [CrossRef]
- Jing, G.; Zhao, L.; Ma, T.; Han, Y.; Chen, G.; Wang, J.; Tong, Q. Failure analysis and pin hole profile optimization design of combined piston for marine diesel engine based on Kriging model and NSGA-Ⅱ algorithm. Eng. Fail. Anal. 2024, 163, 108505. [Google Scholar] [CrossRef]
- Qian, H.M.; Wei, J.; Huang, H.Z. Structural fatigue reliability analysis based on active learning Kriging model. Int. J. Fatigue 2023, 172, 107639. [Google Scholar] [CrossRef]
- Qian, H.M.; Li, Y.F.; Huang, H.Z. Time-variant system reliability analysis method for a small failure probability problem. Reliab. Eng. Syst. Saf. 2021, 205, 107261. [Google Scholar] [CrossRef]
- Jena, J.; Singh, I.V.; Gaur, V. XFEM for semipermeable crack in piezoelectric material with Maxwell stress. Eng. Fract. Mech. 2023, 285, 109281. [Google Scholar] [CrossRef]
- Moustapha, M.; Marelli, S.; Sudret, B. Active learning for structural reliability: Survey, general framework and benchmark. Struct. Saf. 2022, 96, 102174. [Google Scholar] [CrossRef]
- Li, L.; Lu, Z. A new algorithm for importance analysis of the inputs with distribution parameter uncertainty. Int. J. Syst. Sci. 2015, 47, 3065–3077. [Google Scholar] [CrossRef]
- Thomoglou, A.K.; Falara, M.G.; Gkountakou, F.I.; Elenas, A.; Chalioris, C.E. Influence of different surfactants on carbon fiber dispersion and the mechanical performance of smart piezoresistive cementitious composites. Fibers 2022, 10, 49. [Google Scholar] [CrossRef]
- Pozegic, T.R.; Huntley, S.; Longana, M.L.; He, S.; Bandara, R.I.; King, S.G.; Hamerton, I. Improving dispersion of recycled discontinuous carbon fibres to increase fibre throughput in the HIPERDIF process. Materials 2020, 13, 1544. [Google Scholar] [CrossRef]
- Hadianfard, M.A.; Malekpour, S.; Momeni, M. Reliability analysis of H-section steel columns under blast loading. Struct. Saf. 2018, 75, 45–56. [Google Scholar] [CrossRef]


| Material Properties | Value |
|---|---|
| Young’s modulus | E11 = 105.5 GPa; E22 = E33 = 7.2 GPa |
| Poisson’s ratio | v12 = v13 = 0.34; v23 = 0.378 |
| Shear modulus | G12 = G13 = 3.4 GPa; G23 = 2.520 GPa |
| Strength | XT = 1060 MPa; XC = 657 MPa; YT = 694 MPa; YC = 651 MPa; ZT = 75 MPa; ZC = 165 MPa |
| Fracture energy | S12 = 108 MPa; S13 = S23 = 81.1 MPa |
| L/mm | P/KN | Experimental Result/105 | Mean Value/105 | SD/105 | CV | ||||
|---|---|---|---|---|---|---|---|---|---|
| 1 | 2 | 3 | 4 | 5 | |||||
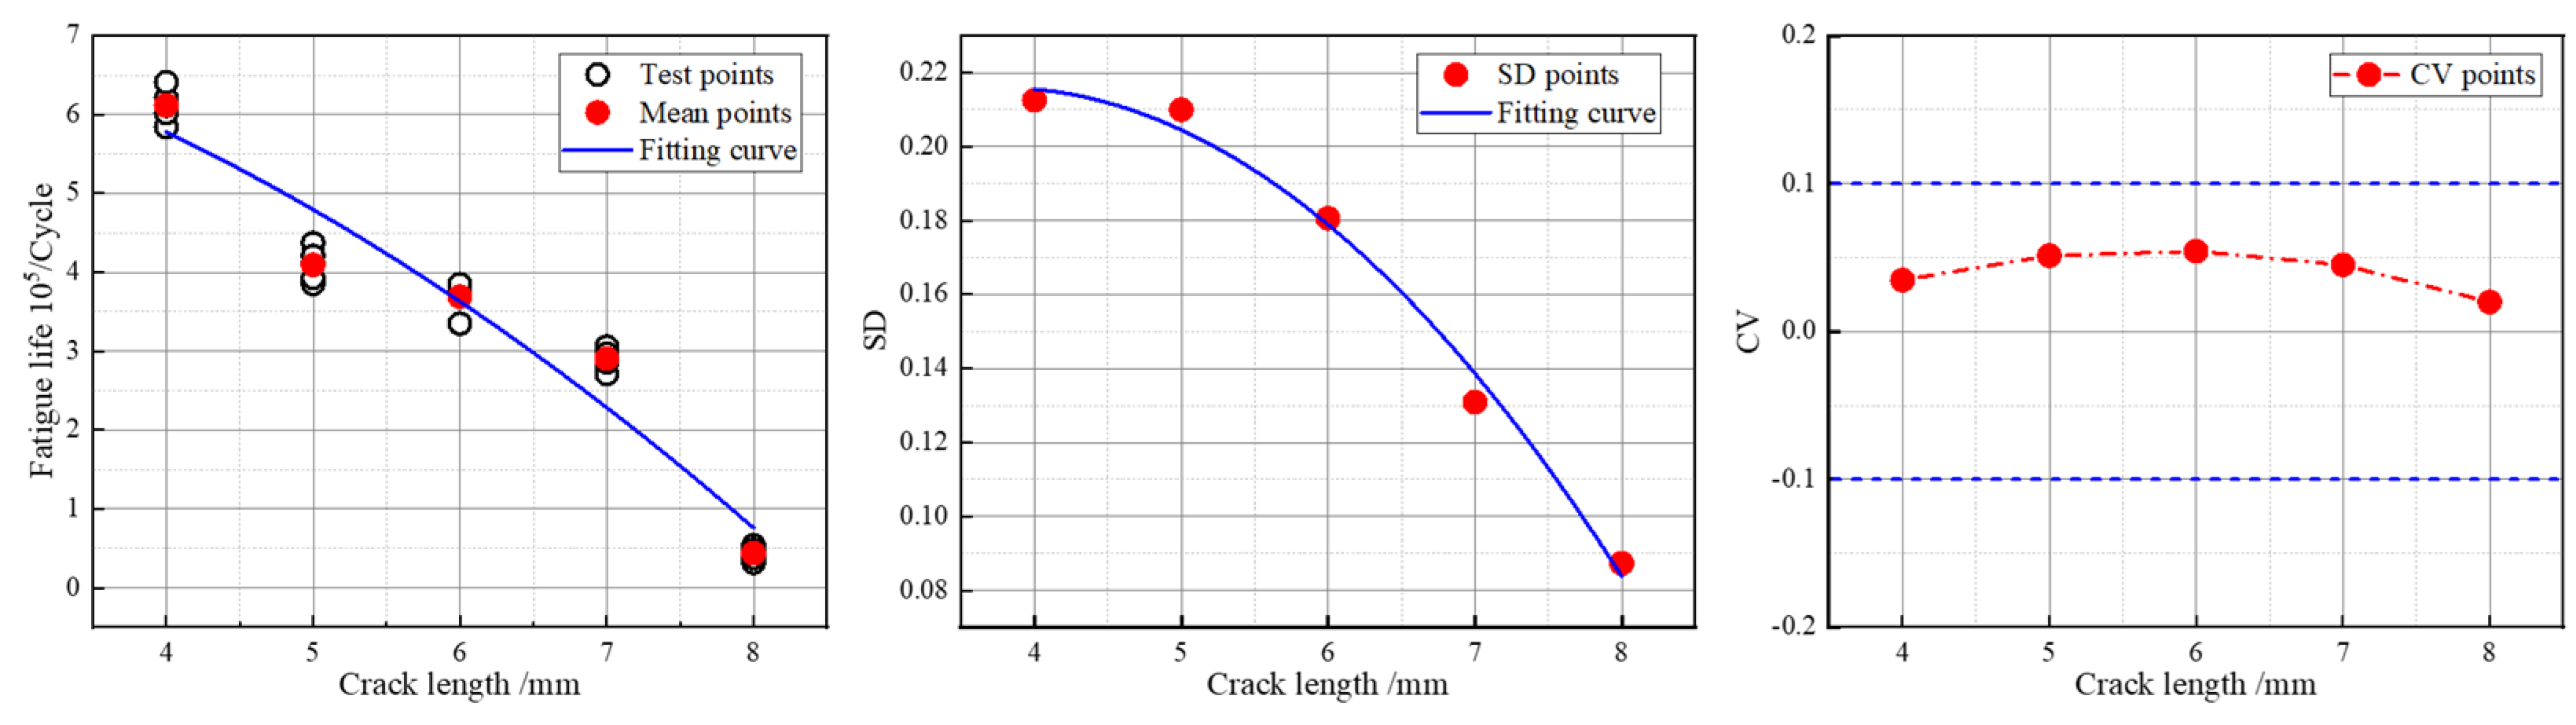
| 4 | 9.5 | 5.84 | 6.21 | 6.41 | 6.02 | 6.11 | 6.11684 | 0.21 | 0.04 |
| 5 | 3.85 | 3.93 | 4.37 | 4.11 | 4.21 | 4.09344 | 0.21 | 0.05 | |
| 6 | 3.74 | 3.35 | 3.83 | 3.71 | 3.85 | 3.69575 | 0.18 | 0.03 | |
| 7 | 2.71 | 3.06 | 2.86 | 2.92 | 2.97 | 2.90287 | 0.13 | 0.05 | |
| 8 | 0.54 | 0.48 | 0.47 | 0.32 | 0.38 | 0.43478 | 0.09 | 0.02 | |
| L/mm | P/KN | Experimental Result/105 | Simulation Result/105 | Relative Error/% |
|---|---|---|---|---|
| 4 | 9.5 | 6.11684 | 6.11661 | −1.64 |
| 5 | 4.09344 | 4.17888 | 3.17 | |
| 6 | 3.69575 | 3.89040 | 6.09 | |
| 7 | 2.90287 | 2.75049 | −0.87 | |
| 8 | 0.43478 | 0.45769 | 0.36 |
| Random Variable | Mean Value | SD | Random Variable | Mean Value | SD |
|---|---|---|---|---|---|
| E11 (GPa) | 5.275 | XC (MPa) | 32.85 | ||
| E22 (GPa) | 0.36 | YT (MPa) | 34.7 | ||
| E33 (GPa) | 0.36 | YC (MPa) | 32.55 | ||
| v12 | 0.017 | ZT (MPa) | 3.75 | ||
| v13 | 0.017 | ZC (MPa) | 8.25 | ||
| v23 | 0.0189 | S12 (MPa) | 5.4 | ||
| G12 (GPa) | 0.17 | S13 (MPa) | 4.055 | ||
| G13 (GPa) | 0.17 | S23 (MPa) | 4.055 | ||
| G23 (GPa) | 0.126 | L (mm) | 0.25 | ||
| XT (MPa) | 53 | P (KN) | 0.475 |
| Random Variable | Mean Value | SD | Random Variable | Mean Value | SD |
|---|---|---|---|---|---|
| E11 | 105.5 | 0.05 | XC | 657 | 0.05 |
| E22 | 7.2 | YT | 694 | ||
| E33 | 7.2 | YC | 651 | ||
| v12 | 0.34 | ZT | 75 | ||
| v13 | 0.34 | ZC | 165 | ||
| v23 | 0.378 | S12 | 108 | ||
| G12 | 3.4 | S13 | 81.1 | ||
| G13 | 3.4 | S23 | 81.1 | ||
| G23 | 2.520 | L | 5 | ||
| XT | 1060 | P | 9.5 |
| Method | Sample Size | |
|---|---|---|
| FEA | — | 2000+ |
| ALK model | 0.98232 | 97 |
| ALK-SS model | 0.99627 | 43 |
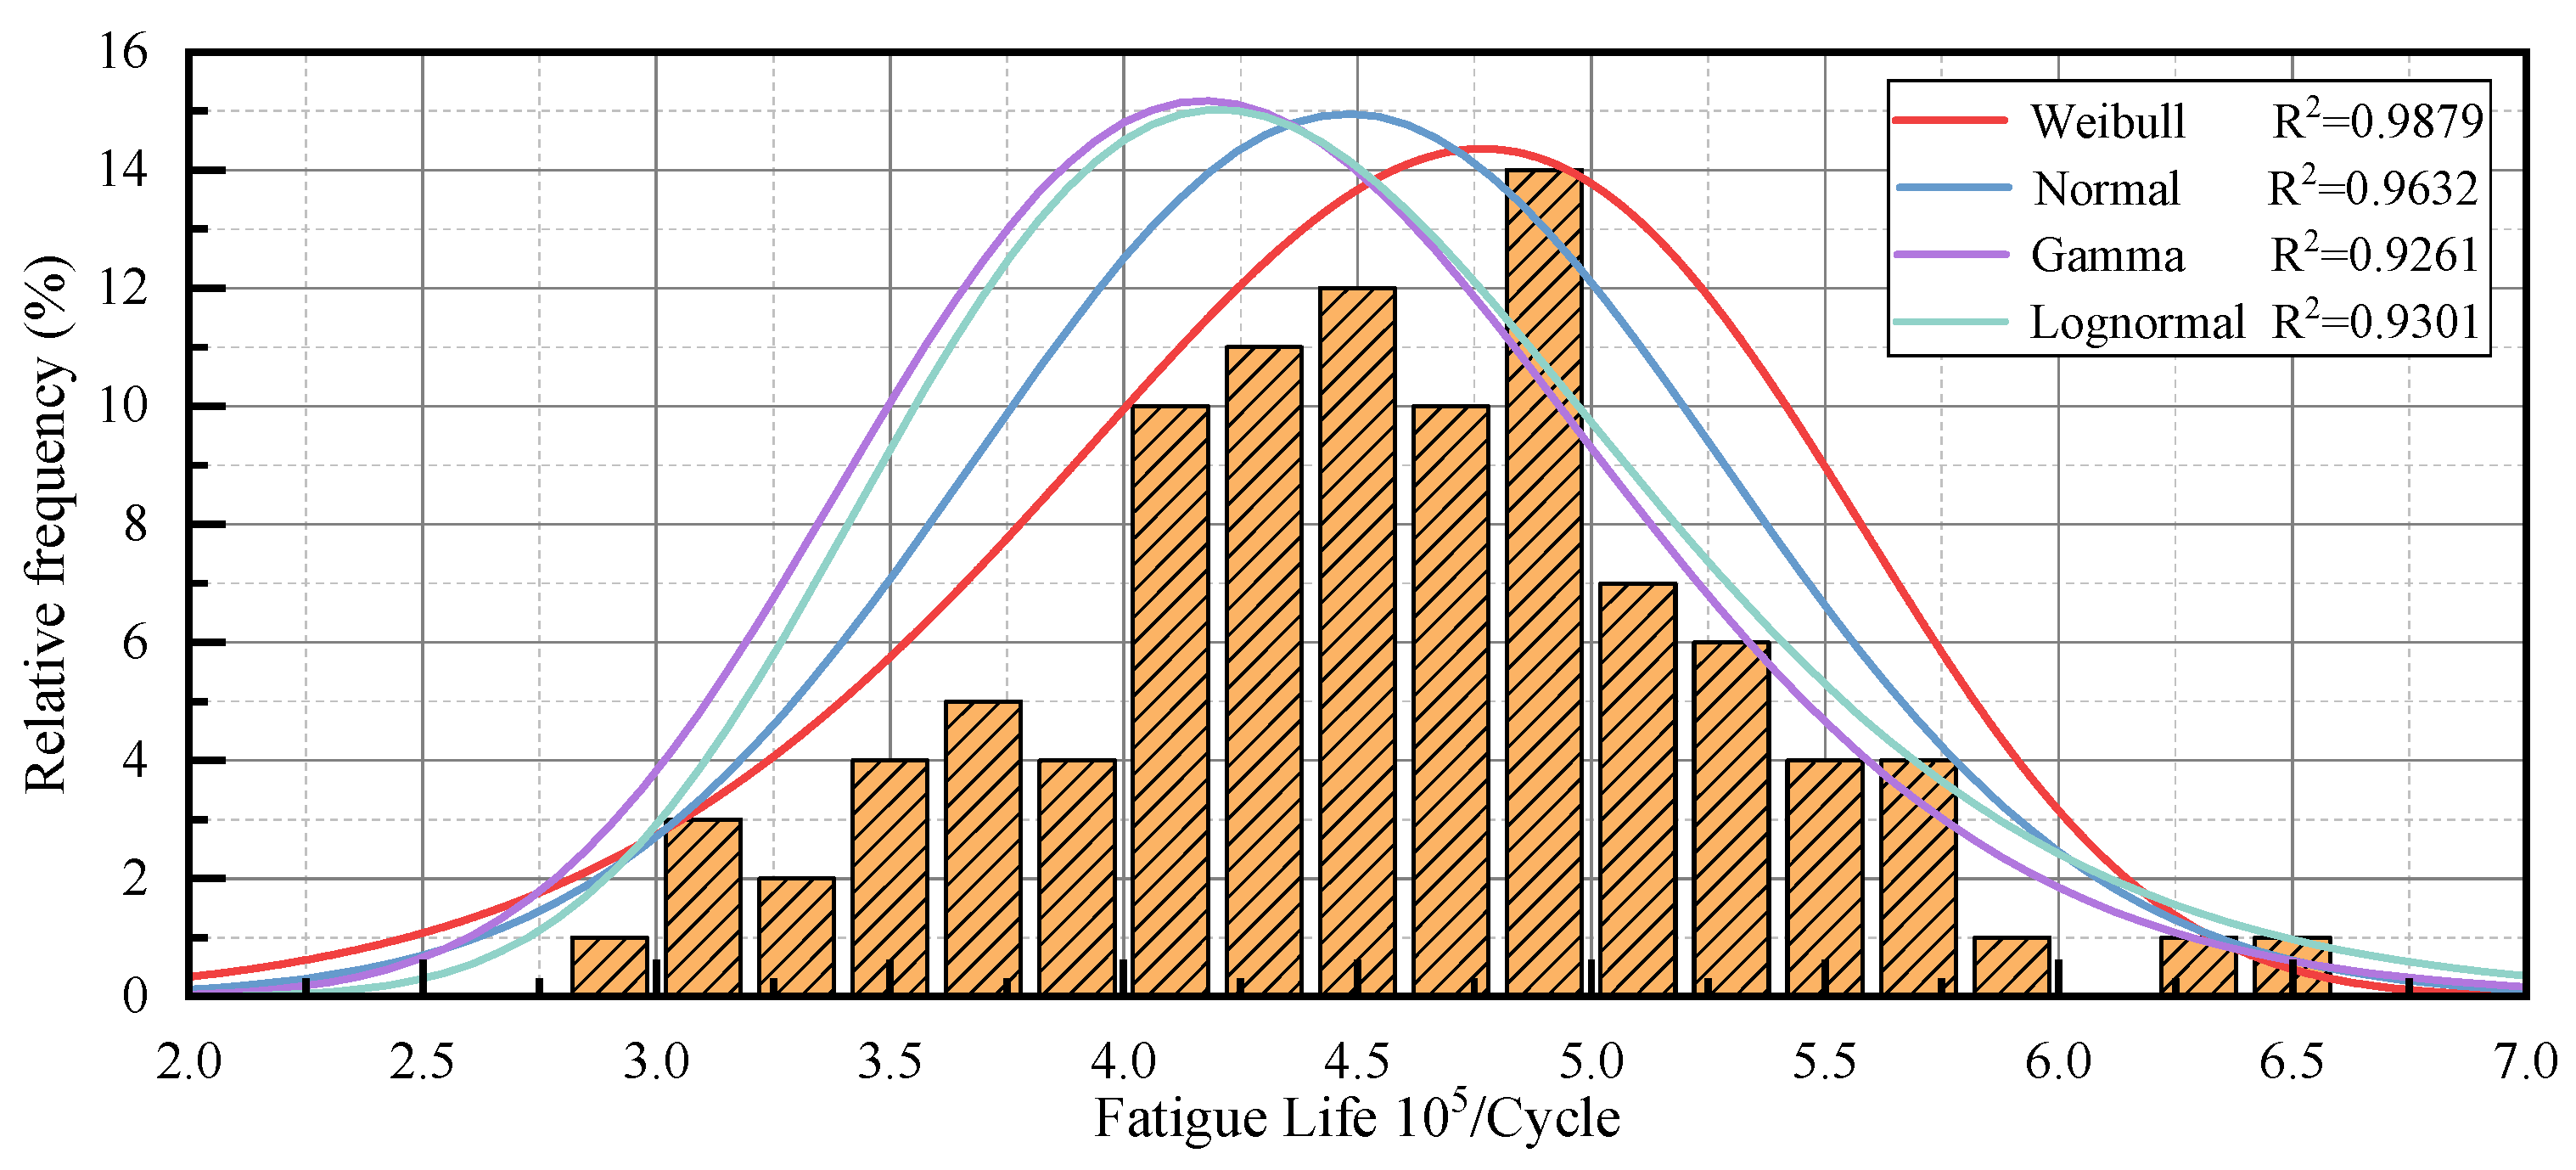
| Distribution Type | Weibull | Normal | Gamma | Lognormal |
|---|---|---|---|---|
| 0.9879 | 0.9632 | 0.9261 | 0.9301 |
| Random Variable | Mean Value | SD | Random Variable | Mean Value | SD |
|---|---|---|---|---|---|
| E11 (GPa) | 105.5 | 6.33 | XC (MPa) | 657 | 39.42 |
| E22 (GPa) | 7.2 | 0.432 | YT (MPa) | 694 | 41.64 |
| E33 (GPa) | 7.2 | 0.432 | YC (MPa) | 651 | 39.06 |
| v12 | 0.34 | 0.0204 | ZT (MPa) | 75 | 4.5 |
| v13 | 0.34 | 0.0204 | ZC (MPa) | 165 | 9.9 |
| v23 | 0.378 | 0.02268 | S12 (MPa) | 108 | 6.48 |
| G12 (GPa) | 3.4 | 0.204 | S13 (MPa) | 81.1 | 4.866 |
| G13 (GPa) | 3.4 | 0.204 | S23 (MPa) | 81.1 | 4.866 |
| G23 (GPa) | 2.520 | 0.1512 | L (mm) | 5 | 0.3 |
| XT (MPa) | 1060 | 63.6 | P (KN) | 9.5 | 0.57 |
Disclaimer/Publisher’s Note: The statements, opinions and data contained in all publications are solely those of the individual author(s) and contributor(s) and not of MDPI and/or the editor(s). MDPI and/or the editor(s) disclaim responsibility for any injury to people or property resulting from any ideas, methods, instructions or products referred to in the content. |
© 2024 by the authors. Licensee MDPI, Basel, Switzerland. This article is an open access article distributed under the terms and conditions of the Creative Commons Attribution (CC BY) license (https://creativecommons.org/licenses/by/4.0/).
Share and Cite
Liu, H.; Liu, Z.; Tu, L.; Liang, J.; Zhang, Y. Sensitivity Analysis of Fatigue Life for Cracked Carbon-Fiber Structures Based on Surrogate Sampling and Kriging Model under Distribution Parameter Uncertainty. Appl. Sci. 2024, 14, 8313. https://doi.org/10.3390/app14188313
Liu H, Liu Z, Tu L, Liang J, Zhang Y. Sensitivity Analysis of Fatigue Life for Cracked Carbon-Fiber Structures Based on Surrogate Sampling and Kriging Model under Distribution Parameter Uncertainty. Applied Sciences. 2024; 14(18):8313. https://doi.org/10.3390/app14188313
Chicago/Turabian StyleLiu, Haodong, Zheng Liu, Liang Tu, Jinlong Liang, and Yuhao Zhang. 2024. "Sensitivity Analysis of Fatigue Life for Cracked Carbon-Fiber Structures Based on Surrogate Sampling and Kriging Model under Distribution Parameter Uncertainty" Applied Sciences 14, no. 18: 8313. https://doi.org/10.3390/app14188313
APA StyleLiu, H., Liu, Z., Tu, L., Liang, J., & Zhang, Y. (2024). Sensitivity Analysis of Fatigue Life for Cracked Carbon-Fiber Structures Based on Surrogate Sampling and Kriging Model under Distribution Parameter Uncertainty. Applied Sciences, 14(18), 8313. https://doi.org/10.3390/app14188313