Abstract
Alloyed high-carbon steels are materials primarily intended for components operating under conditions of intense tribological wear. The carbides present in the microstructure of these materials significantly contribute to improving the wear resistance of such alloys. However, changes in the morphology of these precipitates can considerably alter the wear rate, leading to a deterioration in the properties of the materials. Therefore, this study aims to analyze the influence of several factors on the tribological wear of alloyed high-carbon steel. The research included friction tests under various load conditions and different sliding paths. Additionally, the samples were subjected to heat treatment to change the morphology of the observed precipitates. The tribological tests were conducted in a block-on-ring configuration under dry friction conditions. The tribological tests were analyzed statistically using analysis of variance (ANOVA). The results of the statistical analysis indicated that the primary factor influencing the observed differences between the samples was the heat treatment time of the material. Additionally, there were no significant statistical differences when pressure and friction path were varied. These findings, in conjunction with the SEM studies, allowed for the evaluation of the wear mechanism. The results demonstrated that, within the adopted tribological system, no alterations in the wear mechanism were observed with changes in test parameters. The observed differences in wear properties between the samples were found to be related to their heat treatment. The heat treatment resulted in alterations to the particle size distribution, with the annealing of the material at an elevated temperature leading to the dissolution of finer particles within the material. An increase in the average diameter of the carbide present in the material was observed to improve the wear resistance of the alloy tested.
1. Introduction
High-carbon materials are characterized by the presence of carbides in their microstructure, which significantly influences their resistance to abrasive wear. The functional properties of the material during intense tribological interaction will be affected by the appropriate volumetric fraction and morphology of the carbide phases in the alloy [1,2,3]. A parameter that can significantly affect the wear of high-carbon materials is the stress to which the material is exposed during operation. Studies conducted on high-chromium cast irons have revealed that, as the load applied during testing increases, changes occur in the wear mechanism of the samples. In the case of low loads, microcracking of the surface layer of the material is observed. Increasing stress results in the development of brittle macrocracks on the worn surface. It has been found that the initiation sites for cracks are the carbides present in the material. Additionally, a factor intensifying material wear is the banded segregation of carbides in the material, creating paths for the easy propagation of the resulting cracks [4]. A similar effect can be observed in gradient materials. The application of low loads resulted in abrasive wear of the tested materials. Subsequently, as the stress on the material increased, an increasing proportion of adhesive wear was observed on the surface, and, at the highest load, cracking and spalling of the surface layer occurred. Besides changing the wear mechanism, the stress value during the tribological test also influences the intensity of wear in high-carbon materials. With increasing stress and the speed of movement of the samples relative to each other, an increase in wear intensity is observed. Small changes in load cause a stable increase in material wear, while a significant increase in stress values results in an exponential, rather than linear, increase in mass loss [5,6].
In the case of high-carbon materials, the carbon content itself also significantly affects the wear process. As the carbon content increases, the wear value becomes progressively lower, which is related to the increasing involvement of carbides in the wear process [7,8,9,10]. However, a continuous increase in the volumetric fraction of carbides can facilitate the cracking of the material during its operation. It has been observed that materials characterized by a significant volumetric fraction of carbides are prone to chipping and cracking. Increasing loads during tribological tests can cause easier cracking of carbides with complex shapes. It has been observed that, as the heterogeneity of the distribution of carbides in the microstructure increases, the fracture toughness of the material deteriorates [11,12,13,14]. Changes in the size distribution of carbides and their spheroidization can significantly improve the toughness of high-carbon steels. The application of heat treatment involving cyclic heating and cooling of the material within the carbide dissolution range can refine the material structure by fragmenting the carbide precipitates and obtaining a more spheroidal shape. Similarly, quenching and subsequent complex tempering treatments result in the precipitation of fine carbides, effectively strengthening the material [15,16].
Recent publications have paid particular attention to the role of carbides in the tribological wear process. When evaluating the effect of the spheroidization process on the carbides present in the material, it can be observed that obtaining spherical cementite in a bainitic matrix leads to a visible improvement in the tribological wear resistance of the material. The carbide precipitates obtained were characterized by a diameter of approximately 1 μm. At the same time, a non-negligible effect of larger primary carbide precipitates on the improved wear resistance of the material was also observed [17]. The process of cementite spheroidization to improve wear resistance was also confirmed in the work [18]. It can be observed that the spheroidization process carried out at elevated temperature resulted in coagulation and spheroidization of the particles, increasing the proportion of larger size carbides, effectively improving the wear resistance of the material. A similar phenomenon was observed in the case of machining. Heat treatment involving quenching and multiple tempering of the material also confirmed that, as the uniformity of the carbide size distribution increases, an increase in the wear resistance of the high-carbon material can be expected [19]. Studies on D2 steel showed that both primary and secondary carbides have a significant effect on wear resistance, with smaller primary carbides reducing crack initiation [20]. This effect may be related to the deformation of the carbide itself during the intense tribological interaction, which leads to an increase in hardness while contributing to brittleness and accelerated wear. Therefore, significant differences between the cementite separations can affect the behavior of the material under severe deformation in different ways [21]. In bearing steels, the densely distributed spherical carbides were effective in inhibiting crack propagation, resulting in an increase in toughness [22].
The impact of both tribological test conditions and the complexity of the morphology of carbide precipitates present in iron-based metallic materials indicates the necessity of using statistical tools to describe the phenomena occurring at the interface of interacting elements. The use of statistical models has found application in describing phenomena occurring in sintered materials, which, due to significant porosity, can exhibit considerable variability in results. Statistical models are used in describing the mechanical properties of sintered materials. Statistical ANOVA analysis has been used to optimize the sintering process and heat treatment of sintered Fe-Mn-Cr-Mo-C steels. Analysis of variance allowed for the determination of relationships between sintering temperature, furnace atmosphere, processing time, and the hardness of the produced sintered components. Which of the analyzed variables significantly affected the obtained hardness results was identified. Similar relationships could also be established for the chemical composition of the tested steels. The variability in the chemical composition of the tested samples was correlated with the differences in hardness between the tested materials. This confirmed the significant impact of changes in chemical composition on the final properties of the tested samples [23,24,25].
In tribological studies, variance analysis was used to determine the influence of changes in lubricant parameters on the microstructure and surface quality of steel after mechanical processing. The results of statistical analysis indicate that, both ecologically and economically, the application of specific lubricant volumes and the selection of its chemical composition significantly affect tool wear and the surface condition of the material after processing [26]. Statistical ANOVA analysis was also used to evaluate the results of tribological tests for layers containing boron aimed at improving the wear resistance of railway crossings. The use of variance analysis allowed for the identification of the main factors affecting the material’s wear resistance. It was confirmed that the obtained boron-rich layers significantly improved the material’s wear resistance [27].
2. Materials and Methods
The test material was a high-carbon alloy steel. The chemical composition of the test material is presented in Table 1. This steel is comparable to the chemical composition of a cold-working tool steel. The study material was designed by the authors of the publication. It was melted at the AGH University of Science and Technology in Krakow using a vacuum furnace (VIM LAB 20–50, SecoWarwick, Świebodzin, Poland).

Table 1.
Chemical composition of investigated material, % mass.
The steel under investigation was annealed at a temperature of 850 °C. The heat treatment was carried out at a temperature 30 °C higher than the end of the eutectoid transformation. It is anticipated that the material will undergo alterations in its volume proportion of carbide precipitates, given the conditions to which it is subjected. Furthermore, coagulation and spheroidization of secondary precipitates are anticipated to occur as a consequence of this heat treatment. The dilatometric curve from which the range of eutectoid transformation was determined is presented in Figure 1. Dilatometric tests were performed using an L78 R.I.T.A dilatometer (Linseis, Selb, Germany). The test specimen was a 3 × 10 mm cylinder. It was heated to a temperature of 1200 °C at a heating rate of 0.05 degrees per second. The heating process was conducted in an argon-filled chamber, with a platinum thermocouple. Heat treatment for the tribological specimens material was held at 850 °C for periods of 4, 8, and 12 h, respectively. The heat treatment was performed in a tube furnace with an argon-protective atmosphere. Subsequently, tribological samples, measuring 4 × 4 × 20 mm, were cut from the heat-treated material, which measured 25 × 25 × 35 mm. In order to obtain the same roughness for each sample, all samples were then finished on 1000-grit sandpaper. The same preparation was carried out on the surface of all the counter samples. These samples were tested using a friction block on a ring system on a T05 tribotester (Instytut Technologii Eksploatacji, Radom, Poland). The test material was tested under dry friction conditions without grease at room temperature. Humidity measurements were not carried out; the measurement was carried out in a closed room. The rotational speed of the counter sample was 130 rpm. The study of friction process parameters included variations in the applied load and different friction paths. Loads of 100 N and 150 N were applied, and friction paths of 1000 m and 2000 m were used. The counter-sample for the tribological tests was a ring made of 100Cr6 bearing steel, heat-treated to a hardness of 52 ± 2 HRC. The mass loss of the samples was evaluated by weighing the samples before and after the tribological test using a laboratory scale with an accuracy of 0.0001 g (AS 520.R2 PLUS Radwag, UNIWAG, Kraków, Poland). After the tribological tests, the hardness of the material was measured using the Vickers method with a load of 98.07 N. Hardness measurements were conducted on the surface of the samples using a TUKON 2500 hardness tester (WILSON-HARDNESS, Spectro – Lab, Warszawa, Poland ). The samples were then subjected to profilometric tests using an optical profilometer WYKO NT9300 (Veeco, Munich, Germany). The resulting abrasion profiles allowed the average wear depth to be estimated. The wear depth was evaluated on the basis of four cross-sections of the obtained profile. This was followed by a microscopic analysis of the test material using a scanning electron microscope (SEM) (Merlin Gemini II, Zeiss, Oberkochen, Germany). An analysis was conducted on the surface of the wear and the microstructure of the material in cross-section, aligned with the surface of the investigated wear. The completed microstructure documentation was used for a quantitative analysis of the carbides present in the material. The quantitative analysis was performed using SigmaScanPro software version 5.0 (SPPSS Inc., San Jose, CA, USA). Stereological results were performed on 10 random areas of microstructure for each heat treatment variant. Furthermore, the relationship between the tribological test results and the experimental parameters was confirmed through analysis of variance (ANOVA). This analysis identified which of the investigated parameters significantly affected the differences between the obtained test results. The significance level used for the analysis was α = 0.05. Analysis of the main effects with restricted sigma was conducted. The resulting analysis demonstrates unidimensional outcomes for each variable. The statistical analysis was conducted using STATISTICA software version 13.3 (StatSoft Polska, Krakow, Poland).
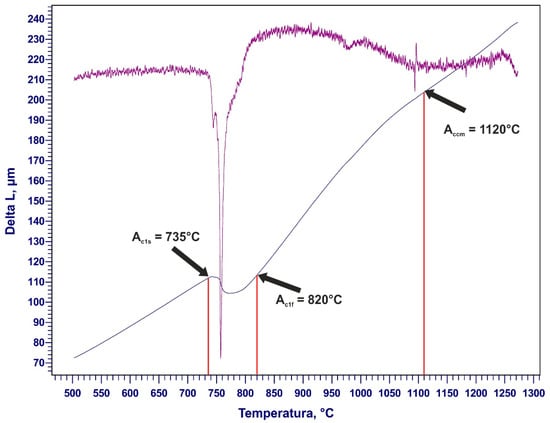
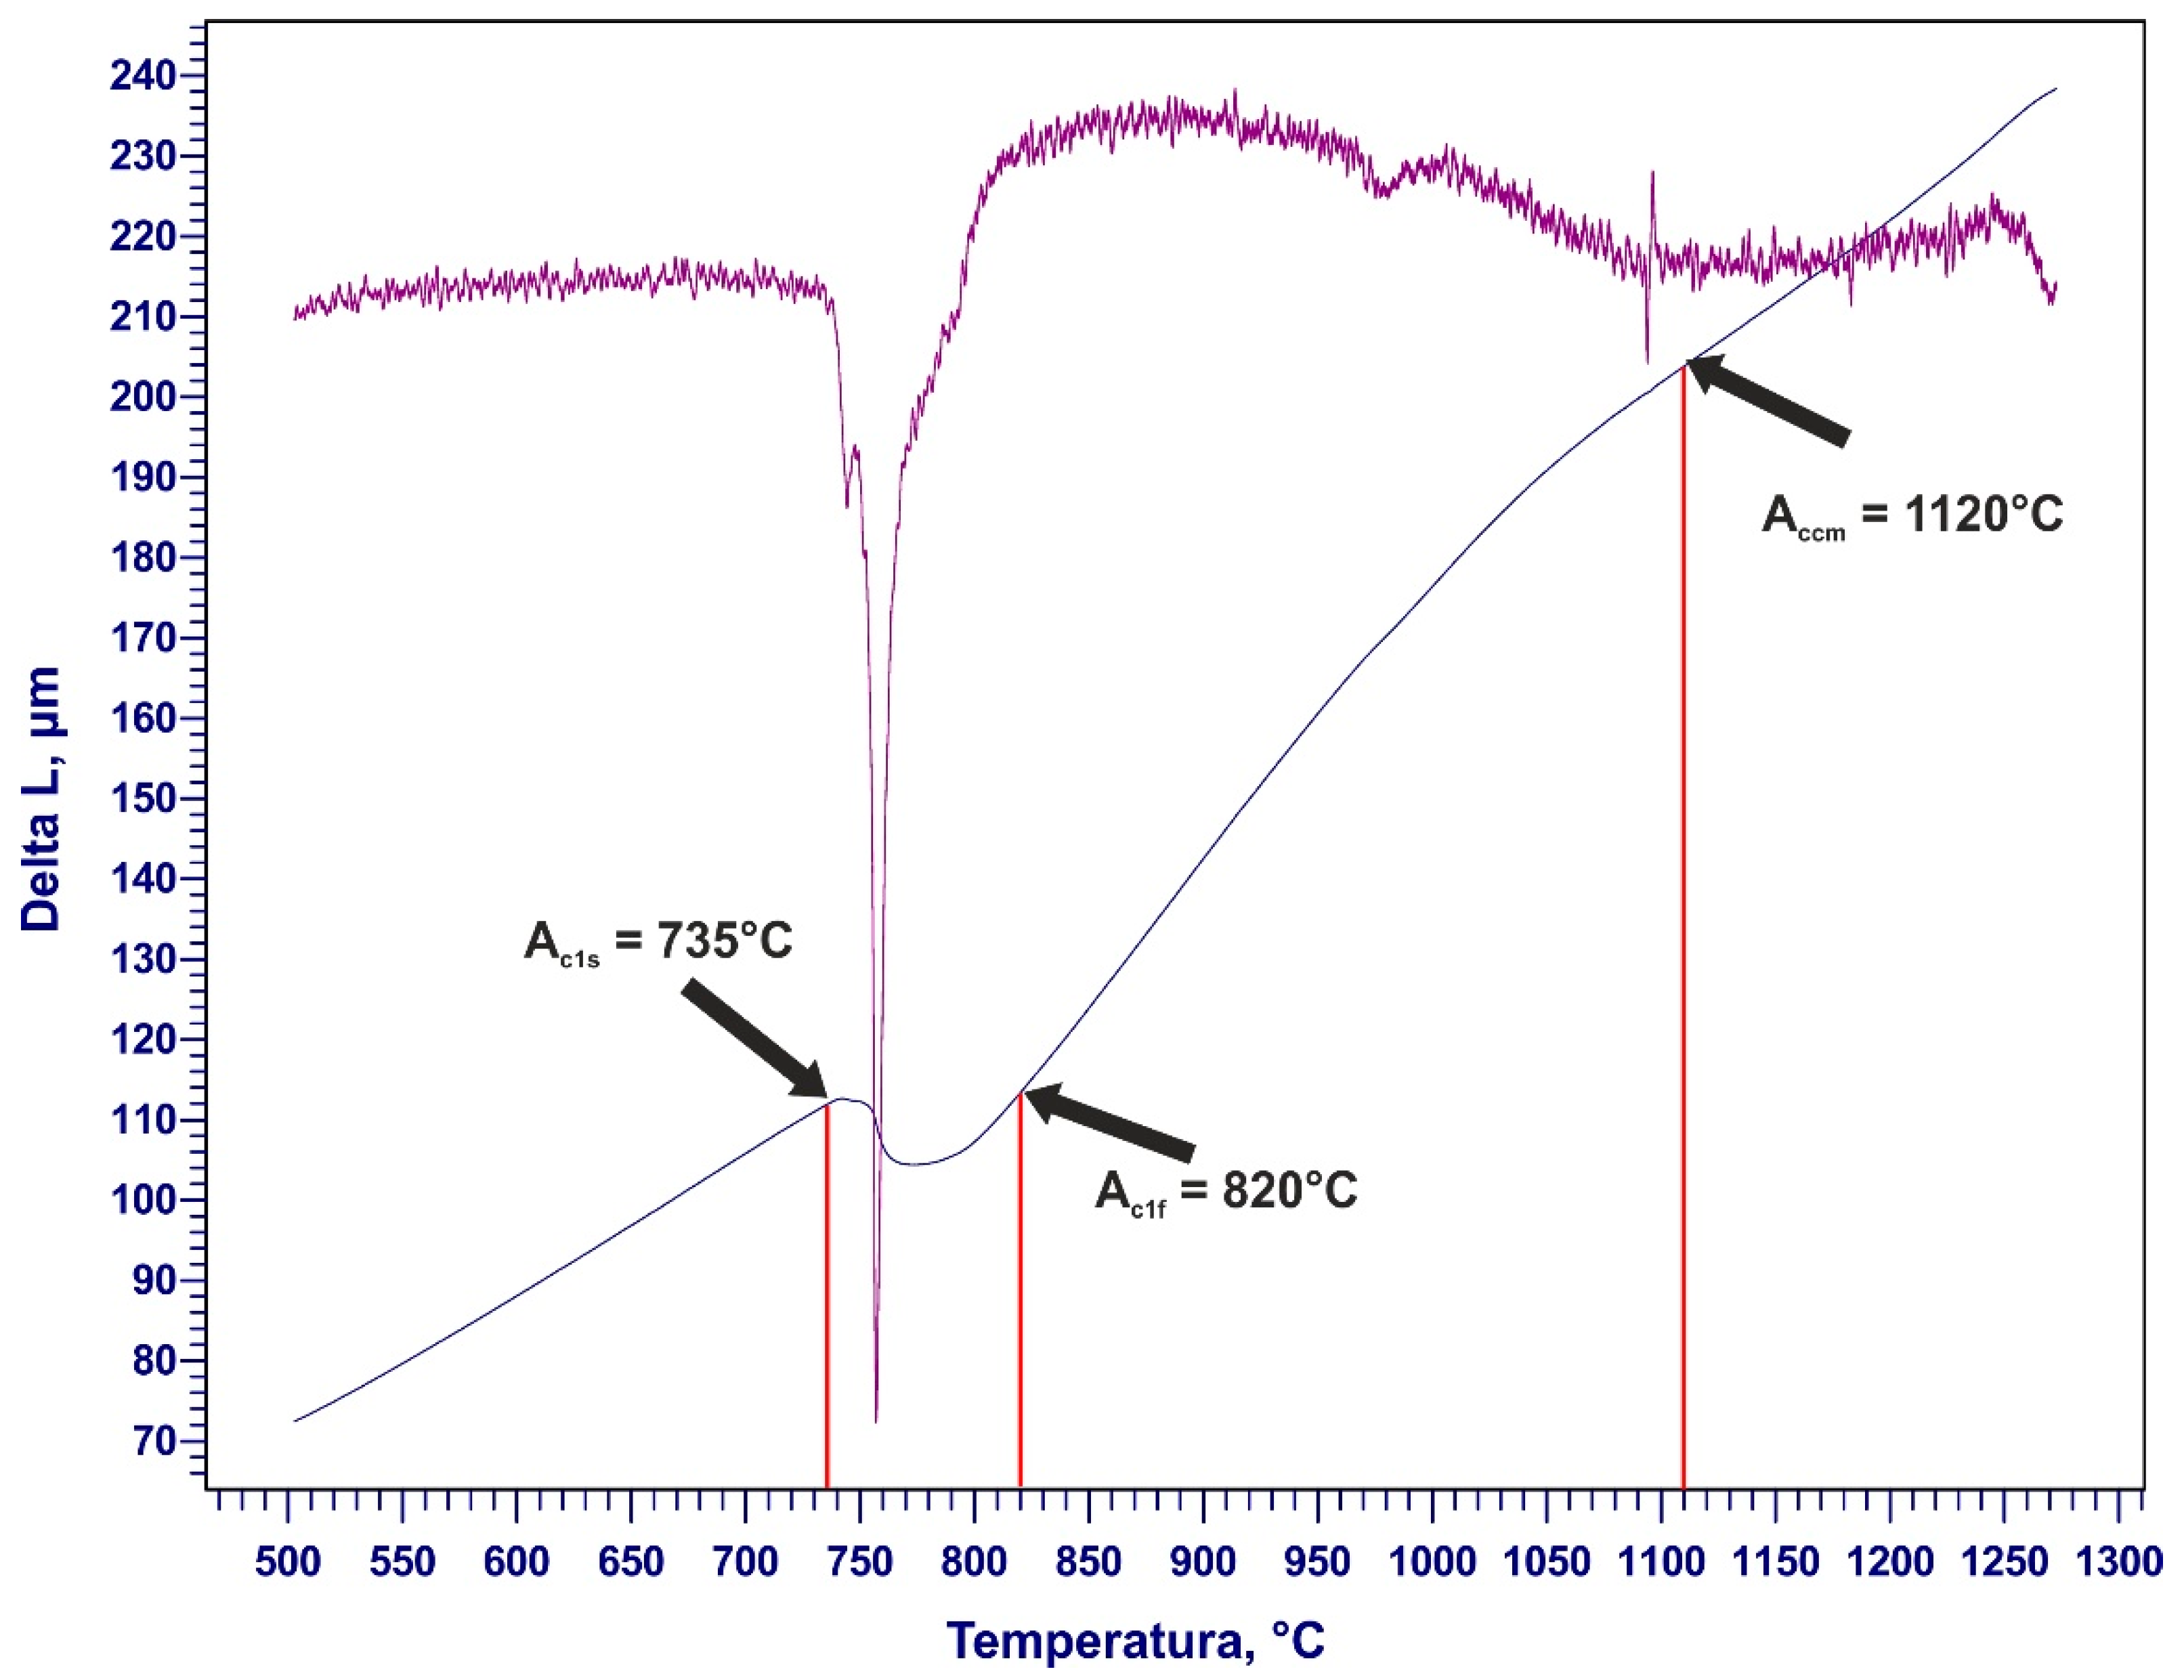
Figure 1.
The dilatometric curve for the investigated material.
3. Results
The preliminary phase of the investigation entailed a dilatometric examination of the prevalence of eutectoid transformation in the materials under examination. The dilatometric curve employed to delineate the heat treatment parameters is illustrated in Figure 1.
The dilatometric tests conducted permitted the estimation of the onset of the eutectoid transformation at 735 °C. Conversely, the end point of this transformation is reached at 820 °C. The temperature of the complete dissolution of secondary cementite was estimated to be 1120 °C. Based on the data obtained from the dilatometric tests, the temperature of the heat treatment was determined to be 850 °C. The discrepancy between the end of the eutectoid transformation and the heat treatment temperature was attributed to the difference in size between the dilatometric sample and the material to be treated.
The next stage of the investigation was the tribological tests. The results of these tests are presented in Table 2. Additionally, the table includes hardness measurements and the average wear depths. The dependent variables analyzed are displayed as repeated values, while the independent variables are shown as average values for the corresponding wear surface. Specifically:
Table 2.
Results of the tribological tests, annealing time, pressure force, and trial time—controlled by the authors; mass loss, hardness, friction coefficient, and wear depth—results of the tribological test for the individual wear surface.
Mass Loss: Measurement for the specified wear surface, presented as a single row.
Hardness: Average hardness from four measurements for the given wear surface.
Friction Coefficient: Mean value derived from the test, based on force measurements sampled every second.
Wear Depth: Average depth from four cross-sections of the profile obtained through profilometric analysis.
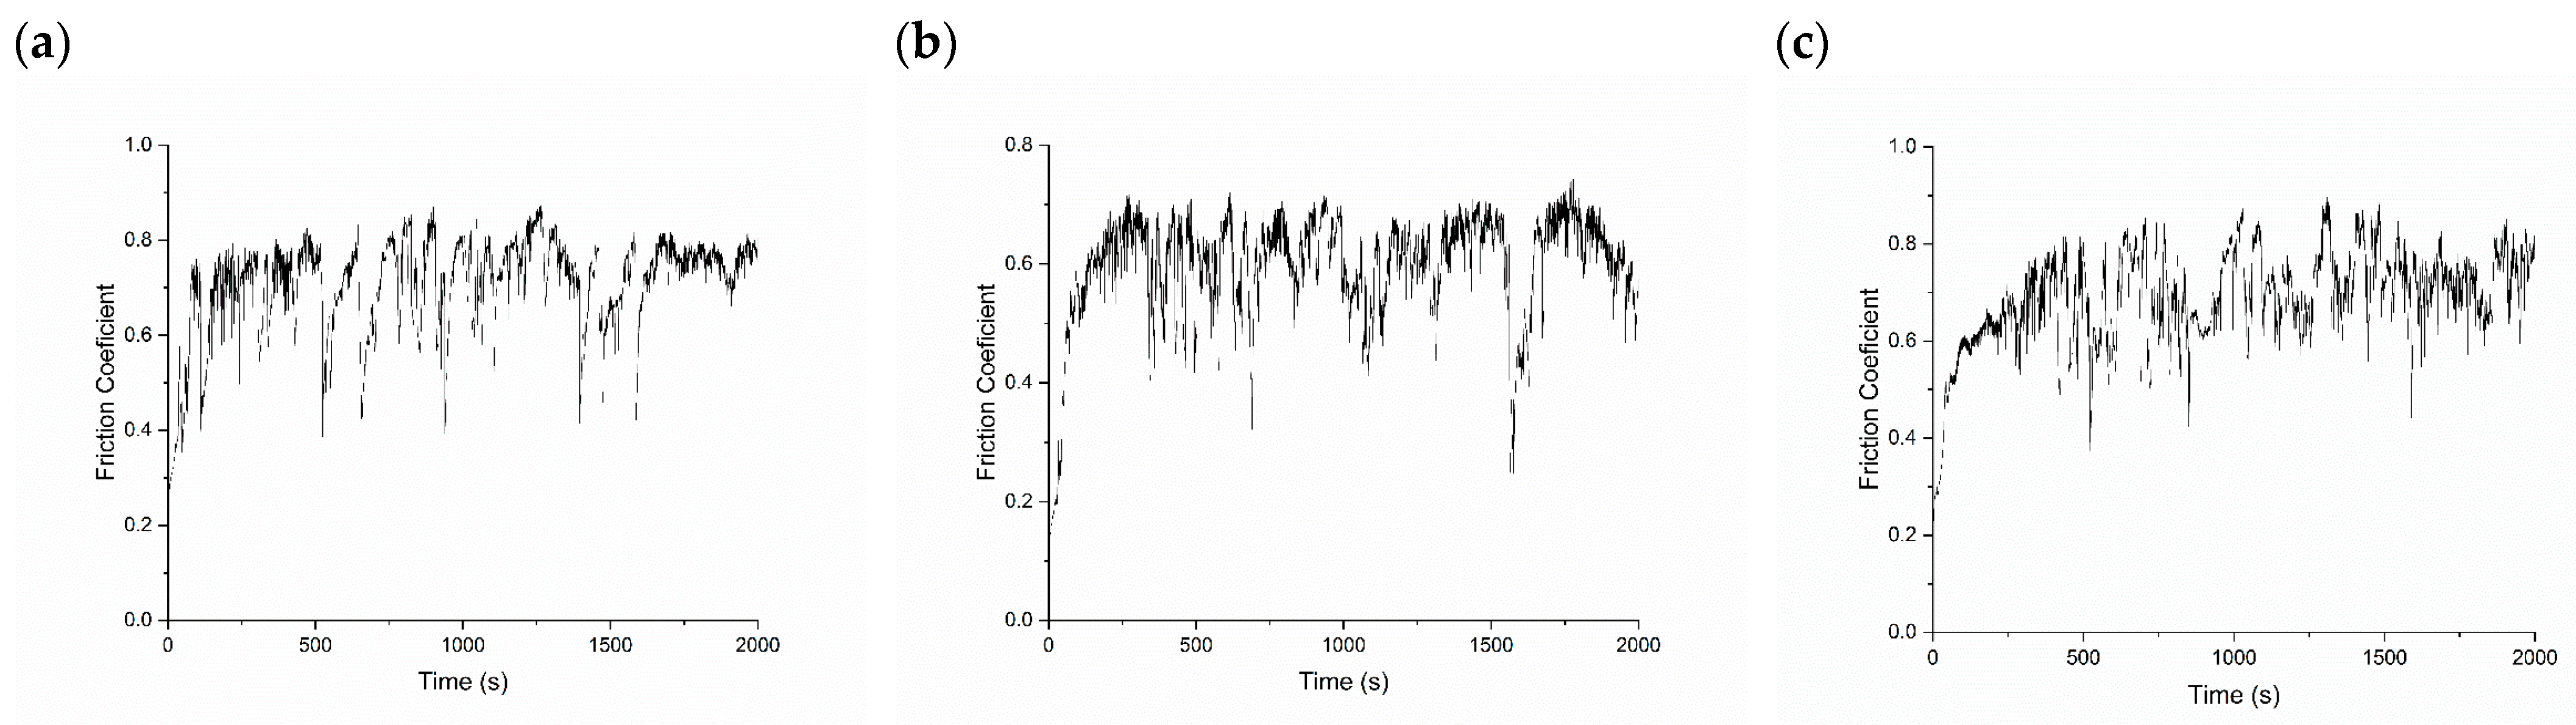
The results obtained from the experiments facilitated a statistical analysis to evaluate the impact of tribological test parameters and heat treatment duration on the results of the tribological tests. The values of the friction coefficient presented in Table 2 were evaluated based on the observed changes in this parameter over time during the course of the friction test. The average value was determined based on the range over which the coefficient value demonstrated stability at some level. Examples of the observed changes in the friction coefficient value over time are illustrated in Figure 2. For these two cases, significant differences in the value of the friction coefficient could be observed. The mean value of the coefficient of friction was determined from values ranging from approximately 500 s to approximately 2000 s of test time. The error of the data presented in Table 1 was assessed as the error of the mean. The low error value is related to the large number of tested values for each of the tested variants. It can be observed that the course of variation of the friction coefficient values is strongly heterogeneous. The significant variations in the instantaneous friction coefficient values can be attributed to the strong interaction between the surface of the test material and the surface of the counterexample. Significant differences between the character of the curve for each variant were not observed.
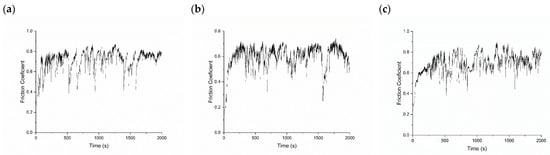
Figure 2.
Examples of friction coefficient change curves during the test. Variant 100 N-2000 s; (a) 4 h, (b) 8 h, and (c) 12 h.
The findings from the analysis of variance (ANOVA) for mass loss, friction coefficient, and wear depth are presented in Table 3.
Table 3.
Results of the ANOVA analysis for the tribological test results.
The statistical analysis reveals that the heat treatment duration was the only factor that exhibited a statistically significant influence on the tribological test results. In contrast, the applied load during the test and the test duration did not show a statistically significant effect on the outcomes. While variations in tribological test parameters do affect the results, the observed dispersion in the obtained values does not substantiate significant differences among them. Notably, the variability in wear depth relative to mean values does not allow for a clear determination of the significant influence of heat treatment. However, there is a discernible effect of the applied force during the tribological test. Based on the results of the statistical analysis, key relationships have been illustrated graphically. Figures depicting the changes in mass loss, friction coefficient, and wear depth relative to heat treatment duration, as well as wear depth variations with respect to the applied force during the test, are presented in Figure 3.
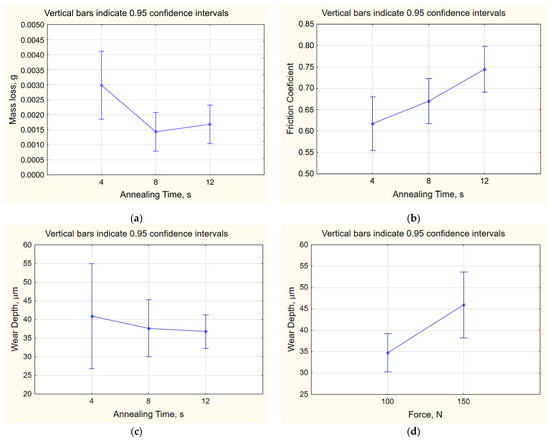
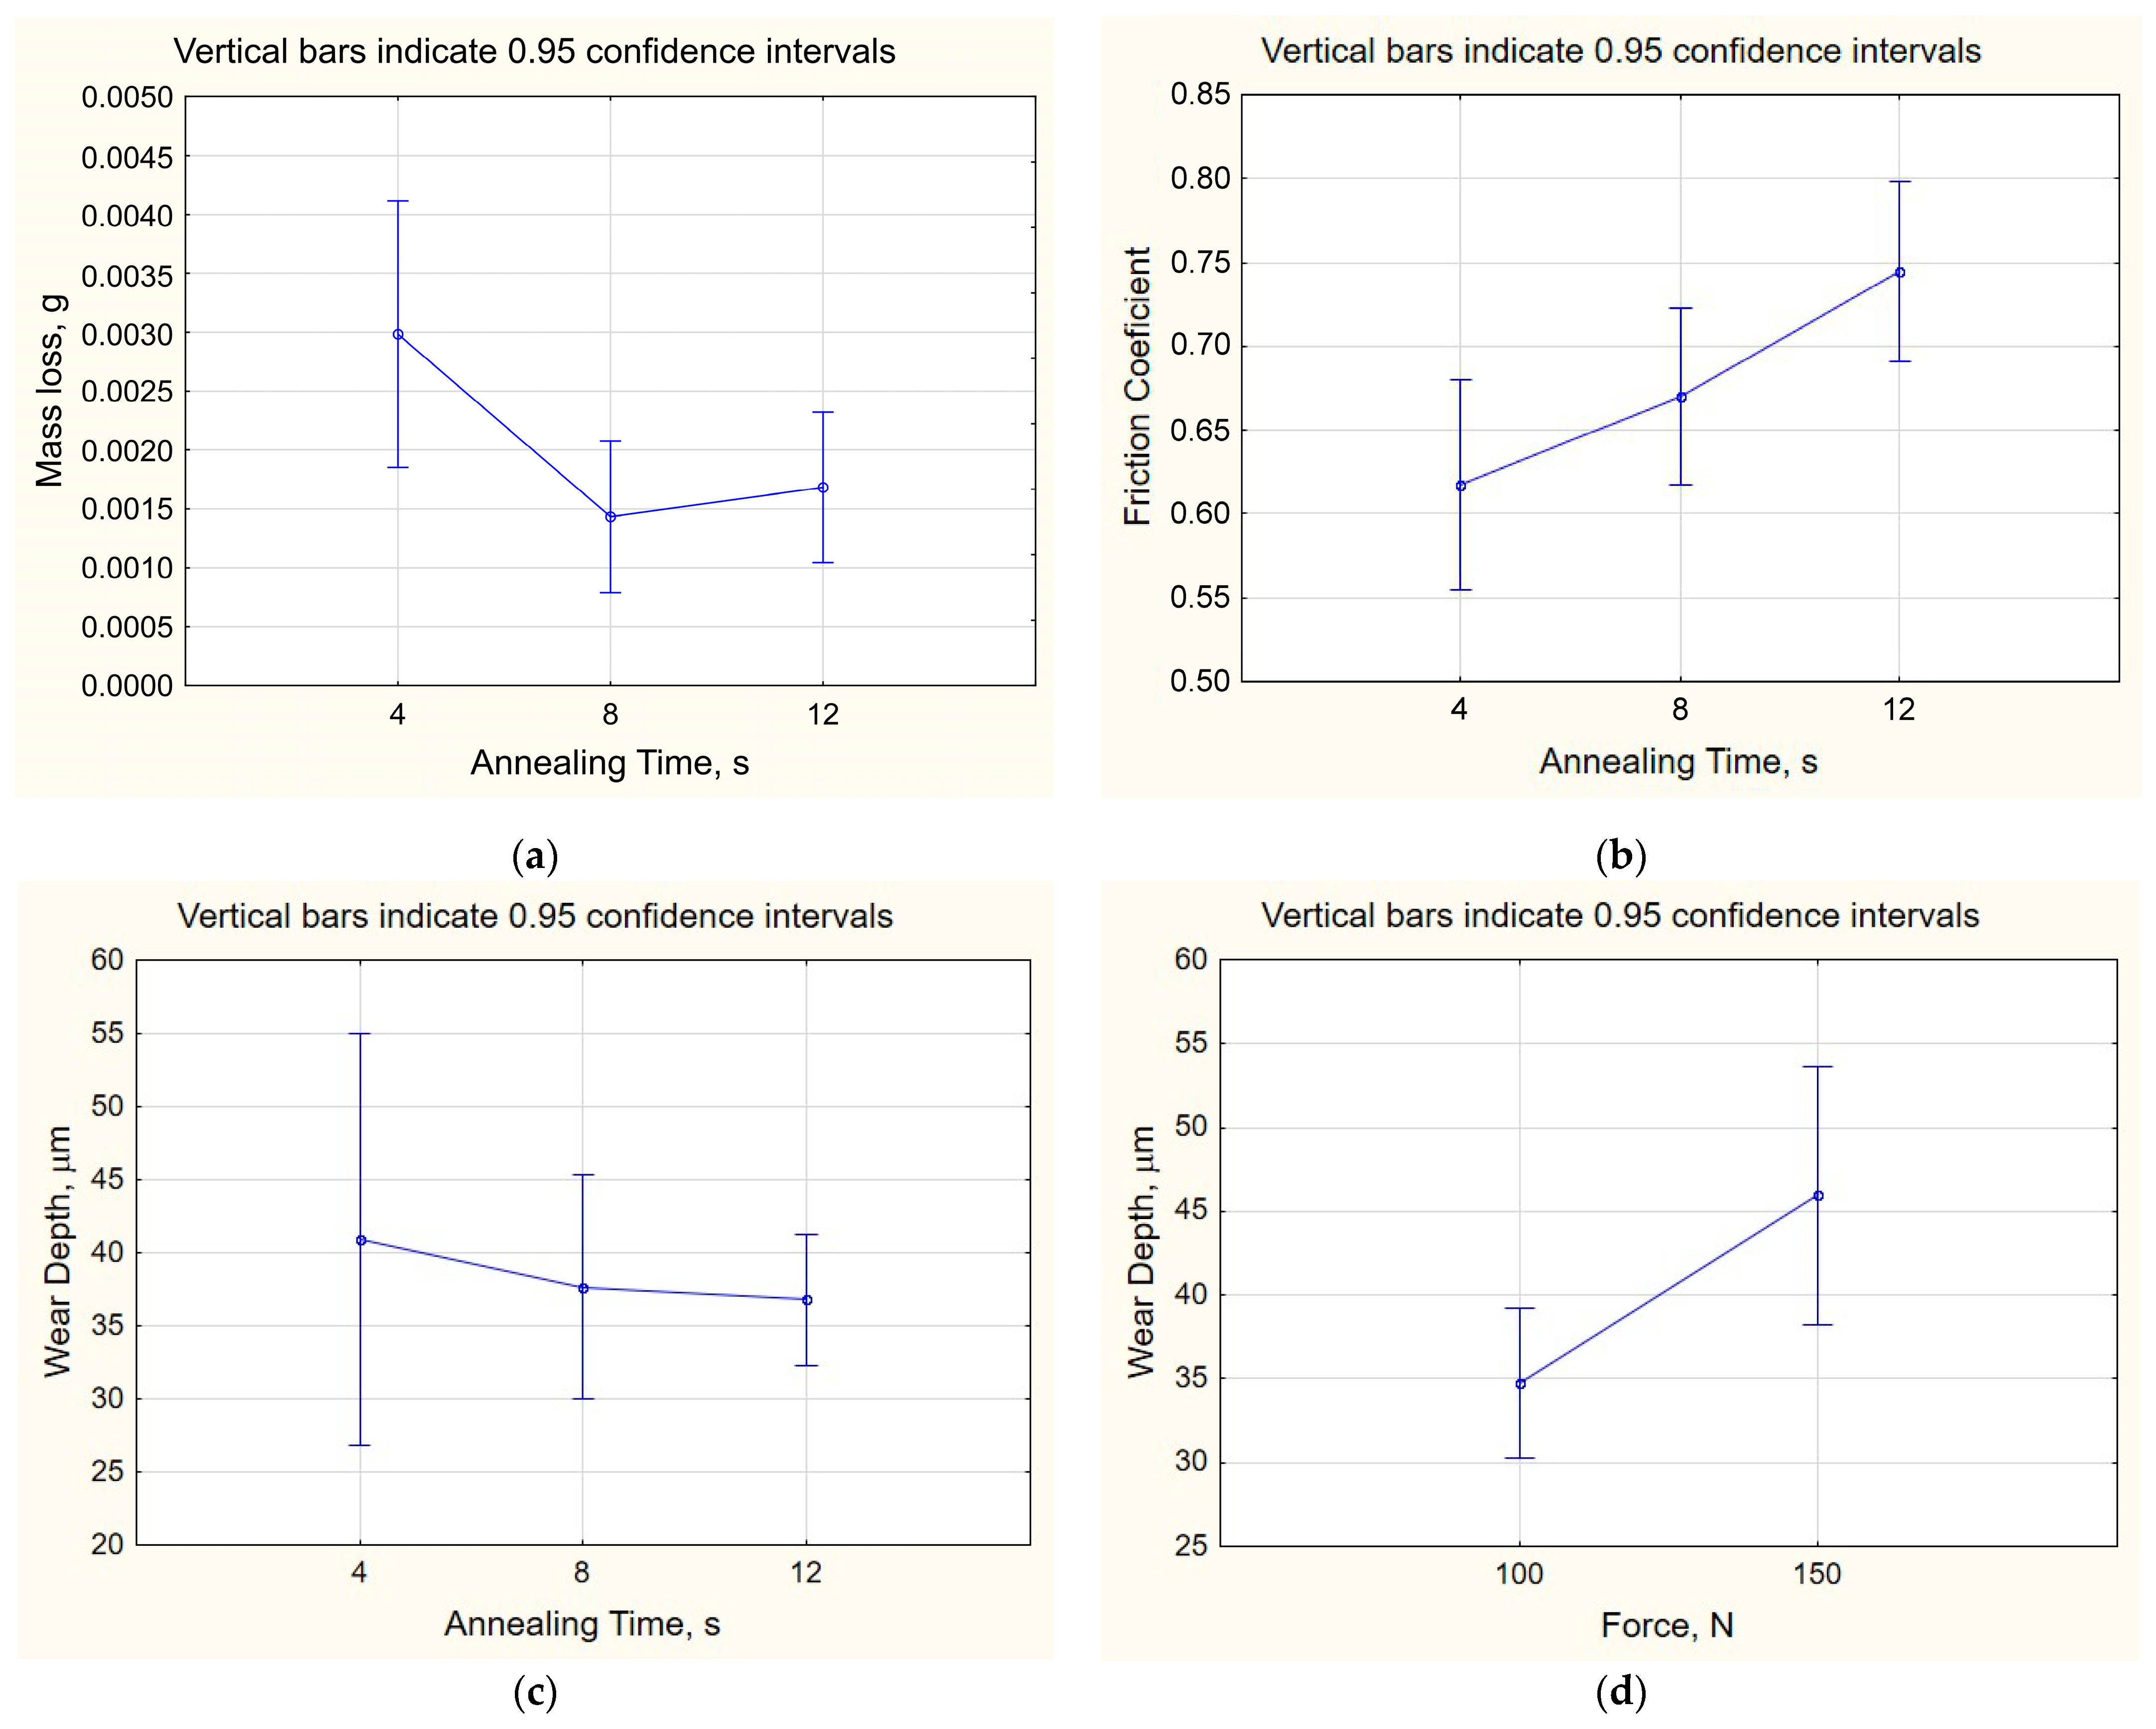
Figure 3.
Results of the tribological test, (a) mass loss of the samples in correlation to the time of material annealing, (b) average friction coefficient in relation to annealing time, (c) wear depth in relation to the annealing time, and (d) wear depth in relation to force used during the test.
The analysis of the obtained results indicates that increasing the annealing time leads to a reduction in the mass loss of the samples. A significant difference is observed between annealing times of 4 h and 8 h or 12 h. However, the differences between 8 h and 12 h are no longer statistically significant (Figure 3a). Annealing time also affects the average friction coefficient, with its average value increasing with longer annealing. A statistically significant difference in mean values is noted between samples annealed for 4 h and those annealed for 12 h, with an overall increasing trend (Figure 3b). The wear depth resulting from the tribological tests does not show a statistically significant difference relative to the annealing time. However, the trend in wear depth is similar to that observed for mass loss. As the annealing time increases, the depth of wear decreases, with the most substantial difference observed between samples annealed for 4 and 8 h. The difference between 8 and 12 h of annealing is smaller. Nonetheless, significant variation in results makes it challenging to definitively establish the impact of observed differences (Figure 3c). Regarding wear depth, the parameter that significantly affects the observed results is the applied load during the test. It is observed that, with increasing applied load, the wear depth also increases. This increase is independent of the annealing time and may be a source of significant variation in the results presented in the earlier chart (Figure 3d).
The tribological tests yielded comparable values of abrasive wear resistance, indicating that the tested materials underwent a similar wear mechanism. To examine this mechanism, scanning electron microscopy (SEM) was used to visualize the wear surfaces. The results of this analysis are presented in Figure 4.

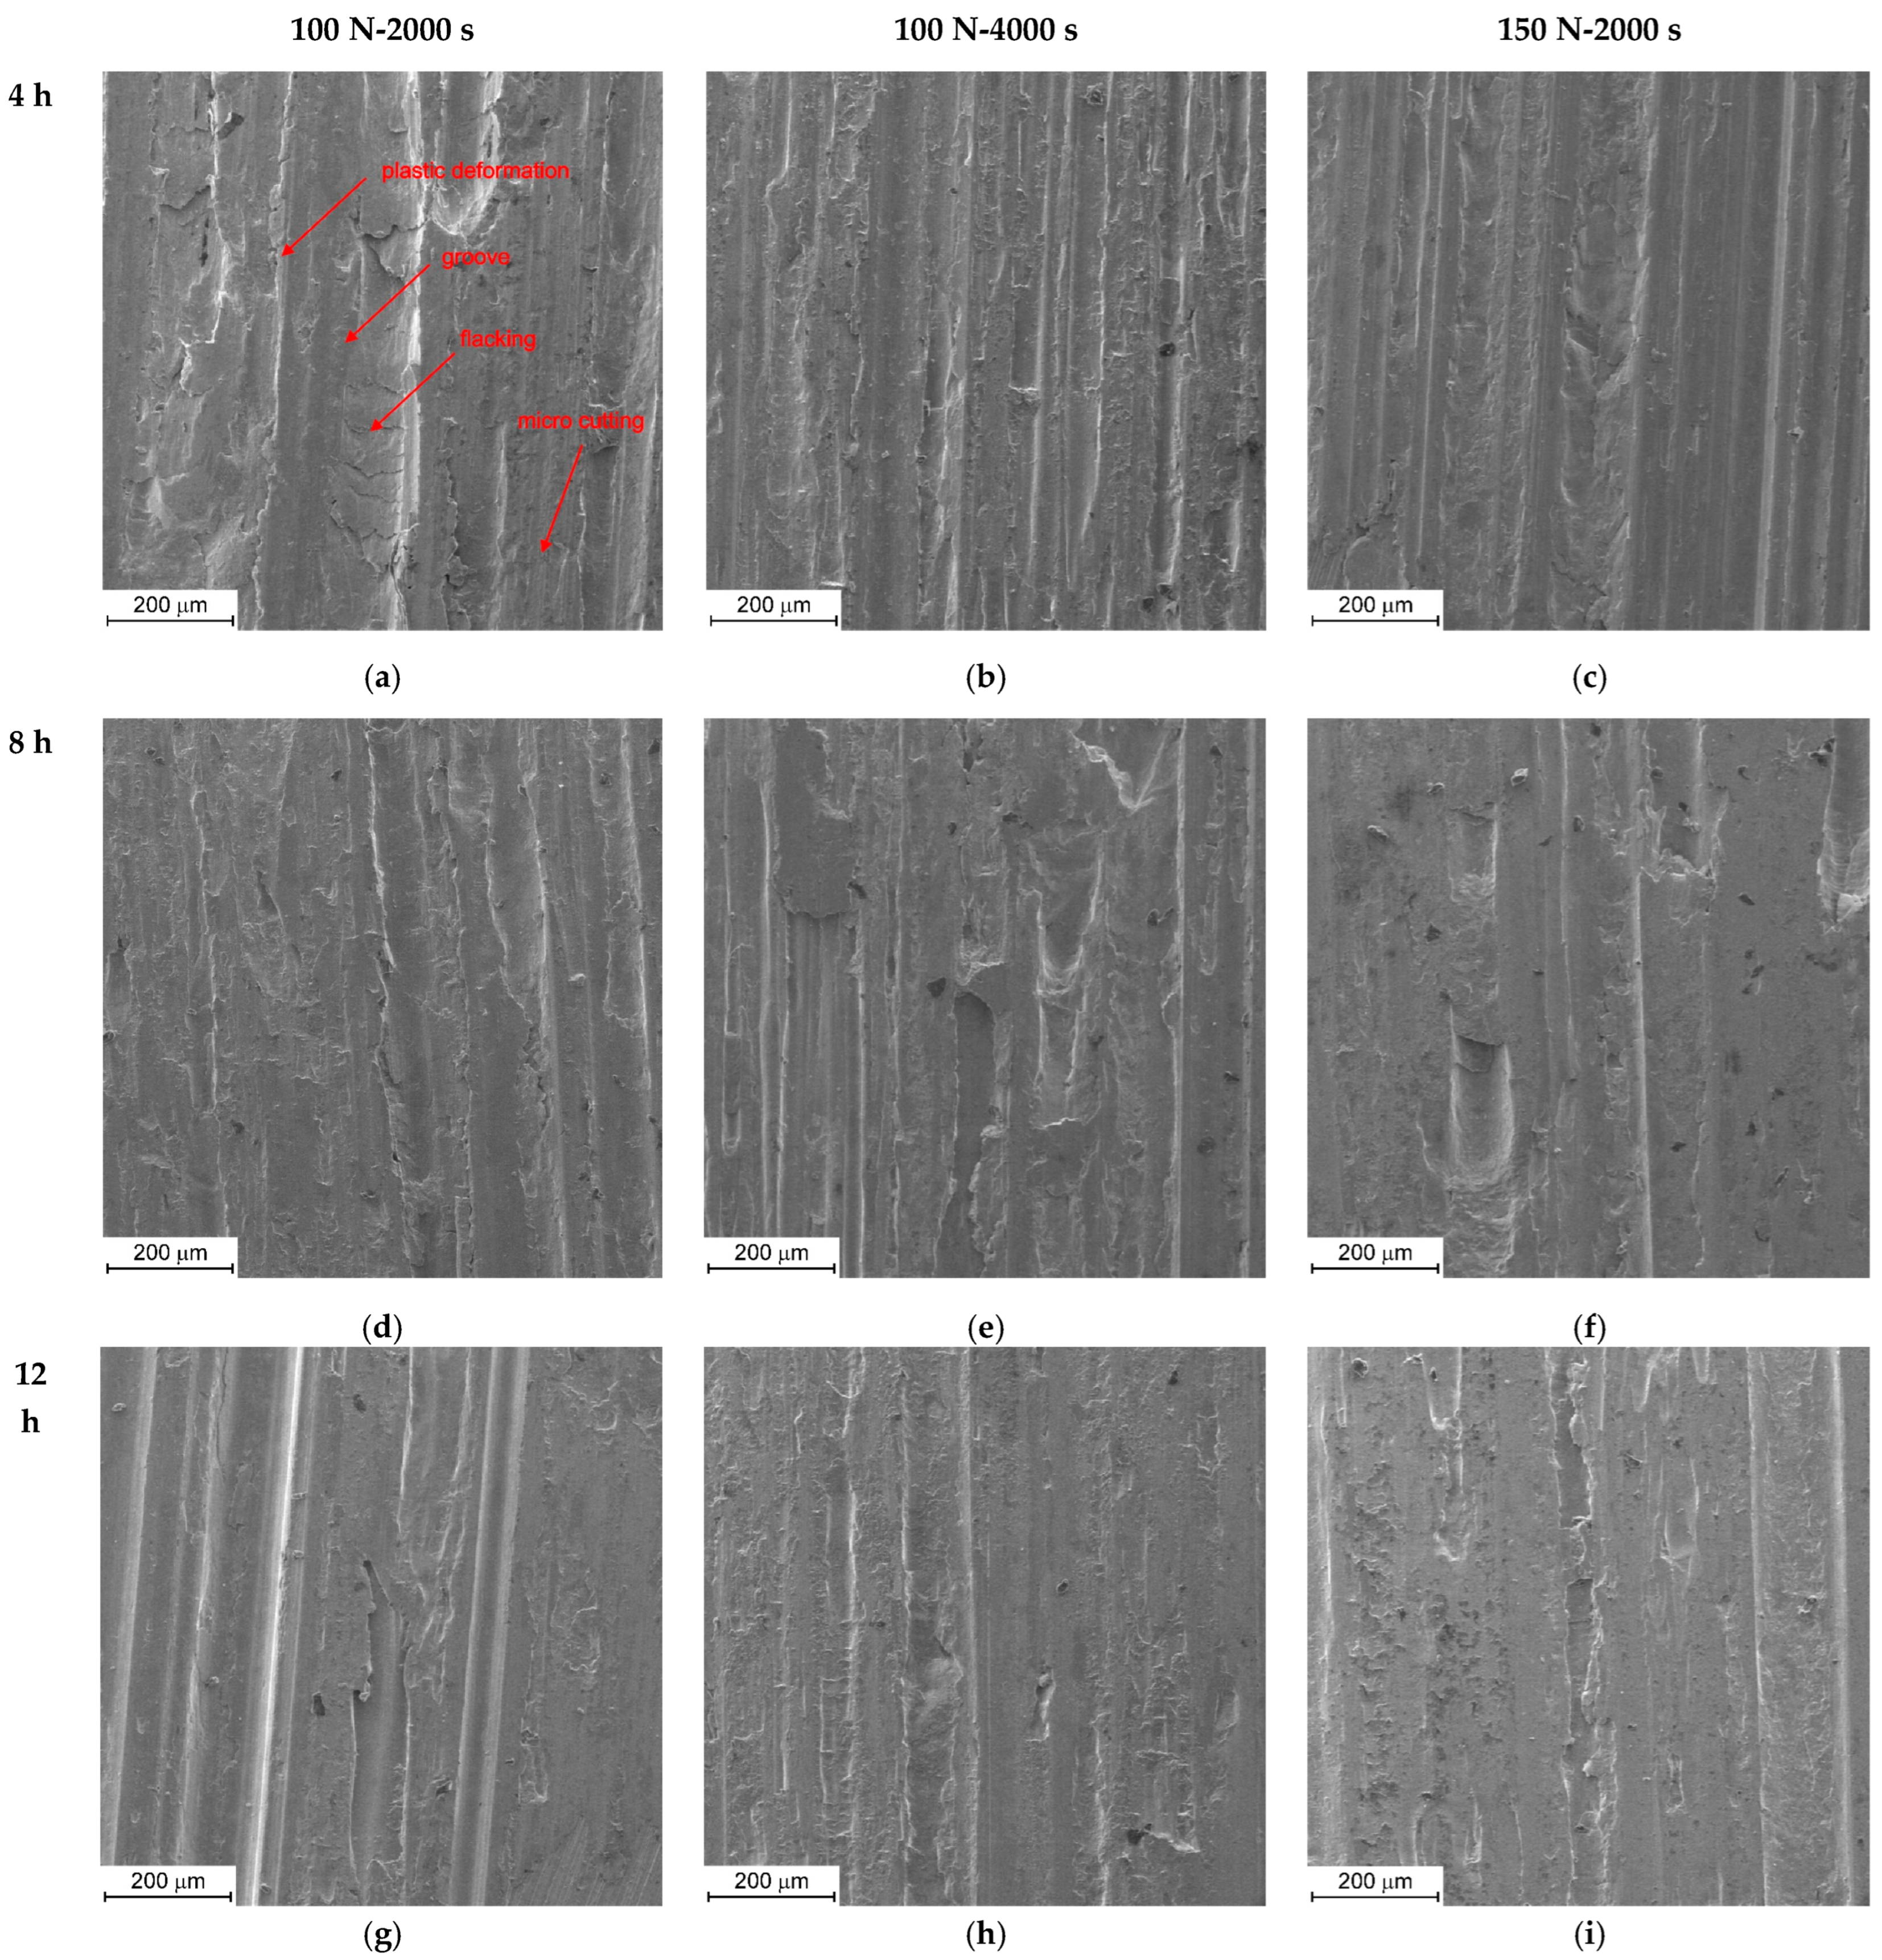
Figure 4.
Surface of samples after tribological testing, area of abrasion, (a)—4 h-100 N-2000 s; (b)—4 h-100 N-4000 s; (c) 4 h-150 N-2000 s; (d) 8 h-100 N-2000 s; (e)—8 h-100 N-4000 s; (f)—8 h-150 N-2000 s; (g)—12 h-100 N-2000 s; (h)—12 h-100 N-4000 s; (i)—12 h-150 N-2000 s.
The documentation of the wear surfaces indicates that the primary wear mechanisms observed were microcutting and grooving. For all tested wear surfaces, features such as grooves and material undulations were evident. Plastic deformation and surface flaking of the worn material were observed in all samples. The image of the sample surface is consistent with the observed changes in the friction coefficient value (Figure 2). The surface of the tested samples is notably uneven, exhibiting a multitude of grooves. No significant differences were noted between the samples treated at 850 °C for 4 and 8 h (see Figure 4a–f). However, for the sample treated for 12 h, the wear surface appeared less developed, with more areas exhibiting a smoother texture (see Figure 4g–i). The observed surfaces did not show significant differences from each other. Based on the photographic documentation, it cannot be confirmed that the heat treatment of the material or changes in the tribological test parameters significantly affected the wear mechanism of the tested samples.
Based on the obtained results, it can be inferred that the observed differences in the tribological properties of the tested material are largely influenced by its microstructure. Therefore, a microstructural analysis of the material was carried out using scanning electron microscopy (SEM). The microstructural images of the heat-treated material at various annealing times are presented in Figure 5.
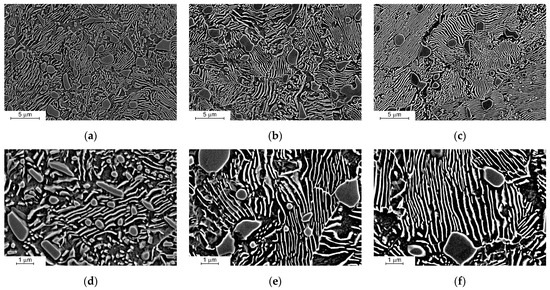
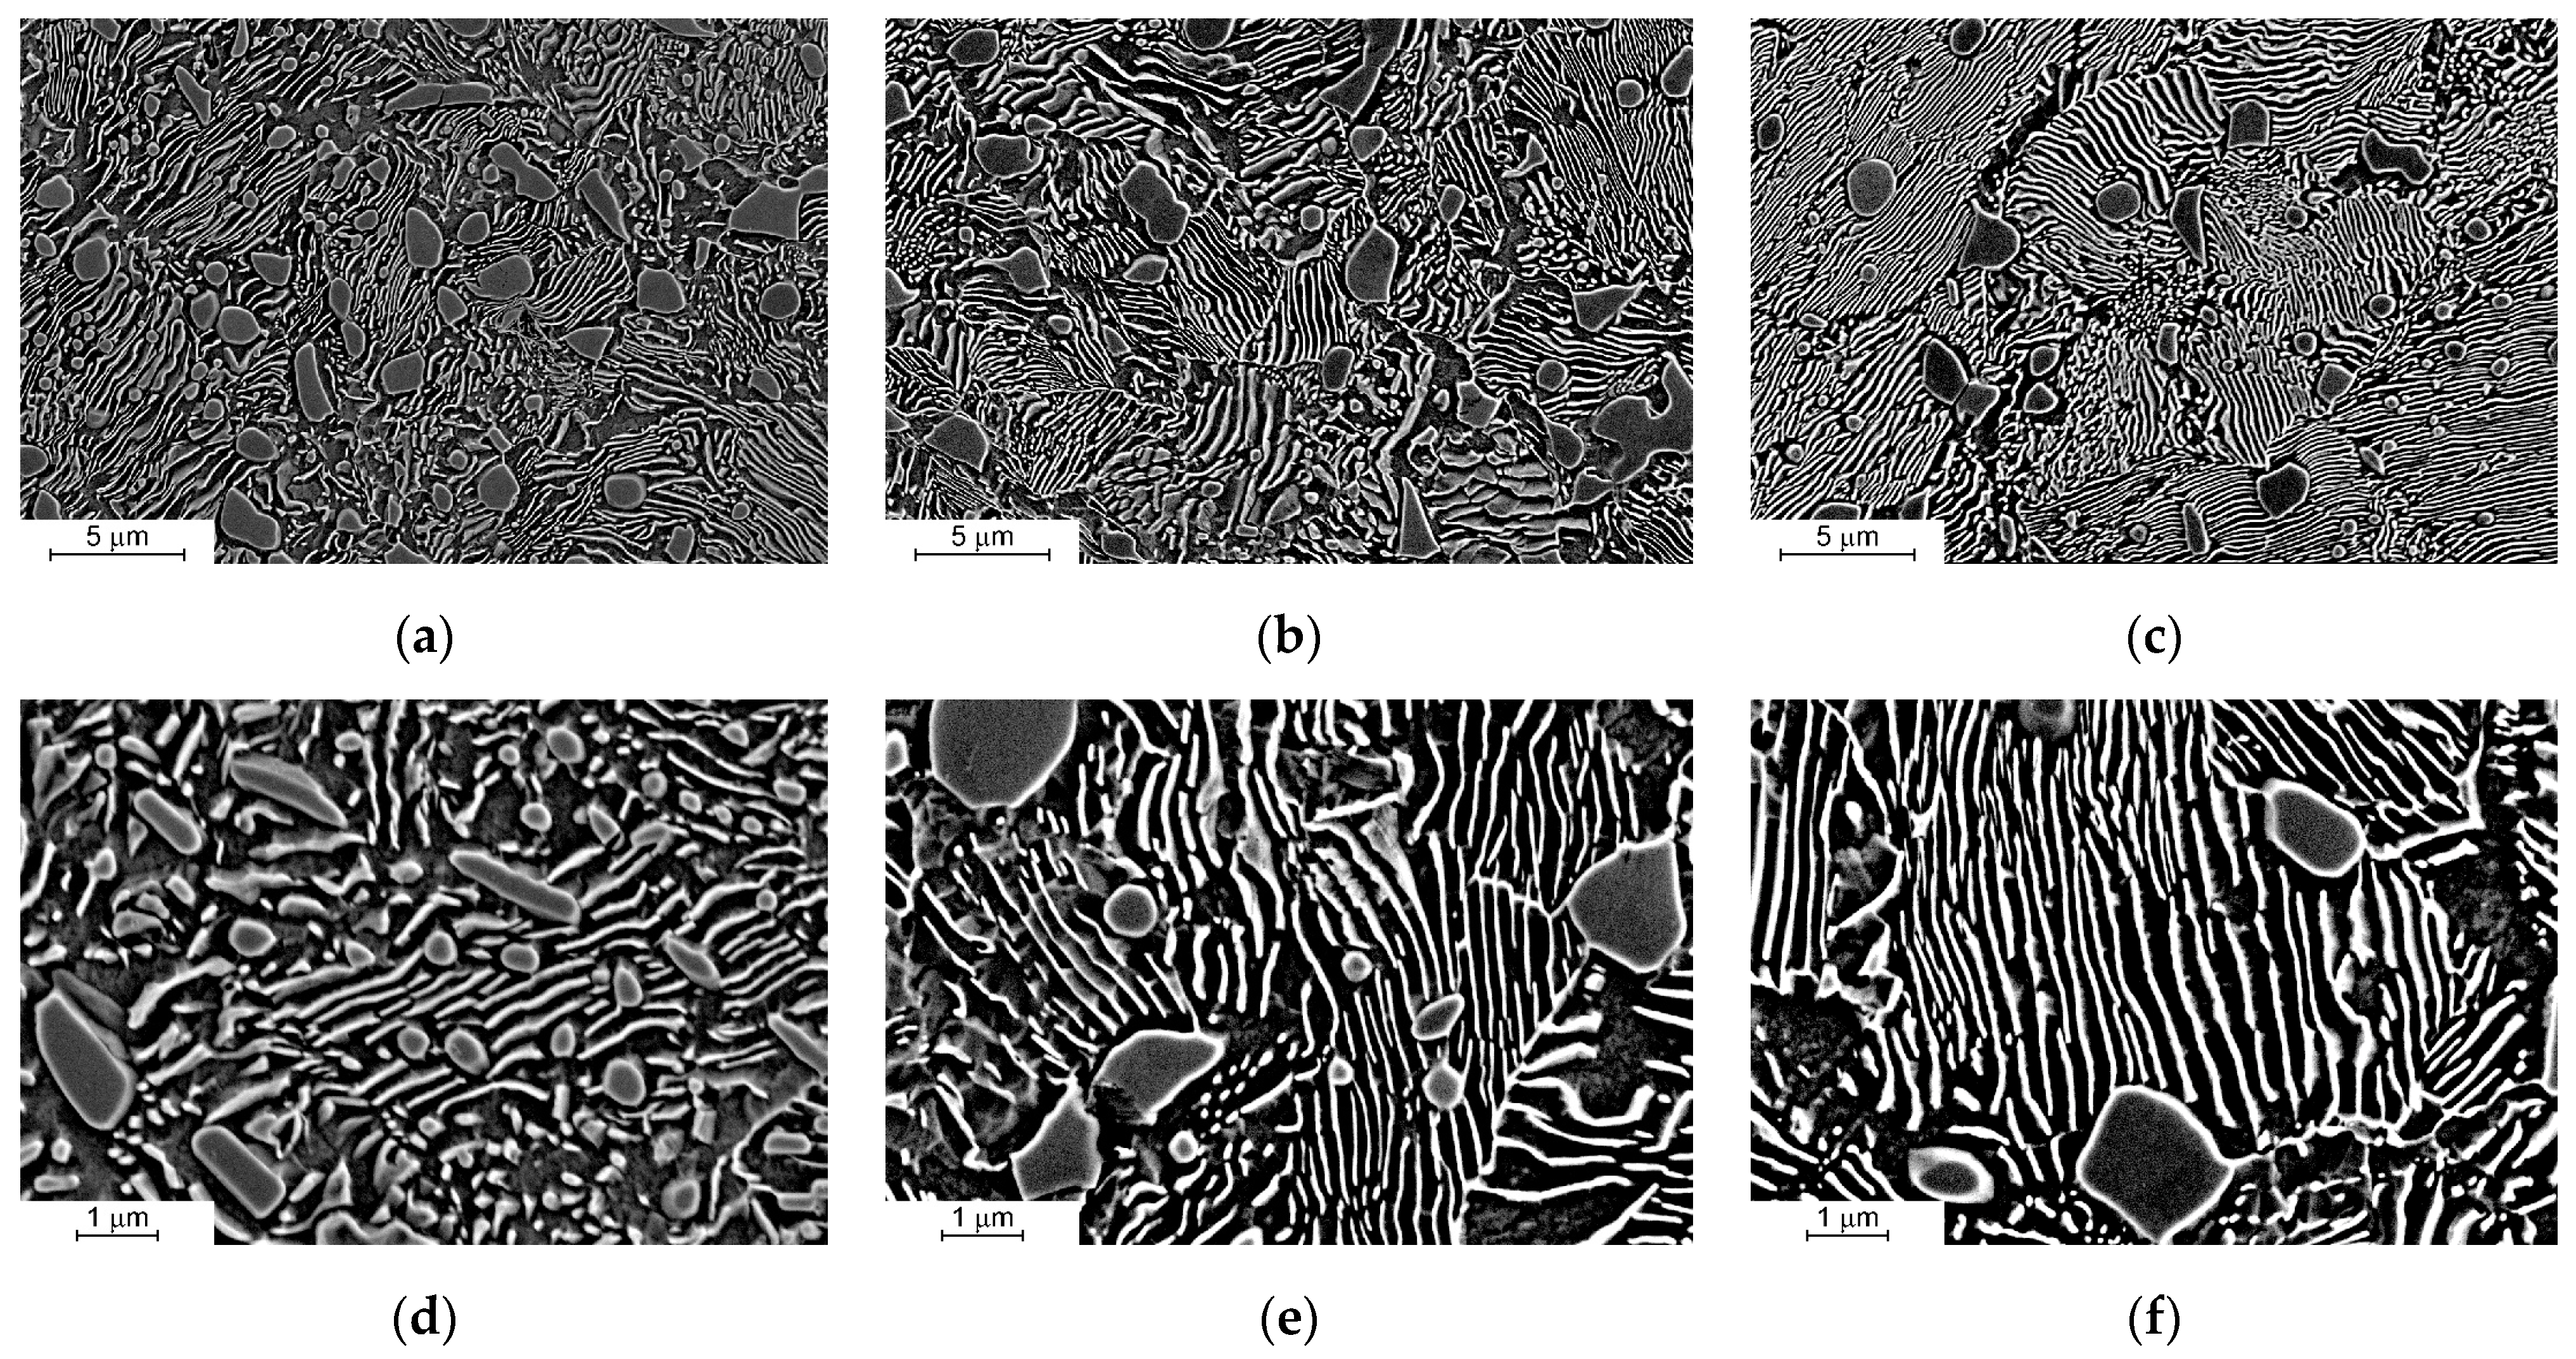
Figure 5.
Microstructure of the investigated material: (a,d)—4 h annealing; (b,e)—8 h annealing; (c,f)—12 h annealing.
The microstructural analysis of the material conducted using scanning electron microscopy (SEM) reveals that the tested samples exhibit a pearlitic microstructure with secondary carbide precipitates. Based on the chemical composition of the alloy, it can be concluded that these precipitates are secondary cementite. As a result of the heat treatment process, a gradual dissolution of smaller secondary cementite precipitates is observed. Comparing the samples annealed for 4 and 8 h shows an increase in the average size of pearlite colonies (Figure 5a,b). This trend continues with the extension of the annealing time (Figure 5c). Observations at higher magnification confirm that the heat treatment process leads to the gradual dissolution of smaller carbide precipitates. In the case of the sample annealed for 12 h, only larger carbide precipitates are visible in the material’s microstructure (Figure 5d–f).
The microstructural documentation of the material facilitated a stereological analysis of the different heat treatment variants. The analysis focused on the average cross-sectional area of the carbides, their shape factor, and their volume fraction. The shape factor of the carbide was calculated as the ratio of the carbide’s area to the area of the circumscribing circle. Particles with a shape factor greater than 0.6 were considered spherical. Additionally, the average size of pearlite colonies and the average interlamellar spacing in the pearlite were analyzed. The results of the stereological analysis for the investigated material are presented in Table 4.
Table 4.
Results of the stereological analysis of the investigated samples.
The analysis indicates that, with increasing annealing time, the average size of the carbides increases. The largest particles are observed in the sample annealed for 8 h. For the 12 h annealed sample, the average carbide area is smaller than that of the 8 h sample but larger than that of the sample subjected to the shortest annealing time. As the annealing time extends, the average volume fraction of carbides present in the material decreases. Examining the changes in the shape factor of the studied materials, it can be observed that all materials exhibit carbide precipitates with a nearly spherical cross-section. However, the shape factor is lowest for the sample annealed for 8 h. The matrix analysis of the material revealed that, with an increase in annealing time, there is a rise in the size of pearlitic colonies. This increase can be linked to a reduction in the volume fraction of the observed precipitates. As their volume fraction decreases, there are fewer particles available to act as nucleation sites for pearlitic colonies, resulting in larger average colony sizes. Additionally, the annealing time affected the average actual interlamellar spacing in the pearlite. A decrease in this parameter is observed with longer annealing times (Table 4).
The stereological analysis of the material’s microstructure was complemented by an examination of the carbide size distribution. Figure 6 illustrates the frequency distribution histograms for carbide sizes. The range of carbide sizes was restricted to areas of up to 1 µm2. Carbides larger than 1 µm2 were classified separately. Additionally, labels indicating the percentage share of each size class within the total population of precipitates have been included above the bars.
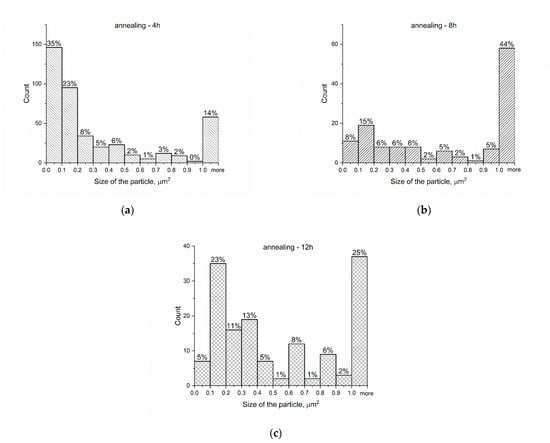
Figure 6.
Frequency distribution of carbide sizes for the test samples. (a) 4 h of annealing, (b) 8 h of annealing, (c) 12 h of annealing.
The frequency distribution histograms reveal that, as the annealing time increases, the number of smallest precipitates in the samples decreases. It is observed that the proportion of carbides with sizes of up to 0.1 µm2 diminishes with longer annealing times. For the material annealed for 4 h, this size range is the most prevalent, constituting 35% of the total population of precipitates. The next most common range is for carbides sized between 0.1 and 0.2 µm2 (Figure 6a). In contrast, for the sample annealed for 8 h, the most frequent size range is for carbides larger than 1 µm2, which account for 44% of the total population. The second most prevalent range is carbides sized between 0.1 and 0.2 µm2, making up approximately 15% of the total population (Figure 6b). For the 12 h annealing treatment, carbides larger than 1 µm2 are also the most common, representing around 25% of the total population, while the next most common range is between 0.1 and 0.2 µm2, comprising 23% (Figure 6c). The analysis of particle size distributions indicates that, with increasing annealing time, the number of the smallest carbides in the material decreases as they dissolve in favor of larger carbides. Additionally, the significant population of particles larger than 1 µm2 for the 8 h annealing variant explains the highest average particle size for this treatment. Similarly, the notable presence of larger particles contributes to the reduced shape factor for this annealing variant. The considerable variation in the sizes of the observed carbides explains the high measurement uncertainty for the average carbide size presented in Table 4.
4. Discussion
The conducted tribological wear studies of high-carbon iron alloys, resulting from various annealing times within the austenitizing temperature range, reveal significant complexity. In the initial phase of the research, the focus was on the influence of variables such as the applied load and test duration on the tribological wear of the material. It was observed that extending the test duration and increasing the applied load generally led to higher tribological wear of the materials, which aligns with the expected intensification of the wear process. However, the considerable variability in the results made it challenging to analyze correlations between tribological test parameters and heat treatment conditions. Consequently, statistical tools were employed to identify parameters with a significant impact on the material’s wear resistance as a function of heat treatment time. The analysis revealed that neither the applied load nor the test duration, despite observable differences, showed statistically significant variations in terms of mass loss or friction coefficient. Significant statistical differences were only observed in the depth of wear when using a profilometer, depending on the applied load during the tribological test. Increased load directly influenced the average depth of wear. Analyzing the volumetric wear in the block–ring tribological setup was notably challenging due to the changing contact geometry of the materials during the test. Initially, the materials were in linear contact, which eventually transitioned to conformal contact, altering loading conditions and affecting wear dynamics. Additionally, the fixture used in the T-05 tribotester allows for the plastic flow of the material parallel to the contact surface. This could significantly increase the depth of wear, especially in materials with low hardness. High applied loads may have promoted the plastic flow of the material, as observed by the increase in wear depth. Therefore, significant statistical differences in wear depth were noted with different applied loads during the tests. Surface analysis of wear confirmed the dominant mechanisms of micro-cutting and micro-grooving, as well as material delamination. The presence of deep grooves suggests they may have resulted from contact with carbides in the microstructure of the counter-sample and the influence of wear products on the contacting surfaces. However, the significance of wear products in the tests is limited due to their continuous removal from the contact areas. No changes in the wear mechanism were observed depending on either the heat treatment variant or the tribological test parameters. This suggests that, under the given conditions, the material exhibited high wear resistance. Further analyses indicated increasing resistance to abrasive wear with longer annealing times, with significant statistical differences observed between samples annealed for 4 h and the other heat treatment variants. For the friction coefficient, an increase was noted with longer annealing times. The relationship between annealing time and wear depth was similar to that observed for mass loss, although it exhibited high result variability. The stable wear of the material under different tribological test conditions suggests that the primary factor affecting wear resistance is the material’s microstructure. Microscopic examinations revealed that the materials are characterized by a pearlitic matrix with secondary cementite precipitates. Significant differences were observed in the distribution of precipitate sizes. Longer annealing times led to the dissolution of smaller carbide particles, resulting in a dominance of larger particles in the material. Particles with an average cross-sectional area exceeding 1 µm2, present in samples annealed for 8 and 12 h, effectively improved resistance to abrasive wear, as reflected in the lower mass loss of these samples compared to those annealed for 4 h. A more uniform distribution of particle sizes will improve wear resistance, as supported by the literature [15,28]. The authors conclude that particles with an average cross-section of less than 0.1 µm2 will not play a significant role under conditions of intensive tribological wear. It can be assumed that particles with such small cross-sections can be considered circular. Consequently, the diameter of the smallest particles will be close to or smaller than the interlaminar distance in perlite. This implies that these particles, while within the material, will be encased in pearlitic cementite, which, due to its higher volume fraction, will exert a dominant influence on the wear process. Therefore, an increase in the volume fraction of particles with larger diameters should result in enhanced abrasion resistance. The objective of the heat treatment was to achieve a more uniform distribution of precipitates in the material [17,18,19]. The application of a high heat-treatment temperature within the austenitic range resulted in the gradual dissolution of carbides until the thermodynamic equilibrium of the austenite + secondary cementite system was reached. Subsequently, the material was cooled at a slow rate, which resulted in the precipitation of excess carbon and alloying elements from the austenite. Given the potential for diffusion over longer distances, it is plausible that these elements may have contributed to an increase in the average diameter of the carbides already present in the material, thereby facilitating their growth. This phenomenon may account for the observed reduction in the volume fraction of precipitates in the material. The parameter Vv, which describes the average volumetric share of precipitates, was assessed by calculating the ratio of the area occupied by carbides to the total area of the test area. A reduction in the number of carbides observed in the randomly selected 10 test areas directly affects this parameter. Furthermore, in variant 8 h, it was observed that a significant percentage of carbides with an average cross-sectional area exceeding 1 µm2 resulted in an increase in the mean value of the carbide cross-sectional area, as illustrated in Table 4. The material’s microstructure, consisting of ferrite and cementite precipitates with a plate-like morphology, also affects wear resistance by effectively countering abrasive wear and accumulating energy through plastic deformation. Changes in the material’s microstructure also impact its hardness. The relationship between the hardness of the samples and the annealing time is shown in Figure 7.
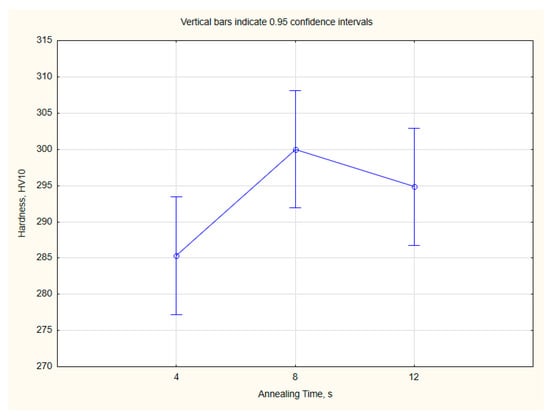
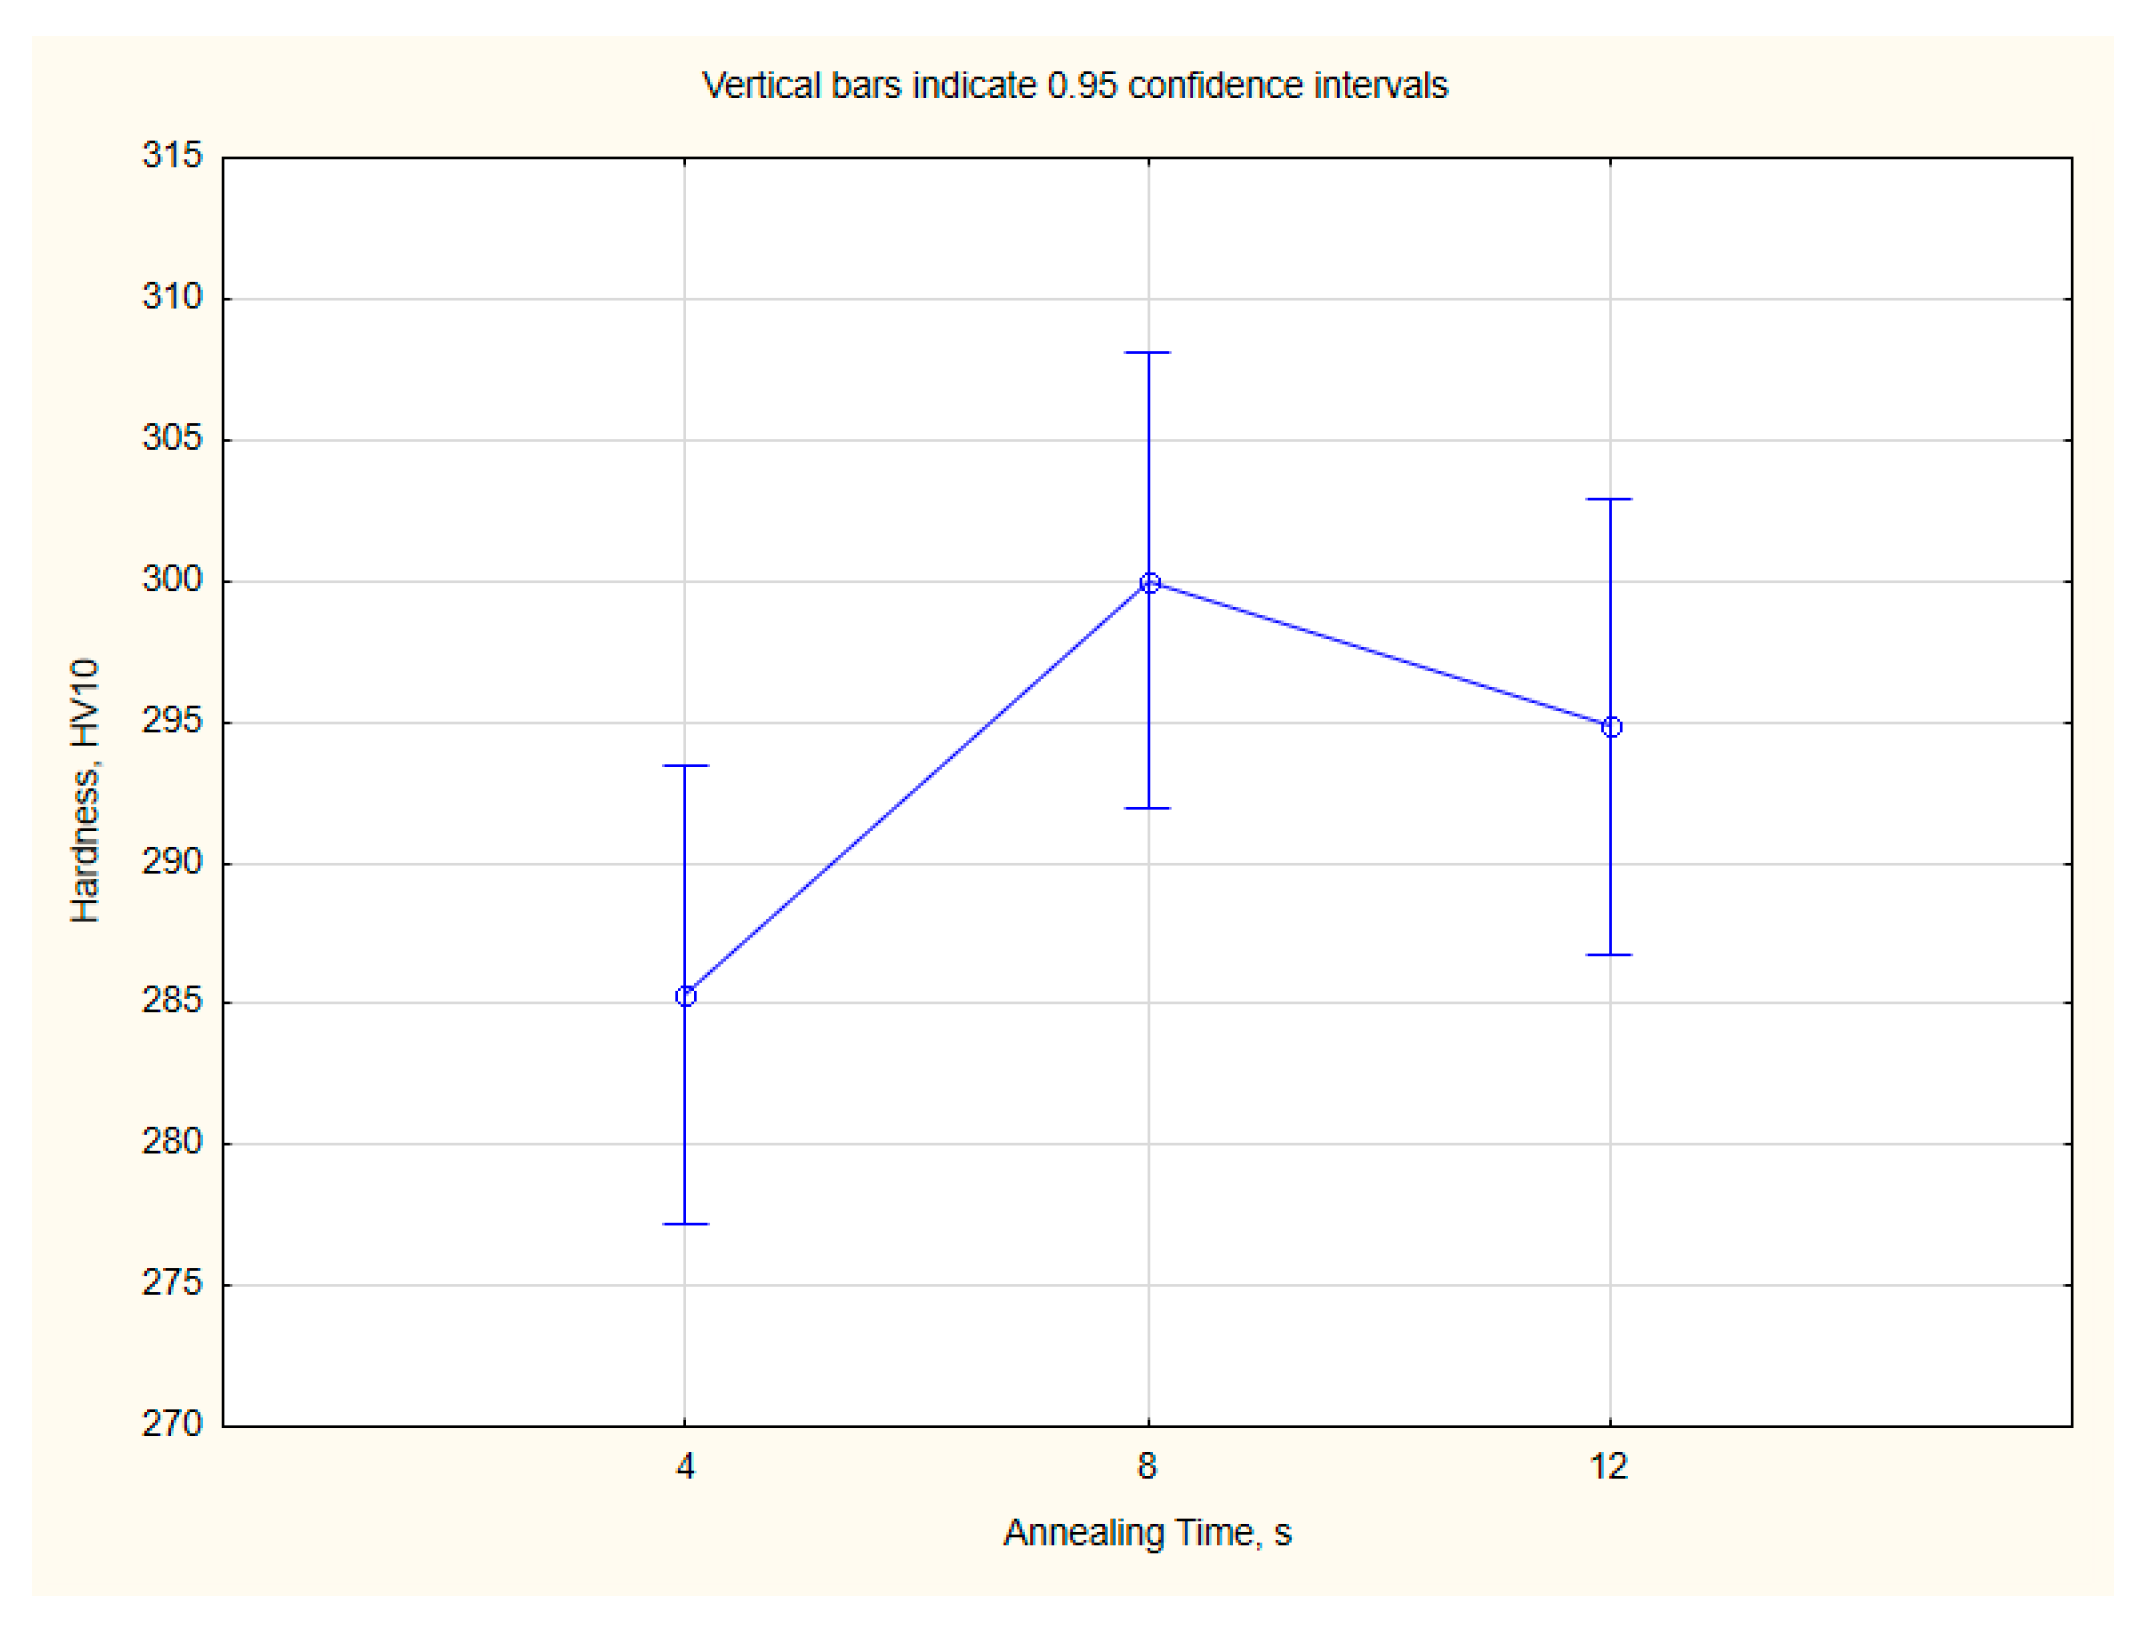
Figure 7.
Dependence of the average hardness of the tested samples on the annealing time.
It can be observed that samples annealed for 4 h exhibit lower hardness compared to those annealed for 8 and 12 h. The changes in the material resulting from the annealing process have influenced its hardness, thereby enhancing its wear resistance. In particular, the significant increase in the proportion of larger carbides in the overall study population improved the wear resistance of the material. It also effectively strengthened the material by increasing its hardness. Therefore, achieving a possible homogenization of the carbide distribution within the material is crucial.
5. Conclusions
The conducted research enables the formulation of the following conclusions:
- The tribological tests conducted on the high-carbon steel under various loading conditions and test durations demonstrated that, as expected, higher mass wear values were generally observed for samples subjected to higher loads and longer test durations. However, a straightforward relationship between the tribological test parameters and the different heat treatment parameters of the material was not always apparent. Therefore, statistical tools were employed to facilitate the interpretation of the obtained results.
- The use of ANOVA (Analysis of Variance) allowed for the identification of statistically significant differences between the annealing time and the material’s abrasive wear resistance. No clear statistical differences were observed in the mass loss of samples with increased load or extended test duration. The only parameter significantly affected by the tribological test parameters was the depth of wear. Higher loads resulted in increased volumetric wear of the material. However, the absence of a similar relationship for mass loss suggests that significant plastic deformation occurred in the material without corresponding mass loss.
- The lack of significant statistical differences under different test conditions indicates that there is no substantial variation in the wear mechanism of the tested materials. Scanning studies confirmed that the predominant wear mechanisms were microcutting and grooving of the material. The worn surfaces exhibited numerous grooves and also showed signs of material flaking. No significant differences were observed among the analyzed samples concerning their wear mechanisms.
- The stable wear behavior of the material within the same wear mechanism also underscores the significant role of the material matrix in determining its abrasive wear resistance. The studied alloys featured a pearlitic matrix with secondary cementite precipitates. The annealing process led to the dissolution of the smallest particles present in the material and a gradual homogenization of particle size distribution. The process of homogenizing cementite particle sizes resulted in improved tribological wear resistance of the material.
Author Contributions
Conceptualisation, J.K.; investigation, Ł.F., M.K., and S.L.; methodology, Ł.F.; software, P.M. and M.K.; supervision, J.K.; validation, Ł.F. and S.L.; writing—original draft, Ł.F.; writing—review and editing, Ł.F. and J.K. All authors have read and agreed to the published version of the manuscript.
Funding
This research was financed by the Ministry of Education and Science (AGH—research subsidy No. 16.16.110.663).
Institutional Review Board Statement
Not applicable.
Informed Consent Statement
Not applicable.
Data Availability Statement
The raw data supporting the conclusions of this article will be made available by the authors on request.
Acknowledgments
The authors would like to thank Adrianna Czernik and Andrzej Czarski for their support of this research.
Conflicts of Interest
The authors declare no conflicts of interest.
References
- Wang, H.; Yu, S. Influence of Heat Treatment on Microstructure and Sliding Wear Resistance of High Chromium Cast Iron Electroslag Hardfacing Layer. Surf. Coat. Technol. 2017, 319, 182–190. [Google Scholar] [CrossRef]
- Zheng, B.; Xing, J.; Li, W.; Tu, X.; Jian, Y. Effect of Chromium-Induced (Fe, Cr)3C Toughness Improvement on the Two-Body Abrasive Wear Behaviors of White Cast Iron. Wear 2020, 456–457, 203363. [Google Scholar] [CrossRef]
- Modi, O.P.; Mondal, D.P.; Prasad, B.K.; Singh, M.; Khaira, H.K. Abrasive Wear Behaviour of a High Carbon Steel: Effects of Microstructure and Experimental Parameters and Correlation with Mechanical Properties. Mater. Sci. Eng. A 2003, 343, 235–242. [Google Scholar] [CrossRef]
- Coronado, J.J.; Sinatora, A. Load Effect in Abrasive Wear Mechanism of Cast Iron with Graphite and Cementite. Wear 2009, 267, 6–11. [Google Scholar] [CrossRef]
- Sun, J.Y.; Mao, X.Y.; Zhou, X.; Zhao, X.M.; Li, D.Y. Effect of Loads on Wear Behavior of Carbon Steel Surface with Gradient Microstructure at High Temperature. Mater. Lett. 2020, 261, 126999. [Google Scholar] [CrossRef]
- Farias, M.C.M.; Souza, R.M.; Sinatora, a.; Tanaka, D.K. The Influence of Applied Load, Sliding Velocity and Martensitic Transformation on the Unlubricated Sliding Wear of Austenitic Stainless Steels. Wear 2007, 263, 773–781. [Google Scholar] [CrossRef]
- Pawar, S.; Jha, A.K.; Mukhopadhyay, G. Effect of Different Carbides on the Wear Resistance of Fe-Based Hardfacing Alloys. Int. J. Refract. Met. Hard Mater. 2019, 78, 288–295. [Google Scholar] [CrossRef]
- Xu, L.; Wei, S.; Xing, J.; Long, R. Effects of Carbon Content and Sliding Ratio on Wear Behavior of High-Vanadium High-Speed Steel (HVHSS) under High-Stress Rolling-Sliding Contact. Tribol. Int. 2014, 70, 34–41. [Google Scholar] [CrossRef]
- Kootsookos, A.; Gates, J.D. The Role of Secondary Carbide Precipitation on the Fracture Toughness of a Reduced Carbon White Iron. Mater. Sci. Eng. A 2008, 490, 313–318. [Google Scholar] [CrossRef]
- Xi, Z.-J.; Koyama, M.; Yoshida, Y.; Yoshimura, N.; Ushioda, K.; Noguchi, H. Effects of Cementite Morphology on Short-Fatigue-Crack Propagation in Binary Fe–C Steel. Philos. Mag. Lett. 2015, 95, 384–391. [Google Scholar] [CrossRef]
- Deshpande, S.; Anekar, N.; Vagge, S.; Joshi, A. Wear Behavior of Spheroidal Graphite Cast Iron in Biodiesel Blends. J. Bio Tribocorros 2020, 6, 4. [Google Scholar] [CrossRef]
- Soiński, M.S.; Jakubus, A. Initial Assessment of Abrasive Wear Resistance of Austempered Cast Iron with Vermicular Graphite. Arch. Metall. Mater. 2014, 59, 1073–1076. [Google Scholar] [CrossRef]
- Muchammad; Syafa’at, I.; Hilmy, F.; Tauviqirrahman, M.; Jamari. Wear Analysis of Spherical Graphite Cast Iron Using Pin-on Disc Tribotester. J. Phys. Sci. 2018, 29, 15–26. [Google Scholar] [CrossRef]
- Marui, E.; Hasegawa, N.; Endo, H.; Tanaka, K.; Hattori, T. Research on the Wear Characteristics of Hypereutectoid Steel. Wear 1997, 205, 186–199. [Google Scholar] [CrossRef]
- Saha, A.; Mondal, D.K.; Biswas, K.; Maity, J. Development of High Strength Ductile Hypereutectoid Steel by Cyclic Heat Treatment Process. Mater. Sci. Eng. A 2012, 541, 204–215. [Google Scholar] [CrossRef]
- Kim, H.; Kang, J.Y.; Son, D.; Lee, T.H.; Cho, K.M. Evolution of Carbides in Cold-Work Tool Steels. Mater. Charact. 2015, 107, 376–385. [Google Scholar] [CrossRef]
- Altuntaş, O.; Güral, A. Designing Spherical Cementite in Bainitic Matrix (SCBM)Microstructures in High Carbon Powder Metal Steels to Improve Dry Sliding Wear Resistance. Mater. Lett. 2019, 249, 185–188. [Google Scholar] [CrossRef]
- Woodward, R.G.; Toumpis, A.; Galloway, A. The Influence of Cementite Spheroidizing Duration on the Microstructure and Sliding Wear Response of Grey Cast Iron against AISI 4330. Wear 2022, 488–489, 204155. [Google Scholar] [CrossRef]
- Anoop, F.R.; Abraham Jacob, B.; Kuriachen, B.; Malgave, S. Effect of Heat Treatment on Microstructure and Wear Properties on Binder Jetting Additive Manufactured M2 High-Speed Steel. Mater. Lett. 2024, 375, 137228. [Google Scholar] [CrossRef]
- Kaba, M.; Filiz, H.I.; Cui, Z.; Baydogan, M.; Cimenoglu, H.; Alpas, A.T. Microstructural Effects on Impact-Sliding Wear Mechanisms in D2 Steels: The Roles of Matrix Hardness and Carbide Characteristics. Wear 2024, 538–539, 205224. [Google Scholar] [CrossRef]
- Tsybenko, H.; Tian, C.; Rau, J.; Breitbach, B.; Schreiber, P.; Greiner, C.; Dehm, G.; Brinckmann, S. Deformation and Phase Transformation in Polycrystalline Cementite (Fe3C) during Single- and Multi-Pass Sliding Wear. Acta Mater. 2022, 227, 117694. [Google Scholar] [CrossRef]
- Li, Y.; Jiang, Z.; Li, L.; Wang, P.; Li, D.; Xue, W.; Duan, D. Wear Behavior and Damage Characterization for AISI 52100 Bearing Steels: Effect of Hardness and Spherical Carbides. J. Mater. Res. Technol. 2024, 30, 8359–8370. [Google Scholar] [CrossRef]
- Ahmed, A.N.; Rashed, H.M.M.A. ANOVA Modeling on Sintering Parameters and Frequencies, Affecting Microstructure and Dielectric Constant of Nb Doped BaTiO3. Procedia Eng. 2014, 90, 72–77. [Google Scholar] [CrossRef]
- Sułowski, M.; Matusiewicz, P.; Kij, P. Optimization of the Manufacturing Process of Sintered Fe-Mn-Cr-Mo-C Steels Using ANOVA. In Materials Science Forum; Trans Tech Publications Ltd.: Wollerau, Switzerland, 2023; Volume 1081, pp. 131–136. [Google Scholar]
- Sułowski, M.; Jordan, A.; Czarski, A.; Matusiewicz, P. Estimation of the Effect of Production Parameters on Mechanical Properties of Sintered Steels Using ANOVA. Arch. Metall. Mater. 2017, 62, 571–576. [Google Scholar] [CrossRef]
- Saxena, P.; Bongale, A.; Kumar, S.; Suresh, R. Tribological and Hardness Analyses of Friction-Stir-Processed Composites Using the Taguchi Approach. Materials 2023, 16, 420. [Google Scholar] [CrossRef]
- Kondul, B.; Cetin, M.H. Increasing the Wear Resistance of Railway Switches with Boron Coating and Analysis of Tribological Performance by ANOVA Method. Wear 2022, 488–489, 204132. [Google Scholar] [CrossRef]
- Lv, Z.Q.; Wang, B.; Wang, Z.H.; Sun, S.H.; Fu, W.T. Effect of Cyclic Heat Treatments on Spheroidizing Behavior of Cementite in High Carbon Steel. Mater. Sci. Eng. A 2013, 574, 143–148. [Google Scholar] [CrossRef]

Disclaimer/Publisher’s Note: The statements, opinions and data contained in all publications are solely those of the individual author(s) and contributor(s) and not of MDPI and/or the editor(s). MDPI and/or the editor(s) disclaim responsibility for any injury to people or property resulting from any ideas, methods, instructions or products referred to in the content. |
© 2024 by the authors. Licensee MDPI, Basel, Switzerland. This article is an open access article distributed under the terms and conditions of the Creative Commons Attribution (CC BY) license (https://creativecommons.org/licenses/by/4.0/).