Article

Features of Temporal Variability of the Concentrations of Gaseous Trace Pollutants in the Air of the Urban and Rural Areas in the Southern Baikal Region (East Siberia, Russia)

by
Maxim Y. Shikhovtsev
1,2,*,
Yelena V. Molozhnikova
1,*,
Vladimir A. Obolkin
1,
Vladimir L. Potemkin
1,
Evgeni S. Lutskin
1 and
Tamara V. Khodzher
1
1
Limnological Institute, Siberian Branch, Russian Academy of Sciences, Ulan-Batorskaya Street 3, Irkutsk 664033, Russia
2
Matrosov Institute for System Dynamics and Control Theory, Siberian Branch of Russian Academy of Sciences, Irkutsk 664033, Russia
*
Authors to whom correspondence should be addressed.
Appl. Sci. 2024, 14(18), 8327; https://doi.org/10.3390/app14188327
Submission received: 26 August 2024 / Revised: 13 September 2024 / Accepted: 14 September 2024 / Published: 15 September 2024
(This article belongs to the Special Issue Air Pollution and Its Impact on the Atmospheric Environment)

Abstract

:
This article presents the results of the automatic monitoring of the concentrations of gaseous impurities of sulfur and nitrogen oxides in the ground-level atmosphere of the urban and rural areas in the Southern Baikal region (East Siberia, Russia). The study was conducted from 2020 to 2023 at the urban Irkutsk station and the rural Listvyanka station located at a distance of 70 km from each other. We calculated the main statistical characteristics of the variations in the concentrations of nitrogen oxides and sulfur dioxide in the ground-level atmosphere and determined a nature of variability in their concentrations on various time scales: annual, weekly, and daily. Annual variabilities of gaseous pollutants in the ground-level atmosphere above the Irkutsk city and the Listvyanka settlement were similar and showed the highest values in winter and the lowest in summer. The daily and weekly dynamics of the nitrogen oxide concentrations in the urban area clearly depended on the increase in the road traffic during rush hours (morning and evening). In the rural area, there was no such dependence. In this area, the daily and weekly variability in the concentrations of nitrogen oxides and sulfur dioxide mainly depended on natural meteorological processes. The work systematizes the meteorological parameters at which the largest amount of anthropogenic impurities enters the air basin of Lake Baikal. The maximum values of acid-forming gas concentrations were observed when the air masses were transferred from the northwest direction, which corresponds to the location of sources in the territory of the Irkutsk–Cheremkhovo industrial hub—the largest concentration of anthropogenic objects in the Irkutsk region.

1. Introduction

Sulfur dioxide (SO2) and nitrogen oxides (NOx) are among the most widespread gaseous pollutants in the air and have a significant impact on the regional and global air quality, human health, environmental conditions, and climate change [1,2,3,4,5]. The high-temperature combustion of organic fuels (coal and oil) and biomass [6,7,8], as well as thunderstorm activity [9] and the microbial N-cycle [10,11], are the main sources of NOx (NOx = NO + NO2). NO2 is involved in the nitrogen cycle in the “air–water–soils” system [12], which affects the intensity of oxidation processes in the air [13] and, in the presence of volatile organic compounds in the air, leads to the formation of ground-level ozone [14,15].
The main SO2 sources are volcanic activity, the combustion of organic fuels, and the purification of sulfide ores [16,17]. Volcanic SO2 is emitted into the air at high altitudes above the atmospheric boundary layer (ABL). Anthropogenic SO2 emissions from thermal power and industrial facilities enter mainly within the ABL. Nitrogen and sulfur oxides in the ground level of the atmosphere participate in many physicochemical reactions. During the oxidation, nitrogen dioxide reacts with ammonia, leading to the formation of ammonium nitrate aerosol. Sulfur dioxide is oxidized in the reactions with the hydroxyl radical, ozone, or hydrogen peroxide, producing sulfate aerosols. This contributes to air pollution by particulate matter with an aerodynamic diameter <2.5 µm (PM2.5) [18,19,20,21], possessing a serious risk to human health [22,23,24], reducing the meteorological visibility [25,26], and affecting the weather and climate through direct radiative forcing and indirect changes in cloud formation and optical properties [27,28].
Elevated concentrations of SO2 and NOx in the air increase the risks of respiratory and oncological diseases and negatively affect the reproductive systems of organisms [29,30,31,32,33]. Nitrogen and sulfur oxides are generally recognized as acid gases that contribute to the occurrence of acid rain, leading to the acidification of water bodies and soils, which possesses a serious threat to biodiversity, especially for plants [34]. High concentrations of nitrogen oxides have a negative impact on agricultural crops because they reduce the efficiency of plant growth, resulting in a decrease in yields.
The atmospheric air in the Southern Baikal region is subject to constant pollution by various impurities due to the large concentrations of industrial enterprises in the cities of the region that are located close to each other. Enterprises of the fuel and energy complex, chemistry and petrochemistry, metallurgy, woodworking, and pulp and paper production play a leading role in the industrial structure.
In 2022, the emissions of air pollutants from anthropogenic sources in the Irkutsk Region amounted to 739,000 tons per year. Of them, 40% entered the atmosphere from the enterprises situated in a relatively small area in the Angara River valley (Irkutsk–Cheremkhovo industrial hub). This is 3 times higher than the emissions from the anthropogenic sources in the Republic of Buryatia (107,000 tons per year) and 12 times higher than the emissions from the anthropogenic sources located in the Central Ecological Zone of Lake Baikal [35,36,37] (Figure 1).
Overall, the pollutants entering the air in the Southern Baikal region account for about 100 items, among which fuel combustion products (nitrogen and sulfur dioxides and carbon oxide) predominate in the amount of the annual influx to the atmospheric air. Emission plumes from large regional coal-fired thermal plants can reach the water area and the watershed basin of Lake Baikal, the world’s deepest lake, with a large volume of fresh water. Previous studies indicated the impact of technology-related emissions from the industrial complexes of the Sothern Baikal region on air pollution in the southern basin of Lake Baikal. The authors [38,39,40] revealed a change in the aerosol composition, the acidification of precipitation, and the other natural environments in the southern basin of Lake Baikal.
Air pollution monitoring, determining the qualitative and quantitative composition of air pollutants both in the source cities and on the lake shore, identifying pollutant transport mechanisms, and studying the patterns of pollution field formation are among the most important tasks of environmental protection in such a unique place as Lake Baikal.
This study aims to analyze the spatiotemporal distribution of gaseous pollutants, such as nitrogen oxide and sulfur oxide, in the ground-level atmosphere of urban and background areas of the Southern Baikal region and to determine the sources and relationships with meteorological conditions in the region.

2. Sampling and Analysis Methods

In this article, we present the analysis results of the measurement data on the ground-level concentrations of sulfur dioxide, nitrogen dioxide, and nitrogen oxide in the urban (Irkutsk city) and rural (Listvyanka settlement) areas of the Southern Baikal region. The experimental data cover the period between January 2020 and December 2023. The Irkutsk station is located on a hill in the southwestern part of the city. The sampling was conducted at the Limnological Institute (LIN) SB RAS (52.248, 104.260, altitude 496 m a.s.l.) at an altitude of 12 m above ground level. At the Listvyanka station, measuring devices are installed on the top of a coastal hill, 1 km northeast of the Listvyanka settlement (51.847, 104.893, altitude 656 m a.s.l.). The difference in altitude between the station and the settlement is 205 m. Figure 1 shows the schematic map of the layout of the observation stations and the main stationary sources of air pollution in the Southern Baikal region. The location and number of coal-fired boiler facilities in the Central Ecological Zone of Lake Baikal are indicated according to [41].
To measure the concentrations of sulfur dioxide (SO2) and nitrogen oxides (NO and NO2), chemiluminescence method-based SV-310 and Z-310 gas analyzers from OPTEK (St. Petersburg, Russia) were used. These devices were verified annually in the OPTEK laboratory (St. Petersburg, Russia). The permissible measurement error limit in the range from 0 to 2000 μg m3 is ±25%.
The meteorological parameters (wind speed and direction, air temperature) were measured at the Listvyanka station using the Sokol M1 meteorological station (Kazan, Russia). The vertical temperature stratification of the atmosphere was examined using the MTP-5 meteorological temperature profiler (Central Aerological Observatory, Russia) and the atmospheric radiosonde data obtained at the Angarsk station (52.48; 103.85) are available on the University of Wyoming website (https://weather.uwyo.edu/upperair/sounding.html, (accessed on 4 July 2024)).
The measured data were collected in real time using the LIN SB RAS server. For this purpose, a server with an installed database running PostgreSQL was organized, as well as a program that receives data from the stations via the Internet, performs primary processing, and records measurements in the database (DB). The DB structure allowed us, through SQL queries, to select data from gas analyzers either jointly or separately, with averaging and filtering. Network access to the DB allows the prompt provision of data to interested parties, including interested departments at the regional level. The freely distributed BI platform, Grafana, was used for the prompt access, analysis, and display of the measured data. The dashboard shows several analytical curves from the two monitoring stations grouped by gases (Figure 2). The left half depicts the data from the Irkutsk station and the right half represents the data from the Listvyanka station.

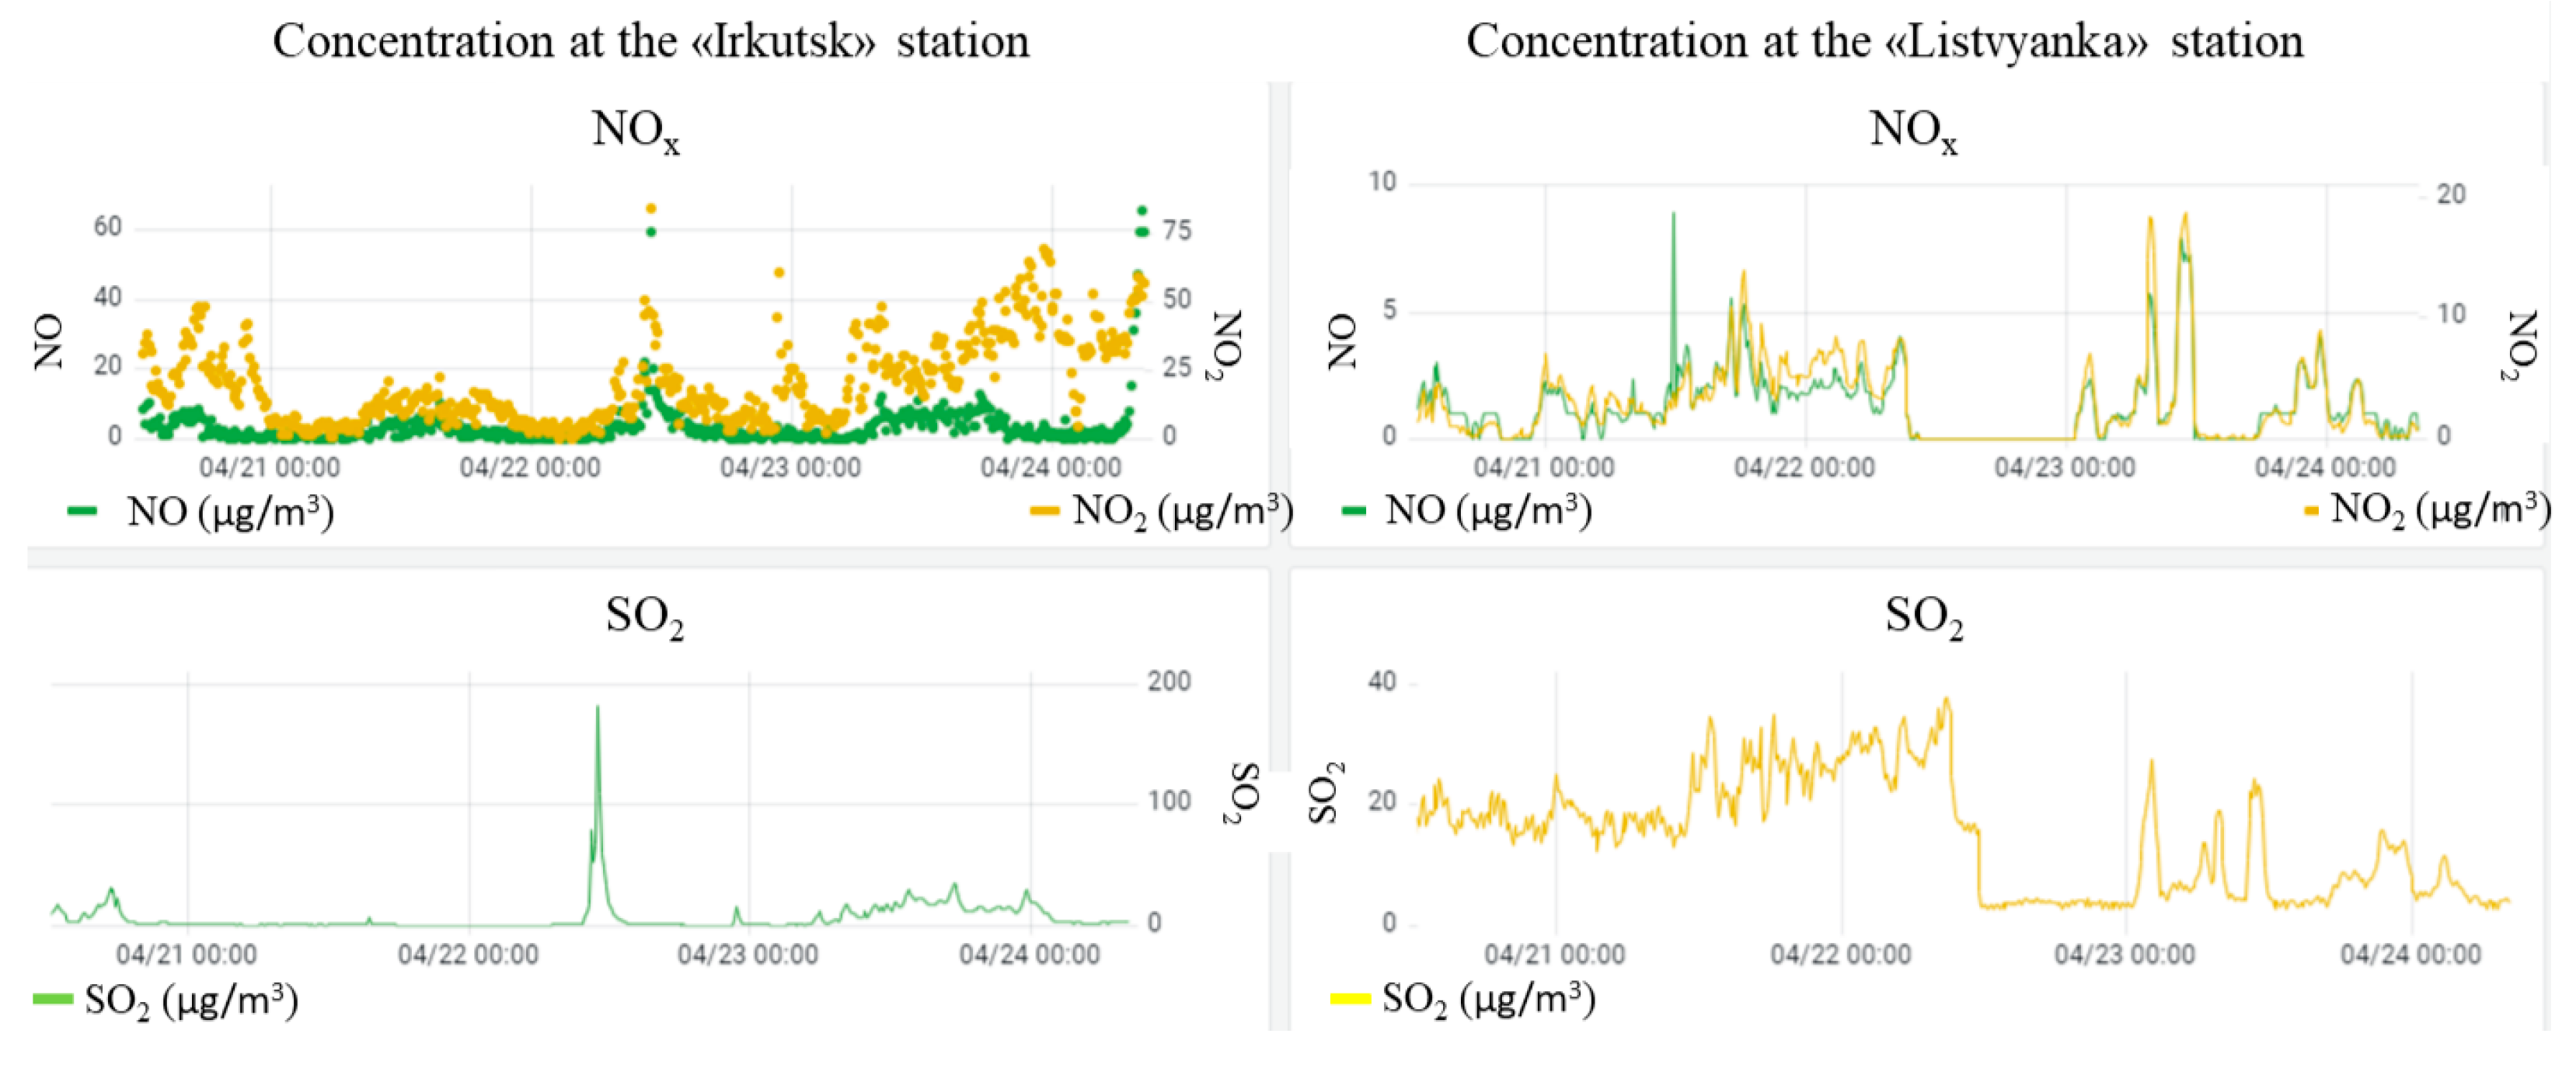
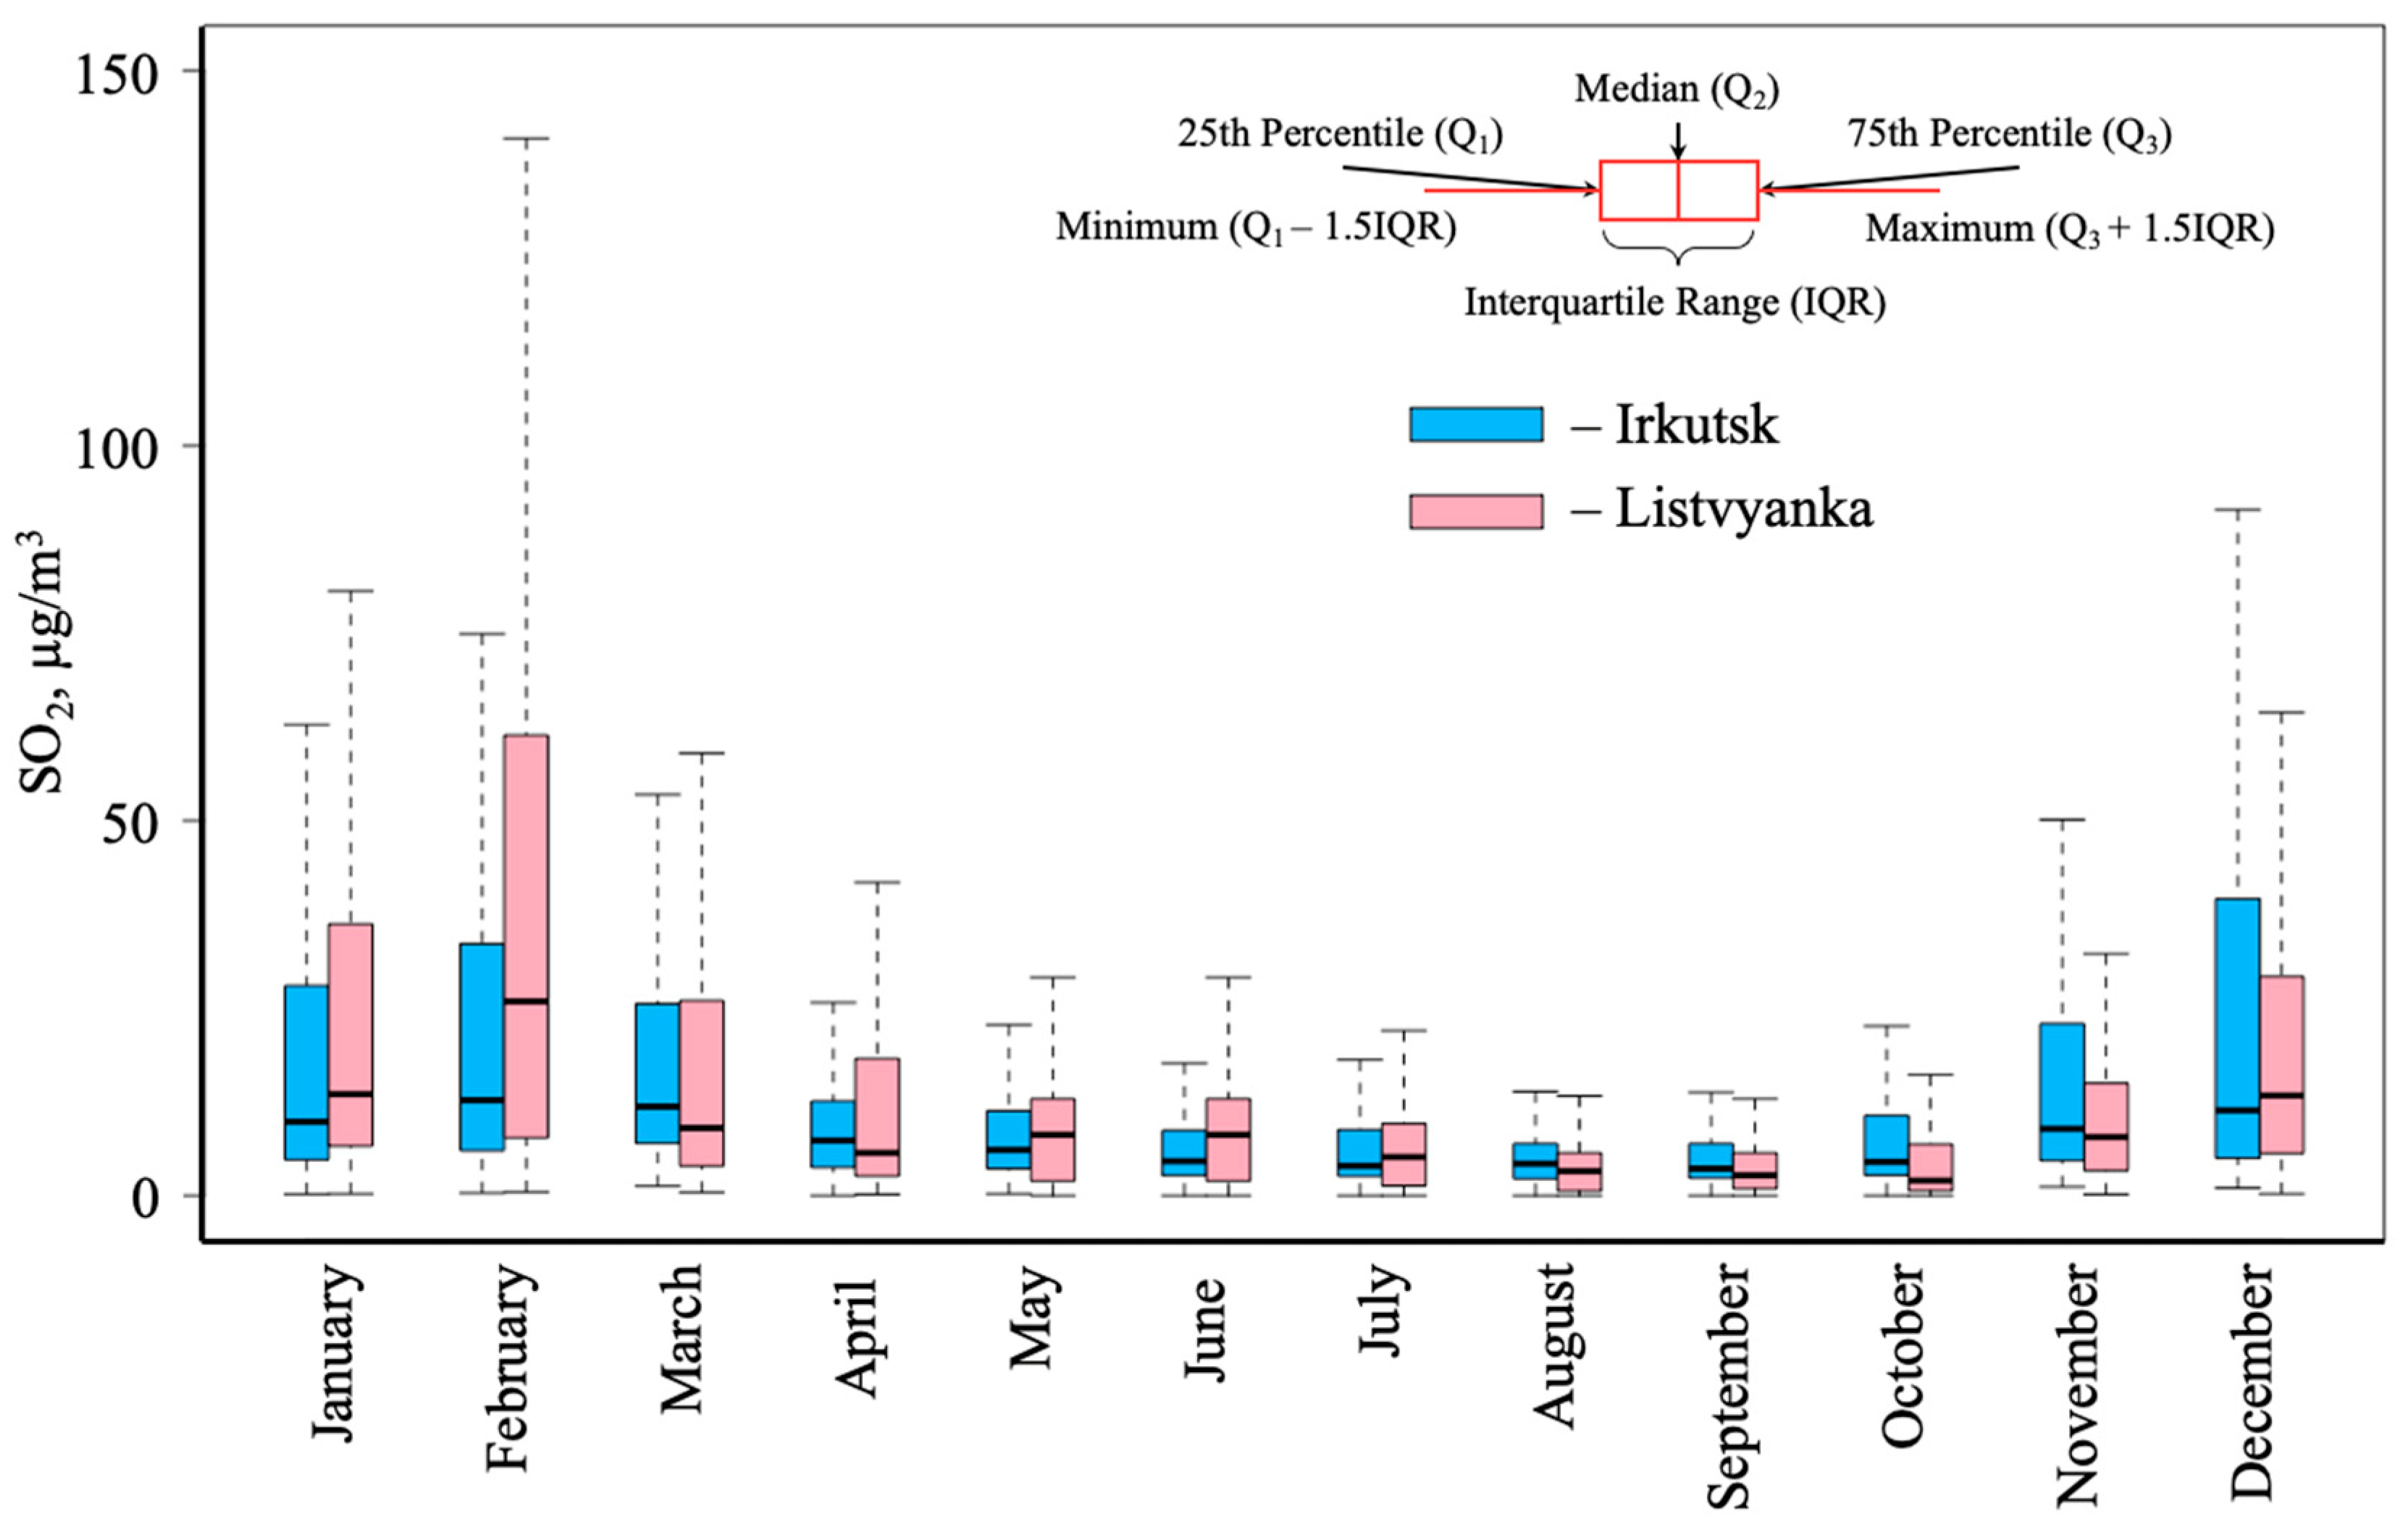
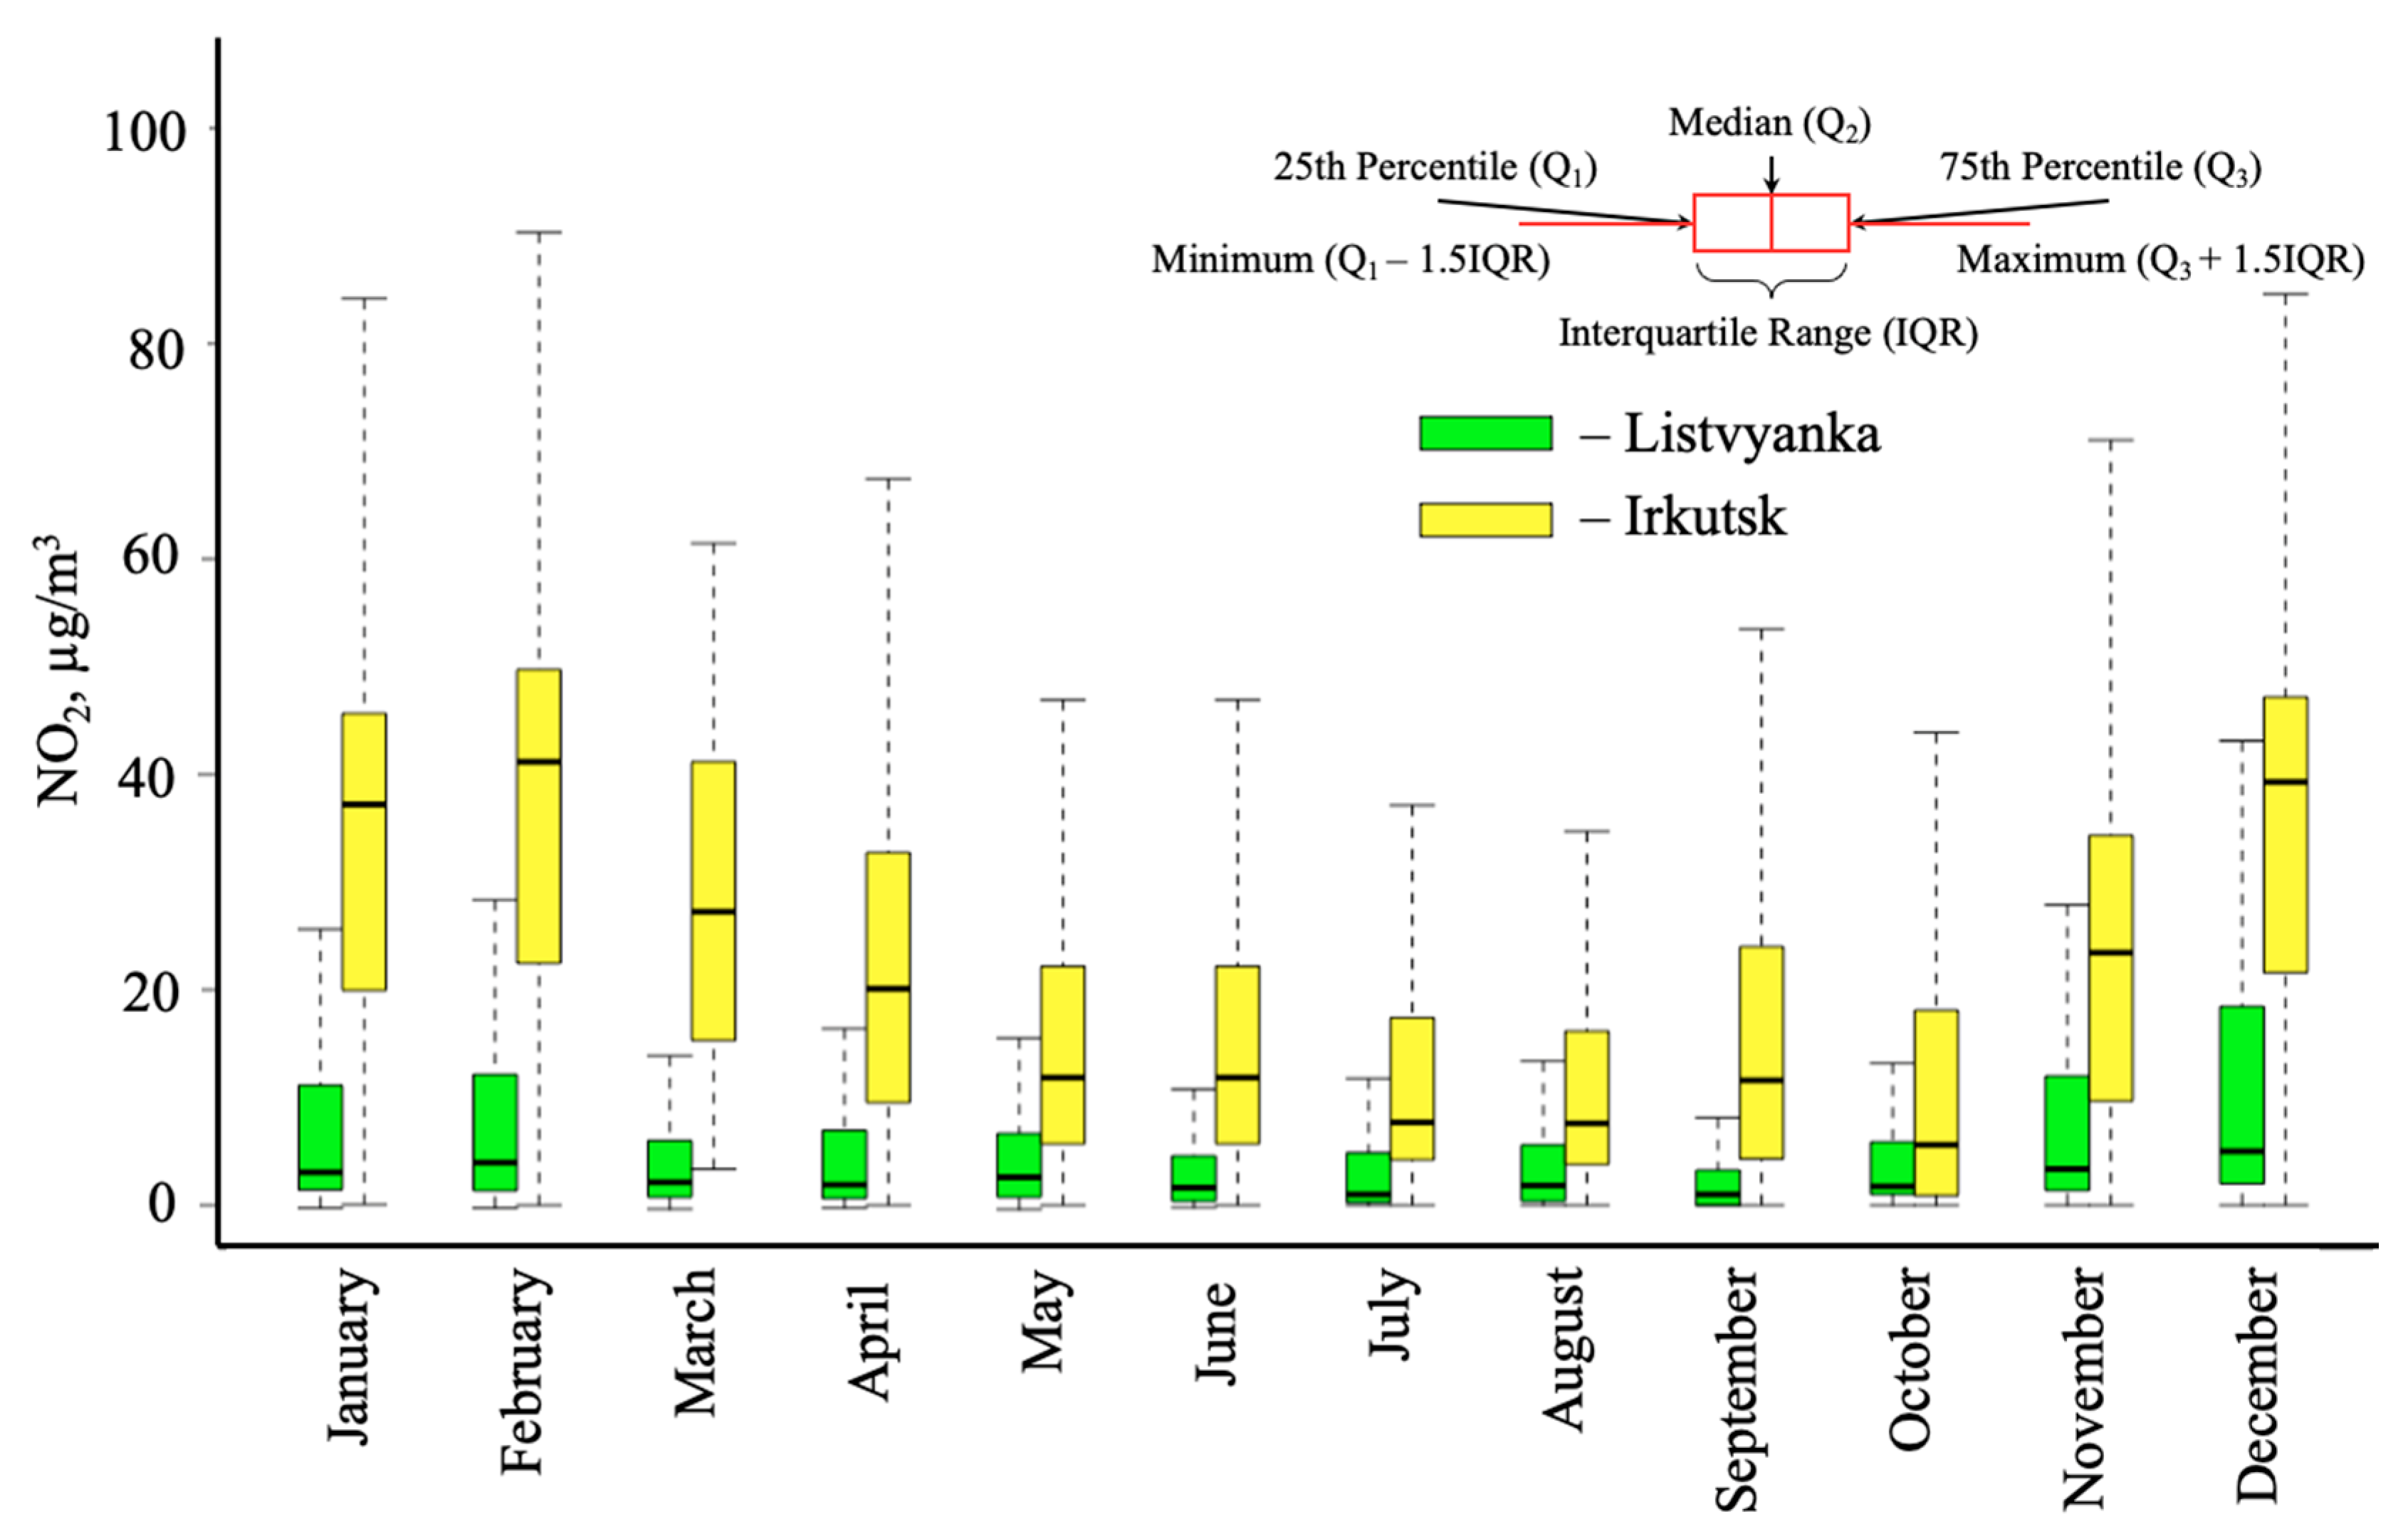
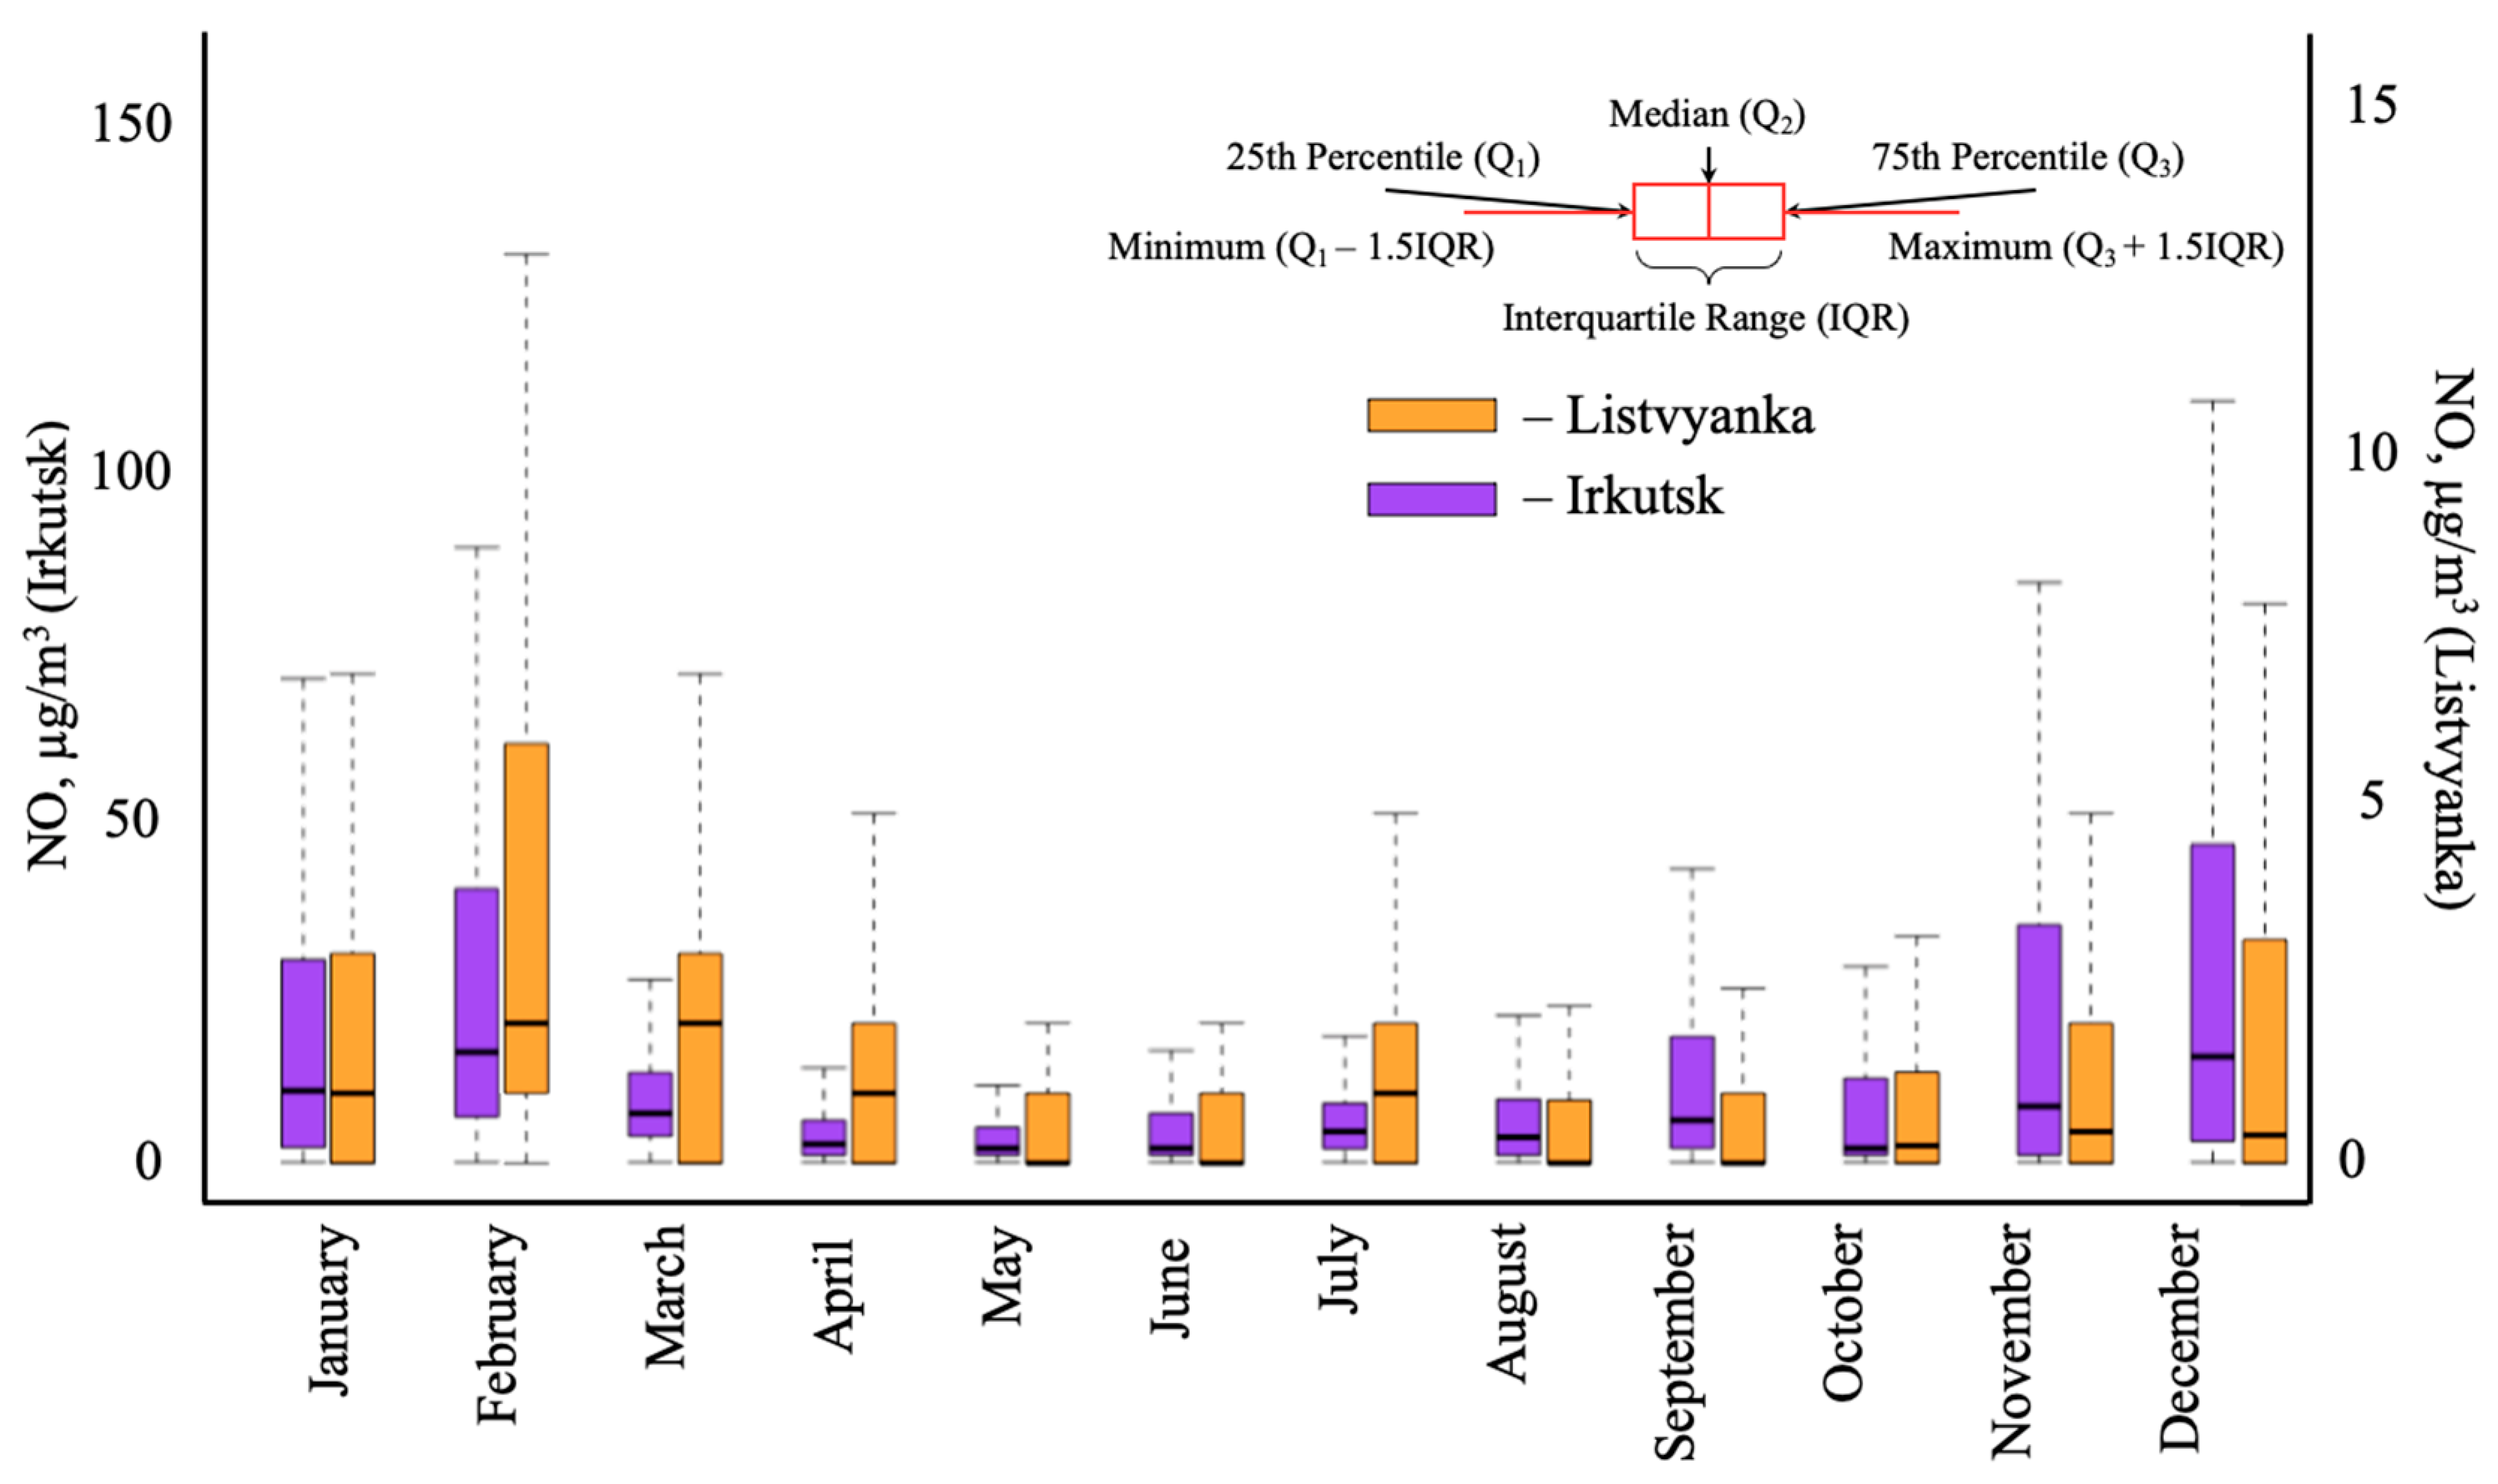
3. Results and Discussion

Here, we present the results of 4-year continuous measurements of the SO2, NO, and NO2 concentrations averaged over 20 min and discuss the features of these pollutants at the levels of monthly, weekly, and daily characteristics.
Figure 3 shows graphs displaying the frequency distributions of gas concentrations at the monitoring stations for the heating (October to April) and non-heating (May to September) seasons. The histograms demonstrate a unimodal distribution with an obvious right-hand asymmetry and a large excess. The frequency decreases rapidly as the concentrations increase. During the heating season, the frequency distribution expands at both the urban and rural stations. Notably, during the heating season, there are cases of concentration increases above 85 µg m3 with a frequency of 4–6%, depending on the gas and the station. Regardless of the season, the nitrogen oxide concentrations mainly range from 0 to 15 µg m3 in Irkutsk and from 0 to 5 µg m3 in Listvyanka, and the sulfur dioxide concentrations range from 0 to 15 µg m3 in both areas. This indicates that both stations are exposed to a major external source of air pollution and, in most cases, reflect an overall air pollution level in these areas.
The graph of the nitrogen dioxide (NO2) concentrations in the urban area has a clear two-modal distribution during the heating season, which likely reflects the influence of several large air pollution sources emitting this gas. Taking into account that motor transport and thermal power plants [42] are the main sources of NO2 emissions, we can assume that this graph reflects the influence of these sources on the air above Irkutsk in winter. In the winter months, there is a high atmospheric pressure zone (Asian Anticyclone) over East Siberia, when the frequency of calm weather conditions increases, leading to the formation of evening and night temperature inversions. The presence of a heat island above the city contributes to the formation of several inversion layers: ground-level in the atmospheric layer of 0–24 m and elevated layer at an altitude of ~90–180 m. The total recurrence of the inversions in winter at night and in the morning is 85–93%. The highest recurrence occurs in December and January. In summer, temperature inversions occur only at night [43]. Based on the radio sounding data, the maximum capacity of inversions can reach 2 km in summer, and over 3 km in winter. This, in turn, leads to a deterioration in the conditions for the dispersion of pollutants and an accumulation of the latter in the ground-level atmosphere.

3.1. Seasonal Variability of Gaseous Pollutants under Urban and Rural Conditions

Table 1 presents the statistical processing data on gaseous pollutants (SO2, NO2, and NO), which we used for the comparative analysis of their concentration in the air at the Irkutsk and Listvyanka stations. As shown in the table, the highest concentrations of sulfur and nitrogen oxides were recorded in the air of the Southern Baikal region during the heating season, from October to April. Analysis of Figure 4, Figure 5, Figure 6 and Figure 7 revealed that the concentrations of sulfur and nitrogen oxides were correlated between each other (the Pearson correlation coefficient was 0.97). Taking into account that most sulfur dioxide emissions in the region result from the combustion of solid organic fuel [44], it is logical to assume that the thermal power industry is the main source of sulfur dioxide and nitrogen oxides in the air above the Listvyanka station. The winter maximum is most likely associated with the operational intensity of the thermal power plant, depending on the ambient temperature. A strong negative linear correlation between the average monthly air temperatures near large sources of air pollution (Irkutsk) and the concentrations of sulfur and nitrogen oxides in the air confirms this. The Pearson correlation coefficient was −0.93 for SO2 and air temperature and −0.97 for NO2 and air temperature.
Analysis of Table 1 indicated that the concentrations of gaseous pollutants both at the Irkutsk station and the Listvyanka station were widely scattered. If the distribution median is used as an average, the absolute value decreases. This means that there are many atypical values, the so-called outliers, which distort the overall pattern towards the overestimation of gas concentrations, especially at the rural station. Moreover, the data analysis (Table 1) identified the maximum values exceeding the average gas concentrations by one or two orders of magnitude, which was likely due to the influx of smoke plumes from the thermal power plant when the weather conditions affecting the dispersion of the pollutants changed. After selection, we attempted to estimate the frequency and seasonal distribution of these cases (Table 2). The table shows that such episodes most often occur in December, January, and February and account for about 8% of all the observations.
Based on the average and median estimates (Table 1), the sulfur dioxide (SO2) concentrations at the remote rural Listvyanka station exceed the values recorded at the Irkutsk station. Lower SO2 values at the urban station are associated with its location on an elevated relief in one of the “clean” forest zones of the city, away from the main direction of the smoke plume transport from the city’s largest thermal power plant, with smoke stacks over 150 m high and a plume rise height exceeding 500 m above ground level [45]. At the 200–500 m altitudes, hot SO2 emissions from this thermal power plant are carried beyond the city and are not recorded in the ground layer of the atmosphere at the Irkutsk station. However, the level of air pollution measured at the Rosgidromet (Federal Service for Hydrometeorology and Environmental Monitoring) stations in the other Irkutsk districts (the stations are located at an altitude of 2 m above ground level) are twice as high [46,47].
Analysis of the nitrogen oxide concentrations (Table 1) in the air above the stations indicated significant differences between them. In the city, the nitrogen oxide concentrations (NO and NO2) were 5–10 times higher than at the Listvyanka station. At the same time, at this station, NO was recorded rather rarely, testifying to the absence or weak influence of the local sources of air pollution on the atmosphere in this area. Because the NO lifetime is ~2–3 h, we can assume that, at the Listvyanka station, we sometimes recorded episodes when this gas managed to reach the shores of Lake Baikal from the remote regional sources of air pollution [48,49], and presented in Section 3.
We examine in detail the average monthly variations of nitrogen and sulfur oxides in the air above the stations for the entire observation period (Figure 4, Figure 5 and Figure 6). The ordinate axis shows the concentration of trace gases (µg m3), and the abscissa axis shows the month (time). The diagrams reflect the distribution medians (bold line), the first quartile (lower boundary of the box, Q1), and the third quartile (the upper boundary of the box, Q3). Atypical values beyond the one and a half product of the difference between Q3 and Q1 (so-called outliers) are not given. The figures demonstrate that gaseous pollutants generally have a similar pattern of intra-annual distribution, with the maximum in February and December and a depression from June to August. The highest concentrations of gaseous pollutants in the air were recorded in February. This was due to the combined effect of some of the factors represented below.
Air temperature and precipitation. The assessment conducted in [50] revealed that February and March are the coldest months in the year with the lowest precipitation. This is also confirmed by data from the Acid Deposition Monitoring Network in East Asia (EANET) (Table 3). Low air temperatures lead to an increase in the volume of emissions from heat sources, and the minimum precipitation (7–8 mm on month) weakens the mechanism for washing out anthropogenic pollutants from the air [51,52,53].
ABL thickness. According to [54], in the winter months, the ABL height decreases to 500–700 m at the Listvyanka station, which is 1.5 times lower than in the transitional seasons (spring and autumn). A thinner ABL at this time is associated with an increase in the thermal stability of the lower atmospheric layers, which also weakens the processes of the natural dispersion of pollutants, increasing the concentrations of the latter in the air [55,56,57].
Wind regime character. In addition to the amount of emissions from the thermal power plant, the frequency of air mass transport from large pollution sources and the wind regime character affect the state of the air basin above the investigated areas. During the cold season of the year, with a high-pressure area above most of East Siberia, weak winds prevail in the lower 500 m of the atmospheric layer. As the anticyclone disintegrates, the character of the weather conditions changes. In summer, due to the development of the cyclonic activity, wind speeds increase dramatically. On the contrary, in the higher atmospheric layers, minimum wind speeds are recorded in July, and the maximum recorded in November and December [58]. Although the northwesterly direction is predominant for air mass transport in the region (on average 60–70% per year) [59], orographic features determine the wind direction in the ground-level atmospheric layer. As shown in [60], the number of cases of transport from high-altitude air pollution sources situated in the cities of the Irkutsk agglomeration varies significantly from month to month. In January 2022, we recorded the maximum number (84%) of plume transport from the regional thermal power plants to the southern basin of Lake Baikal. This, together with other factors, explains the frequent occurrence of the winter concentration maxima of sulfur and nitrogen dioxides at the rural Listvyanka station.
In spring, the wind regime changes in the region: the ABL grows (to 800–1000 m) [54] and the amount of precipitation increases (more than by a factor of 2–4) [50]. Noteworthy is that the frequency of northwesterly transport does not always lead to an increase in the concentrations of gaseous pollutants at the Listvyanka station. In certain winter months and in summer, the frequency of northwesterly transport may be the same, but an increase in the air temperature in the warm season decreases the emissions from heat sources and, hence, decreases the pollutants in the air. Therefore, SO2 and NOx concentrations are approximately 4–5 times lower in summer than in the winter months.
Despite the similar nature of the relative intra-annual distribution of nitrogen oxides at the stations, the absolute values differed significantly. For example, the monthly NO2 concentrations at the Irkutsk station were 3–12 times higher than at the Listvyanka station, and the NO concentrations were 2–15 times higher, which was due to the large volume of emissions from motor vehicles into the air above Irkutsk, the pollution from which was largely distributed near its source [42,61]. Irkutsk is the large industrial center with a population of >600 thousand people. In 2015, >200 thousand motor vehicles were registered in the city [62], the number of which has only increased in recent years. The Listvyanka settlement is the large tourist center at Lake Baikal. On weekends, >2.5 thousand cars per day can visit it [63], which is much lower than the car traffic in Irkutsk. Another feature is that NO2 in Listvyanka is much higher than NO. This is due to the transformation of nitrogen oxide into dioxide resulting from reactions with atmospheric ozone during the transport from anthropogenic sources in the Irkutsk agglomeration to the southern basin of the lake [64].

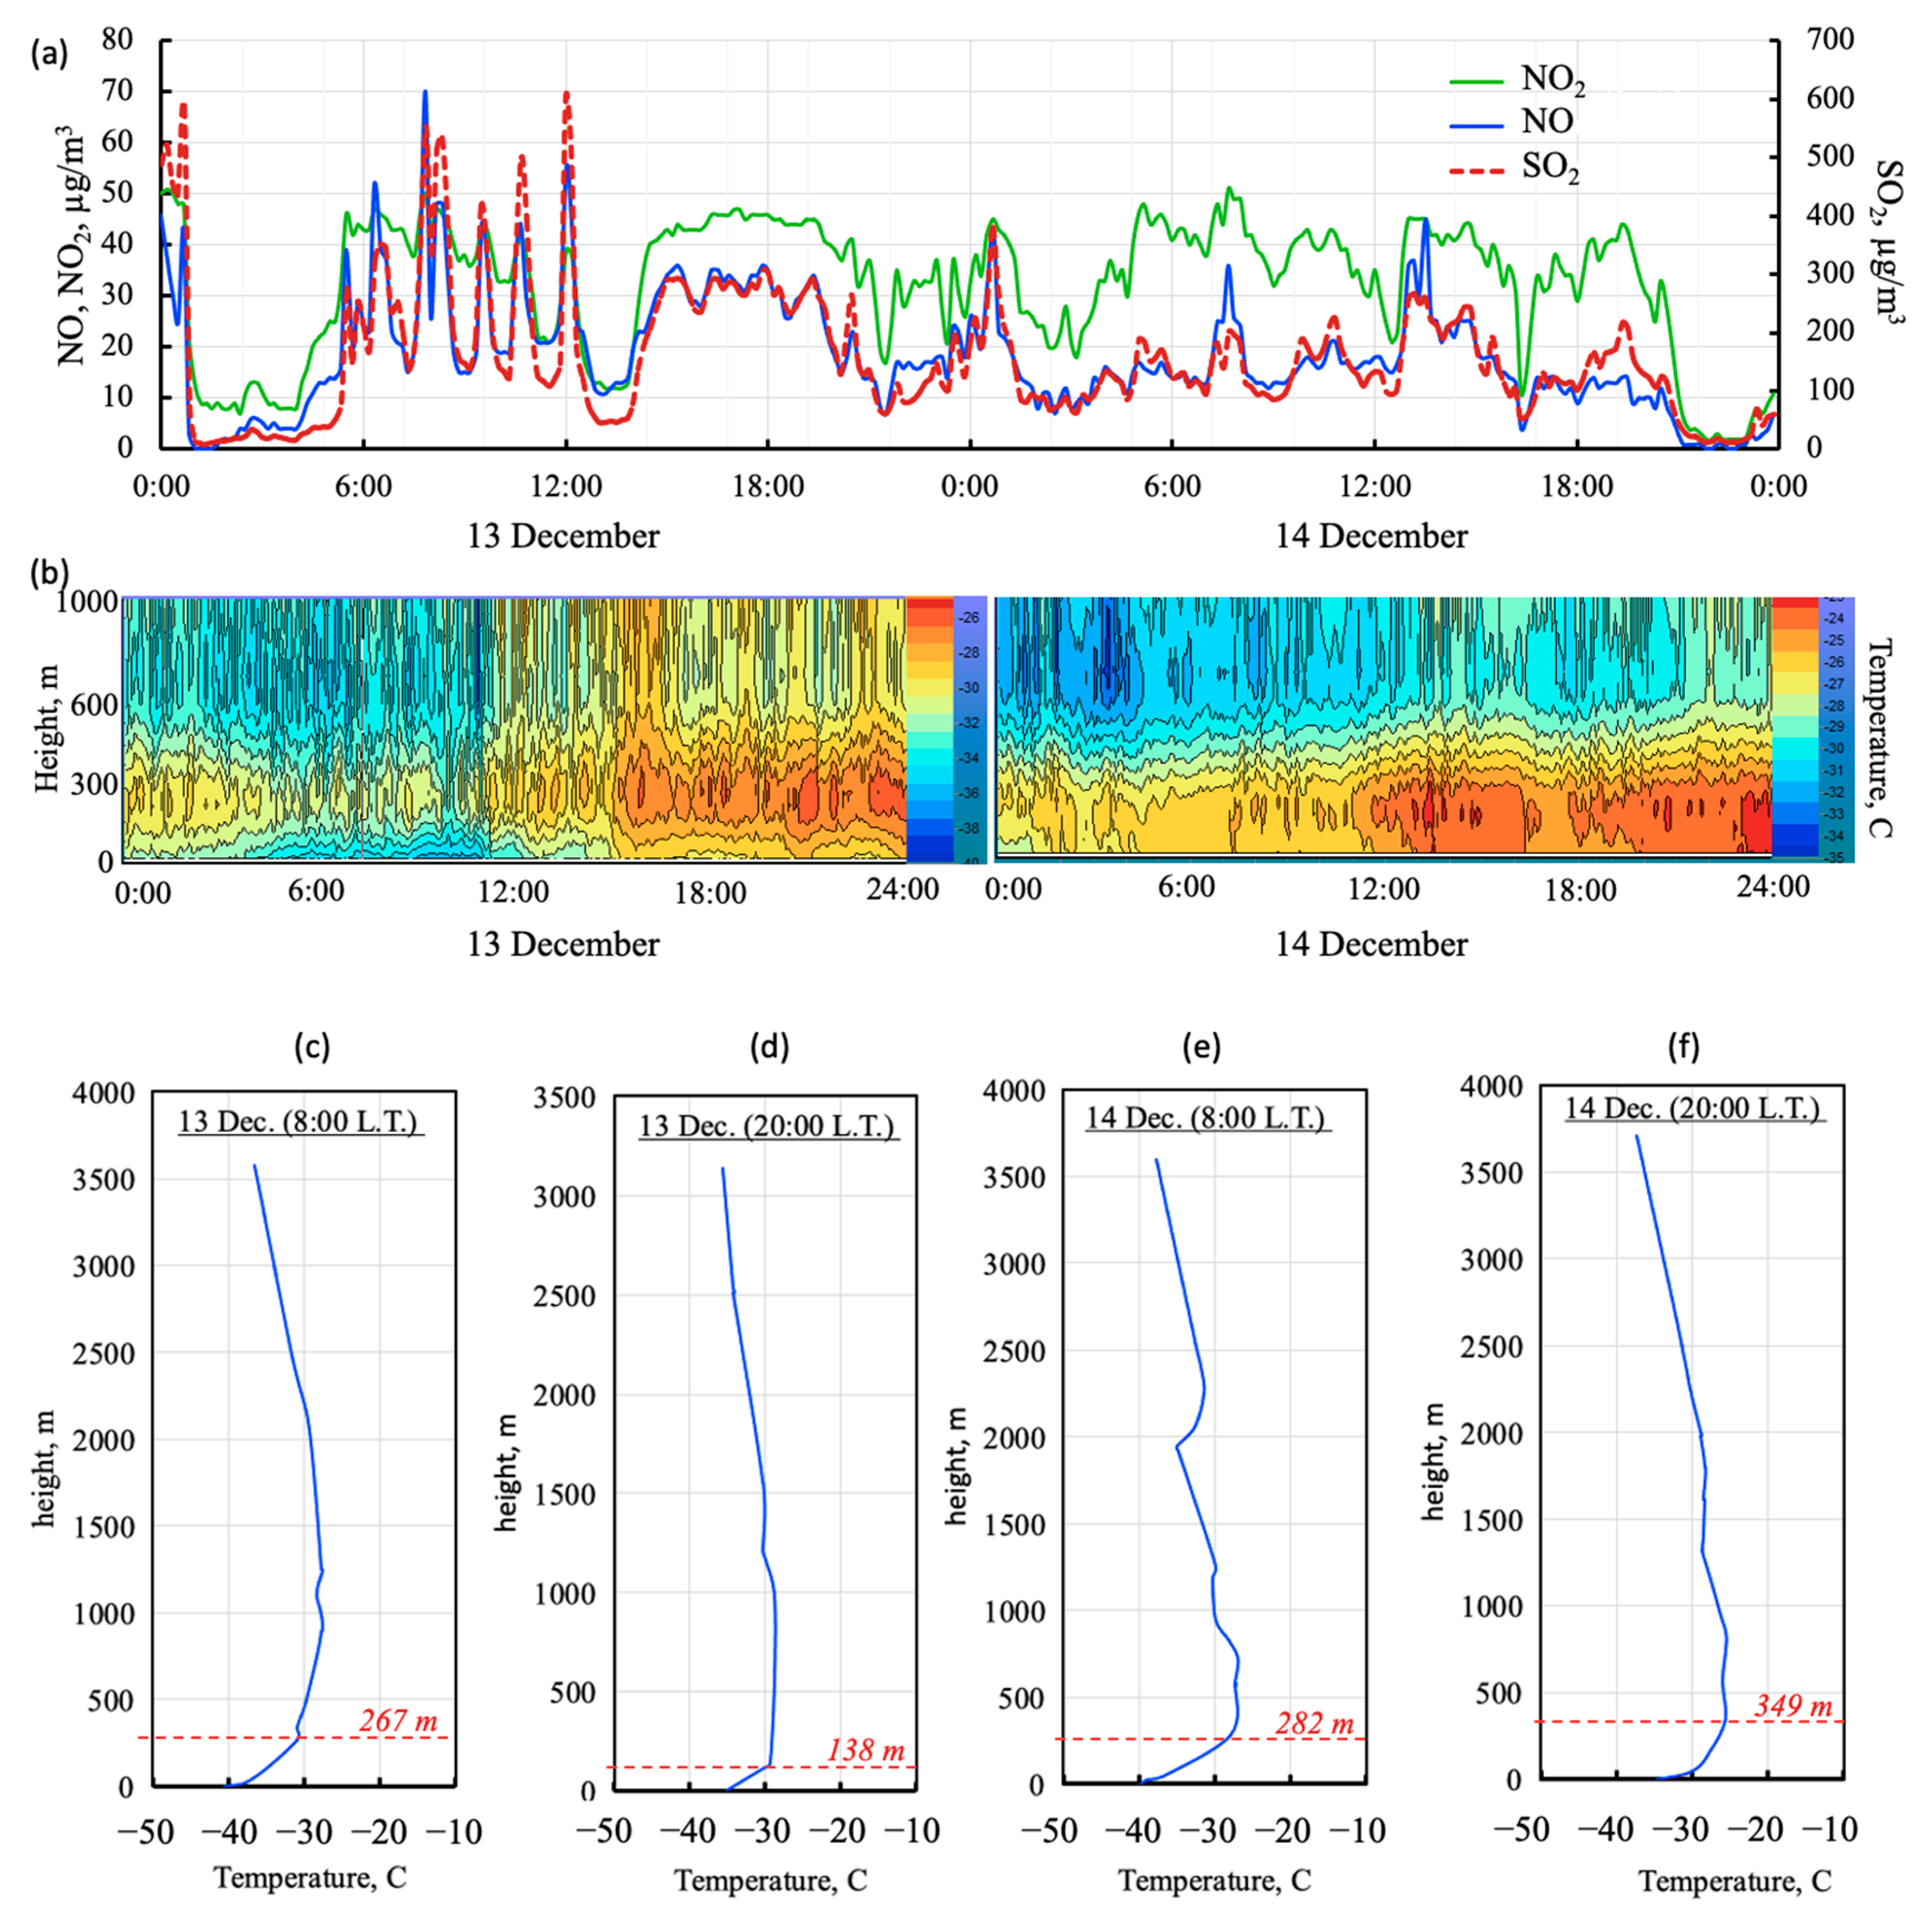
3.2. Weekly and Daily Variations of SO2, NO, and NO2

Figure 7 shows the data on the daily and weekly variability of the concentrations of sulfur and nitrogen oxides in the air. As known from the literature, the intensity and nature of the emission sources, as well as the spatiotemporal dynamics of ABL, affect these indicators [65,66]. Because ABL is closely related to the heating of the surface by solar irradiance, it has a typical daily variability. If we compare the data from the two stations, we can notice significant differences in the daily and weekly variations (Figure 7).
At the Irkutsk station, there are two typical increases in the nitrogen oxide concentrations, which occur from Monday to Friday in the morning (8 to 10 a.m.) and in the evening (6 to 7 p.m). The morning peak in nitrogen oxide concentrations in Irkutsk is associated with an increase in automobile traffic and the minimum depth of ABL. After 11 a.m. to 12 p.m., when the ABL depth increases, the air pollutants dissipate faster, and the nitrogen oxide concentrations decrease at the station (see Figure 7). The second daily peak (6 to 7 p.m.) is also associated with the evening rush hour in the city. From 9 p.m. to 6 a.m., the nitrogen oxide concentrations decrease to background urban values.
Analysis of the weekly dynamics of gaseous pollutants in the air at the Irkutsk station demonstrates a so-called “weekend effect.” The assessment of fluctuations in air pollutants, depending on the day of the week, revealed that the road traffic affects the concentration of nitrogen oxides in the air of urban areas. On Saturday and Sunday, the nitrogen oxide concentrations decrease by 20–30% compared with weekdays [67,68,69]. The difference between the pollution on weekdays and weekends varies, depending on the season. It is the most obvious in the cold season of the year due to the increase in the volume of fuel burnt to warm up the engine and the interior of the cars.
Daily cycles of nitrogen dioxide in the air above Irkutsk have one broad peak between 12 and 6 p.m. Unlike nitrogen oxides, morning and evening peaks are not typical of nitrogen dioxide in the daily and weekly cycles of concentrations, indicating that the main source of this gas entering the urban air is the combustion of coal by thermal power plants.
Analysis of the data on the concentration of gaseous pollutants in the air at the Listvyanka station revealed that the daily variations in the sulfur dioxide concentrations are generally similar to the variations in the nitrogen dioxide concentrations and have a unimodal distribution, with a peak in the morning from 6 to 11 a.m. However, during the heating season, a second peak appears in the distribution of nitrogen dioxide, in the evening or at night, which begins at about 6 p.m. In the weekly variations, there is a slight increase in the NO concentrations on weekends. Daily variations of the sulfur dioxide concentrations are generally similar and have a unimodal distribution, with a peak in the morning from 6 to 11 a.m. However, during the heating season, a second peak appears in the distribution of nitrogen dioxide, in the evening or at night, which begins at about 6 p.m. This may be due to the increase in the number of cars in the settlement on weekends. There are no large industrial enterprises in the settlement; the heating sources are the boiler facility and house stoves. The number of residents in the settlement is small (less than 2000 people in 2021). The regional transport of the polluted air from the cities of the Baikal region and the motor vehicles that contribute to air pollution all year around are likely the main sources of air pollution by nitrogen oxides near the Listvyanka settlement.

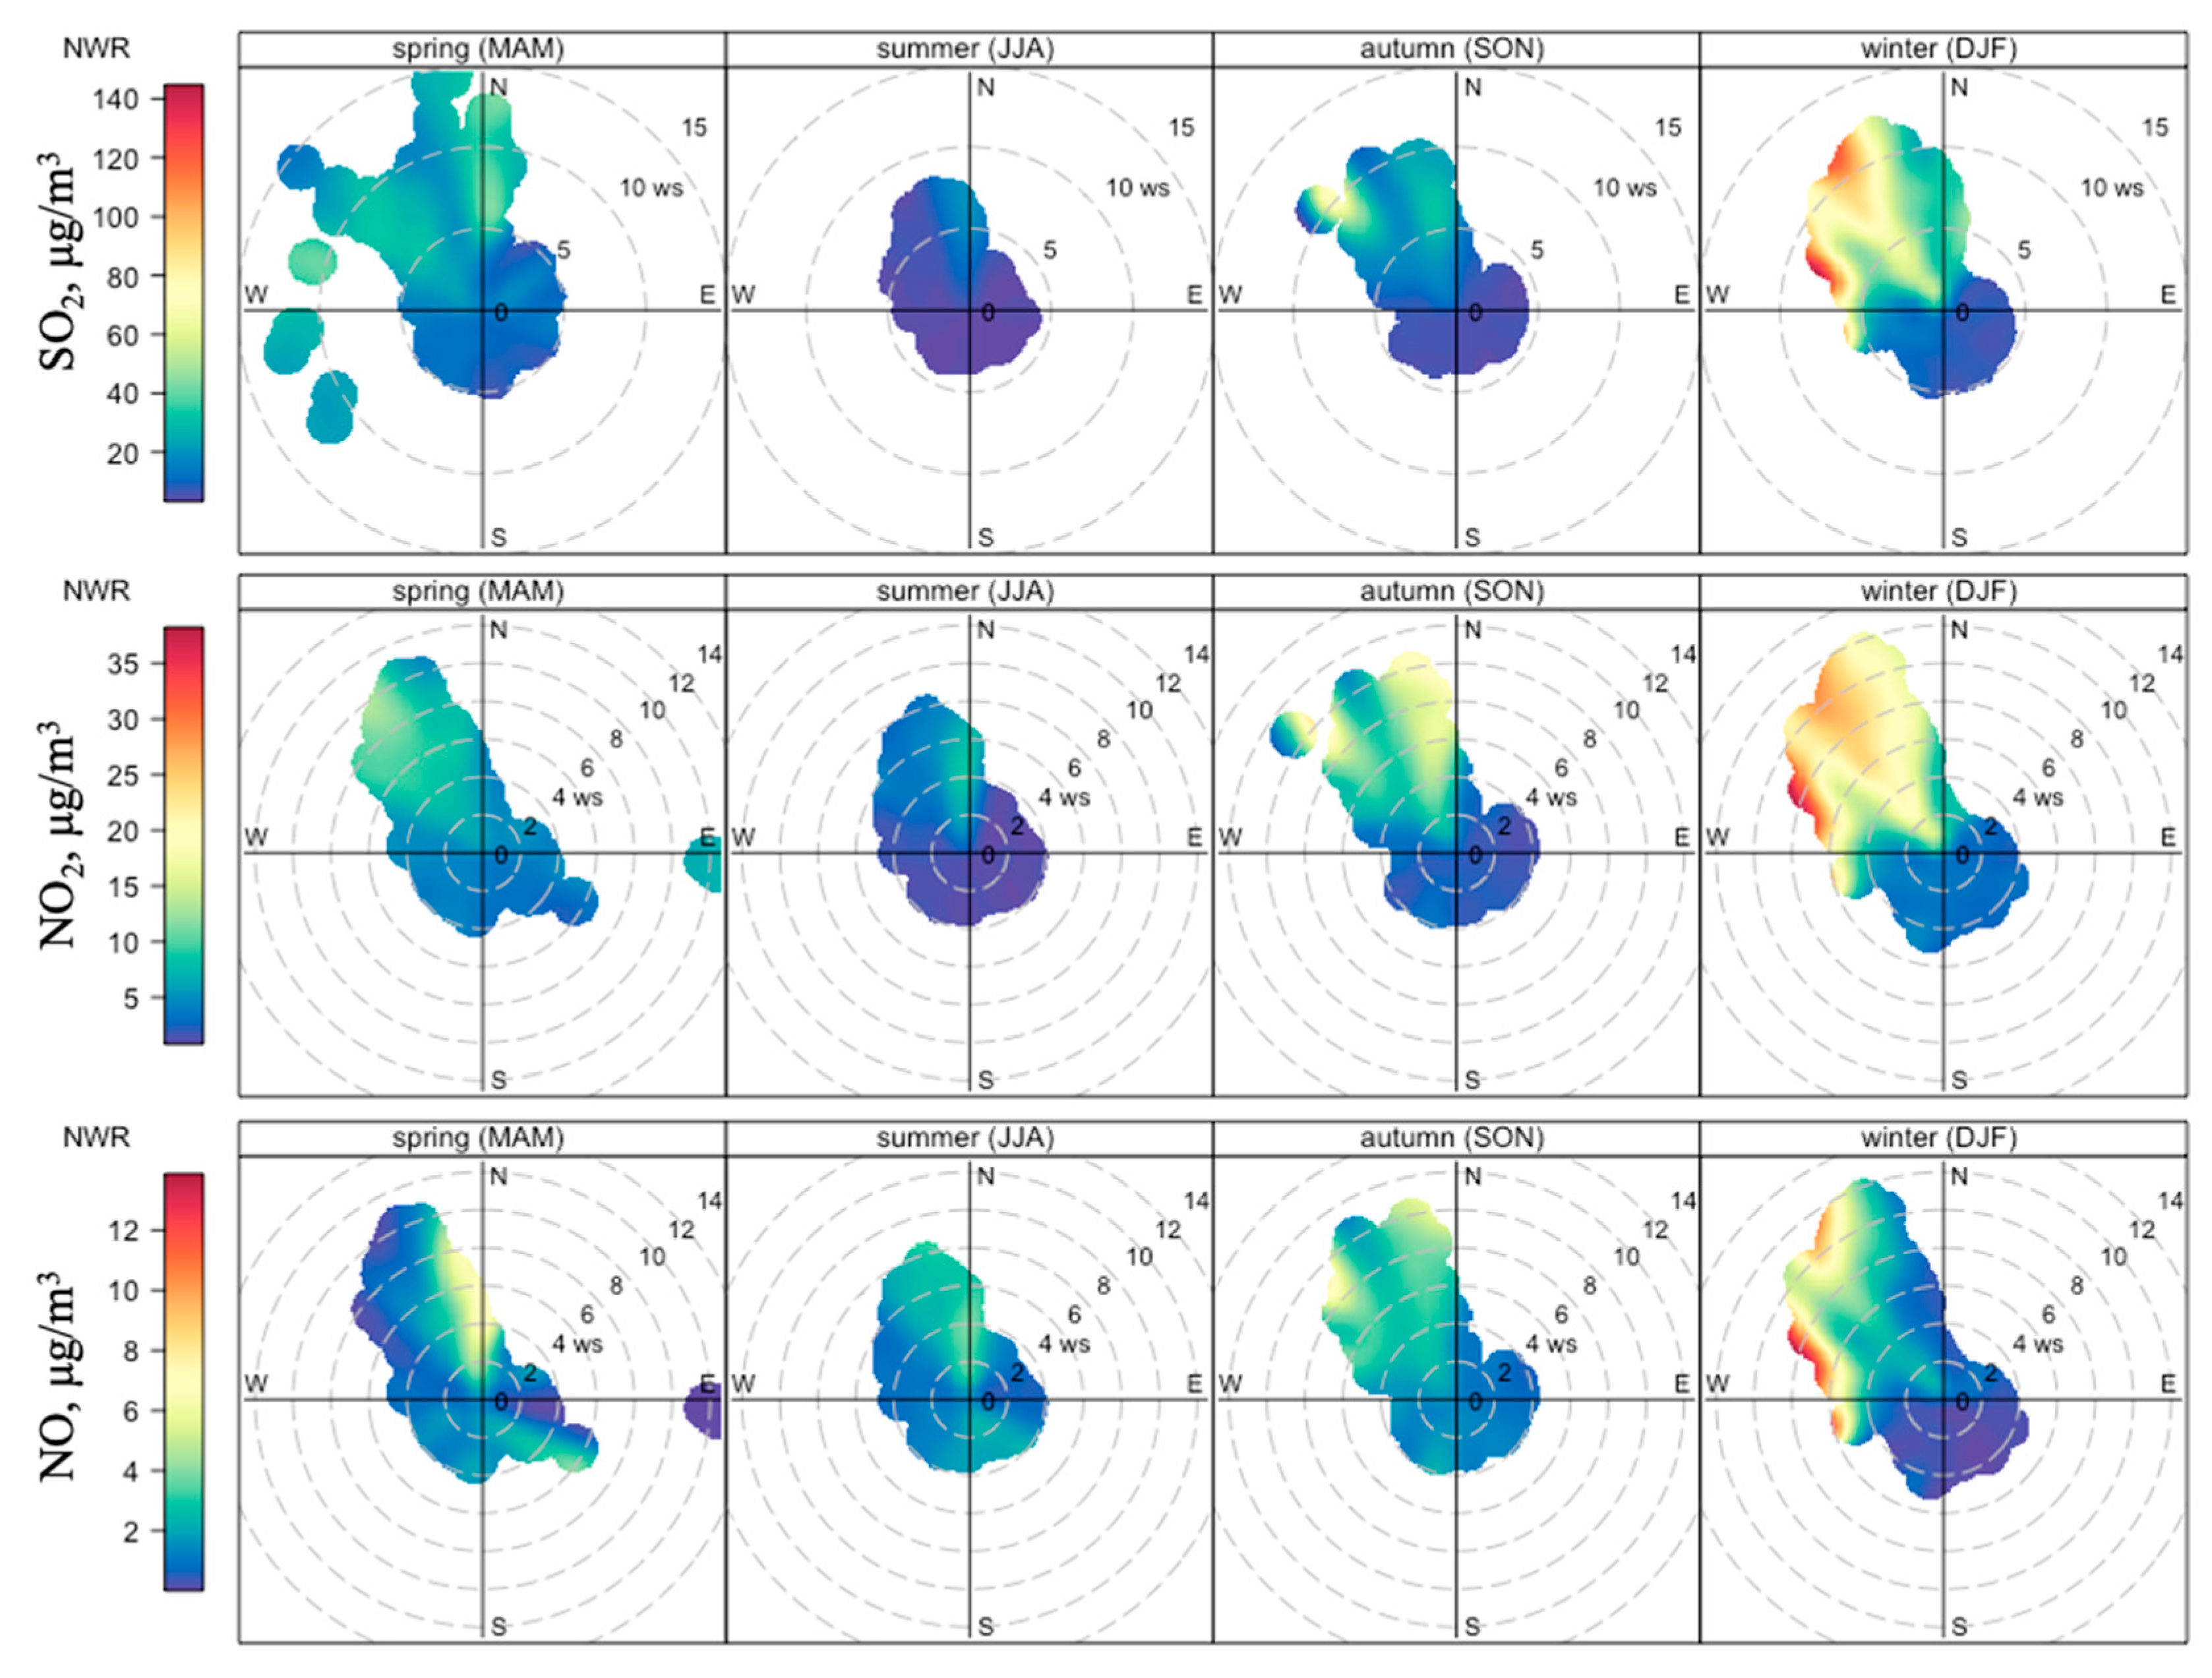
4. Dependence of Air Pollution at the Listvyanka Station on Meteorological Parameters

To systematize the meteorological data and gain insight on how the wind speed and direction affect changes in the concentrations of acid gases in the air of the southern basin of Lake Baikal, we used a nonparametric wind regression (NWR) model, described in more detail in [70]. As input data, we used the 20-min average concentrations of SO2, NO2, and NO, as well as the resulting wind speed and direction, measured at the Listvyanka station. Figure 8 shows the results of the NWR analysis for each season. This figure indicates that the highest concentrations of all the investigated gases were observed with northwesterly winds. As can be seen in Figure 1, this direction corresponds to the locations of large industrial centers in the Irkutsk region.
The highest concentrations of acid gases (>100 µg/m3 for SO2 and >25 µg/m3 for NO2) were recorded in air mass transport from two directions. Azimuths of the first wind direction range from 310 to 340 degrees, with a wind speed from 10 to 12 m per second. The second direction has azimuths ranging from 280 to 295 degrees, with a wind speed from 6 to 9 m per second. The direction of the first peak corresponds to the location of the air pollution sources in the Irkutsk–Cheremkhovo industrial hub, the largest centralization of anthropogenic objects in the Irkutsk region (Figure 1). The overall air emissions from these sources exceed 289,000 tons per year, of which 52% are sulfur dioxide (SO2) emissions and 14% are nitrogen dioxide (NOx) emissions. The direction of the second peak also corresponds to the location of the emission sources in the Irkutsk agglomeration. However, the shift of the peak to the western azimuth may indicate that, in winter, emissions from a municipal boiler facility in the Listvyanka settlement can contribute to emissions from large remote air pollution sources. This increases the level of air pollution at the station. With winds of the southerly and southeasterly sectors (from the water surface of the lake), the concentrations of gaseous pollutants decreased to regional background values. The distribution of nitrogen monoxide (NO) concentrations differed from SO2 and NO2. Figure 8 demonstrates that, in spring, summer, and autumn, the concentrations of nitrogen oxide increase in air masses brought to the station from the lake. This may be due to the onset of navigation and the influx in the emissions to the air above the station from numerous ships in Listvennichny Bay.
Figure 9 shows an example of severe air pollution at the rural station resulting from air mass transport from anthropogenic sources in the Irkutsk agglomeration. This episode occurred in the second decade of December 2023. At that time, there was anticyclonic weather characterized by weak winds, no precipitation, and an air temperature of 11–17 °C below the climatic norm for December. Such conditions led to an increase in the emissions from thermal power facilities and a decrease in the atmospheric dispersion potential. Figure 9a–c shows the temperature stratification of the atmosphere above the city of Angarsk on December 13 and 14, 2023. Based on radiosonde data, a temperature inversion formed and persisted above Angarsk at an altitude from 138 to 349 m above ground level. To confirm the area where the polluted air masses form, we used the HYSPLIT model, which is commonly applied to analyze air mass pathways [71,72,73]. The calculation revealed that air masses from the pollution sources of Irkutsk, Angarsk, and Shelekhov moved to the southeast (Figure 10). At the same time, the main emissions from the air pollution sources in the city of Shelekhov were transported 10–15 km southwest of the Listvyanka station, emissions from the Angarsk sources were transported 20–30 km northeast of the station, and emissions from the Novo–Irkutsk Thermal Power Plant (Irkutsk) were drawn along the valley of the Angara River. Three hours after the emission, plumes from the Irkutsk thermal power plant reached the southwest coast of Lake Baikal near the Listvyanka station (Figure 10a). We recorded this as an increase in the concentration of sulfur dioxide on December 13, 2023, at 8 a.m. (Figure 9a). Simultaneously, we recorded a temperature inversion at the station, with a thickness of 200–300 m and a temperature difference of up to 5–6 °C, which weakened the possibility of pollutant dispersion in the atmosphere (Figure 9b). The highest average hourly concentrations at the Listvyanka station on December 13, 2023 were recorded between 4 and 11 a.m. and amounted to ~600 µg/m3, with instantaneous values of 1107 µg/m3 (Figure 10a). On the evening of December 14, 2023, the emissions from anthropogenic sources of the Irkutsk–Cheremkhovo industrial hub dispersed southwest of the Listvyanka station, as evidenced by calculations using the HYSPLIT model (Figure 10b). This led to a decrease in the concentrations of gaseous pollutants to average winter values (Figure 9a).

5. Conclusions

This study analyzes the behaviour of gaseous pollutants, such as nitrogen and sulfur oxides, in the ground-level atmosphere in the urban (Irkutsk station) and background (Listvyanka station) areas of the Southern Baikal region and determines their sources and relationship with the meteorological conditions in the region.
Analysis of continuous monitoring of 4-year measurements of nitrogen and sulfur dioxide concentrations in the air at two stations, located 70 km apart in the Southern Baikal region, revealed similarity in their annual variability with maximum values in the winter months and minimum values in the summer. Both stations showed the highest concentrations of gaseous pollutants in February. Thermal power plants and motor vehicles are the main sources of air pollution with nitrogen and sulfur oxides in the Southern Baikal region.
Meteorological parameters of the atmosphere, such as air temperature, precipitation, boundary layer thickness, and wind speed and direction, have a direct impact on the concentrations of gaseous pollutants. An increase in precipitation in the warm season decreases the concentrations of sulfur and nitrogen oxides in the air, whereas a high number of calms and temperature inversions in the winter dramatically increases these concentrations.
We determined the daily variations in gaseous pollutants at the monitoring stations, which differed in time scale. There was a clear dependence of the increase in the nitrogen oxide concentrations at the urban station with the increase in road traffic during rush hours. In the morning and evening hours, the nitrogen dioxide concentrations were 3 times higher than at night. The highest sulfur dioxide concentrations in the air above the city were observed in the evening. In the rural area, the highest concentrations were recorded at night, which was likely due to the increase in the frequency of the transport of the pollutants from their sources through the system of low-level jet streams.
Using the nonparametric wind regression (NWR) model, we classified the meteorological conditions, under which acid gases enter the atmosphere of the southern basin of Lake Baikal. The highest concentrations of nitrogen and sulfur oxides were recorded on the west coast of the southern basin of Lake Baikal, with westerly and northwesterly winds and wind speed ranging from 6 to 12 m per second. This corresponds to the locations of the large industrial centers in the Irkutsk region. The distribution of nitrogen monoxide measured at the station differed from the above gases. In spring, summer, and autumn, nitrogen monoxide concentrations had an additional maximum with southerly winds, which is likely due to the emissions from numerous ships in Listvennichny Bay.
The transport pathways of the anthropogenic air masses can be predicted from synoptic maps and confirmed using the HYSPLIT modelling of air mass back trajectories. This study revealed that westerly and northwesterly winds prevailing in the lower boundary layer above the southeast of Siberia transported plumes directly to the water area of Lake Baikal. Therefore, this study provided information on the characteristics and transport of trace gases and allowed us to understand their potential impact on air quality near the southern basin of Lake Baikal.

Author Contributions

Conceptualization, methodology, data analysis, writing, review and editing: M.Y.S. and Y.V.M.; data collection and analysis, software, and visualization: V.A.O., V.L.P. and E.S.L.; project administration, review and editing: T.V.K. All authors have read and agreed to the published version of the manuscript.

Funding

This study was supported by the state project No. 075-15-2024-533 “Fundamental studies of the Baikal natural territory based on the system of interconnected basic methods, models, neural networks, and digital platform for environmental monitoring”.

Institutional Review Board Statement

Not applicable.

Informed Consent Statement

Not applicable.

Data Availability Statement

Data used are available on request from the corresponding author.

Conflicts of Interest

The authors declare no conflicts of interest.

References

  1. Sheng, J.X.; Weisenstein, D.K.; Luo, B.P.; Rozanov, E.; Stenke, A.; Anet, J.; Peter, T. Global atmospheric sulfur budget under volcanically quiescent conditions: Aerosol-chemistry-climate model predictions and validation. J. Geophys. Res. Atmos. 2015, 120, 256–276. [Google Scholar] [CrossRef]
  2. Porter, J.G.; De Bruyn, W.; Saltzman, E.S. Eddy flux measurements of sulfur dioxide deposition to the sea surface. Atmos. Chem. Phys. 2018, 18, 15291–15305. [Google Scholar] [CrossRef]
  3. Kamarehie, B.; Ghaderpoori, M.; Jafari, A.; Karami, M.; Mohammadi, A.; Azarshab, K.; Noorizadeh, N. Quantification of health effects related to SO2 and NO2 pollutants by using air quality model. J. Adv. Environ. Health Res. 2017, 5, 44–50. [Google Scholar] [CrossRef]
  4. World Health Organization. WHO Global Air Quality Guidelines: Particulate Matter (PM2.5 and PM10), Ozone, Nitrogen Dioxide, Sulfur Dioxide and Carbon Monoxide; World Health Organization: Geneva, Switzerland, 2021. [Google Scholar]
  5. Manisalidis, I.; Stavropoulou, E.; Stavropoulos, A.; Bezirtzoglou, E. Environmental and health impacts of air pollution: A review. Front. Public Health 2020, 8, 14. [Google Scholar] [CrossRef]
  6. Vinken, G.C.M.; Boersma, K.F.; Maasakkers, J.D.; Adon, M.; Martin, R.V. Worldwide biogenic soil NOx emissions inferred from OMI NO2 observations. Atmos. Chem. Phys. 2014, 14, 10363–10381. [Google Scholar] [CrossRef]
  7. Erickson, L.E.; Newmark, G.L.; Higgins, M.J.; Wang, Z. Nitrogen oxides and ozone in urban air: A review of 50 plus years of progress. Environ. Prog. Sustain. Energy 2020, 39, e13484. [Google Scholar] [CrossRef]
  8. Dix, B.; de Bruin, J.; Roosenbrand, E.; Vlemmix, T.; Francoeur, C.; Gorchov-Negron, A.; McDonald, B.; Zhizhin, M.; Elvidge, C.; Veefkind, P.; et al. Nitrogen oxide emissions from US oil and gas production: Recent trends and source attribution. Geophys. Res. Lett. 2020, 47, e2019GL085866. [Google Scholar] [CrossRef]
  9. Schumann, U.; Huntrieser, H. The global lightning-induced nitrogen oxides source. Atmos. Chem. Phys. 2007, 7, 3823–3907. [Google Scholar] [CrossRef]
  10. Song, W.; Wang, Y.L.; Yang, W.; Sun, X.C.; Tong, Y.D.; Wang, X.M.; Liu, C.Q.; Bai, Z.P.; Liu, X.Y. Isotopic evaluation on relative contributions of major NOx sources to nitrate of PM2.5 in Beijing. Environ. Pollut. 2019, 248, 183–190. [Google Scholar] [CrossRef]
  11. Song, W.; Hu, C.C.; Chen, G.Y.; Liu, X.J.; Walters, W.W.; Michalski, G.; Liu, C.Q. Important contributions of non-fossil fuel nitrogen oxides emissions. Nat. Commun. 2021, 12, 243. [Google Scholar] [CrossRef]
  12. Galloway, J.N.; Leach, A.M.; Bleeker, A.; Erisman, J.W. A chronology of human understanding of the nitrogen cycle. Philos. Trans. R. Soc. B Biol. Sci. 2013, 368, 20130120. [Google Scholar] [CrossRef] [PubMed]
  13. Valin, L.C.; Russell, A.R.; Cohen, R.C. Variations of OH radical in an urban plume inferred from NO2 column measurements. Geophys. Res. Lett. 2013, 40, 1856–1860. [Google Scholar] [CrossRef]
  14. Duncan, B.N.; Yoshida, Y.; Olson, J.R.; Sillman, S.; Martin, R.V.; Lamsal, L.; Hu, Y.; Pickering, K.E.; Retscher, C.; Allen, D.J.; et al. Application of OMI observations to a space-based indicator of NOx and VOC controls on surface ozone formation. Atmos. Environ. 2010, 44, 2213–2223. [Google Scholar] [CrossRef]
  15. Ryan, R.G.; Rhodes, S.; Tully, M.; Schofield, R. Surface ozone exceedances in Melbourne, Australia are shown to be under NOx control, as demonstrated using formaldehyde: NO2 and glyoxal: Formaldehyde ratios. Nat. Commun. 2020, 749, 141460. [Google Scholar] [CrossRef]
  16. Jion, M.M.M.F.; Jannat, J.N.; Mia, Y.; Ali, A.; Islam, S.; Ibrahim, S.M.; Pal, S.C.; Islam, A.; Sarker, A.; Malafaia, G.; et al. A critical review and prospect of NO2 and SO2 pollution over Asia: Hotspots, trends, and sources. Sci. Total Environ. 2023, 876, 162851. [Google Scholar] [CrossRef] [PubMed]
  17. Wang, Y.; Ali, A.; Bilal, M.; Qiu, Z.; Mhawish, A.; Almazroui, M.; Shahid, S.; Islam, M.N.; Zhang, Y.; Haque, N. Identification of NO2 and SO2 pollution hotspots and sources in Jiangsu Province of China. Remote Sens. 2021, 13, 3742. [Google Scholar] [CrossRef]
  18. Ye, C.; Lu, K.; Song, H.; Mu, Y.; Chen, J.; Zhang, Y. A critical review of sulfate aerosol formation mechanisms during winter polluted periods. J. Environ. Sci. 2023, 123, 387–399. [Google Scholar] [CrossRef]
  19. Wang, J.; Li, J.; Ye, J.; Zhao, J.; Wu, Y.; Hu, J.; Jacob, D.J. Fast sulfate formation from oxidation of SO2 by NO2 and HONO observed in Beijing haze. Nat. Commun. 2020, 11, 2844. [Google Scholar] [CrossRef] [PubMed]
  20. Borhani, F.; Shafiepour Motlagh, M.; Rashidi, Y.; Ehsani, A.H. Estimation of short-lived climate forced sulfur dioxide in Tehran, Iran, using machine learning analysis. Stoch. Environ. Res. Risk Assess. 2022, 36, 2847–2860. [Google Scholar] [CrossRef]
  21. Adame, J.A.; Lope, L.; Sorribas, M.; Notario, A.; Yela, M. SO2 measurements in a clean coastal environment of the southwestern Europe: Sources, transport and influence in the formation of secondary aerosols. Sci. Total Environ. 2020, 716, 137075. [Google Scholar] [CrossRef]
  22. Liu, Y.; Zheng, M.; Yu, M.; Cai, X.; Du, H.; Li, J.; He, K. High-time-resolution source apportionment of PM2.5 in Beijing with multiple models. Atmos. Chem. Phys. 2019, 19, 6595–6609. [Google Scholar] [CrossRef]
  23. Wang, H.; Li, J.; Gao, Z.; Yim, S.H.; Shen, H.; Ho, H.C.; Li, Z.; Zeng, Z.; Liu, C.; Li, Y.; et al. High-spatial-resolution population exposure to PM2.5 pollution based on multi-satellite retrievals: A case study of seasonal variation in the Yangtze River Delta, China in 2013. Remote Sens. 2019, 11, 2724. [Google Scholar] [CrossRef]
  24. Tiotiu, A.I.; Novakova, P.; Nedeva, D.; Chong-Neto, H.J.; Novakova, S.; Steiropoulos, P.; Kowal, K. Impact of air pollution on asthma outcomes. Int. J. Environ. Res. Public Health 2020, 17, 6212. [Google Scholar] [CrossRef] [PubMed]
  25. Kovadlo, P.; Shikhovtsev, A.; Lukin, V.; Kochugova, E. Solar activity variations inducing effects of light scattering and refraction in the Earth’s atmosphere. J. Atmos. Sol.-Terr. Phys. 2018, 179, 468–471. [Google Scholar] [CrossRef]
  26. Zeng, Z.; Gui, K.; Wang, Z.; Luo, M.; Geng, H.; Ge, E.; An, J.; Song, X.; Ning, G.; Zhai, S.; et al. Estimating hourly surface PM2.5 concentrations across China from high-density meteorological observations by machine learning. Atmos. Res. 2021, 254, 105516. [Google Scholar] [CrossRef]
  27. Gharibzadeh, M.; Bidokhti, A.A.; Alam, K. The interaction of ozone and aerosol in a semi-arid region in the Middle East: Ozone formation and radiative forcing implications. Atmos. Environ. 2021, 245, 118015. [Google Scholar] [CrossRef]
  28. Liu, J.; Guo, Z.; Zhou, L.; Wang, L.; Wang, J.; Yan, Q.; Hua, D. Inversion and analysis of aerosol optical properties and lidar ratios based on sky-radiometer and Raman lidar measurements in Xi’an, China. Front. Environ. Sci. 2022, 10, 1039559. [Google Scholar] [CrossRef]
  29. Greenberg, N.; Carel, R.S.; Derazne, E.; Bibi, H.; Shpriz, M.; Tzur, D.; Portnov, B.A. Different effects of long-term exposures to SO2 and NO2 air pollutants on asthma severity in young adults. J. Toxicol. Environ. Health Part A 2016, 79, 342–351. [Google Scholar] [CrossRef]
  30. Zheng, X.Y.; Orellano, P.; Lin, H.L.; Jiang, M.; Guan, W.J. Short-term exposure to ozone, nitrogen dioxide, and sulphur dioxide and emergency department visits and hospital admissions due to asthma: A systematic review and meta-analysis. Environ. Int. 2021, 150, 106435. [Google Scholar] [CrossRef]
  31. Chiang, T.Y.; Yuan, T.H.; Shie, R.H.; Chen, C.F.; Chan, C. Increased incidence of allergic rhinitis, bronchitis and asthma, in children living near a petrochemical complex with SO2 pollution. Environ. Int. 2016, 96, 1–7. [Google Scholar] [CrossRef]
  32. Dehghani, M.; Keshtgar, L.; Javaheri, M.R.; Derakhshan, Z.; Oliveri Conti, G.; Zuccarello, P.; Ferrante, M. The effects of air pollutants on the mortality rate of lung cancer and leukemia. Mol. Med. Rep. 2017, 15, 3390–3397. [Google Scholar] [CrossRef] [PubMed]
  33. Gawełko, J.; Cierpiał-Wolan, M.; Bwanakare, S.; Czarnota, M. Association between Air Pollution and Squamous Cell Lung Cancer in South-Eastern Poland. Int. J. Environ. Res. Public Health 2022, 19, 11598. [Google Scholar] [CrossRef] [PubMed]
  34. Sebald, V.; Goss, A.; Ramm, E.; Gerasimova, J.V.; Werth, S. NO2 air pollution drives species composition, but tree traits drive species diversity of urban epiphytic lichen communities. Environ. Pollut. 2022, 308, 119678. [Google Scholar] [CrossRef] [PubMed]
  35. Saneev, B.G.; Ivanova, I.Y.; Maysyuk, E.P.; Tuguzova, T.F.; Ivanov, R.A. The energy infrastructure of the central ecological zone: Air in the natural environment and its ways of removal. Geogr. Nat. Resour. 2016, 5, 218–224. (In Russian) [Google Scholar]
  36. The State Report “On the State and Environmental Protection of the Irkutsk Region in 2019; Megaprint: Irkutsk, Russia, 2020; 314p. (In Russian)
  37. Khodzher, T.V.; Yausheva, E.P.; Shikhovtsev, M.Y.; Zhamsueva, G.S.; Zayakhanov, A.S.; Golobokova, L.P. Black Carbon in the Air of the Baikal Region, (Russia): Sources and Spatiotemporal Variations. Appl. Sci. 2024, 14, 6996. [Google Scholar] [CrossRef]
  38. Obolkin, V.A.; Potemkin, V.L.; Makukhin, V.L.; Khodzher, T.V.; Chipanina, E.V. Long-Range Transport of Plumes of Atmospheric Emissions from Regional Coal Power Plants to the South Baikal Water Basin. Atmos. Ocean. Opt. 2017, 30, 360–365. [Google Scholar] [CrossRef]
  39. Obolkin, V.A.; Potemkin, V.L.; Makukhin, V.L.; Chipanina, E.V.; Marinaite, I.I. Peculiarities of spatial distribution of sulfur dioxide in Cisbaikalia from the data of shipboard measurements and numerical experiments. Russ. Meteorol. Hydrol. 2014, 39, 809–813. [Google Scholar] [CrossRef]
  40. Molozhnikova, E.V.; Golobokova, L.P.; Marinaite, I.I.; Netsvetaeva, O.G.; Shekhovtsev, M.Y.; Khodzher, T.V. Chemical Compound of Atmospheric Deposition in the Baikal State Biospherical Nature Reserve (the Eastern Coast of Southern Baikal). Russ. Meteorol. Hydrol. 2023, 48, 291–299. [Google Scholar] [CrossRef]
  41. Ivanova, I.Y.; Ivanov, R.A. Use of Geovisualization in the Analysis of the Placement of Energy Infrastructure Facilities in the Central Ecological Zone of the Baikal Natural Territory. Informatsionnyye Mat. Tekhnologii Nauk. Upr. [Inf. Math. Technol. Sci. Manag.] 2016, № 4-2, 80–89. (In Russian) [Google Scholar]
  42. Baldauf, R.W.; Watkins, N.; Heist, D.; Bailey, C.; Rowley, P.; Shores, R. Near road air quality monitoring: Factors affecting network design and interpretation of data. Air Qual. Atmos. Health 2009, 2, 1–9. [Google Scholar] [CrossRef]
  43. Molozhnikova, E.V. Uchet zagryazneniya okruzhayushchey sredy aerozolyami v zadachakh razvitiya energeticheskikh sistem [Monitoring of Environmental Pollution by Aerosols in Energy Systems Development]. Ph.D. Thesis, Melentyev Energy Systems Institute of the Siberian Branch of the Russian Academy of Sciences, Irkutsk, Russia, 2003. (In Russian). [Google Scholar]
  44. Maisyuk, E.P. The Role of Energy in the Ecological State of the Baikal Natural Territory. Geogr. Nat. Resour. 2017, 100–107. (In Russian) [Google Scholar] [CrossRef]
  45. Molozhnikova, Y.V.; Shikhovtsev, M.Y.; Netsvetaeva, O.G.; Khodzher, T.V. Ecological Zoning of the Baikal Basin Based on the Results of Chemical Analysis of the Composition of Atmospheric Precipitation Accumulated in the Snow Cover. Appl. Sci. 2023, 13, 8171. [Google Scholar] [CrossRef]
  46. Obolkin, V.A.; Shamanskii, Y.u.V.; Khodzher, T.V.; Falits, A.V. Mesoscale Processes of Atmospheric Pollutants Transfer in the South Baikal Region. Okeanol. Issled. [J. Oceanol. Res.] 2019, 47, 104–113. [Google Scholar] [CrossRef] [PubMed]
  47. Khuriganova, O.I.; Obolkin, V.A.; Golobokova, L.P.; Khodzher, T.V. Monitoring of Atmospheric Trace Gases in Urban and Rural Areas of the Baikal Natural Territory during 2019–2021. Russ. Meteorol. Hydrol. 2023, 48, 324–333. [Google Scholar] [CrossRef]
  48. Spicer, C.W.; Kenny, D.V.; Ward, G.F.; Billick, I.H. Transformations, lifetimes, and sources of NO2, HONO, and HNO3 in indoor environments. Air Waste 1993, 43, 1479–1485. [Google Scholar] [CrossRef]
  49. Ye, C.; Zhou, X.; Pu, D.; Stutz, J.; Festa, J.; Spolaor, M.; Tsai, C.; Cantrell, C.; Mauldin, R.L.; Campos, T.; et al. Rapid cycling of reactive nitrogen in the marine boundary layer. Nature 2016, 532, 489–491. [Google Scholar] [CrossRef]
  50. Potemkina, T.; Potemkin, V. Extreme phenomena in the Lake Baikal basin: Tropical nights and hot days as indicators of climate warming (Eastern Siberia, Russia). Theor. Appl. Climatol. 2024, 155, 6581–6590. [Google Scholar] [CrossRef]
  51. Guo, L.C.; Zhang, Y.; Lin, H.; Zeng, W.; Liu, T.; Xiao, J.; Ma, W. The washout effects of rainfall on atmospheric particulate pollution in two Chinese cities. Environ. Pollut. 2016, 215, 195–202. [Google Scholar] [CrossRef]
  52. Yoo, J.M.; Lee, Y.R.; Kim, D.; Jeong, M.J.; Stockwell, W.R.; Kundu, P.K.; Lee, S.J. New indices for wet scavenging of air pollutants (O3, CO, NO2, SO2, and PM10) by summertime rain. Atmos. Environ. 2014, 82, 226–237. [Google Scholar] [CrossRef]
  53. Duhanyan, N.; Roustan, Y. Below-cloud scavenging by rain of atmospheric gases and particulates. Atmos. Environ. 2011, 45, 7201–7217. [Google Scholar] [CrossRef]
  54. Shikhovtsev, A.Y. Reference optical turbulence characteristics at the Large Solar Vacuum Telescope site. Publ. Astron. Soc. Jpn. 2024, 31, 538–549. [Google Scholar] [CrossRef]
  55. Kotthaus, S.; Halios, C.H.; Barlow, J.F.; Grimmond, C.S.B. Volume for pollution dispersion: London’s atmospheric boundary layer during ClearfLo observed with two ground-based lidar types. Atmos. Environ. 2018, 190, 401–414. [Google Scholar] [CrossRef]
  56. Seibert, P.; Beyrich, F.; Gryning, S.E.; Joffre, S.; Rasmussen, A.; Tercier, P. Review and intercomparison of operational methods for the determination of the mixing height. Atmos. Environ. 2000, 34, 1001–1027. [Google Scholar] [CrossRef]
  57. Wang, J.; Alli, A.S.; Clark, S.; Hughes, A.; Ezzati, M.; Beddows, A.; Vallarino, J.; Nimo, J.; Bedford-Moses, J.; Baah, S.; et al. Nitrogen oxides (NO and NO2) pollution in the Accra metropolis: Spatiotemporal patterns and the role of meteorology. Sci. Total Environ. 2022, 803, 149931. [Google Scholar] [CrossRef] [PubMed]
  58. Bolbasova, L.A.; Shikhovtsev, A.Y.; Kopylov, E.A.; Selin, A.A.; Lukin, V.P.; Kovadlo, P.G. Daytime optical turbulence and wind speed distributions at the Baikal Astrophysical Observatory. Mon. Not. R. Astron. Soc. 2019, 482, 2619–2626. [Google Scholar] [CrossRef]
  59. Shikhovtsev, M.Y.; Molozhnikova, Y. Inter-annual dynamics of regional and transboundary transport of air masses of the Baikal region for 2010–2018. Proc. SPIE 2020, 11560, 1–8. [Google Scholar] [CrossRef]
  60. Shikhovtsev, M.Y.; Obolkin, V.A.; Khodzher, T.V.; Molozhnikova, Y.V. Variability of the Ground Concentration of Particulate Matter PM1-PM10 in the Air Basin of the Southern Baikal Region. Atmos. Ocean. Opt. 2023, 36, 655–662. [Google Scholar] [CrossRef]
  61. Bahino, J.; Yoboué, V.; Galy-Lacaux, C.; Adon, M.; Akpo, A.; Keita, S.; Liousse, C.; Gardrat, E.; Chiron, C.; Ossohou, M.; et al. A pilot study of gaseous pollutants’ measurement (NO2, SO2, NH3, HNO3 and O3) in Abidjan, Côte d’Ivoire: Contribution to an overview of gaseous pollution in African cities. Atmos. Chem. Phys. 2018, 18, 5173–5198. [Google Scholar] [CrossRef]
  62. Novikova, S.A. Pollution of Atmosphere by Auto Transport Emissions in Big Cities of Irkutsk Region. Bull. Irkutsk. State Univ. Ser. «Earth Sci.» 2015, 11, 64–82. (In Russian) [Google Scholar]
  63. Sokolova, N.A.; Chelpanova, I.A.; Levashev, A.G. Study of Parameters of Transport Flow and Visitors of the Tourist Listvyanka Settlement in the Irkutsk Region. Mezhdunarodnyy Zhurnal Gumanit. Yestestvennykh Nauk. [Int. J. Humanit. Nat. Sci.] 2022, 230–234. (In Russian) [Google Scholar] [CrossRef]
  64. Obolkin, V.; Molozhnikova, E.; Shikhovtsev, M.; Netsvetaeva, O.; Khodzher, T. Sulfur and nitrogen oxides in the atmosphere of lake baikal: Sources, automatic monitoring, and environmental risks. Atmosphere 2021, 12, 1348. [Google Scholar] [CrossRef]
  65. Gubanova, D.P.; Belikov, I.B.; Elansky, N.F.; Skorokhod, A.I.; Chubarova, N.E. Variations in PM2.5 Surface Concentration in Moscow according to Observations at MSU Meteorological Observatory. Atmos. Ocean. Opt. 2018, 31, 290–299. [Google Scholar] [CrossRef]
  66. Soleimanpour, M.; Alizadeh, O.; Sabetghadam, S. Analysis of diurnal to seasonal variations and trends in air pollution potential in an urban area. Sci. Rep. 2023, 13, 21065. [Google Scholar] [CrossRef] [PubMed]
  67. Ionov, D.V.; Poberovskii, A.V. Variability of Nitrogen Oxides in the Atmospheric Surface Layer near Saint Petersburg. Russ. Meteorol. Hydrol. 2020, 45, 720–726. [Google Scholar] [CrossRef]
  68. Jang, E.; Do, W.; Park, G.; Kim, M.; Yoo, E. Spatial and temporal variation of urban air pollutants and their concentrations in relation to meteorological conditions at four sites in Busan, South Korea. Atmos. Pollut. Res. 2017, 8, 89–100. [Google Scholar] [CrossRef]
  69. Kendrick, C.M.; Koonce, P.; George, L.A. Diurnal and seasonal variations of NO, NO2 and PM2.5 mass as a function of traffic volumes alongside an urban arterial. Atmos. Environ. 2015, 122, 133–141. [Google Scholar] [CrossRef]
  70. Henry, R.; Norris, G.A.; Vedantham, R.; Turner, J.R. Source region identification using kernel smoothing. Environ. Sci. Technol. 2009, 43, 4090–4097. [Google Scholar] [CrossRef]
  71. Attiya, A.A.; Jones, B.G. Impact of smoke plumes transport on air quality in Sydney during extensive bushfires (2019) in New South Wales, Australia using remote sensing and ground data. Remote Sens. 2022, 14, 5552. [Google Scholar] [CrossRef]
  72. Stein, A.F.; Draxler, R.R.; Rolph, G.D.; Stunder, B.J.B.; Cohen, M.D.; Ngan, F. NOAA’s HYSPLIT atmospheric transport and dispersion modeling system. Bull. Am. Meteorol. Soc. 2015, 96, 2059–2077. [Google Scholar] [CrossRef]
  73. Attiya, A.A.; Jones, B.G. An extensive dust storm impact on air quality on 22 November 2018 in Sydney, Australia, using satellite remote sensing and ground data. Environ. Monit. Assess. 2022, 194, 432. [Google Scholar] [CrossRef]
Figure 1. Layout of the Irkutsk (IRK) and Listvyanka (LSTV) monitoring stations and the main sources of air pollution in the study region.
Applsci 14 08327 g001
Figure 2. An example of the accumulation of online monitoring data in the Grafana system on the LIN SB RAS server (Irkutsk).
Applsci 14 08327 g002
Figure 3. Frequency distribution graphs of 20-minute averaged concentrations of SO2, NO, and NO2 at the Irkutsk and Listvyanka monitoring stations during the heating (blue) and non-heating (red) seasons. The ordinate axis shows the recurrence of the concentrations within a certain range. The abscissa axis shows the pollutant concentration ranges. The data are averaged for 2020–2023.
Applsci 14 08327 g003
Figure 4. Intra-annual variability of sulfur dioxide (SO2) concentrations at the Irkutsk and Listvyanka stations from 2020 to 2023, without atypical values (outliers). The ordinate axis shows the concentrations (µg/m3); the abscissa axis shows the month. The diagram shows the median (bold line), the first quartile (lower boundary of the box), and the third quartile (upper boundary of the box).
Applsci 14 08327 g004
Figure 5. Intra-annual variability of nitrogen dioxide (NO2) concentrations at the Irkutsk and Listvyanka stations from 2020 to 2023, without atypical values (outliers). The ordinate axis shows the concentrations (µg/m3); the abscissa axis shows the month. The diagram shows the median (bold line), the first quartile (lower boundary of the box), and the third quartile (upper boundary of the box).
Applsci 14 08327 g005
Figure 6. Intra-annual variability of nitrogen oxide (NO) concentrations at the Irkutsk and Listvyanka stations from 2020 to 2023, without atypical values (outliers). The ordinate axis shows the concentrations (µg/m3); the abscissa axis shows the month. The diagram shows the median (bold line), the first quartile (lower boundary of the box), and the third quartile (upper boundary of the box).
Applsci 14 08327 g006
Figure 7. Weekly and daily variations in the concentrations of nitrogen and sulfur oxides in the heating (October to April, blue) and non-heating (May to September, red) seasons. Shading shows the 95% confidence intervals of the mean value.
Applsci 14 08327 g007
Figure 8. NWR analysis for the 20-min concentrations of SO2, NO2, and NO at the Listvyanka station in the polar coordinate system from January 2020 to December 2023.
Applsci 14 08327 g008
Figure 9. Episode of severe air pollution at the Listvyanka station on 13 and 14 December 2023: (a) variability of the 20-min concentrations of gaseous pollutants (SO2, NO2, NO); (b) vertical profiles of the air temperature at the Listvyanka station; (cf) temperature stratification at the Angarsk station based on radiosonde data (the dotted line reflects the altitude of the temperature inversion boundary).
Applsci 14 08327 g009
Figure 10. Air mass transport trajectories from large anthropogenic sources in Irkutsk, Angarsk, and Shelekhov calculated using the HYSPLIT model: (a) 13 December 2023 (6 a.m.) and (b) 14 December 2023 (10 p.m.).
Applsci 14 08327 g010
Table 1. Comparison of the 20-min gas concentrations (µg m3) at the urban and rural stations from 2020 to 2023. In the numerator—June–September–October–April; in the denominator, the average for all the observation periods.
µg m3“Irkutsk” Station (Urban)“Listvyanka” Station (Rural)
Avg. Time = 20 minSO2NONO2SO2NONO2
Average7.0–19.8
12.2
7.8–19.3
13.6
14.9–28.3
21.6
7.2–22.1
16.4
1.4–1.3
1.3
3.3–8.1
5.7
Maximum224.6–237.7206.0–503.0114.3–150.4289–75434–8294.4–94.8
SD10.1–25.8
19.3
12.6–32.6
26.5
14.5–20.8
19.4
9.0–37.8
23.4
2.6–3.8
3.2
4.8–11.1
8.0
Median4.5–9.0
5.7
3.6–7.0
5.3
10.1–26.7
17.1
4.5–9.2
6.8
0.0–0.0
0.0
1.4–3.0
2.2
Table 2. Number of episodes with elevated SO2 and NO2 concentrations at the “Listvyanka” station, n—total numbers of measurements.
Avg. Time = 1 hIIIIIIIVVVIVIIVIIIIXXXIXII
SO2 > 85 µg m3219205681800021667238
n292423292519209721522329203019522093208923412777
NO2 > 35 µg m320918033752145648158260
n278721192129195921461927178126802234256424012669
Table 3. Meteorological statistics at the Listvyanka and Irkutsk monitoring stations, according to EANET data (https://monitoring.eanet.asia/document/public/index, (accessed on 6 September 2024)).
MonthIIIIIIIVVVIVIIVIIIIXXXIXII
Listvyanka station (rural)
T, °C−14.4−15.1−6.91.07.010.613.513.18.22.5−4.8−11.7
Precipitation amount, mm/month18.38.47.616.059.376.4122.277.246.022.314.219.1
Mean wind speed, m/s3.23.83.53.43.32.82.62.33.03.33.74.3
Irkutsk station (urban)
T, °C−16.2−14.8−4.93.811.016.418.316.09.42.5−6.2−14.4
Precipitation amount, mm/month27.314.36.114.647.288.9129.967.543.115.518.219.6
Mean wind speed, m/s1.61.72.02.02.01.61.51.41.71.81.71.4
Disclaimer/Publisher’s Note: The statements, opinions and data contained in all publications are solely those of the individual author(s) and contributor(s) and not of MDPI and/or the editor(s). MDPI and/or the editor(s) disclaim responsibility for any injury to people or property resulting from any ideas, methods, instructions or products referred to in the content.

