Article

Analysis of Mechanical Properties of Steep Surrounding Rock and Failure Process with Countermeasures for Tunnel Bottom Structures

School of Civil Engineering, Beijing Jiaotong University, Beijing 100044, China
*
Author to whom correspondence should be addressed.
Appl. Sci. 2024, 14(18), 8341; https://doi.org/10.3390/app14188341
Submission received: 9 August 2024 / Revised: 9 September 2024 / Accepted: 14 September 2024 / Published: 16 September 2024

Abstract

:
Steep surrounding rock significantly challenges tunnel stability by affecting the stress distribution and deformation behavior. The angle of dip in surrounding rock greatly influences these factors, heightening the risk of instability along bedding planes, particularly under high ground stress conditions. This paper presents a comprehensive analysis of steep rock strata mechanical properties based on a railway tunnel in Yunnan Province, China. It incorporates long-term field monitoring and various laboratory tests, including point load, triaxial, and loose circle tests. Using experimental data, this study simulated the failure processes of steep surrounding rock and tunnel structures with a custom finite element method (FEM) integrated with the volume of fluid (VOF) approach. The analysis summarized the deformation patterns, investigated the causes of inverted arch deformation and failure, and proposed countermeasures. The findings reveal that increasing the rock dip angle results in greater deformation and accelerated failure rates, with the surrounding rock’s loose zone stabilizing at approximately 8 m once deformation stabilizes. At a surface deformation of 8 cm, the failure zone extends to 6 m; however, this extension occurs more rapidly with higher lateral pressure coefficients. Additionally, failure zones develop more quickly in thin, soft rock on steep slopes compared to uniform rock formations. The rise of the tunnel floor is attributed to the steeply inclined, thin surrounding rock. To enhance bottom structure stiffness, this study recommends incorporating an inverted arch structure and increasing both the number and strength of the anchor bolts.

1. Introduction

Tunnel excavation in steep rock areas presents significant geotechnical challenges due to the complex mechanical behavior of rock masses. The distinctive geomechanical properties of steep rock frequently cause deformation and stability issues within tunnel infrastructure, with tunnel inverts being particularly susceptible to high stress concentrations [1,2]. These concentrations, resulting from the unstable equilibrium of the surrounding rock, can lead to substantial deformation, instability, and even structural damage. A thorough understanding of the mechanical properties of steep rock is crucial for the effective design, construction, and long-term stability of tunnels in such complex geological settings. To address these challenges, preliminary research by several scholars has been undertaken.
Different geological compositions, such as soft soil, soft rock, and composite strata, exhibit varying lithologies and engineering properties, each affecting large deformation in tunnels differently [3,4,5,6,7]. The impact of stress conditions, including high ground stress and groundwater presence, is also critical [8,9,10,11]. Addressing these issues, researchers have utilized model tests to analyze tunnel deformation mechanisms. For instance, Yang et al. [12] studied deformation and failure patterns in deep-buried composite strata, finding that damage is influenced by stress levels and lithological characteristics. Numerical simulations have similarly been employed to investigate tunnel deformation [13], with Du et al. [14] simulating soil deformation under deformation lining control and analyzing stress states and soil arch development in loess tunnels. Further research has focused on countermeasures for tunnel deformation. Tian et al. [15] proposed a radial yield support method with a compressible layer to mitigate deformation, while Yu et al. [16] outlined principles for designing prestressed support systems, demonstrated through a case study of layered carbonaceous shale tunnels. Alongside specific optimization measures, numerous scholars have extensively re-searched tunnel repair materials and monitoring techniques [17,18,19,20,21]. Zheng et al. [22] explored the effect of soil strength on base bulge damage mechanisms, revealing that soil strength increases with depth and that the sliding surface extends downward. Ma et al. [23] analyzed tunnel floor heave impacts using on-site monitoring and numerical simulations, noting that deformation pressure transfers to the filling layer due to surrounding rock weakening. Ou et al. [24] investigated tunnel floor heave mechanisms in inclined coal bed highways, identifying horizontal stress as a primary cause. Feng et al. [25] examined floor heave causes, including ground stress and surrounding rock structure, through field investigations and simulations. Regarding finite element methods (FEMs), Li et al. [26] utilized a two-dimensional geotechnical model to capture critical sliding surfaces. Mo et al. [27] investigated coal mine tunnel bottom drumming, finding that the destruction of weak units causes displacement. Wang et al. [28] combined FEMs with discrete element methods to simulate deep roadway excavation, focusing on rock deformation and lining damage. Chen et al. [29] simulated seepage experiments using FEMs to study spatial seepage and tunnel interaction. In fluid mechanics, the volume of fluid (VOF) method has seen advancements. Ruiz-Gutiérrez et al. [30] introduced a new VOF approach for fluid–fluid interfaces, considering surface tension and force equilibrium. Ni et al. [31] developed an algebraic VOF approach to address operational issues in fluid simulation. Sabooniha et al. [32] used VOF to study clogging mechanisms in porous media, considering parameters such as oil droplets.
Although significant advancements have been made in understanding large deformation in tunnel surrounding rock, much of the existing research adopts a macro perspective. There is limited investigation into the specific structural characteristics of steeply inclined rock strata, leading to unclear mechanical properties. Additionally, long-term on-site monitoring of loose circles has often been overlooked. This paper addresses these gaps by utilizing extensive test data from actual projects to provide a scientific basis for studying the “coupling structure” of steep rock strata and tunnels. Furthermore, traditional studies frequently neglect the use of numerical simulation software that more accurately models the impact of groundwater on tunnel structures. This paper employs a combination of the finite element method (FEM) and the volume of fluid (VOF) method to simulate the failure processes of steeply inclined surrounding rock and tunnel floor structures. It summarizes the deformation patterns of tunnels and analyzes the causes of surrounding rock failure and floor heave. The findings have been implemented and validated in practical applications, offering both theoretical insights and practical experience for industry professionals.

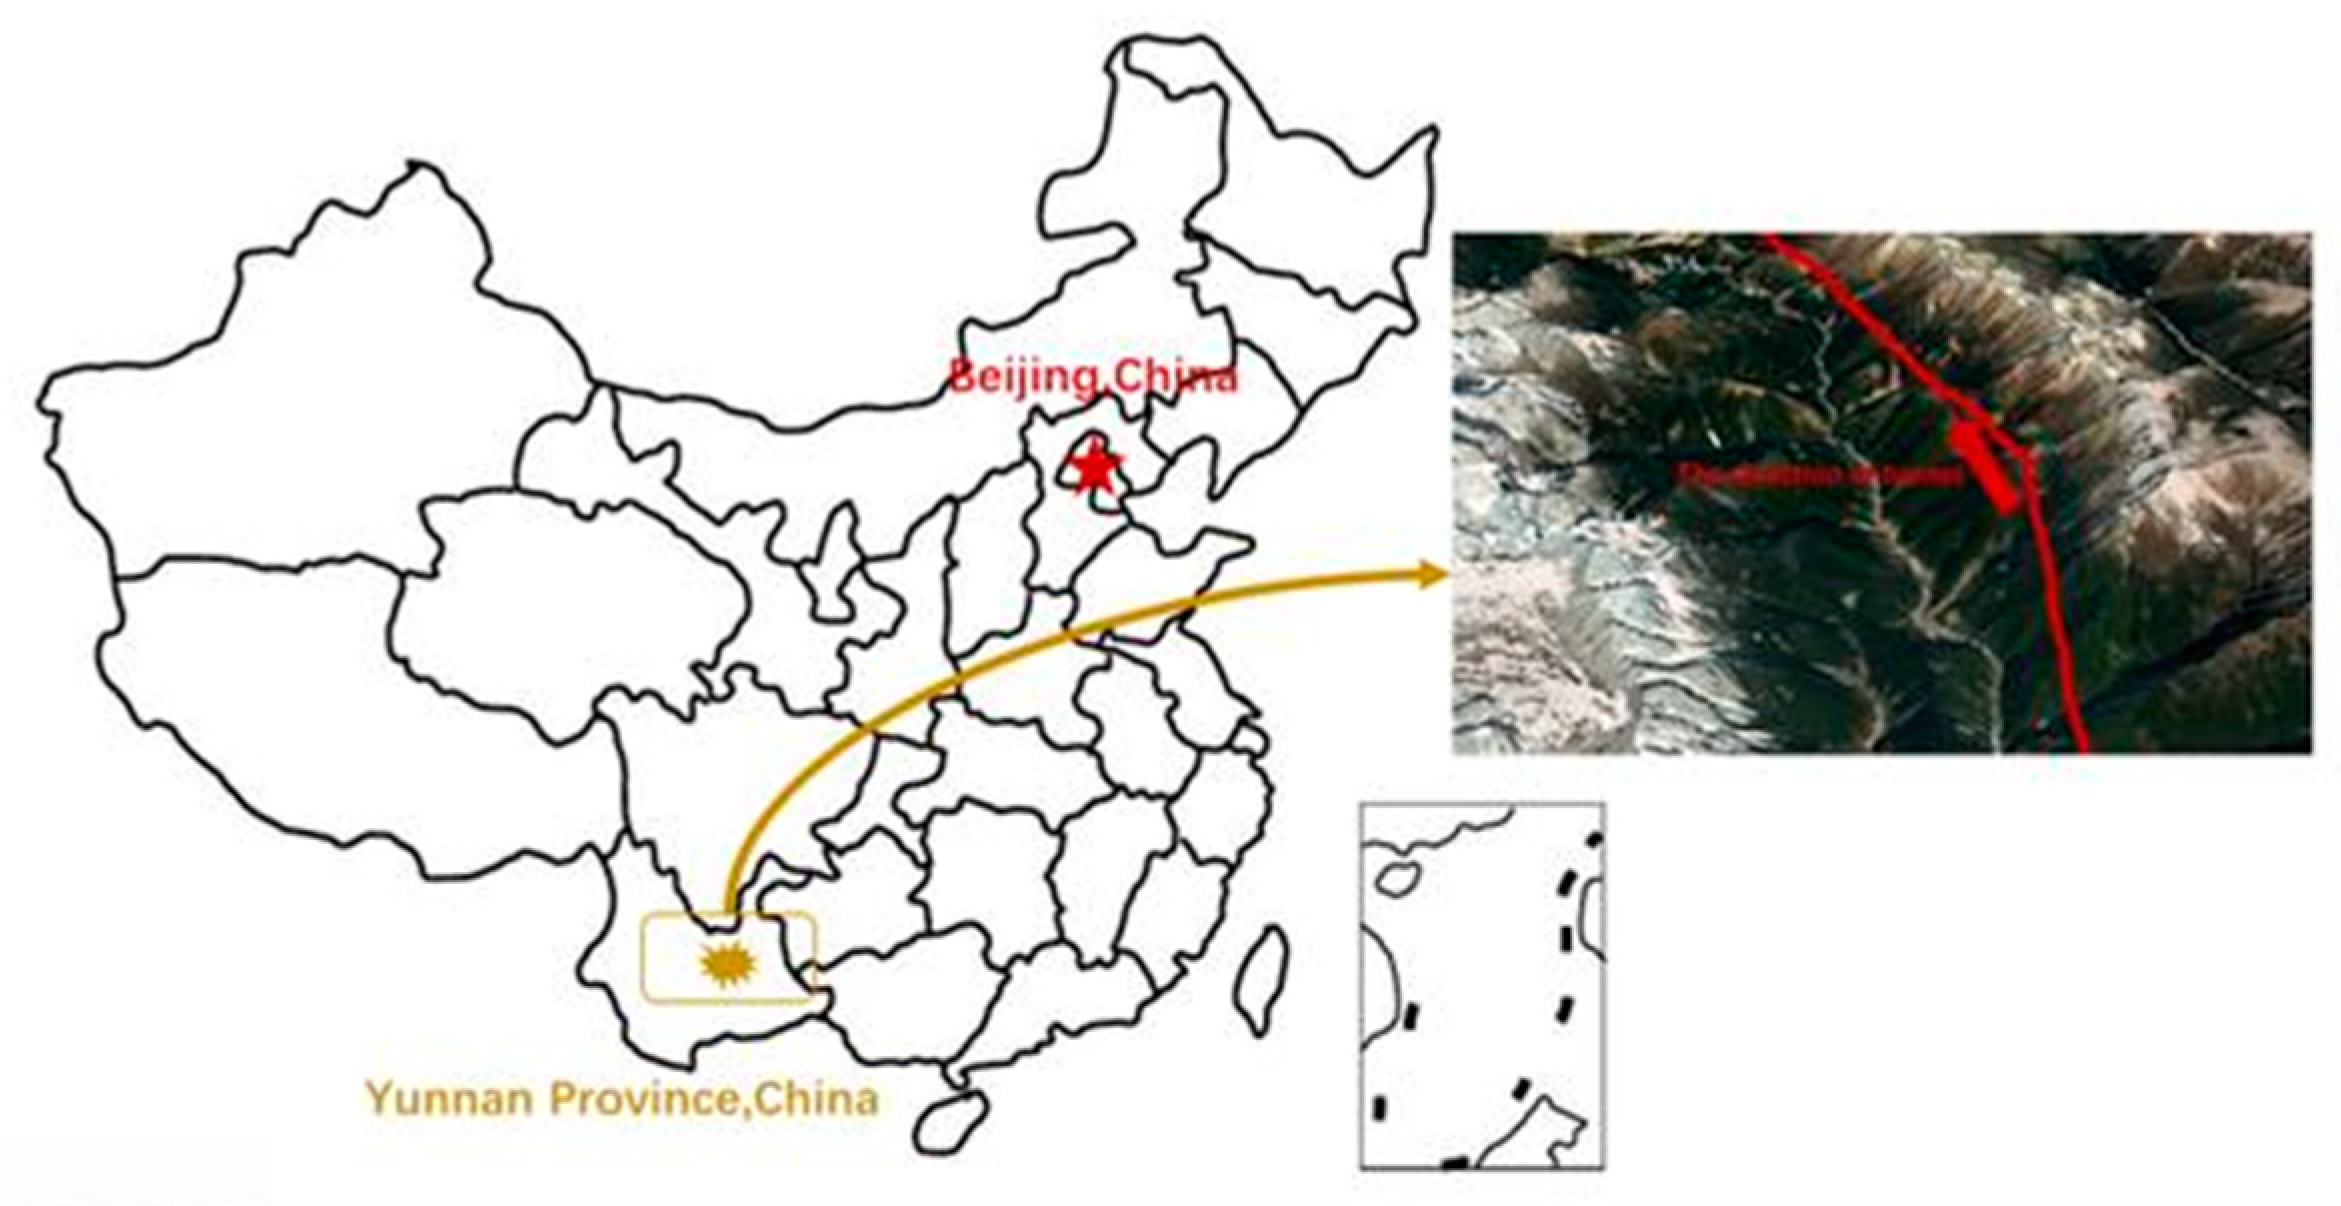
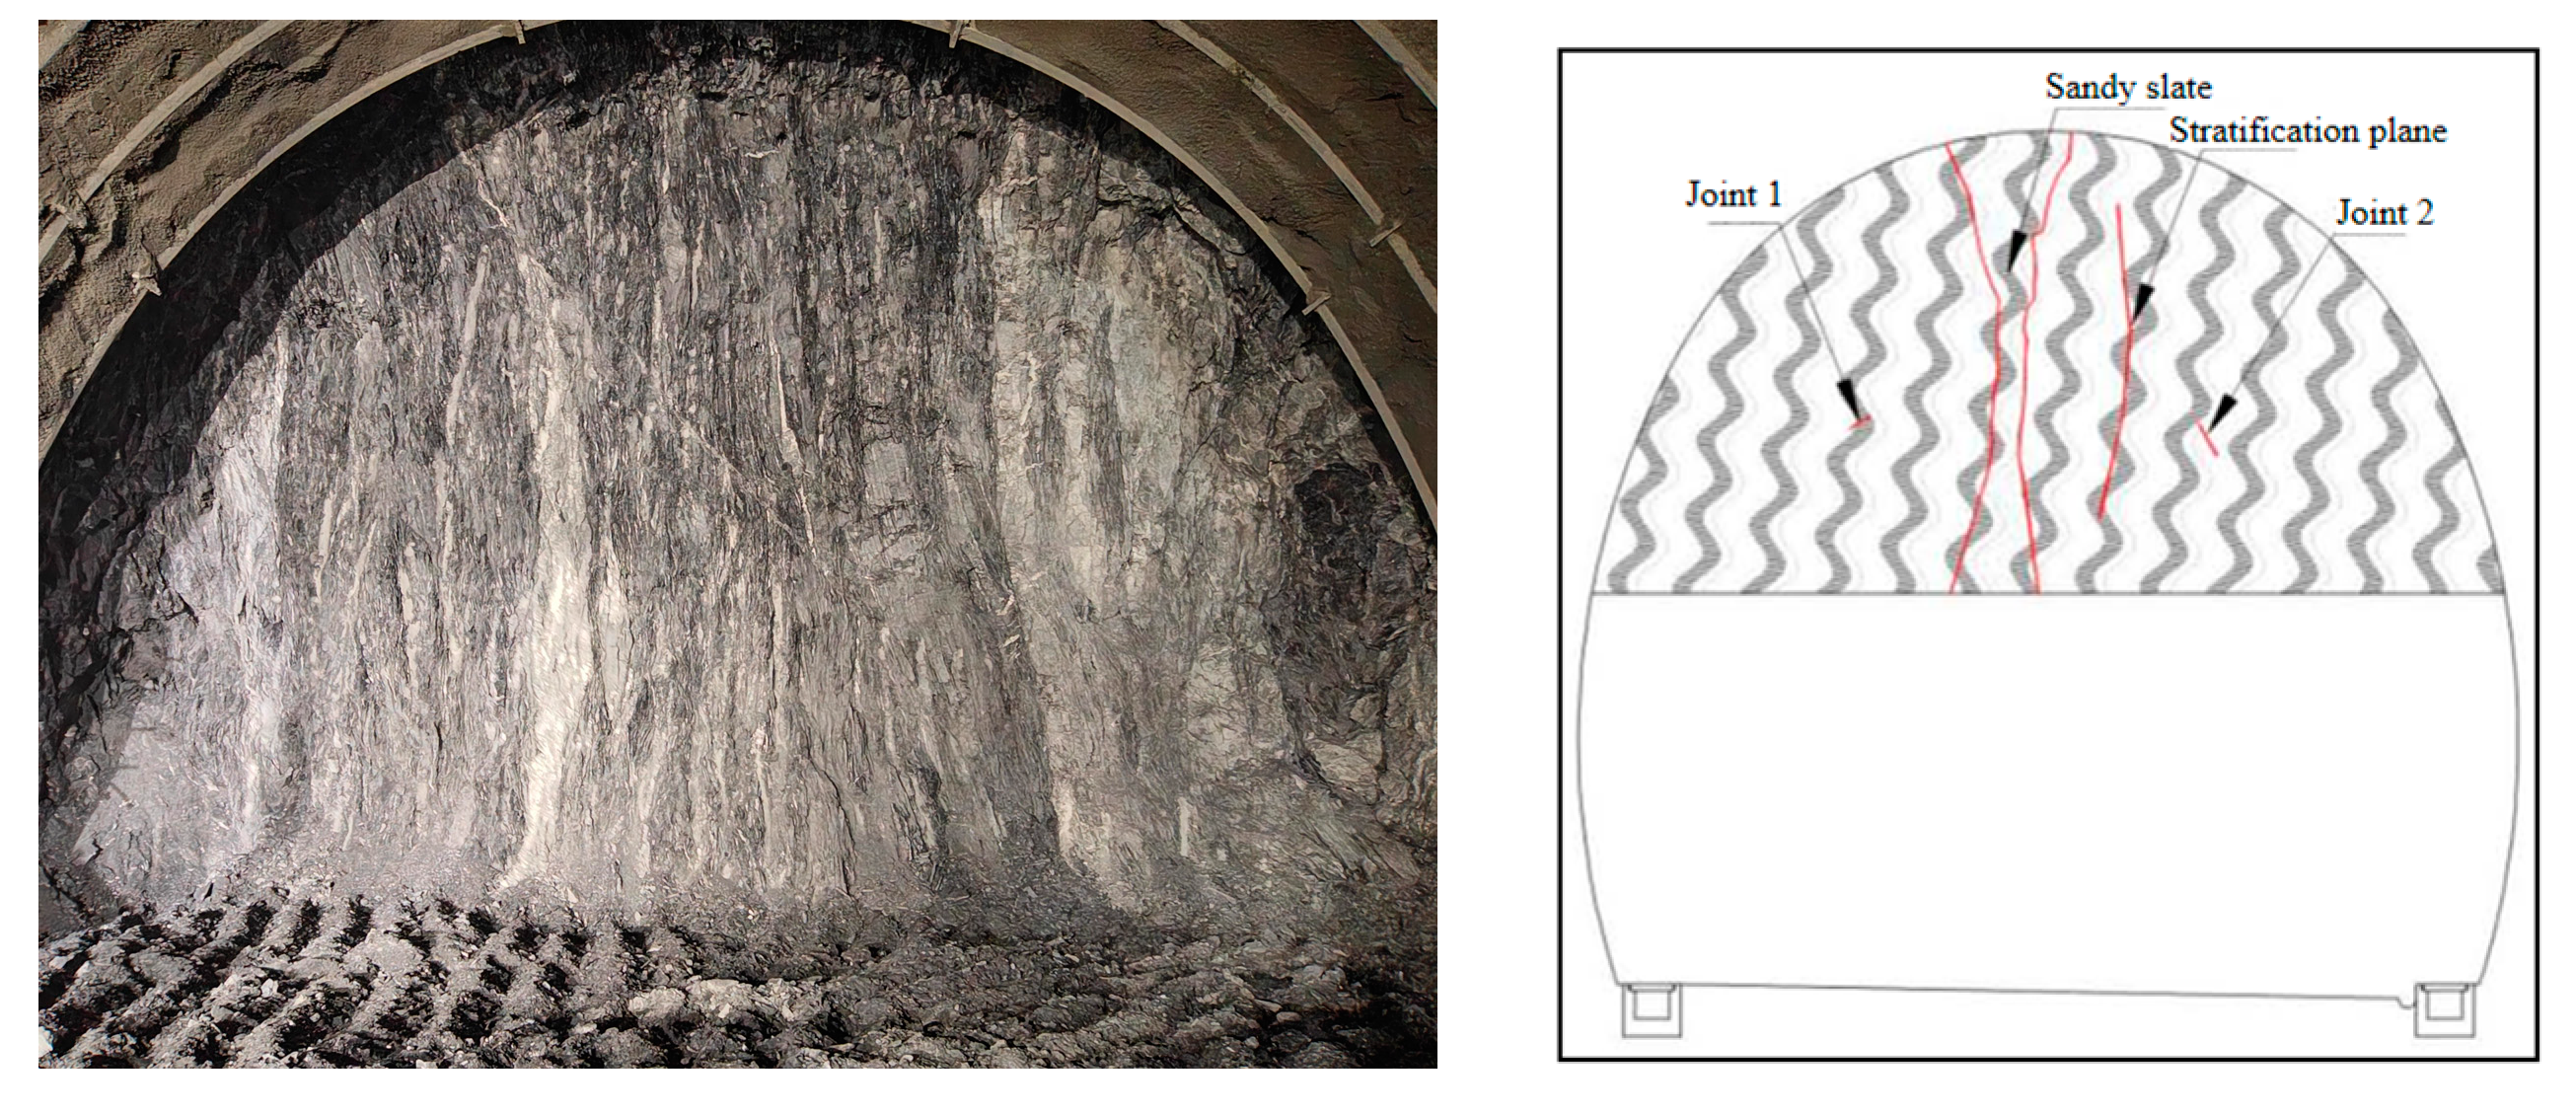
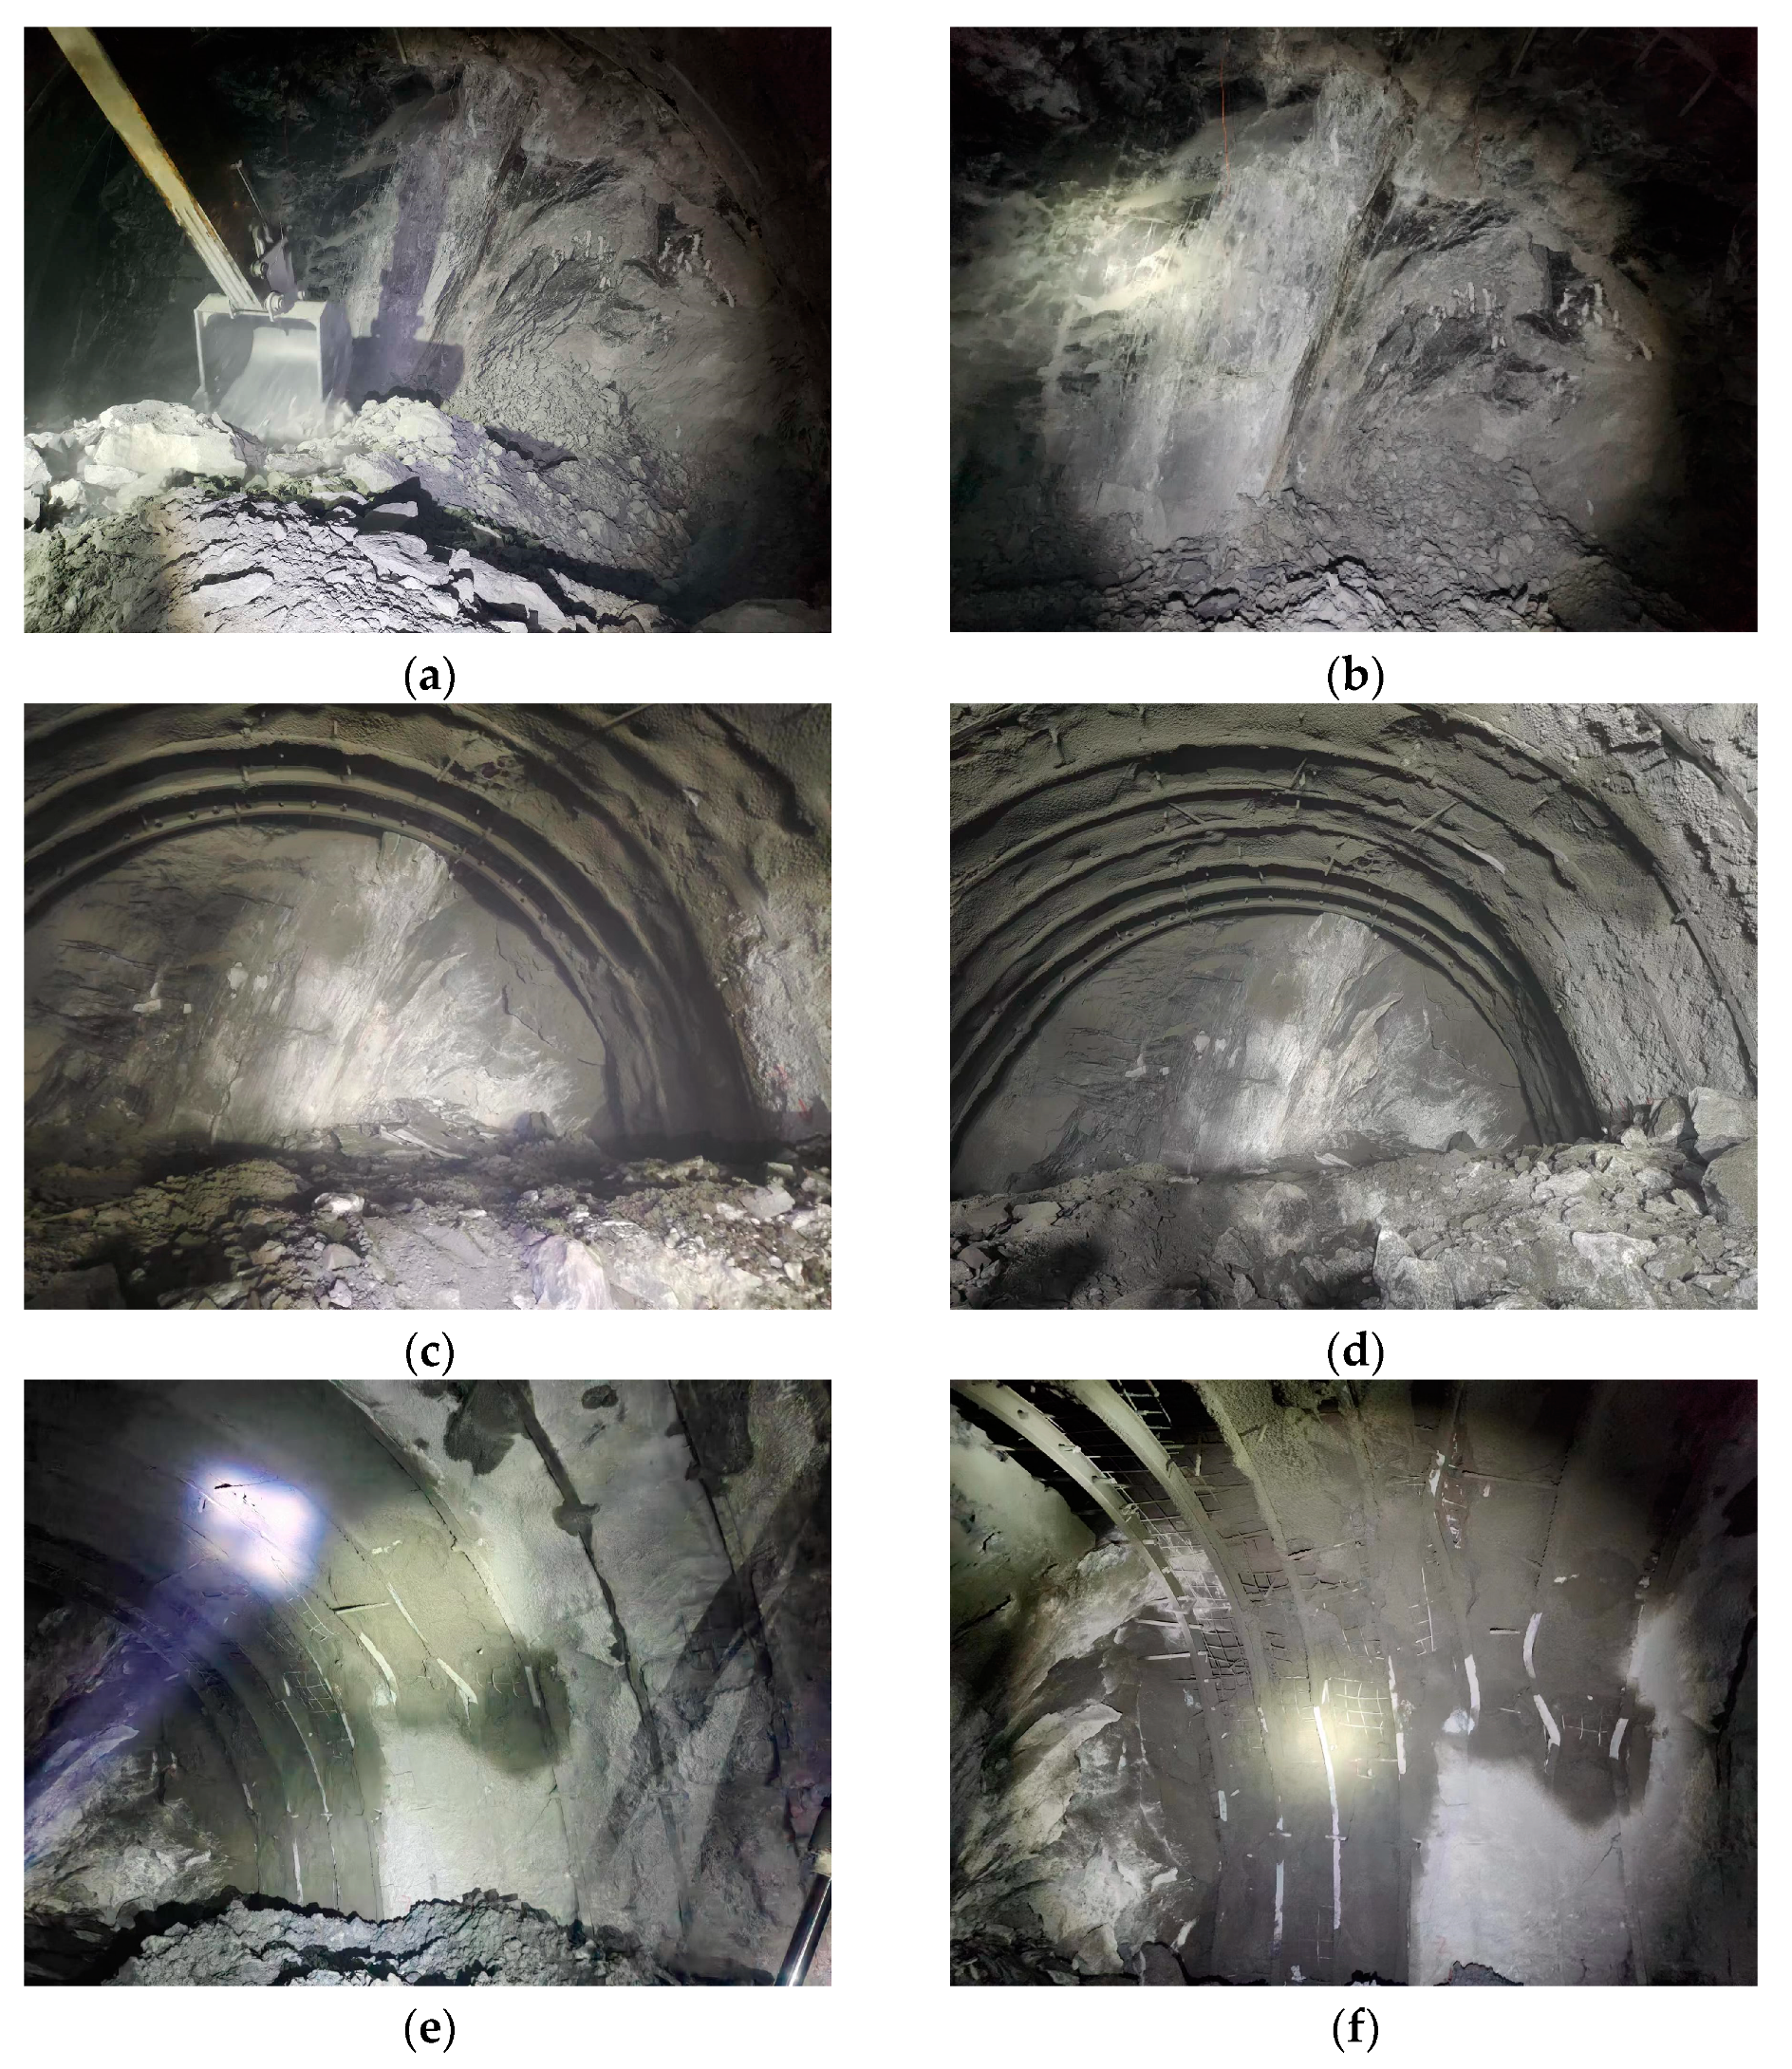
2. Engineering Background

The Laoshishan Tunnel, located in Kunming, Yunnan Province, China, poses considerable engineering challenges due to the extensive distribution of karst formations and the highly developed karst features, as illustrated in Figure 1. These conditions are exacerbated during the rainy season, which brings substantial groundwater inflows, complicating the geological environment even further. The surrounding rock mass, primarily consisting of shale with interbedded argillaceous sandstone, is of notably poor quality, contributing to the complex and demanding construction conditions.
The stratum of the tunnel site area mainly includes Quaternary Holocene alluvial-diluvial (Q4al+pl) silty clay, pebble soil, gravel soil, residual slope (Q4dl+el) silty clay, and breccia soil; the Paleogene Relu Formation (E2-3r) purple conglomerate, calcareous lithic sandstone, and glutenite with different particle sizes; the Middle Triassic Lieyi Formation (T2ly) sericite-quartz phyllite intercalated with sericite phyllite; and the Lower Triassic Dangen Formation (T1d) gray-black carbonaceous slate, sericite slate, phyllite, metamorphic argillaceous siltstone intercalated with crystalline limestone, and dolomitic oolitic limestone. The design parameters for tunnel support are illustrated in Figure 2.
This section is characterized by numerous faults. Influenced by the regional tectonic framework, the rock mass exhibits highly developed joints and fissures, resulting in a generally fractured surrounding rock mass. Excavation of the large deformation section has revealed that the surrounding rock comprises steeply inclined, extremely thin slate and carbonaceous slate. Additionally, due to tectonic compression, portions of the surrounding rock strata are distorted and display wavy structures, as illustrated in Figure 3.
Due to the highly fractured nature of the rock mass, the uniaxial compressive strength measured using point load tests in the vertical direction is less than 5 MPa, classifying it as extremely soft rock. The weak interlayer bonding results in the formation of smooth surfaces between layers, commonly referred to as the “mirror phenomenon”, as illustrated in Figure 4, rendering it impossible to measure the strength along these layers. Following tunnel excavation, the surrounding rock undergoes relaxation, resulting in localized micro-creep. The combined effect of these factors leads to progressive deformation, which, in turn, triggers the rupture of deeper rock masses. This process causes the deformation of the surrounding rock to manifest gradually. In the case of the tunnel, the soft rock has exhibited persistent deformation over a significant length of 190 m, accounting for 11.57% of the total tunnel length, all of which is categorized as large deformation.

3. Analysis of Mechanical Properties of Steep Surrounding Rock

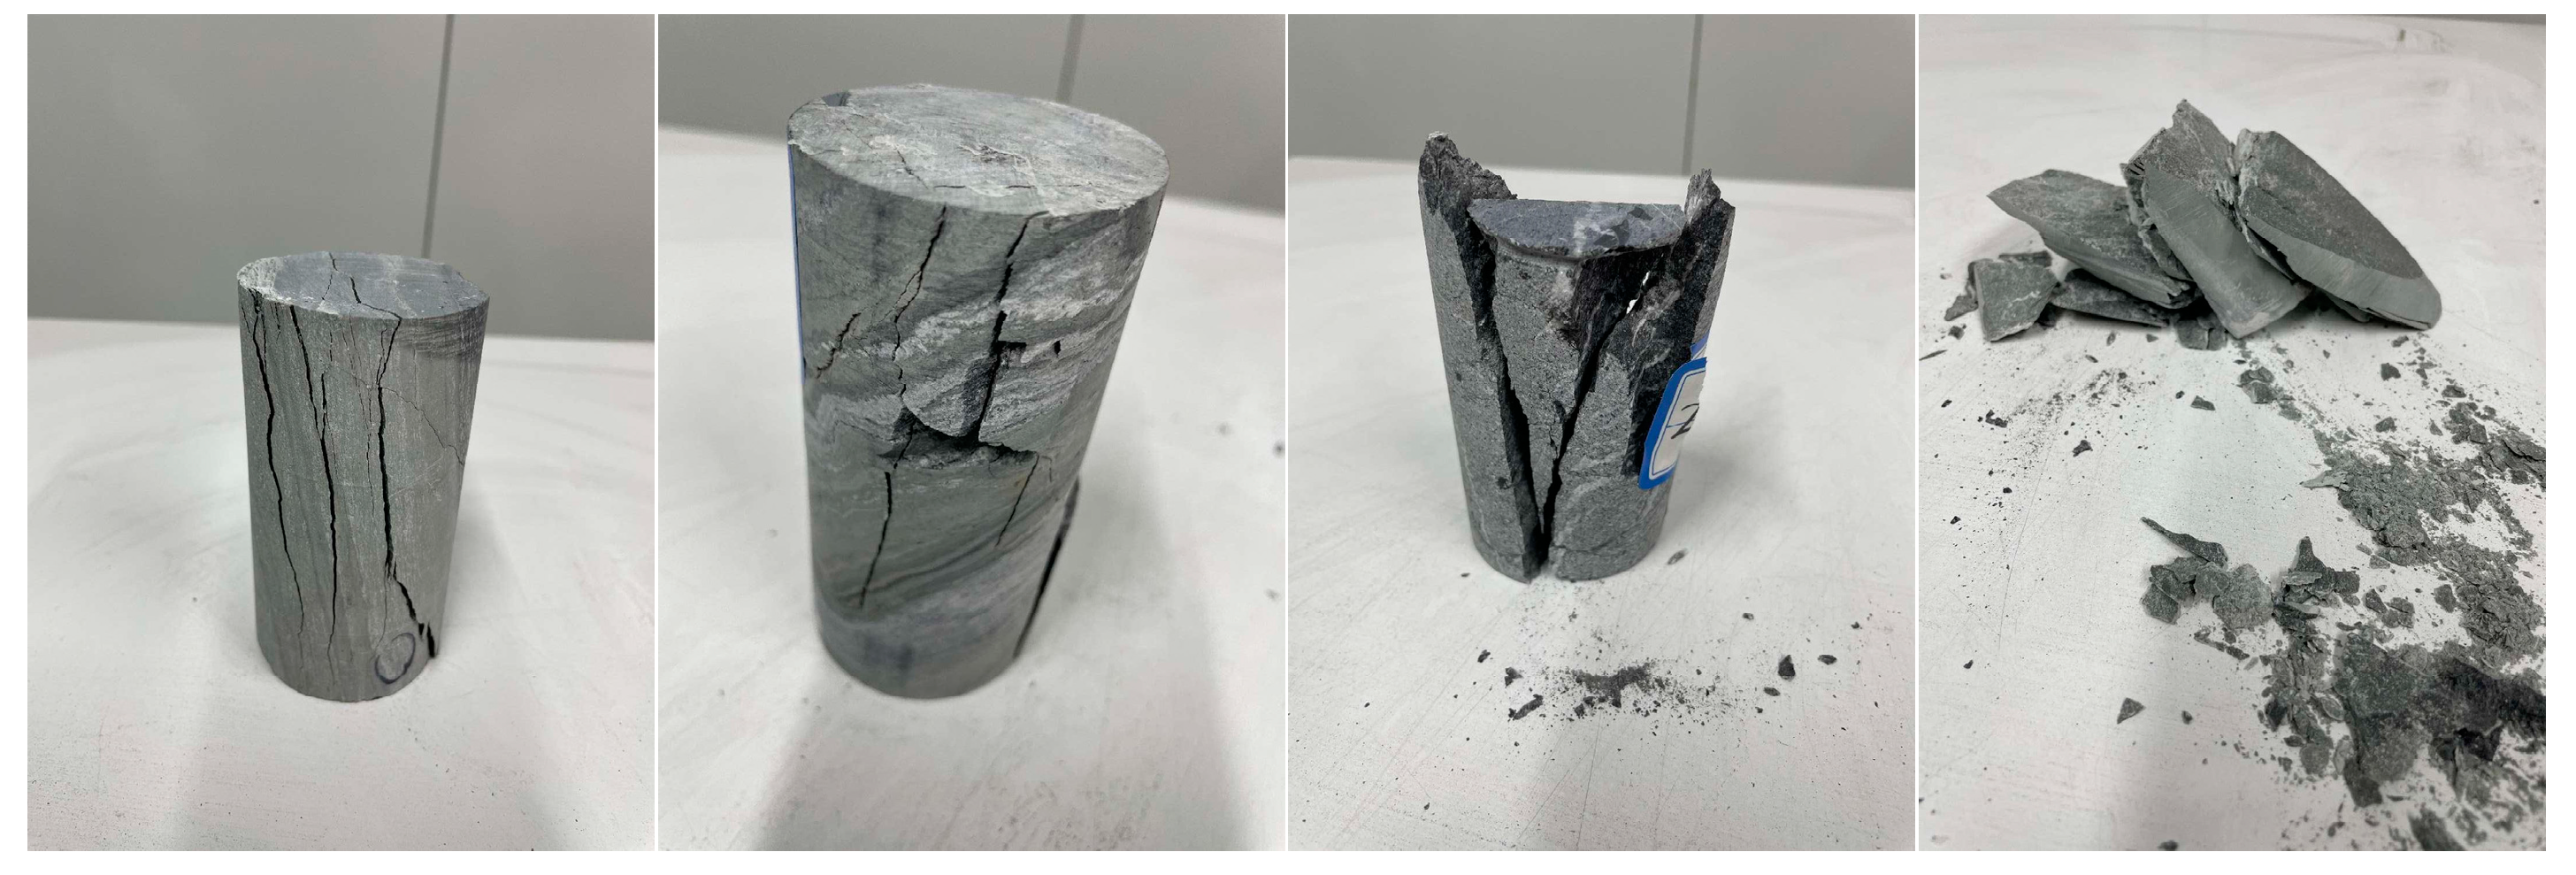
3.1. Point Load Test

The rock samples used in this study are carbonaceous slate collected from the tunnel site, where point load tests were conducted on surrounding rock at each excavation face. The site’s lithology is notably weak due to extensive soft rock deformation, characterized by a highly developed structure and fragile carbonaceous slate that struggles to form cohesive blocks. Figure 5 presents the results of the point load test (four typical failure modes). Table 1 shows the point load test results of the tunnel.
Table 1 provides the energy characteristic parameters of different rock blocks. There are four sets of data with a failure load of 0. The reason for the failure is that the point load sample is seriously affected by blasting, and there are cracks, which affect the strength of the test block. Therefore, these four sets of data are excluded when analyzing the data. The maximum uniaxial compressive strength of the rock obtained after exclusion is 10.827 MPa, the minimum value is 0.09 MPa, the standard deviation of the data is 2.739, and the average strength is 4.72 MPa, which belongs to the extremely soft rock.
The tunnel has a thin layer of surrounding rock (part of the layer thickness is less than 1 cm), as shown in Figure 3. The strength of this kind of surrounding rock is quite different when the loading angle is different; there is inhomogeneity in the strength of the layered surrounding rock loaded at different angles.

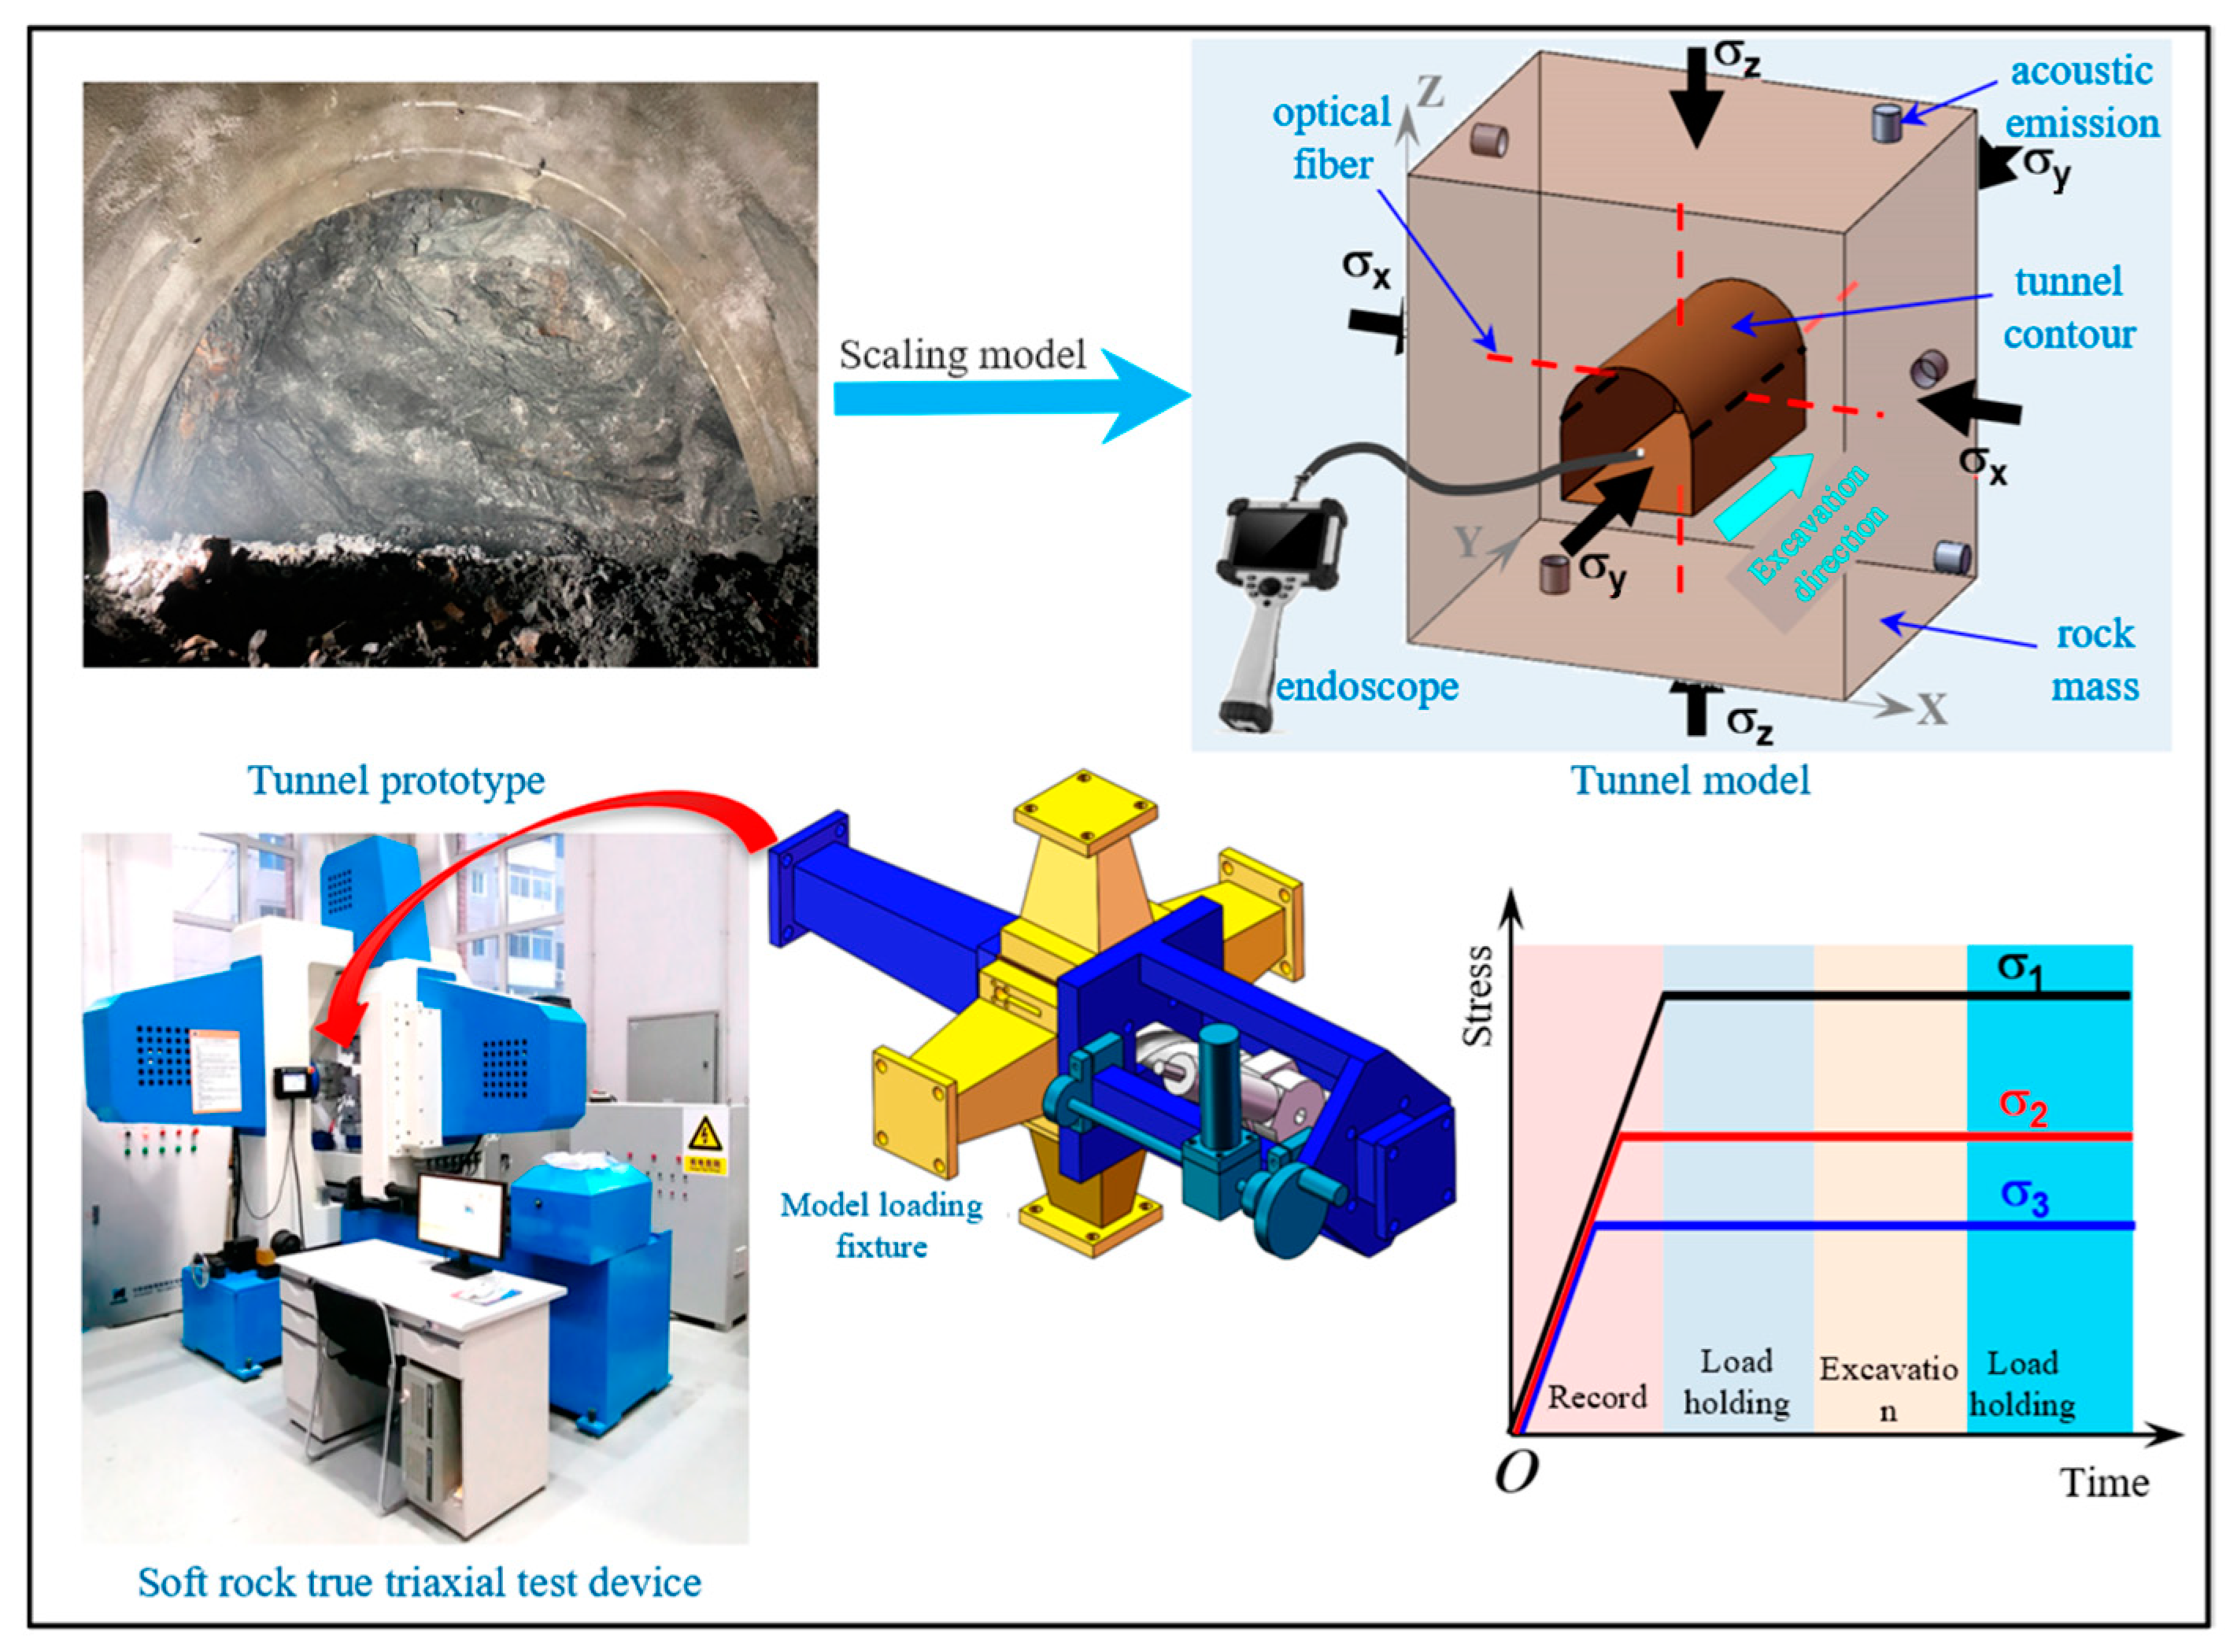
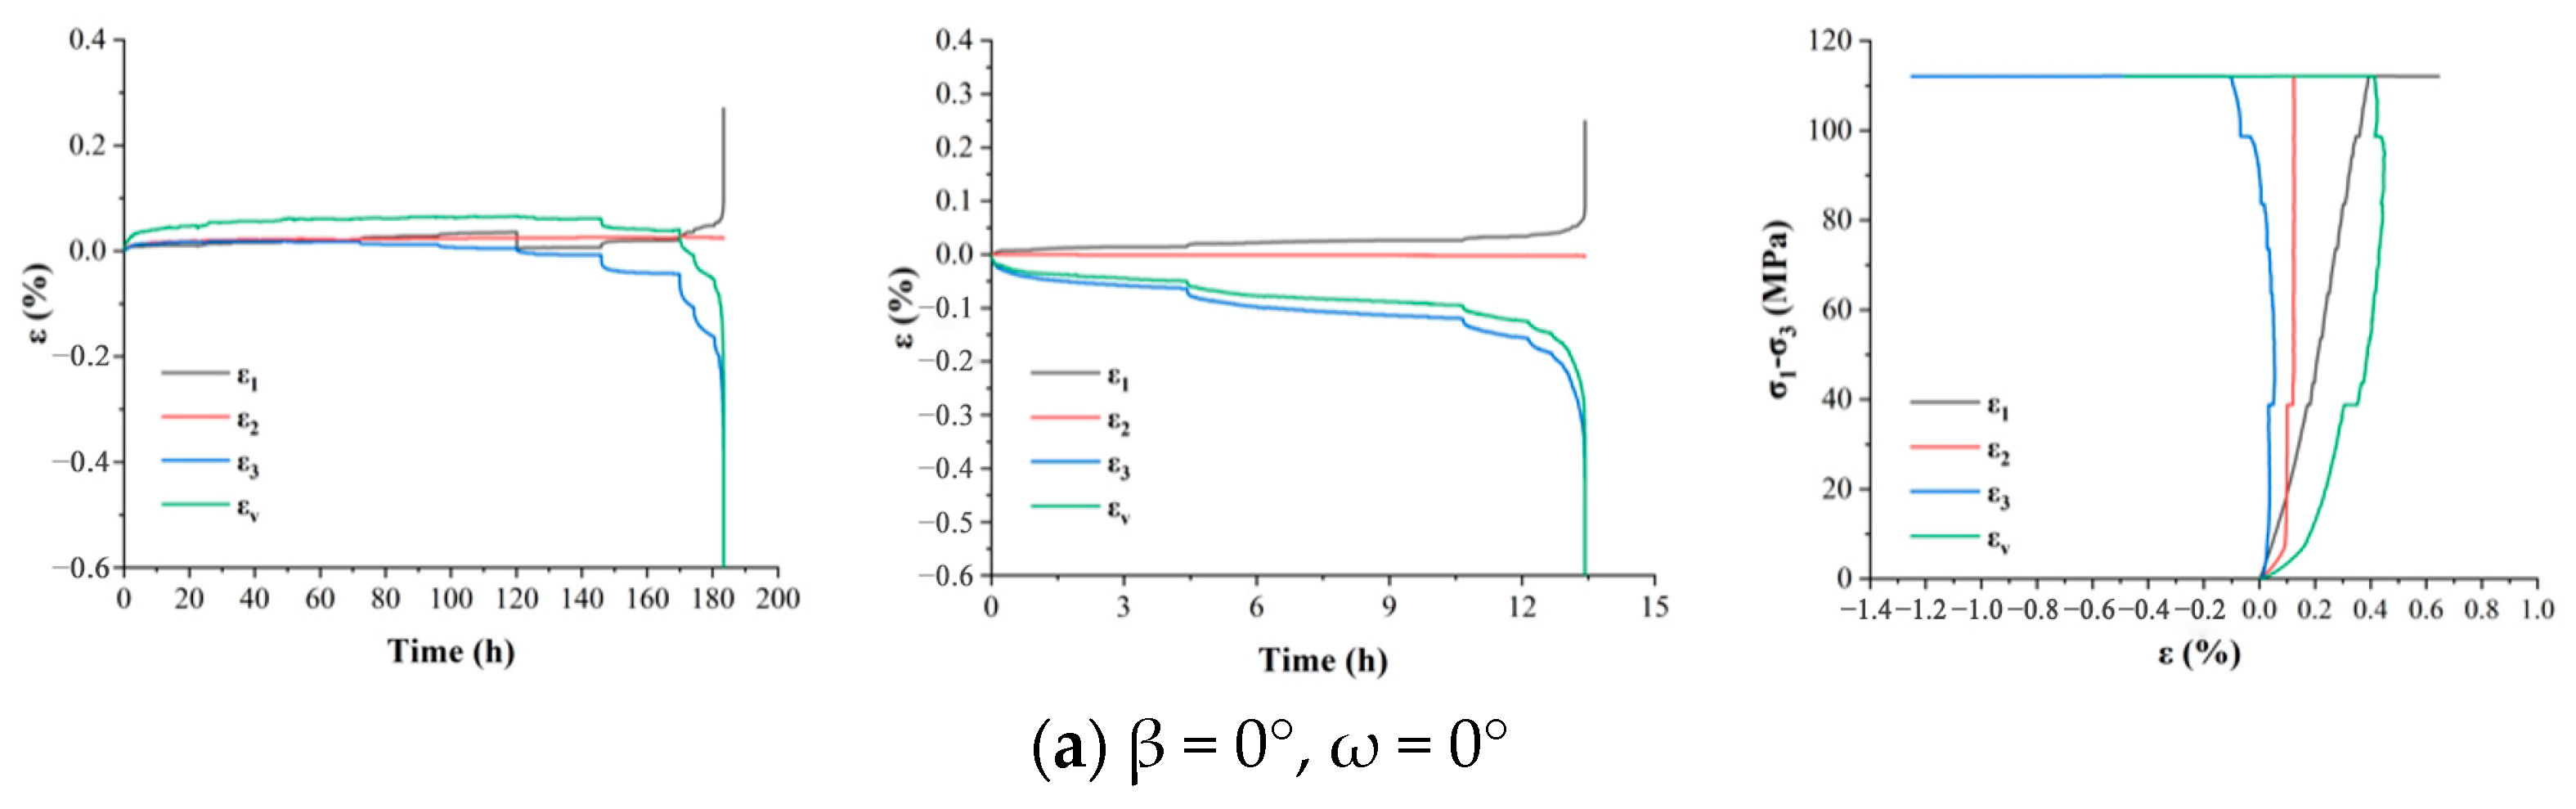
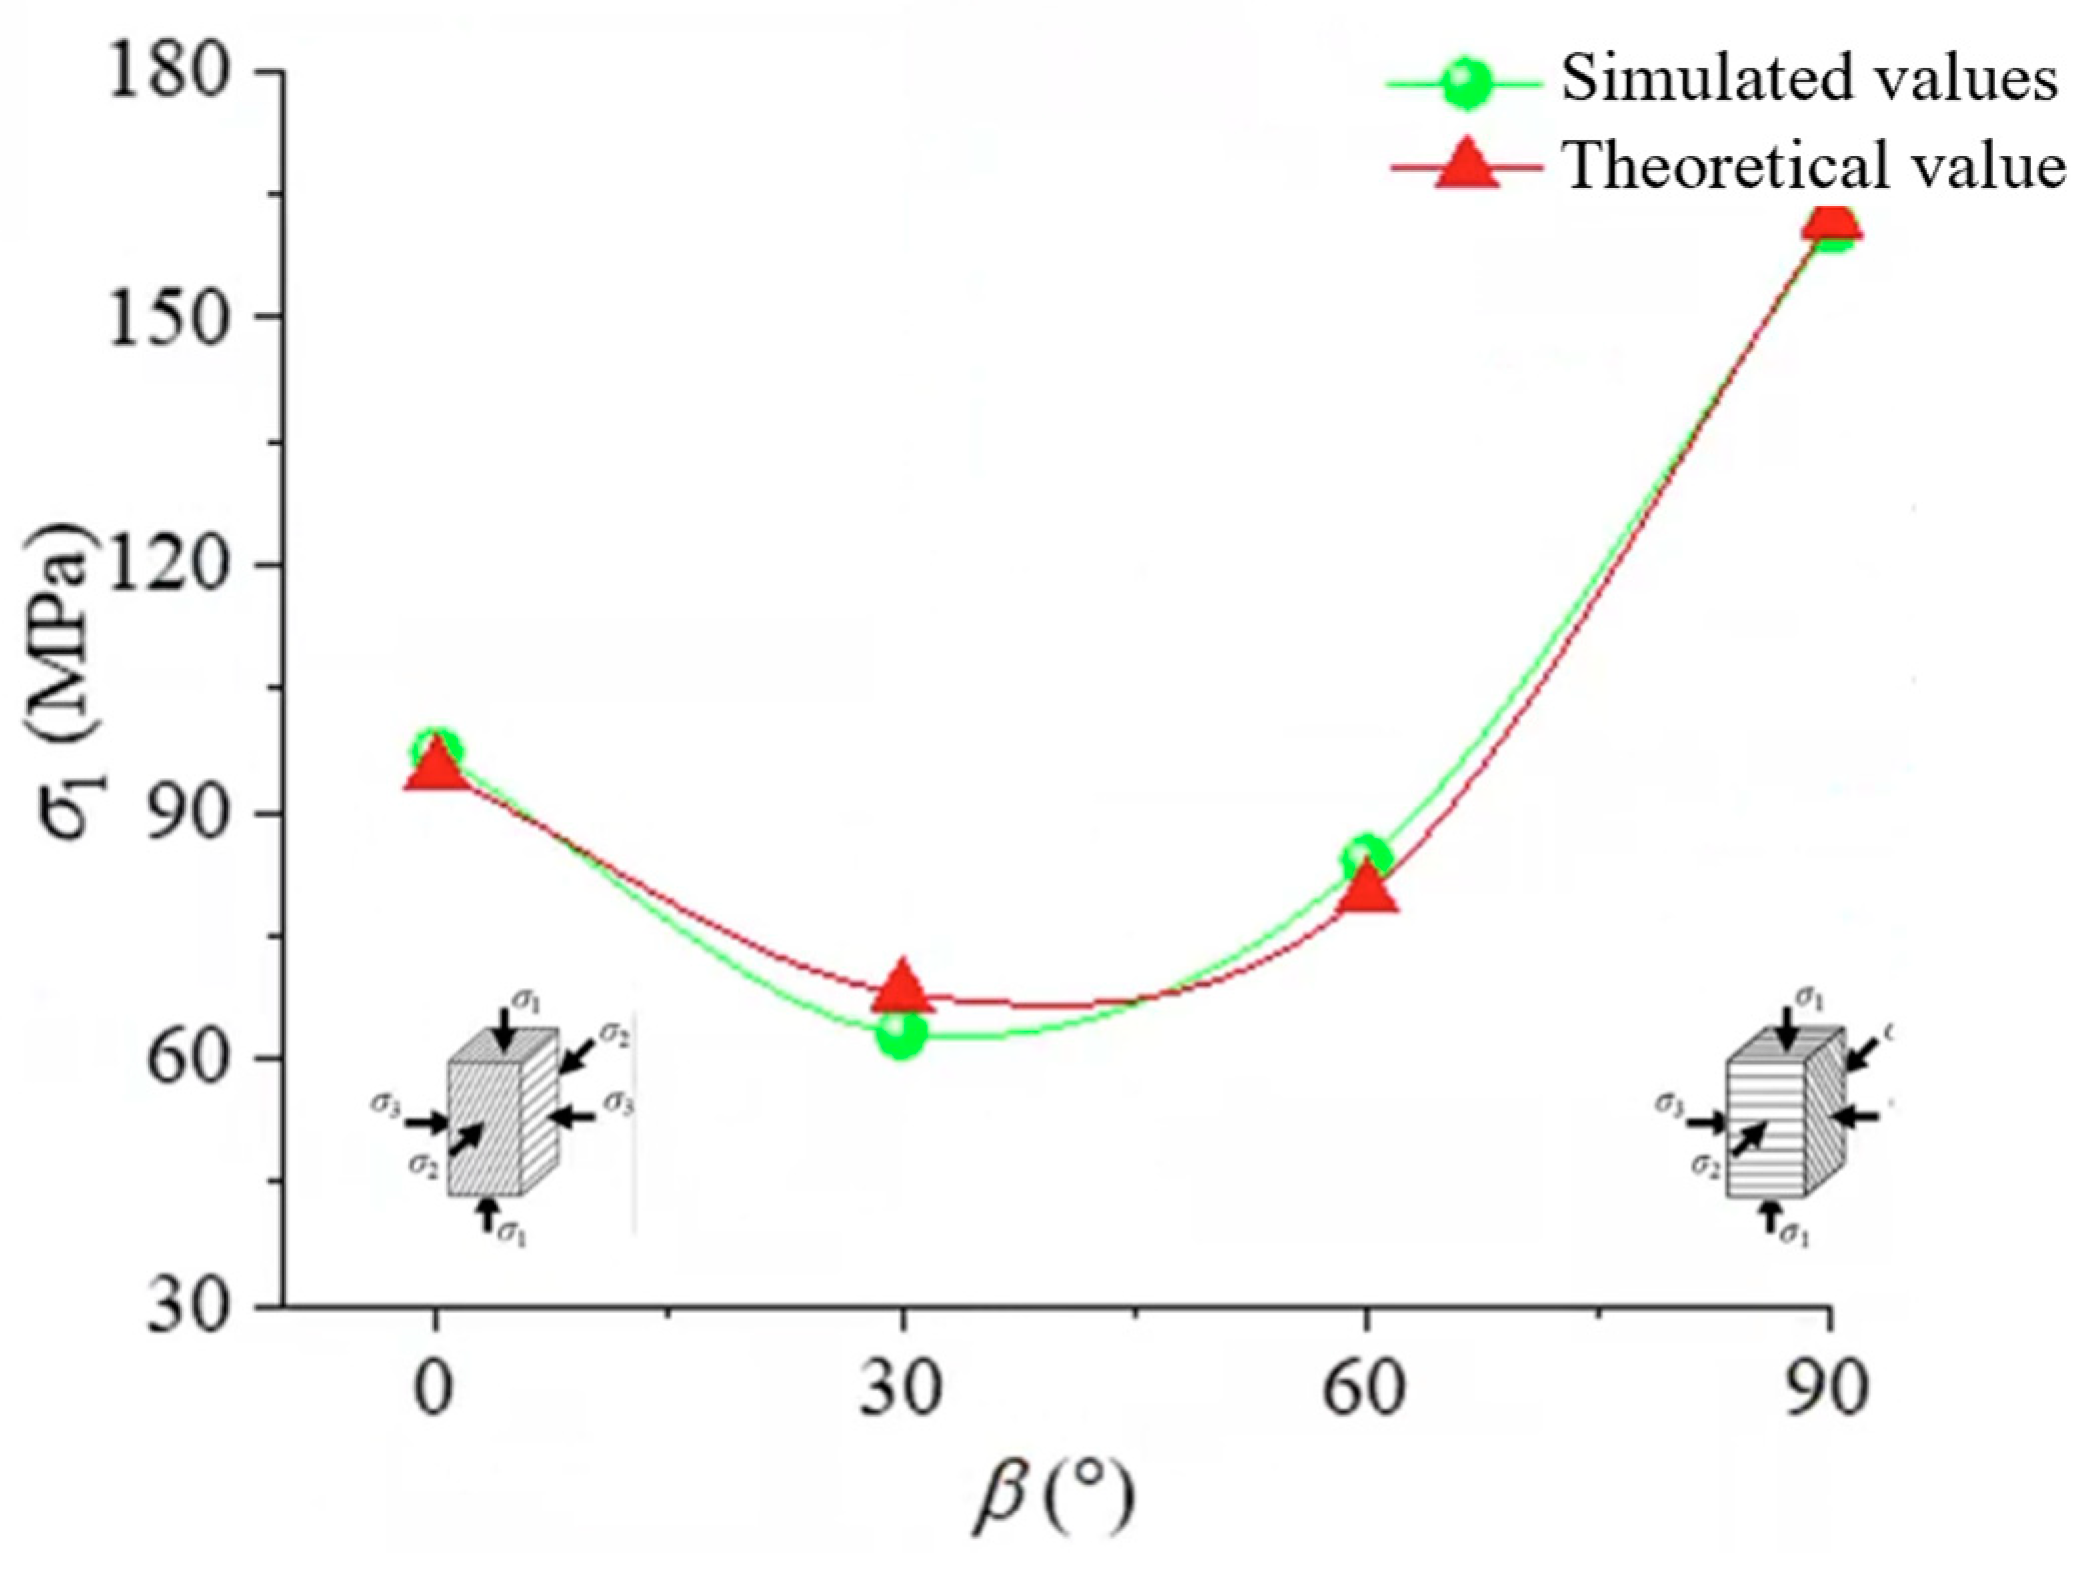
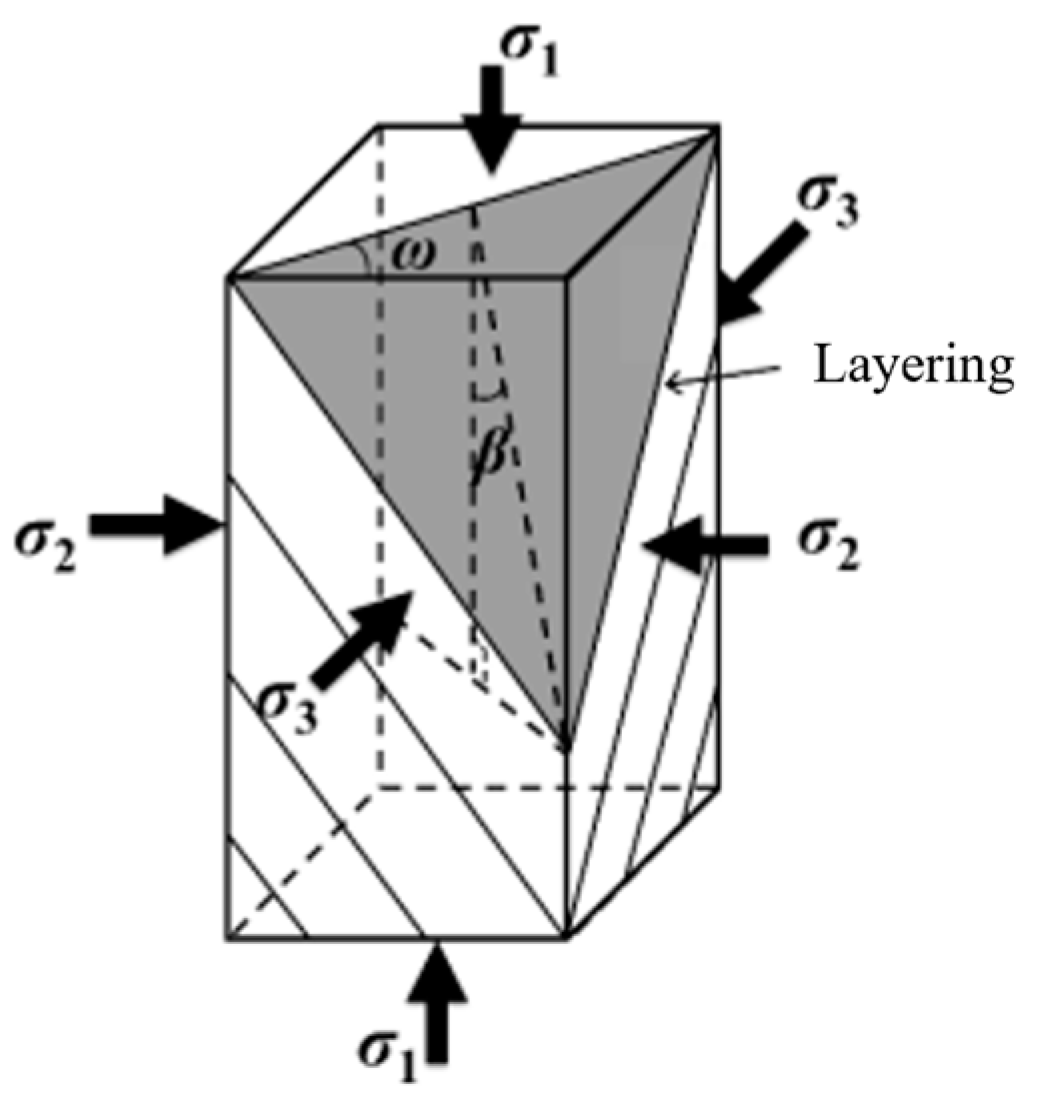
3.2. Triaxial Rock Creep Test

The strength and deformation characteristics of tunnel thin-layer slate with time under in situ stress conditions are studied, and the anisotropy of the time-dependent deformation of surrounding rock caused by different rock strata angles is explored. By using the soft rock true triaxial experimental instrument to simulate the in situ stress environment, the time-dependent creep test of tunnel surrounding rock is carried out by exploring different surrounding rock angles. The test process is shown in Figure 6.
The triaxial rock creep test of the aging mechanical properties of the deep layered surrounding rock of the tunnel was carried out by laboratory testing, and the strain characteristics of slate with three bedding angles of β = 0°, 30°, 90° and ω = 0° were obtained, as shown in Figure 7. It can be seen that the strain increment corresponding to each principal stress of the β = 30° test block is obviously larger than that of β = 0° and 90°, and the volume strain increment is also larger. In addition, the aging deformation time of the β = 30° test block is shorter than that of the β = 0° and 90° test blocks, indicating that the β = 30° test block is more prone to damage; the failure of the β = 0° test block is mainly tensile splitting failure, and the strength is about 110 MPa. The failure of the β = 30° test block is mainly shear slip failure, and the strength is about 48 MPa. The failure of the β = 90° test block is mainly splitting failure, and the strength is about 163 MPa. Therefore, it can be concluded that within a certain range, with the increase in the angle of the rock layer, the deformation of the surrounding rock will increase and the failure rate will be faster. However, when the maximum angle of β reaches 90°, the deformation and strength of the surrounding rock will increase, as shown in Figure 8, which presents the variation in the strength of the surrounding rock with the change in the angle of β when ω = 0°.
Considering the loading angle, the strength calculation formula of layered surrounding rock is:
c β ω b = c 90 1 + A [ cos 2 β min + cos 2 ( β β min ) ] n [ 1 + D · sin ω cos π ( β β max ) π 2 β max m · b m ]
sin φ b = sin φ 0 1 b + s b 2 + t ( 1 1 b + b 2 ) sin φ 0
b = σ 2 σ 3 σ 1 σ 3
where s = 0.98; t = 0.88; c90 = 44.2 MPa; φ0 = 30°; βmin = 32.8°; βmax = 32.8°; A = 1.0; n = 2.55; D = 3; and m = 0.5.
Under the most unfavorable angle condition, the layered rock mass is C = 13 MPa, φ = 29.65°.φb is the internal friction angle at different b; φ0 is b = 0, that is, the internal friction angle in the conventional triaxial compression stress state; s and t are material constants, where s reflects the strength difference of rock at b = 0 and b = 1, and t controls the influence of intermediate principal stress on the peak strength of rock. When b = 0, sinφb = sinφ0; Cβφb represents the cohesion for different orientations of β, ω, and b, with C90 specifically denoting cohesion at β = 90°. βmin refers to the angle where the strength reaches its minimum in the ‘U’ shape during conventional triaxial compression. βmax indicates the angle β where the strength is most influenced by ω during true triaxial compression, with βmax being less than 45°. Parameters A and n primarily affect the degree of anisotropy and the shape of the strength curve in conventional triaxial compression, where n is a positive integer. Parameters D and m mainly influence the impact of ω and b on strength in true triaxial compression, with 0 < m < 1. The meaning of each parameter is shown in Figure 9.

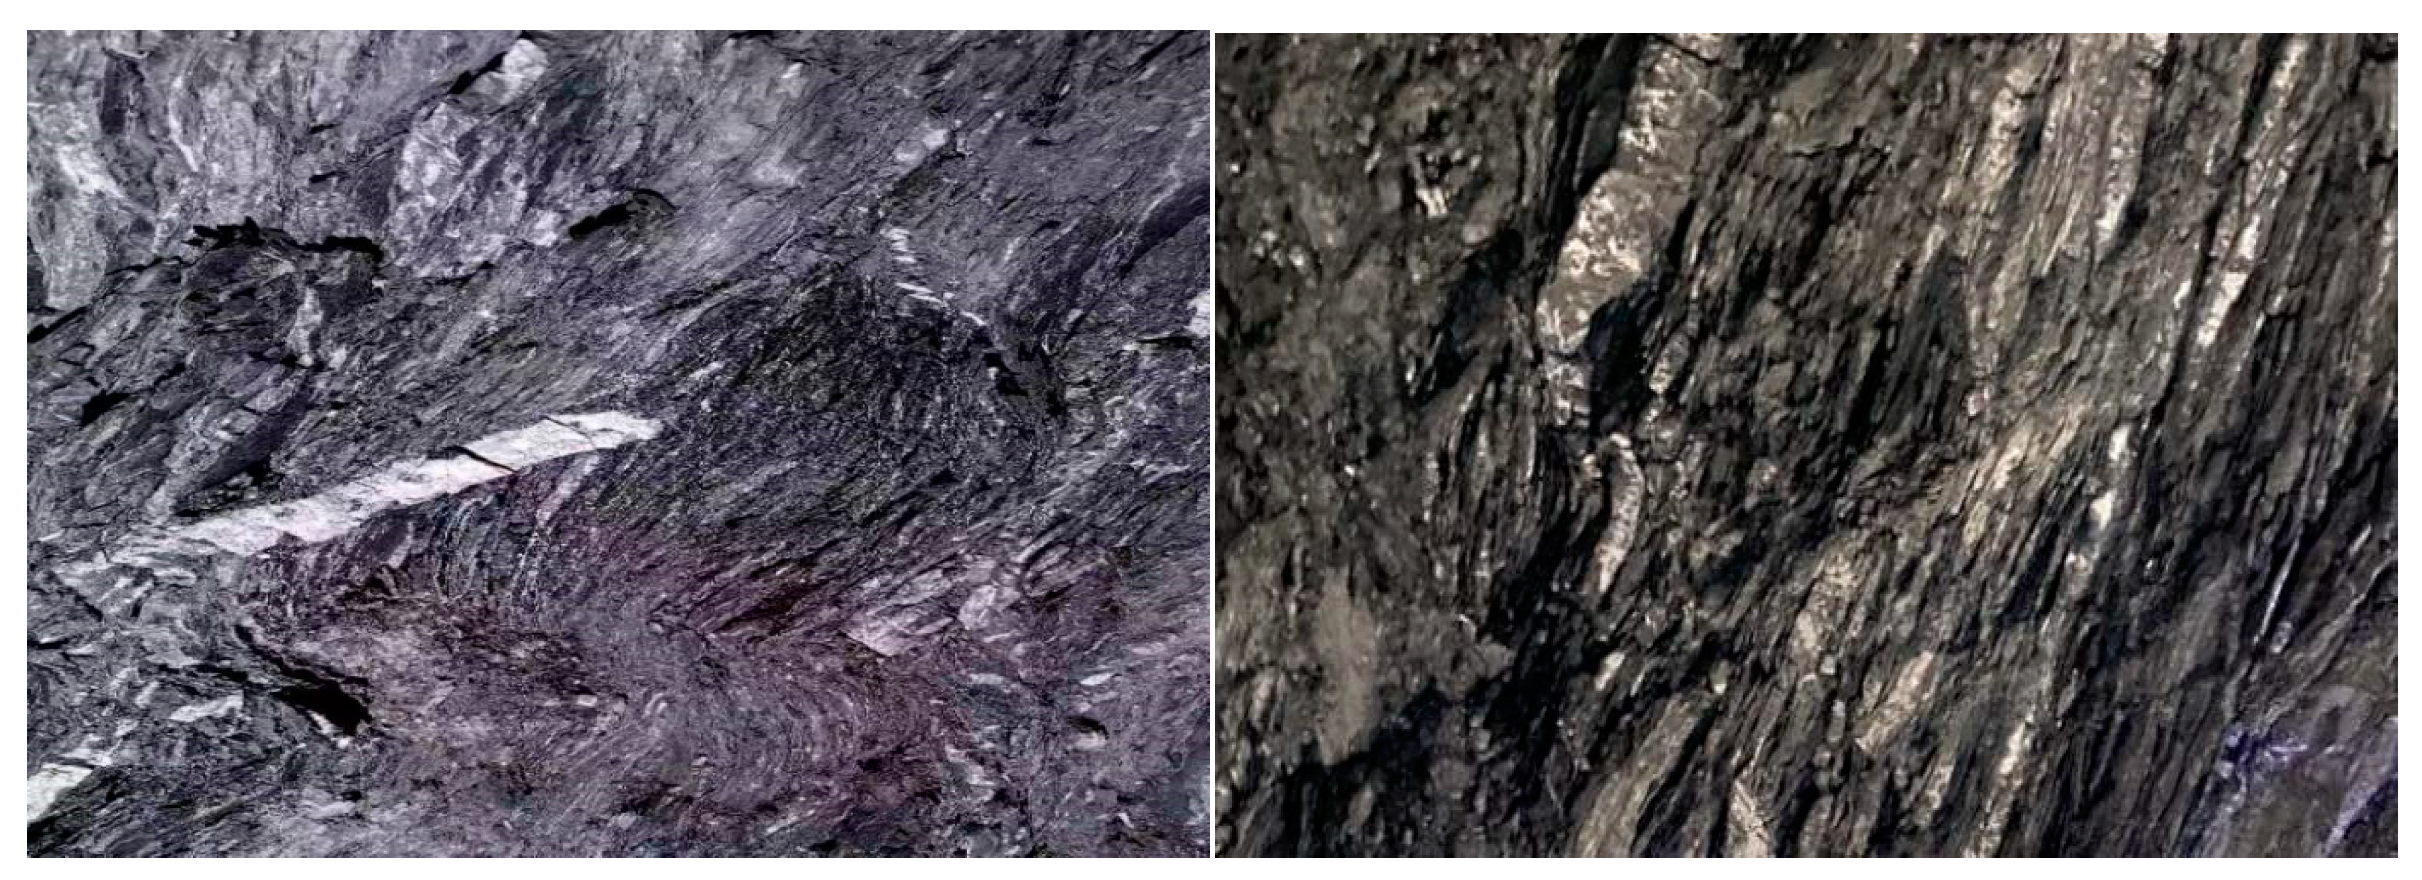
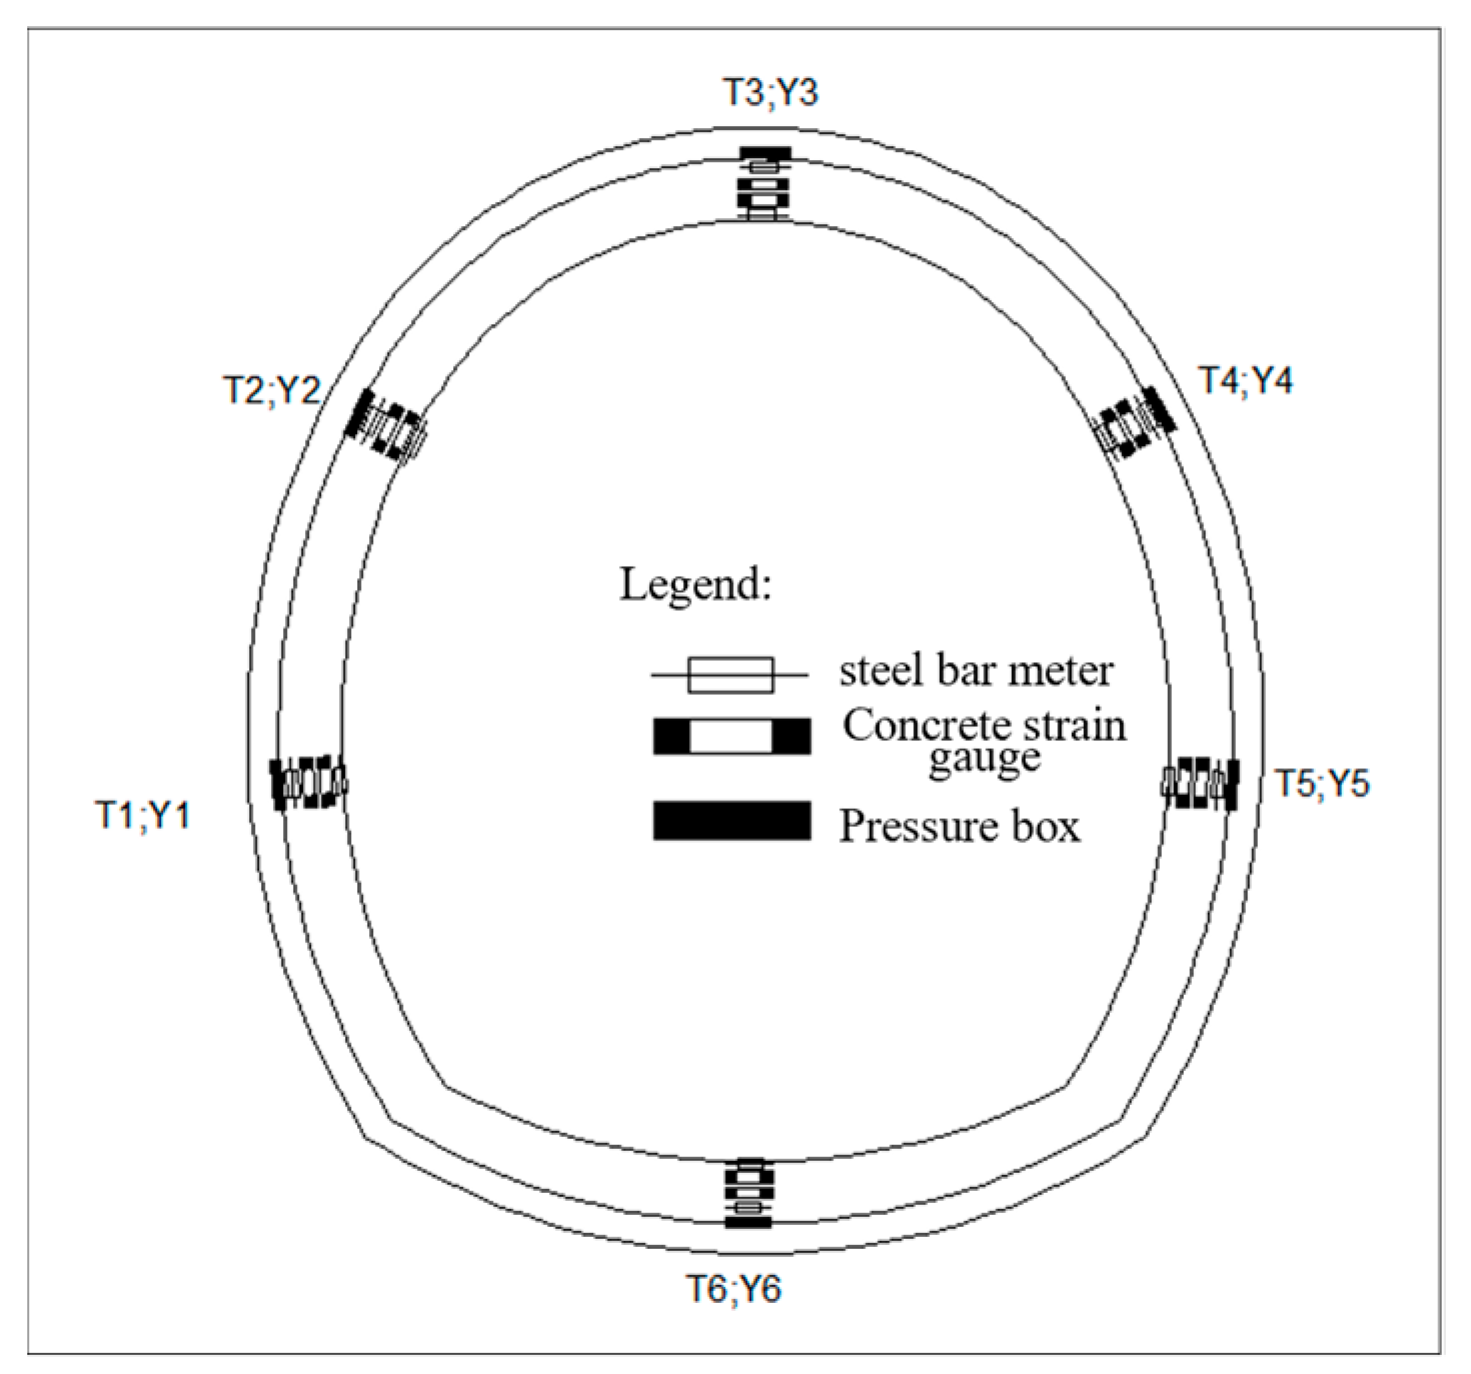
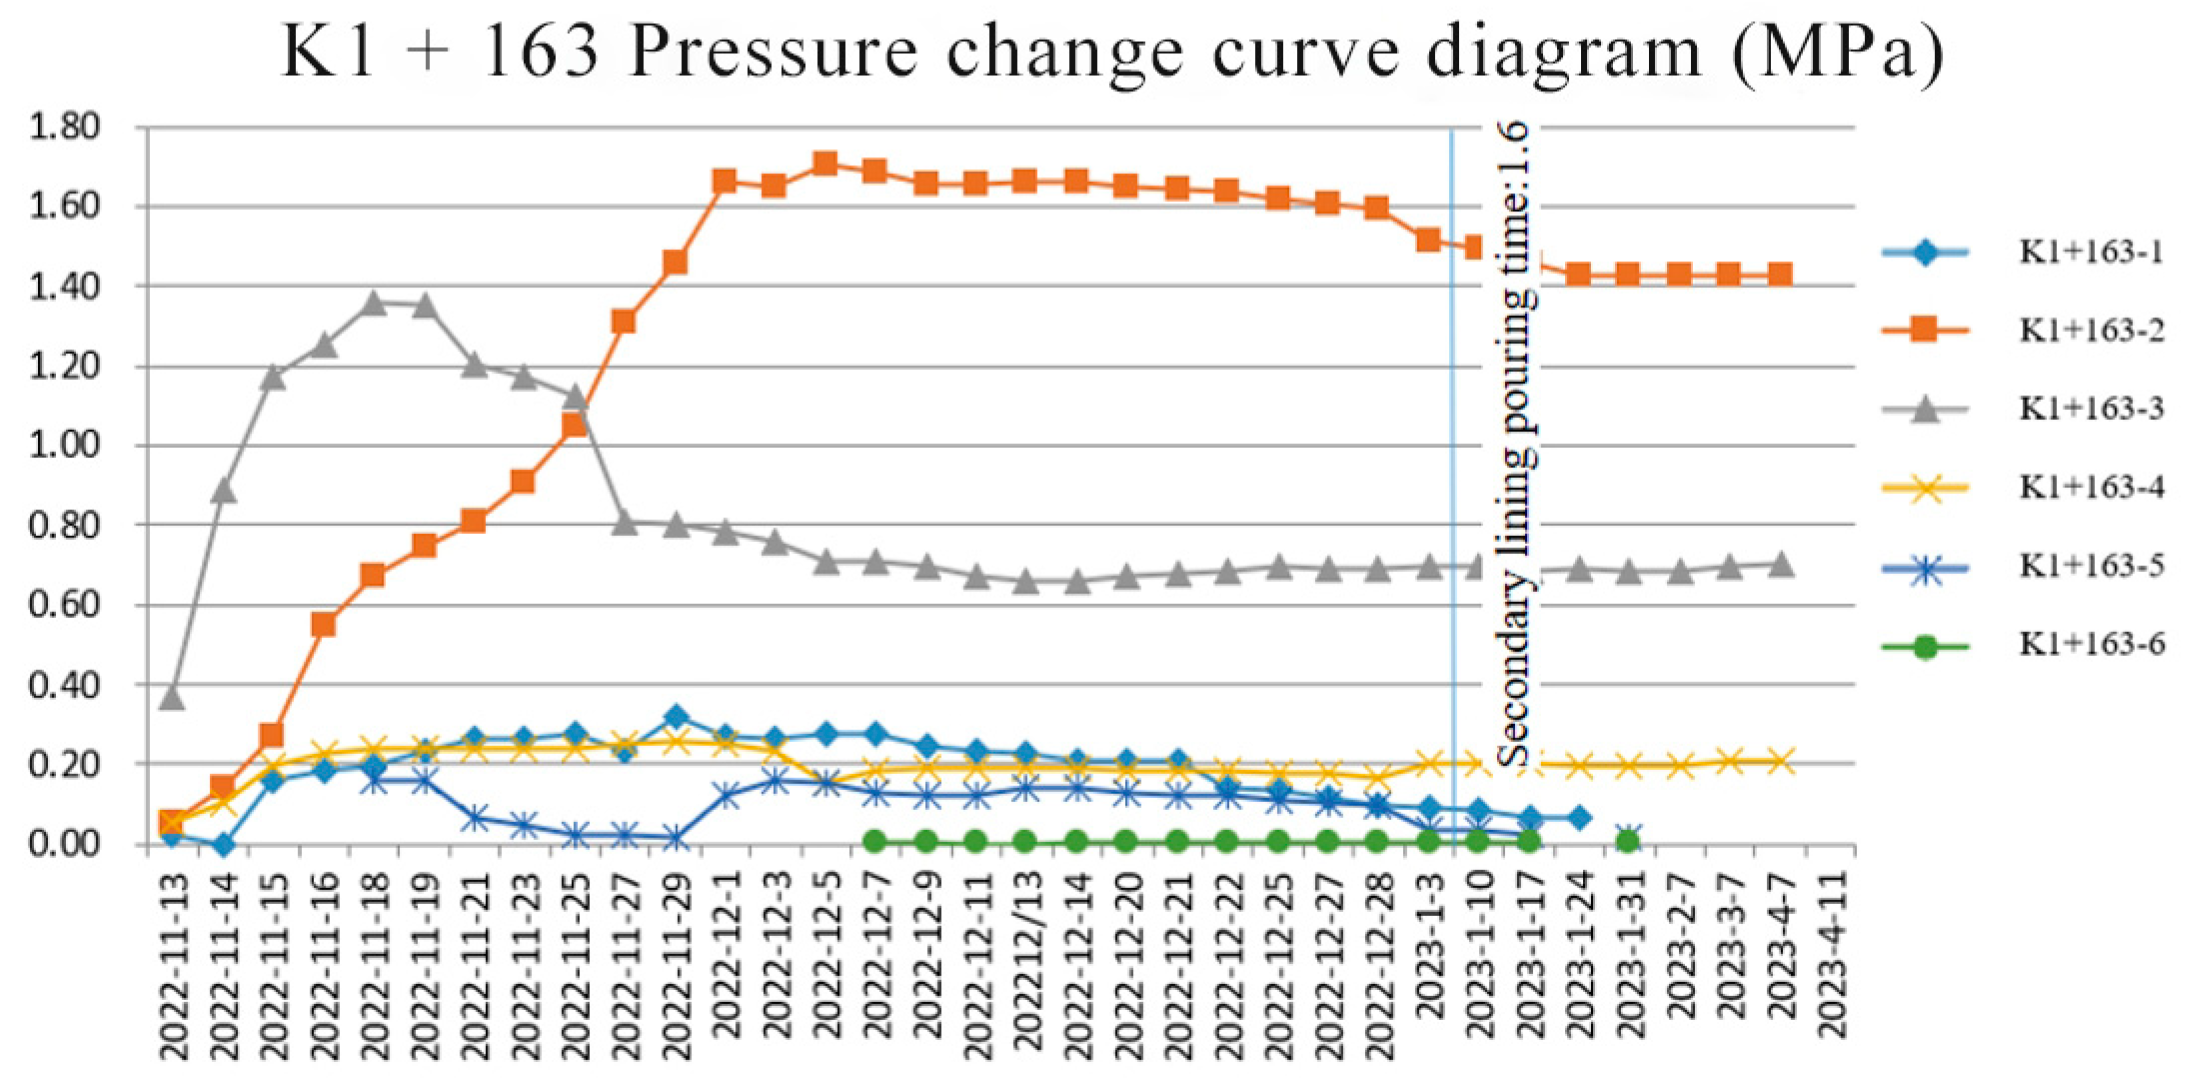
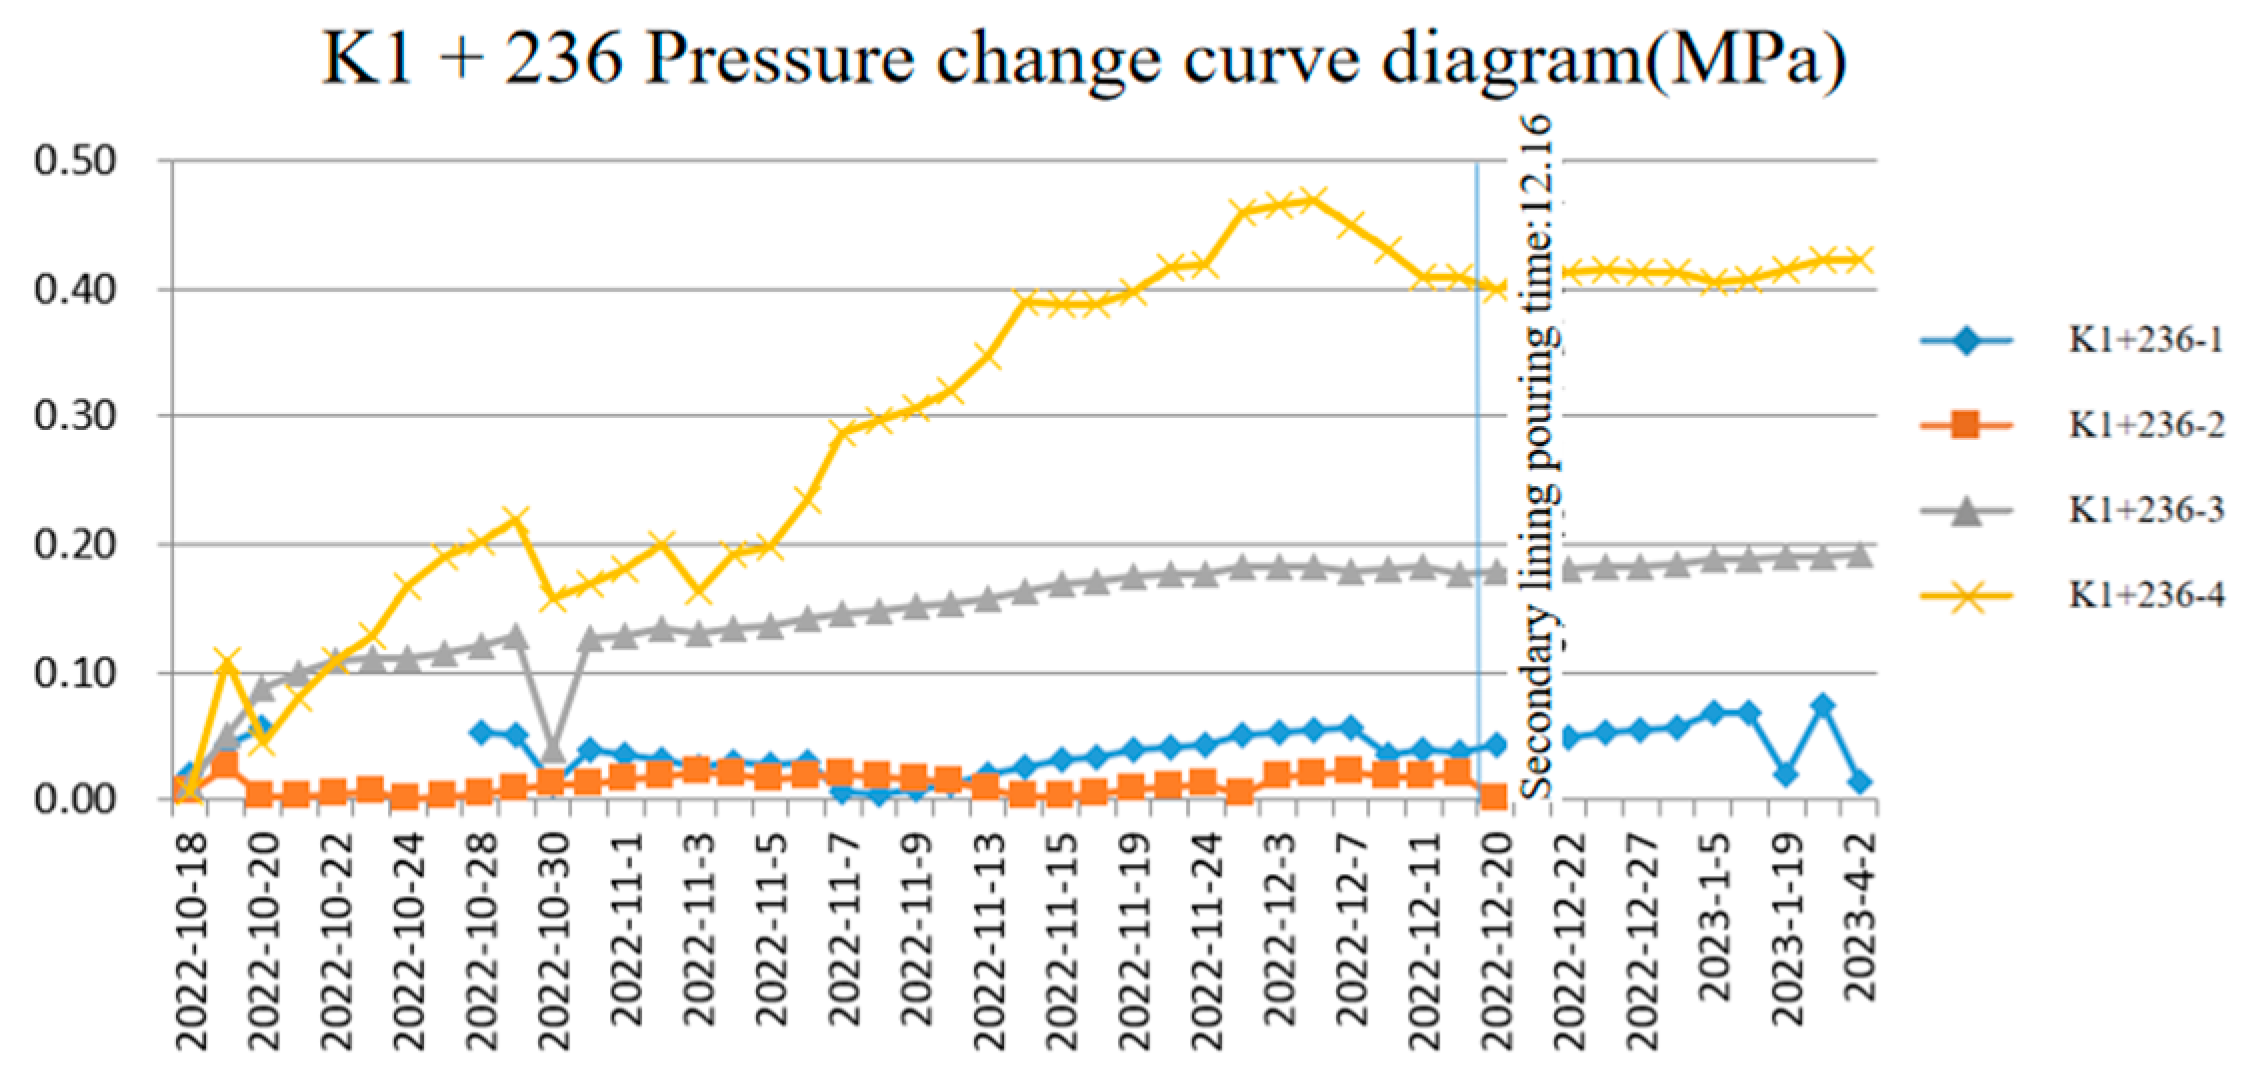
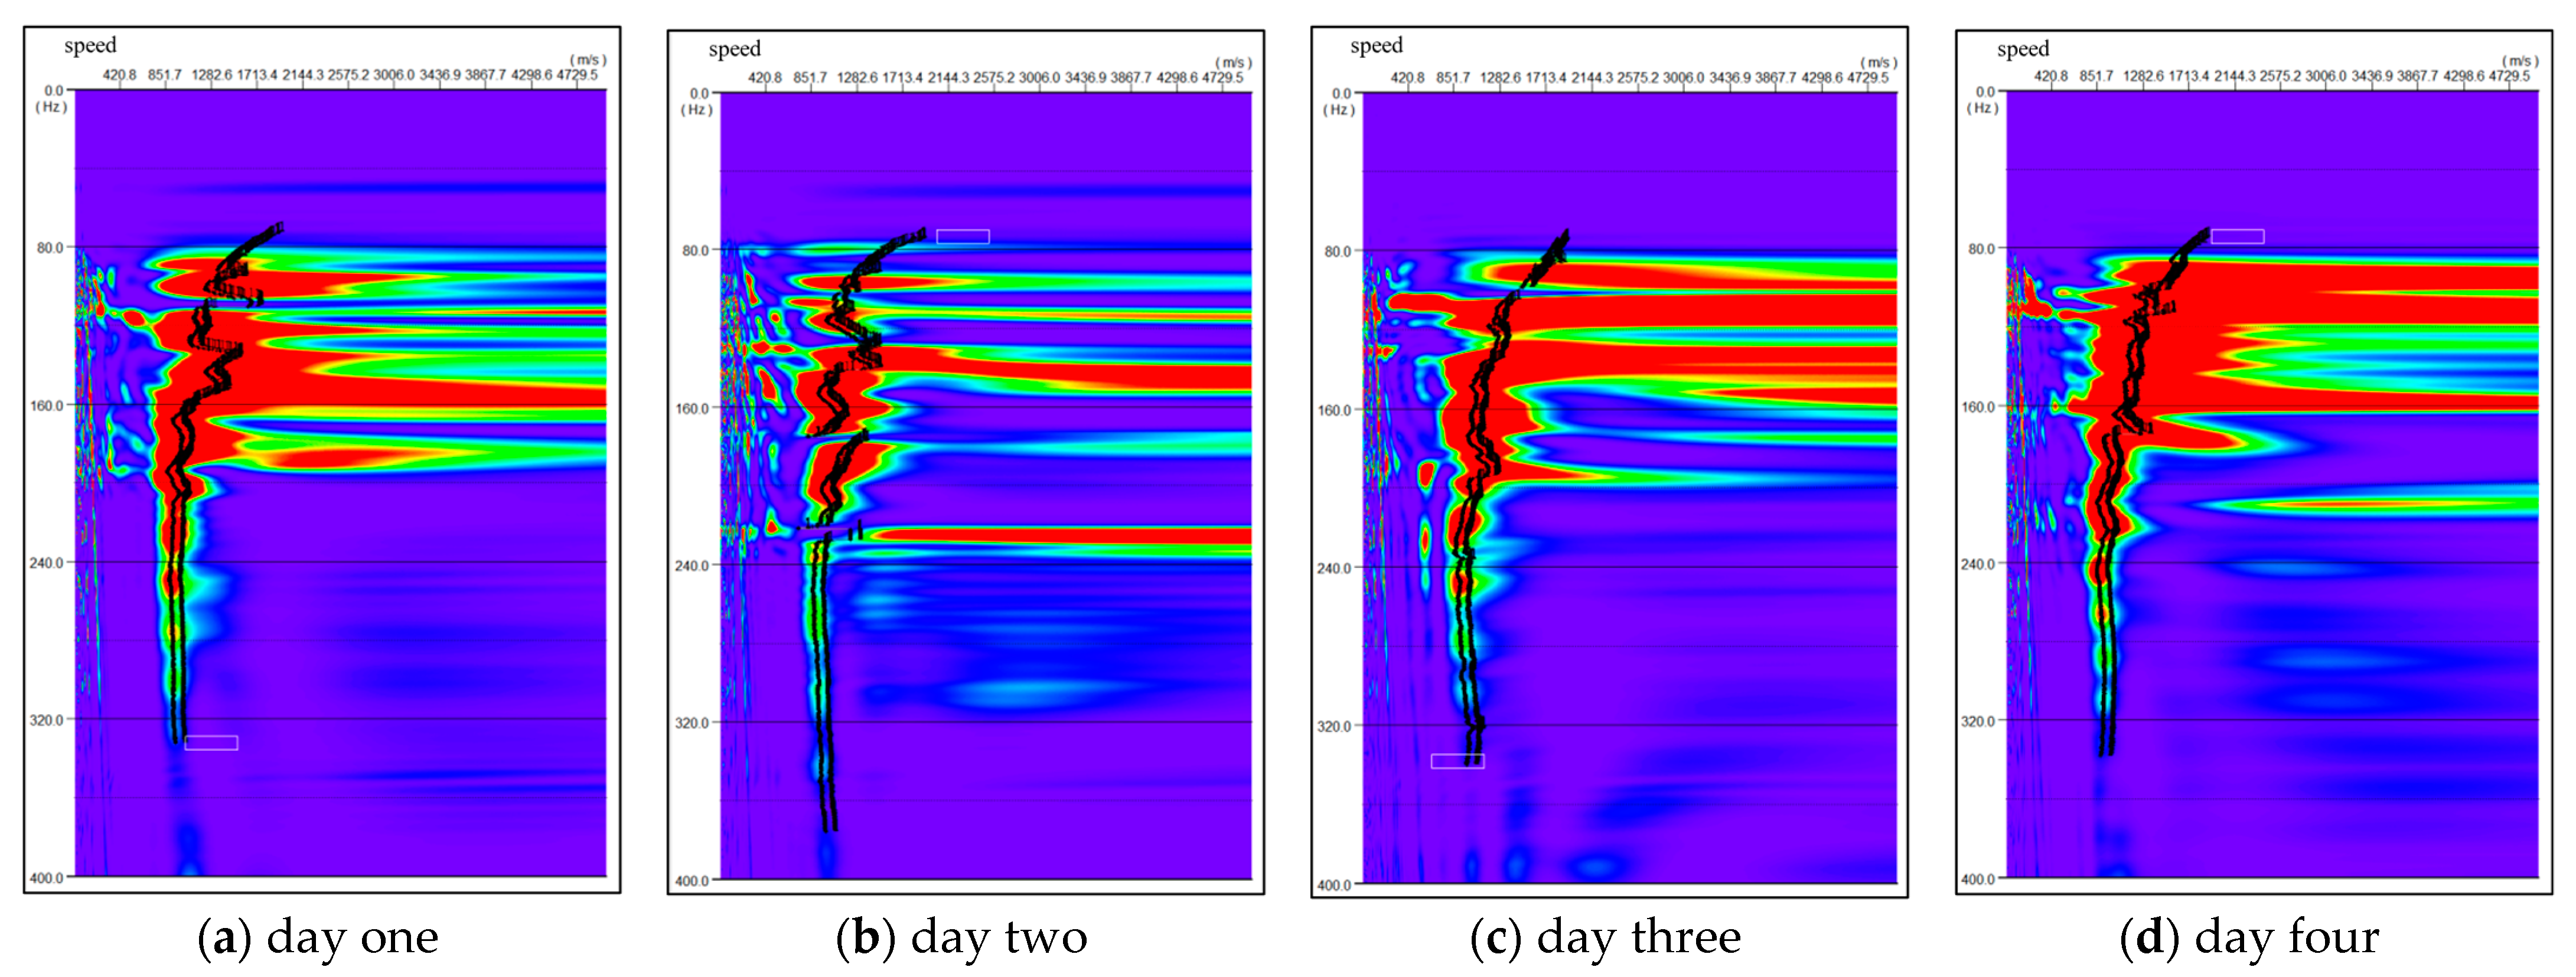
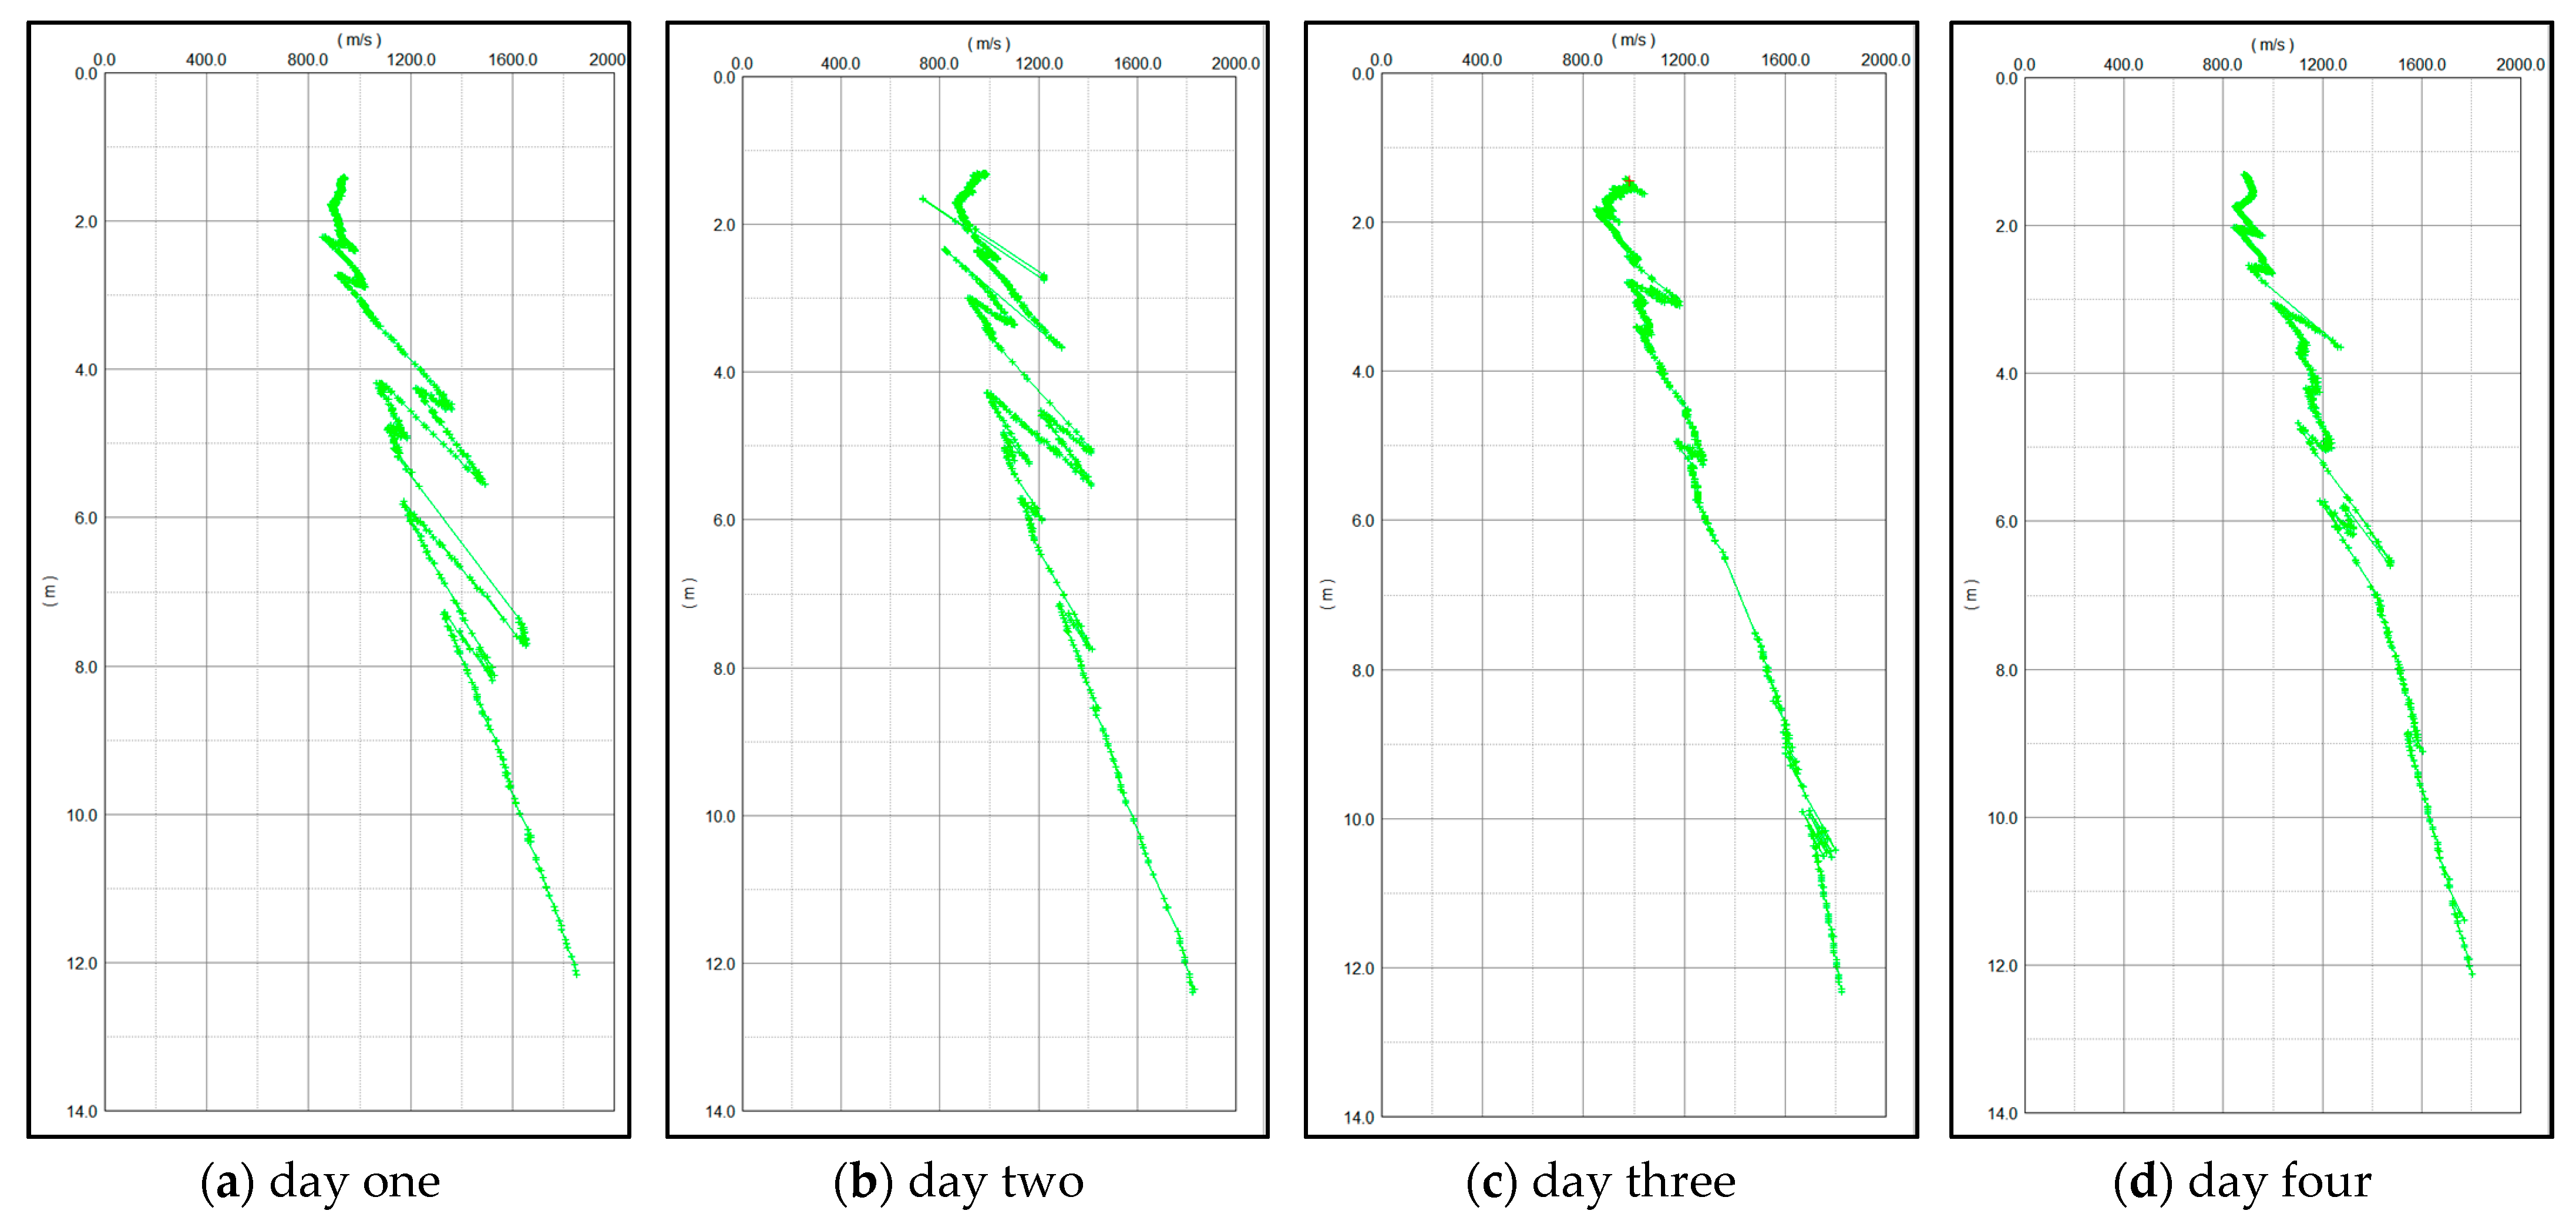
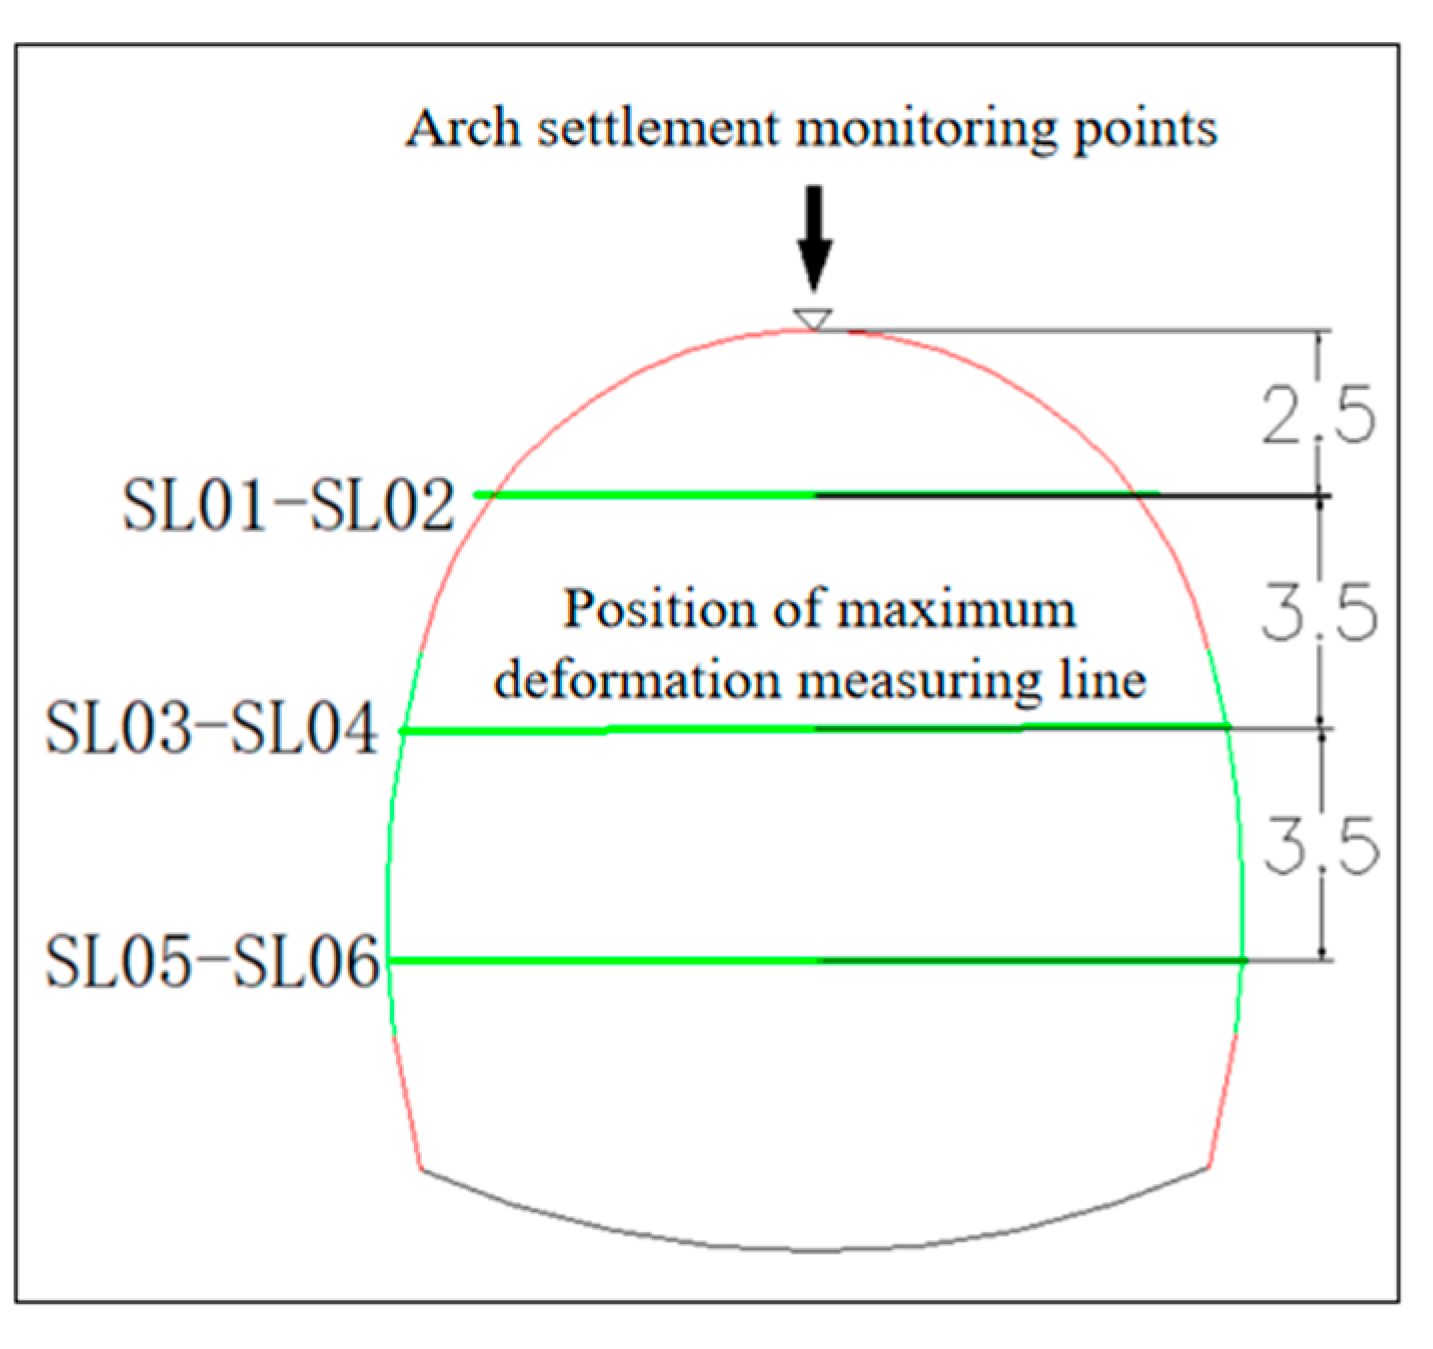
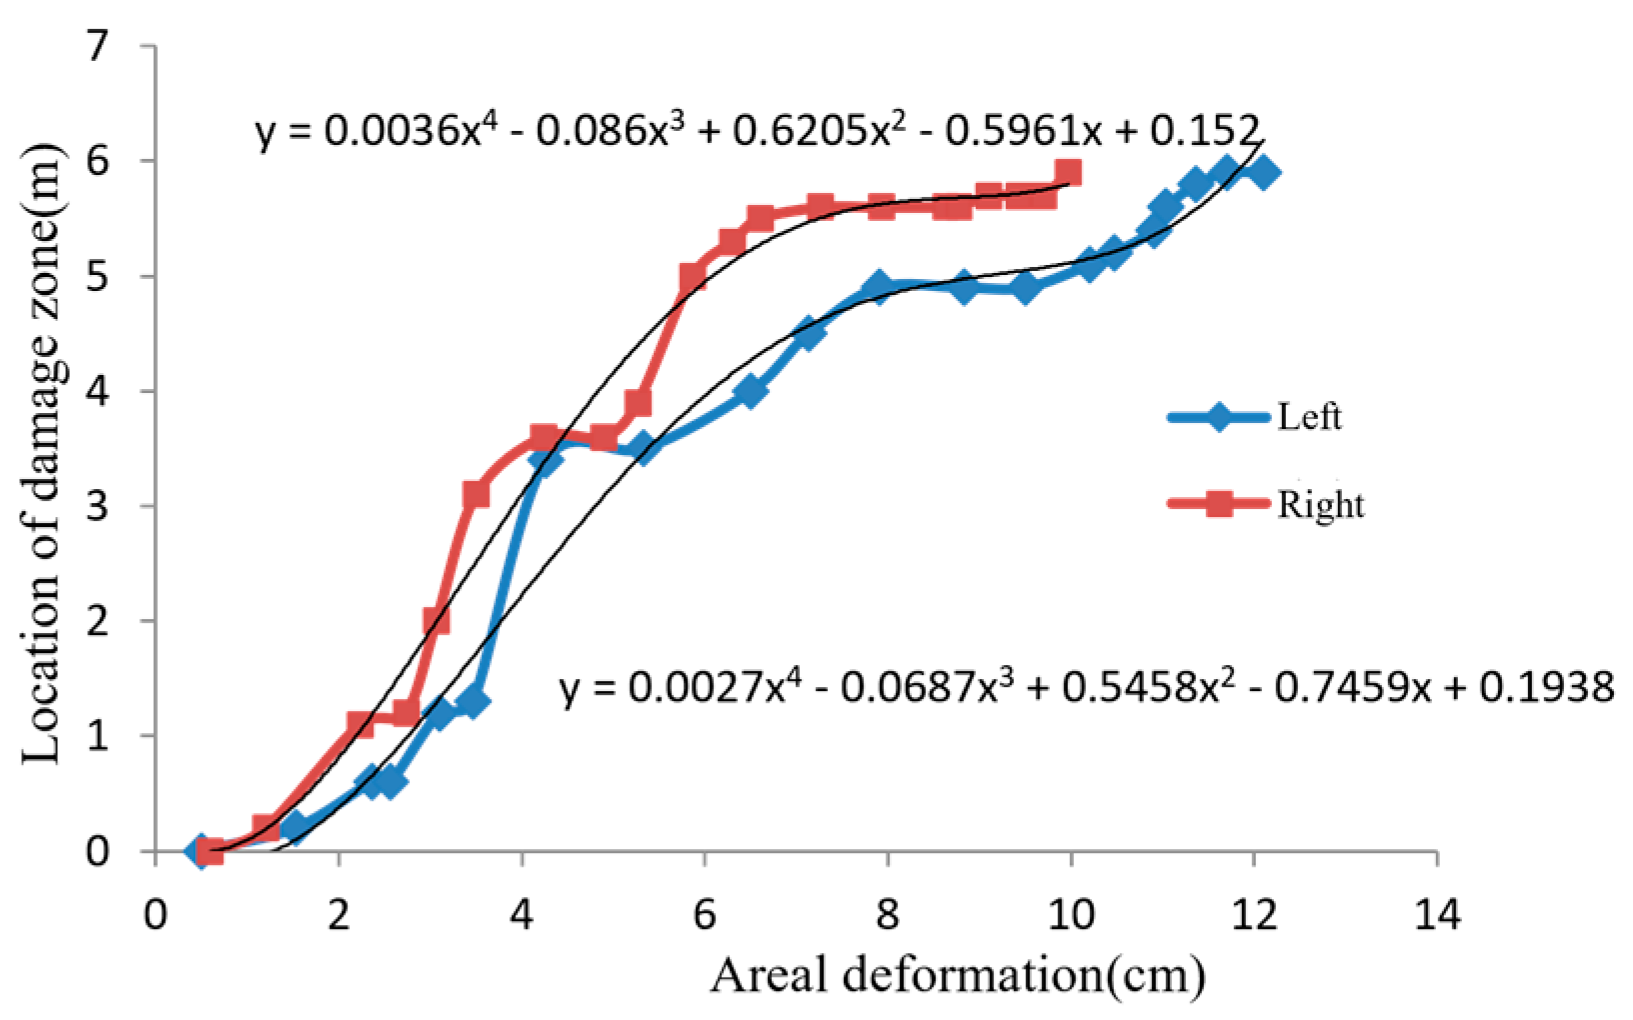
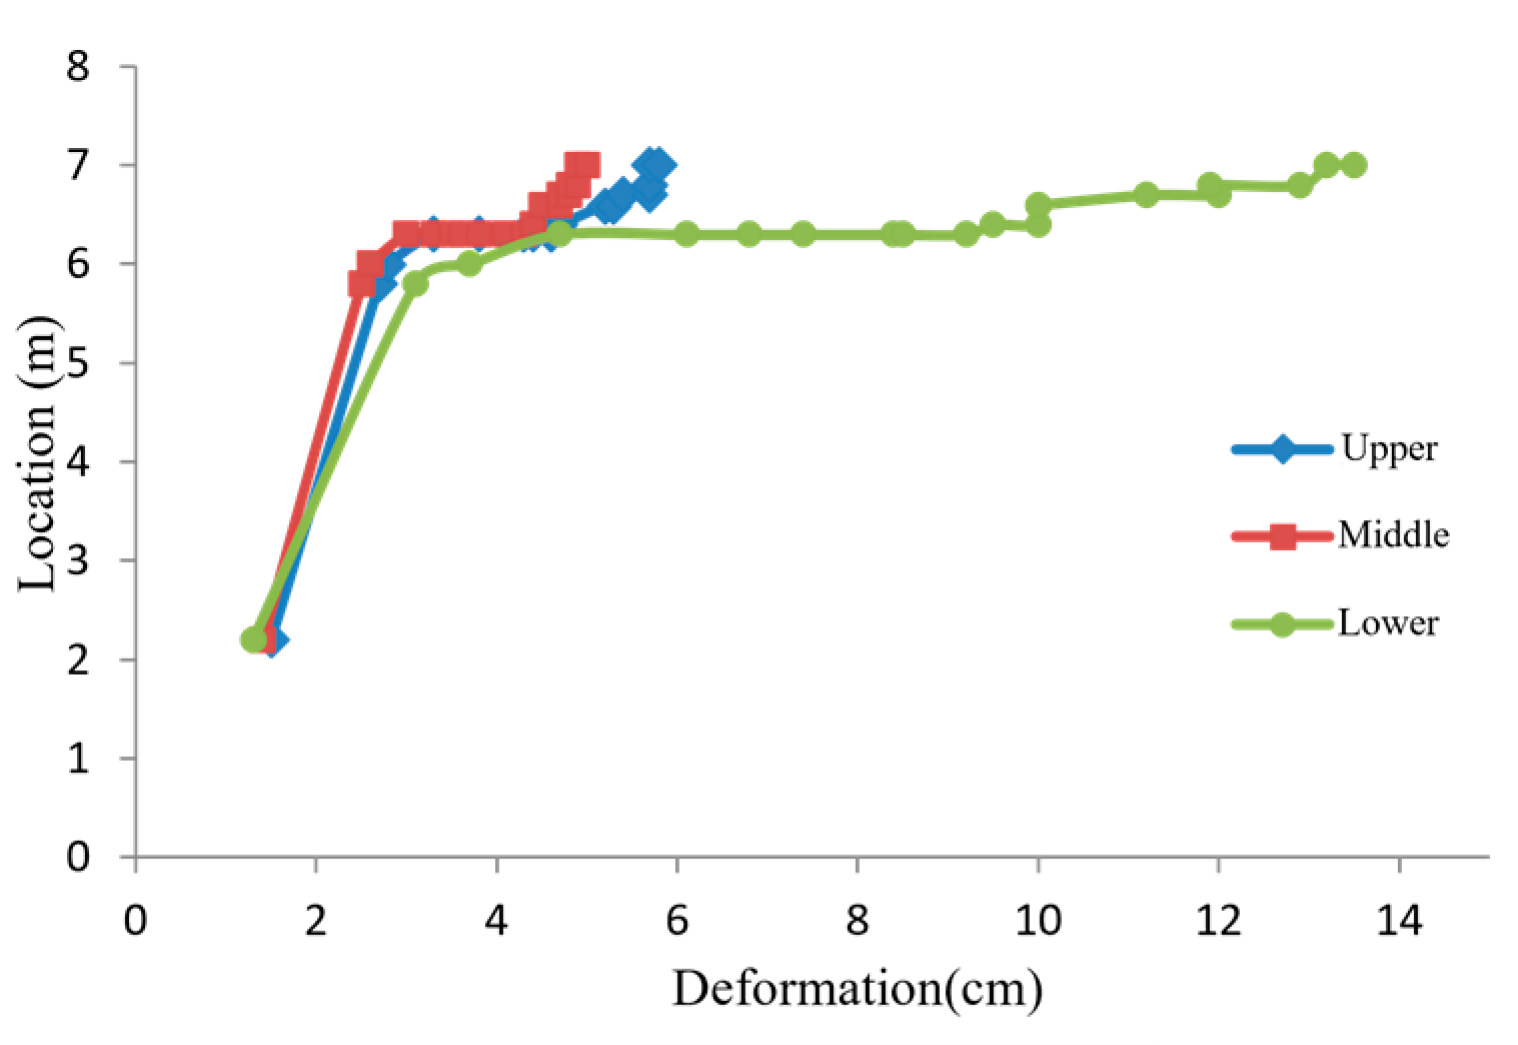
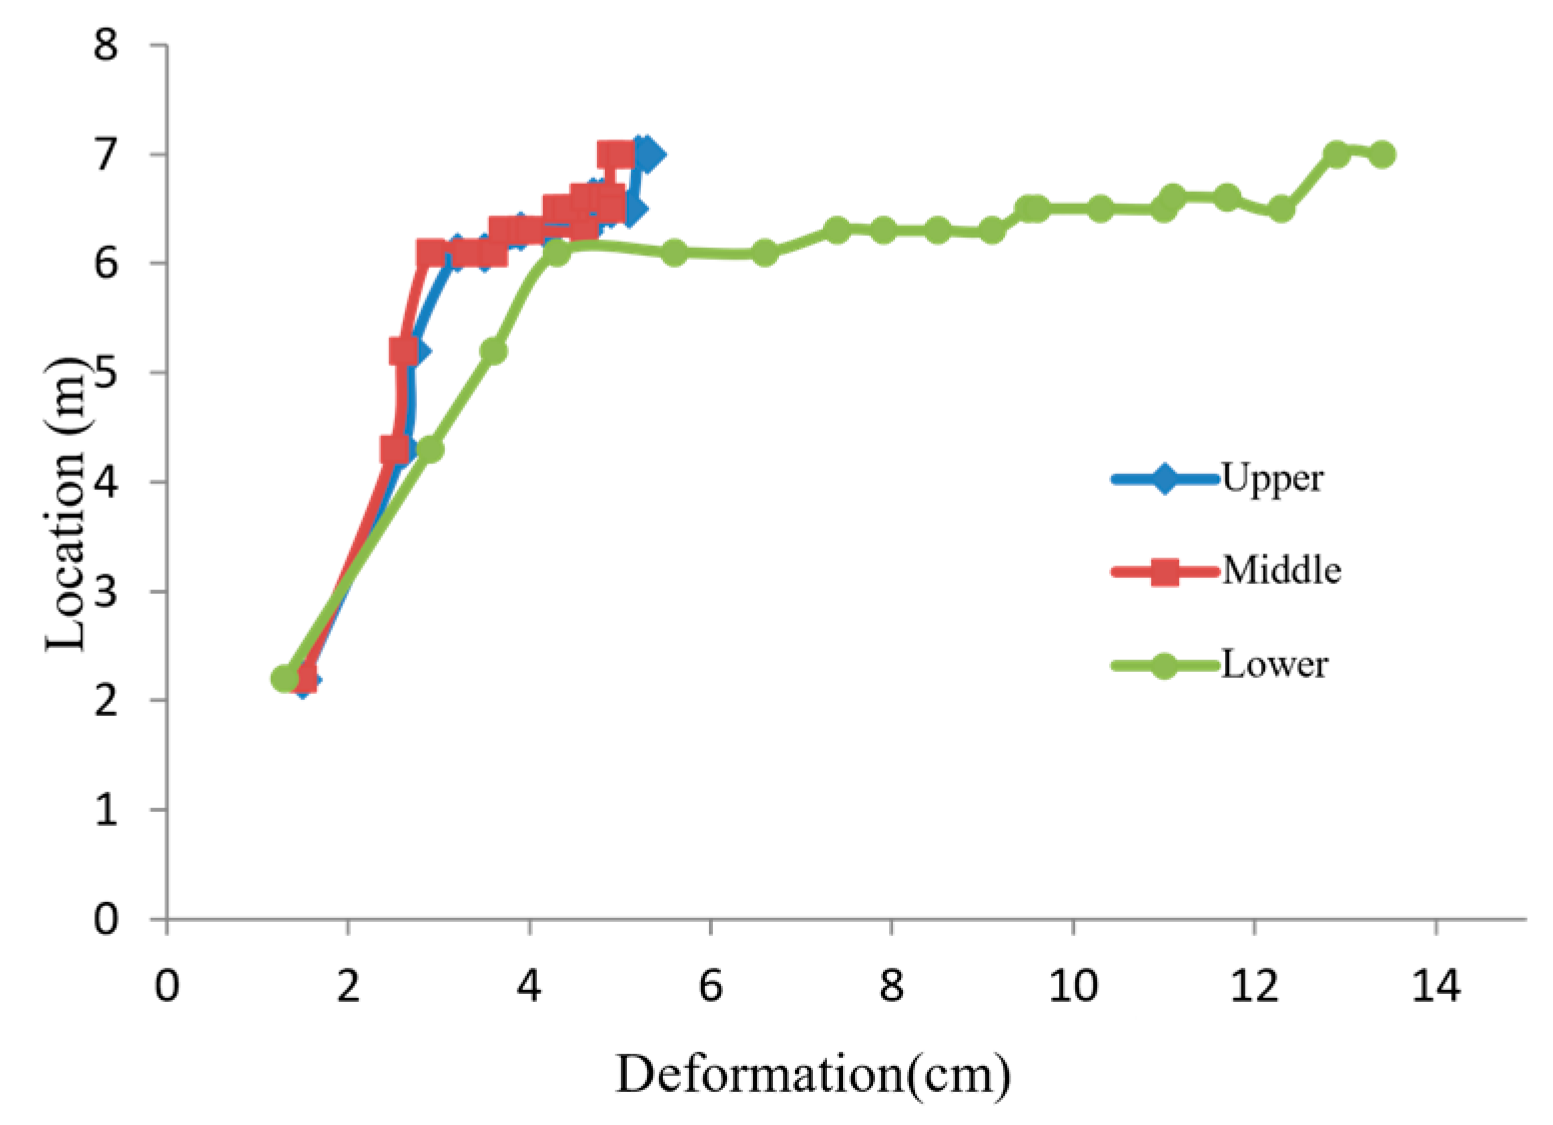
3.3. Field Test Analysis of Surrounding Rock Contact Pressure

To analyze the impact of weak surrounding rock on the tunnel support’s load-bearing capacity, a field test was conducted to measure the contact pressure. Six force sensors were installed between the surrounding rock and the initial support surface, with their specific locations illustrated in Figure 10.
Six pressure sensors are buried between the surrounding rock and the initial support surface in the K1 + 163 section of the tunnel. After construction, six of them can collect data normally. From the contact pressure deformation curve of the tunnel (Figure 11), it can be seen that the maximum contact pressure between the surrounding rock and the initial support surface is 1.7 MPa, which is located at the right arch waist of the tunnel, which is basically consistent with the field deformation. The maximum contact pressure of the left haunch is between 0.02 MPa and 0.26 MPa. According to the monitoring measurement data, the maximum deformation part is the position of the SL01–SL02 measuring line, which is basically consistent with the maximum stress part. It can be seen that the deformation is relatively large in the part with large stress.
Six pressure sensors are buried between the surrounding rock and the initial support surface in the K1 + 236 section of the tunnel. After construction, four of them can collect data normally. From the contact pressure deformation curve of the tunnel (Figure 12), it can be seen that the maximum contact pressure between the surrounding rock and the initial support surface is 0.46 MPa, which is located at the left arch waist of the tunnel, which is basically consistent with the field deformation. The maximum contact pressure at the vault is 0.19 MPa, and the contact pressure on the right side wall is small, ranging from 0.01 MPa to 0.08 MPa. According to the monitoring measurement data, the maximum deformation part is the position of the SL01–SL02 measuring line, which is basically consistent with the maximum stress part. It can be seen that the deformation is relatively large in the part with large stress.

3.4. Loose Ring Test

The elastic wave velocity test of the side wall was carried out with the typical carbonaceous slate K1 + 200 section. The K1 + 200 section is close to the tunnel entrance, and the deformation of the surrounding rock is basically stable. The range of the loose circle after the deformation of the surrounding rock is stable is analyzed by the elastic wave velocity test. Twelve detectors are set up, where the interval between each detector is 1 m, and the tapping point is 6 m away from the first detector. The test results are as follows.
From the elastic wave spectrum diagram (Figure 13), it can be seen that the energy accumulation area of the surrounding rock is relatively concentrated, indicating that the deformation of the surrounding rock has been basically stable. From the elastic wave dispersion curve (Figure 14), it can be found that the effective detection depth of the elastic wave is also 12 m, and no effective signal is found within 1 m due to the loss of high frequency signal. After the surrounding rock is stable, the range of wave velocity changes is concentrated between 1~8 m, and the position of the wave velocity increases and then decreases, indicating that the final range of surrounding rock loose circle is stable at about 8 m.

4. Analysis of Progressive Failure Process of Surrounding Rock and Tunnel Structure

Due to challenges in measuring the deep displacement and failure zones of surrounding rock over large on-site ranges, numerical calculation methods are employed to study how surrounding rock deformation and failure propagate under various in situ stress conditions. This approach establishes the relationship between the surface deformation of tunnel surrounding rock and the extent of deep failure zones. Surface displacement serves to identify the failure zone’s location, offering insights for assessing significant deformation levels and devising appropriate countermeasures.
Given the engineering context outlined in Section 2, where significant groundwater presence is noted at the tunnel site, this study employs a self-developed finite element method (FEM) integrated with the volume of fluid (VOF) technique for numerical simulations of steeply inclined surrounding rock formations. The VOF method is particularly effective in simulating complex fluid dynamics in regions with extensive groundwater development. It excels in modeling free surface behavior and the interaction between groundwater and excavation activities, making it an optimal choice for addressing fluid boundary conditions such as inflow, outflow, and surface tension effects. The VOF method’s capability of accurately tracking fluid free surfaces is crucial for analyzing tunnel stability and construction dynamics. It adeptly manages variations in fluid volumes and interfaces, providing precise descriptions of groundwater flow and its effects on tunnel stability. Additionally, it simulates transient phenomena, such as abrupt changes in groundwater levels, enhancing its utility in assessing construction dynamics.
Our proprietary software enhances computational efficiency by focusing on fluid volume fractions rather than individual particle tracking, making it particularly suited for simulating large-scale deformations and construction processes involving significant groundwater interactions. The finite element method divides the domain into discrete elements and uses interpolation functions to approximate partial differential equations (PDEs). In fluid–structure interactions (FSI), FEM typically models solid structures, while VOF handles fluid phases. Both methods use iterative solvers to address large systems of equations arising from discretization. Consequently, we aim to seamlessly integrate these methods and develop specialized non-commercial software to address practical engineering challenges presented in this study.

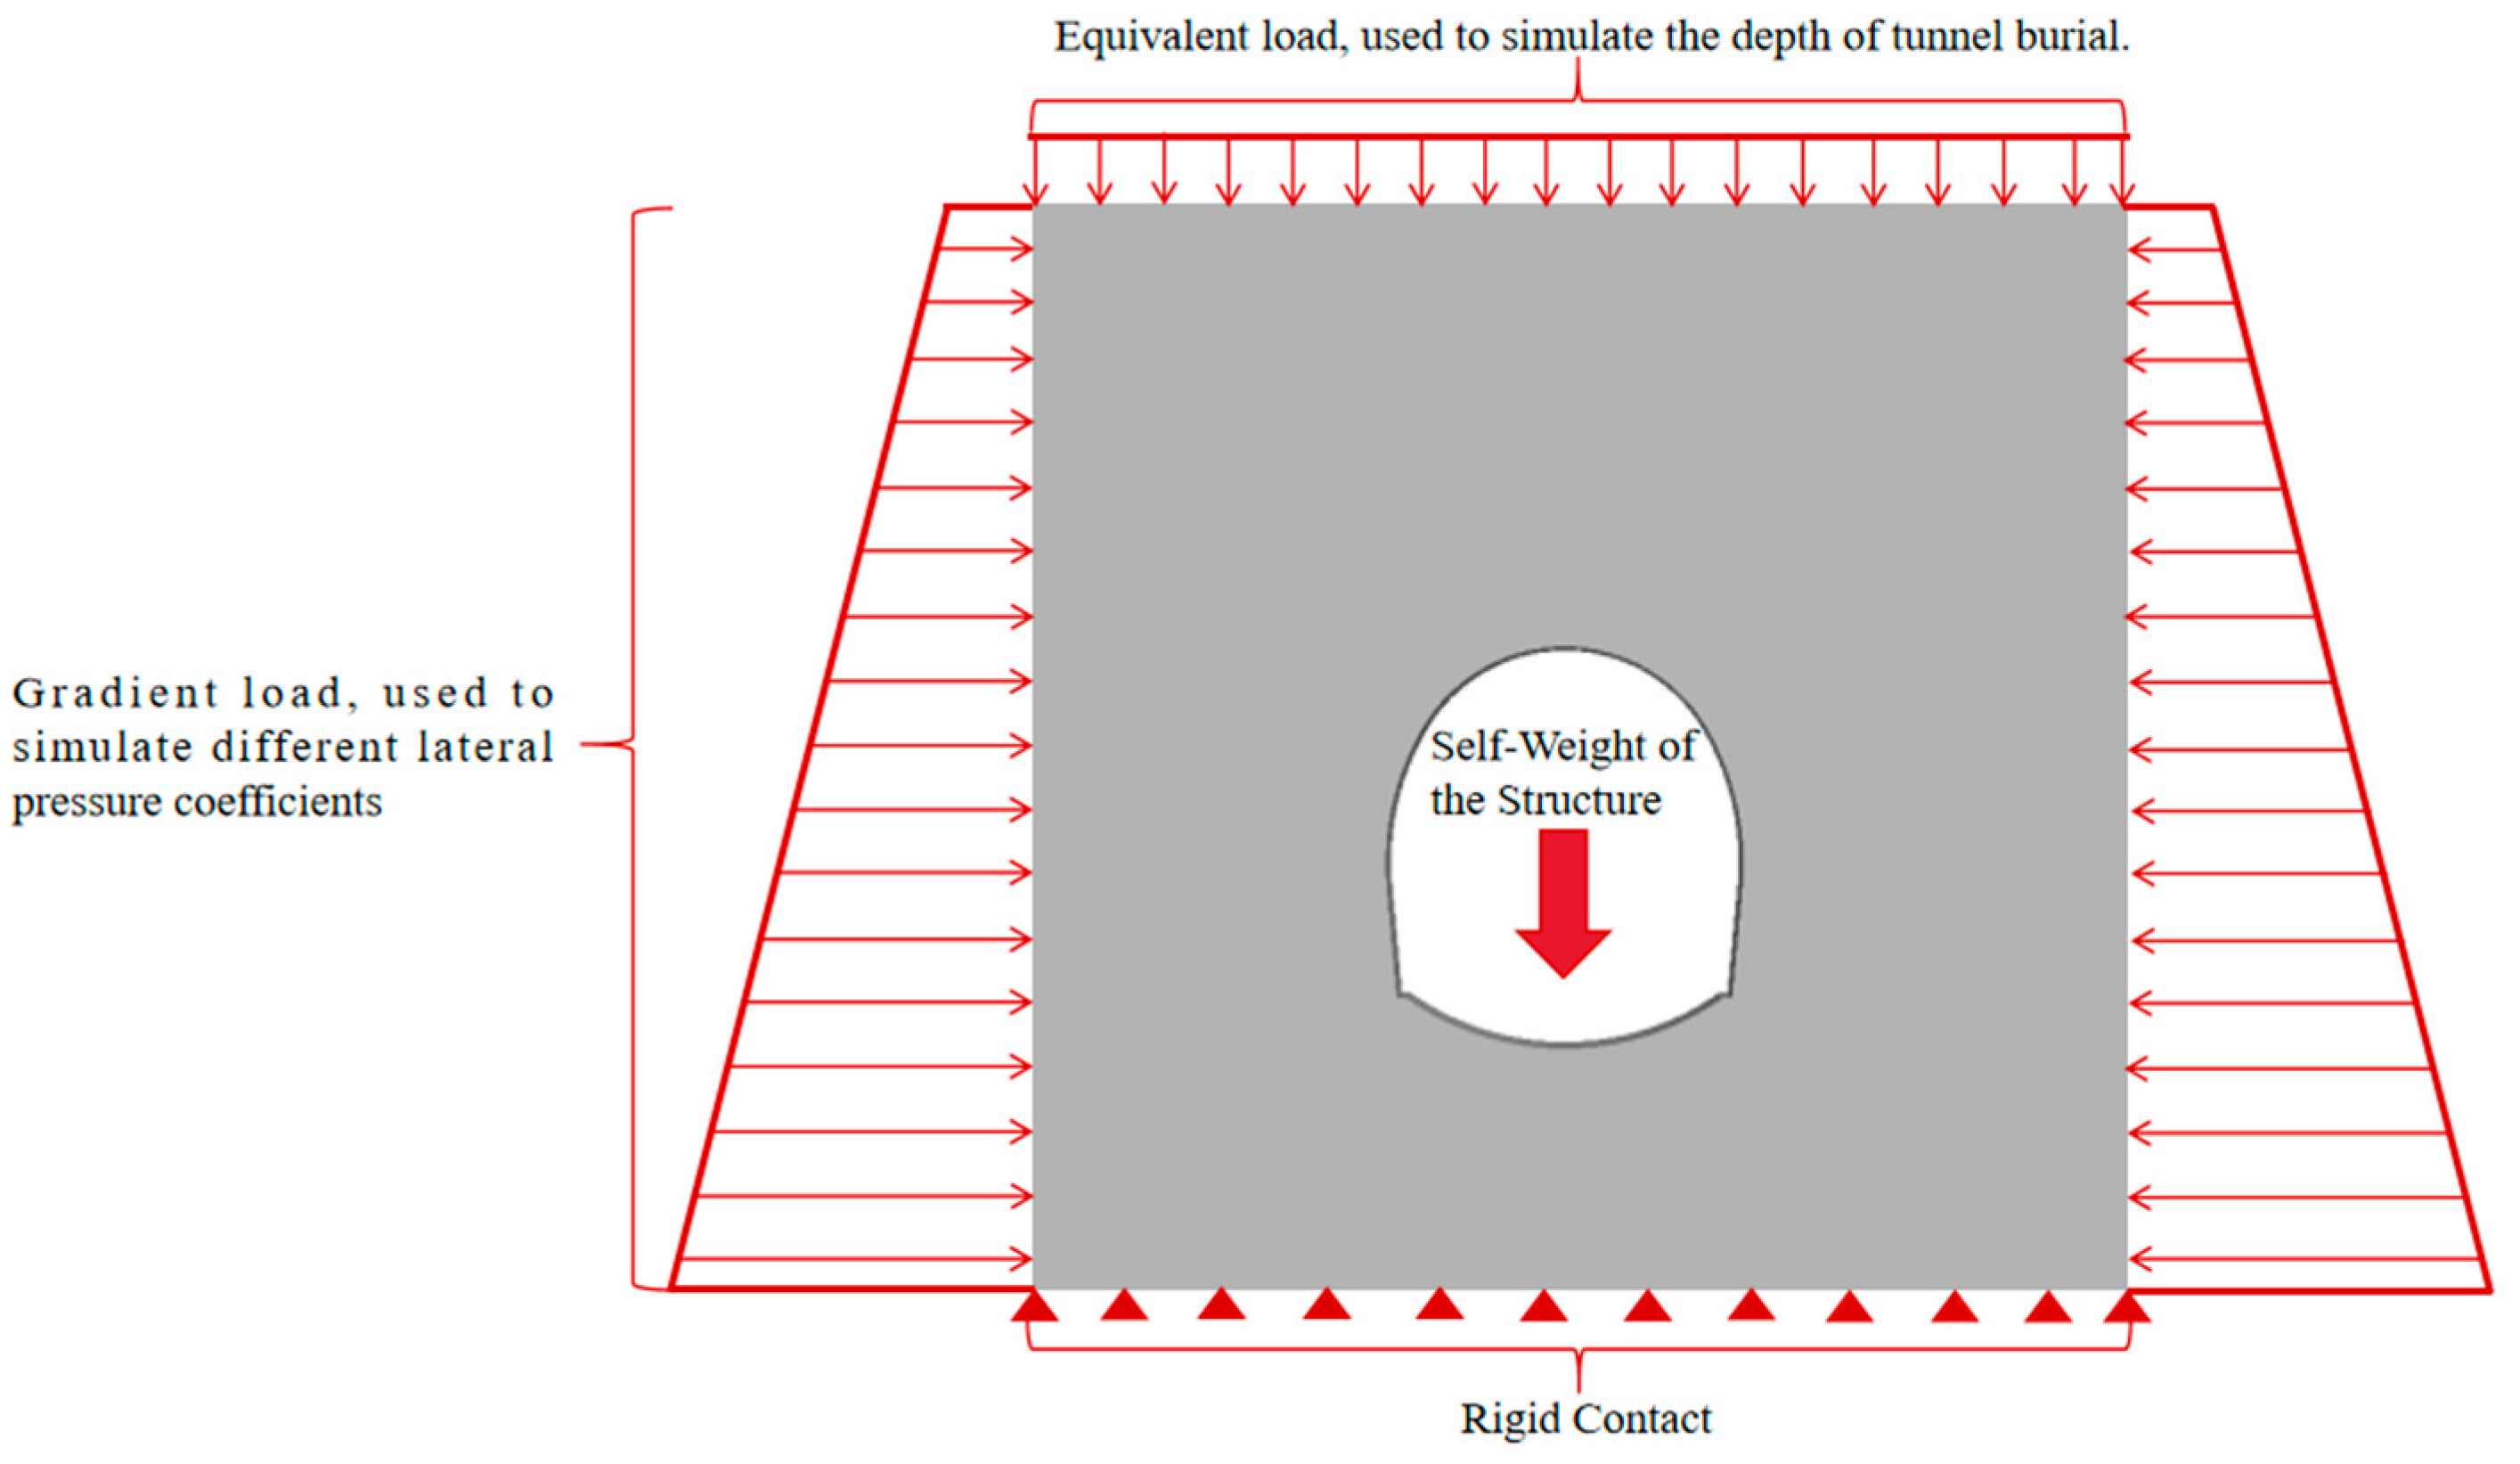
4.1. Establishment of Numerical Simulation Model

In tunneling engineering, regional discretization is a fundamental process for both the finite element method (FEM) and the volume of fluid (VOF) method. This procedure involves partitioning a continuous physical domain into a finite number of discrete subregions to enable numerical simulation and analysis.
For FEM, discretization is achieved by generating a mesh that divides the computational domain into finite elements. These elements may be triangular, quadrilateral, cubic, or other polyhedral shapes, depending on the problem’s dimensionality and complexity, and are defined by nodes. The quality and density of the mesh are critical as they influence both the accuracy and computational efficiency of the simulation. Within each element, interpolation functions, also known as shape functions, approximate the solution. These functions determine how the solution varies within each element based on node values, thereby converting continuous physical fields—such as stress, strain, or temperature—into discrete sets. Consequently, partial differential equations (PDEs) are transformed into algebraic equations, which are then solved using numerical methods applied to the global system of equations formed by all elements.
Similarly, in the VOF method, regional discretization entails dividing the computational domain into grid cells. Each cell represents a certain volume of fluid or gas, with the primary goal being to track the fluid volume fraction within each cell. This approach is particularly effective for simulating complex fluid dynamics and free surface behavior. The VOF method leverages these grid cells to monitor fluid interface changes and manage flow dynamics. By discretizing the mass and momentum equations into algebraic equations for each cell, the VOF method accurately simulates fluid movement and interface dynamics.
In summary, regional discretization in the FEM and VOF methods is essential for numerical simulations. In the FEM, it involves converting continuous fields into finite elements and using interpolation functions to approximate solutions, resulting in solvable algebraic equations. In the VOF method, discretization facilitates the tracking of fluid volume fractions within grid cells, enhancing the simulation of intricate fluid interfaces. These discretization techniques transform real-world physical problems into computational models, allowing for precise analysis and resolution of engineering challenges.
To mitigate the influence of boundary effects, the tunnel section is positioned centrally within the model, with the distance from the boundary set at three times the tunnel diameter. The Mohr–Coulomb constitutive model is employed for the steep rock strata, while the elastic constitutive model is applied to the primary support, secondary lining, and invert filling layer (as shown in Figure 15). The analysis adopts the plane strain criterion. In the vertical stress field, a uniform load is applied to the top of the model, accounting for the self-weight of the rock mass. In the horizontal stress field, the initial stress values vary along a vertical gradient. The bottom of the model is constrained with fixed supports, while force constraints are applied at the upper boundary to simulate the tunnel’s burial depth. Additionally, force constraints are applied to the left and right boundaries to represent different lateral pressure coefficients. The physical and mechanical parameters of the surrounding rock, informed by previous research, are presented in Table 2. As mentioned above, the groundwater in the tunnel area is developed, and the physical and mechanical parameters of the fluid are shown in Table 3. Figure 2 illustrates the dimensions of the tunnel structure and its support parameters. This study employs a numerical simulation with a 1:1 scale relative to the actual tunnel dimensions. Additionally, the self-developed software (v1.0) allows for the input of the rock dip angle.

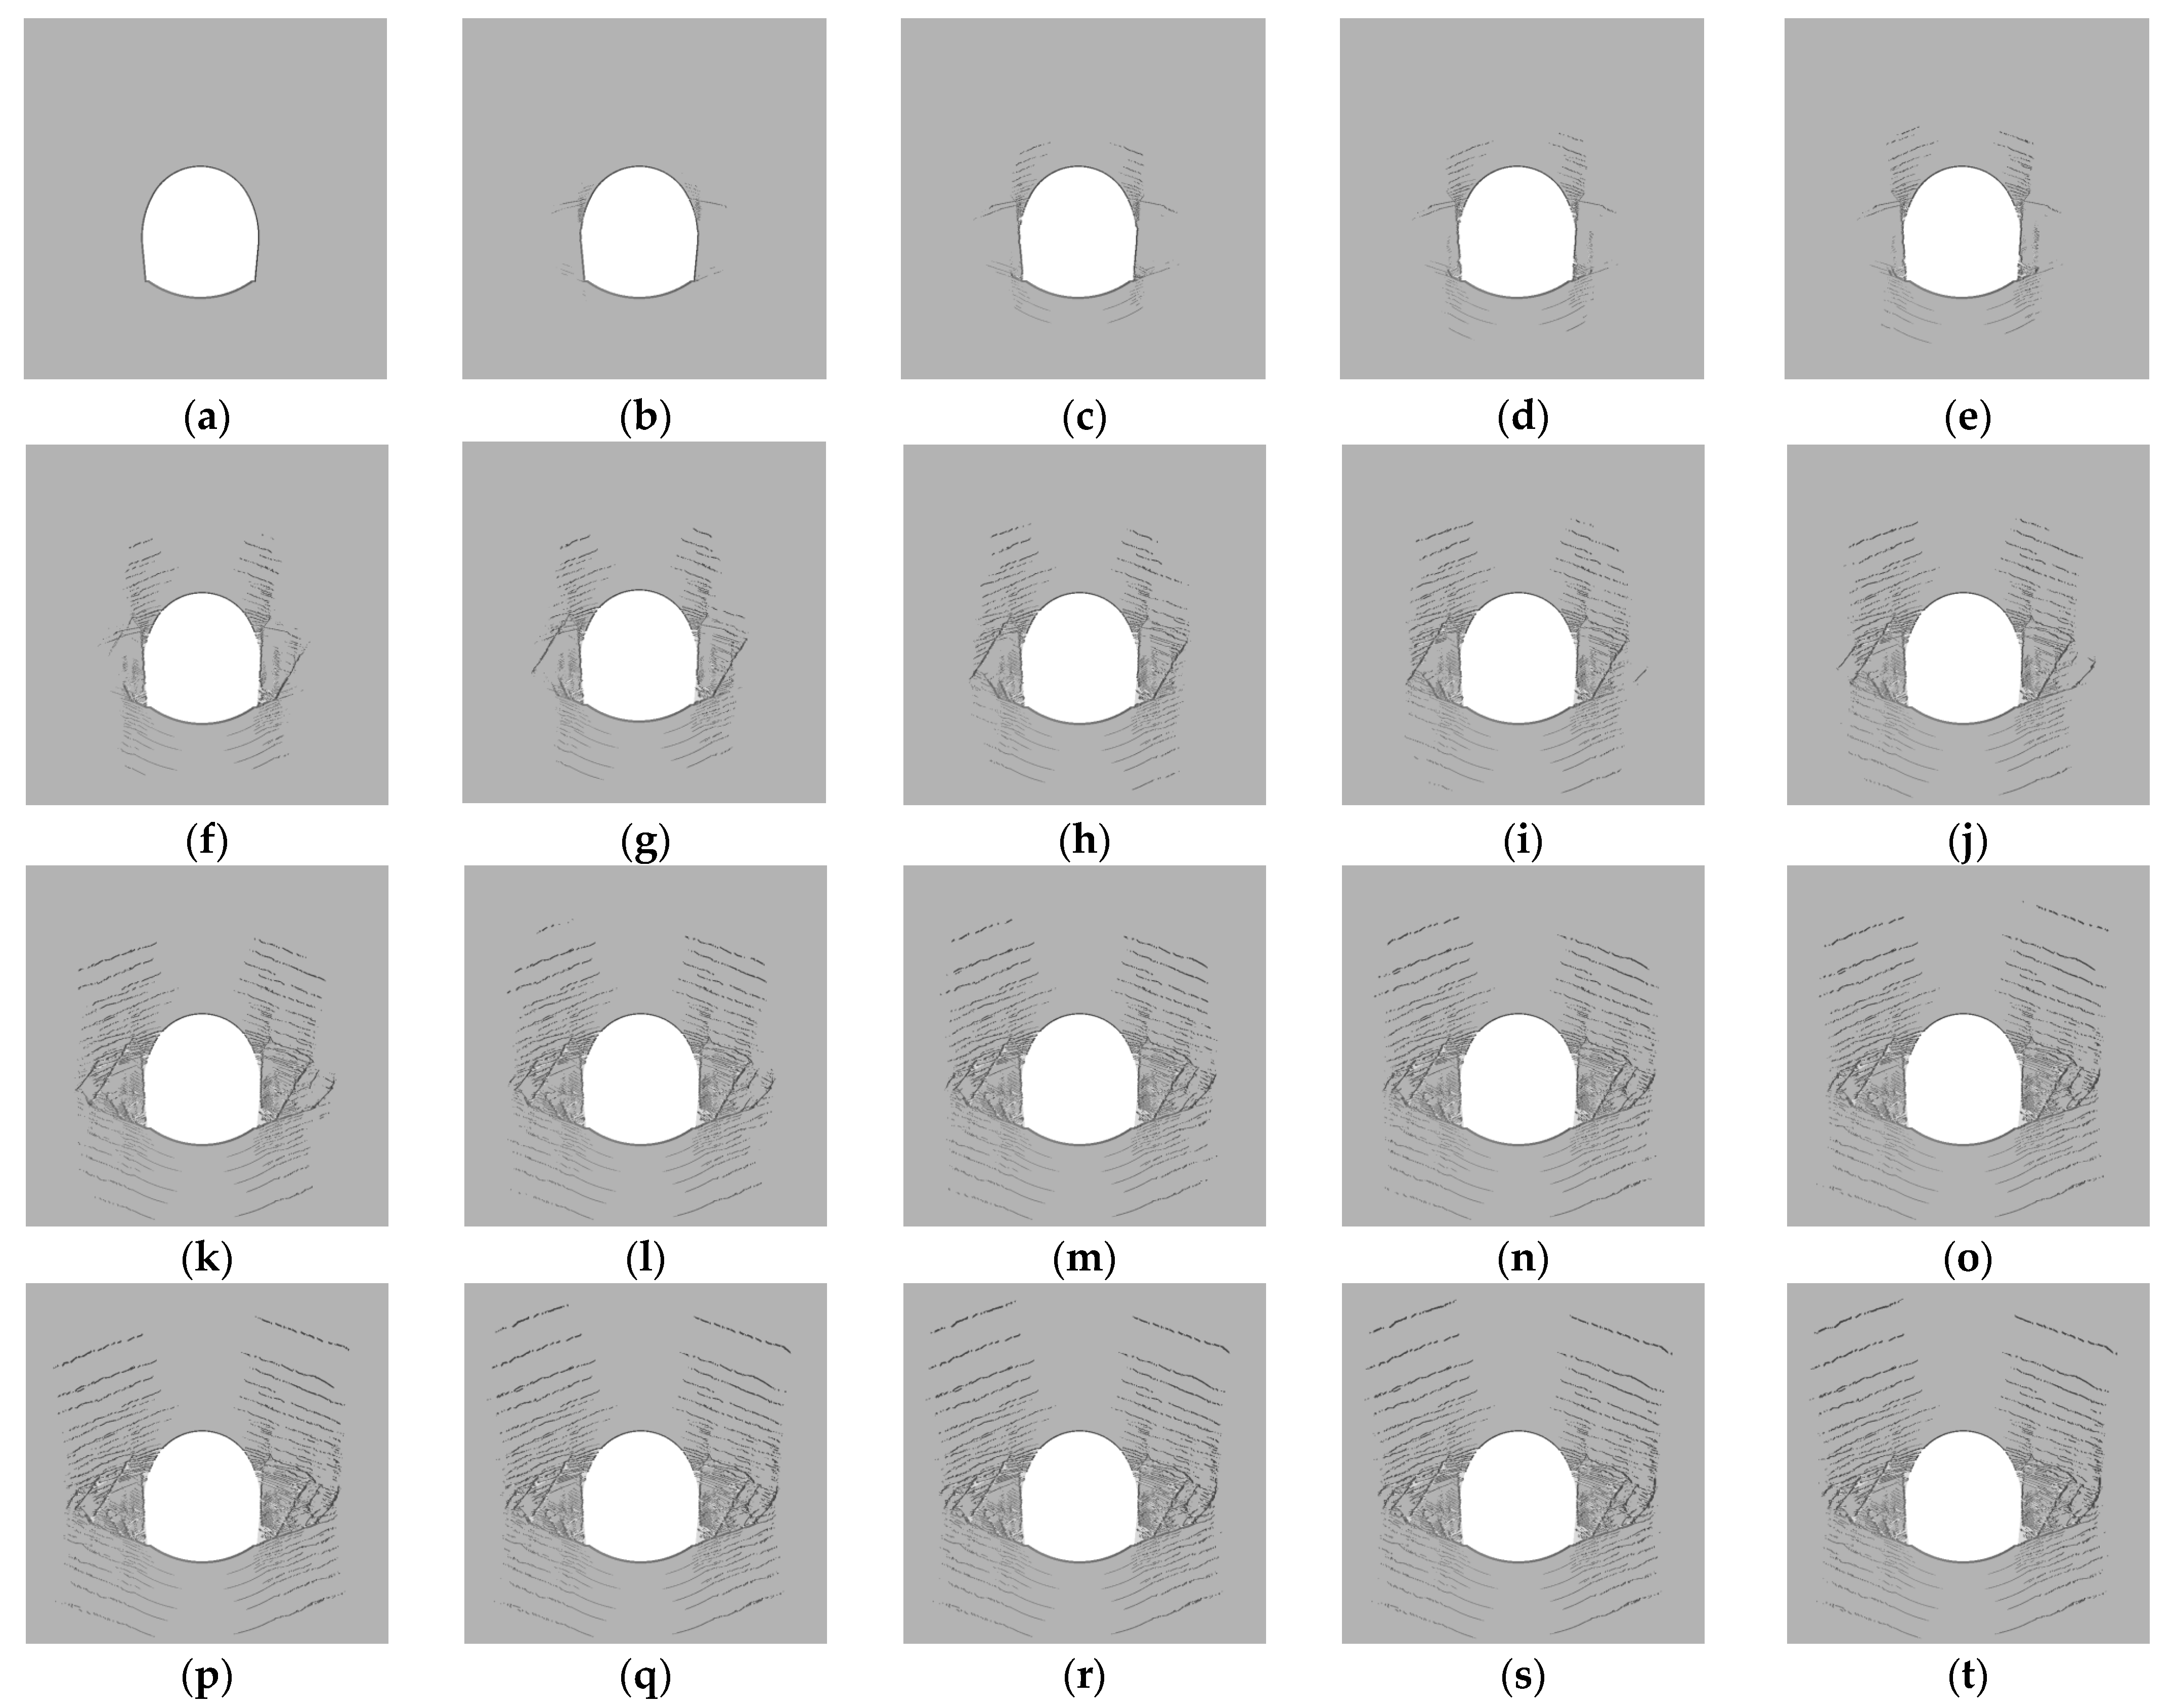
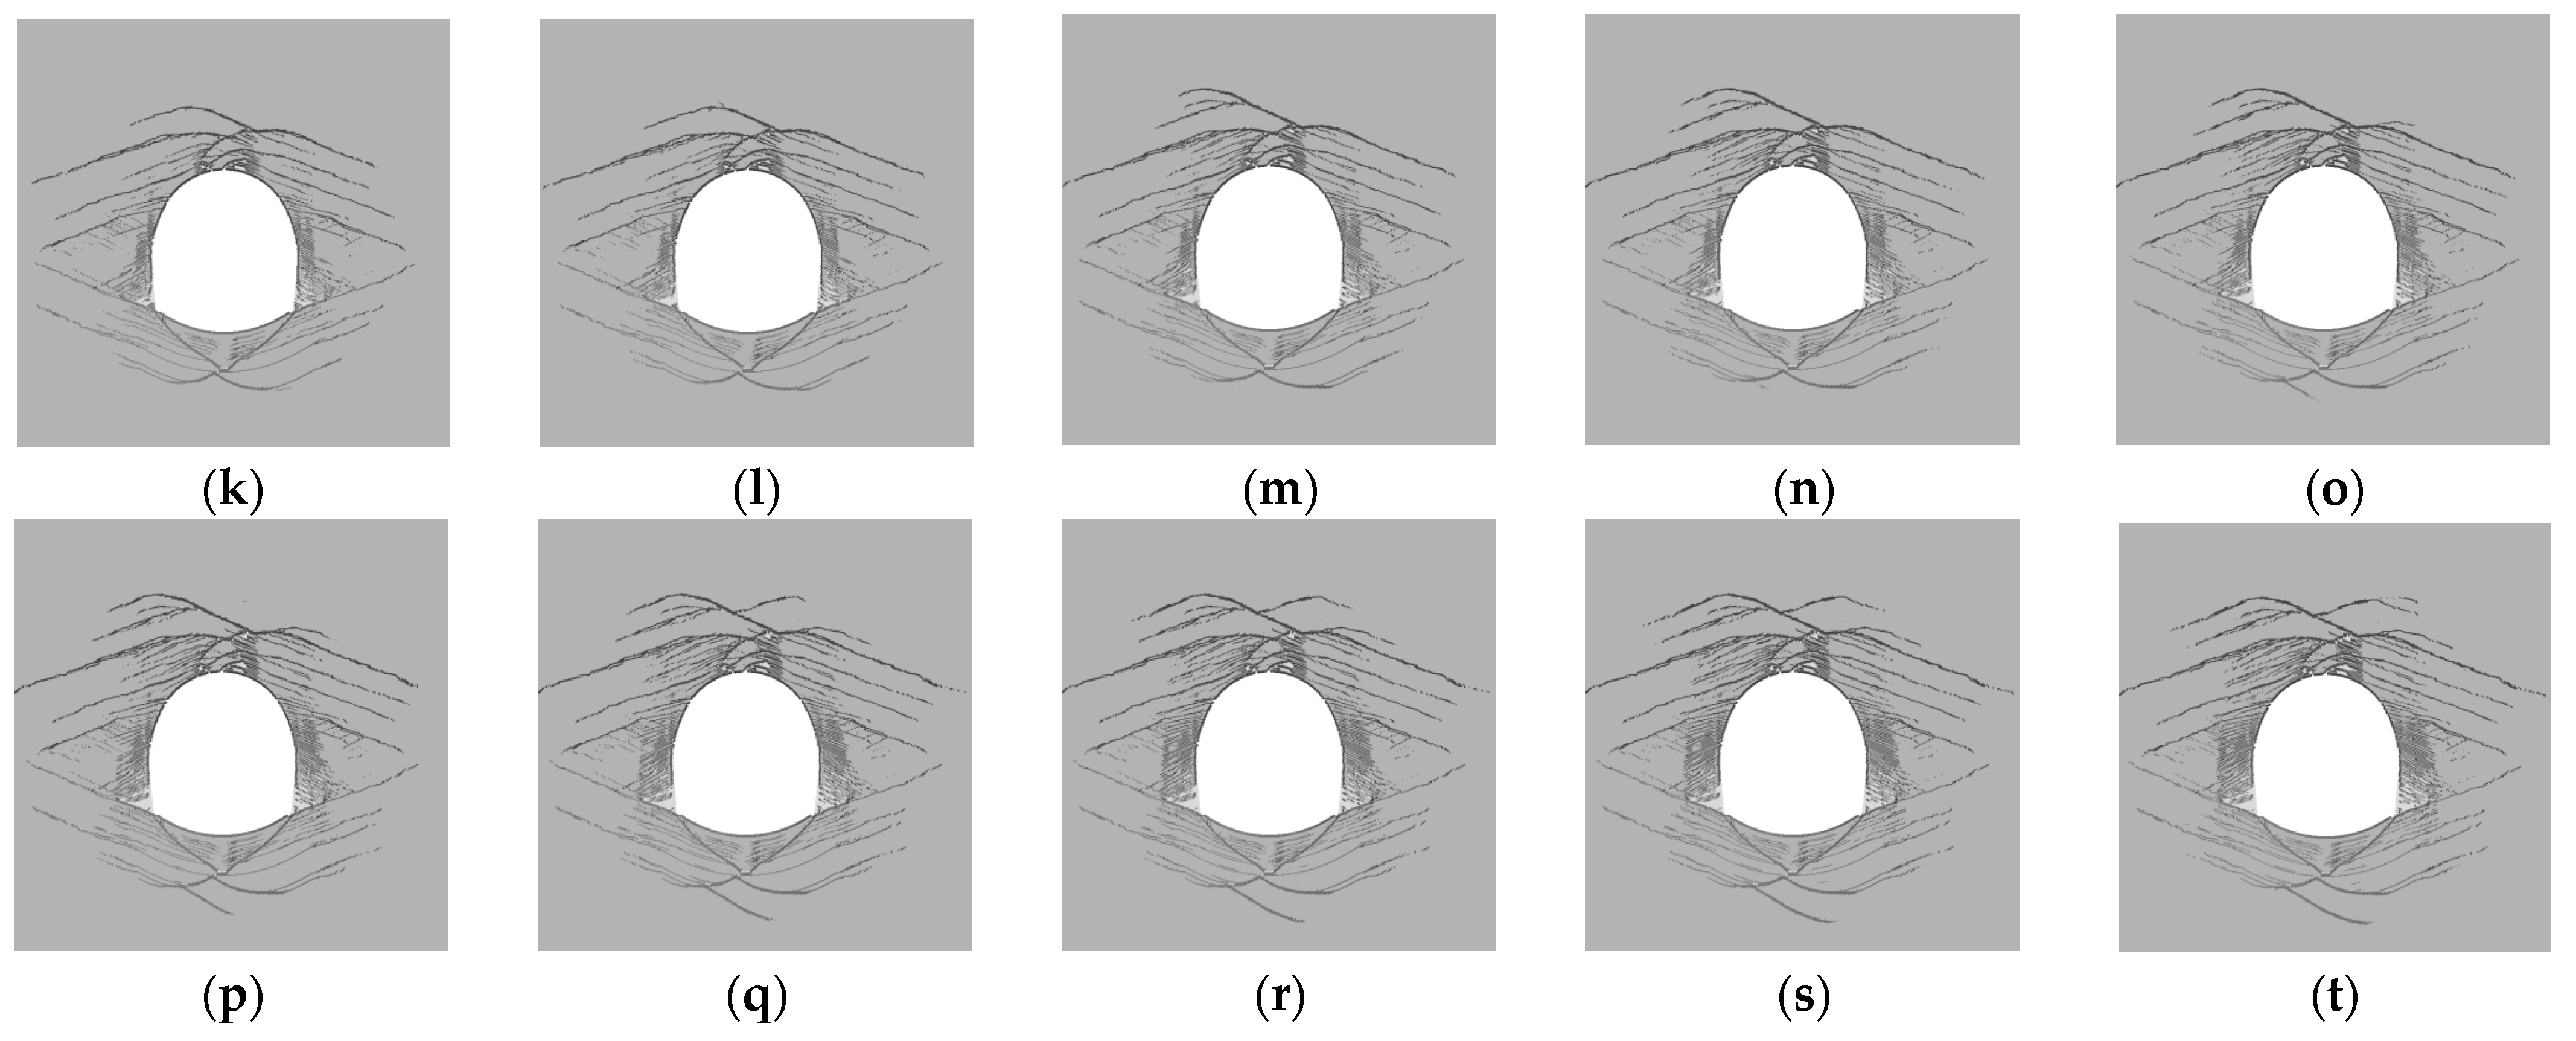
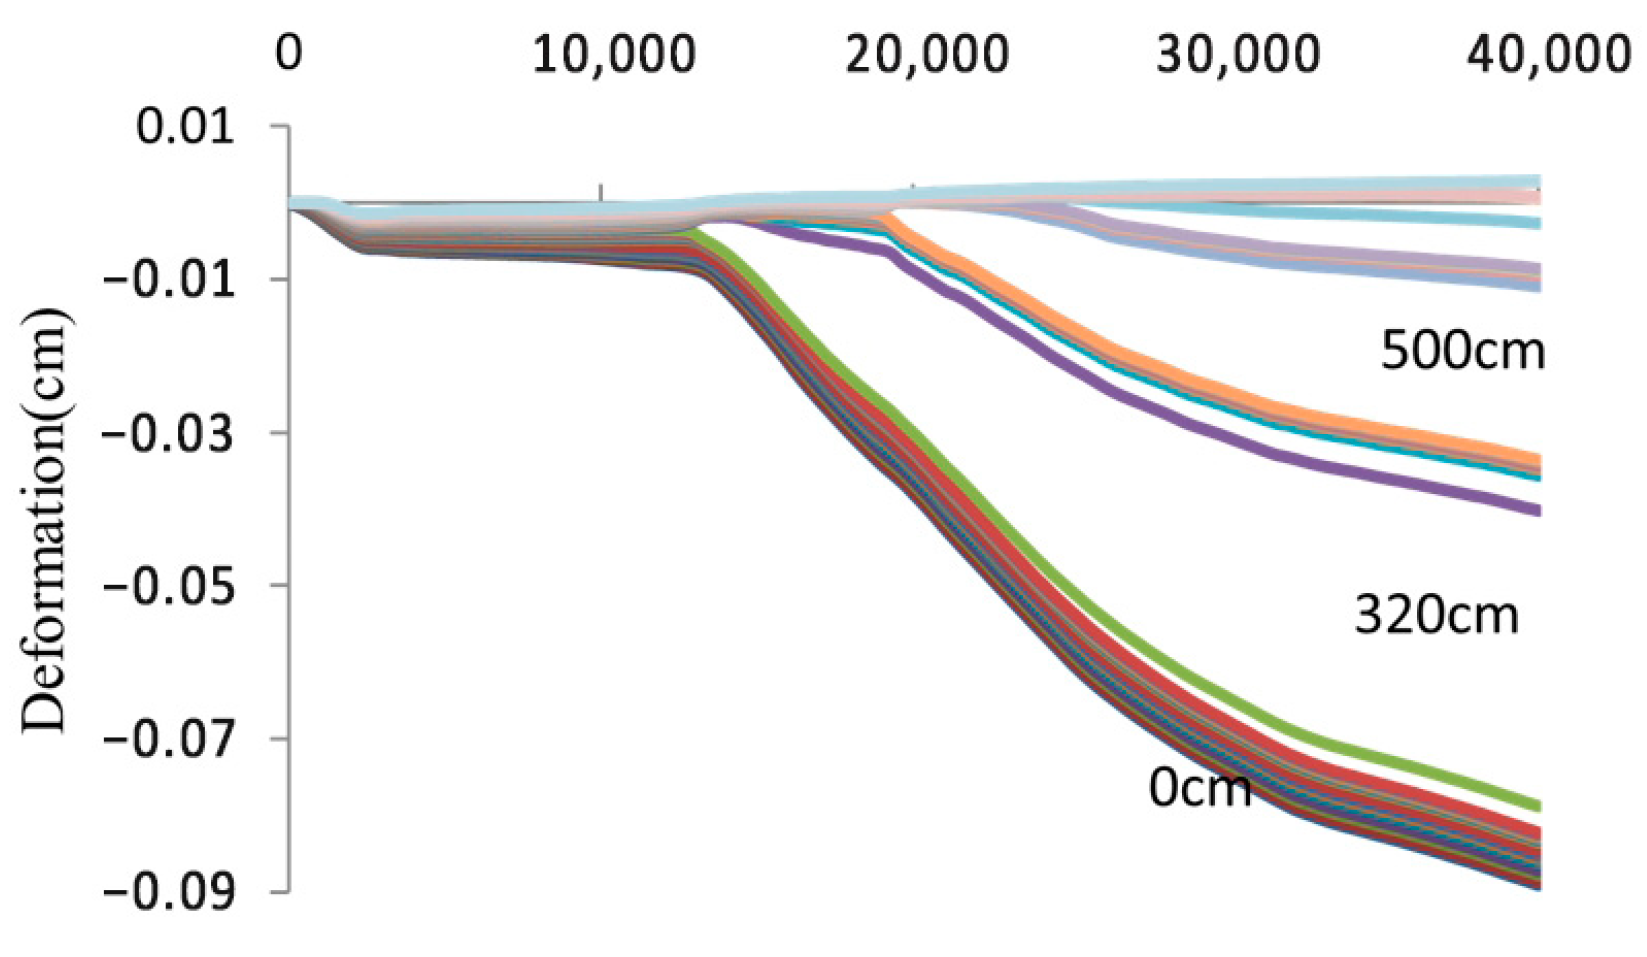
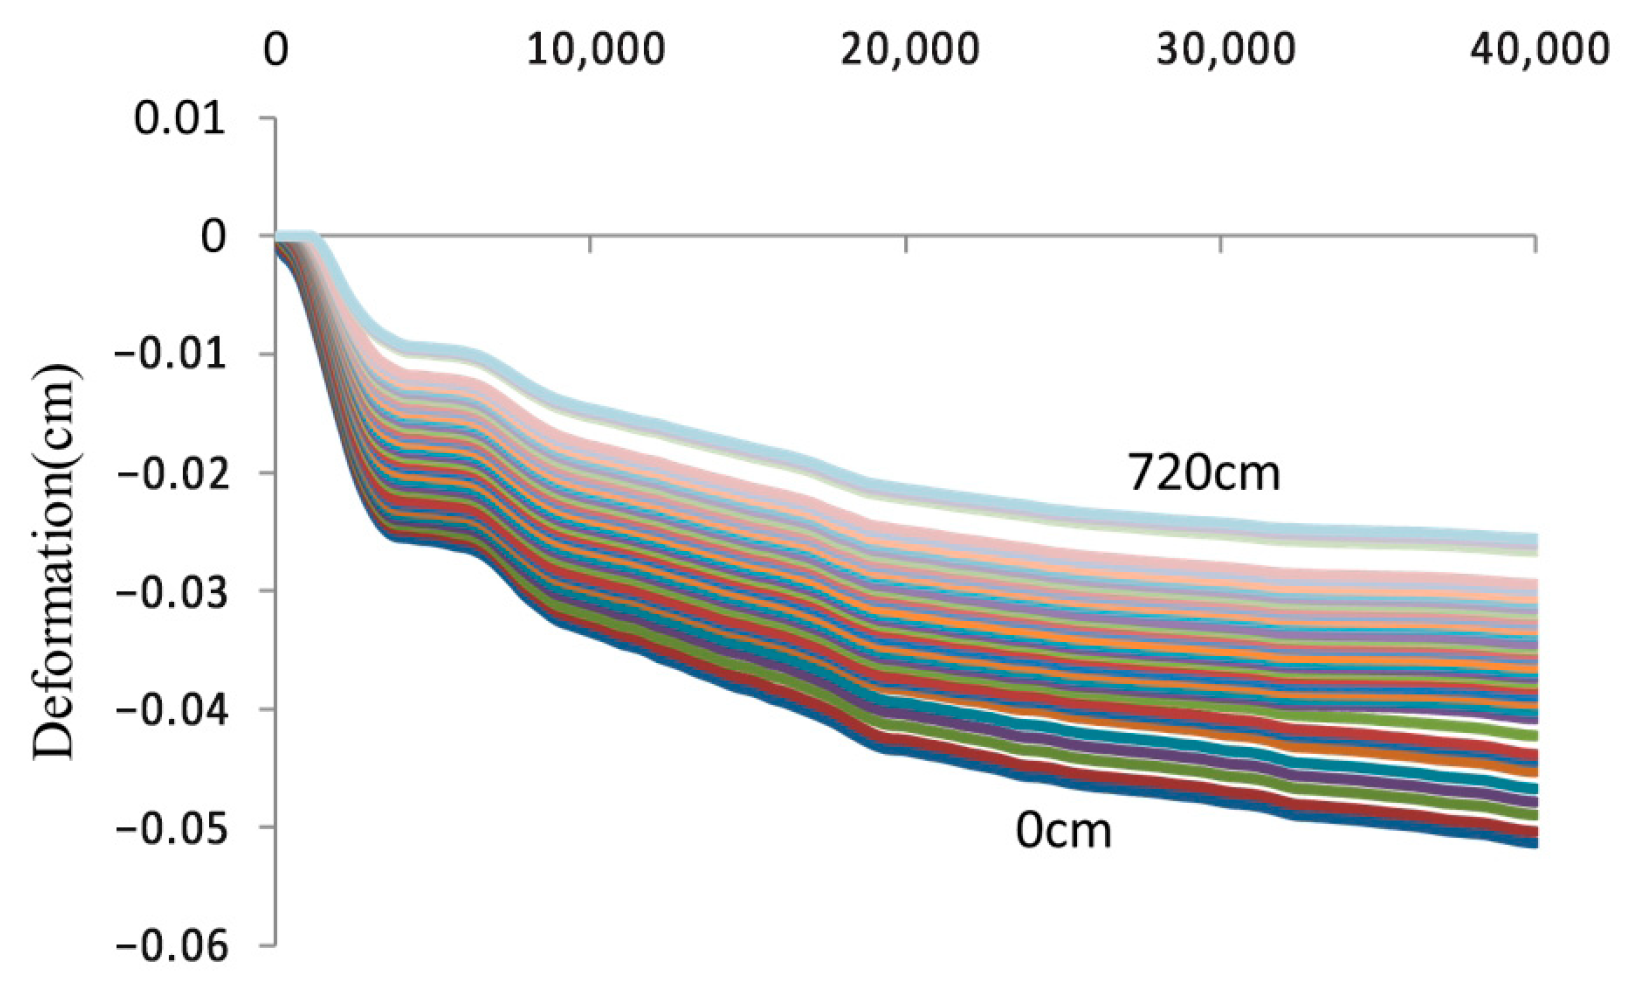
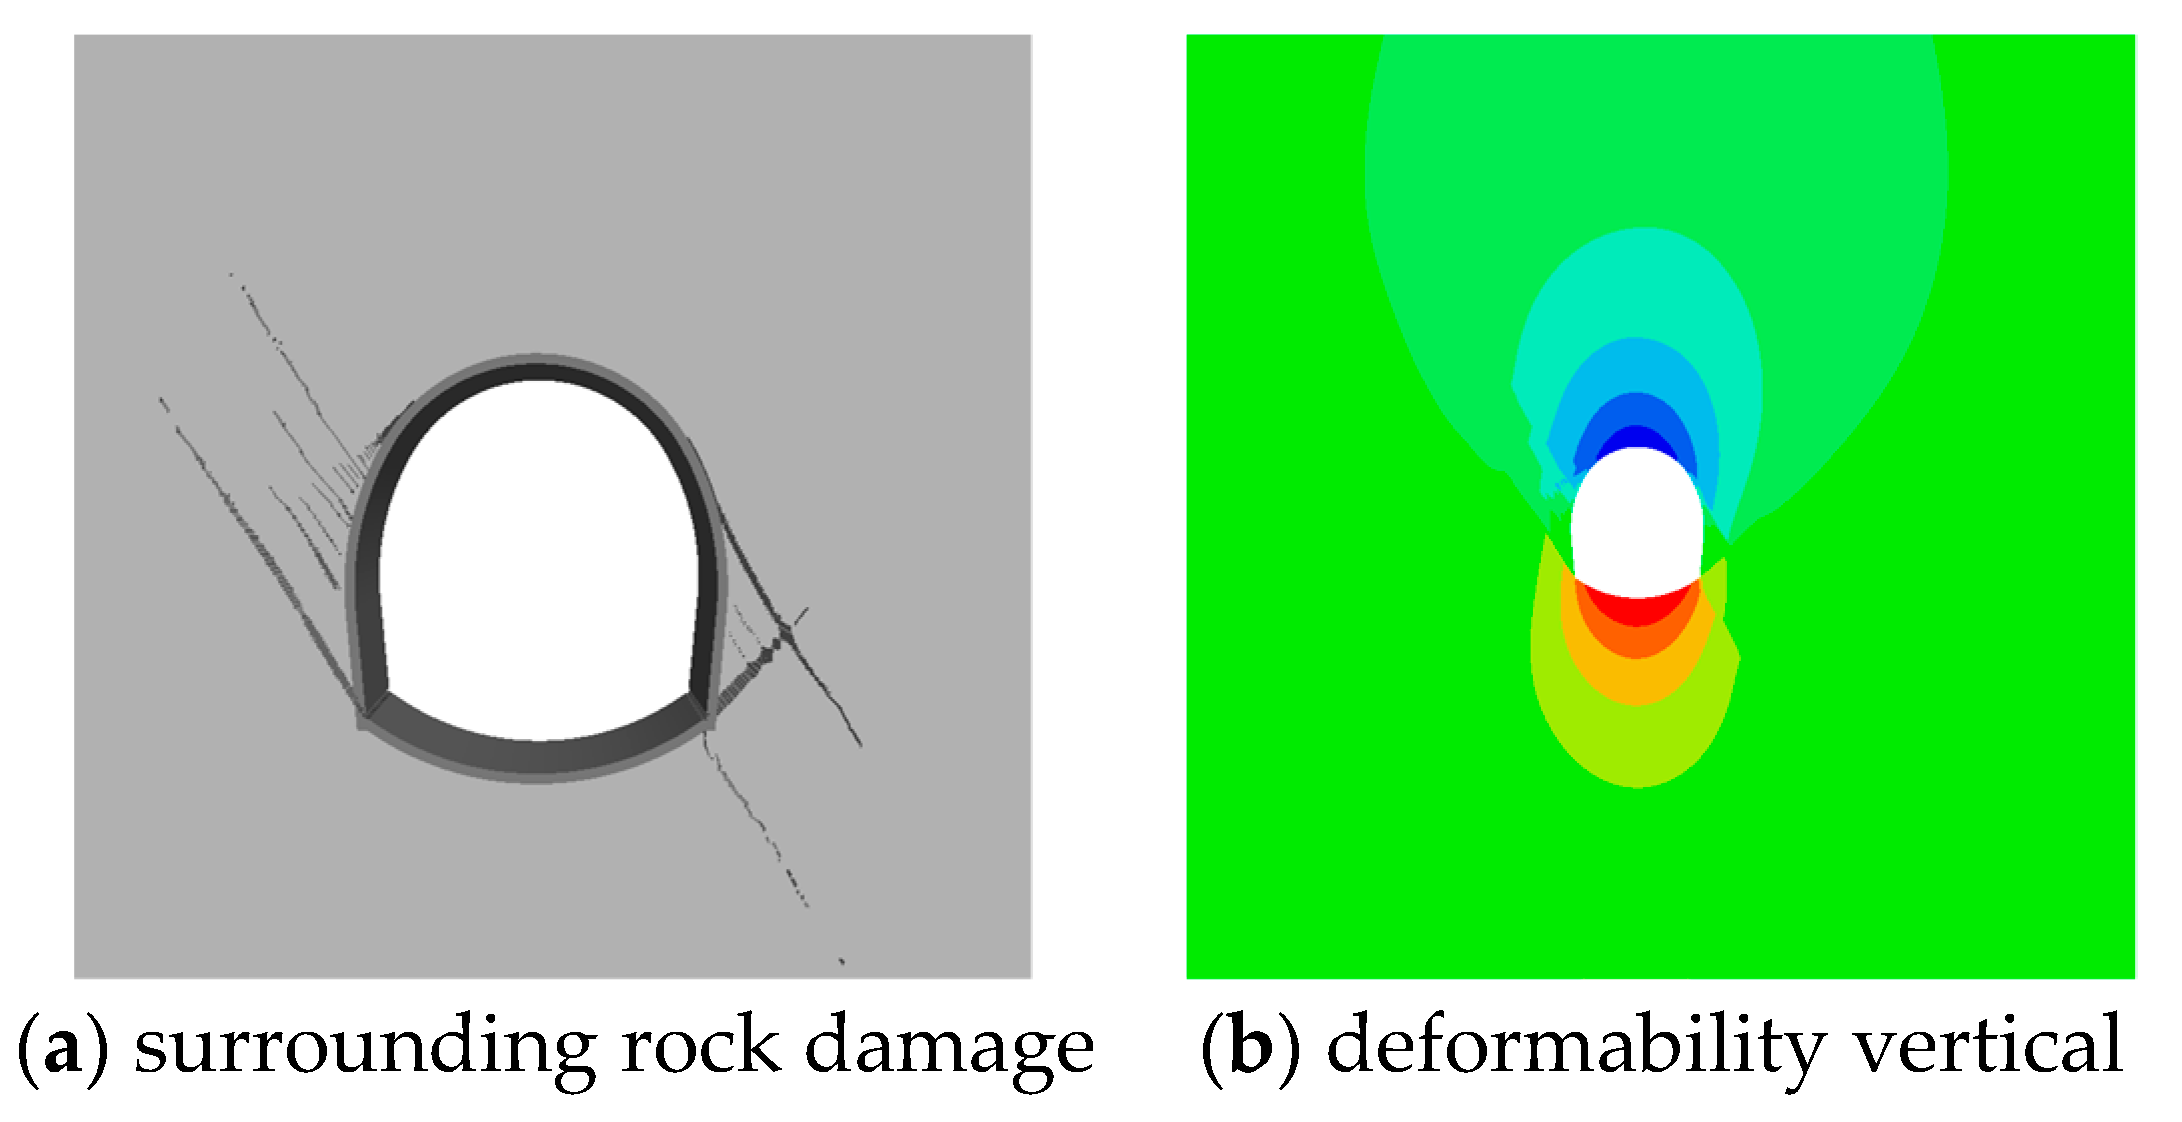
4.2. Numerical Simulation Results

This paper employs the self-developed finite element method (FEM) and fluid volume method (VOF) to numerically simulate steeply inclined surrounding rock. To simulate the actual excavation conditions accurately, the failure processes of surrounding rock are simulated under lateral pressure coefficients K0 of 0.5 and 1.25, reflecting the in situ stress environment and rock characteristics. Figure 16 and Figure 17 depict the failure processes of surrounding rock under these two conditions, revealing distinct failure characteristics between the cases.

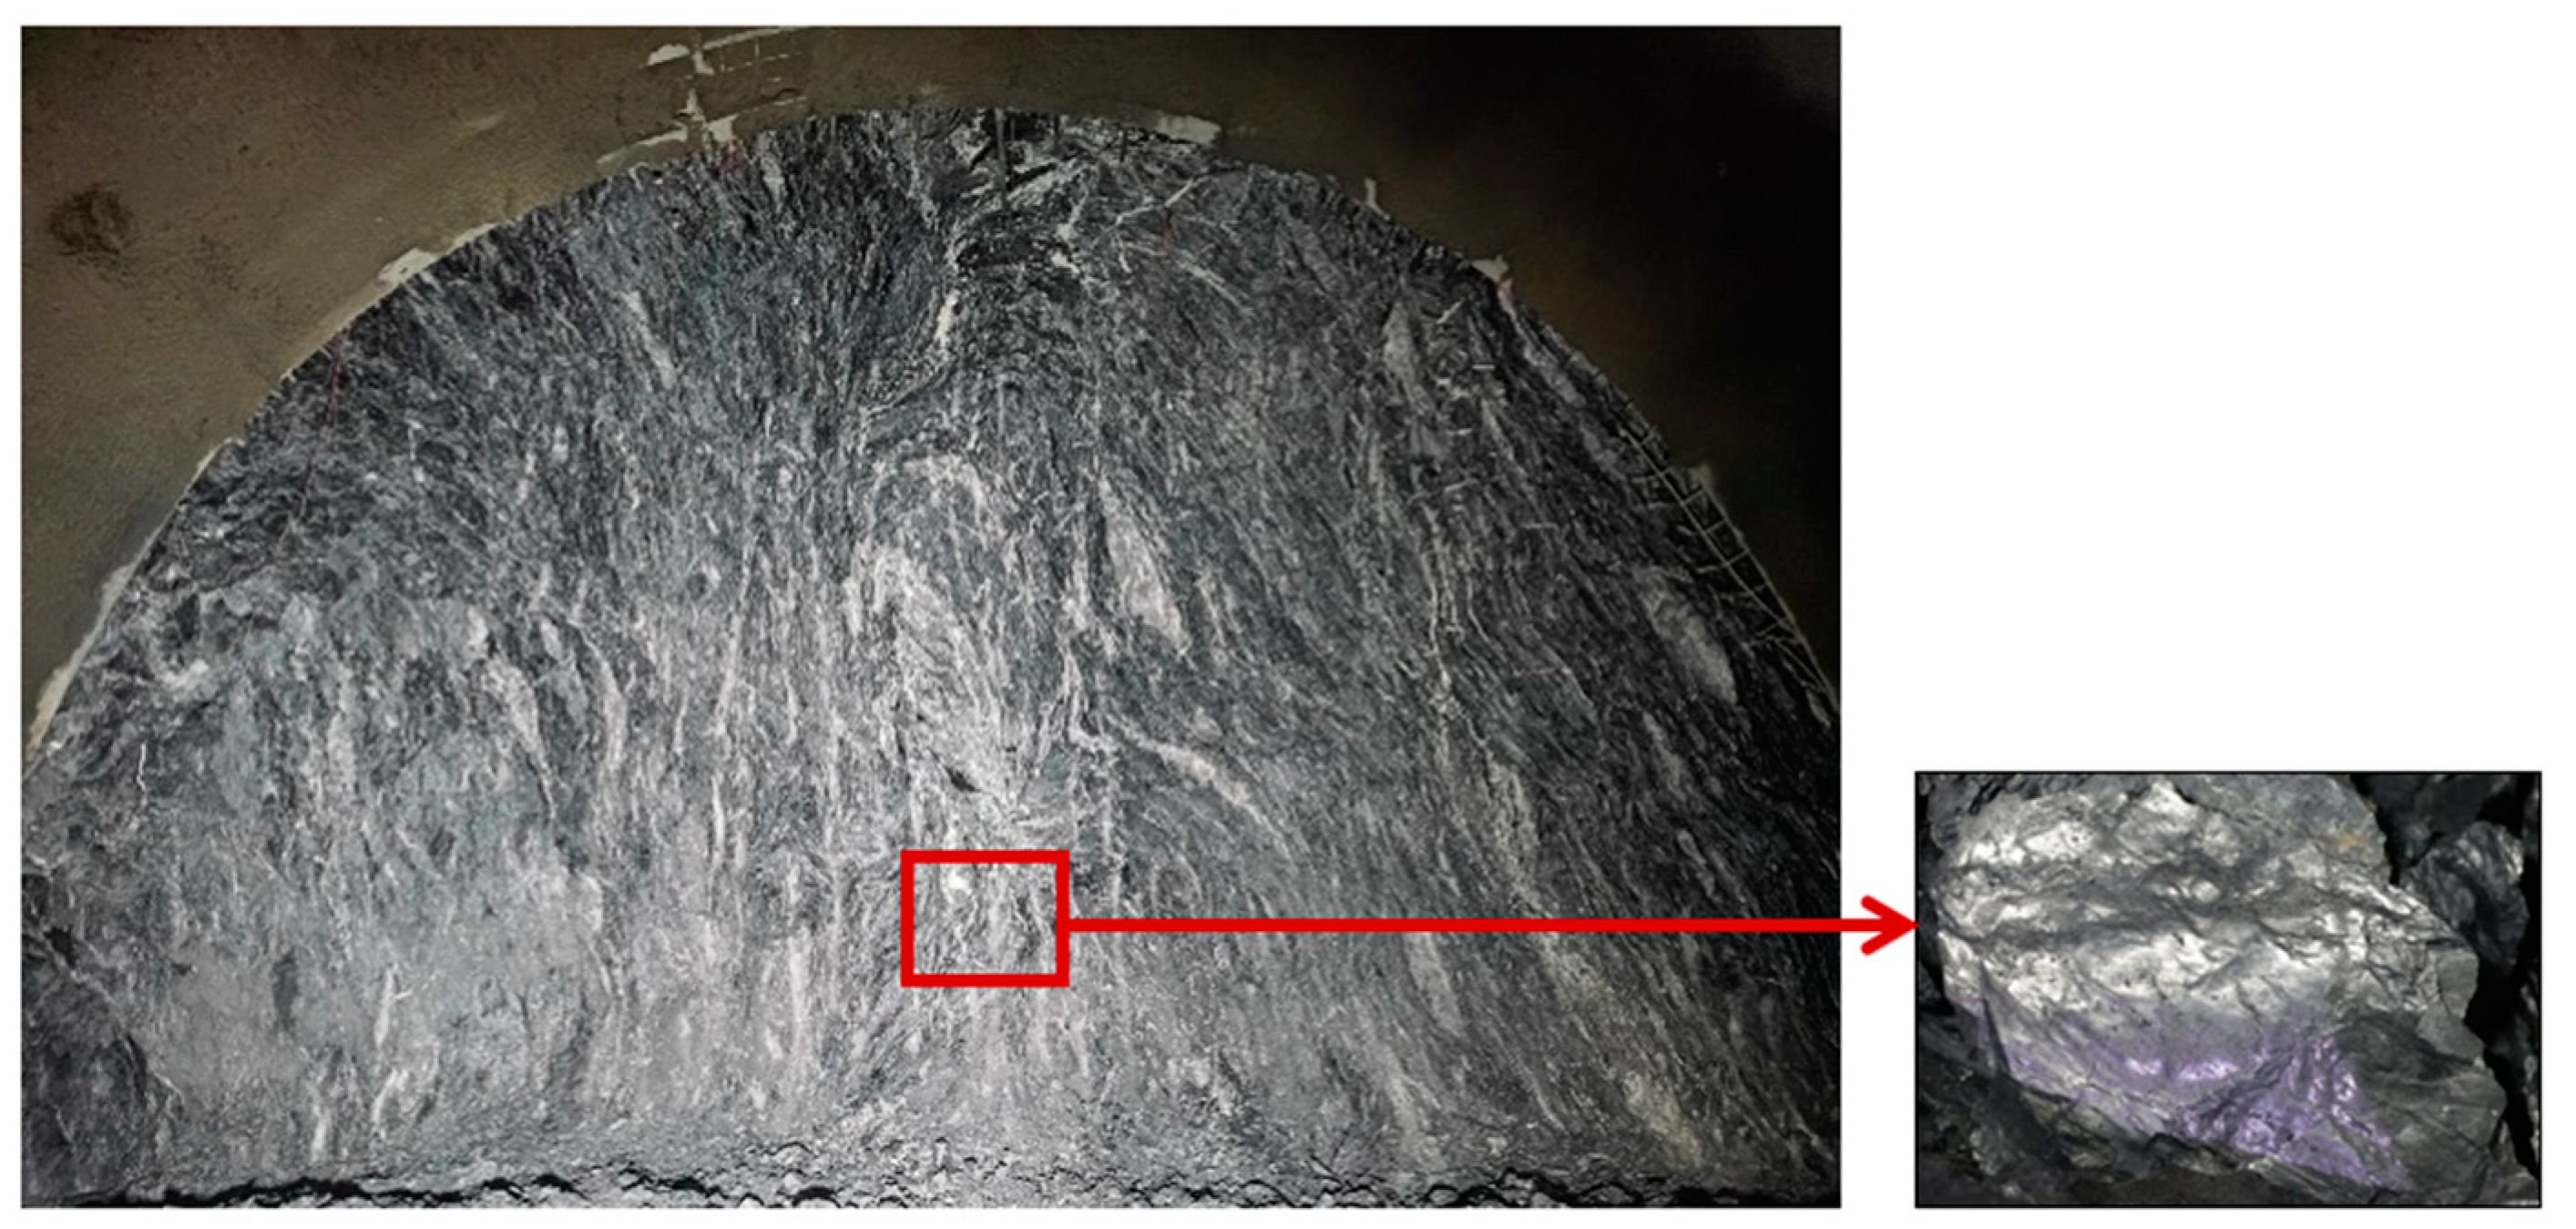
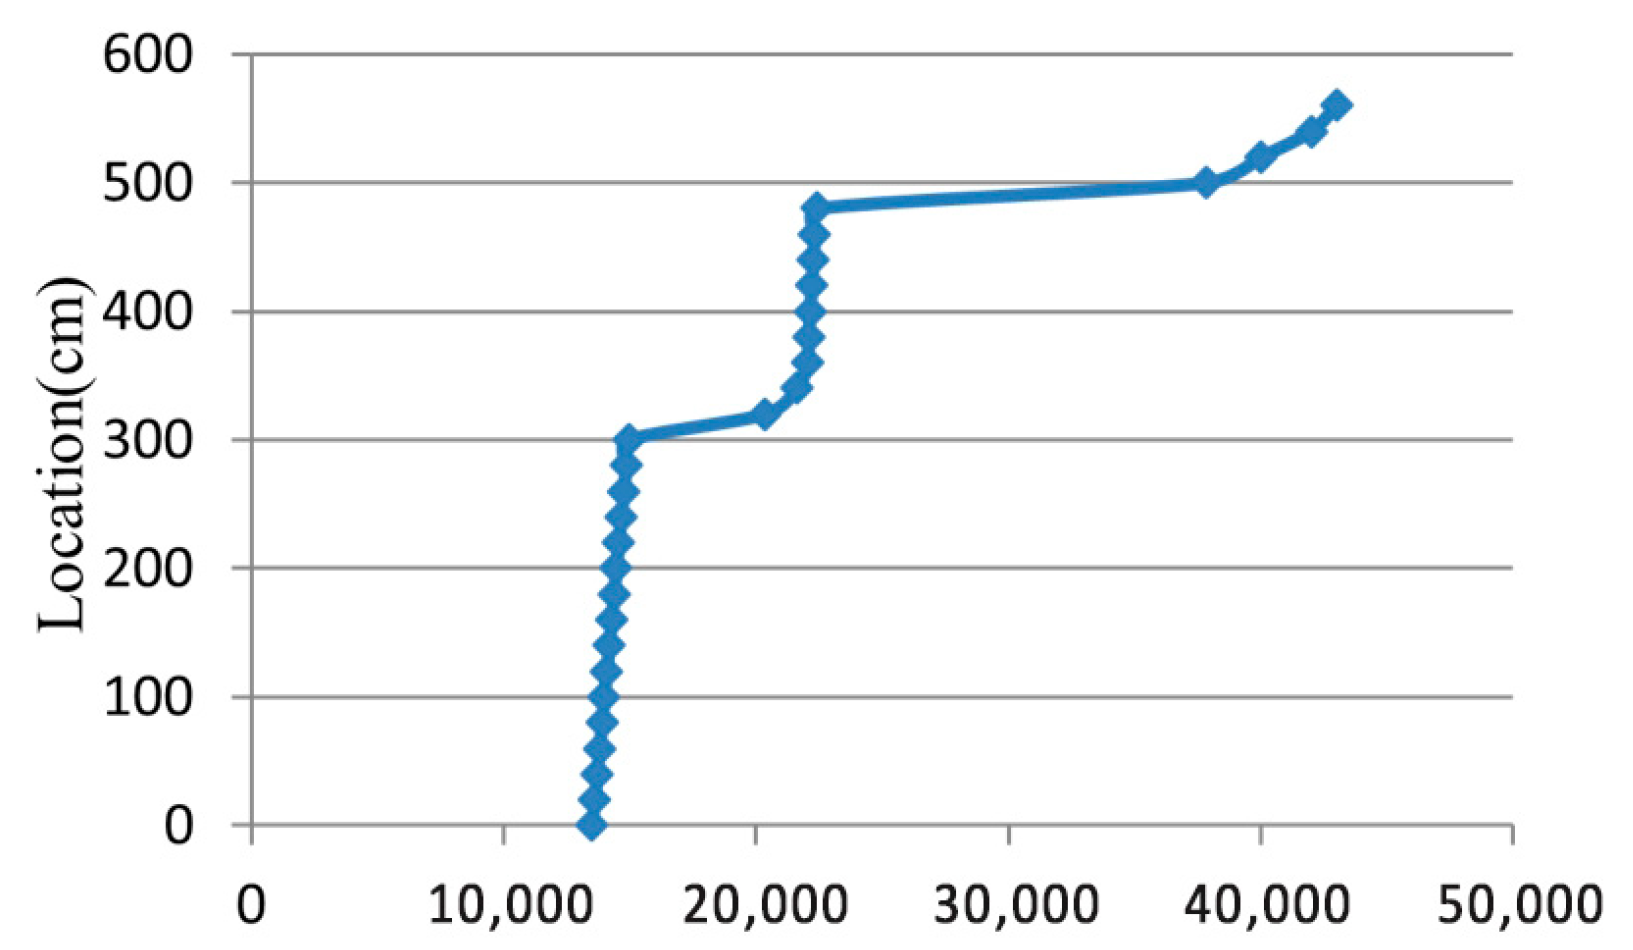
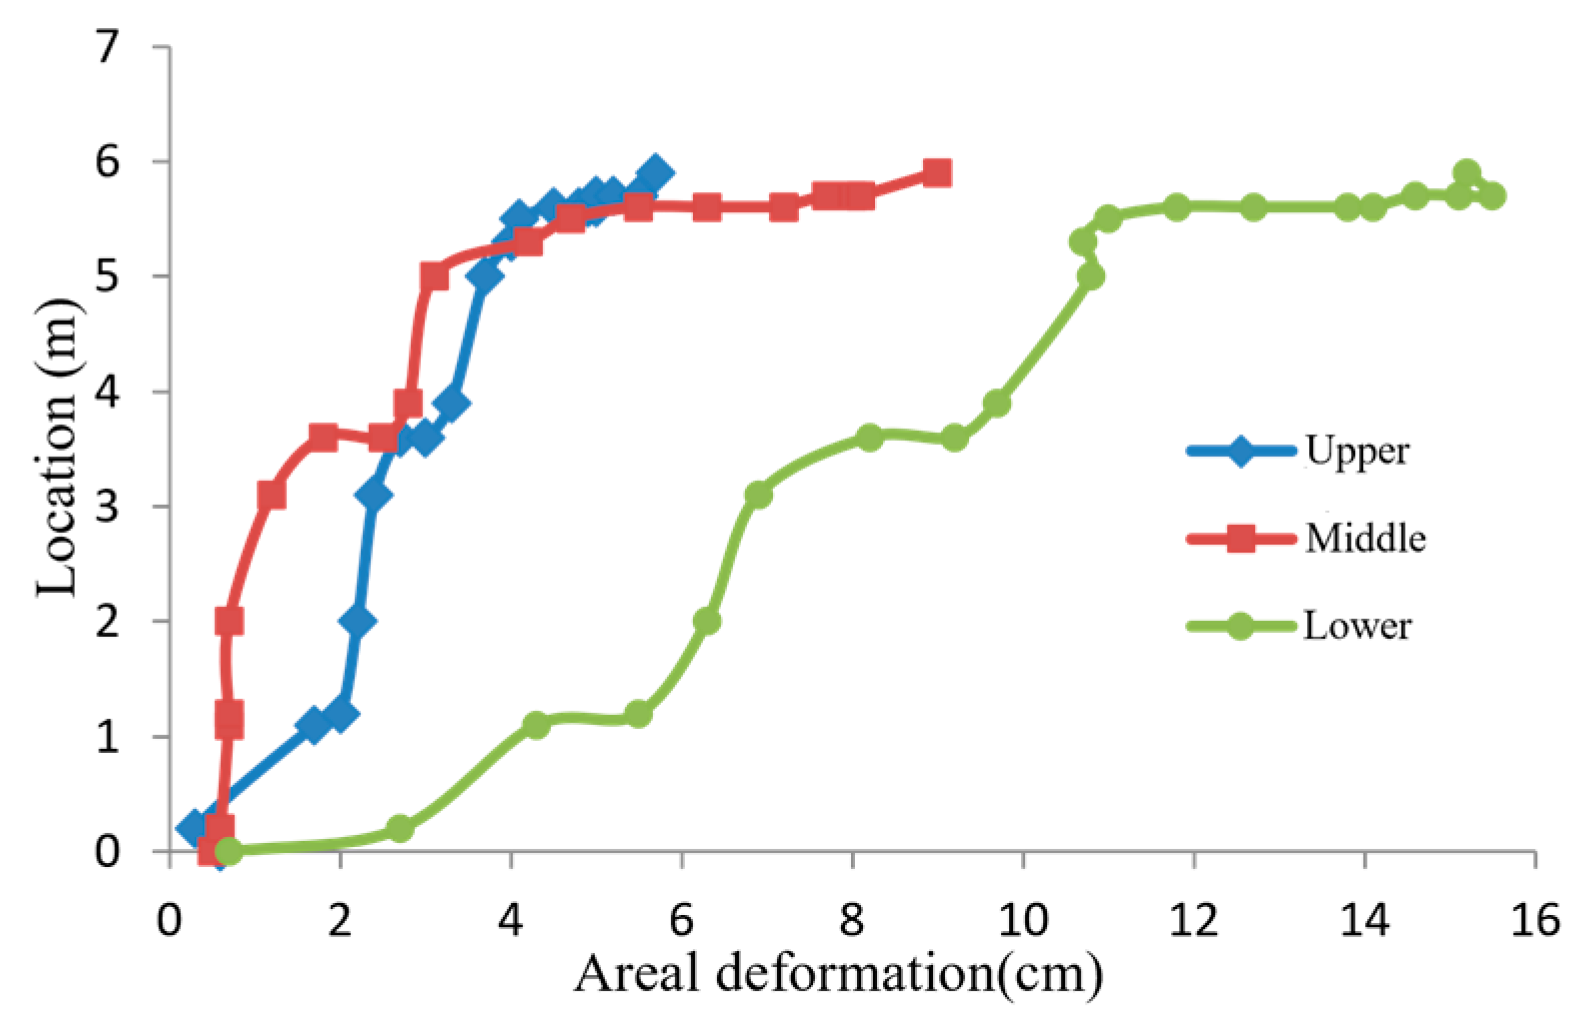
4.3. Site Monitoring Results

According to the classification standard of large deformation, the grade of large deformation tunnel in the whole line is determined. Sections K1 + 163~K1 + 236 of steeply inclined rock tunnel are determined separately as the model test sections, and the mechanical behavior during the construction period is tested and analyzed on site.
The schematic diagram of the layout of the monitoring points is shown in Figure 18, and the face and geological sketch photos are shown in Figure 19.
The cumulative deformation of SL01–SL02 is 188.7 mm, the cumulative variation of SL03–SL04 is 253.8 mm, and the cumulative variation of SL05–SL06 is 244.6 mm. The cumulative convergence of SL03–SL04 is 1.3 times that of SL01–SL02, and the cumulative convergence of SL03–SL04 is 1.1 times that of SL05–SL06. The left deformation is greater than the right deformation.
The cumulative deformation is 38.4 mm, and the average deformation rate is 12.8 mm/d (the maximum deformation rate per day is 22.4 mm/d).
The interval between the construction of the lower step and the closed-loop construction of the initial support of the inverted arch is 7 days. The variation of this stage is 158.4 mm (the cumulative deformation is 196.8 mm), and the maximum average rate during the period is 22.6 mm/d (the maximum daily deformation rate is 40.7 mm/d).
The time interval from the closed-loop of the initial support of the inverted arch to the pouring of the inverted arch is 22 days. The variation in this stage is 57 mm (the cumulative deformation is 252.3 mm), and the average rate during the period is 2.5 mm/d (the maximum deformation rate per day is 13.5 mm/d).
The on-site photographed progressive failure process of the surrounding rock and the tunnel is shown in Figure 20. (Given the spatial constraints, we will illustrate the scenario using a lateral pressure coefficient of 1.25, aligning it with the numerical simulation results).

4.4. Analysis of Progressive Failure Process

By integrating the numerical simulation results with field-measured data, the following conclusions can be drawn.
(1) To visually depict the deformation characteristics of soft rock tunnels, we extracted the deformation process curve and propagation positions from the model section under working conditions. Figure 21 and Figure 22 illustrate that at K0 = 0.5, deformation propagation occurs in three main stages. Initially, deformation progresses gradually from the surface into the surrounding rock with minimal displacement. In the second stage, the surrounding rock deformation stabilizes. Finally, deformation occurs in groups within the surrounding rock, specifically between 0~320 cm and 320~500 cm, with each group exhibiting nearly uniform deformation rates.
(2) To analyze the deformation characteristics of soft rock under various working conditions more clearly, we extracted deformations under different lateral pressure coefficients. Figure 23 illustrates that at K0 = 1.25, deformation progressively extends into the surrounding rock, exhibiting consistent trends across different positions. Surface displacement is uniformly distributed over the affected area. Due to the extensive affected area, the strain in the surrounding rock remains moderate, characterized by ‘change but not collapse’.
(3) From Figure 19, Figure 20 and Figure 21, it can be observed that when K0 = 0.5, the grouping deformation characteristics are obvious. The surrounding rock at 6 m is basically not deformed, the relative displacement between the rock strata is 1.7 cm, and the displacement of the separation layer is 7 cm. The relative displacement between rock strata only accounts for 24.3% of the total displacement. The actual tensile strain of the rock layer is 0.24%. When K0 = 1.25, deformation gradually spread. The surrounding rock is still deformed at 7.2 m, and the influence range is large. The surface deformation is relatively small. However, the actual tensile strain is 0.34%.
(4) In order to explore the failure characteristics of surrounding rock in tunnel excavation, the position change relationship of the model failure circle is selected for analysis. Figure 24, Figure 25 and Figure 26 are the relationships between the location of the failure circle and the deformation of the tunnel surface. When K0 = 0.5, the development of the location of the damage circle also occurs in stages. In the 0–3 cm stage of surface deformation, the position of the failure ring extends to about 1 m. In the 3–4 cm stage of surface deformation, the failure ring rapidly develops to the position of 3.5 m and then stagnates. Then, the surface deformation is 6–8 cm, and the damage circle expands rapidly to the position near 5 m, therein entering the stagnation stage again.
(1) It can be seen from Figure 27 and Figure 28 that when K0 = 1.25, the failure circle develops rapidly at the initial stage of deformation. When the surface deformation is 3 cm, the failure circle develops to the position of 6 m, but the position of the failure circle remains steady after this. However, the local loose circle continues to develop.
(2) Based on the previous analysis and the field-measured loose circle, it can be concluded that the deformation and failure process of surrounding rock under different stress conditions shows different characteristics. For the specific situation, the surface displacement can be used to infer the location of the expansion of the internal failure zone of the surrounding rock. From the calculation results, in both cases, when the surface deformation is 8 cm, the failure zone develops to the position of 6 m, but the development rate is large when the lateral pressure coefficient is large. Compared with the uniform surrounding rock, the development speed of the failure zone is faster in the case of steeply inclined thin-layered soft rock.

5. Analysis of Tunnel Bottom Structure Damage and Countermeasures

5.1. Types and Mechanism of Tunnel Bottom Drum

Tunnel floor heave can be classified into four fundamental types based on the mechanics of failure: extrusion flow deformation, water-induced swelling, flexible folding, and shear dislocation. Each type is illustrated in Figure 29.
The causes and mechanical mechanisms of uplift deformation in tunnel inverted arches can be attributed to two primary factors: lateral load mechanisms and longitudinal load mechanisms.
Lateral load mechanism: The ends of the inverted arch are subjected to vertical loads from the overlying strata and the structure’s weight, which are transmitted through the arch foot. Simultaneously, the base of the arch experiences an upward reaction force from the underlying foundation. These forces generate significant internal stresses within the inverted arch and its fill, resulting in substantial lateral tensile stress at the arch’s cracking points.
Longitudinal load mechanism: Along the tunnel’s longitudinal axis, the presence of extensive weak surrounding rock near the uplifted sections of the inverted arch contributes to increased surrounding rock pressure, structural internal forces, and displacement, particularly foundation settlement. Moreover, the long-term operation of trains exacerbates uneven settlement between uplifted and settled sections, inducing significant internal forces along the tunnel’s longitudinal axis. This phenomenon resembles a “leverage effect” or the distribution pressure on an upper cantilever beam, where the structural internal force peaks at the stratigraphic boundary. The transfer of shear forces intensifies the vertical load at the ends of the inverted arch, further increasing the transverse tensile stress at the arch’s cracking points. The accumulation of bending moments results in substantial longitudinal compressive stress across the cross-section of the inverted arch.
While both Thin Plate Differential Equations and Euler Beam Theory are used to analyze thin structural elements under load, they differ significantly in the type of structures they describe (plates vs. beams), the complexity of their governing equations, and the dimensionality of their applications. Euler Beam Theory is simpler and focuses on one-dimensional bending, whereas Thin Plate Theory deals with two-dimensional bending and is more complex, accommodating a wider range of loading and boundary conditions.
From the above analysis and combined with the Thin Plate Differential Equations [33] and Figure 30, we can obtain:
D ω 4 ( N x 2 ω x 2 + 2 N x y 2 ω y 2 + N y 2 ω y 2 ) = 0
where ω is the deflection of the bottom plate (m); D is the bending stiffness of the bottom plate (N∙m); N x , N x y , and N y are the mid-plane stress of the bottom plate (N/m).
The stress in the bottom plate is (positive in tension).
σ x = p x t , σ y = μ p x t , τ x y = 0
where p x is the uniform pressure per unit length of the side of the bottom plate (N·m); t is the thickness of the bottom plate (m); and µ is the Poisson’s ratio.
The stress in the middle surface is thus obtained as:
N x = p x , N y = μ p x , N x y = 0
Replace Formula (3) with Formula (1) and, taking into account that deflection is only related to x, obtain:
D d ω 4 d x 4 + p x d 2 ω d x 2 = 0
The deflection expression is:
ω = m = 1 A m sin m π x l
In the formula, m is any positive integer; Am is the undetermined coefficient; and l is the width of the floor (m).
Replace (5) with (4)
m = 1 A m ( D m 4 π 4 l 4 p x m 2 π 2 l 2 ) sin m π x l = 0
The crimping conditions are:
D m 4 π 4 l 4 p x m 2 π 2 l 2 = 0
Let m = 1 and obtain the critical load ( p x ) max :
( p x ) max = π 2 D l
Thus, the stress in the bottom plate under critical condition is
σ x = π 2 D t l 2 σ y = μ π 2 D t l 2 σ z = τ x y = τ y z = τ z x = 0 }
When p x > ( p x ) max , there is bottom plate buckling instability.

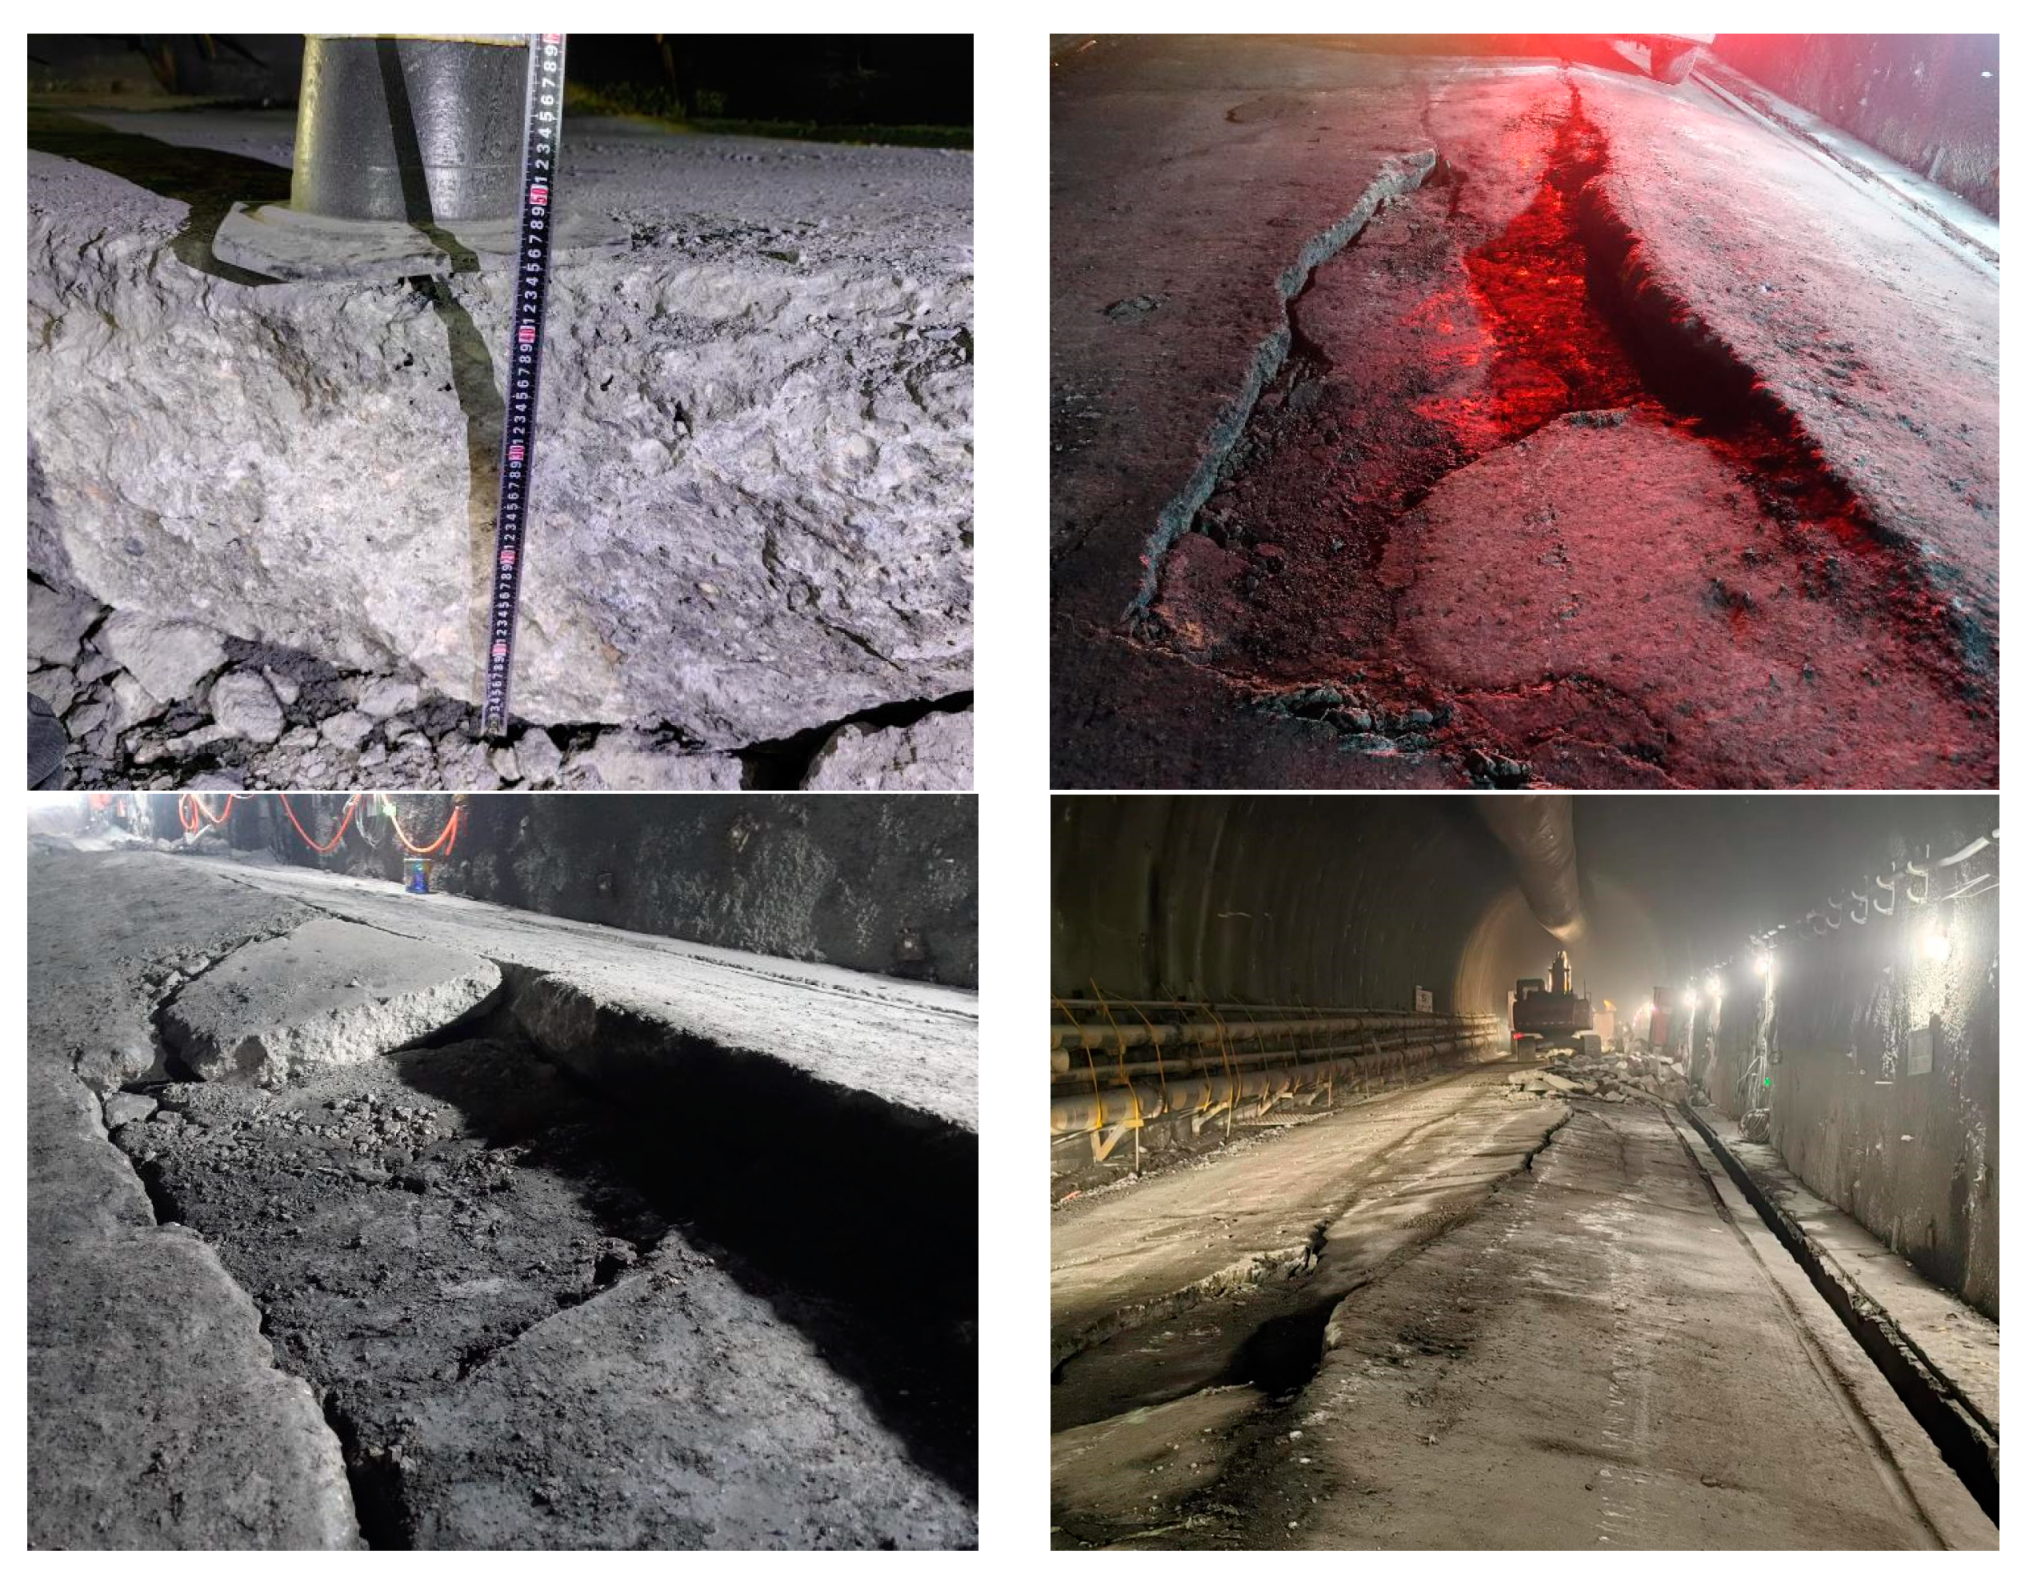
5.2. Analysis of Tunnel Bottom Structure Damage

Through the investigation and analysis of tunnel diseases, the span of the inverted arch uplift section of the steep rock tunnel K1 + 163~K1 + 236 is 73 m, and the buried depth is about 100 m. The surrounding rock is distributed in vertical joints, with the characteristics of a steep dip angle and thin layer. Therefore, this section is selected as a representative case of tunnel floor heave simulation. The deformation law of surrounding rock in the process of tunnel floor heave under different joint directions (vertical, 45°, and horizontal) is analyzed. (The modeling process and parameter selection follow the same approach as outlined in Section 4.1).
When the joint is vertical, as shown in Figure 31, there are two vertical cracks in the basement of the tunnel, and the uplift deformation of the basement is concentrated between the two cracks, which is similar to the pumping failure, and the direction is opposite. The existence of these two cracks causes a large uplift deformation of the surrounding rock of the basement and leads to the destruction of the initial support at the foot of the inverted arch, resulting in greater uplift deformation. A large range of non-conducting cracks are produced in the surrounding rock in the 45 degree direction of the arch. With the occurrence of deformation, the vault may also produce vertical cracks upward and will lead to existing cracks, resulting in a large range of sudden vault caving. When the joint is 45 degrees, as shown in Figure 32, the surrounding rock of the vault and the base is not damaged, and the vertical deformation distribution is normal. When the joint is horizontal, as shown in Figure 33, there are also two non-vertical cracks in the surrounding rock of the basement. Although there is a trend towards arch failure, the deformation is not large, and floor heave has not been initiated.
According to the deformation characteristics of surrounding rock in different joint states, it is concluded that the floor heave of the tunnel is caused by steeply inclined thin-layer surrounding rock. The research results can provide a theoretical basis for the control of tunnel deformation in similar strata.

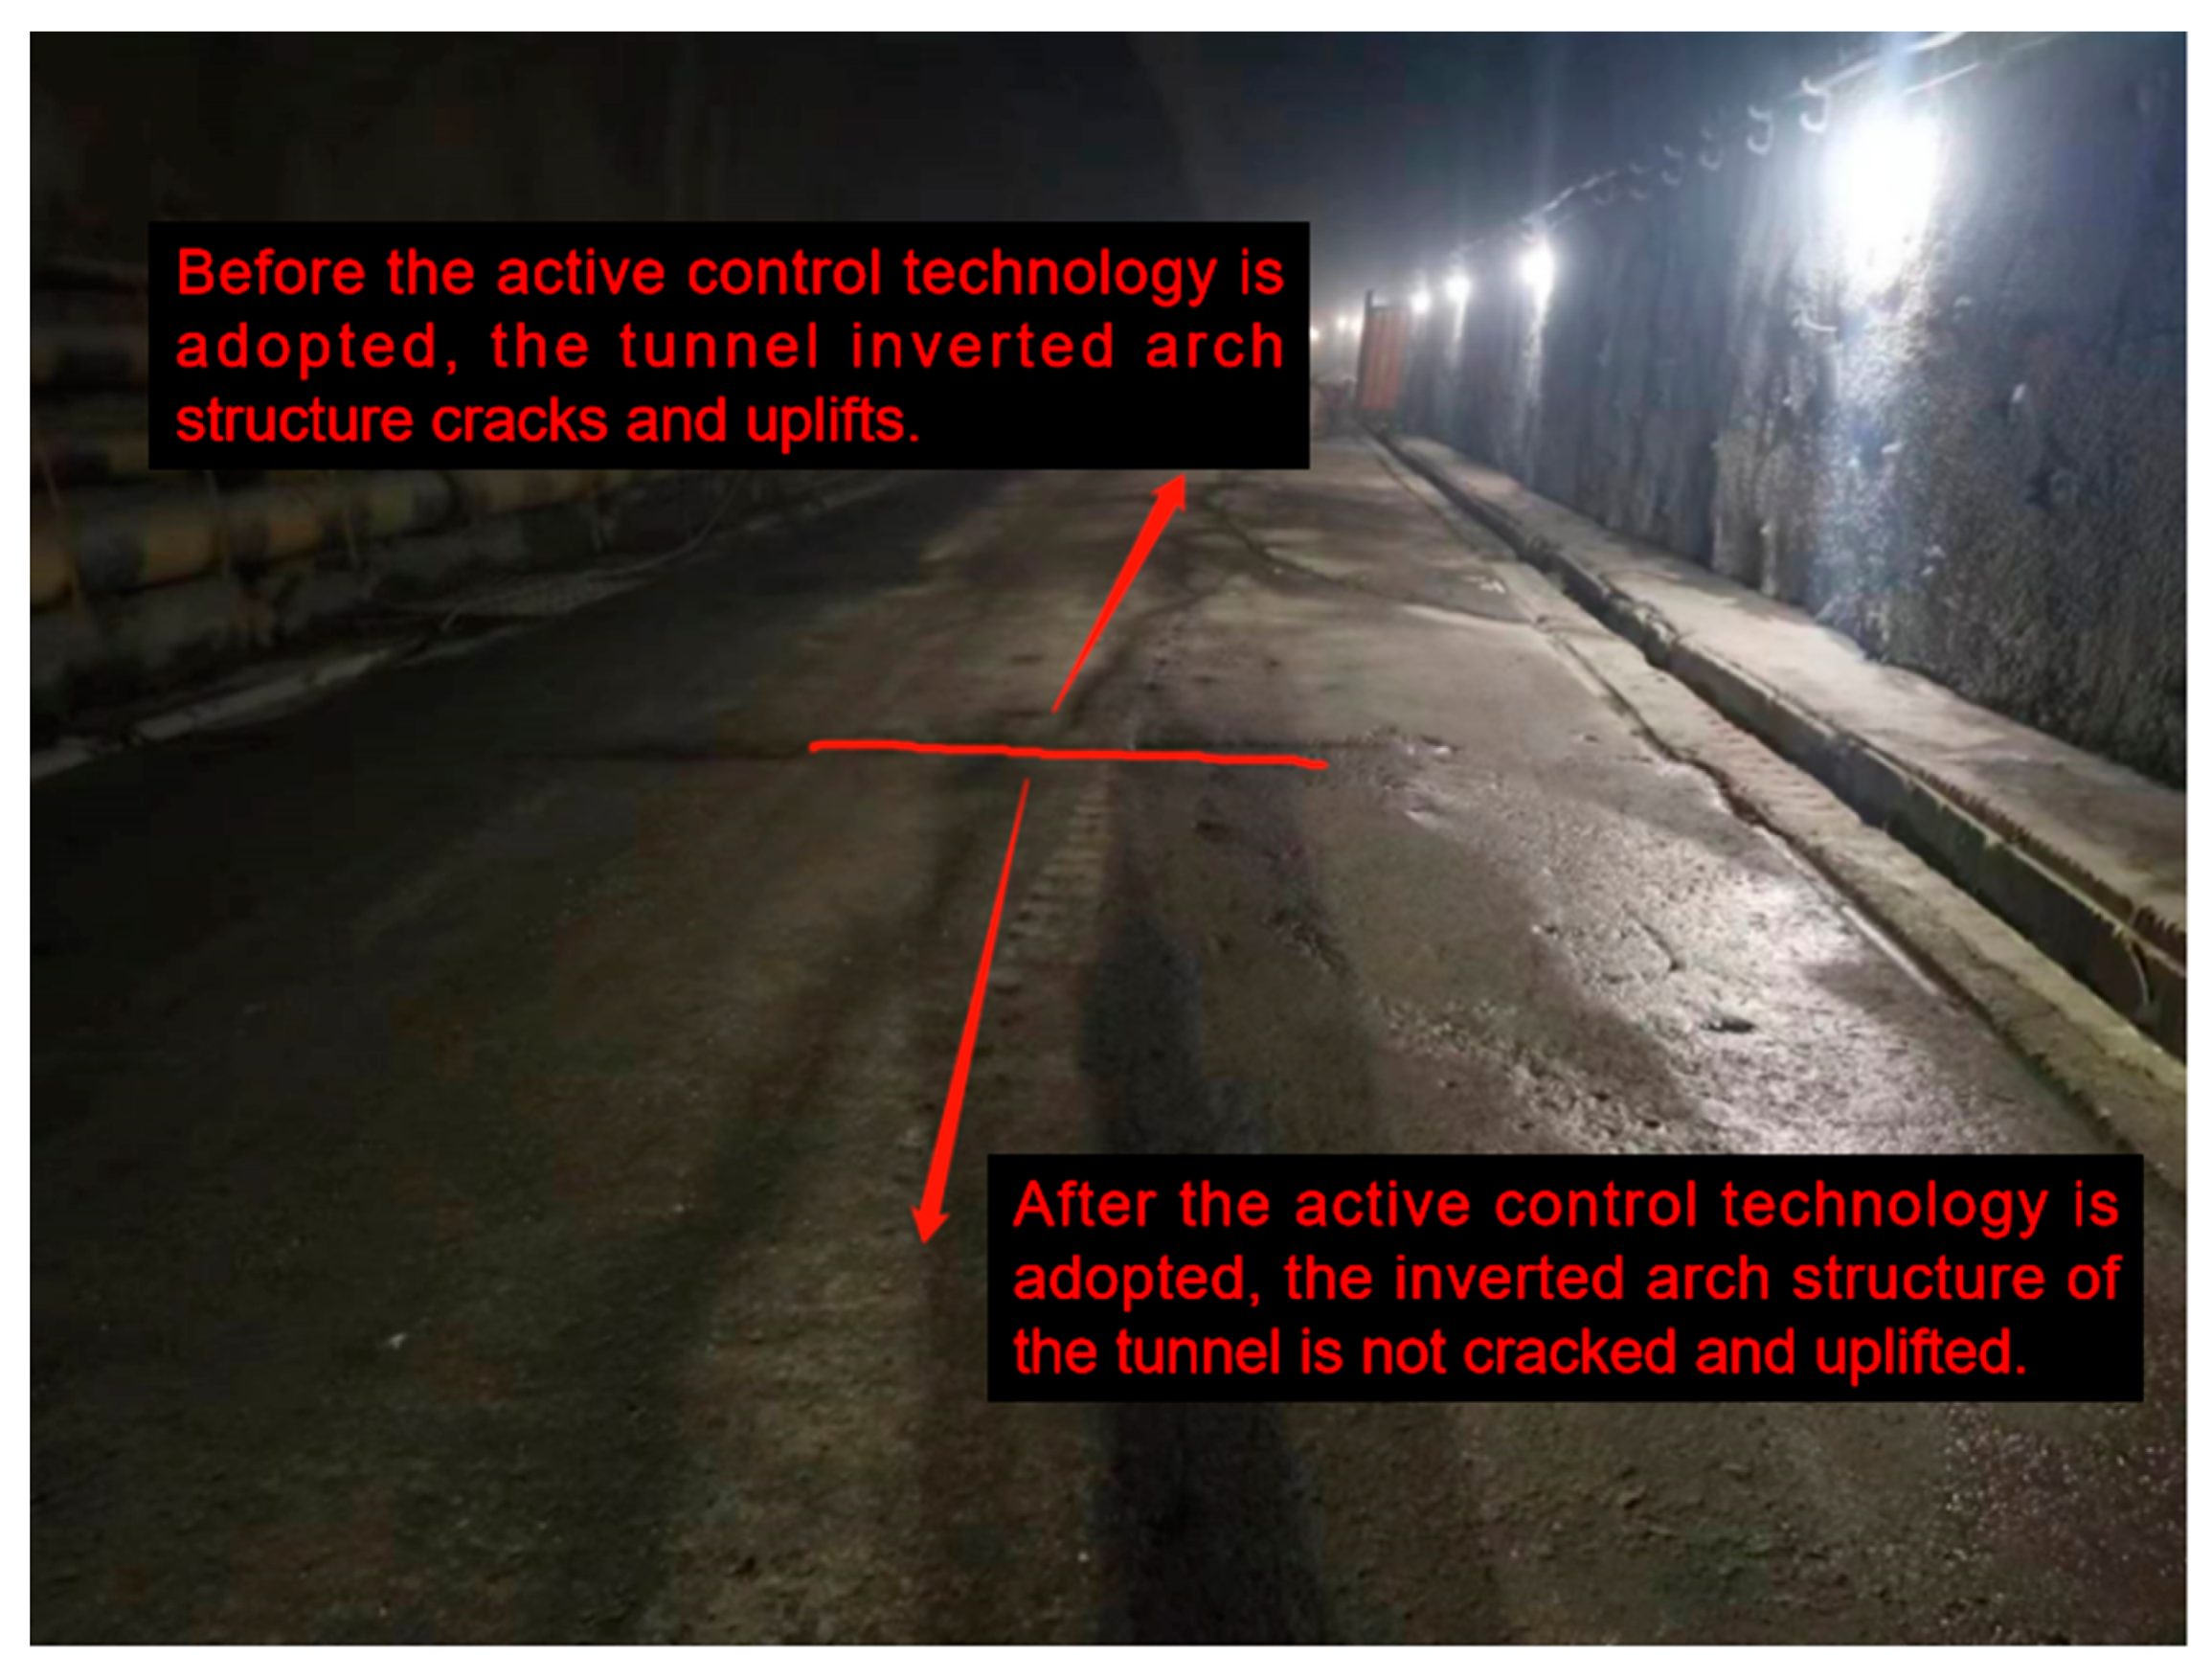
5.3. Analysis of Tunnel Bottom Structure Countermeasures

The buried depth of the tunnel is about 100 m, and the cumulative length of inverted arch uplift is 73 m. Uplift has occurred one after another and gradually developed into the situation in Figure 34.
The tunnel invert floor heave is often the result of a variety of complex factors, which are mainly summarized as the following three kinds:
(1) The shallow range is large. The final range of the surrounding rock loose circle is stable at about 8 m (as outlined in Section 3.4). A significant portion of the loose load from the surrounding rock is transferred to the lower strata, imposing a substantial burden on the lower surrounding rock and leading to its sliding instability.
(2) The inverted arch structure is not applied. In the case of steeply inclined rock masses and tunnels lacking an inverted arch structure, the bending stiffness of such large-span structures is insufficient to support the load exerted by the lower surrounding rock (floor heave force). Under the combined effects of lateral and vertical pressures at the base, the rock layers are subjected to expansion, forming bending folds that protrude toward the tunnel, leading to instability (interlayer shear dislocation and crushing of the surrounding rock result in volume expansion). The shear and compressive forces acting on the rock layers cause bending failure at the inverted arch, ultimately resulting in flexural-tensile floor heave.
(3) The locking bolt angle is too shallow and lacks sufficient design strength. The angle of the locking foot bolt is too shallow, and its design strength is inadequate. The upper structure of the tunnel transfers the surrounding rock load to the sides and lower rock strata via the arch foot, making the arch foot a critical point for reinforcement. Although a locking foot bolt has been included in this section, its shallow angle limits its ability to withstand the significant shear stress, making it prone to failure as the surrounding rock deforms. Additionally, the anchor rod at the arch foot is not sufficiently reinforced, preventing the transfer of the upper load to the deeper surrounding rock layers on either side. As a result, stress concentrations at the arch foot lead to failure, causing the loosening of the shallow surrounding rock to propagate outward.
From the three perspectives discussed above, an inverted arch structure was added to enhance the number and strength of anchor rods. Figure 35 illustrates the comparison of the tunnel bottom structure before and after treatment.

6. Conclusions

Through a series of field and laboratory tests—including point load tests, triaxial tests, and loose circle tests—the fundamental physical and mechanical properties of steep surrounding rock are investigated. The study employs a custom-developed finite element method (FEM) integrated with the volume of fluid (VOF) approach to simulate both the failure of steep surrounding rock and the tunnel floor heave. This simulation facilitates an analysis of the progressive failure process and underlying mechanisms. Based on these findings, remediation measures are proposed and implemented as follows:
(1) Relative to uniform surrounding rock, the failure zone in steeply inclined, thin-layered soft rock tunnels experiences accelerated deformation rates. This is particularly evident with high lateral pressure coefficients, where the initial failure zone expands rapidly, stabilizes within a certain range, and subsequently leads to gradual damage within the surrounding rock.
(2) The surface deformation of the tunnel’s sidewall correlates closely with the location of the failure zone within the surrounding rock, which can be inferred through surface displacement measurements. For instance, with a lateral pressure coefficient of 0.5, a 4 cm surface displacement corresponds to a failure zone beginning at 2 m. At 8 cm displacement, the failure zone extends to 5 m and stabilizes thereafter. During initial deformation stages, the failure circle expands rapidly; for example, at 3 cm surface deformation, the failure circle extends to 6 m, with subsequent slower changes. Comparative numerical simulations indicate that the tunnel floor heave is caused by steeply dipping thin surrounding rock.
(3) The results of field tests and numerical simulations show that the key factors causing the floor heave of steeply inclined tunnels are the following: large buried range, no inverted arch structure, low angle of locking bolt, and insufficient design strength. Solving the shallow instability includes strengthening advanced support, controlling early surrounding rock deformation, lengthening the anchor rod, and adopting self-propelled anchor rod construction technology to ensure that the anchor rod can play an effective role. To improve the stiffness of the bottom structure, it is necessary to increase the inverted arch structure and adjust the angle of the bolt and improve its design strength.
(4) Future research should focus on the following three areas:
Integration of Artificial Intelligence and Geomechanics Models: Advancing the integration of artificial intelligence (AI) with geomechanics models is vital for developing more accurate and reliable prediction tools in tunnel engineering. Early implementation of AI-driven models for predicting large deformations in steep rock tunnel structures is essential for achieving successful applications. This integration promises to enhance prediction precision and operational effectiveness.
Large-Scale Model Tests: Conducting large-scale model tests is necessary to understand the progressive failure mechanisms of tunnel inverts within steeply inclined thin rock masses. These tests, when combined with the mechanical models discussed in this paper, will provide valuable insights into the failure processes. This approach will elucidate the disaster mechanisms involved and improve our understanding of the conditions leading to structural failures.
Enhancing On-Site Monitoring and Classification Methods: Ongoing on-site monitoring should be continued, and in combination with this study’s findings, a refined classification and grading system for tunnel floor heave should be developed.

Author Contributions

Conceptualization, R.F. and T.C.; Methodology, R.F.; Software, X.Y.; Validation, R.F., T.C., X.Y., G.W., M.L. and S.W.; Formal analysis, G.W.; Writing—original draft, R.F.; Writing—review & editing, T.C., X.Y., G.W. and M.L.; Visualization, S.W.; Supervision, T.C.; Project administration, R.F. All authors have read and agreed to the published version of the manuscript.

Funding

This research received no external funding.

Institutional Review Board Statement

Not applicable.

Informed Consent Statement

Not applicable.

Data Availability Statement

The original contributions presented in the study are included in the article, further inquiries can be directed to the corresponding author.

Conflicts of Interest

The authors declare no conflict of interest.

References

  1. Meng, L.; Li, T.; Jiang, Y.; Wang, R.; Li, Y. Characteristics and mechanisms of large deformation in the Zhegu mountain tunnel on the Sichuan–Tibet highway. Tunn. Undergr. Space Technol. 2013, 37, 157–164. [Google Scholar] [CrossRef]
  2. Chen, J.; Tian, C.; Luo, Y.; Li, Y.; Liu, W.; Chen, H.; Zhu, H. Deformation behavior and damage characteristics of surface buildings induced by undercrossing of shallow large-section loess tunnels. Eng. Fail. Anal. 2024, 162, 108422. [Google Scholar] [CrossRef]
  3. Bao, H.; Liu, C.; Liang, N.; Lan, H.; Yan, C.; Xu, X. Analysis of large deformation of deep-buried brittle rock tunnel in strong tectonic active area based on macro and microcrack evolution. Eng. Fail. Anal. 2022, 138, 106351. [Google Scholar] [CrossRef]
  4. Xu, C.; Xia, C. A new large strain approach for predicting tunnel deformation in strain-softening rock mass based on the generalized Zhang-Zhu strength criterion. Int. J. Rock. Mech. Min. Sci. 2021, 143, 104786. [Google Scholar] [CrossRef]
  5. Wu, K.; Zheng, X.; Zhao, N.; Shao, Z. Effect of compressible layer on time-dependent behavior of soft-rock large deformation tunnels revealed by mathematical analytical method. Appl. Math. Model. 2024, 126, 457–481. [Google Scholar] [CrossRef]
  6. Jia, R.; Zheng, G.; Jiang, Y. The effect of clay structure formed during deposition on the ground deformation induced by shield tunneling. Tunn. Undergr. Space Technol. 2024, 147, 105689. [Google Scholar] [CrossRef]
  7. He, H.; Wang, S.; Shen, W.; Zhang, W. The influence of pipe-jacking tunneling on deformation of existing tunnels in soft soils and the effectiveness of protection measures. Transp. Geotech. 2023, 42, 101061. [Google Scholar] [CrossRef]
  8. Tian, Y.; Shu, X.; Tian, H.; He, L.; Jin, Y.; Huang, M. Effect of horizontal stress on the mesoscopic deformation and failure mechanism of layered surrounding rock masses in tunnels. Eng. Fail. Anal. 2023, 148, 107226. [Google Scholar] [CrossRef]
  9. Hong, J.; Huang, X.; Chen, R.; Zhang, Y.; Lu, J.; Zhou, F. Investigating on the longitudinal seismic response and deformation mechanism of a long tunnel under the combined action of the traveling wave effect and mutation of the soil layer. Structures 2024, 63, 106377. [Google Scholar] [CrossRef]
  10. Wu, F.; Sheng, W.; Zhang, G.; Li, H.; Ren, Y.; Zhang, K.; Wang, C.; Sun, T. Research on the deformation and settlement characteristics of tunnel lining structures under repeated loads. Structures 2024, 63, 106366. [Google Scholar] [CrossRef]
  11. Zhang, B.; Tao, Z.; Guo, P.; Yang, K.; Yang, Y. Model test on deformation and failure mechanism of tunnel support with layered rock mass under high ground stress. Eng. Fail. Anal. 2023, 150, 107296. [Google Scholar] [CrossRef]
  12. Yang, S.-Q.; Tao, Y.; Xu, P.; Chen, M. Large-scale model experiment and numerical simulation on convergence deformation of tunnel excavating in composite strata. Tunn. Undergr. Space Technol. 2019, 94, 103133. [Google Scholar] [CrossRef]
  13. Ma, M.; Yang, X.; Zhou, J.; Li, L.; Tian, J. Model tests and numerical simulations of deformation repair effect for operating shield tunnels under horizontal lateral grouting. Transp. Geotech. 2024, 47, 101277. [Google Scholar] [CrossRef]
  14. Du, X.; Li, Y.; Dong, X.; Han, K. Large deformation induced soil pressure changes in a loess tunnel. Eng. Fail. Anal. 2024, 163, 108568. [Google Scholar] [CrossRef]
  15. Tian, H.; Chen, W.; Tan, X.; Shu, X. Failure of rigid support and yielding support solution in large deformation tunnels: A case study. Eng. Fail. Anal. 2022, 140, 106598. [Google Scholar] [CrossRef]
  16. Yu, W.; Luo, X.; Wang, B.; Liu, J.; Zi, X. Design approaches for active prestressed and prestressed yielding anchorage systems in large deformation traffic tunnels. Tunn. Undergr. Space Technol. 2024, 152, 105942. [Google Scholar] [CrossRef]
  17. Liu, Y.; Song, H.L.; Sun, X.D.; Xing, H.P.; Feng, C.Y.; Liu, J.F.; Zhao, G.T. Characteristics of rail deformation caused by tunnel floor heave and corresponding running risk of high-speed train. Constr. Build. Mater. 2022, 346, 128385. [Google Scholar] [CrossRef]
  18. Wang, C.; Zhang, D.; Tan, D.; Ye, J.; Wang, X.; Wang, C.; Li, Q. Study on the evolution of limestone damage and permeability under the tunnel driving stress path. Constr. Build. Mater. 2024, 425, 136050. [Google Scholar] [CrossRef]
  19. Wu, K.; Shao, Z.; Qin, S. A solution for squeezing deformation control in tunnels using foamed concrete: A review. Constr. Build. Mater. 2020, 257, 119539. [Google Scholar] [CrossRef]
  20. Zhang, X.; Broere, W. Monitoring seasonal deformation behavior of an immersed tunnel with distributed optical fiber sensors. Measurement 2023, 219, 113268. [Google Scholar] [CrossRef]
  21. Zhu, A. A novel high-precision photogrammetric technique for monitoring subway tunnel deformation. Structures 2023, 55, 2217–2231. [Google Scholar] [CrossRef]
  22. Zheng, G.; Zhen, J.; Cheng, X.; Du, Y.; Yu, D.; Song, X. Basal heave stability analysis of excavations considering the soil strength increasing with depth. Comput. Geotech. 2024, 166, 106026. [Google Scholar] [CrossRef]
  23. Ma, K.; Zhang, J.; Zhang, J.; Dai, Y.; Zhou, P. Floor heave failure mechanism of large-section tunnels in sandstone with shale stratum after construction: A case study. Eng. Fail. Anal. 2022, 140, 106497. [Google Scholar] [CrossRef]
  24. Ou, X.-F.; Ouyang, L.-X.; Xu, X.-X.; Wang, L. Case study on floor heave failure of highway tunnels in gently inclined coal seam. Eng. Fail. Anal. 2022, 136, 106224. [Google Scholar] [CrossRef]
  25. Feng, J.; Gong, L.; Wang, L.; Zhou, P.; Zhang, P.; Li, Y.; Liu, Z. Study on failure mechanism and treatment measures of floor heave of high-speed railway tunnel in the interbedded surrounding rock with high geostress. Eng. Fail. Anal. 2023, 150, 107365. [Google Scholar] [CrossRef]
  26. Li, Z.X.; Fujii, Y.; Alam, A.K.M.B.; Li, Z.H.; Du, F.; Wei, W.J. Implementing a simple 2D constitutive model for rocks into finite element method. Comput. Geotech. 2024, 167, 106095. [Google Scholar] [CrossRef]
  27. Mo, S.; Sheffield, P.; Corbett, P.; Ramandi, H.L.; Oh, J.; Canbulat, I.; Saydam, S. A numerical investigation into floor buckling mechanisms in underground coal mine roadways. Tunn. Undergr. Space Technol. 2020, 103, 103497. [Google Scholar] [CrossRef]
  28. Wang, W.; Gao, X.; Ding, Z.; Ma, H.; Ren, J.; Liu, Z. Fracture characteristic and support effect around deep lined tunnels using CGP-FDEM simulation and field investigation analysis. Eng. Anal. Bound. Elem. 2024, 161, 29–47. [Google Scholar] [CrossRef]
  29. Chen, Z.; Zhuang, D.; Yu, B.; Ning, Z.; Zhan, H.; He, C. Seepage interaction mechanism of crossing tunnels and existing tunnels: Model test and numerical analysis. Transp. Geotech. 2024, 46, 101269. [Google Scholar] [CrossRef]
  30. Ruiz-Gutiérrez, É.; Hasslberger, J.; Klein, M.; Dalgarno, K.; Chakraborty, N. Physically consistent modelling of surface tension forces in the Volume-of-Fluid method for three or more phases. J. Comput. Phys. 2024, 513, 113149. [Google Scholar] [CrossRef]
  31. Ni, W.; Zeng, Q.; Ruan, Y.; He, Z. A novel steepness-adjustable harmonic volume-of-fluid method for interface capturing. J. Comput. Phys. 2024, 501, 112765. [Google Scholar] [CrossRef]
  32. Sabooniha, E.; Nick, H.M. Pore-scale investigation of injectivity impairment caused by oil droplets during produced water reinjection using volume of fluid method. J. Mol. Liq. 2024, 411, 125686. [Google Scholar] [CrossRef]
  33. Wu, L. Theory of Plates and Shells; Shanghai Jiao Tong University Press: Shanghai, China, 1989. [Google Scholar]
Figure 1. Geographic location map of the tunnel.
Applsci 14 08341 g001
Figure 2. Design schematic diagram of tunnel support parameters (units: cm).
Applsci 14 08341 g002
Figure 3. Typical rock strata of tunnel face.
Applsci 14 08341 g003
Figure 4. Mirror phenomenon between carbonaceous slates.
Applsci 14 08341 g004
Figure 5. Four typical faults in point loading test.
Applsci 14 08341 g005
Figure 6. Triaxial test process diagram.
Applsci 14 08341 g006
Figure 7. Creep strain–time and stress–strain curves of slate under different loading angles.
Applsci 14 08341 g007aApplsci 14 08341 g007b
Figure 8. Diagram of the surrounding rock strength with changes in the β angle when ω = 0.
Applsci 14 08341 g008
Figure 9. Meaning model of parameters of layered surrounding rock considering loading angle.
Applsci 14 08341 g009
Figure 10. Schematic diagram of the buried force sensor.
Applsci 14 08341 g010
Figure 11. K1 + 163 tunnel pressure deformation curve.
Applsci 14 08341 g011
Figure 12. K1 + 236 tunnel pressure deformation curve.
Applsci 14 08341 g012
Figure 13. The spectrum diagram of the stable area of the hole (spacing 1.0 m).
Applsci 14 08341 g013
Figure 14. The dispersion curve of the stable area of the hole (spacing 1.0 m).
Applsci 14 08341 g014
Figure 15. Numerical simulation model diagram.
Applsci 14 08341 g015
Figure 16. Tunnel surrounding rock failure evolution process (buried depth 100 m, K0 = 0.5). (at) represents the destructive characteristics at different stages.
Applsci 14 08341 g016
Figure 17. Tunnel surrounding rock failure evolution process (buried depth 100 m, K0 = 1.25). (at) represents the destructive characteristics at different stages.
Applsci 14 08341 g017aApplsci 14 08341 g017b
Figure 18. Monitoring point layout diagram.
Applsci 14 08341 g018
Figure 19. Hand face and geological sketch photos.
Applsci 14 08341 g019
Figure 20. Real shots of the scene. (ah) represents the failure of surrounding rock from different perspectives.
Applsci 14 08341 g020aApplsci 14 08341 g020b
Figure 21. Deformation process curve (buried depth of 100 m, K0 = 0.5).
Applsci 14 08341 g021
Figure 22. The position of deformation propagation.
Applsci 14 08341 g022
Figure 23. Deformation process curve—buried depth of 100 m, K0 = 1.25.
Applsci 14 08341 g023
Figure 24. The location of the left failure circle on the left side—100 m buried depth, K0 = 0.5.
Applsci 14 08341 g024
Figure 25. The right side of the damage circle position—depth 100 m, K0 = 0.5.
Applsci 14 08341 g025
Figure 26. Failure circle location—depth 100 m, K0 = 0.5 (the average value of upper, middle and lower deformation).
Applsci 14 08341 g026
Figure 27. Left failure circle location—depth 100 m, K0 = 1.25.
Applsci 14 08341 g027
Figure 28. The right side of the damage circle location—depth 100 m, K0 = 1.25.
Applsci 14 08341 g028
Figure 29. Tunnel floor heave model diagram. (a) Squeezed flow model of tunnel floor heave. (b) Water swelling model of tunnel floor heave. (c) Shear-staggered model of tunnel floor heave. (d) An upper arch model of tunnel bottom with flexural folds.
Applsci 14 08341 g029
Figure 30. Mechanical model of bulking damage of invert.
Applsci 14 08341 g030
Figure 31. Joint vertical.
Applsci 14 08341 g031
Figure 32. Joint 45 degrees.
Applsci 14 08341 g032
Figure 33. Joint level.
Applsci 14 08341 g033
Figure 34. Bottom heave of tunnel.
Applsci 14 08341 g034
Figure 35. Comparison diagram of tunnel inverted arch before and after renovation.
Applsci 14 08341 g035
Table 1. Point load test results.
Serial NumberP
Breaking Load (N)
Is(50)
Point Load Strength of Standard Specimens (MPa)
Rc
Uniaxial Compression Strength of Rock (MPa)
12720.104.0
21780.031.60
31920.052.25
41300.052.49
52460.083.26
61620.0843.57
7000
89720.278.58
9000
109580.124.53
11000
124720.186.27
137020.217.09
1420.0010.09
156180.267.45
162360.723.17
174320.37010.83
182900.103.92
192260.196.46
20000
Table 2. Physical and mechanical parameter values of surrounding rock.
Surrounding Rock ClassificationVolumetric Weight/(kN/m3)E/(GPa)Poisson RatioAngle of Internal Friction/(°)Cohesion/(MPa)
Va191.650.37240.16
Table 3. Physical and mechanical parameter values of fluid.
Density/(kg/m3)Viscosity/(Pa·s)Inflow/(m3/s)Initial Pressure/(kPa)
10000.0010.00249.05
Disclaimer/Publisher’s Note: The statements, opinions and data contained in all publications are solely those of the individual author(s) and contributor(s) and not of MDPI and/or the editor(s). MDPI and/or the editor(s) disclaim responsibility for any injury to people or property resulting from any ideas, methods, instructions or products referred to in the content.

