1. Introduction
The condition monitoring and fault diagnosis of rotary components remains a crucial area of research within the scientific community. The ability to accurately assess the health of these components is essential for ensuring operational reliability, preventing catastrophic failures, and minimizing downtime in industrial processes [
1,
2,
3].
Vibration and acoustic signals emitted by mechanical components offer a rich source of information about their health status. These signals contain valuable clues about the internal condition of the component, including wear, damage, or impending failure. The presence of specific frequency components in these signals can be directly linked to specific faults within the component [
4,
5,
6].
Vibration-based techniques have emerged as a powerful tool for fault diagnosis in rotating machinery [
7,
8,
9]. These techniques leverage the relationship between the frequencies present in the vibration signal and the corresponding faults within the machine. Spectral analysis of the vibration signal is a fundamental approach for extracting this crucial information [
10]. For instance, Sepulveda and Sinha [
11] successfully demonstrated the viability of a two-step artificial neural network approach for condition monitoring and fault diagnosis in rotating machinery. This approach has the potential to significantly improve operational efficiency by enabling proactive maintenance and minimizing costly downtime caused by unexpected breakdowns. Almutairi et al. [
12] presented a compelling approach to vibration-based fault detection in rotating machinery, demonstrating the effectiveness of integrating the poly-coherent composite spectrum (pCCS) with machine learning techniques. By effectively condensing multi-location vibration data into a single spectrum, pCCS significantly reduces the computational burden associated with large datasets, while preserving critical amplitude and phase information. Bendjama [
13] presented a novel and effective feature extraction method for enhancing the accuracy of rolling bearing fault diagnosis under time-varying operating conditions. By combining the complementary ensemble empirical mode decomposition (CEEMD), Teager–Kaiser energy operator (TKEO), and self-organizing map (SOM), the proposed approach effectively removes unwanted noise components and extracts relevant bearing characteristics from the vibration signal. Tahmasbi et al. [
14] demonstrated the successful diagnosis and root cause analysis of bearing failure in a 2300 kW motor, highlighting the importance of a comprehensive approach that considers both vibration and lubrication factors.
However, the conventional approach provides a robust framework for fault diagnosis in rotating machines but limitations arise from the presence of noise and the complex nature of real-world signals. Recent research focuses on developing advanced signal-processing techniques and machine learning algorithms to enhance the accuracy and efficiency of fault diagnosis in rotating machinery.
The accurate demodulation of vibration signals is crucial for extracting fault-related information. The selection of the appropriate frequency band for filtering plays a vital role in achieving this accuracy. Several techniques have been developed in recent years to effectively extract the informative frequency band. Antoni’s Spectral Kurtosis (SK) method has proven to be highly effective for detecting transient events and pinpointing their location within the frequency spectrum. Notably, SK exhibits robustness against additive stationary noise. This technique provides a valuable tool for isolating the relevant frequency band within the vibration signal, paving the way for more precise fault diagnosis in rotating machinery [
15,
16,
17,
18,
19]. Borghesani et al. [
20] investigated the effectiveness of cepstrum pre-whitening as a technique for enhancing rolling element-bearing diagnostics, particularly in industrial settings where heterogeneous vibration sources introduce challenges for traditional signal processing methods. The study demonstrated that cepstrum pre-whitening, with its low computational requirements and simplicity, offers a promising alternative to traditional pre-whitening techniques like linear prediction filters and spectral kurtosis. Sacerdoti et al. [
21] presented a comprehensive comparative study of signal analysis techniques for rolling element-bearing diagnostics, focusing on fault detection, diagnosis, and prognosis. The study revealed that statistical parameters like RMS, kurtosis, and detectivity are effective in detecting the onset of faults in bearings.
Antoni and Randall proposed the first systematic approach of band selection using kurtogram. The optimal central frequency
and bandwidth of the band pass filter can be determined by maximizing the kurtogram [
22]. Berrouche et al. [
23] proposed a Single Ensemble Empirical Mode Decomposition (SEEMD) method, which demonstrates a significant advancement in fault detection for rolling element bearings, particularly within the challenging context of mining industry signals. Wang et al. [
24] proposed a novel and effective method for enhancing early weak fault features in rolling element bearings by combining resonance sparse decomposition with multi-objective information frequency band selection (MIFBS). This approach effectively addresses the challenge of interference components obscuring early fault signatures in vibration signals. Hebda-Sobkowicz et al. [
25] provided a comprehensive comparative analysis of various signal-processing techniques designed to extract the signal of interest (SOI) from non-Gaussian noise in vibration signals acquired from machinery. Schmidt et al. [
26] addressed the critical challenge of identifying informative frequency bands for extracting weak damage components in vibration signals acquired from rotating machines operating under time-varying conditions. A novel framework is proposed that leverages angle-frequency instantaneous power spectrum and order-frequency cyclic modulation spectrum to construct consistent feature planes. Zhao et al. [
27] proposed a novel and effective method for early fault detection in rolling element bearings, addressing the challenge of weak fault features being masked by environmental noise. The proposed method integrates the negative entropy of the square envelope spectrum approach with optimized stochastic resonance (SR) signal enhancement. Wu et al. [
28] presented a novel approach to constructing envelope spectra for the surveillance and diagnostics of rotating machinery, addressing limitations of existing methods like narrowband demodulation and cyclo-stationary analysis. The proposed Combined Weighted Envelope Spectrum (CWES) framework is designed to extract specific characteristic frequencies, effectively mitigating challenges posed by low SNR conditions, non-Gaussian noise, and cyclo-stationary noise.
However, the current methods often struggle with non-stationary noise, common in real-world scenarios. This limits their accuracy and reliability, particularly for early fault detection. Many techniques rely on predefined or manually selected frequency bands, which may not be optimal for all fault types or operating conditions. Developing adaptive methods that automatically identify the most informative frequency bands is crucial. The existing techniques often assume stationary operating conditions, which are not representative of real-world machinery, especially in industries like wind turbines. Further research is needed to develop methods that can reliably function under time-varying conditions.
Thus, an attempt is made in this work to address these issues. In this current work, cluster-based segmentation is used to divide signals into different segments. The frequency band and their central frequencies are automatically estimated using fuzzy C-mean clustering. The informative frequency band among the different segments was selected based on a combination of maximum L-kurtosis and minimum entropy in the segments [
29]. This informative frequency band is further utilized to design a band pass filter to filter the original signal. Hilbert’s transform-based envelope spectrum is applied to demodulate the filtered signals for extraction of the fault frequency.
4. Results and Discussion
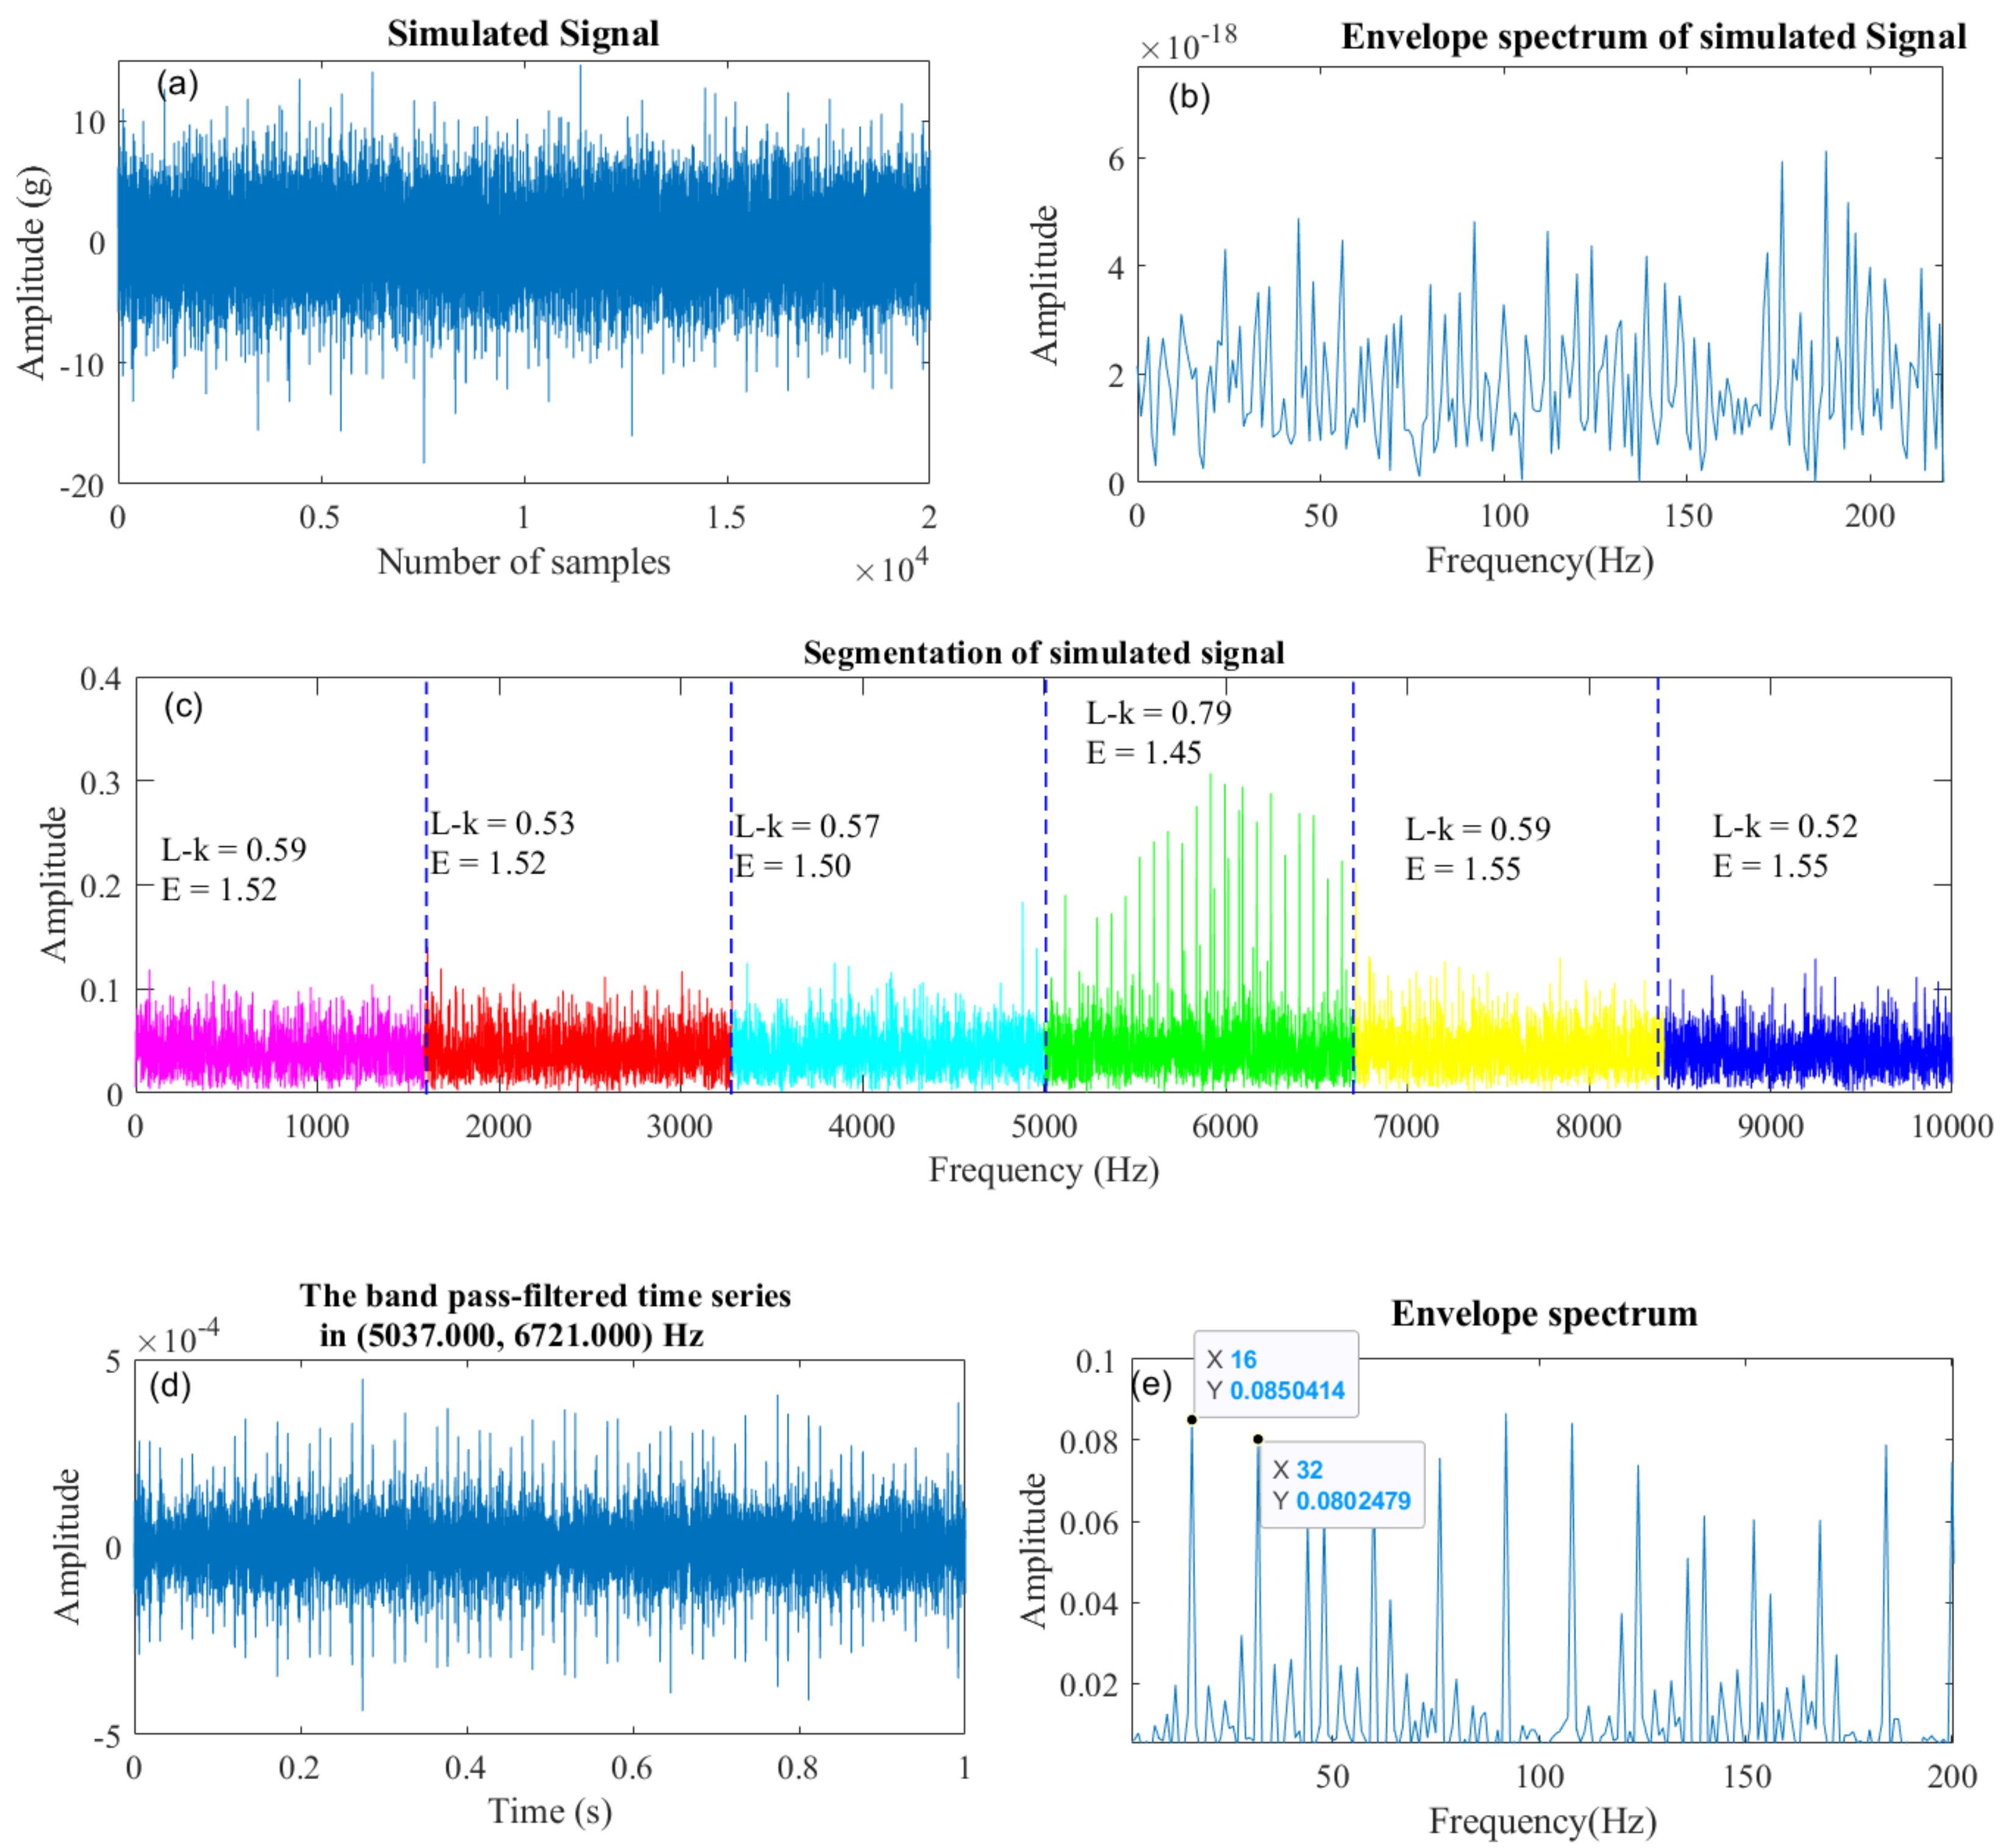
The proposed scheme was implemented in the simulated signal with a fault frequency of 16 Hz. A sampling rate of 20 kHz was considered and a white noise of signal-to-noise ratio (SNR) equal to -5 was added to the simulated signal as shown in
Figure 2a. The envelope spectrum of the simulated signal is shown in
Figure 2b, where the fault frequency of 16 Hz is not clearly visible.
The envelope spectrum of the signal was divided into six segments using FCM segmentation, as shown in
Figure 2c. The frequency band and their central frequencies are automatically estimated using fuzzy C-mean clustering. Each segment was reconstructed as a time domain signal using inverse FFT and L-kurtosis, and the entropy of each reconstructed signal was extracted. The informative frequency band among the different segments was selected based on a combination of maximum L-kurtosis and minimum entropy of the segment. This informative frequency band was further utilized to design a bandpass filter. The original signal was reconstructed using this bandpass filter, as shown in
Figure 2d. Hilbert’s transform-based envelope spectrum is applied to demodulate the filtered signals for extraction of the fault frequency, as shown in
Figure 2e, where a fault frequency of 16 Hz and its harmonics are clearly visible.
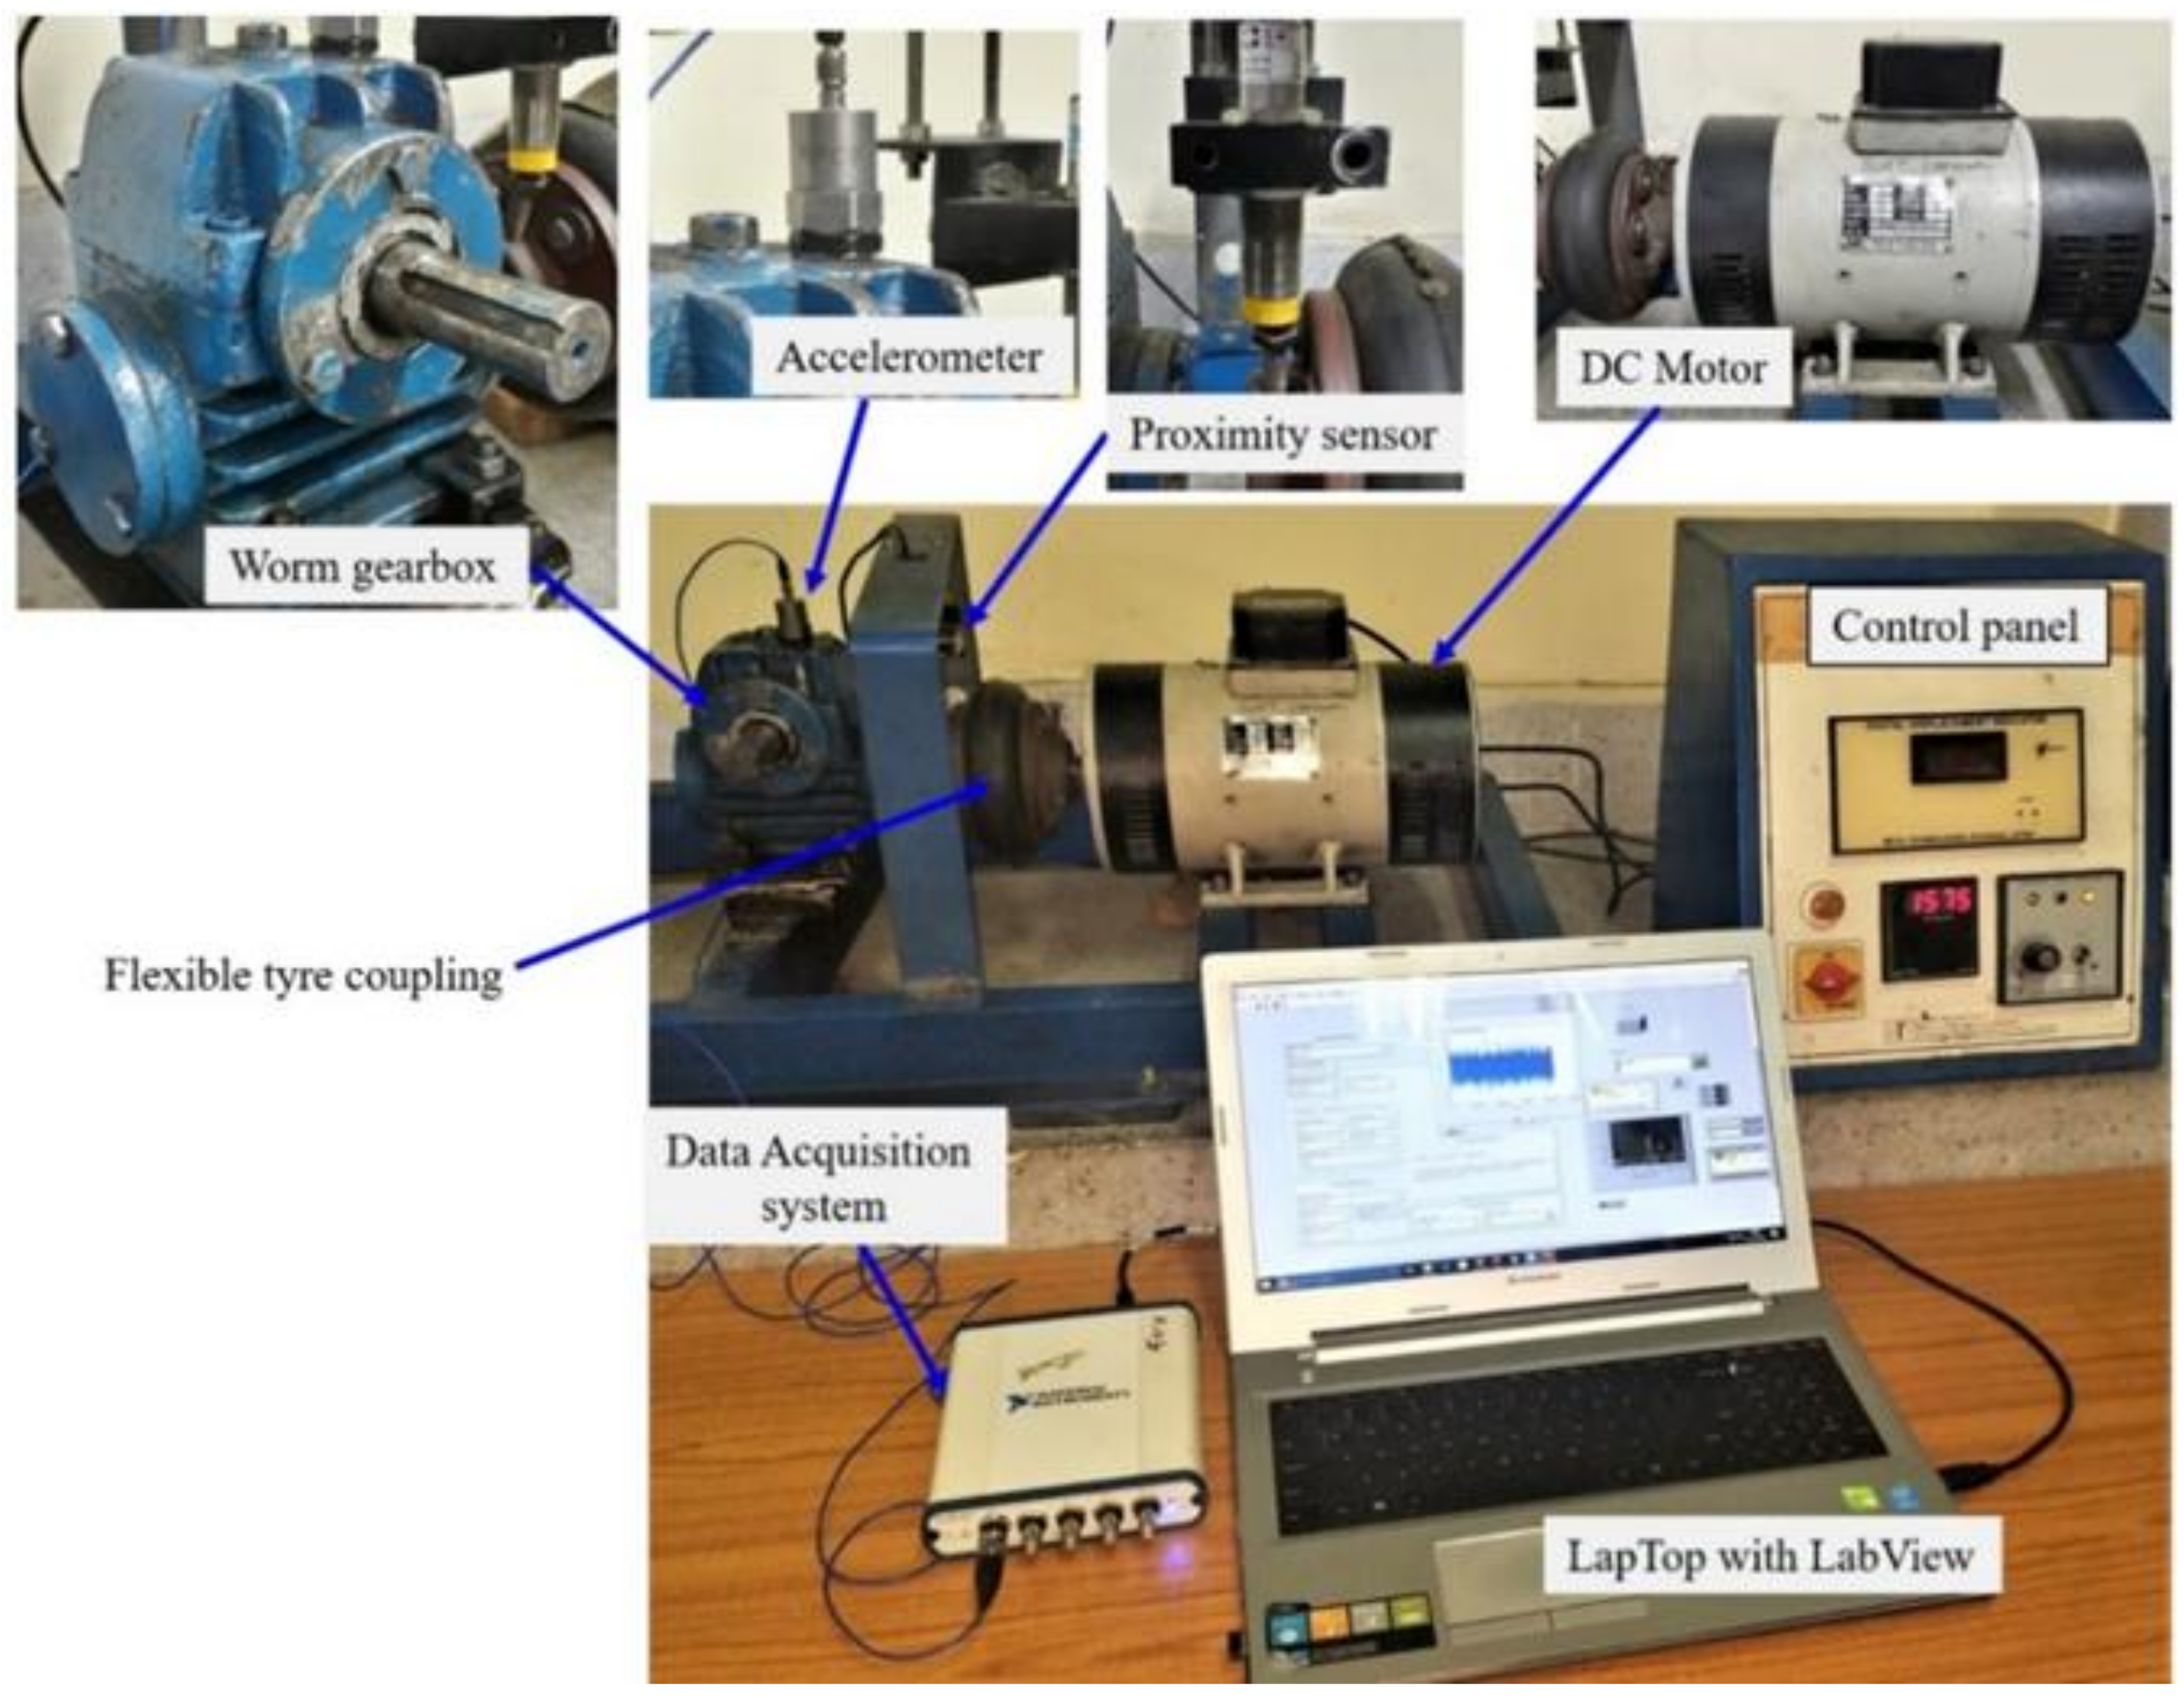
The effectiveness of the proposed scheme is further validated through its application to an experimental dataset obtained from a worm and wheel gearbox test rig (as depicted in
Figure 3). The experimental setup utilizes a single-stage worm and wheel gearbox with a 20:1 gear ratio. The wheel, featuring 20 teeth and a pitch circle diameter of 65 mm, is driven by a 50 Hz, 1 hp DC motor (WAFRO) operating at 2880 rpm. Flexible coupling ensures the smooth transmission of power between the motor shaft and the gearbox. More details of the worm gearbox are tabulated in
Table 1.
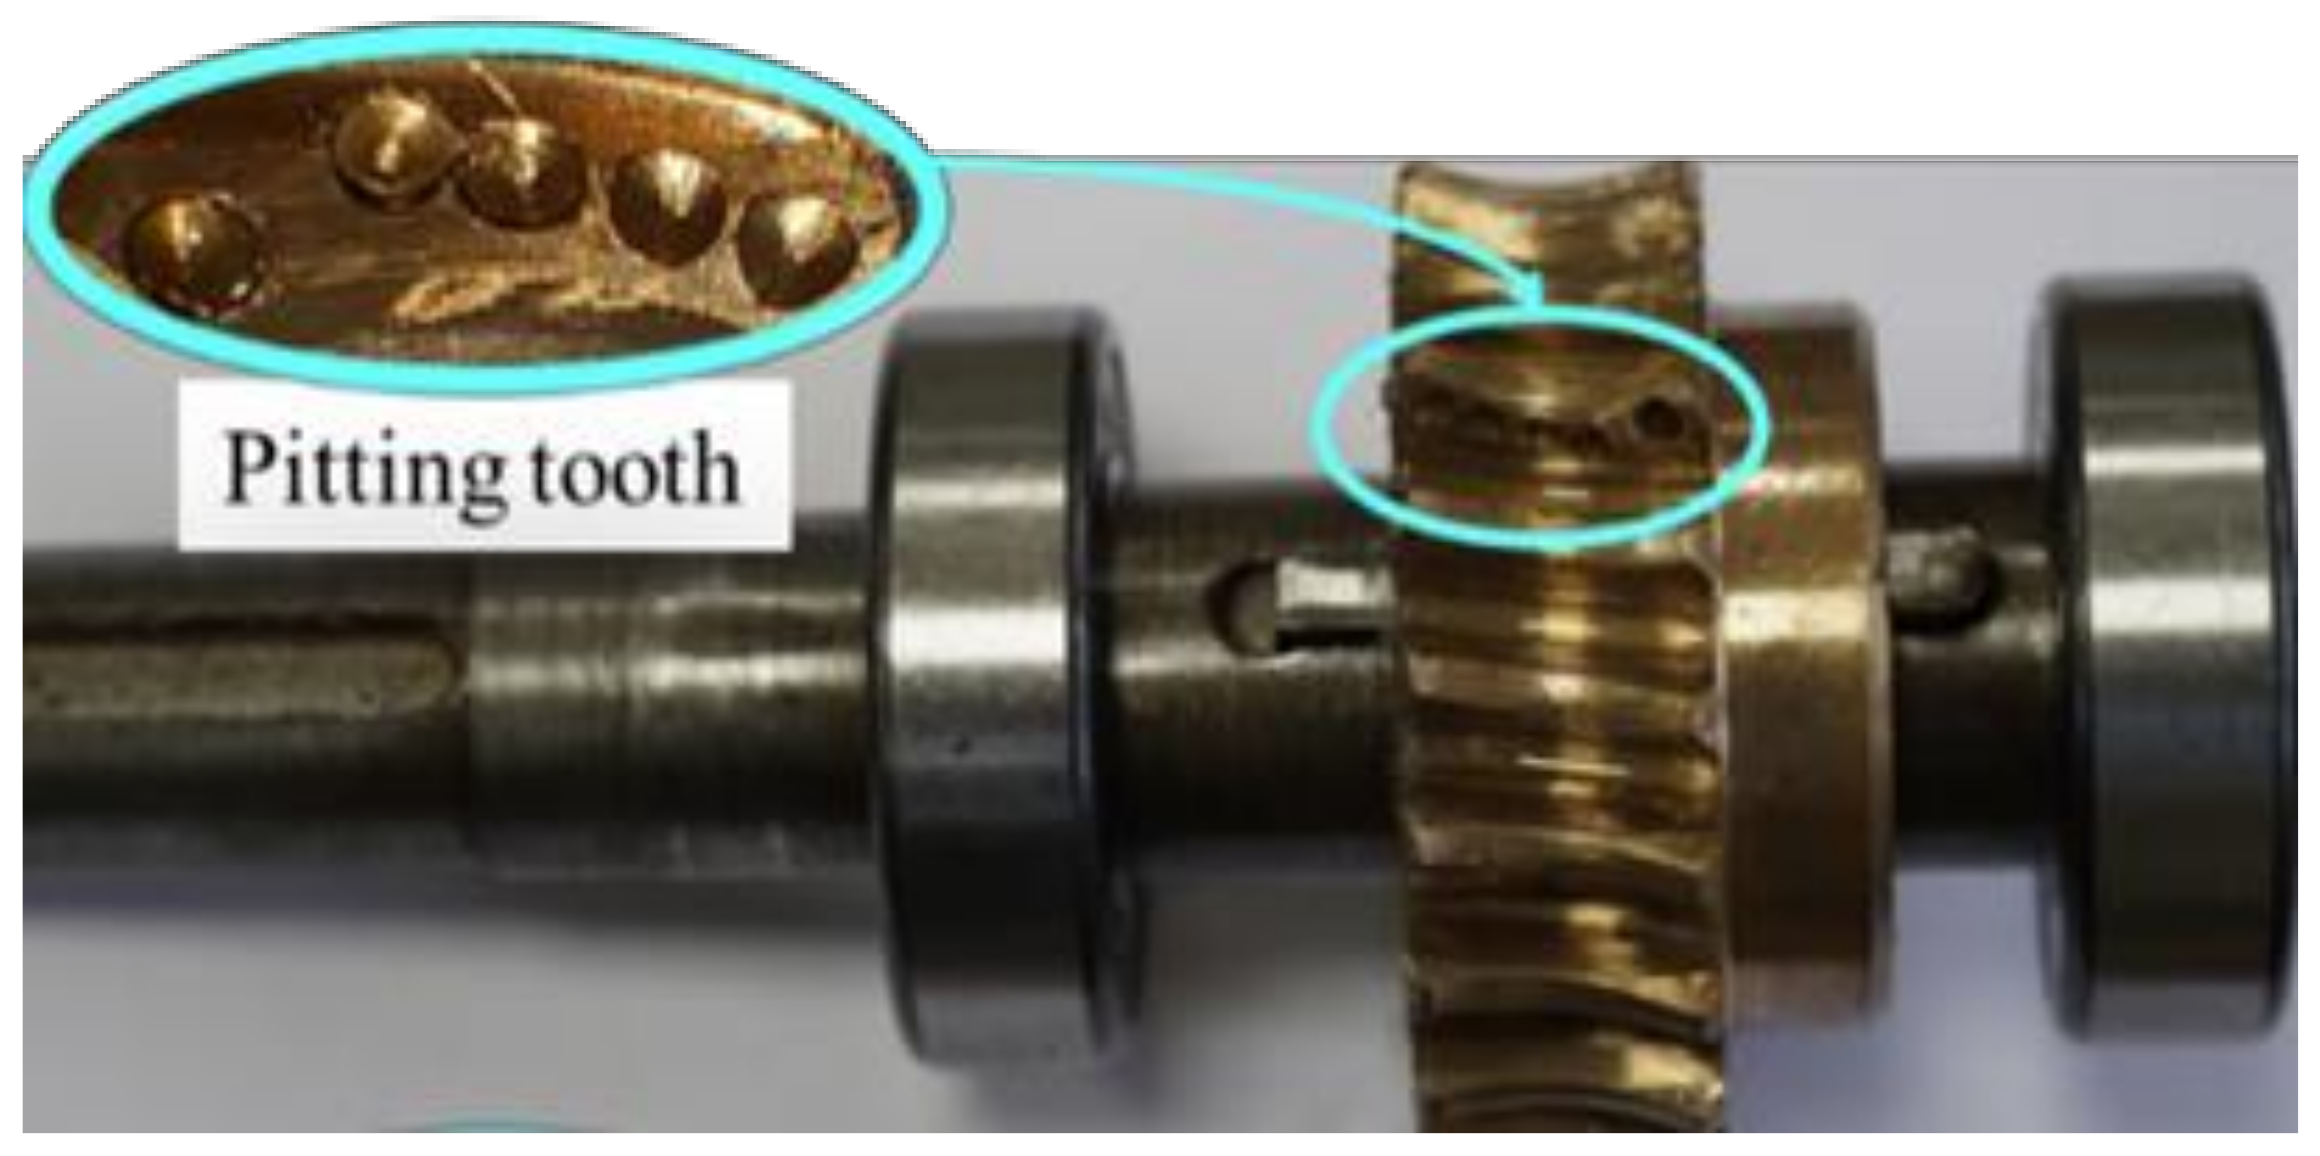
To capture vibration signals, a piezoelectric uniaxial PCB accelerometer with a sensitivity of 100 mV/g is strategically placed on the bearing seat of the wheel shaft. This accelerometer operates based on internal excitation, ensuring accurate measurement. A seeded pitting tooth fault, as illustrated in
Figure 4, is deliberately introduced on a tooth of the wheel, simulating a common failure scenario.
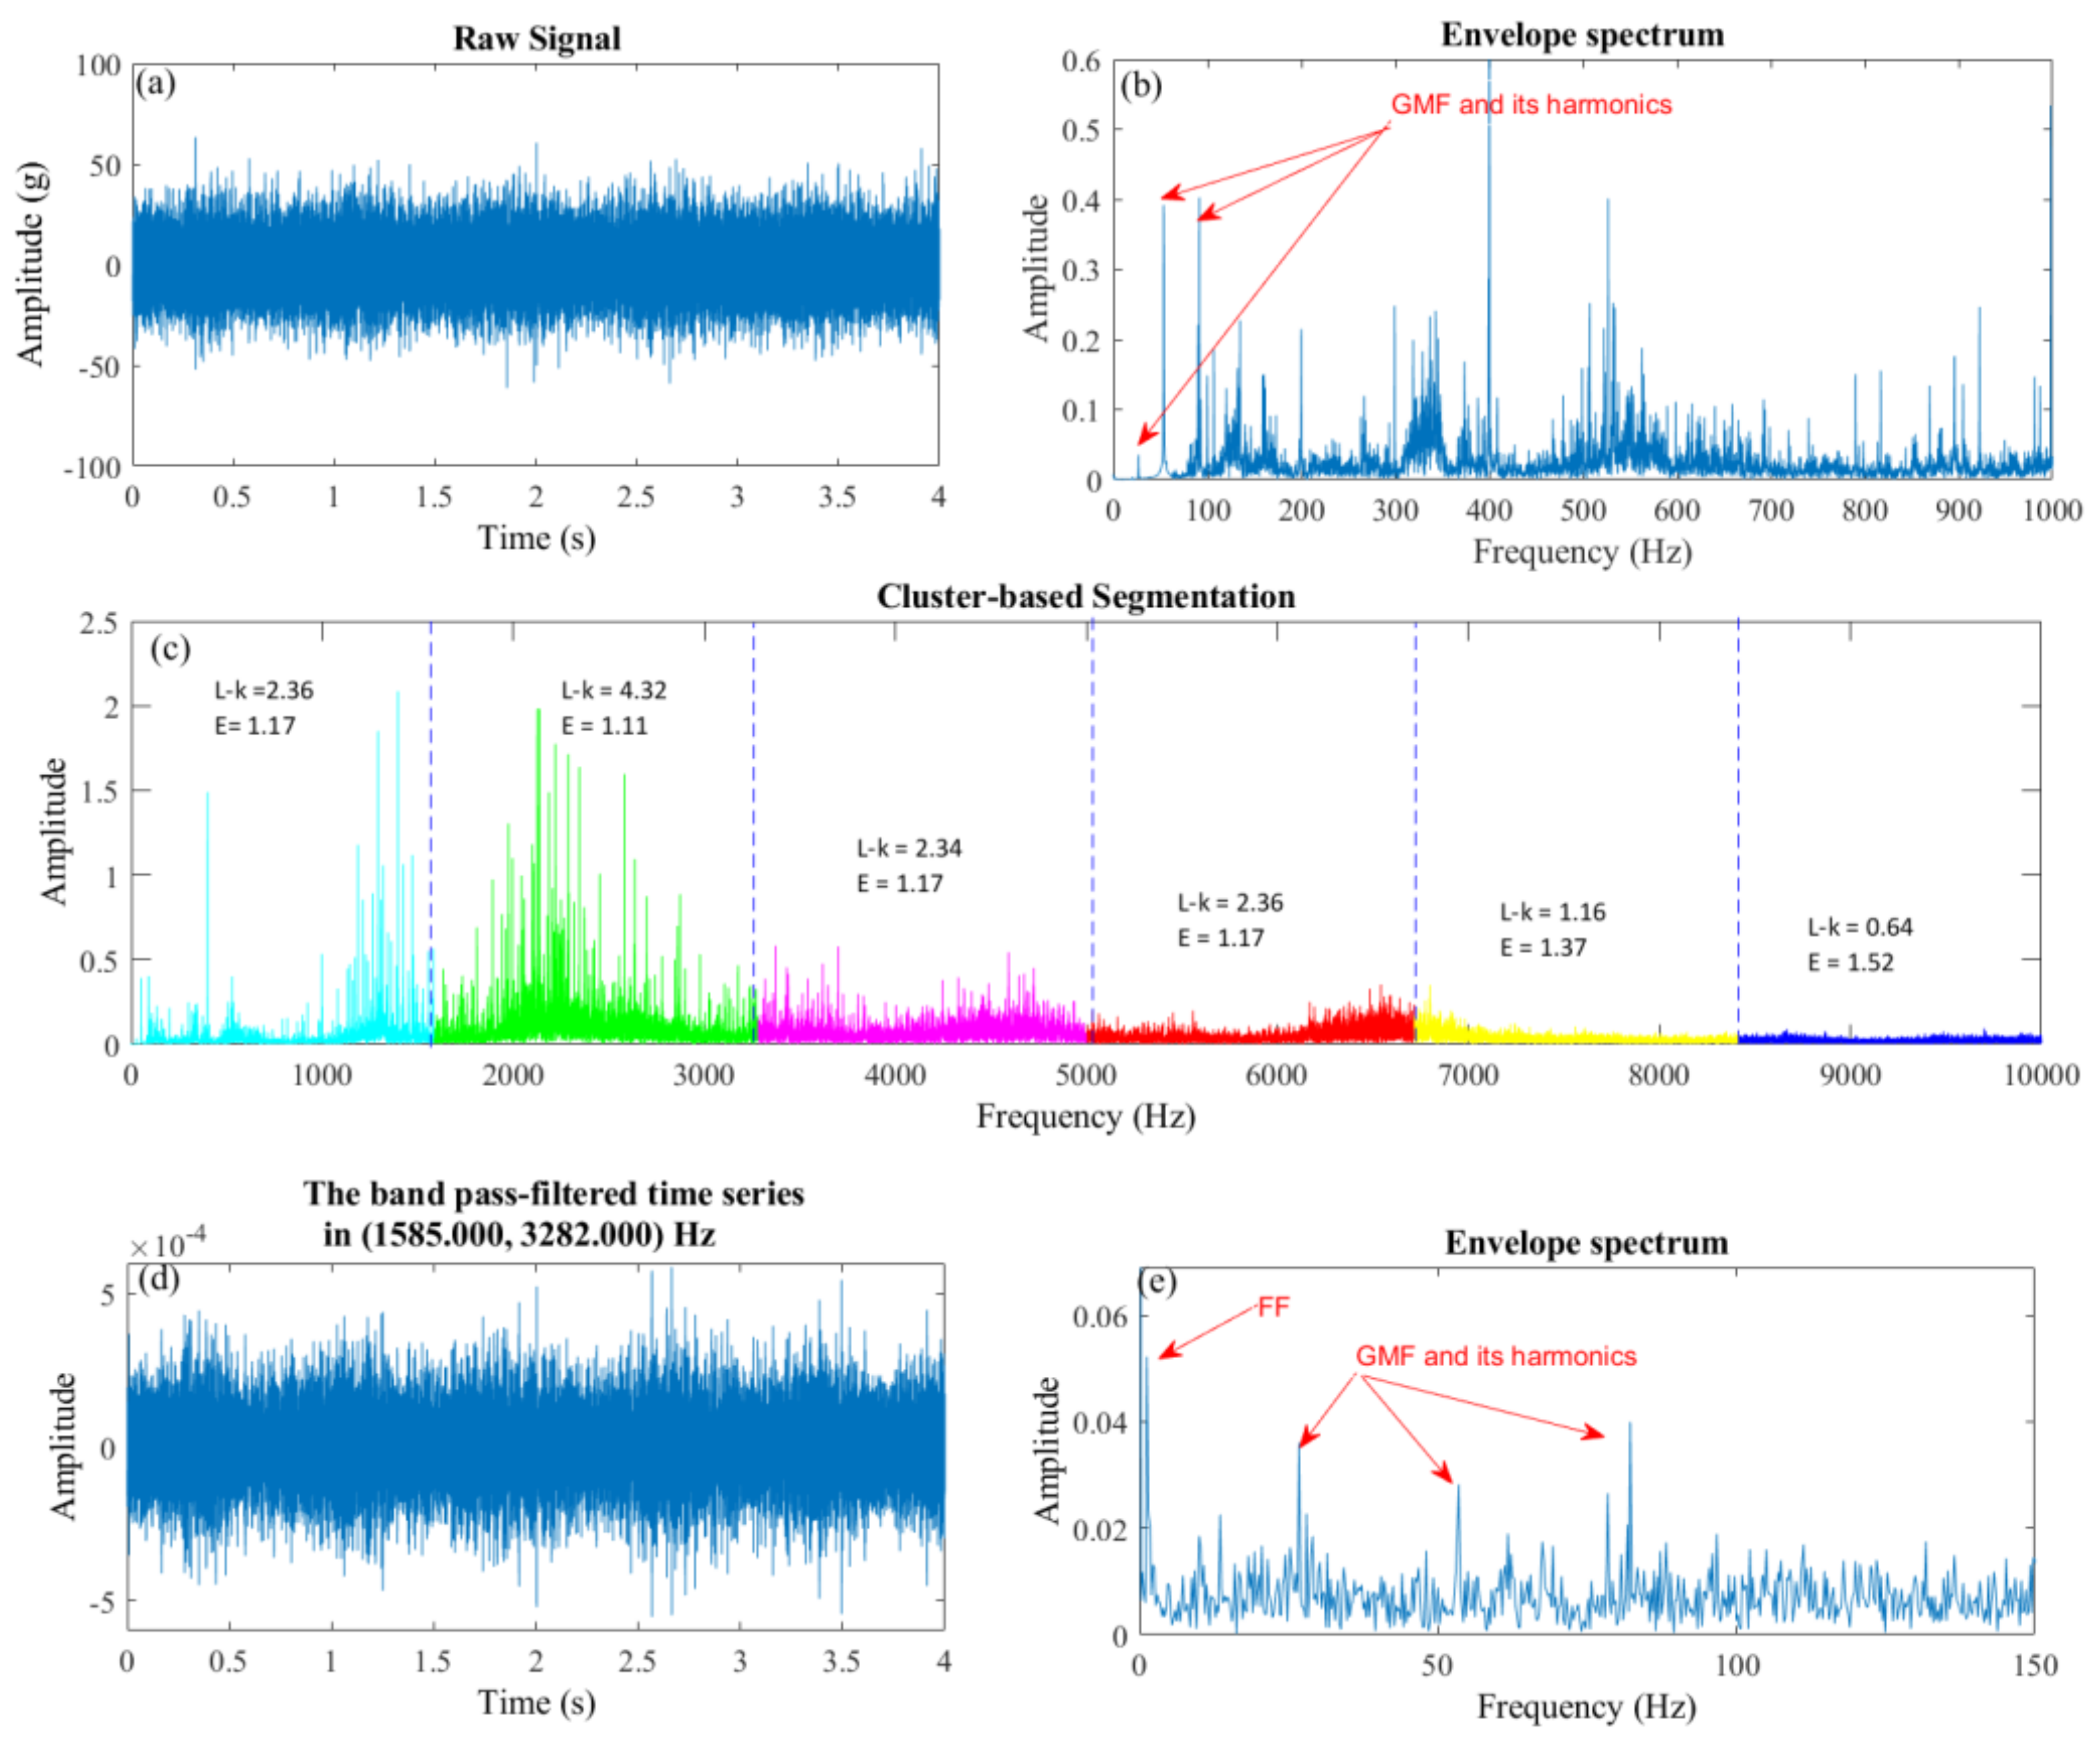
The experiment focuses on acquiring data under three distinct speeds: 1600 rpm, 1800 rpm, and 2000 rpm, all sampled at a rate of 20 kHz. The proposed scheme is then employed to process this acquired data.
Figure 5a displays the raw signal obtained, while
Figure 5b presents its corresponding envelope spectrum.
An analysis of the envelope spectrum reveals prominent frequency components associated with the Gear Meshing Frequency (GMF) at 26 Hz and its harmonics. This observation highlights the presence of regular tooth engagement within the gearbox. However, a crucial finding emerges: no identifiable fault signature related to the seeded pitting tooth fault is present in the spectrum. This absence of a discernible fault signature underscores the inherent challenges of detecting such faults in the presence of significant noise and complex gear meshing dynamics.
While the proposed scheme effectively captures the overall gear meshing behavior, its ability to accurately detect and characterize the specific pitting fault remains limited in this experimental scenario. The absence of a clear fault signature suggests the need for further refinement of the scheme or exploration of alternative techniques for effective fault identification in such complex systems. The proposed method is then employed to analyze the measured signal. From
Figure 5c, the maximum L-kurtosis and minimum entropy of the frequency domain are 4.32 and 1.11, respectively, for the second segment among all the segments. As a result, this band is used as the passband of the filter with a frequency ranging from 1585 Hz to 3282 Hz, as shown in
Figure 5d.
Applying the Hilbert transform to the filtered signal yields the frequency spectrum of the envelope signal plotted in
Figure 5e, where the fault frequency (FF) of 1.25 Hz is clearly observable.
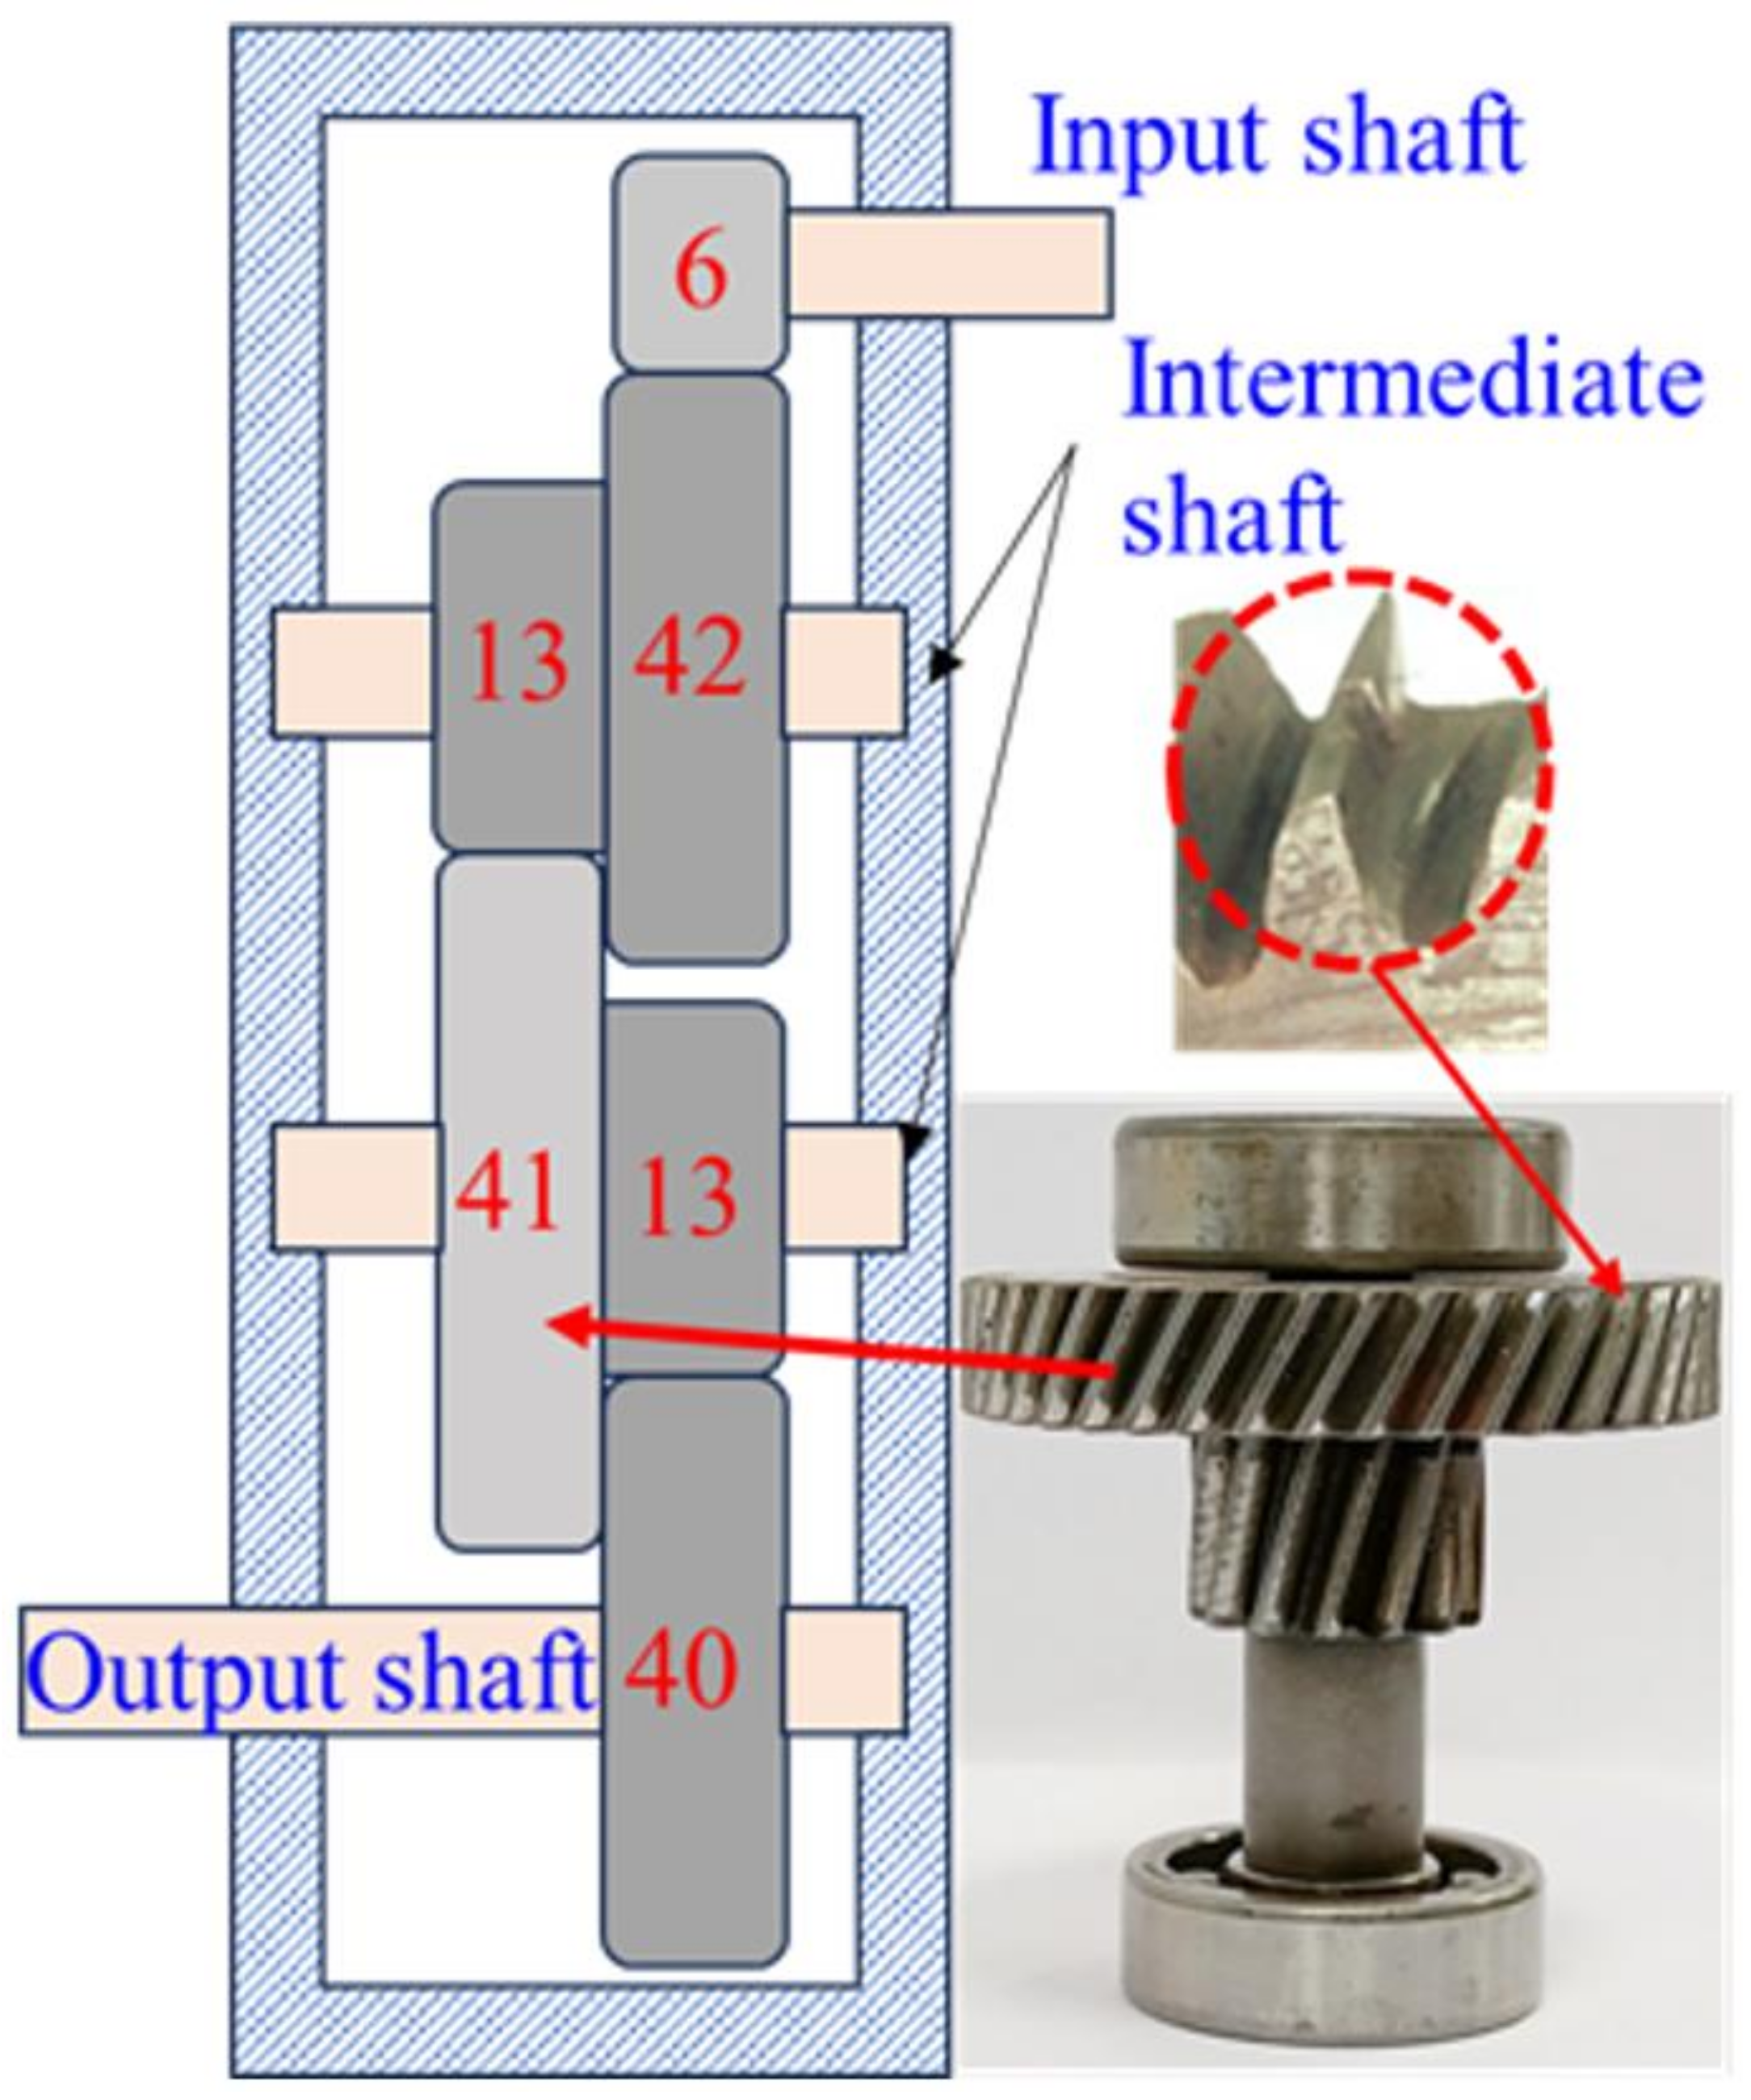
The robustness of the proposed scheme is further demonstrated through its application to a real-world scenario involving a three-stage helical gearbox. This gearbox features reduction ratios of 7, 3.2, and 3.1, resulting in a complex transmission system with multiple gear meshing frequencies. The schematic diagram of this gearbox is presented in
Figure 6, whereas the detailing of the helical gearbox is tabulated in
Table 2.
To introduce a controlled fault condition, a wear tooth defect is deliberately seeded on the gear of the intermediate shaft, which possesses 41 teeth (as shown in
Figure 6). Vibration data are acquired at a motor speed of 2100 rpm (35 Hz), providing a representative operating condition for analysis.
The three stages of the gearbox lead to distinct gear meshing frequencies (GMFs) corresponding to the rotational frequencies of each shaft. These frequencies are calculated as 210 Hz (input shaft), 65 Hz (intermediate shaft), and 20 Hz (output shaft), based on the motor speed of 35 Hz and the gearbox reduction ratios.
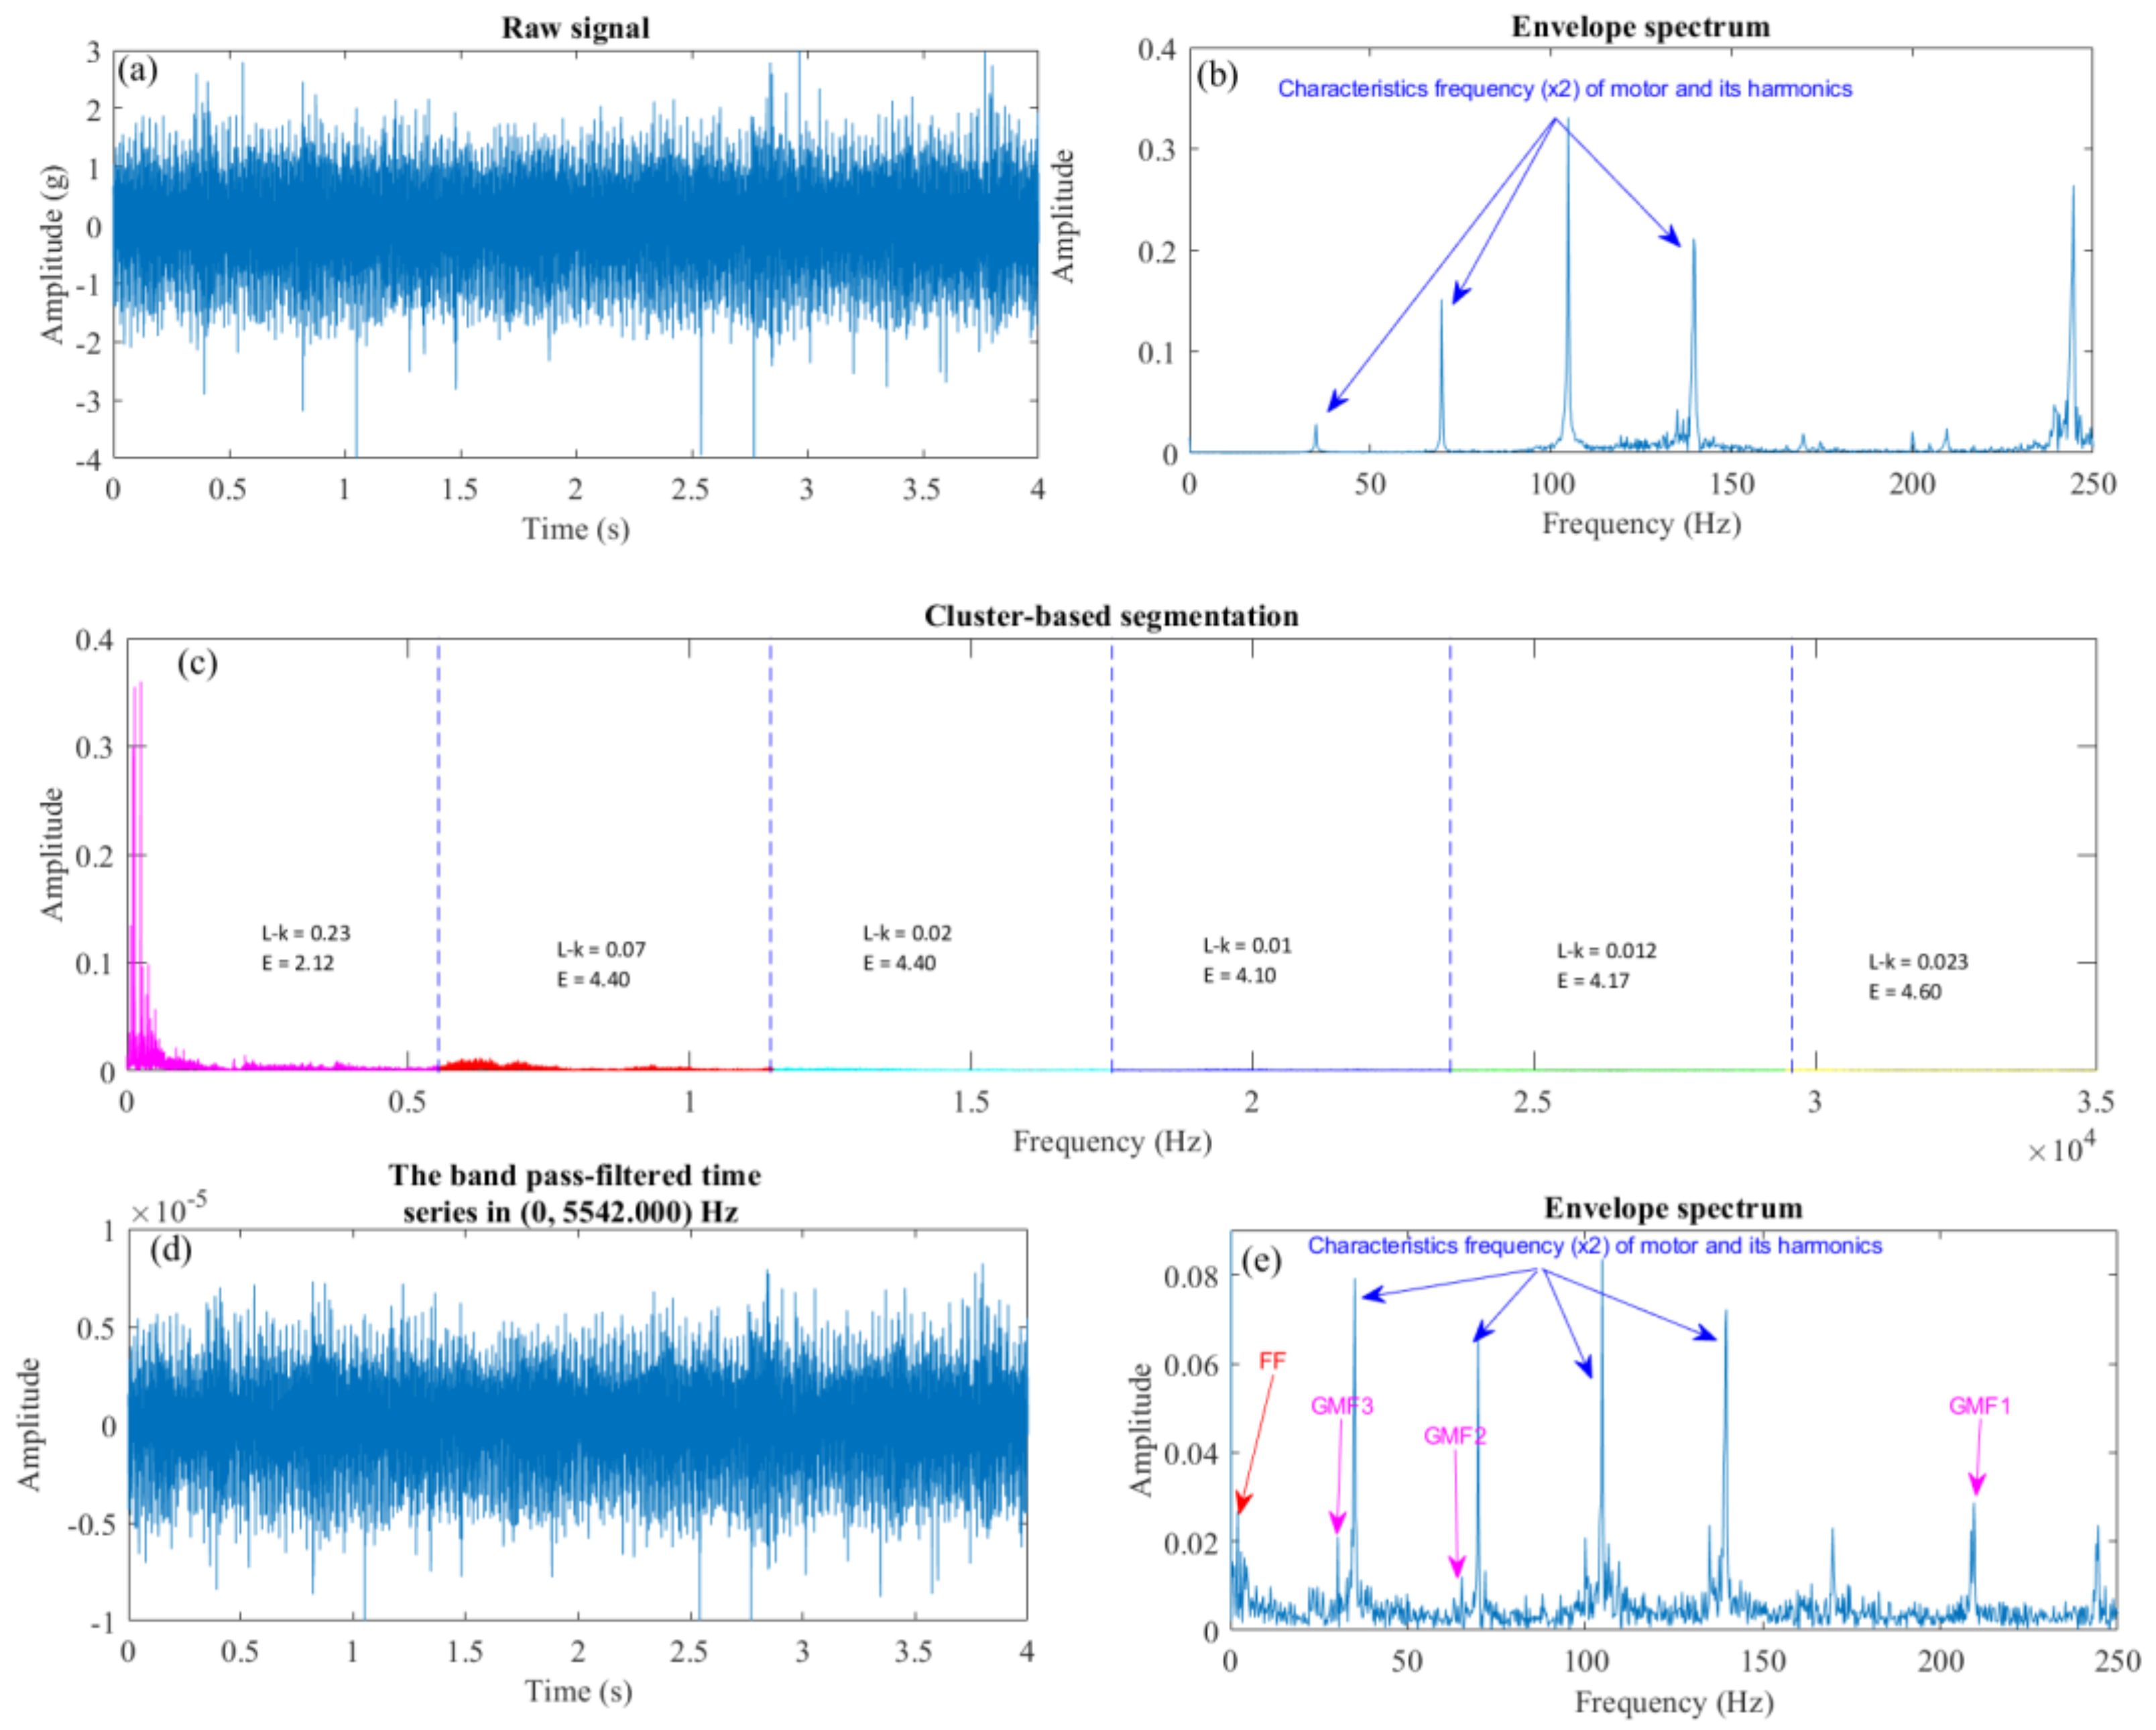
The acquired vibration signal from the helical gearbox is displayed in
Figure 7a, while its envelope spectrum is presented in
Figure 7b. Initial analysis of the envelope spectrum reveals the presence of the characteristic frequency of the motor shaft (35 Hz, the rotational frequency of the input shaft) and its harmonics. However, the expected gear meshing frequencies (210 Hz, 65 Hz, and 20 Hz) and the fault frequency related to the wear tooth defect are conspicuously absent from the spectrum. This initial observation highlights the challenge of detecting subtle fault signatures amidst the complex vibration signals generated by the gearbox.
To overcome this challenge, a segmentation strategy is implemented in the acquired signal. Segment one of the signal exhibits the highest L-kurtosis value and the lowest entropy, indicating potential significance in terms of fault information (as illustrated in
Figure 7c). This segment, spanning a frequency range of 0 Hz to 5542 Hz, is selected as a passband filter for filtering the raw vibration signal (shown in
Figure 7d).
The filtered signal is then subjected to the Hilbert transform, and the envelope spectrum of the resulting signal reveals key frequencies (
Figure 7e). Crucially, the spectrum now exhibits not only the previously observed characteristic frequency of the motor shaft and its harmonics but also the three gear meshing frequencies (GMF1, GMF2, and GMF3) corresponding to the three stages of the gearbox. Most importantly, the fault frequency of 1.6 Hz associated with the seeded wear tooth defect is now clearly visible in the spectrum.
This successful identification of the fault frequency through the proposed scheme demonstrates its efficacy in extracting valuable fault information from complex gearbox vibration data. The combination of segmentation based on statistical features (L-kurtosis and entropy), passband filtering, and the Hilbert transform envelope analysis proves to be highly effective in isolating and highlighting subtle fault signatures that would otherwise be masked by noise and complex gear meshing dynamics.
5. Conclusions
This paper presents a novel signal-processing scheme for extracting fault-related information from vibration signals, leveraging cluster-based segmentation as a key component. This method utilizes the inherent capability of clustering algorithms to automatically divide the signal into a predetermined number of distinct segments.
The identification of the segment containing the most valuable fault-related information is based on two crucial criteria: maximum L-kurtosis and minimum entropy. L-kurtosis, a measure of impulsiveness, highlights segments characterized by sharp, transient events, often indicative of incipient faults. Conversely, minimum entropy identifies segments exhibiting a high degree of cyclo-stationarity, suggesting a strong periodic pattern related to the machine’s operating conditions. By focusing on the segment exhibiting both maximum L-kurtosis and minimum entropy, the proposed scheme pinpoints the frequency range containing the most relevant fault-related information.
To further refine the signal and extract this crucial information, a passband filter is specifically designed for the identified frequency range. This filtering process effectively isolates the desired information, enriching the signal with impulsive and cyclo-stationary components directly related to the fault.
The proposed scheme has been successfully validated through fault detection experiments on various gearbox types. Its ability to automatically segment signals, identify the most informative frequency range, and enhance the signal with fault-related components demonstrates its robustness and versatility as a tool for condition monitoring and fault diagnosis in mechanical systems.


