Article

Research on the Gap Effect of Circular Concrete-Filled Steel Tubes Using the Improved Cohesive Zone Model

1
School of Resources and Civil Engineering, Northeastern University, Shenyang 110819, China
2
Department of Civil and Environmental Engineering, Brunel University London, London UB8 3PH, UK
3
College of Mechanical Engineering, Taiyuan University of Technology, Taiyuan 030024, China
*
Author to whom correspondence should be addressed.
Appl. Sci. 2024, 14(18), 8361; https://doi.org/10.3390/app14188361
Submission received: 30 July 2024 / Revised: 10 September 2024 / Accepted: 13 September 2024 / Published: 17 September 2024
(This article belongs to the Section Civil Engineering)

Abstract

:
Understanding the influence of gap distribution characteristics on the mechanical properties of circular concrete-filled steel tubes (CCFSTs) under bending load is important for stability and support design in engineering projects. In this study, the improved cohesive zone model considering friction was used to describe the mechanical behavior of mortar interfaces. Meanwhile, the concrete damage plastic model and isotropic elastoplastic model were applied for core concrete and steel tubes. The improved cohesive zone model has a unified potential function that governs the Mode I and Mode II failure processes of mortar interfaces to realize the mechanical interaction between concrete and steel. A smooth frictional function was utilized in the elastic stage to calculate the accurate frictional effect. Furthermore, the capability of the model in addressing unloading and reloading was verified, and the fracture energy varied accordingly during the cyclic loading. Then, the mechanical response of CCFSTs was investigated under bending loads by setting different gap sizes and angles between the gap and loading direction. The results show that under three-point bending, the equivalent plastic strains at the middle part of CCFSTs are much larger and the peak bearing forces are much lower than the other degrees when the angles between the coronal gap axis and loading direction equal 0° and 180°. In addition, the order of the peak bearing forces, from highest to lowest, is when the height of the coronal-cap gap increases from 0.0 mm to 2.5 mm, 5.0 mm, and 7.5 mm. The significant effect makes it inappropriate to ignore the weakening of the structural performance caused by coronal gaps in structural design.

1. Introduction

Circular concrete-filled steel tubes (CCFSTs) are composite structural elements that combine the strength of steel tubes with the compressive resistance of concrete. CCFST structures are widely used in construction and bridge engineering because of their superior performances [1,2,3]. In CCFST structures, an initial gap is often inevitable, and the main causes of crown gaps in CCFST structures are concrete settlement, air entrapment, seasonal freeze–thaw cycles, or other factors [4,5]. These issues prevent the concrete inside a steel tube from fully filling the space after it hardens, resulting in voids in the top region [6,7]. The main imperfections of CCFSTs are circumferential gaps and spherical-cap gaps [8,9], and spherical-cap gaps are one of the main forms. These gaps will weaken combinations of steel tubes and concrete and significantly reduce the bearing capacity of structures [5,7,10,11]. Existing construction technology cannot safely and completely avoid gap disasters in CCFSTs [12,13]. In recent years, relevant scholars have carried out a series of experimental studies and numerical analyses on the mechanical properties of CCFSTs with spherical spherical-cap gap defects [14,15,16]. Considering that CCFST structures may have both coronal and circumferential voids, the simultaneous occurrence of coronal and circumferential gaps is inevitable. Therefore, it is necessary to study the synergistic effect of two types of gap disasters on the mechanical properties of CCFSTs. At the same time, the relative directions of the coronal gap position and the bending load after CCFST construction are also uncertain. Hence, the angle between the detachment position and the bending load is also an important factor affecting the structural bending resistance. Describing the mechanical properties of mortar interfaces using friction models cannot reflect the bonding effect of mortar during the bonding and sliding processes, while selecting traditional bilinear or trilinear cohesive models does not allow for fully considering the contribution of frictional force to the tangential strength of the interface. It is still challenging to determine the influences of the distance of the circular-segment gap and the angle between the gap and bending load on the flexible mechanical properties of the CCFSTs.
The bonding states of mortar interfaces have a significant effect on the flexural performance of steel–concrete composite structures, and quantifying the bonding-slip behavior of mortar interfaces is an important aspect of computational and experimental mechanics [9,17,18]. Both cohesion and friction play considerable roles in governing the mechanical behavior of brittle interface materials, such as concrete, rock, and mortar interfaces [19,20,21]. The cohesive zone model [22] has been applied to simulate the progressive failure of brittle materials. However, the tangential strength of brittle interface materials is commonly provided by the combined support of cohesive bonding and friction [23,24]. Researchers have established several coupling cohesion–friction models within continuum methods [25,26]. For most, friction can only appear when cohesion disappears completely, which is unreasonable compared with the Mohr–Coulomb (MC) strength criterion. To determine the onset condition of friction, some researchers suggest that friction can occur and grow when cohesion enters the softening stage [27,28]. These cohesion–friction models have mainly been used to investigate the pull-out of steel and reinforcement from concrete, as well as the instability of masonry wall [29,30,31]. Additionally, Yao et al. (2015) [32], Li et al. (2017) [33], and Li et al. (2019) [34] used the coupling cohesion–friction model to investigate rock failure.
The Park–Paulino–Roesler (PPR) model was proposed by Park (2009) [35] and Park (2009) [36] to model the mechanical response of quasi-brittle interface material. After, researchers added novel properties to the PPR cohesive model and applied it in engineering research [37,38,39,40]. Tvergaard (1990) proposed a cohesive model that considers friction, which plays a role after the cohesive bonding at the interface is reduced to the residual stage and may lead to the unsmooth transition from cohesion to friction and convergence difficulties [25]. To solve this problem, Spring and Paulino (2015) [41] improved the PPR cohesive model by introducing the smooth friction term when the cohesion reaches the peak. Although the model can consider the influence of friction and cohesion on shear strength, the peak shear stress may be hysteretic when the friction is large, because the peak points of cohesion and friction are generally not studied at the same tangential separation. Therefore, characterizing the strength of the cohesive model [41] is difficult because the MC strength criterion is not satisfied.
In this study, the improved PPR model was adopted to fully describe the coupling effect behavior of the cohesion and frictional behavior of quasi-brittle interface material. In the improved model, the Mode I and Mode II tractions are controlled by a unified potential function, and the influence between them being interactive. The unified potential function is second-order continuous and differentiable with respect to Mode I and Mode II separations. Therefore, the related traction–separation and tangent stiffness curves are continuous and smooth, which ensures the effective convergence of the improved cohesive model compared with bilinear or trilinear cohesive models [42,43,44]. The governing equation for friction force in the improved model is continuous and differentiable with respect to the Mode II separation. Thus, the coupling superposition equation for cohesion and friction can also be continuous and smooth, and the improved model inherits the advantage of easy convergence from the original model. Then, a direct shear test on a masonry wallette was carried out, and the results obtained by the improved model were compared with the experimental data and the numerical simulations using the other methods [41,45,46,47,48]. After the comparison, the effectiveness and reliability of the improved model were verified, and the fitting parameters were also determined. In addition, we further investigated the effects of the coronal gap length and the angle between the loading direction and gap axis on the flexural capacity of CCFSTs.

2. Improved Cohesive Model

2.1. Basic Principles

The PPR cohesive model was proposed by Park (2009) [35] and Park et al. (2009) [36] and has a clear physical meaning for each parameter. The model ensures that both the cohesive bonding and the tangent stiffness matrix are consistently governed by a continuous potential function. The Mode I and Mode II cohesive tractions, denoted as Tn and Tt, are derived by taking the first-order derivatives of the potential function with respect to the Mode I and Mode II crack separations. The tangent stiffness matrix is determined by solving the second-order differential equation of the potential energy function. Because of the continuous and smooth nature of the traction–crack separation curve, the model guarantees satisfactory convergence in the process of numerical iteration.
The potential function of the PPR cohesive model is provided in Equation (1), as follows:
ψ Δ n , Δ t = min ϕ n , ϕ t + F n Δ n , Δ t F t Δ n , Δ t F Δ n , Δ t = Γ 1 Δ δ A Q A + Δ δ Q + O O = ϕ n ϕ t / ϕ n ϕ t , Mode I ϕ t ϕ n / ϕ t ϕ n , Mode II
where Δ represents the Mode I (Δn) and Mode II (Δt) crack separations; ϕn and ϕt correspond to the Mode I and Mode II fracture energies, respectively; A is the parameter that governs the softening behavior of the normal and tangential tractions once tensile or shear strength is achieved; and A = α in Mode I and A = β in Mode II; Γ and Q can be calculated using Equations (2) and (3).
Γ = ϕ p M p = ϕ n ϕ t / ϕ n ϕ t , Mode I ϕ t ϕ n / ϕ t ϕ n , Mode II M = A Q Q
where p and M are process variables; Γ represents the normal (Γn) or tangential (Γt) fracture energy coefficients.
Q = α α 1 λ n 2 1 α λ n 2 , Mode I β β 1 λ t 2 1 β λ t 2 , Mode II
The potential function is limited in a square area called the cohesive region, which has boundaries from 0 to δn and −δt to δt, where δn and δt are the final crack separations for the Mode I and Mode II fractures, respectively, and can be calculated using Equation (4).
δ = ϕ σ A λ 1 λ A 1 A Q λ + 1 Q 1
In Equations (2)–(4), ϕ, Γ, δ, and λ are directional variables, and when their subscripts are marked “n”, they correspond to the behavior of Mode I; subscript “t” corresponds to the behavior of Mode II, where σ is the strength of the interface material, and σ = σmax in Mode I fractures and σ = τmax in Mode II fractures. σ is also the maximum traction in the process of crack separation; λn and λt are the stiffness parameters in the elastic stage along the normal and tangential crack separations, which equal the ratio of the separation when the traction reaches the strength (Κn and Κt) and residual boundaries (δn and δt) in the scope of the potential energy function. The parameters have a relationship which can be expressed in Equation (5), and the cohesive region is shown in Figure 1.
T n K n , 0 = σ max T t 0 , K t = τ max
The normal and tangential cohesive tractions (Tn and Tt) according to the crack separations are controlled by Equations (6) and (7).
T n n , t = Ψ n = Γ n δ n · F n n , t n · F t ( n , t ) T t n , t = Ψ t = Γ t δ t · F t n , t t · F n ( n , t ) F n , t = Q 1 δ A Q A + δ Q 1 A 1 δ A 1 Q A + δ Q
T n Δ n , Δ t = Γ n δ n F n Δ n , Δ t Δ n F t Δ n , Δ t , Tension T n 0 , 0 Δ n Δ n = Γ n δ n 2 2 ψ n 0 , 0 Δ n 2 F t 0 , 0 Δ n , Compression T t Δ n , Δ t = ψ Δ t = Γ t δ t F t Δ n , Δ t Δ t F n Δ n , Δ t 2 F n 0 , 0 Δ n 2 = Q 2 Q Q A Q 2 + A 2 A Q A m 2 A Q Q A Q 1
It is important to highlight that Equations (6) and (7) delineate the method for calculating cohesive traction under a mix mode of tension and compression. For the tensile state, Tn is derived as a partial derivative of the potential function with respect to normal crack separation. In the compression state, drawing from studies by Spring and Paulino [41] and Li et al. [33], Tn increases linearly with normal crack separations. The stiffness in the compression is the initial tensile stiffness of Tn and remains unaffected by a Mode II crack separation of 0. The PPR cohesive model requires eight input parameters, including fracture energy (ϕn and ϕt), strength (σmax and τmax), initial stiffnesses (λn and λt), and softening parameters (α and β). According to the above displacement traction function, the relationship between cohesion and displacement can be drawn as shown in Figure 2.
It can be seen in Figure 2 that the normal and tangential cohesive tractions are affected by both normal and tangential crack separations. Simultaneously, the cohesive traction can vary continuously and smoothly with the normal or tangential crack separation growing.

2.2. Friction Model

The improved friction model was developed by integrating the conventional PPR cohesive model with the MC strength criterion. This integration ensures that the peak values of the cohesive traction and frictional traction of interface materials occur simultaneously at the same tangential crack separation. When elements on either side of the interface compress and intrude into one another, resistance is activated along the interface. The resistance magnitude is determined by the intrusion depth and the normal stiffness of the interface under compression, which is equal to the normal stiffness when the tensile crack separation is nearly 0. The improved model assumes that frictional traction is initiated when the interface is compressed and shear slip occurs between adjacent layers, leading to a smooth increase in resistance as the tangential crack separation grows. This process is described by Equation (8) [3].
T f = μ × κ Δ t × T n ,   T n   <   0   and   Δ t   >   0
where μ is the friction coefficient of the interface; κ is the response factor that increases monotonically and continuously from 0 to 1 with the growth in shear displacement, and it can be expressed by Equation (9) [3], as follows:
κ Δ t = T t 0 , Δ t τ m a x s , 0 < Δ t λ t δ t 1 , Δ t > λ t δ t
where s is the transformation shape parameter controlling the growth mode of the friction, and the influence of s on κ can be seen in Figure 3a. Through the established friction mode, the peak cohesion and friction can appear at the same shear deformation, and a smooth transition between cohesion and friction can be realized. For the improved model, eight input parameters are required, i.e., Γn, Γt, σmax, τmax, λn, λt, α, and β. In addition, the friction growth shape parameter, s, and the friction coefficient, μ, should also be used as inputs. The curve shape of the coupled cohesion–friction model is shown in Figure 3.

2.3. Numerical Benchmark

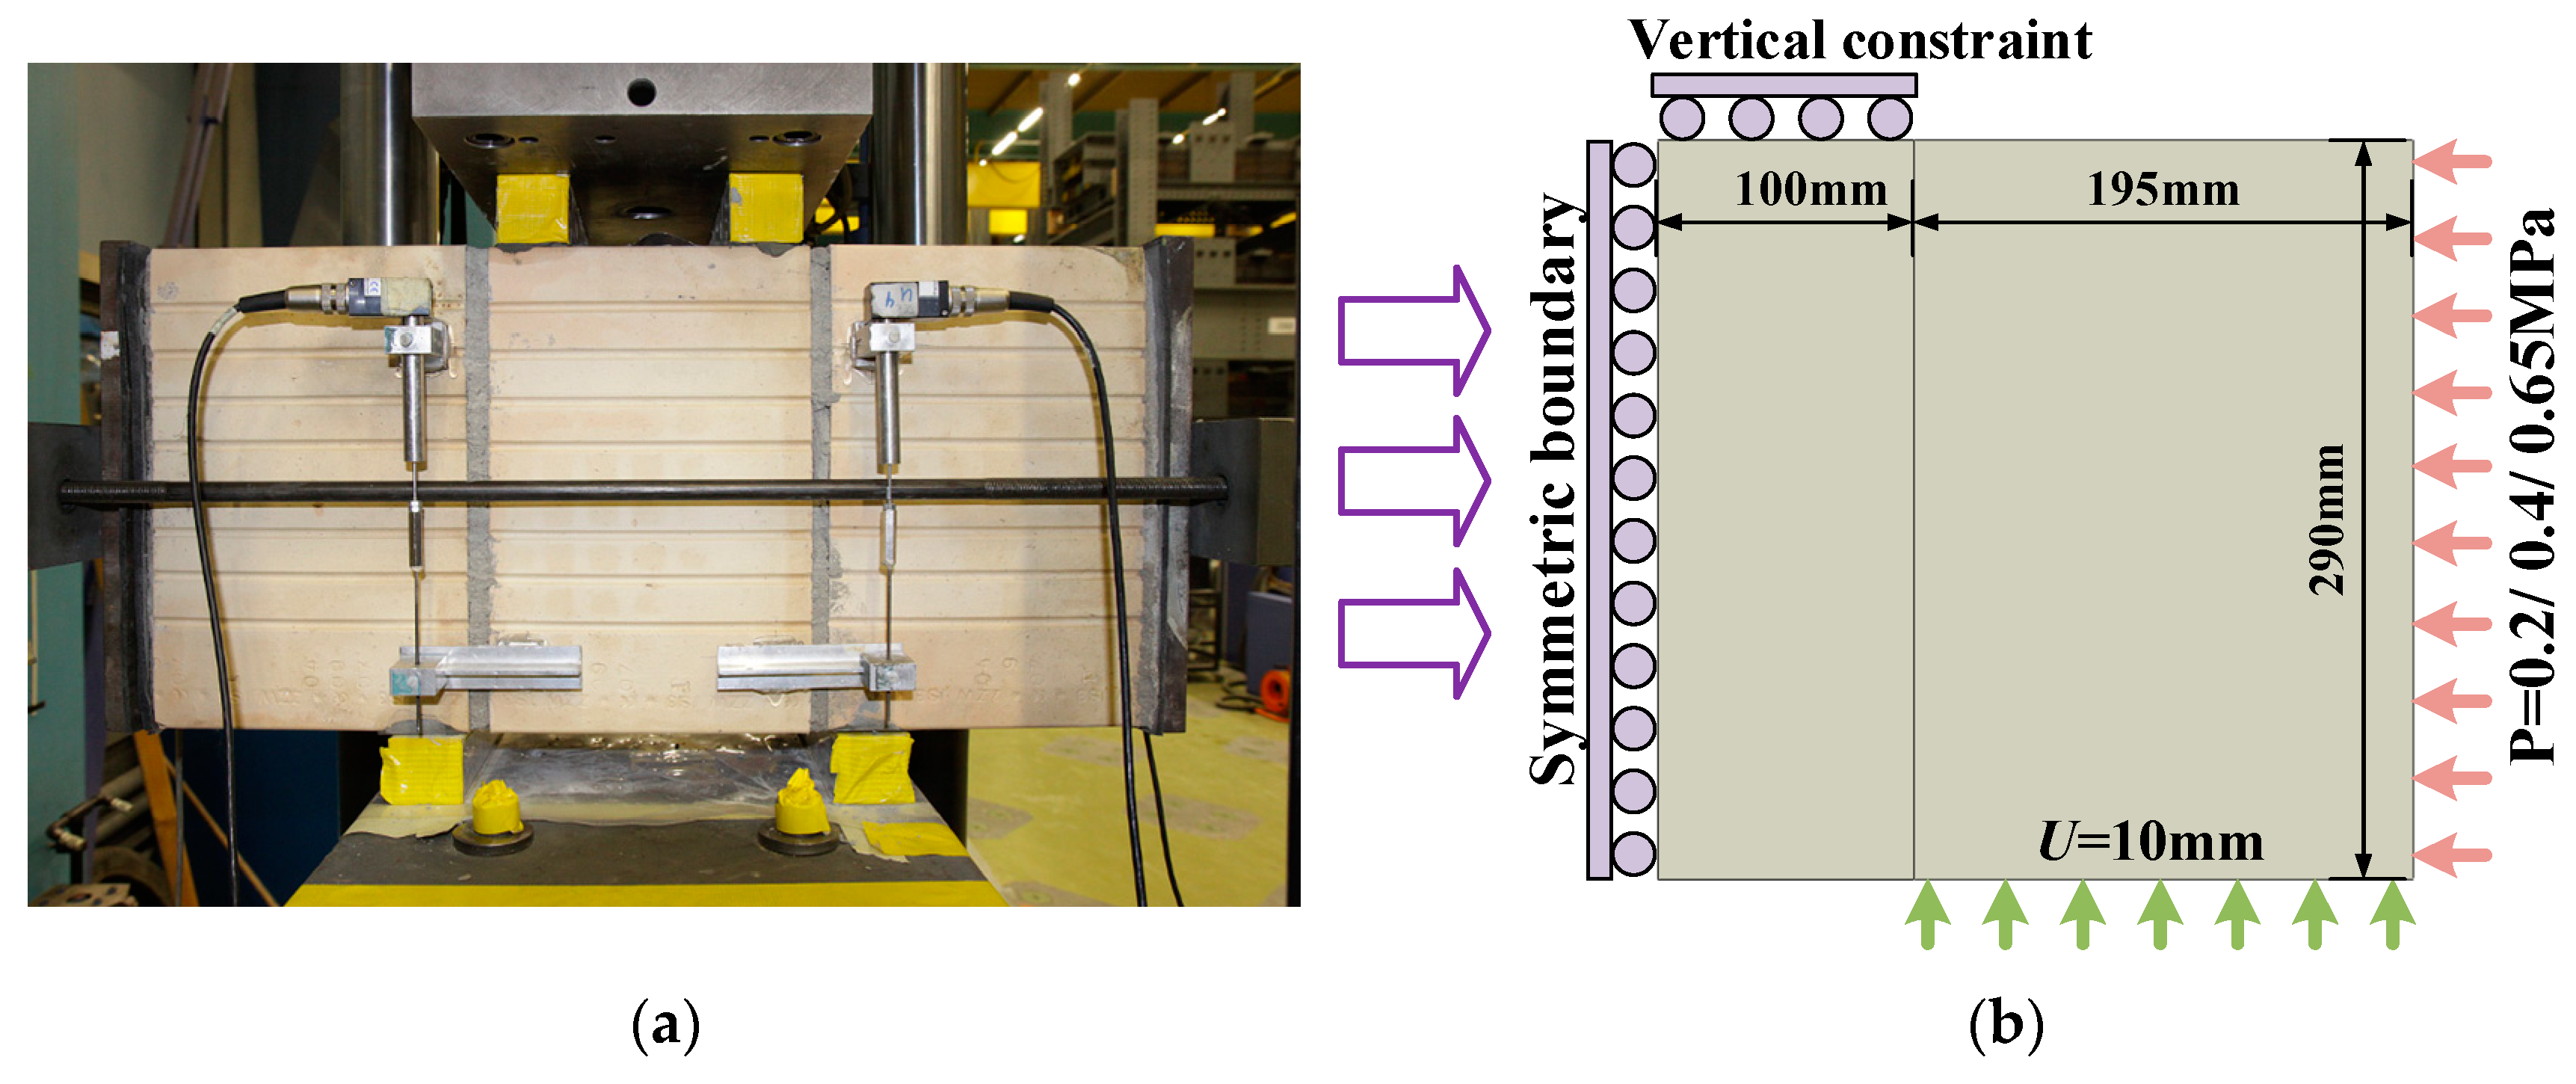
Masonry wallette is widely used in civil engineering. Experiments conducted by Beyer et al. (2010, 2012) on a Masonry wallette was chosen to verify the correctness and effectiveness of the improved cohesion–friction mode [45,46]. Both the bonding of the masonry and the bonding of the steel–concrete structure is provided by cement mortar. The related failure modes can be simplified to be quasi-brittle, although the material and production method used for the cement mortar may lead to differences in the mechanical parameters. Hence, after verification by the shear slip behavior between the bricks, the established model can be applied to characterize the mechanical behavior of the interface between steel and concrete in CCFSTs. As shown in Figure 4a, there are three bricks bonded by mortar; the middle brick is also constrained by two rigid bricks on the upper surface. In addition, the bilateral bricks are applied with the vertical displacement load on the lower surfaces to achieve a shear effect. Pressure is applied on the two outer vertical surfaces to ensure the friction effect.
Different numerical models have been used to simulate the experiment of Beyer et al. (2010, 2012) [45,46]. As Spring and Paulino (2015) [41], Snozzi and Molinari (2013) [47], and Baek and Park (2019) [48] utilized the symmetric half model, as depicted in Figure 4a,b; this same model is adopted here for an accurate comparison. Initially, different normal pressures of 0.2, 0.4, and 0.65 MPa are applied to the right surface of the specimen and maintained at a constant level during the shearing process. Then, a vertical displacement load of 10 mm is applied to the lower side of the right brick, while a vertical constraint is imposed on the upper surface of the light brick. Consequently, the mortar interface is in a coupled state of compression and shear during loading. This study used the ABAQUS (R2017) software to simulate the above experiment. A static solving algorithm was used. Three-dimensional (3D) eight-node linear elements (C3D8R) were chosen to describe the mechanical behavior of the masonry, and eight-node cohesive elements (COH3D8) were inserted into the mortar interface between the bricks. Considering that the strength of the masonry was significantly higher than that of the mortar, the linear elastic model was used for the masonry. The experimental case cited in this study has been widely simulated using various numerical methods, with the masonry often assumed to be elastic bodies [41,47,48]. The mortar material was characterized by the improved cohesive model, and the model was embedded into ABAQUS as the user-defined model.
Based on the MC strength criterion, the peak shear stress can be separated into two components. The first component, contributed by cohesion, is approximately 0.2295 MPa, while the second component, contributed by friction, is around 0.308 MPa. Given a normal pressure of 0.4 MPa, the friction coefficient was calculated to be 0.77. The material properties of the bricks and joint mortar are listed in Table 1. Furthermore, it is assumed that the brick behaves as a linear elastic material with an elastic modulus of 14,000 MPa and a Poisson’s ratio of 0.15.
The critical results of the improved PPR model demonstrate good agreement with the experimental results. The results simulated by the applied model can approach the experimental results in terms of the peak shear stress, displacement at the peak shear stress, initial displacement in the residual stage, tangential cohesive strength, and friction coefficient with a maximum relative error < 6%. In the results of Snozzi and Molinari [47] and Baek and Park [48], there was an obvious difference in terms of the displacement at peak shear stress. Meanwhile, Baek and Park [48] had large errors in predicting the initial displacement in the residual stage. In the simulation by Spring and Paulino [41], excessive tangential cohesive strength was chosen for predicting the experimental results. In summary, the applied model is effective in predicting the shear behavior of quasi-brittle interface materials.

3. Analysis of the Flexural Performances of CCFSTs with Gaps

CCFST structures are often assembled together to form complex framework structures. In these structures, the mid span of a CCFST may be an intersecting node, and the connection methods among nodes are diverse, such as welding and bolt fixation. The intersection shapes at the nodes include “T” shapes and “K” shapes. However, various forms inevitably result in concentrated loads at the midspan of the CCFST, causing it to be subjected to bending loads. Therefore, the study focuses on the bending of CCFST structures caused by loads at midspan nodes.
This section employs the improved cohesive–friction model to describe the contact behavior between the steel tubes and concrete of CCFSTs, aiming to predict the influence of a coronal-cap gap on the bending capacity of a CCFST. For CCFST structures, an initial gap is often inevitable. The main gaps in CCFSTs are circumferential gaps and coronal-cap gaps. Especially, the existence of coronal-cap gaps will weaken the combination of core concrete and steel tube, and significantly reduce the bearing capacity of the structures [5,7,10]. The existing construction technology cannot avoid the cavity defect of CCFSTs [12,13]. In recent years, researchers have carried out a series of experimental and numerical analyses on the mechanical properties of CCFSTs with the coronal gap defect [14,49,50]. In this section, the effect of the height of the coronal-cap gap and the angle between the load and gap axis on flexural CCFSTs are studied comprehensively.

3.1. Numerical Model Configuration

In the numerical model of CCFSTs, the concrete core is simulated by 3D 8-node reduced integral elements. The outer steel tube is simulated by the 4-node reduced integral shell element. By referring to the mesh in a study by Han et al. (2016) [9], this study sets a denser mesh to ensure the reliability of the numerical results. The concrete damage plastic (CDP) constitutive model is adopted [51,52,53]. The Poisson’s ratio, μ, cylinder compressive strength, fc′, and corresponding strain, εc′, of the concrete under uniaxial compressive stress are 0.21, 33 MPa, and 0.0033, respectively. The empirical Equation (10), recommended in ACI318 (2011), can be adopted to calculate the elastic modulus, Ec [54].
E c = 4700 f c
The ratio of the compressive strength under biaxial loading to uniaxial compressive strength, fb0/fc′, can be calculated using Equation (11) [55].
f b 0 f c = 1.5 f c 0.075
where fb0 is the biaxial compressive strength. The confinement factor, ξ, can be determined according to Equation (12) [3].
ξ = A s f s A c f c
According to Tao et al. [56], the ratio of the second stress invariant on the tensile meridian to that of the compressive meridian, Kc, and the dilation angle, ψ, can be determined by Equations (13) and (14).
K c = 5.5 5 + 2 f c 0.075
ψ = 56.3 1 ξ , ξ 0.5 6.672 e 7.4 4.64 + ξ , ξ > 0.5
According to Equations (10)–(14), the key material parameters for confining the CDP constitutive model are set. Namely, the elastic modulus, Ec, is 27 GPa; the ratio of the second stress invariant on the tensile meridian to that on the compressive meridian, Kc, is 0.72. Moreover, the shear dilation angle depends on the confining pressure parameters. Because of the different gap sizes set in this study, the shear dilation angle and confinement factor vary with the changes in the gap size conditions. The flow potential eccentricity, e, is 0.1. The viscosity parameter is set to 1 × 10⁻⁵ to ensure that the model has appropriate convergence.
When core concrete has to bear a circular confining pressure, the uniaxial compressive yield strength, fc′, and corresponding strain, εc′, are substantially higher than those of unconfined concrete. According to Mander’s model, the relationship between fc′ and its corresponding strain, εc′, as well as the parameters (fcc′ and εcc′) under confining compression [57,58], can be defined. Han et al. [9] established an equivalent stress–strain relationship to simulate the plastic-damage behavior of core concrete in CCFSTs under a compressive state, as follows:
σ ¯ = 2 ε ¯ ε ¯ 2 , ε ¯ 1 1 + q ε ¯ 0.1 ξ 1 , ξ 1.12 ε ¯ β ε ¯ 1 2 + ε ¯ , ξ < 1.12 , ε ¯ > 1
σ 0 = 1 + 0 . 054 ξ 2 + 0 . 4 ξ 24 f c 0.45 f c
ε 0 = ε c c + 1400 + 800 f c 24 1 ξ 0.2
q = ξ 0.745 2 + ξ
β = 2.35 × 10 4 2 . 36 × 10 5 0 . 25 + ξ 0 . 5 7 f c 2
Additionally, the tension stiffening still needs to be defined in ABAQUS. The tensile behavior is assumed to be linear until the tensile strength of the concrete is met, which was taken as 0.1 × fc′. Beyond the tensile strength, a softening method can be characterized by the fracture energy, Gf [56]. The definition of Gf is shown in Equation (20):
G f = 0.0469 d max 2 0.5 d max + 26 0.1 f c
where dmax is the maximum coarse aggregate size in the core concrete. According to Tao et al. (2013) [56], it is set at 20 mm in this study.
As a simplification, the ideal bilinear isotropic elastoplastic model [59] was applied for the steel with an elastic modulus of 2.1 × 10⁵ MPa, Poisson’s ratio of 0.3, and yield stress of 335 MPa. The Von Mises yield criterion was applied to describe the elastic–plastic behavior in ABAQUS, which is defined in Equation (21), as follows:
F = 3 J 2 = 1 2 σ 1 σ 2 2 + σ 2 σ 3 2 + σ 1 σ 3 2
where J2 is the second invariant of the deviatoric stress tensor, and σ1, σ2, and σ3 are the maximum, intermediate, and minimum principal stresses, respectively. The yield criterion for the steel tube was modeled using the associated flow rule.
The cement mortar interlayer was simulated by the cohesive elements, and the related properties were defined via the user self-defined subroutine in ABAQUS software [60]. The Mode I and Mode II fracture energies of the mortar interlayer was determined according to Nasiri and Liu [61], and the initial stiffness and strength are derived by the test data [62]. The friction coefficient is set as 0.6 [63]. The material properties are shown in Table 2.
The CCFST mode adopted a circular section with an outer diameter of 170 mm, steel tube thickness of 2.5 mm, and length of 2000 mm. The distances between the two lower supports was 1800 mm, and the upper indenter was placed at the midpoint of the specimen. The cross-section and front view are illustrated in Figure 5a,b. The concrete core and the outer steel tube were firstly established and then the 8-node zero thickness elements were inserted into the interface between the concrete core and the outer steel tube. The finite element model is shown in Figure 5c.
A quasi-static analysis was adopted, and the influence of the loading speed can be ignored. The contacts along the surfaces surrounding the coronal gap were set as the normal “hard” contact model, with a tangential penalty friction coefficient of 0.6 [63]. Meanwhile, the contacts between the steel tube and the supports w treated in the same way as above. The friction coefficient should be enough to prevent structural instability. A displacement-control vertical load of 80 mm was applied on the upper indenter to realize the bending deformation of the structure until the peak force was reached. In this study, the ABAQUS software was employed to conduct finite element analysis.
The general static procedure in ABAQUS was used to solve the equilibrium state of the model under the applied loads. This technology was appropriate for time-independent problems, where the system response was analyzed after it has reached equilibrium under the given loading conditions. During this procedure, ABAQUS used an incremental-iterative method to solve the system of equations and find the equilibrium state. Specifically, the total applied load was divided into multiple load increments. In each increment, ABAQUS iteratively solved the equilibrium equations for the current step. When the convergence criteria were met, the system proceeded to the next increment until all load increments were completed.

3.2. Effect of the Angle between Loading Direction and Coronal Gap Axis

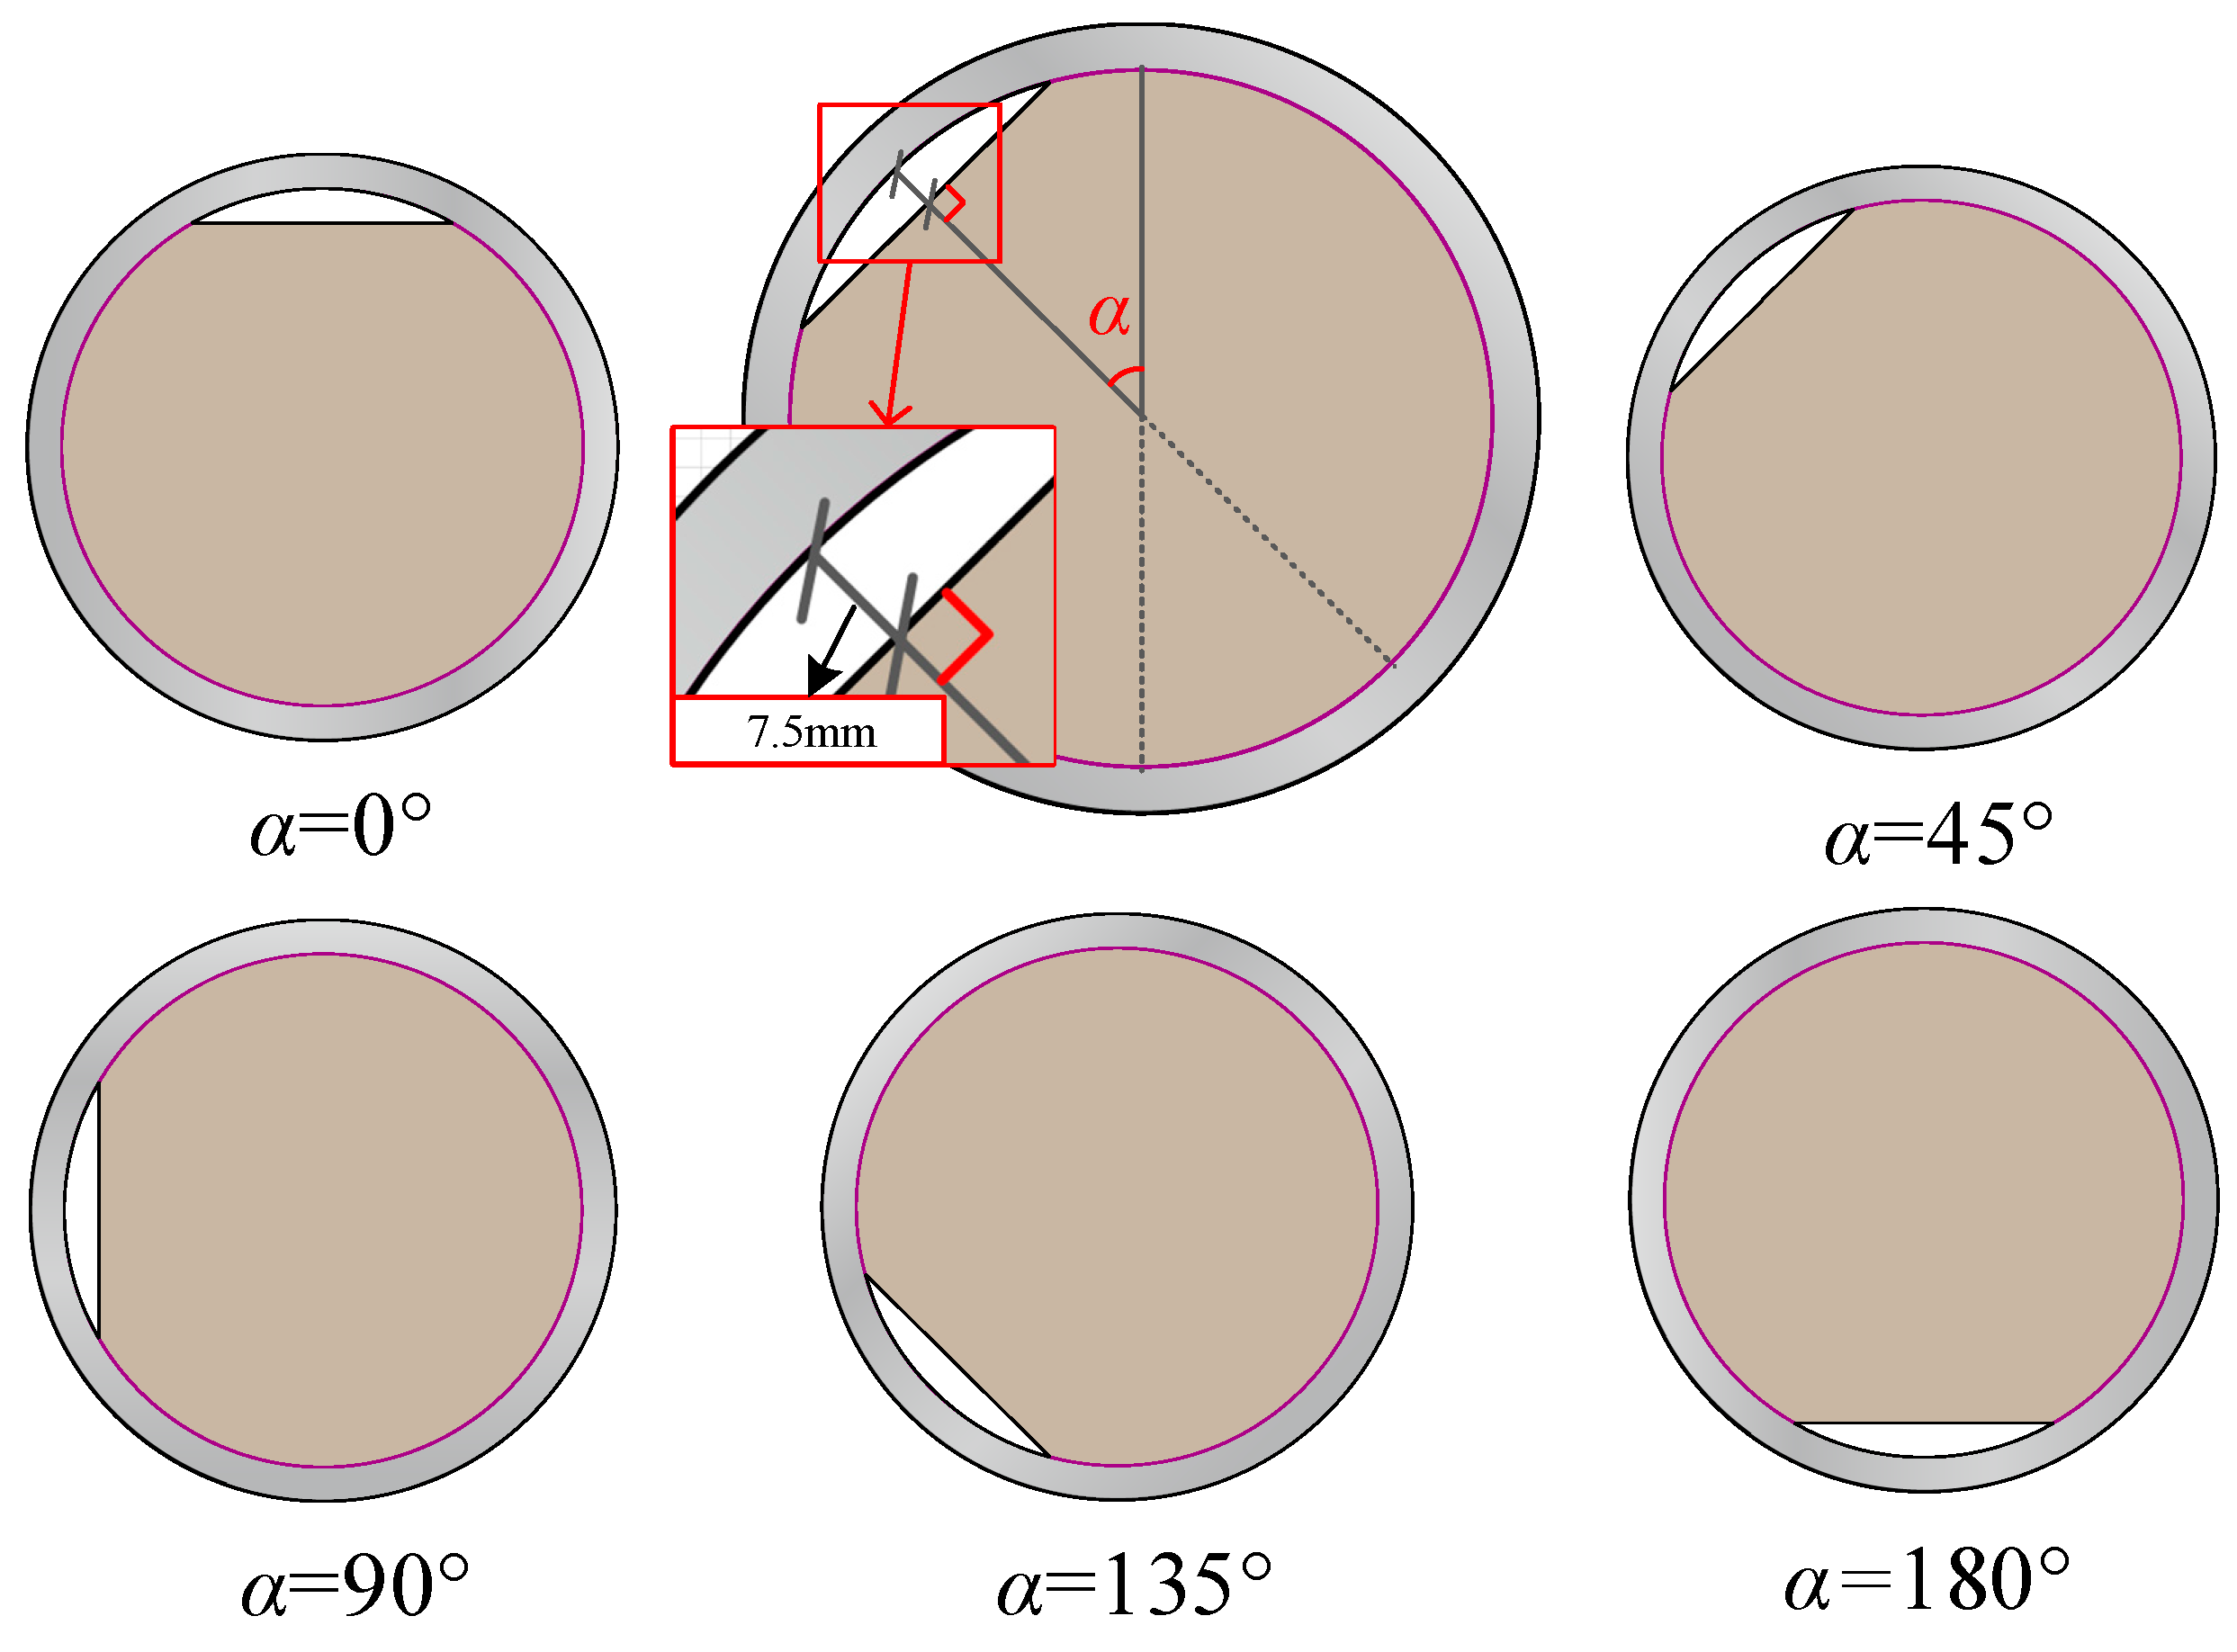
In this section, the effect of the angle between loading direction and coronal gap axis on the flexural capacity of CCFSTs is investigated, and the height of the coronal-cap gap was fixed as 7.5 mm. The angles between the load direction and coronal gap axis were set to 0°, 45°, 90°, 135°, and 180°, respectively, as illustrated in Figure 6. At the same time, the interface between the core concrete and steel pipe allowed for cohesion and friction. Then, the difference in the flexural capacity of the structures with and without interfacial bonding could be clarified, and the ability of the coupled cohesive–friction cohesive model could be tested.
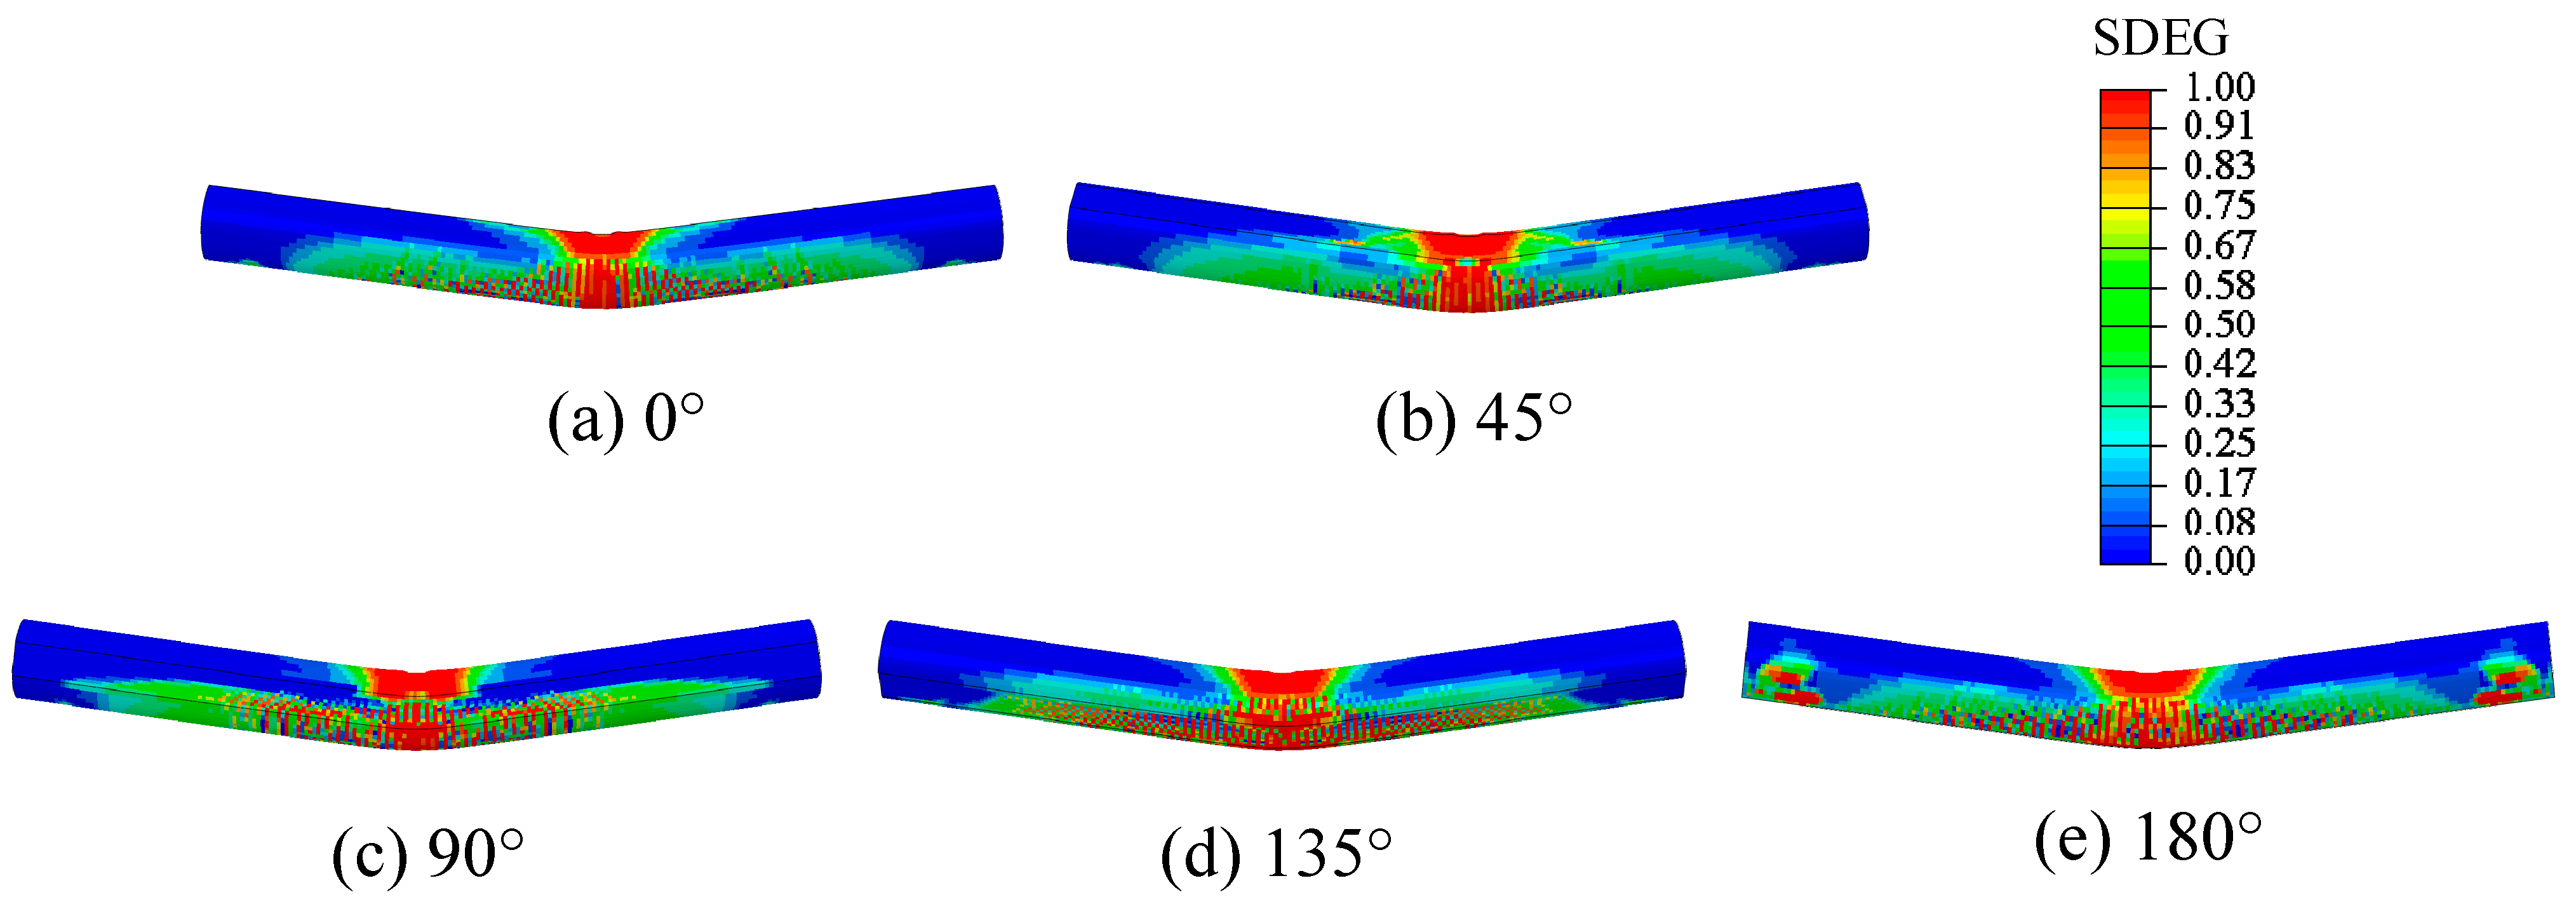
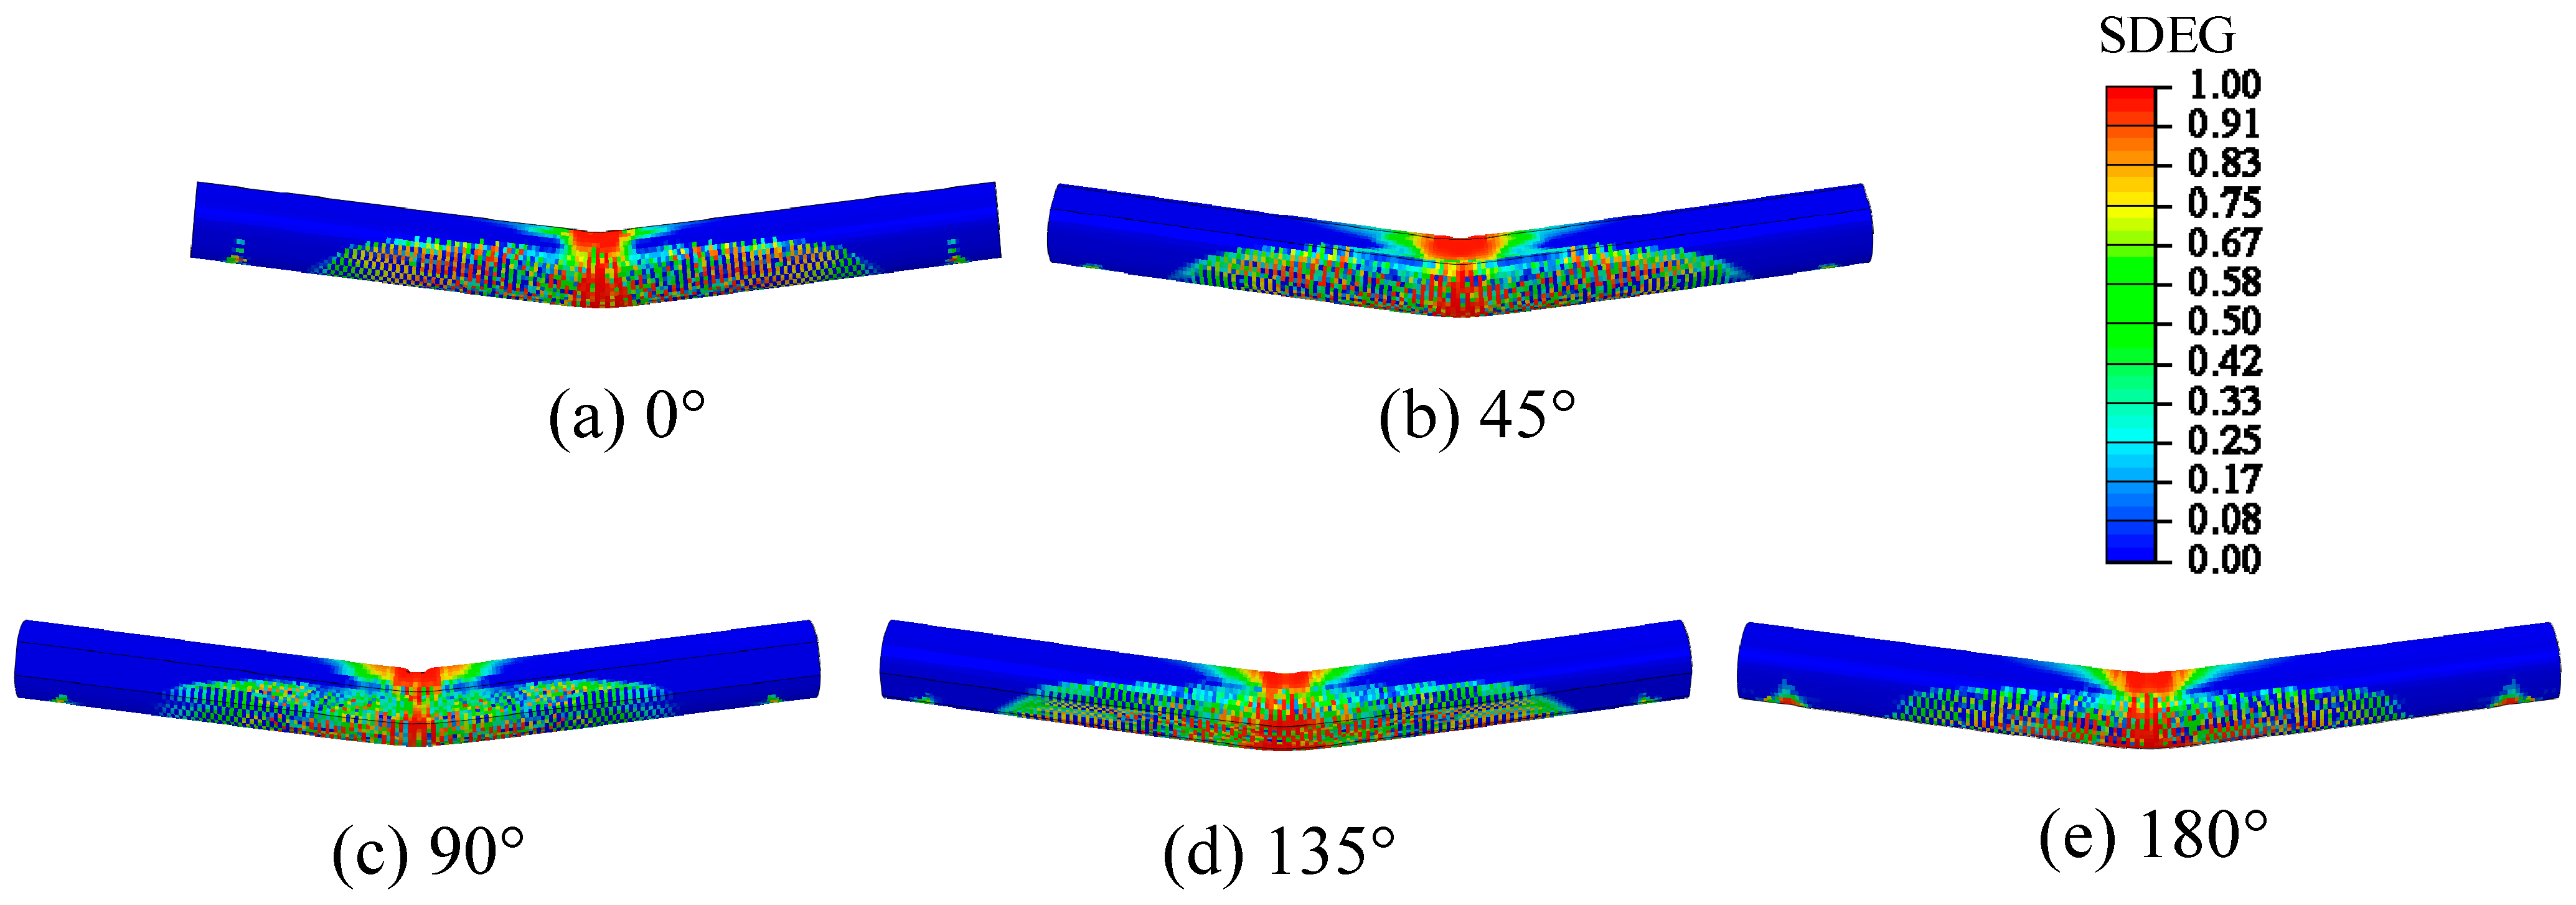
The static displacement load was applied, and the damage fields (SDEGs) of the core concrete are displayed in Figure 7. It should be explained that the SDEG field was chosen because it contains the necessary information on concrete damage. The SDEG field displays the superposition of the tensile damage and compressive damage, and it can comprehensively reflect the complete stiffness degradation distribution inside the structure. The relationship between the SDEG field, tensile damage field, and compressive damage field can be expressed by Equation (22), as follows:
1 S D E G = 1 s t D a m a g e T 1 s c D a m a g e C , Cyclic 1 D a m a g e T 1 D a m a g e C , Monotonic
where DamageT and DamageC are the damage factors of tension and compression; st and sc are the recovery coefficients of tension and compression, respectively. Monotonic loading was applied in this study.
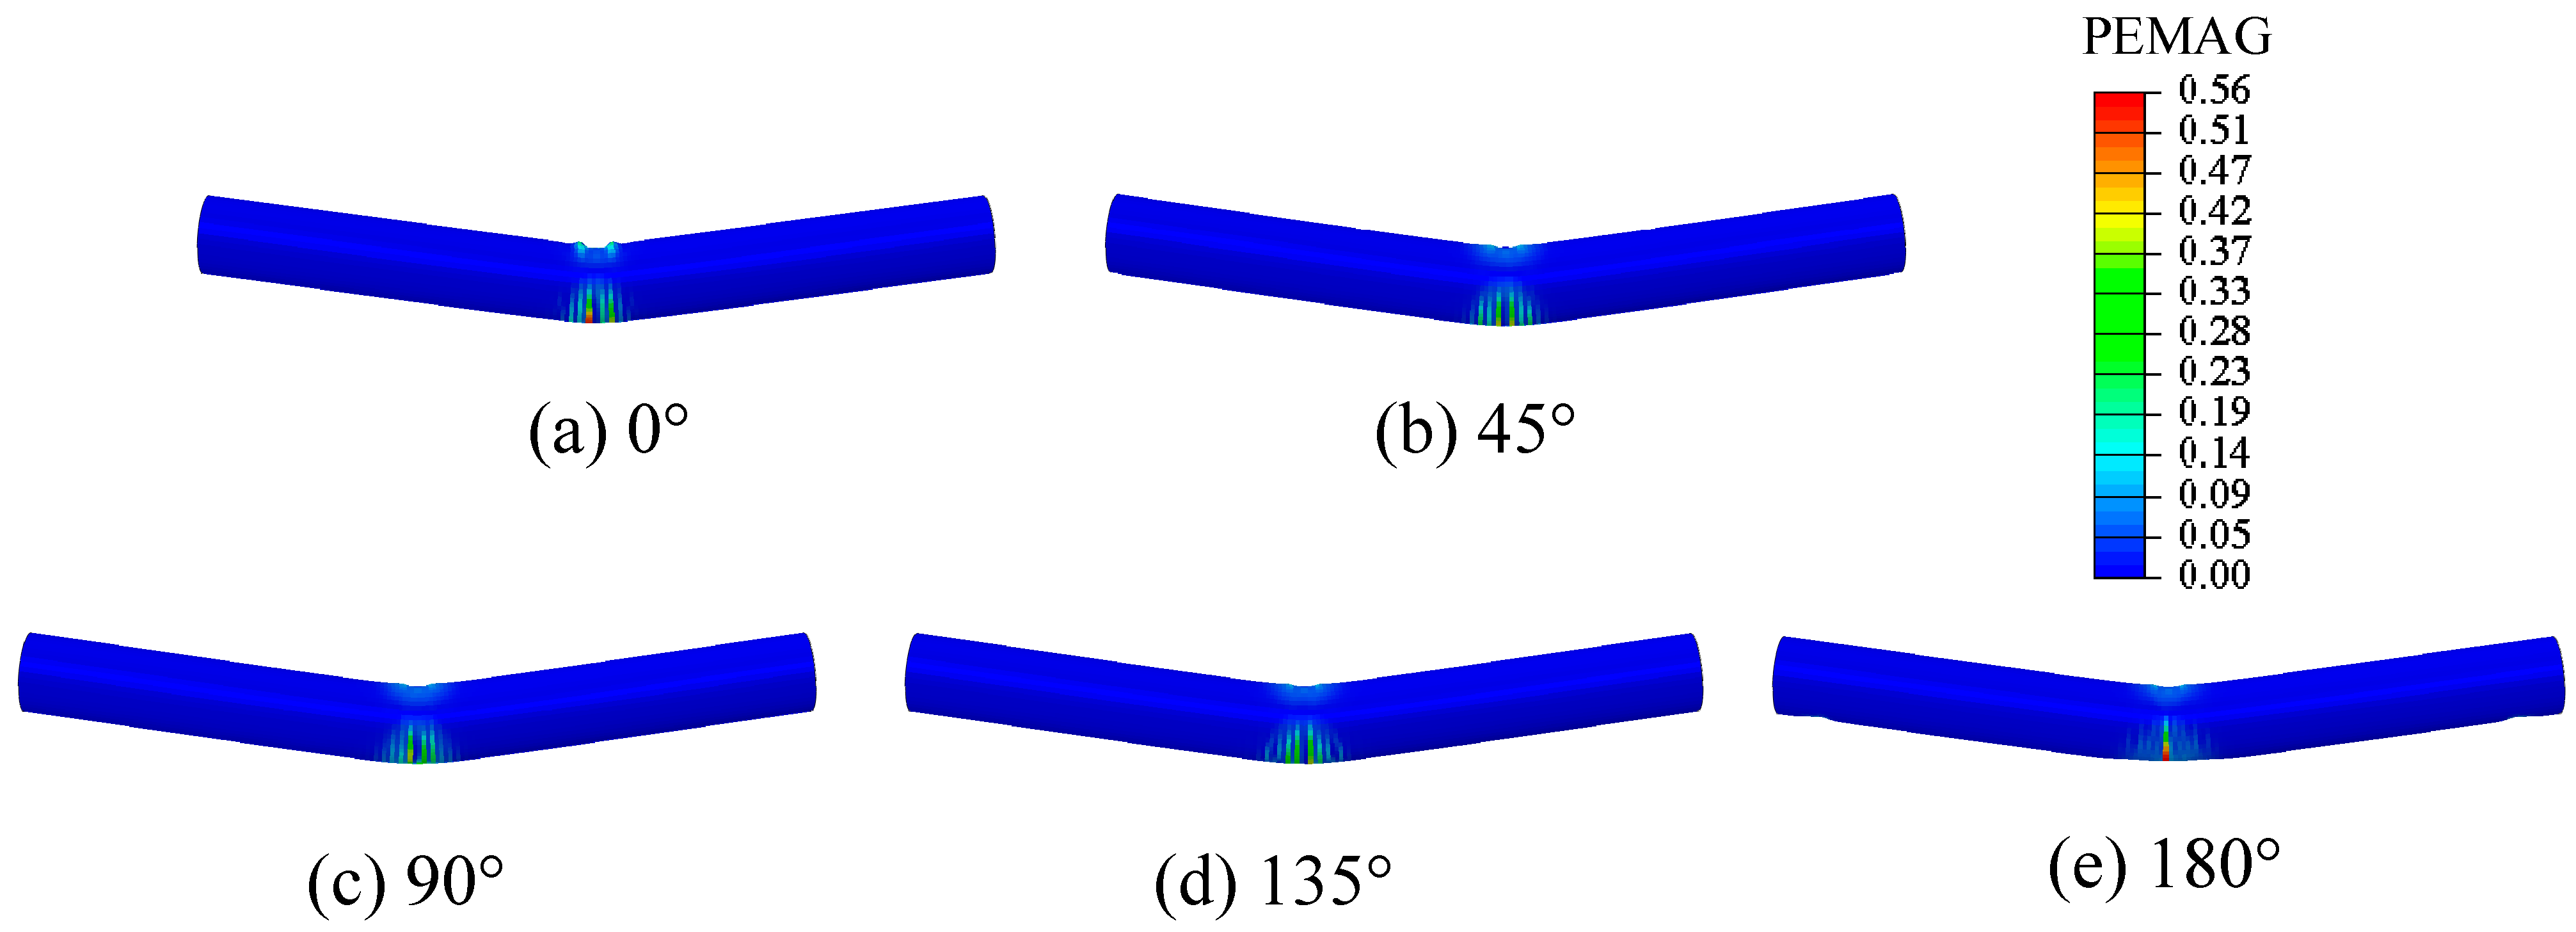
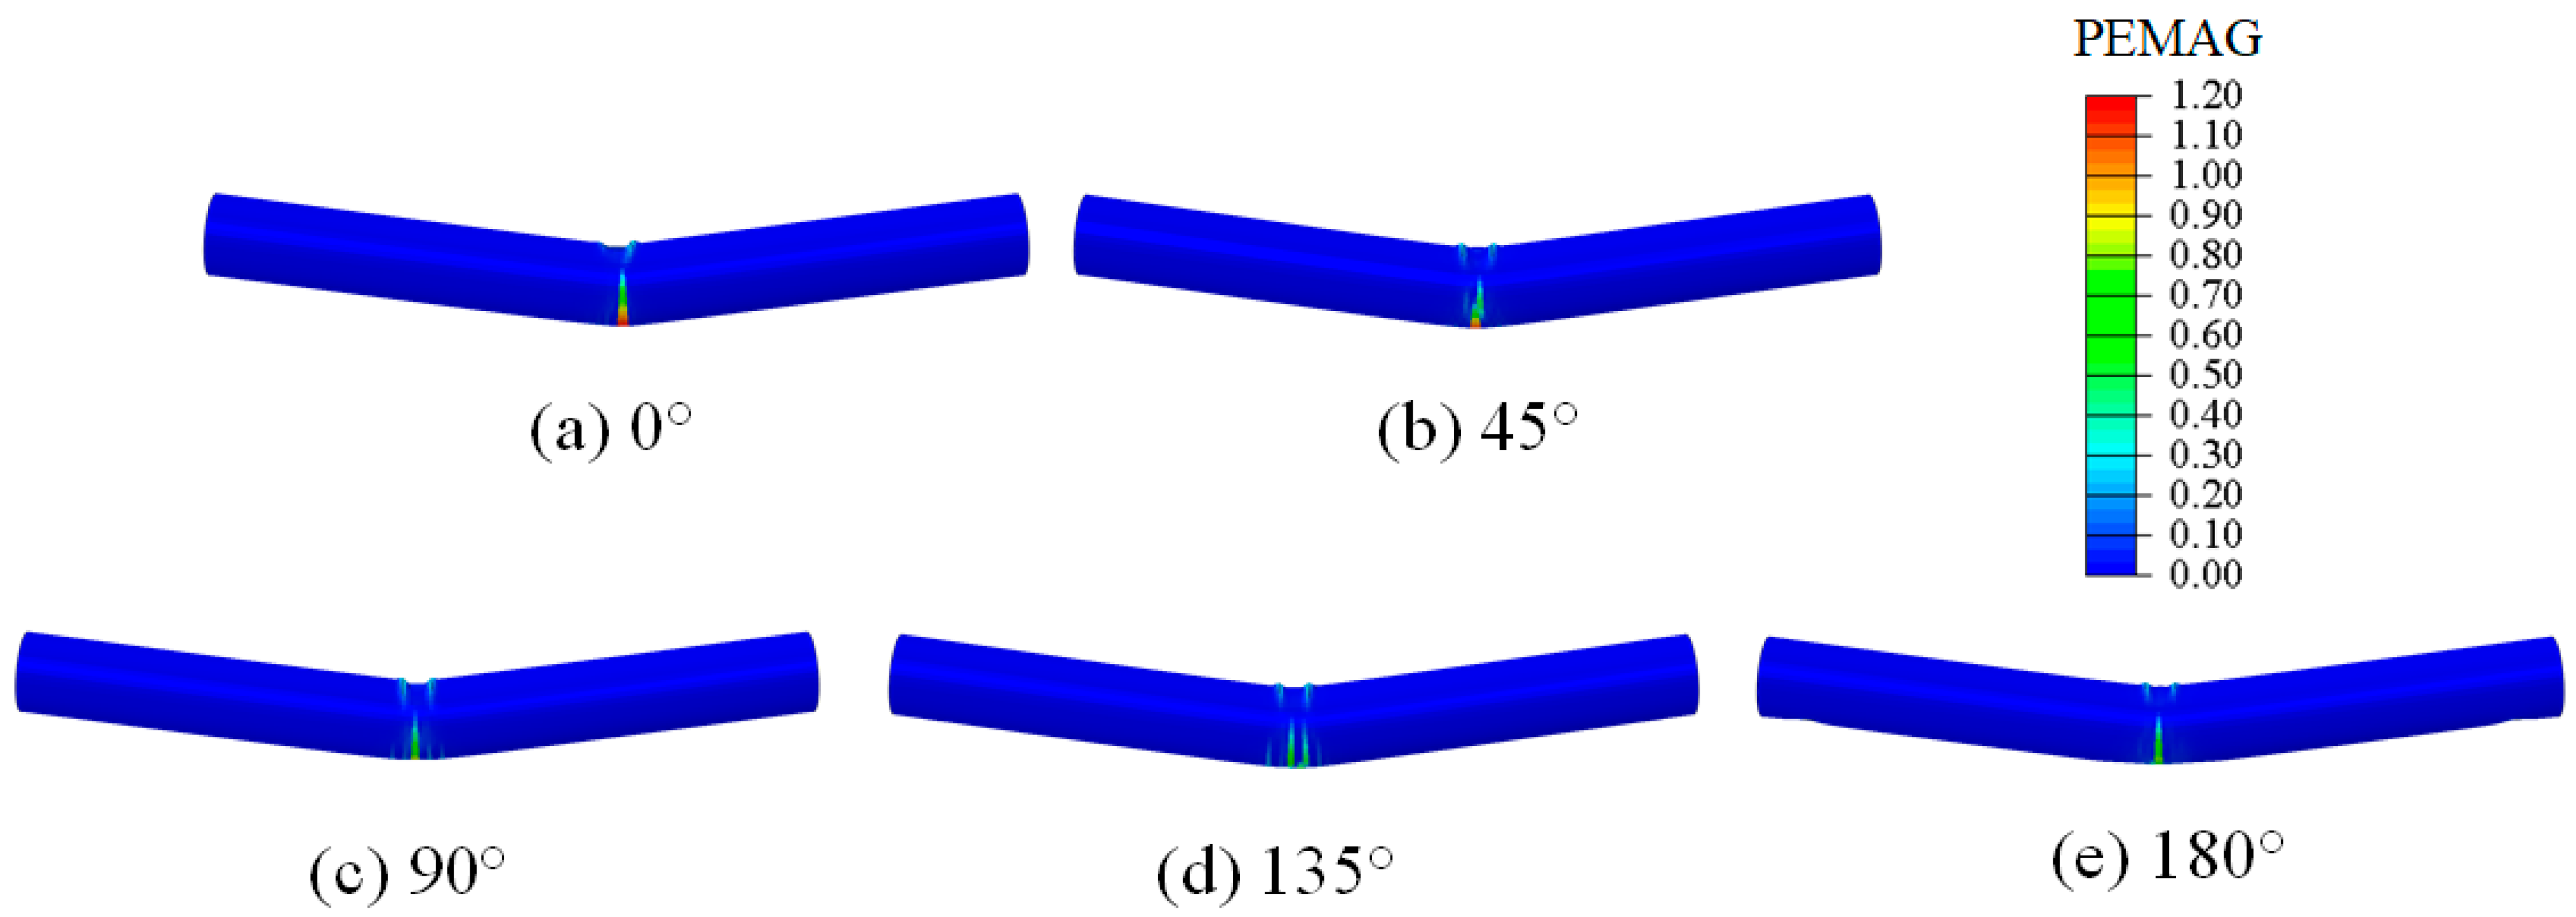
The equivalent plastic strain fields (PEMAGs) of the outer steel tube are displayed in Figure 8.
As illustrated in Figure 7, in the upper part of the core concrete of the CCFST, the damage shows a continuous status, and a compression failure area formed. However, the lower part of the core concrete shows a strip distribution status. At this area, tensile failure continued to occur. Although the compression failure characteristics under each angle were quite similar, the tensile failure region of 45° was more concentrated in the middle of the sample. The concentration degree decreased when the angle equaled 90°. The difference was not significant for the other conditions. The equivalent plastic strain field of the outer steel tube reflected the inelastic deformation. It can be seen in Figure 9 that the equivalent plastic strains of 0° and 180° were much larger than the other angles, and 180° was the most significant. The equivalent plastic strains were very similar when the angle equaled 45°, 90°, and 135°.
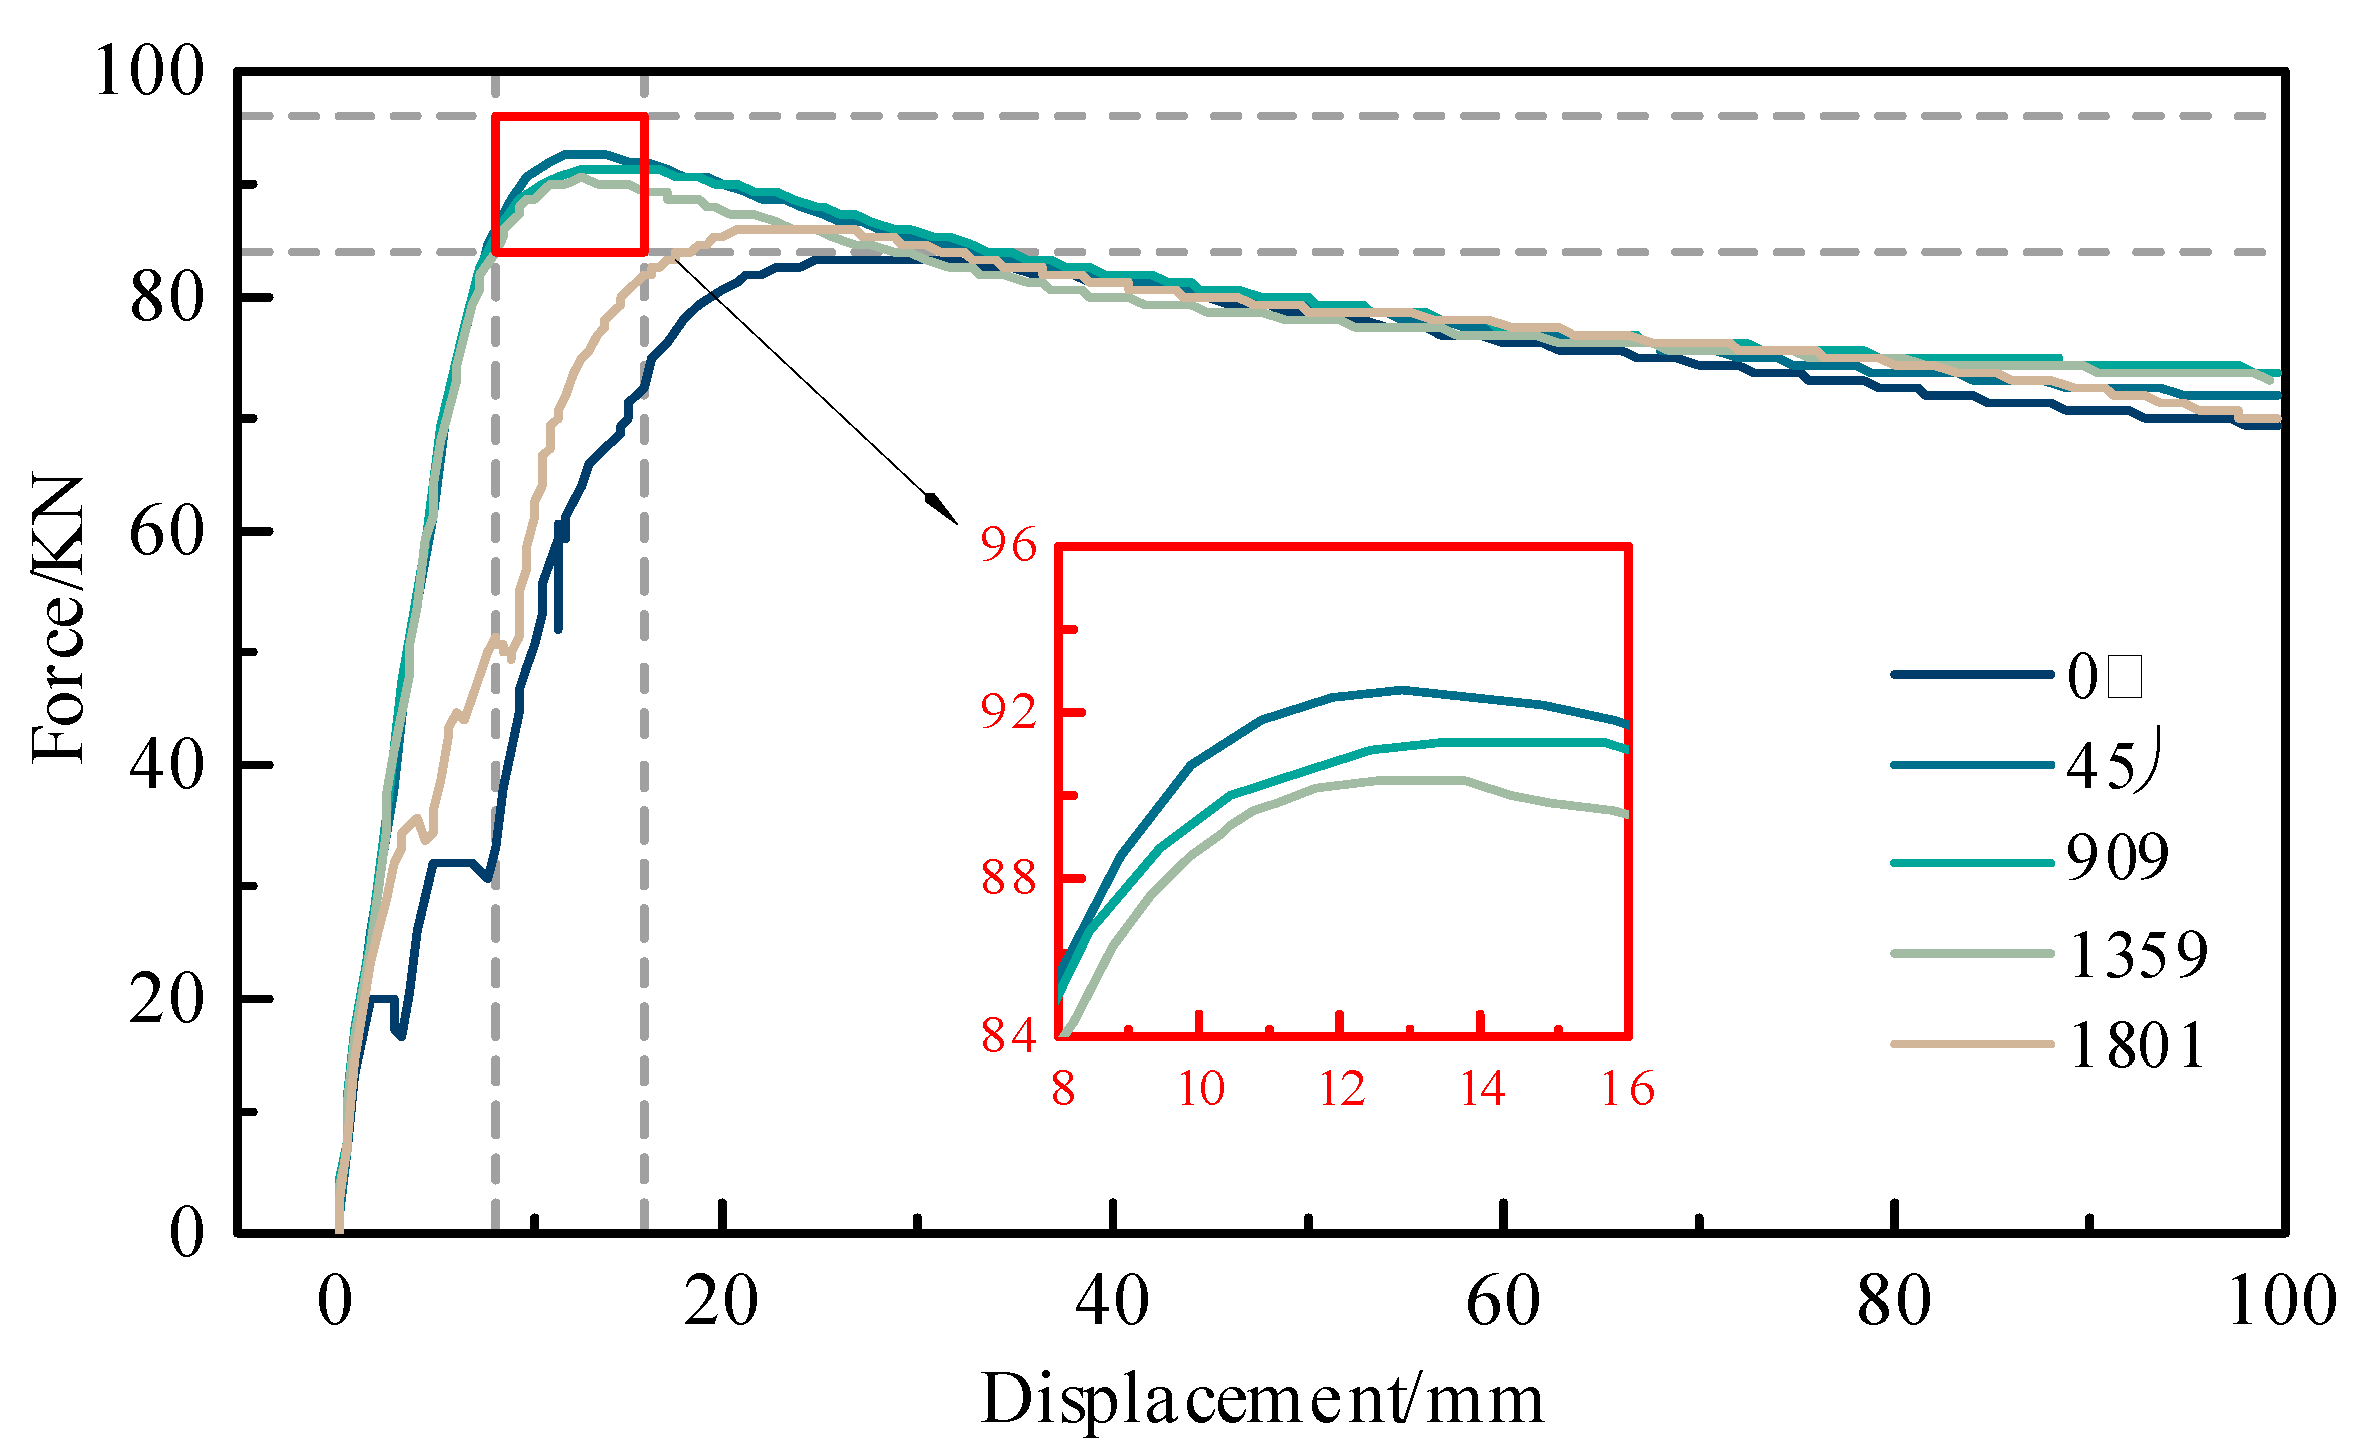
The rigid body elements were used as the loading blocks, as shown in Figure 5c. The reference points were coupled to the loading device to control the displacement of the entire loading device and achieve the targeted load. Then, the displacements of the reference points and the reaction forces were extracted. Figure 9 shows the load–displacement curves under various angles. The peak force intuitively reflects the bending bearing capacity of the CCFST. It is clear that the peak forces, ranked from lowest to highest, were 45°, 90°, 135°, 0°, and 180°. Especially, when the angle equaled 0° and 180°, the peak force was much lower than the other degrees. This phenomenon demonstrates that the flexural capacity of the CCFST will seriously decrease when the gap axis and load direction are parallel.
For further comparison, a CCFST model without a mortar interlayer was built, and the contact between the outer steel tube and the core concrete is described by the Coulomb model. Figure 10 shows the damage fields of the CCFST core concrete under the varying angles between the loading direction and coronal gap axis, from which it can be seen that the damage distribution of the CCFST core concrete was more dispersed than that with a mortar interlayer. This phenomenon was caused by the lack of interlayer bonding. The difference in the damage distribution can not only reflect the bonding effect of the interface but also verify the validity and rationality of the adopted coupling model. Furthermore, the equivalent plastic strain fields are illustrated in Figure 11, from which we can see that the maximal strain was 1.2 in the CCFST without a mortar interlayer, and when the angle was 0°, the value was far larger than the CCFST with a mortar interlayer. Thus, the fine bonding will greatly reduce the damage of concrete and steel.
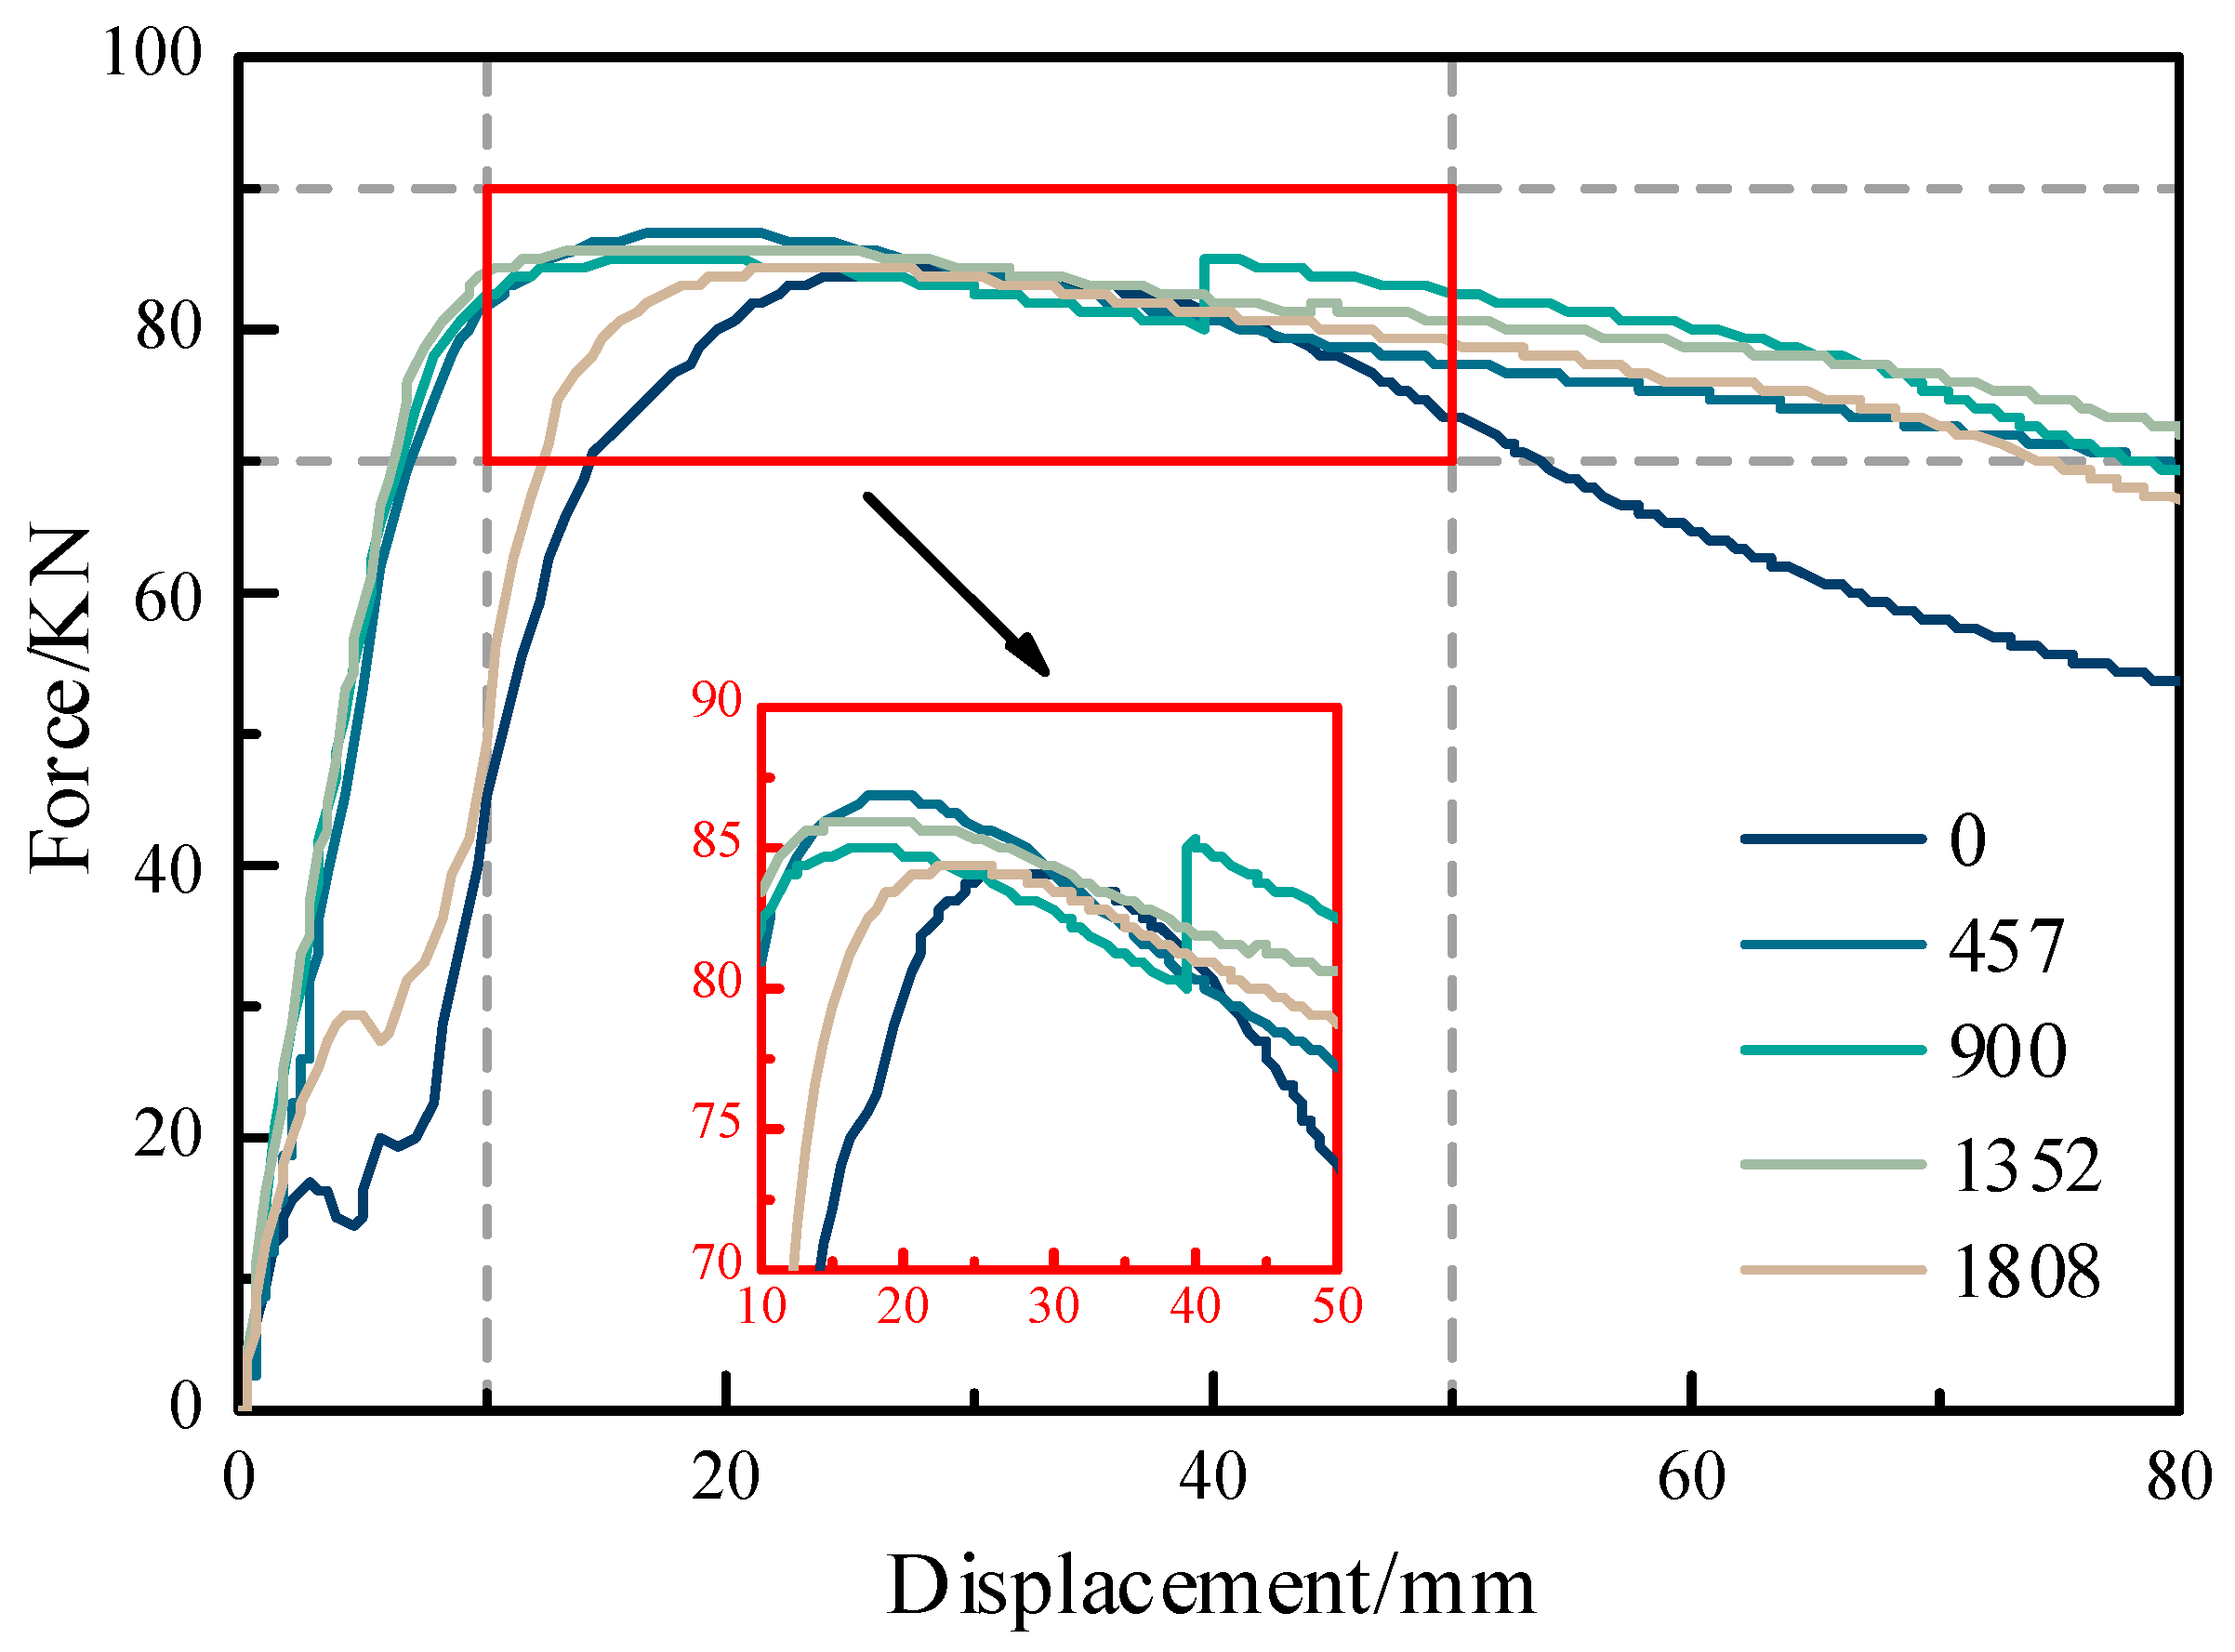
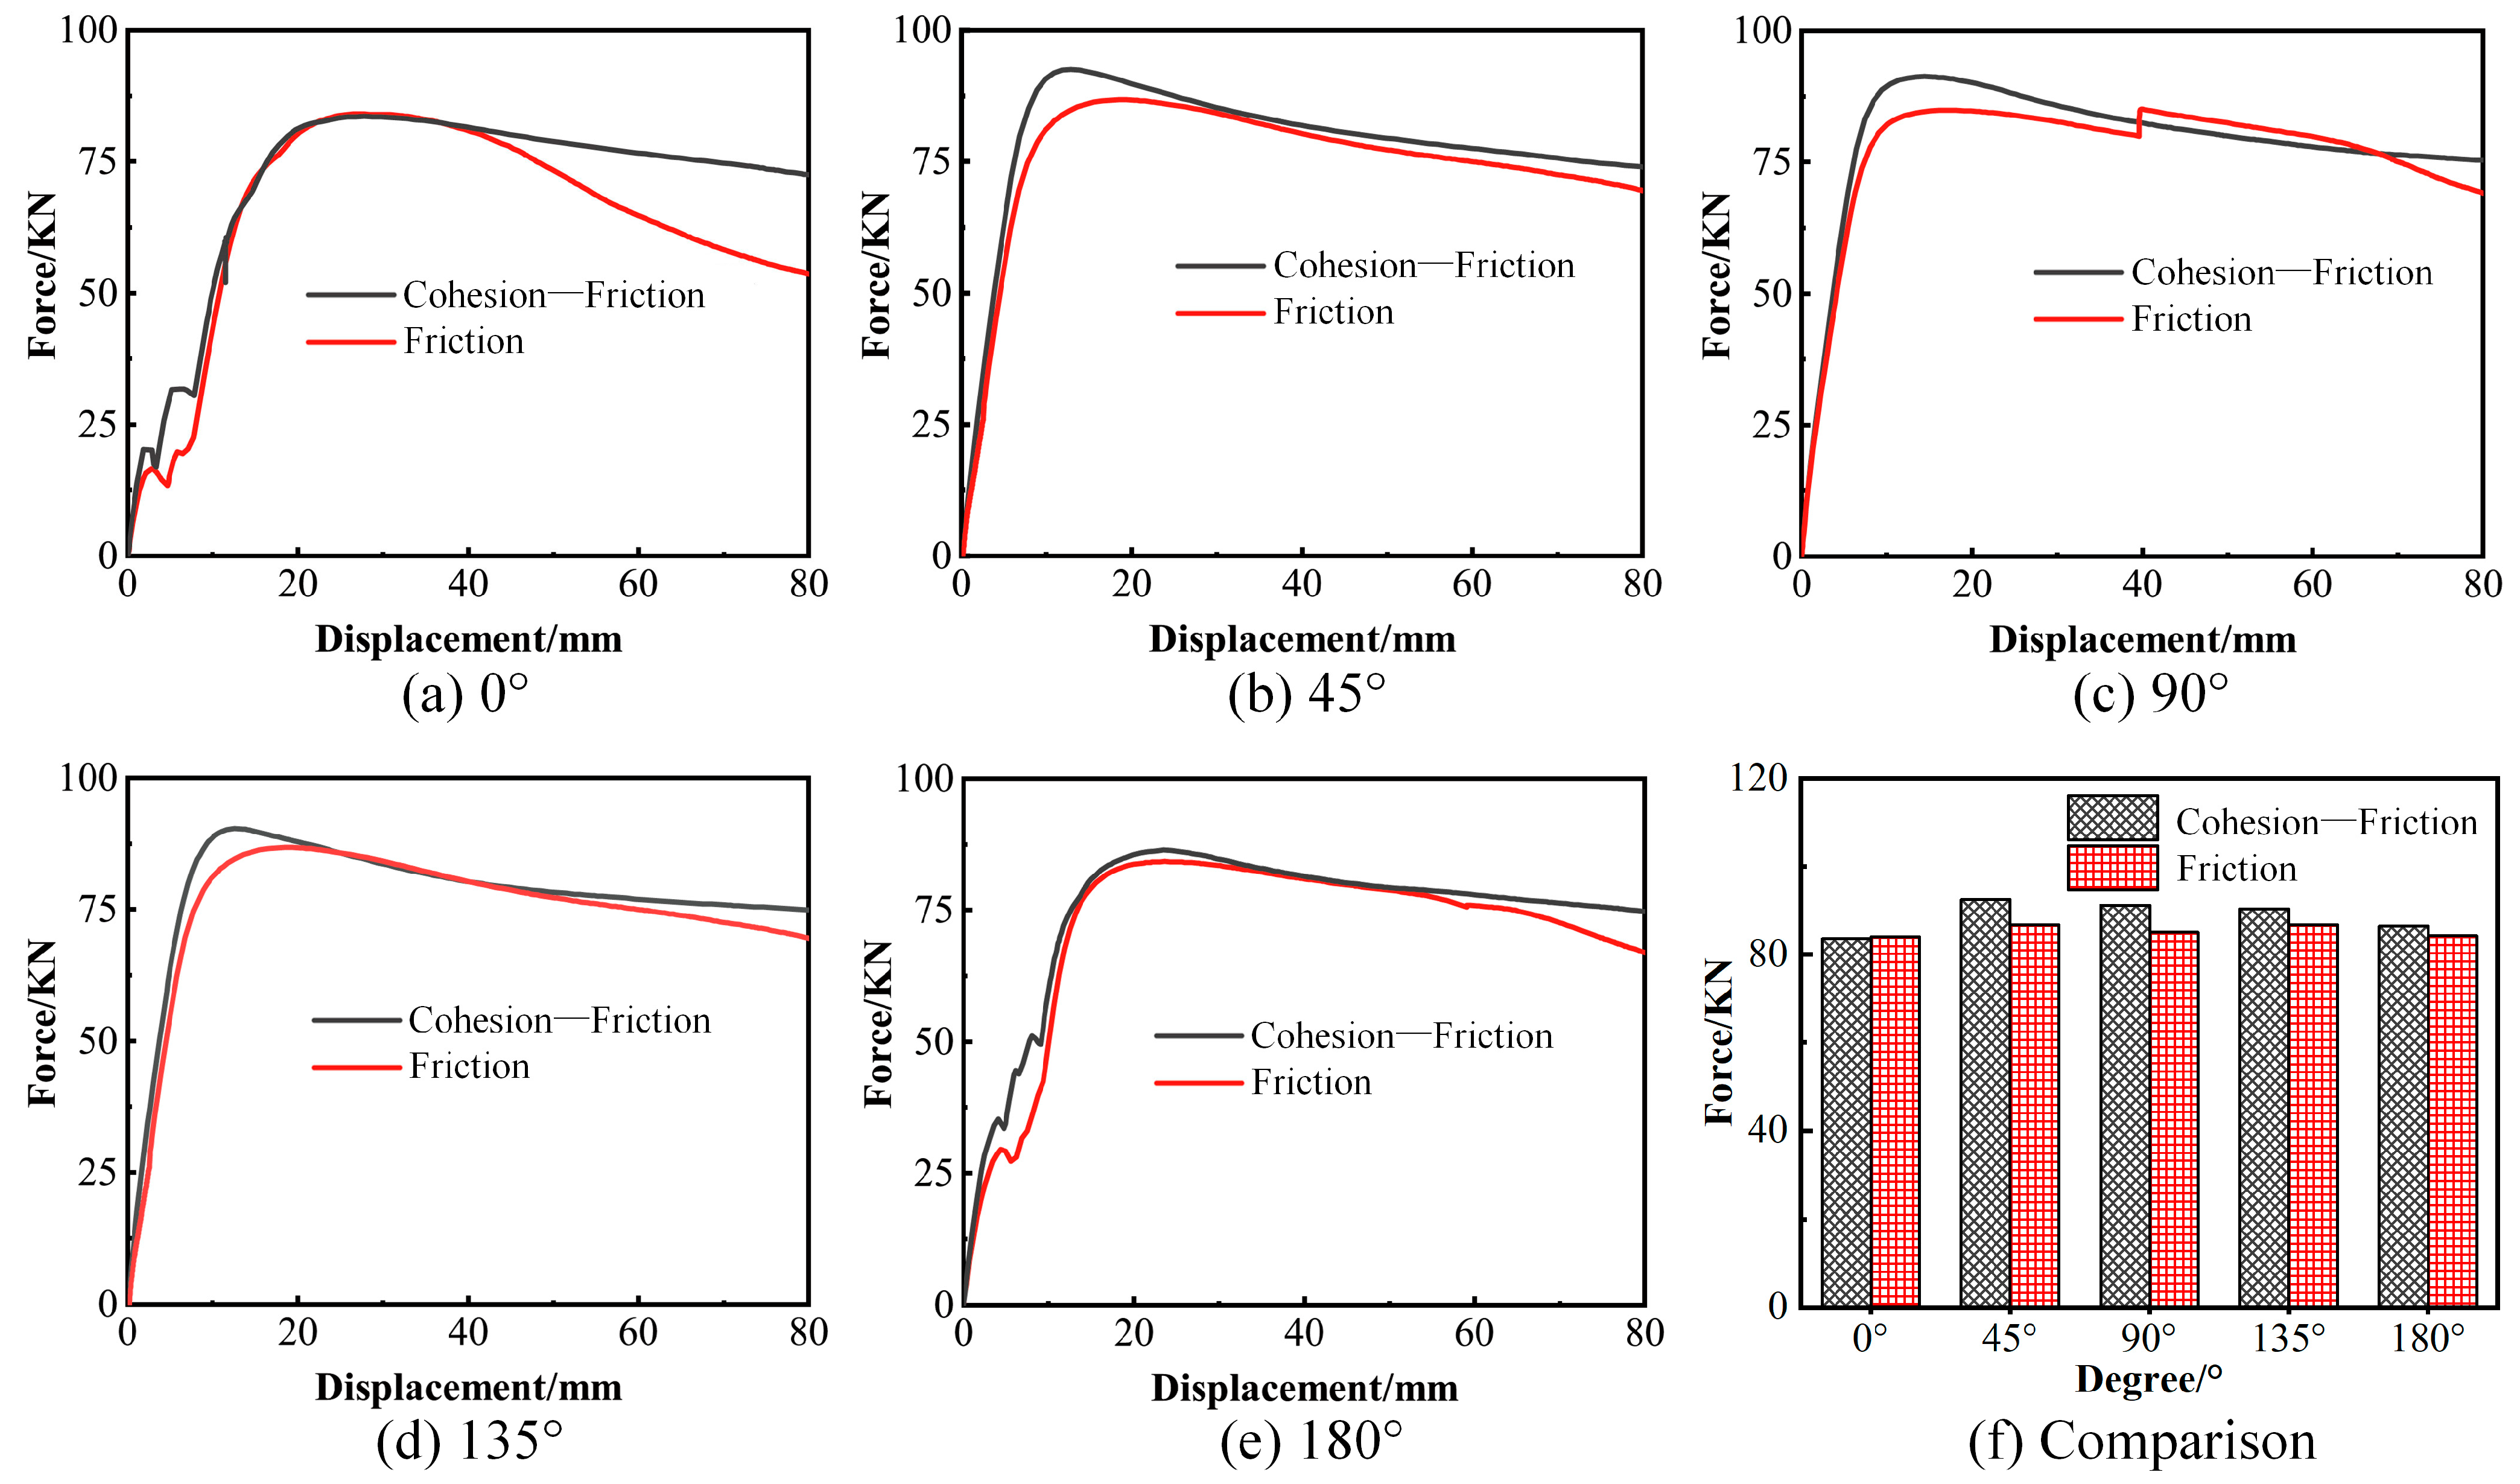
Figure 12 shows the load–displacement curves of the CCFST without a mortar interface under different angles between the loading direction and coronal gap axis. We can see that the peak stress at the 45° angle was the largest, and the peak stresses were the lowest when the angles equaled 0° and 180°, which are consistent with the CCFST with a mortar interface. Figure 13a–e illustrate a comparison of the load–displacement curves when the angle changed from 0° to 180°. The initial stiffness of the load–displacement curves of the CCFST with a mortar interface was larger than that without an interface, but the peak forces were at the same level. After the peak force, a more urgent decreasing tendency appeared in the curves of the CCFST without a mortar interface.
Figure 13f shows a comparison of the peak forces of the different load–displacement curves. Obviously, the peak forces of the CCFST with a mortar interface were larger than that without a mortar interface, except 0°. Namely, when the angle between the loading direction and gap axis equaled 0°, the improvement in the flexural capacity of the CCFST due to the mortar interface bonding was the smallest.

3.3. Effect of the Coronal Gap Height

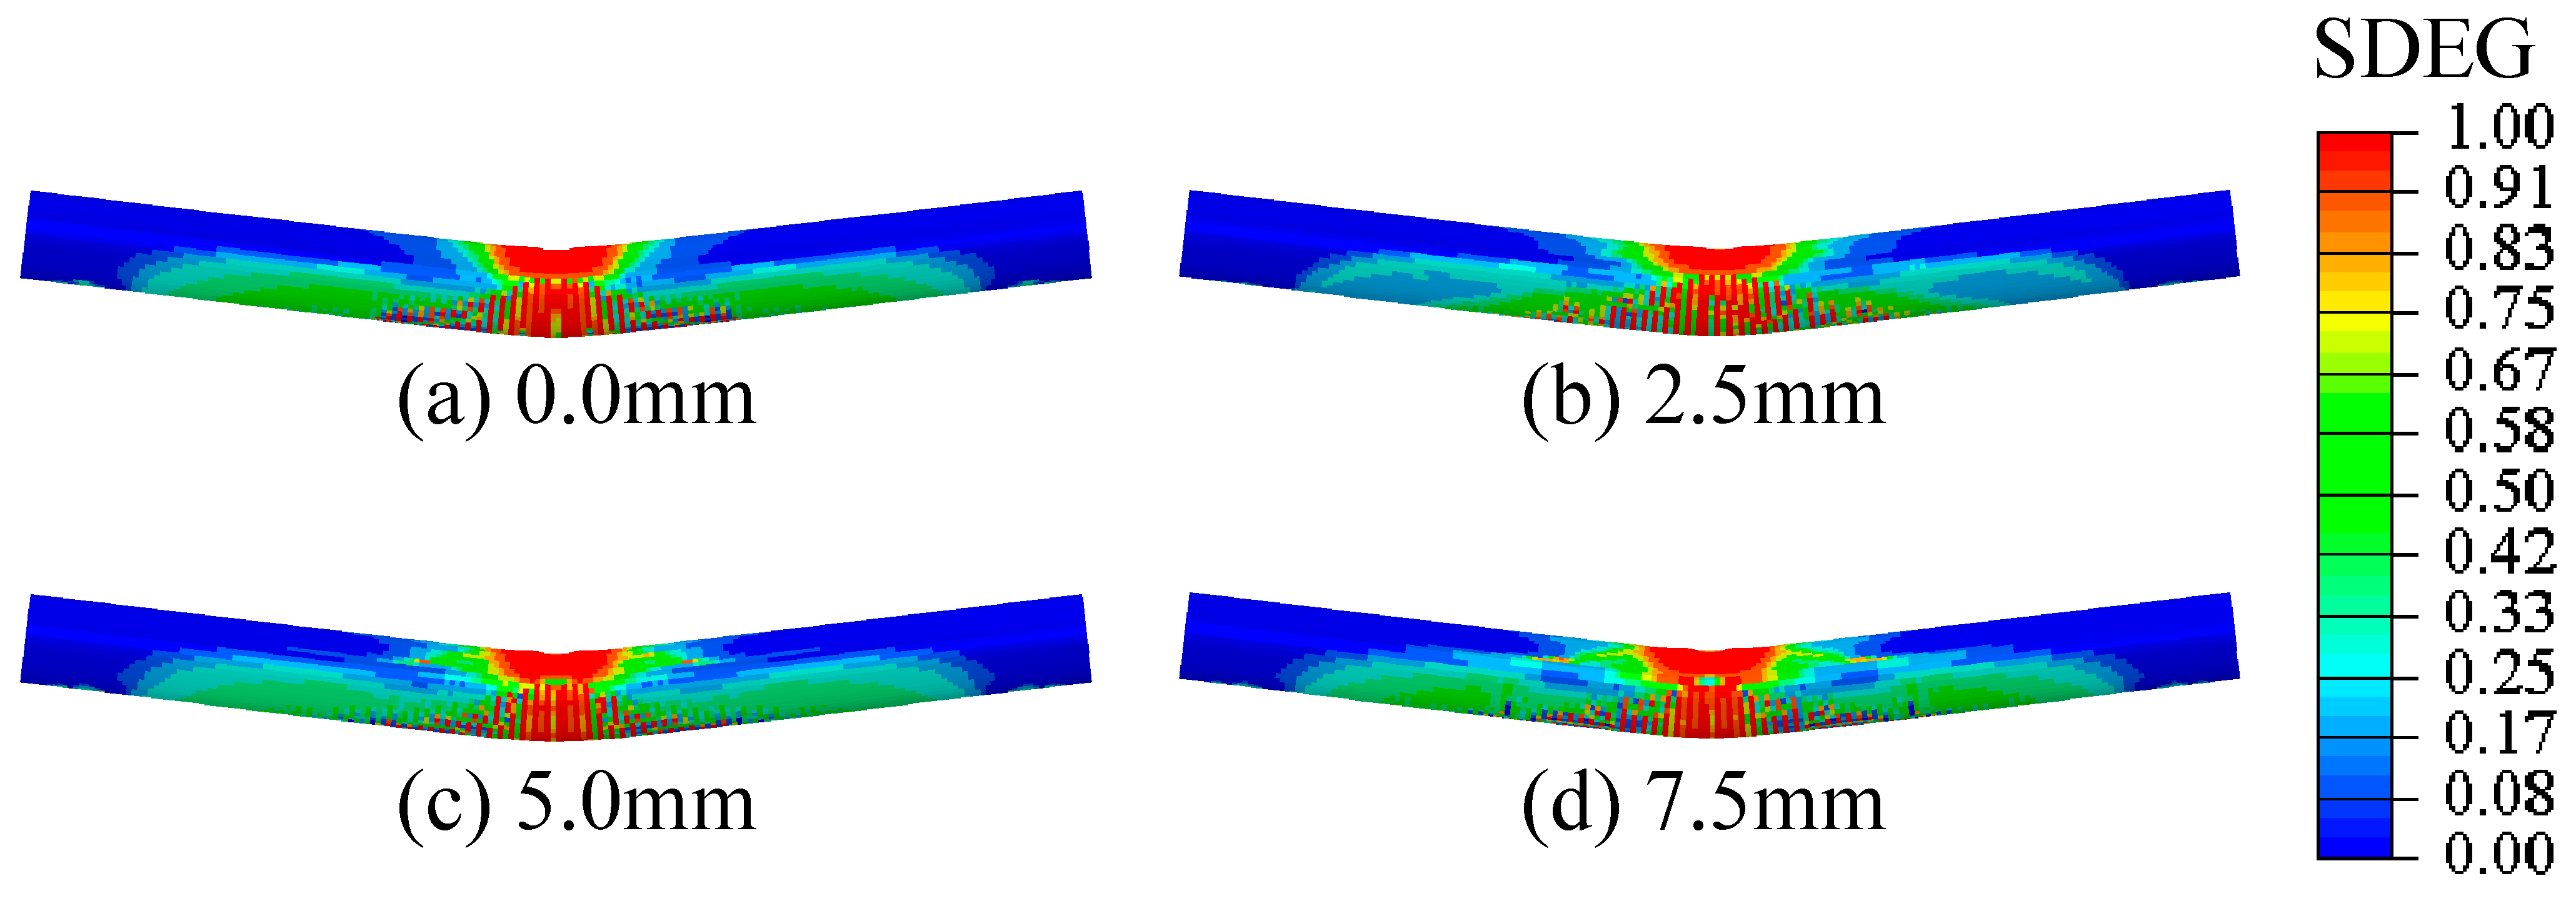
In this section, to investigate the effect of the coronal gap height, D, on the flexural capacity of CCFSTs, heights, D, were set to 0.0 mm, 2.5 mm, 5.0 mm, and 7.5 mm. As discussed in the above section, the largest peak force appeared when the angle between the load direction and coronal gap axis was 45°. Therefore, an inclination of 45° was used as the preset condition and the other factors were also kept unchanged.
Figure 14 shows the CCFST damage fields under different coronal gap heights, from which we can see that after the three-point bending load, their damage distributions were very similar, which means that the coronal gap height had little effect on the formation and evolution of damage in the structure. From Figure 15, we can find that when the gap height was 2.5 mm, the equivalent plastic strain of the outer steel tube was the largest. Then, the equivalent plastic strain decreased with the gap height rose from 0.0 mm to 5.0 mm and 7.5 mm. Furthermore, as illustrated in Figure 16, the force–displacement curves show the comparatively obvious regularity. The curves of the four conditions show the same initial stiffness. However, the peak loads were obviously different. The order of the peak forces, from highest to lowest, are when the gap height equaled 0.0 mm, 2.5 mm, 5.0 mm, and 7.5 mm. When there is no coronal gap, the flexural capacity of the CCFST is significantly higher than that with a coronal gap. Hence, the integrity of the core concrete has an important impact on the flexural capacity of CCFSTs.

4. Discussion

To quantify and compare the effect of various gap conditions on the strength of CCFST structures, the strength index (SI) was introduced to normalize the strength parameter, and it can be defined by Equation (23), as follows:
S I = F max g a p F max int a c t
where Fmax-gap is the maximum force in the loading procession of the CCFST with a gap; Fmax-intact is the maximum force in the loading procession of the intact CCFST.
In Eurocode 4, it is stated that the design of steel–concrete composite structures needs to consider the geometric defects [64]. Therefore, it can help guide the design of engineering projects and provide theoretical basis for eliminating the specific effect of geometric defects to exploring the influence of gap location and distance on the flexural bearing capacity of CCFSTs. In this study, the SI of the CCFST is introduced, and its correlation with different loading angles and clearance distances are shown in Figure 17. When the coronal gap distance remained constant, the bearing capacity of the CCFST structure with only friction at the interface between the steel tube and concrete was the worst, with an SI between 0.789 and 0.814. In this scenario, the influence of the angle between the coronal gap and the loading direction on the flexural performance was relatively small. However, for the CCFST structure with cohesive bonding, the SI ranged from 0.784 to 0.868. The angle between the coronal gap and the loading direction had a significant effect on the flexural performance, and the optimal angle for the structural strength was 45°. The change in the coronal gap distance had the most significant impact on the flexural bearing capacity of the CCFST, and the SI decreased quickly with the increase in the gap distance. In summary, coronal gap has a great impact on the performance of the CCFST structures. If coronal gap cannot be completely avoided, the designed bending capacity of the structure will decrease.

5. Conclusions

In this study, the improved cohesive interlayer model was adopted to investigate the influence of friction on the shear-slip behavior of heterogeneous brittle composites. By comparing simulated shear deformation results of a masonry wallette with the corresponding experimental data, the model’s effectiveness and validity were confirmed. Subsequently, it was applied to analyze the mechanical response of CCFST structures subjected to three-point bending. The key findings can be summarized as follows:
(1)
The improved cohesive interface model can ensure that friction and cohesion peak at the same element deformation. The unified potential function governing the tangential and normal behaviors of an interface can facilitate the mechanical interaction between Mode I and Mode II fractures. Meanwhile, the smooth friction growth function, which was incorporated during the elastic deformation stage, can accurately capture contact pressure and friction force. This approach can also address the issue of excessive invasion between contact surfaces which may lead to incorrect deformation.
(2)
By comparing with the classical shear test on the composite masonry structure, we found that the applied model shows the advantage of convenient parameter fitting. Simultaneously, it indicates high accuracy in predicting shear stress and shear displacement. Especially, it is universally applicable under different compressive stress conditions. The predicted shear stress–displacement curves generally fell within the envelope of the experimental data, and the model showed high accuracy in predicting both shear strength and residual strength.
(3)
Under three-point bending, when the angle between the loading direction and the coronal gap axis was 0° or 180°, the middle part of the CCFST structure exhibited significantly higher equivalent plastic strains and lower peak bearing forces compared to the other angles. In addition, the CCFST without a mortar interface showed much larger equivalent plastic strains and higher peak bearing forces at the middle part than the CCFST with a mortar interface. In addition, the peak bearing forces decreased as the height of the coronal gap increased from 0.0 mm to 7.5 mm, with the highest forces observed at 0.0 mm and the lowest at 7.5 mm. Given the significant weakening of the structural performance caused by the coronal gap, the SI can be beneficial for the structural design of CCFSTs.

Author Contributions

J.Y.: Investigation, Formal analysis, Visualization, Data curation, and Writing—Original draft; B.G.: Conceptualization, Methodology, Supervision, and Writing—Review and Editing; C.C.: Formal analysis, Validation, and Writing—Review and editing. All authors have read and agreed to the published version of the manuscript.

Funding

This research received no external funding.

Institutional Review Board Statement

Not applicable.

Informed Consent Statement

Not applicable.

Data Availability Statement

All data files are available from the Brunel University London’s data repository, Brunelfigshare, under a CCBY license with the DOI of 10.17633/rd.brunel.26980513.

Conflicts of Interest

The authors declare no conflicts of interest.

References

  1. Zheng, J.L.; Wang, J.J. Concrete-filled steel tube arch bridges in China. Engineering 2018, 4, 143–155. [Google Scholar] [CrossRef]
  2. Guo, C.; Lu, Z.R. Air void and cap gap composite defects of concrete-filled steel-tube arch bridge transverse brace. J. Perform. Constr. Facil. 2020, 34, 04020073. [Google Scholar] [CrossRef]
  3. Yu, J.; Gong, B.; Cao, C.; Tang, C. A novel cohesive interlayer model considering friction. Int. J. Solids Struct. 2024, 305, 113049. [Google Scholar] [CrossRef]
  4. Chen, H.B.; Xu, B.; Zhou, T.M. Multi-scale stress wave simulation for aggregates segregation detection of concrete core in circular CFST coupled with PZT patches. Materials 2018, 11, 1223. [Google Scholar] [CrossRef] [PubMed]
  5. Liao, F.Y.; Han, L.H.; He, S.H. Behavior of CFST short column and beam with initial concrete imperfection: Experiments. J. Constr. Steel Res. 2011, 67, 1922–1935. [Google Scholar] [CrossRef]
  6. Rath, S.; Ouchi, M.; Puthipad, N.; Attachaiyawuth, A. Improving the stability of entrained air in self-compacting concrete by optimizing the mix viscosity and air entraining agent dosage. Constr. Build. Mater. 2017, 148, 531–537. [Google Scholar] [CrossRef]
  7. Liao, F.Y.; Han, L.H.; Zhong, T. Behaviour of CFST stub columns with initial concrete imperfection: Analysis and calculations. Thin-Walled Struct. 2013, 70, 57–69. [Google Scholar] [CrossRef]
  8. Han, L.H.; An, Y.F. Performance of concrete-encased CFST box stub columns under axial compression. J. Constr. Steel Res. 2014, 93, 62–76. [Google Scholar] [CrossRef]
  9. Han, L.H.; Ye, Y.; Liao, F.Y. Effects of core concrete initial imperfection on performance of eccentrically loaded CFST columns. J. Struct. Eng. 2016, 142, 04016132. [Google Scholar] [CrossRef]
  10. Huang, Y.H.; Liu, A.R.; Fu, J.Y.; Pi, Y.L. Experimental investigation of the flexural behavior of CFST trusses with interfacial imperfection. J. Constr. Steel Res. 2017, 137, 52–65. [Google Scholar] [CrossRef]
  11. Chen, S.; Hou, C.; Zhang, H.; Han, L.H. Structural behaviour and reliability of CFST trusses with random initial imperfections. Thin-Walled Struct. 2019, 143, 106192. [Google Scholar] [CrossRef]
  12. Huang, Y.H. Mechanism and Effect of Arch Rib Disease and Suspender Replacement for Concrete-Filled Steel Tube Arch Bridges. Ph.D. Thesis, South China University of Technology, Guangzhou, China, 2010. [Google Scholar]
  13. Hola, J.; Sadowski, L.; Schabowicz, K. Nondestructive identification of delaminations in concrete floor toppings with acoustic methods. Autom. Constr. 2011, 20, 799–807. [Google Scholar] [CrossRef]
  14. Ye, Y.; Li, W.; Liu, X.J.; Guo, Z.X. Behaviour of concrete-filled steel tubes with concrete imperfection under axial tension. Mag. Concr. Res. 2021, 73, 743–756. [Google Scholar] [CrossRef]
  15. Lu, Z.R.; Guo, C.; Li, G. Air void and ring gap effect on CFST arch bridges dynamic performance. J. Constr. Steel Res. 2020, 177, 106418. [Google Scholar] [CrossRef]
  16. Zhang, R.L.; Hao, Z.F.; Ma, L.N.; Ning, G.X.; Li, Z.Y.; Gao, F. Influence of defect rate and location of core concrete on the bearing capacity of concrete-filled steel tube. Build. Struct. 2021, 51, 78–84. [Google Scholar] [CrossRef]
  17. Chao, Z.; Gong, B.; Yue, W.; Xu, X.; Shi, D.; Yang, C.; Hu, T. Experimental study on stress-dependent gas permeability and porosity of artificially cracked cement mortar. Constr. Build. Mater. 2022, 359, 129290. [Google Scholar] [CrossRef]
  18. Tian, L.M.; Kou, Y.F.; Lin, H.L.; Li, T.J. Interfacial bond-slip behavior between H-shaped steel and engineered cementitious composites (ECCs). Eng. Struct. 2021, 231, 111731. [Google Scholar] [CrossRef]
  19. Feng, X.; Gong, B.; Liang, Z.; Wang, S.; Tang, C.; Li, H.; Ma, T. Study of the dynamic failure characteristics of anisotropic shales under impact Brazilian splitting. Rock Mech. Rock Eng. 2024, 57, 2213–2230. [Google Scholar] [CrossRef]
  20. Chen, B.; Gong, B.; Wang, S.; Tang, C. Research on zonal disintegration characteristics and failure mechanisms of deep tunnel in jointed rock mass with strength reduction method. Mathematics 2022, 10, 922. [Google Scholar] [CrossRef]
  21. Wang, Y.; Gong, B.; Tang, C.; Yang, X. Size effect and lateral pressure effect on the mechanical resistance of columnar jointed basalt. Int. J. Rock Mech. Min. Sci. 2023, 171, 105571. [Google Scholar] [CrossRef]
  22. Enayatpour, S.; van Oort, E.; Patzek, T. Thermal shale fracturing simulation using the Cohesive Zone Method (CZM). J. Nat. Gas Sci. Eng. 2018, 55, 476–494. [Google Scholar] [CrossRef]
  23. Benzeggagh, M.L.; Kenane, M. Measurement of mixed-mode delamination fracture toughness of unidirectional glass/epoxy composites with mixed-mode bending apparatus. Compos. Sci. Technol. 1996, 56, 439–449. [Google Scholar] [CrossRef]
  24. Haddad, M.; Sepehrnoori, K. XFEM-based CZM for the simulation of 3D multiple-stage hydraulic fracturing in quasi-brittle shale formations. Rock Mech. Rock Eng. 2016, 49, 4731–4748. [Google Scholar] [CrossRef]
  25. Tvergaard, V. Effect of fiber debonding in a whisker-reinforced metal. Mater. Sci. Eng. A 1990, 125, 203–213. [Google Scholar] [CrossRef]
  26. Gong, B.; Zhao, T.; Thusyanthan, I.; Tang, C. Modelling rock fracturing by a novel implicit continuous to discontinuous method. Comput. Geotech. 2024, 166, 106035. [Google Scholar] [CrossRef]
  27. Dehestani, M.; Mousavi, S.S. Modified steel bar model incorporating bond-slip effects for embedded element method. Constr. Build. Mater. 2015, 81, 284–290. [Google Scholar] [CrossRef]
  28. Jin, L.; Liu, M.J.; Huang, J.Q.; Du, X.L. Mesoscale modelling of bond failure behavior of ribbed steel bar and concrete interface. SCIENTIA SINICA Technol. 2019, 49, 445–454. [Google Scholar] [CrossRef]
  29. Bolhassani, M.; Hamid, A.A.; Lau, A.C.W.; Moon, F. Simplified micro modeling of partially grouted masonry assemblages. Constr. Build. Mater. 2015, 83, 159–173. [Google Scholar] [CrossRef]
  30. Zeng, B.; Li, Y.; Noguez, C.C. Modeling and parameter importance investigation for simulating in-plane and out-of-plane behaviors of un-reinforced masonry walls. Eng. Struct. 2021, 248, 113233. [Google Scholar] [CrossRef]
  31. Sunkpal, M.; Sherizadeh, T. Exploring the deformation mechanics of coal ribs using the distinct element modeling approach. Rock Mech. Rock Eng. 2022, 55, 2879–2898. [Google Scholar] [CrossRef]
  32. Yao, Y.; Liu, L.; Keer, L.M. Pore pressure cohesive zone modeling of hydraulic fracture in quasi-brittle rocks. Mech. Mater. 2015, 83, 17–29. [Google Scholar] [CrossRef]
  33. Li, Y.; Deng, J.G.; Liu, W.; Feng, Y. Modeling hydraulic fracture propagation using cohesive zone model equipped with frictional contact capability. Comput. Geotech. 2017, 91, 58–70. [Google Scholar] [CrossRef]
  34. Li, Y.; Liu, W.; Deng, J.; Yang, Y.; Zhu, H. A 2D explicit numerical scheme-based pore pressure cohesive zone model for simulating hydraulic fracture propagation in naturally fractured formation. Energy Sci. Eng. 2019, 7, 1527–1543. [Google Scholar] [CrossRef]
  35. Park, K. Potential-Based Fracture Mechanics Using Cohesive Zone and Virtual Internal Bond Modeling. Ph.D. Thesis, University of Illinois at Urbana-Champaign, Champaign, IL, USA, 2009. [Google Scholar]
  36. Park, K.; Paulino, G.H.; Roesler, J.R. A unified potential-based cohesive model of mixed-mode fracture. J. Mech. Phys. Solids 2009, 57, 891–908. [Google Scholar] [CrossRef]
  37. Gilormini, P.; Diani, J. Some features of the PPR cohesive-zone model combined with a linear unloading/reloading relationship. Eng. Fract. Mech. 2017, 173, 32–40. [Google Scholar] [CrossRef]
  38. Oliver, G.L.; Paulino, G.H.; Buttlar, W.G. Fractional calculus derivation of a rate-dependent PPR-based cohesive fracture model: Theory, implementation, and numerical results. Int. J. Fract. 2019, 216, 1–29. [Google Scholar] [CrossRef]
  39. Yang, J.; Lian, H.; Nugyen, V.P. Study of mixed mode I/II cohesive zone models of different rank coals. Eng. Fract. Mech. 2021, 246, 107611. [Google Scholar] [CrossRef]
  40. Zhong, Y.; Gao, L.; Cai, X.; An, B.; Zhang, Z.; Lin, J.; Qin, Y. An improved cohesive zone model for interface mixed-mode fractures of railway slab tracks. Appl. Sci. 2021, 11, 456. [Google Scholar] [CrossRef]
  41. Spring, D.W.; Paulino, G.H. Computational homogenization of the debonding of particle reinforced composites: The role of interphases in interfaces. Comput. Mater. Sci. 2015, 109, 209–224. [Google Scholar] [CrossRef]
  42. Park, K.; Paulino, G.H. Computational implementation of the PPR potential-based cohesive model in ABAQUS: Educational perspective. Eng. Fract. Mech. 2012, 93, 239–262. [Google Scholar] [CrossRef]
  43. Spring, D.W.; Paulino, G.H. A growing library of three-dimensional cohesive elements for use in ABAQUS. Eng. Fract. Mech. 2014, 126, 190–216. [Google Scholar] [CrossRef]
  44. Park, K.; Choi, M.H.; Paulino, G.H. Assessment of cohesive traction-separation relationships in ABAQUS: A comparative study. Mech. Res. Commun. 2016, 78, 71–78. [Google Scholar] [CrossRef]
  45. Beyer, K.; Abo-El-Ezz, A.; Dazio, A. Quasi-Static Cyclic Tests on Different Types of Masonry Spandrels; Institute of Structural Engineering, Swiss Federal Institute of Technology Zürich: Zürich, Switzerland, 2010; pp. 75–80. [Google Scholar] [CrossRef]
  46. Beyer, K.; Dazio, A. quasi-static monotonic and cyclic tests on composite spandrels. Earthq. Spectra 2012, 28, 885–906. [Google Scholar] [CrossRef]
  47. Snozzi, L.; Molinari, J.F. A cohesive element model for mixed mode loading with frictional contact capability. Int. J. Numer. Methods Eng. 2013, 93, 510–526. [Google Scholar] [CrossRef]
  48. Baek, H.; Park, K. Cohesive Frictional-Contact Model for Dynamic Fracture Simulations under Compression. Int. J. Solids Struct. 2018, 144–145, 86–99. [Google Scholar] [CrossRef]
  49. Giżejowski, M.; Szczerba, R.; Gajewski, M.; Stachura, Z. Beam-column in-plane resistance based on the concept of equivalent geometric imperfections. Arch. Civ. Eng. 2016, 62, 35–72. [Google Scholar] [CrossRef]
  50. Ye, F.X.; Zha, X.X.; Wang, H.X. The application of a HHT based ultrasonic detecting method in quality assessment of CFST. Adv. Steel Constr. 2011, 7, 182–191. [Google Scholar] [CrossRef]
  51. Hillerborg, A.; Modeer, M.; Peterson, P.E. Analysis of crack formation and crack growth in concrete by means of fracture. Cem. Concr. Res. 1976, 6, 773–782. [Google Scholar] [CrossRef]
  52. Lee, J.; Fenves, G.L. Plastic-damage model for cyclic loading of concrete structures. J. Eng. Mech. 1998, 124, 892–900. [Google Scholar] [CrossRef]
  53. Lubliner, J.; Oliver, J.; Oller, S.; Oñate, E. A plastic-damage model for concrete. Int. J. Solids Struct. 1989, 25, 299–326. [Google Scholar] [CrossRef]
  54. American Concrete Institute. Building Code Requirements for Structural Concrete (ACI 318-11) and Commentary; American Concrete Institute: Farmington Hills, MI, USA, 2011. [Google Scholar]
  55. Papanikolaou, V.K.; Kappos, A.J. Confinement-sensitive plasticity constitutive model for concrete in triaxial compression. Int. J. Solids Struct. 2007, 44, 7021–7048. [Google Scholar] [CrossRef]
  56. Tao, Z.; Wang, Z.B.; Yu, Q. Finite element modelling of concrete-filled steel stub columns under axial compression. J. Constr. Steel Res. 2013, 89, 121–131. [Google Scholar] [CrossRef]
  57. Mander, J.B.; Priestley, M. Observed stress-strain behavior of confined concrete. J. Struct. Eng. 1988, 114, 22687. [Google Scholar] [CrossRef]
  58. Mander, J.B.; Priestley, M. Theoretical stress-strain model for confined concrete. J. Struct. Eng. 1988, 114, 1804–1826. [Google Scholar] [CrossRef]
  59. Kabir, M.I.; Lee, C.K.; Rana, M.M.; Zhang, Y.X. Flexural and bond-slip behaviours of engineered cementitious composites (ECC) encased steel composite beam. J. Constr. Steel Res. 2019, 157, 229–244. [Google Scholar] [CrossRef]
  60. Dassault Systèmes Abaqus 2016 Online Documentation; Dassault Systèmes Simulia Corp.: Providence, RI, USA, 2016; Available online: http://130.149.89.49:2080/v2016/index.html (accessed on 18 December 2017).
  61. Nasiri, E.; Liu, Y. Development of a detailed 3D FE model for analysis of the in-plane behaviour of masonry infilled concrete frames. Eng. Struct. 2017, 143, 603–616. [Google Scholar] [CrossRef]
  62. Tao, Z.; Song, T.Y.; Uy, B.; Han, L.H. Bond behavior in concrete-filled steel tubes. J. Constr. Steel Res. 2016, 120, 81–93. [Google Scholar] [CrossRef]
  63. Wang, Y.F.; Ma, Y.S.; Han, B.; Deng, S.Y. Temperature effect on creep behavior of CFST arch bridges. J. Bridge Eng. 2013, 18, 1397–1405. [Google Scholar] [CrossRef]
  64. CEN. EN 1994-1-1; Eurocode 4: Design of Composite Steel and Concrete Structures-Part 1.1: General Rules and Rules for Buildings. European Committee for Standardization: Brussels, Belgium, 2004. [CrossRef]
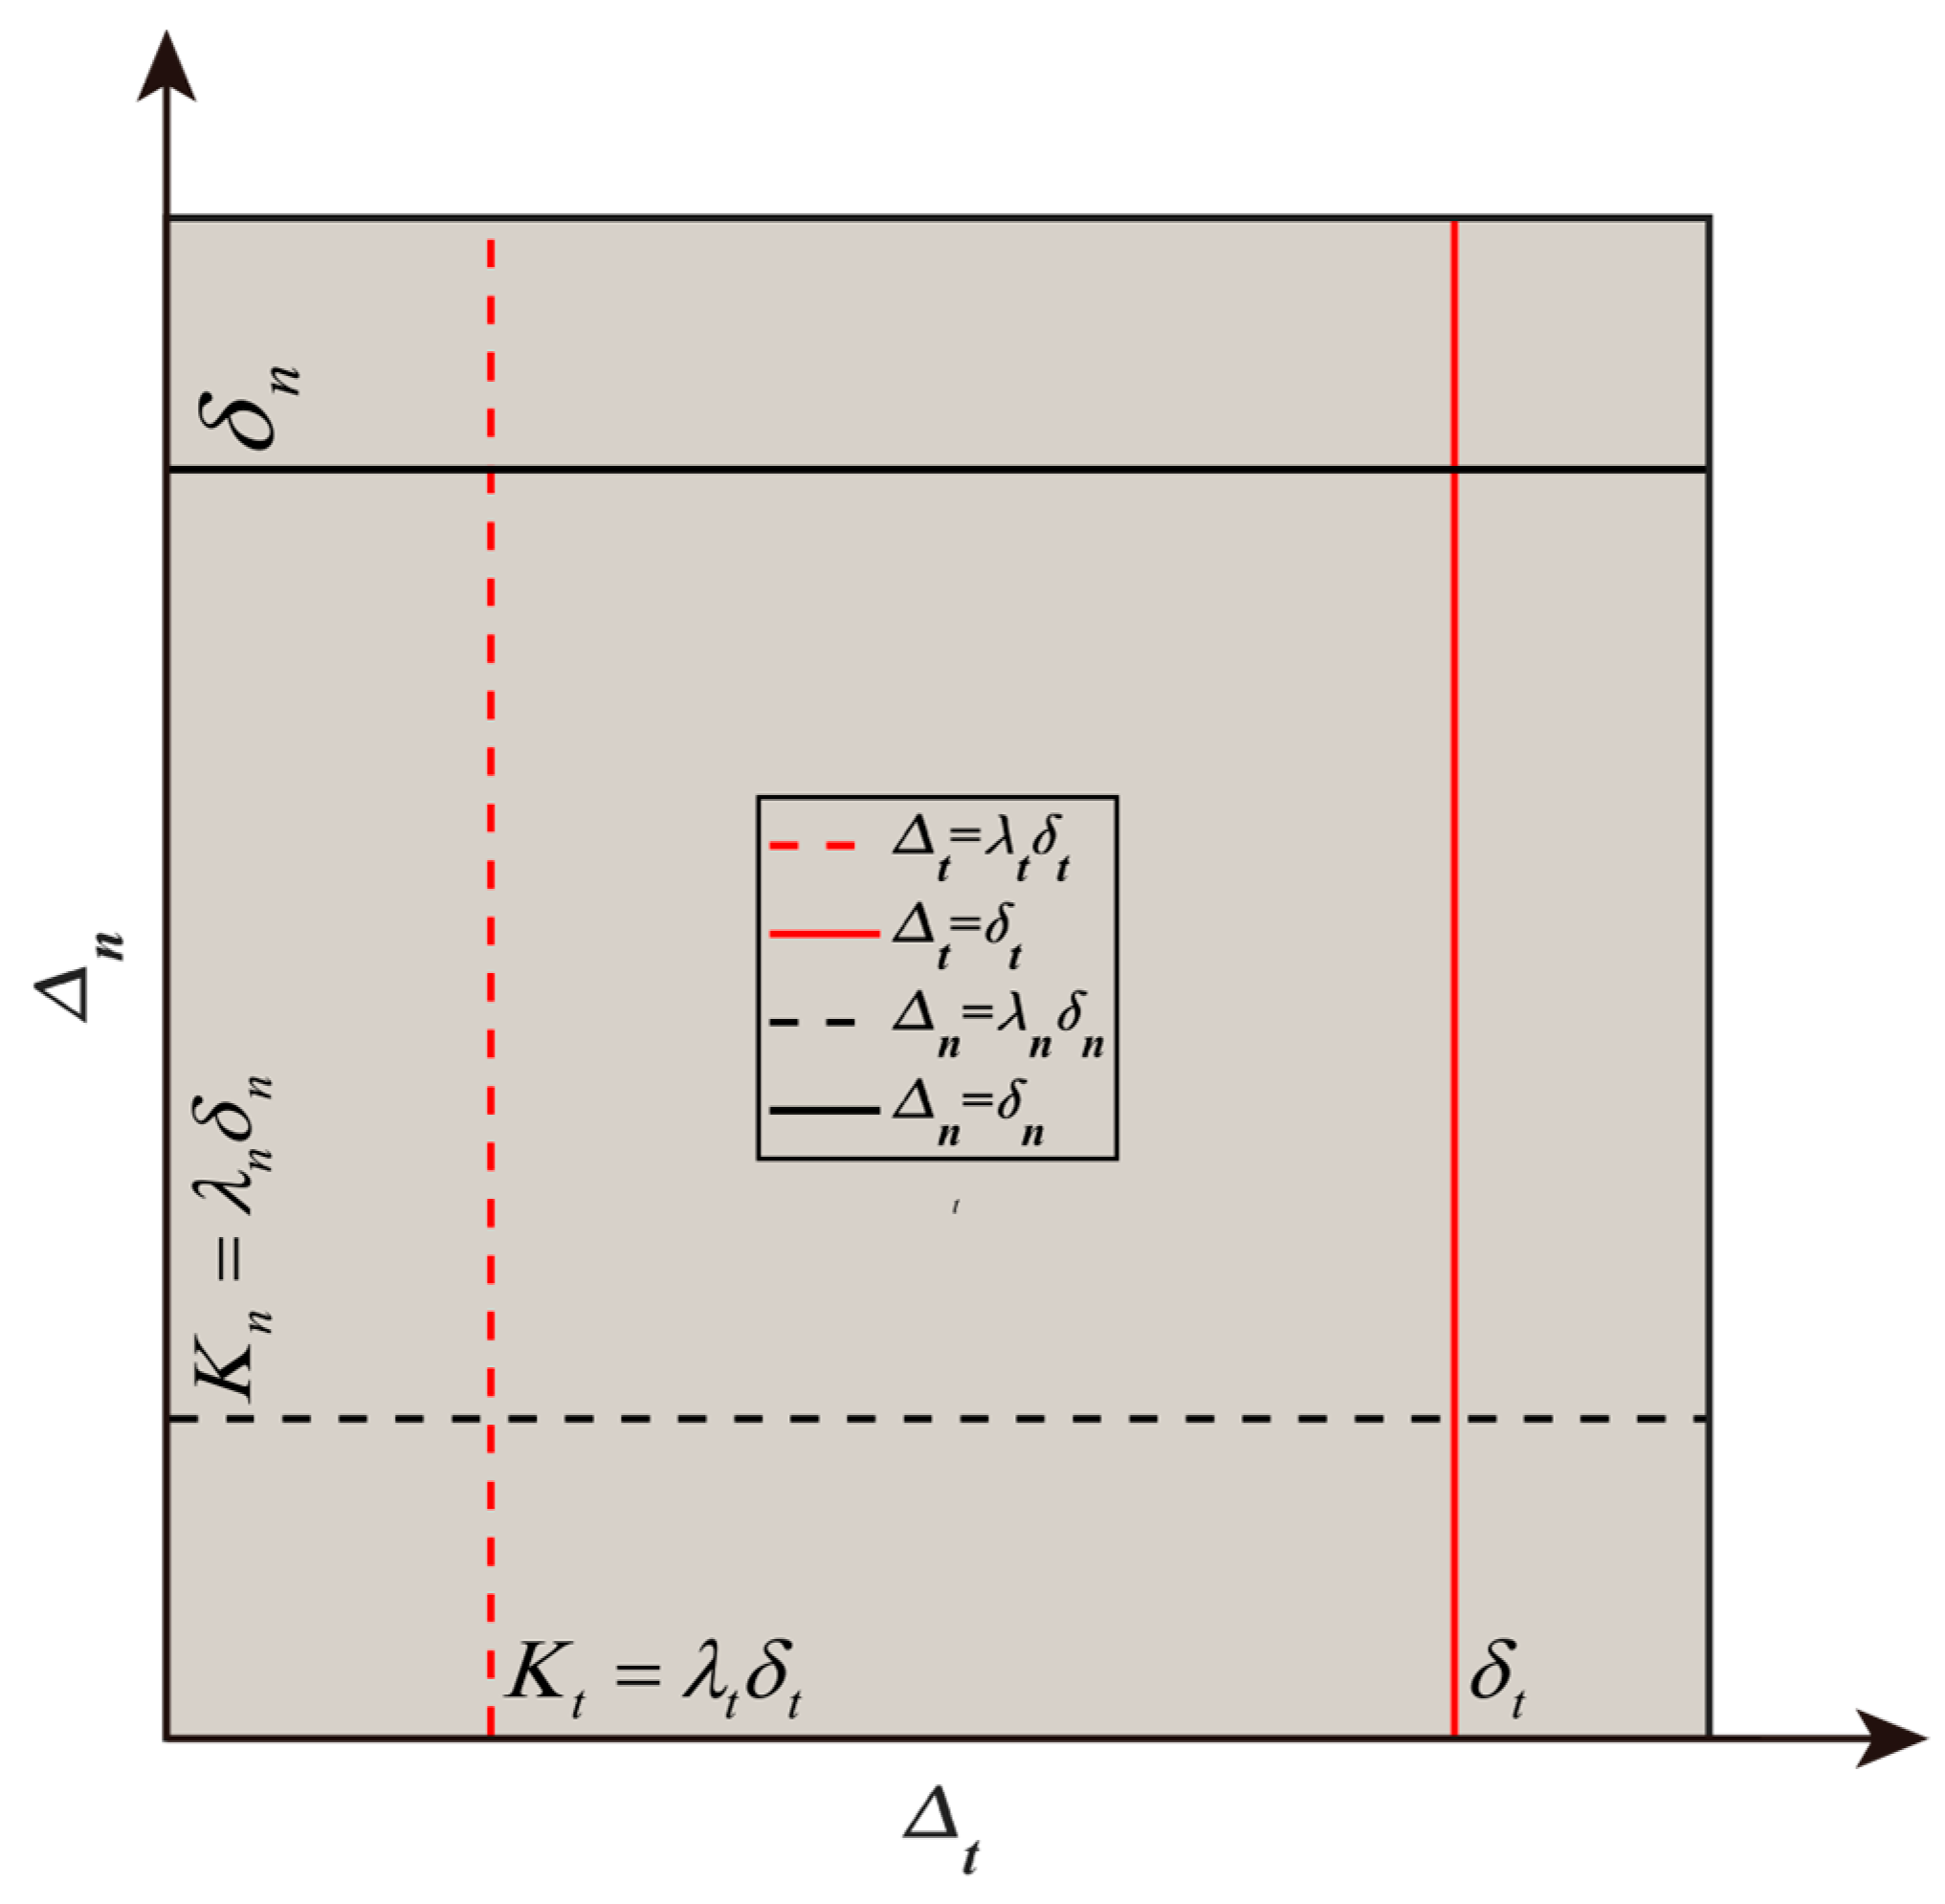
Figure 1. Description of the cohesive region.
Applsci 14 08361 g001
Figure 2. Separation–traction relationship in the PPR cohesive model: (a) Mode I fracture; (b) Mode II fracture.
Applsci 14 08361 g002
Figure 3. Coupling method between friction and tangent tractions: (a) effect of the friction growth shape parameter, s, on the response factor, κ; (b) relationship between tangential stress and tangential displacement.
Applsci 14 08361 g003
Figure 4. Numerical verification of the masonry wallette: (a) experiment configuration (Beyer et al. 2010, 2012) [45,46]; (b) numerical configuration.
Applsci 14 08361 g004
Figure 5. Schematic diagram of the geometric dimensions and finite element model of the structure: (a) cross-section view; (b) front view; (c) finite element model.
Applsci 14 08361 g005
Figure 6. Changes in the angle between the load direction and coronal gap axis.
Applsci 14 08361 g006
Figure 7. Damage contours of the core concrete under different angles between the load direction and gap axis of the CCFST with a mortar interface.
Applsci 14 08361 g007
Figure 8. Equivalent plastic strain contours of the outer steel tube under different angles between the load direction and coronal gap axis of the CCFST with a mortar interface.
Applsci 14 08361 g008
Figure 9. The load–displacement curves under different angles between the load direction and coronal gap axis of the CCFST with a mortar interface.
Applsci 14 08361 g009
Figure 10. Damage contours of the core concrete under different angles between the loading direction and coronal gap axis of the CCFST without a mortar interlayer.
Applsci 14 08361 g010
Figure 11. Equivalent plastic strain contours of the outer steel tube under different angles between the load direction and coronal gap axis of the CCFST without a mortar interface.
Applsci 14 08361 g011
Figure 12. The load–displacement curves under different angles between the load direction and coronal gap axis of the CCFST without a mortar interface.
Applsci 14 08361 g012
Figure 13. Comparison of the flexural capacity of the CCFSTs with and without a mortar interface.
Applsci 14 08361 g013
Figure 14. Damage contours of the CCFST under different gap heights.
Applsci 14 08361 g014
Figure 15. Equivalent plastic strain contours of the CCFST with different gap heights.
Applsci 14 08361 g015
Figure 16. The load–displacement curves of the CCFST with different gap heights.
Applsci 14 08361 g016
Figure 17. Influence of α and D on SI.
Applsci 14 08361 g017
Table 1. Material parameters of bricks and joint mortar used in numerical simulation.
ParameterValue
Mode I fracture energy, ϕn/MPa∙mm0.125
Mode II fracture energy, ϕt/MPa∙mm0.45
Normal cohesive strength, σmax/MPa0.2295
Tangential cohesive strength, τmax/MPa0.2295
Normal initial slope indicator, λn0.06
Tangential initial slope indicator, λt0.06
Normal shape parameter, α5.0
Tangential shape parameter, β5.0
Friction shape parameter, s1.0
Friction coefficient, μ0.77
Table 2. The mechanical parameters of the interlayer.
ParameterValue
Mode I fracture energy, ϕn/MPa∙mm0.04
Mode II fracture energy, ϕt/MPa∙mm0.4
Normal cohesive strength, σmax/MPa0.2
Tangential cohesive strength, τmax/MPa1.0
Normal initial slope indicator, λn0.25
Tangential initial slope indicator, λt0.25
Normal shape parameter, α5.0
Tangential shape parameter, β5.0
Friction shape parameter, s4.0
Friction Coefficient, μ0.6
Disclaimer/Publisher’s Note: The statements, opinions and data contained in all publications are solely those of the individual author(s) and contributor(s) and not of MDPI and/or the editor(s). MDPI and/or the editor(s) disclaim responsibility for any injury to people or property resulting from any ideas, methods, instructions or products referred to in the content.