Abstract
The aim of this study was to evaluate the validity of an orthotic deformation test on insole arches and the impact of researcher expertise on the test’s reproducibility. Three researchers with different levels of experience evaluated orthotic deformation by applying a vertical force with their thumb on the dorsal surface of 48 polypropylene orthoses. An electromechanical test machine was used to evaluate the stiffness of the orthoses, and the results were compared with those of the orthotic deformation tests. Fleiss’ kappa and weighted kappa and Mann–Whitney U tests were used to evaluate the interobserver reliability and the validity, respectively. There was no consensus among the three researchers (Kappa = 0.080; p-value = 0.334), although the two researchers with higher levels of experience exhibited moderate consensus (Kappa = 0.52; p-value < 0.001). Orthoses characterised by a positive test suffered from more pronounced deformation when a constant vertical force was applied by the electromechanical test machine (5.62 [4.64–7.38] vs. 4.56 [3.59–5.28] mm; p-value = 0.003). The orthotic deformation test is valid for interpreting the degree of deformation of polypropylene custom orthoses when it is compared with an axial force from a compression-device test. However, considering the high dispersion of the results, it suggests that clinical experience is required to properly interpret the tests.
1. Introduction
The windlass mechanism is essential in the development of bipedal gait [1]. This phenomenon begins when passive toes, specifically the hallux, approximate close to the foot dorsum during push off in the gait cycle. Consequently, chaining of the movements of the foot and lower limbs, based on the engineering concept of lifting weights via a pulley system, occurs naturally in the foot. The foot transforms itself into a more rigid structure to enable efficient and stable propulsion during walking and running [2]. The plantar aponeurosis acts like a cable winding to the drum of a windlass (the first metatarsophalangeal joint), which is pulled by a handle (the proximal phalanx of the hallux). Therefore, plantar aponeurosis stretching plays an essential role in the establishment of the windlass mechanism [3]. However, some musculoskeletal disorders such as plantar fasciitis are related to repetitive cycles of stretching and relaxing of the plantar aponeurosis [4]. Prefabricated and custom foot orthoses or insoles are devices commonly prescribed for the treatment of biomechanical pathologies related to excessive stress of plantar tissues [5,6,7].
Several studies have focused on determining the effectiveness of orthotic interventions [8]. Questionnaires or plantar pressure measurements are commonly used [9,10]. However, these tools are time consuming, and devices to measure plantar pressure are costly and not often available. Wear and tear of the materials in orthoses also results in reduced effectiveness of these devices over time. A simple and rapid test to evaluate device effectiveness could reduce clinical examinations, which are associated with both monetary and time costs.
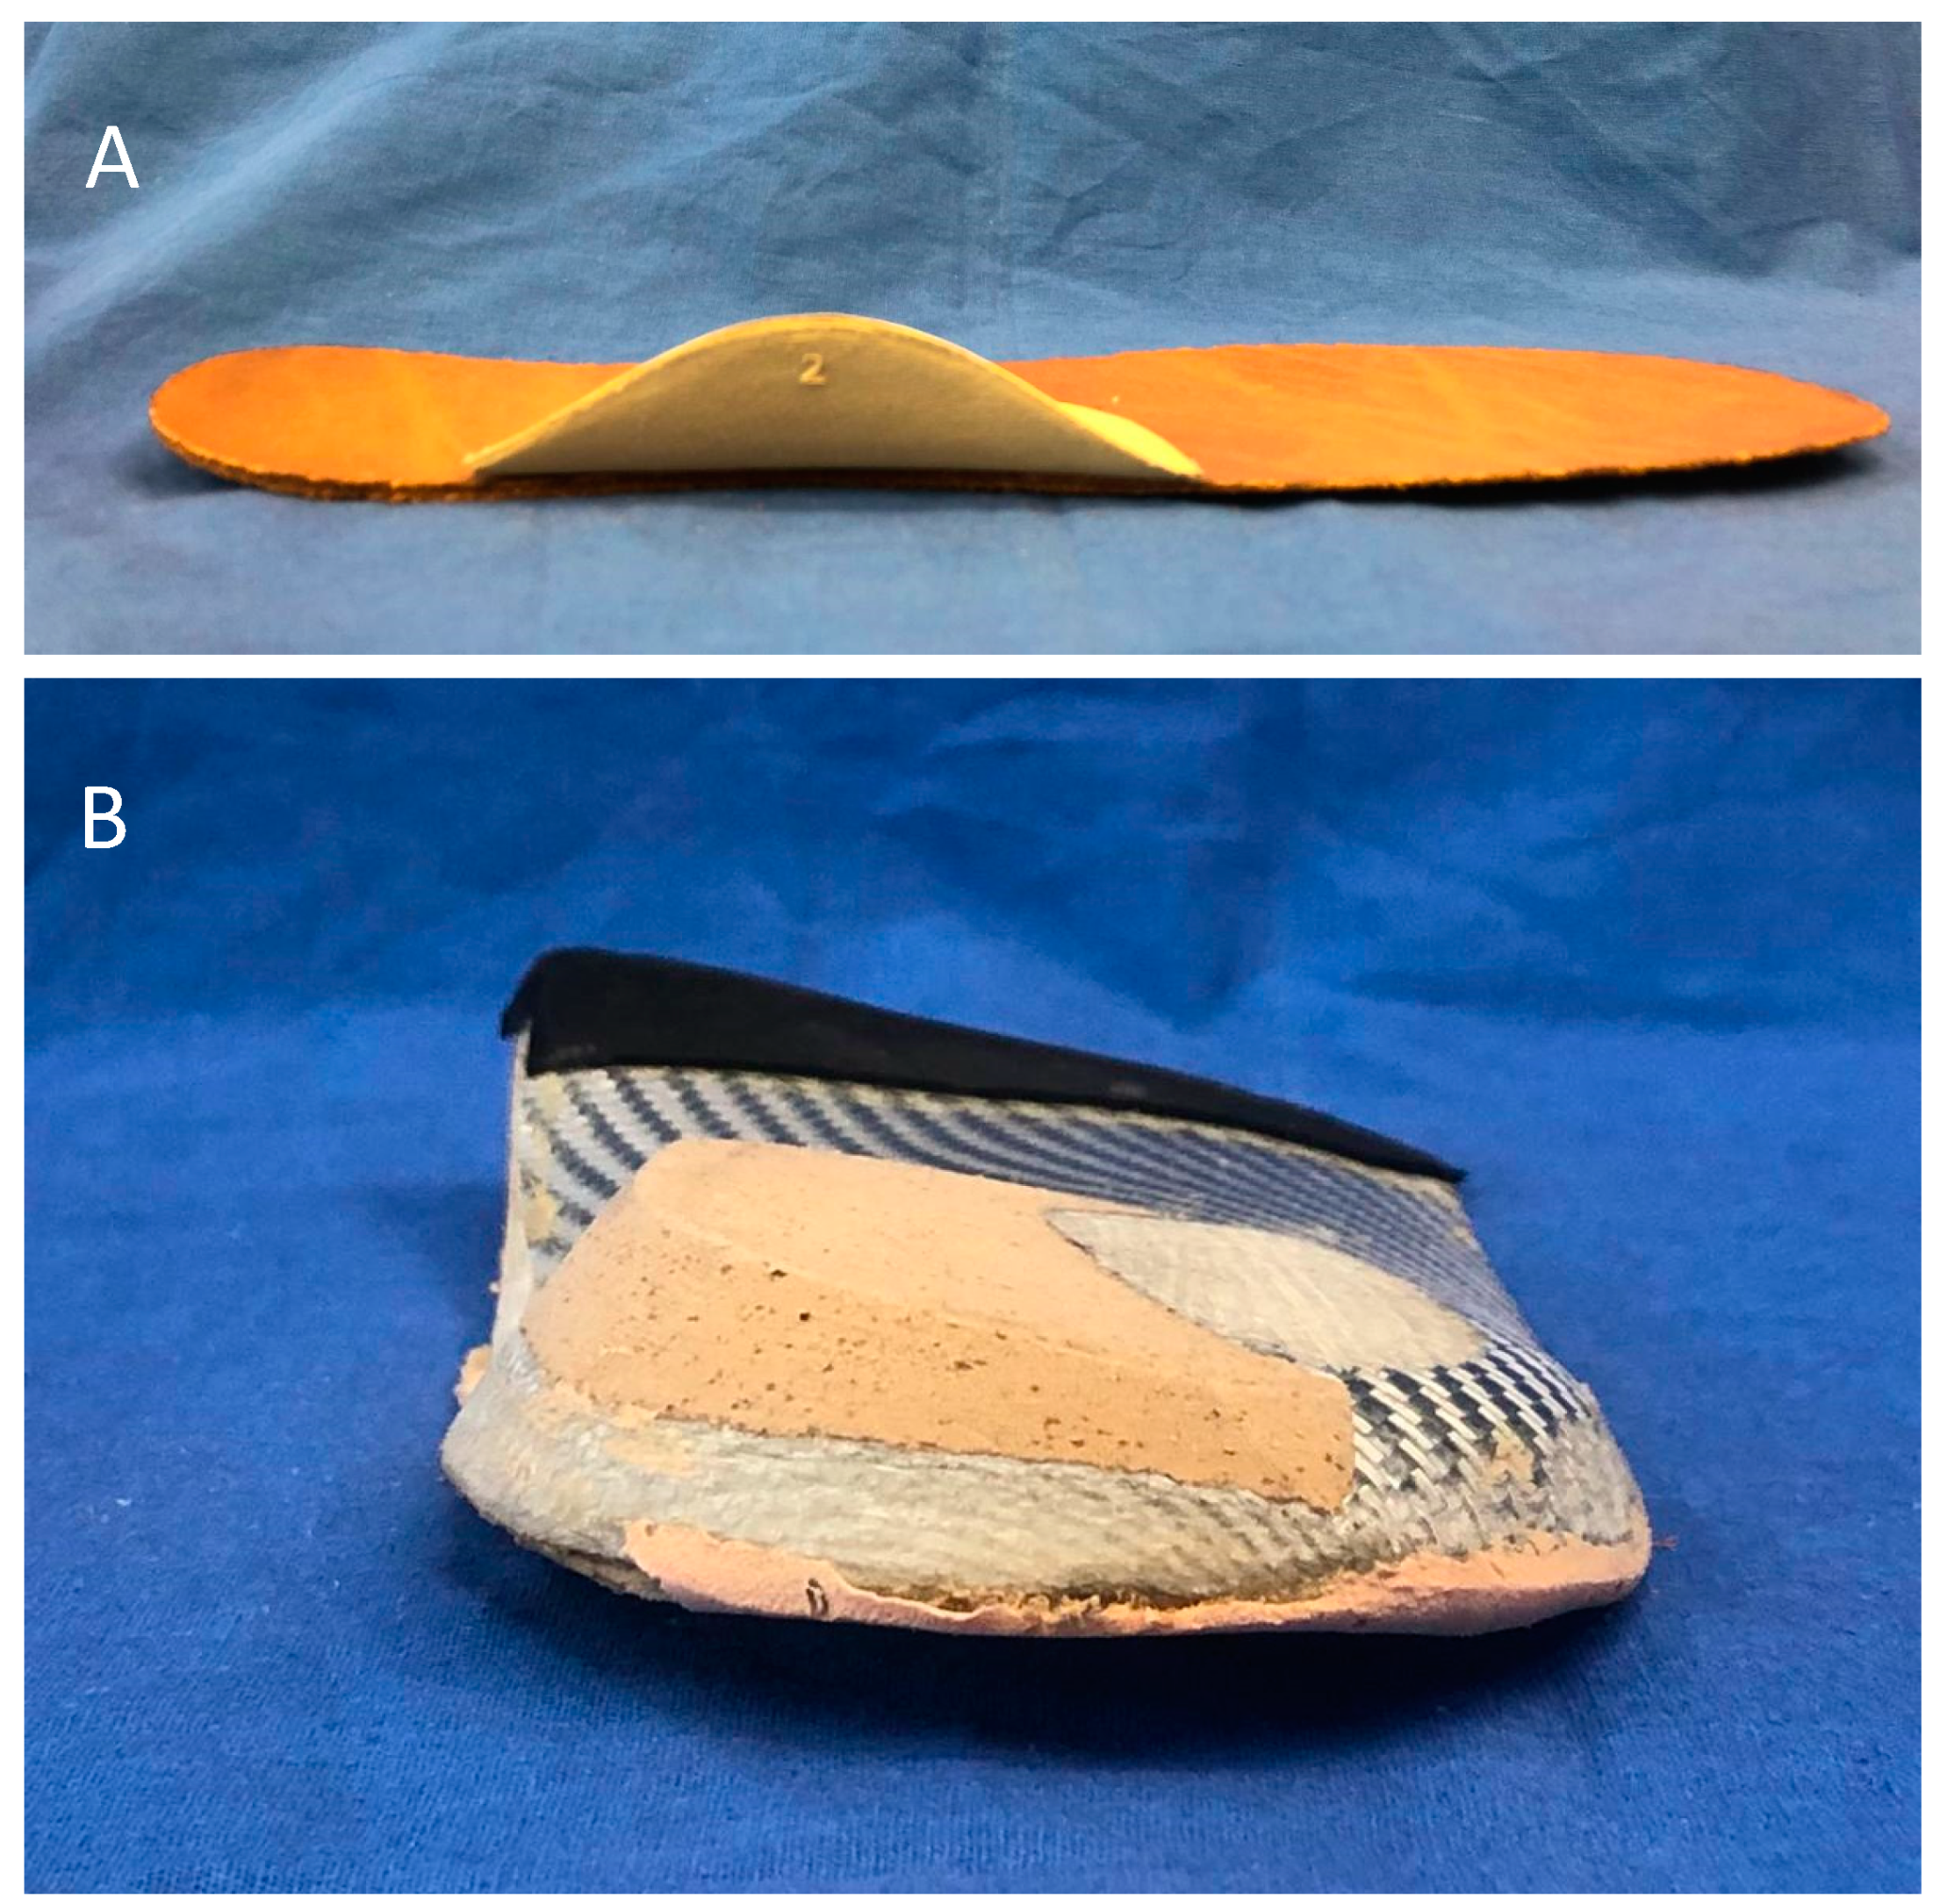
The origin of biomechanical diseases is related to increasing foot plantar pressure during loading [11,12]; the plantar pressure distribution depends on anatomical and physiological characteristics of the foot, as well as walking speed [13]. Commonly employed strategies for decreasing plantar pressure include changing the shape and material of insoles [14,15]. It has been shown that addition of some elements (Figure 1A) at the orthoses, such as arch support, has a slight impact on plantar pressure [16]. However, custom foot orthoses fit the foot better than those that are prefabricated, and they have been shown to be more effective at relieving the pain of plantar fasciitis over the medium term [17,18]. Therefore, it is important to ensure geometric surface congruency between the foot arch and dorsal arch support to reduce pressure on the plantar foot [18,19].

Figure 1.
Flat insoles and custom foot orthoses Panel (A) (top): Upper side of a flat insole with additional arch support. Panel (B) (bottom): Bottom side of custom orthoses with additional forefoot–rearfoot posts.
The foot in contact with the orthoses produces, attenuates, or re-orientates the motion of other non-contact joints of the lower extremity such the hips or knees [20]. Custom foot orthoses are composed of different elements. The medial longitudinal arch is molded to the foot shape and shifts plantar pressure from the rearfoot and forefoot toward the midfoot [21]; orthoses consequently reduce plantar fascia strain [6]. The medial longitudinal arch should resist arch depression by increasing contact and providing support. The addition of some elements, such as forefoot–rearfoot posts (Figure 1B), has been shown to increase medial longitudinal arch stiffness [22]. Therefore, arch stiffness has been shown to be the primary characteristic responsible for altering lower-limb biomechanics. Furthermore, polypropylene is commonly used to manufacture foot orthoses due to its stiffness and durability in comparison with other materials [23,24,25].
Arch stiffness of polypropylene orthoses is commonly evaluated by podiatrists in clinical practice [26]. The correct stiffness is considered a sign of proper functioning of the orthosis [27]. Only when the orthoses resist or alter specific movements of the foot during weight-bearing activities are they able to improve foot and lower-limb functioning [28]. However, if the foot applies a larger load than the custom foot orthosis can resist, deformation results. Excessive deformation is one of the most common reasons why a plantar orthosis fails at ameliorating patients’ symptoms [18]. This situation arises from inadequate initial stiffness of the orthosis design or from the wearing of orthoses over time [29]. Unfortunately, excessive deformation is difficult to detect directly during clinical evaluation of gait because the orthosis is hidden inside footwear; furthermore, the lateral sides inhibit observations of medial arch deformation. For this reason, it is necessary to conduct tests to identify the amount of deformation of plantar orthoses. Kirby describes the orthotic deformation test (ODT) to identify the amount of deformation in the lateral and medial sides of plantar orthoses [29]. It has been considered that 5 mm of deformation is excessive; however, this finding has not yet been validated.
The ODT is sometimes performed by having a clinician apply a vertical force with their thumb to the dorsal surface of the medial longitudinal arch of the orthoses. The test is considered to be positive when the medial longitudinal arch deforms with the applied force. Due to the subjective nature of the test, results can vary between clinicians; there are general inconsistencies in the force applied on the orthoses, the practitioner’s clinical experience, and the stiffness of the orthoses being evaluated. Furthermore, it has not been possible to determine the amount of deformation of orthoses that have not relieved symptoms. Additionally, despite the extensive use of this test, there is no set amount of deformation that corresponds to a positive or negative test. Due to such a lack of standards, the results of the ODT should be compared with results of an electromechanical test machine commonly used to accurately evaluate the stiffness of different orthoses [22].
It is crucial to determine the validity and reproducibility of the ODT because this test has important consequences for patient treatments. A positive test is commonly interpreted by clinicians as a sign of failure, necessitating that the orthoses be modified or changed. Clinicians and researchers should have access to information about reference thresholds when it comes to the deformation indicative of a positive or negative test. Despite the fact that mechanical tests have widely been used to check ankle-foot orthoses, no other studies have validated this subjective test according to the literature found. Therefore, the objective and the novelty of this investigation was to assess the validity of the ODT in comparison with a mechanical test. We also sought to evaluate the impact of researcher expertise on the reproducibility of the test.
2. Materials and Methods
2.1. Custom Foot Orthoses
Forty-eight custom foot orthoses were used in this study. We used plaster and foam box casting to obtain a three-dimensional (3D) impression of a patient’s foot for use in orthoses manufacturing. We used a traditional method: filling the plaster impression with liquid plaster to obtain a positive mold; we then manufactured the orthosis via thermoforming (Figure 2A) [30]. We used the software CAD Insole Creator V2.18.2.0 (Perpedes Tecnoinsole SL, Alicante, Spain) to fabricate the foot models and custom orthoses; this software relies on computer-aided design/computer-aided manufacturing (CAD/CAM) technology (Figure 2B) [31].
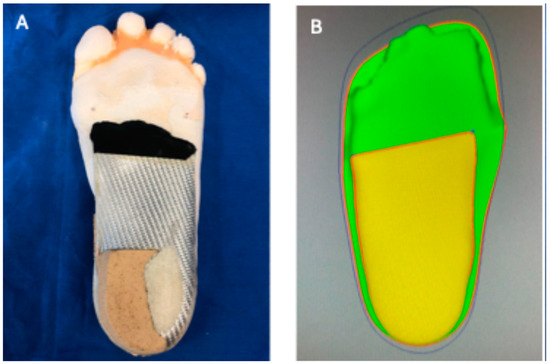
Figure 2.
Panel (A) (left): Left side of a custom foot orthosis manufactured by thermoformed method. Panel (B) (right): Right side of a custom foot orthosis manufactured by CAD/CAM technology.
Rearfoot and forefoot posts were glued to the shell in the traditional method; the CAD/CAM system-manufactured shells were produced using a single piece of polypropylene that included rearfoot and forefoot posts. Orthoses with different types of posts and thicknesses that ranged from 4 mm to 6 mm were selected for this study. Both new orthoses and orthoses that had been used for different durations were included. We also evaluated orthoses intended for different types of foot conditions (i.e., pes planus, pes cavus, and normal foot). This heterogeneity was pre-meditated to ensure variability in the amount of medial longitudinal arch deformation.
All of the orthoses extended from the heel to the metatarsal head (shell) and were free of any accessories such as a top layer or heel lift. We ensured that the orthoses had a similar appearance in order to prevent bias. One researcher, other than those who developed the test, selected and prepared all of the orthoses.
2.2. Manual Orthotic Deformation Test
The pressure test was carried out by three researchers (one woman and two men) with different levels of experience in managing lower-limb disorders with orthotic treatments. The trio had less than 1, 8, and 18 years of experience, respectively; those durations mapped to low, moderate, and high levels of experience, respectively. None of the researchers were aware of the others’ interpretations.
The evaluator used his or her dominant thumb to apply a vertical force to the dorsal apex of the medial longitudinal arch of the orthoses (Figure 3). The non-dominant hand is positioned on the lateral longitudinal arch to help hold the orthosis in place. The non-dominant hand prevents undesirable movement of the orthosis due to applied vertical force with the thumb. The degree of deformation of the medial longitudinal arch was observed. The result of the test was categorised as positive when the researcher interpreted that the medial longitudinal arch collapsed easily and negative when collapse did not occur or only occurred with difficulty. Researchers were permitted to repeat the test as many times as they wished.
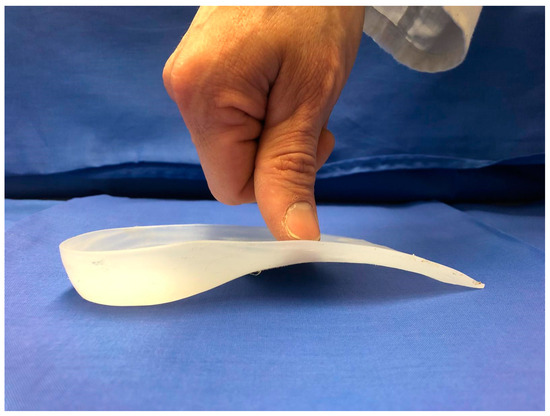
Figure 3.
Orthotic deformation test. The dominant thumb applies a vertical force on the medial longitudinal arch of the orthoses. Observe the point of force application on the dorsal apex of the medial longitudinal arch. The non-dominant hand can apply resistance to the lateral arch to prevent rotation of the orthosis.
2.3. Device Compression Test
A compression device (EM2-200/FR, Microtest SA, Madrid, Spain) was used as reference. The device had a load cell of 1kN, which was applied via a 20 mm-diameter indenter over the middle point of the medial edge of the medial longitudinal arch. A vertical compression force was applied at a constant displacement rate of 1 mm/min. Two heavy-duty G-clamps were used to firmly fix each custom foot orthosis in a horizontal position on a rectangular metal compression plate. The movable jaw of the screw of the G-clamps was fixed on the lateral longitudinal arch of the orthosis the same way as the researcher’s non-dominant hand applied resistance to the ODT. Doing so ensured that the orthosis remained in contact with the compression plate and did not rotate while being compressed [22] (Figure 4).
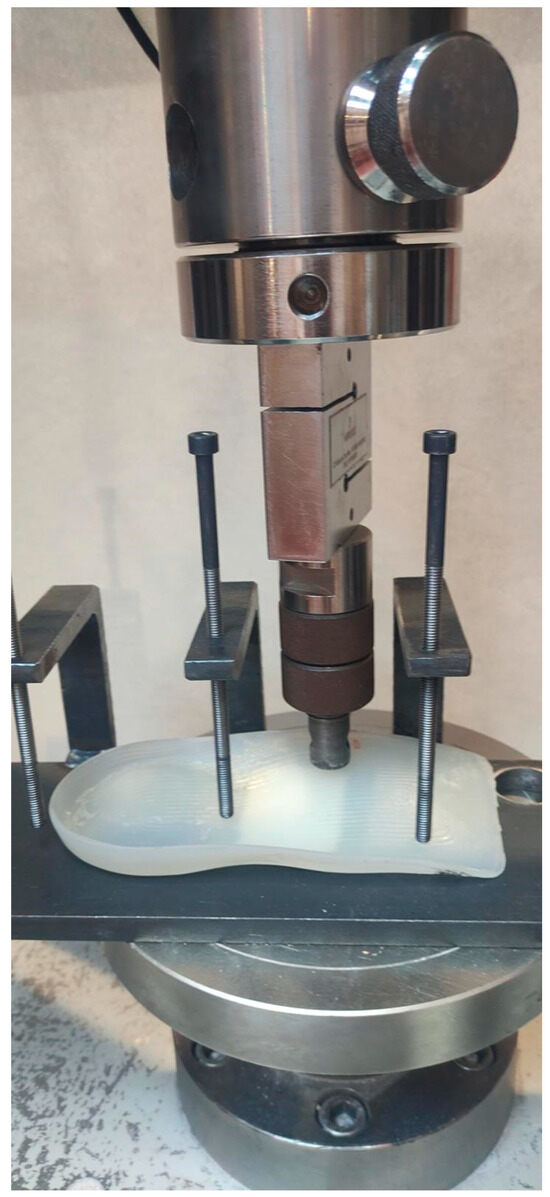
Figure 4.
Device compression test setup. The indenter and the G-clamps were positioned to simulate the positions of fingers in the orthotic deformation test.
The length and maximum height of the medial longitudinal arch of each orthosis were measured by a vernier caliper. Length was considered to correspond to the distance between the proximal and distal arch in a line along the medial longitudinal arch and tangent to the medial edge of the heel; it was used to calculate the length mid-point. This point, in turn, was approximately where the ODT was applied; it was indicated on the orthosis to ensure the reproducibility of the tests. The maximum height was considered to be the distance between the floor and the highest point of the medial longitudinal arch. The maximum height was used to calculate the medial longitudinal arch collapse. The mid-point of the orthotic’s length and the maximum height did not always coincide in terms of position.
The indenter was positioned over the calculated length mid-point and the maximum height served as the reference of the zero position of medial longitudinal arch deformation. Zero position was defined as the initial contact between the intender and orthosis dorsal surfaces.
The system continuously recorded the displacement (mm) and the corresponding force (N); force was applied until a peak value of 150 N. Nussbaum et al. [32]. determined that the human thumb can exert a maximum average of 150 N. Only one test was performed on each orthosis to avoid bias related with cyclic loads that could have caused severe damage due to fatigue of the polypropylene [33].
2.4. Data Analysis
We selected three points from the load displacement curves. First, the displacement of the medial longitudinal arch was calculated for an applied force of 150 N. Second, the force required to deform the medial longitudinal arch 3 mm, and third the force required to deform the medial longitudinal arch by 10% were calculated. The last points were selected to ensure the test’s reproducibility between orthoses with arches of different heights.
All the statistical analyses were performed using SPSS statistics version 25.0 for Mac OS (SPSS, Chicago, IL, USA). The assumption of normality of quantitative variables was verified using the Kolmogorov–Smirnov test. Normally distributed variables (Kolmogorov–Smirnov test with p ≥ 0.05) were reported as means and standard deviations (SD), and non-normally distributed variables were reported as medians and between the 25th and 75th interquartile ranges [IQR 25–75]. Categorical variables were reported as frequencies and percents. Inter-rater reliability was evaluated by comparing the three researchers’ interpretations using Fleiss’ kappa. Pairwise agreement was evaluated using the weighted kappa value. Compression graphs of force and displacement were obtained using Excel (version 16.85 for Mac OS) (Microsoft, Redmond, WA, USA).
The Landis and Koch guideline was used to rate the agreement among the researchers. Negative value indicated no agreement, values from 0.01 to 0.20 indicated slight agreement, values from 0.21 to 0.40 indicated fair agreement, values from 0.41 to 0.60 indicated moderate agreement, values from 0.61 to 0.80 indicated substantial agreement and values from 0.81 to 0.99 indicated almost perfect agreement [34].
The Student’s t-test and the Mann–Whitney U test were used for normally and non-normally distributed data, respectively, to evaluate the consistency between the most experienced researcher’s interpretations of the ODT results and measurements from the compression test device.
3. Results
3.1. Custom Foot Orthoses
Thirty-one percent (n = 15) of custom foot orthoses were manufactured using the traditional method, and 69% (n = 33) were manufactured using the CAD/CAM system. Twenty-four orthoses (50%) were prescribed for flatfoot, 15 orthosis (31%) were prescribed for normal foot, and 9 (19%) were prescribed for pes cavus.
3.2. Interobserver Reliability (Manual Test)
Fleiss’ Kappa did not reveal any reliability among the three researchers (K = 0.08; p-value = 0.334; CI [−0.083–0.244]). However, pairwise comparisons revealed moderate agreement among the two researchers with higher levels of experience (K = 0.517; p-value < 0.001; CI [0.309–0.724]). Pairwise comparisons between researchers with low levels of experience and researchers with both moderate and high levels of experience revealed a lack of reliability (K = −0.99; p-value = 0.493 [−0.378–0.181]; K = −0.91; p-value = 0.452 [−0.332–0.150], respectively) (Table 1).

Table 1.
Pairwise agreement between researchers as a function of experience.
3.3. Compression Test
The compression graphs reveal the relationship between force and displacement. Orthoses with positive tests exhibited rapidly increasing displacement compared with orthoses with negative tests, which were associated with a flat displacement curve during the initial application of the force.
3.4. Validity
A comparison between the results of the compression test and the interpretations of a researcher with a high level of experience was carried out to determine the validity of the test. Two cut-off points were selected: one for the force applied by device compression and the other for the displacement exhibited by the orthoses. Furthermore, due to differences in the arch medial height between the orthoses, we selected two cut-off points for displacement: a fixed displacement of 3 mm and 10% of the total height of the medial longitudinal arch (Figure 5).
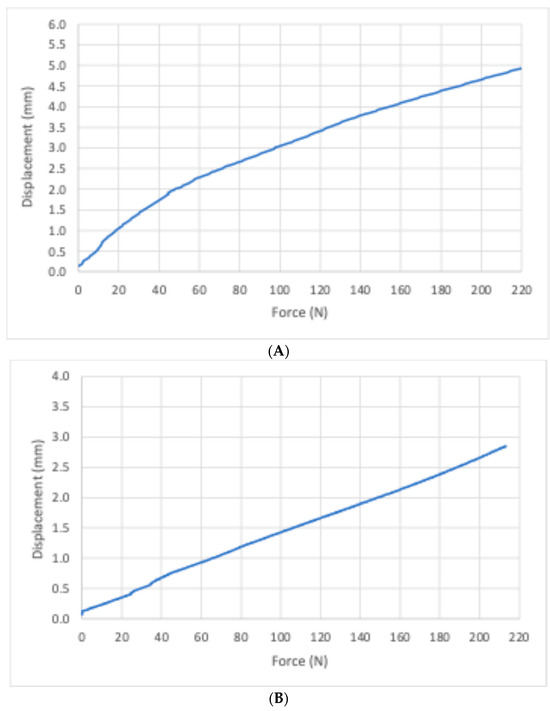
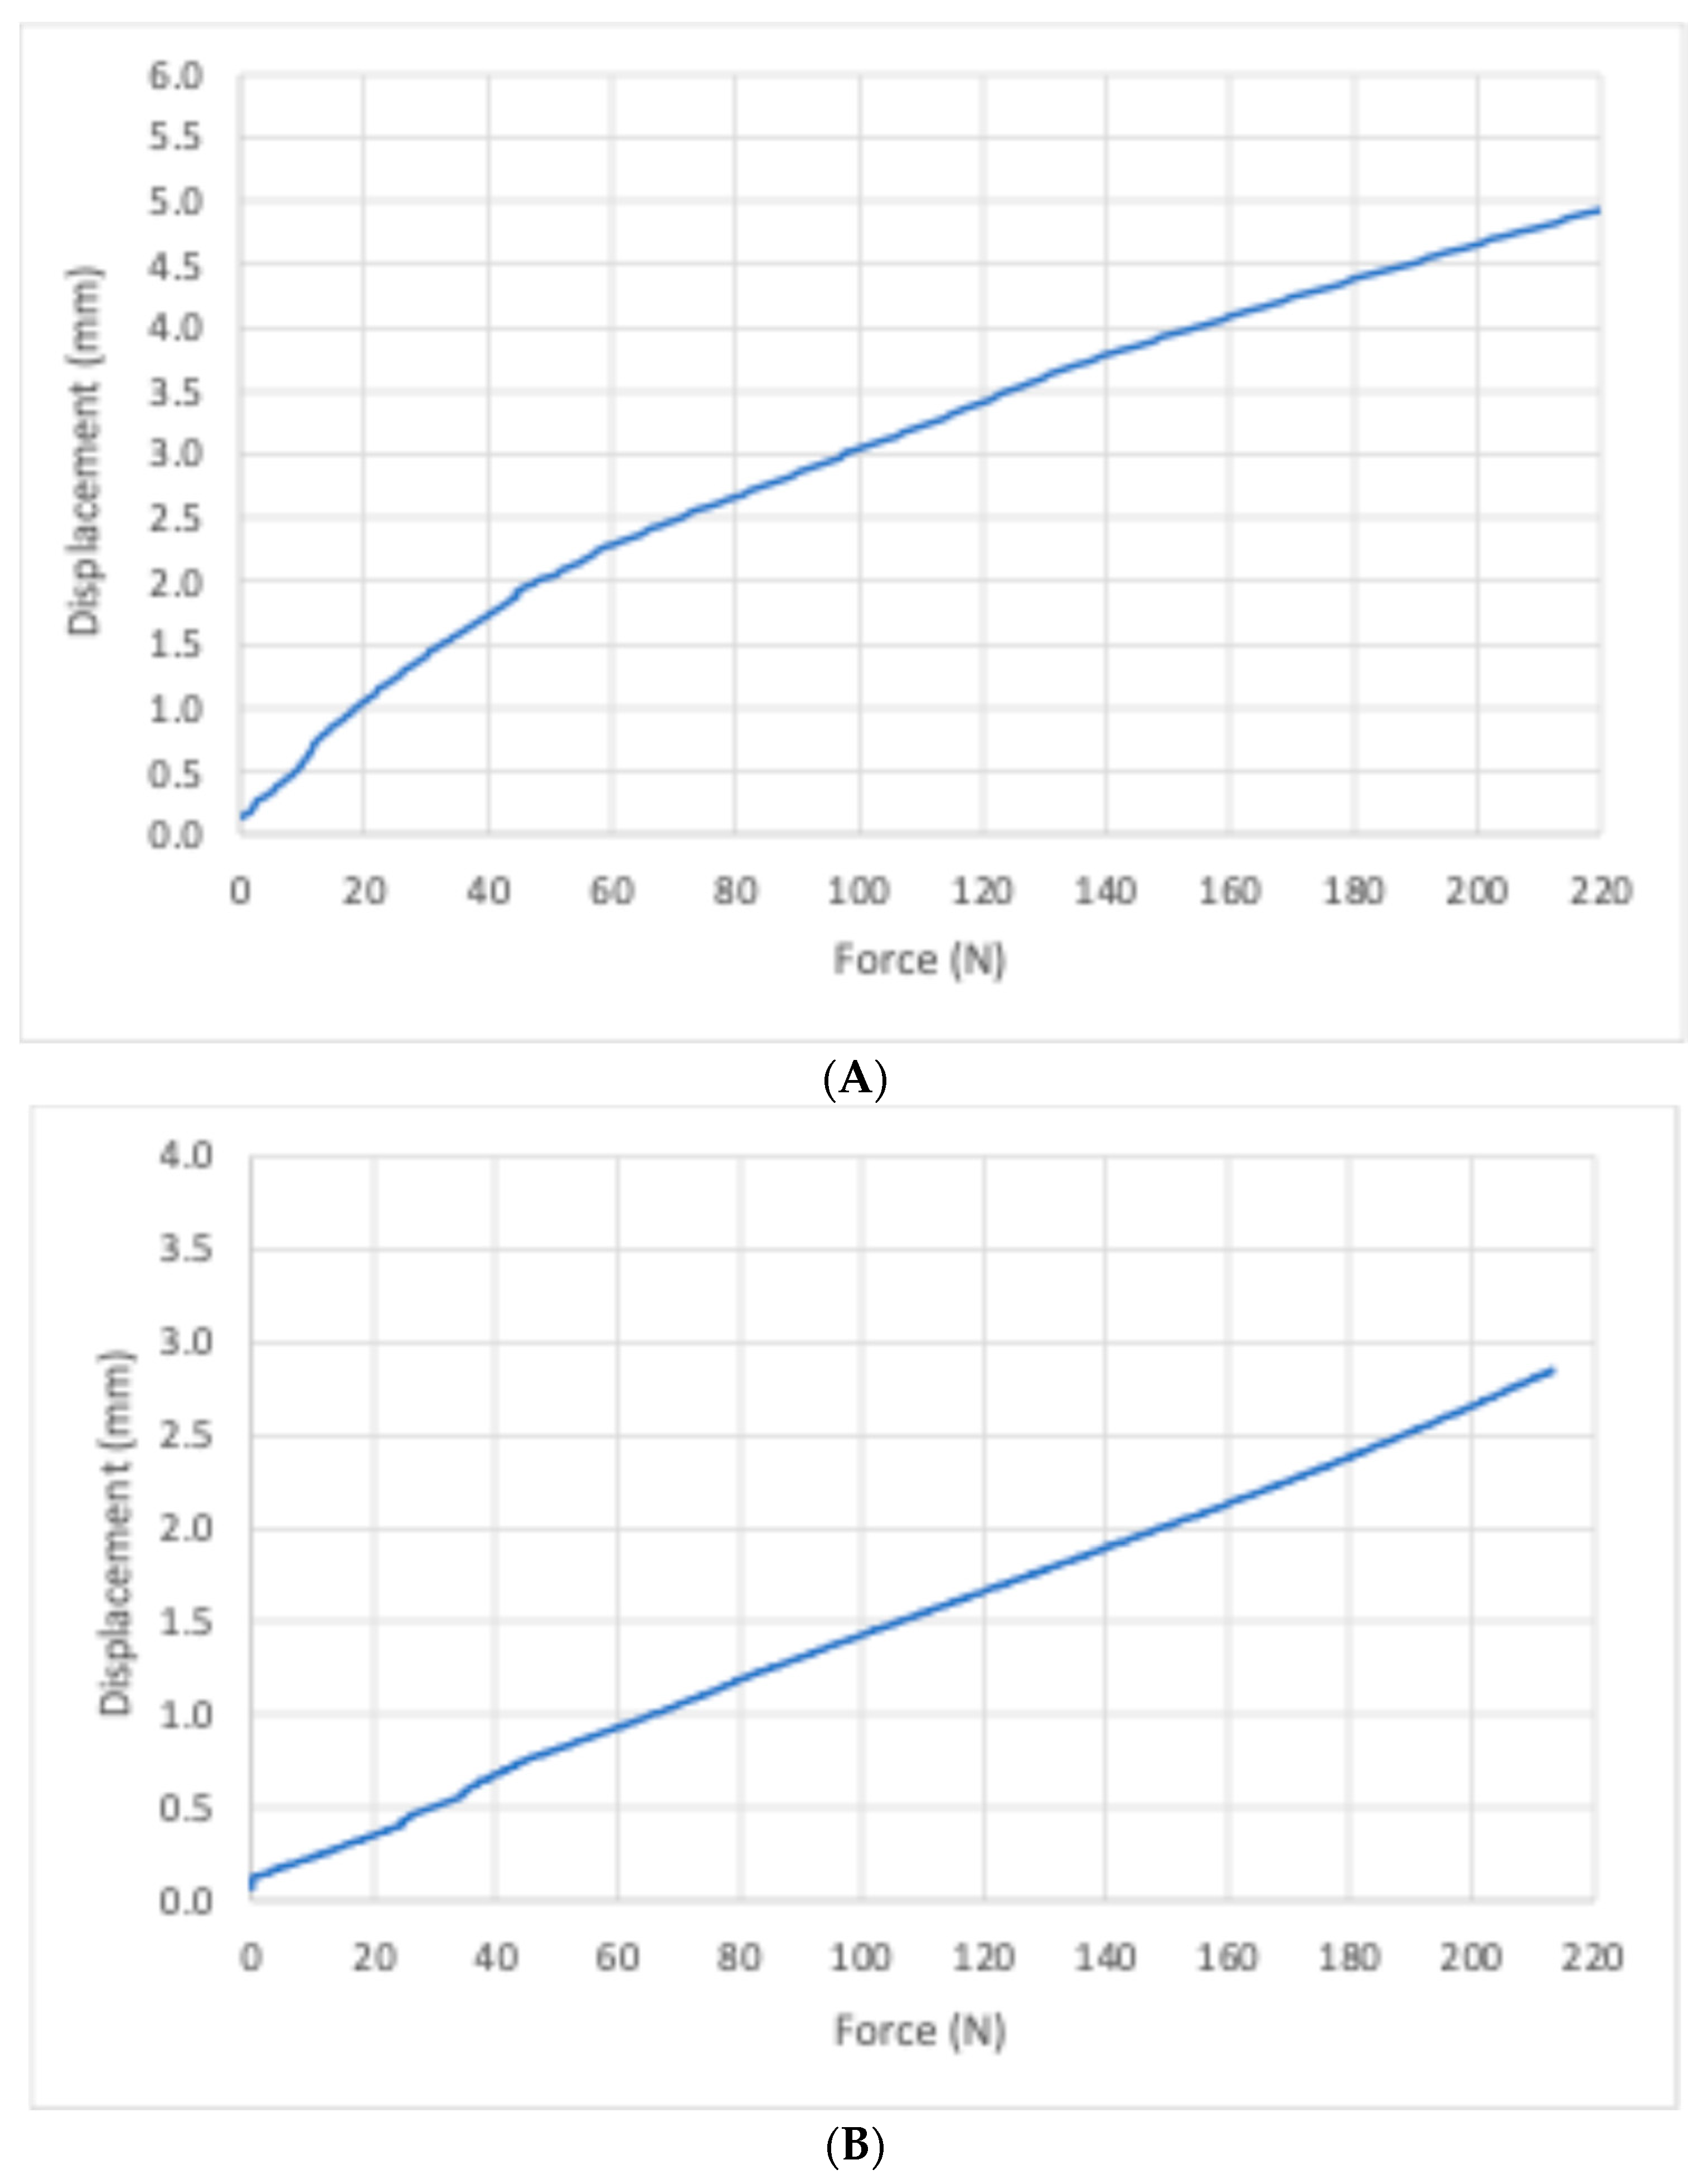
Figure 5.
Force/displacement graphs for two samples of orthosis. Panel (A) (top): sample number 17 with a positive test. Panel (B) (bottom): sample number 38 with a negative test.
The mean height of the medial longitudinal arch of the orthoses was 19.8 ± 2.7 mm. The median deformation of the orthosis after applying 150 N of vertical force was 5.30 [IQR 4.51–6.42] mm. The vertical force required to deform the medial longitudinal arch by 3 mm and 10%, respectively, was characterised by a median of 79.9 [54.3–102.9] and 37.8 [32.1–45.3] N, respectively (Figure 6).

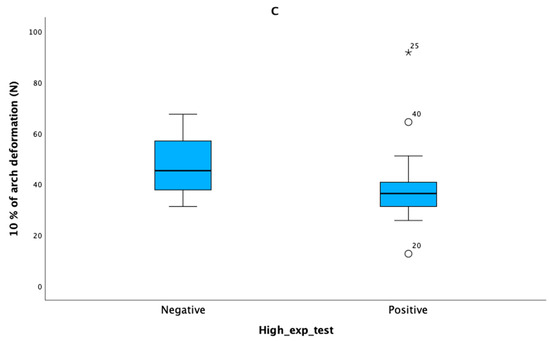
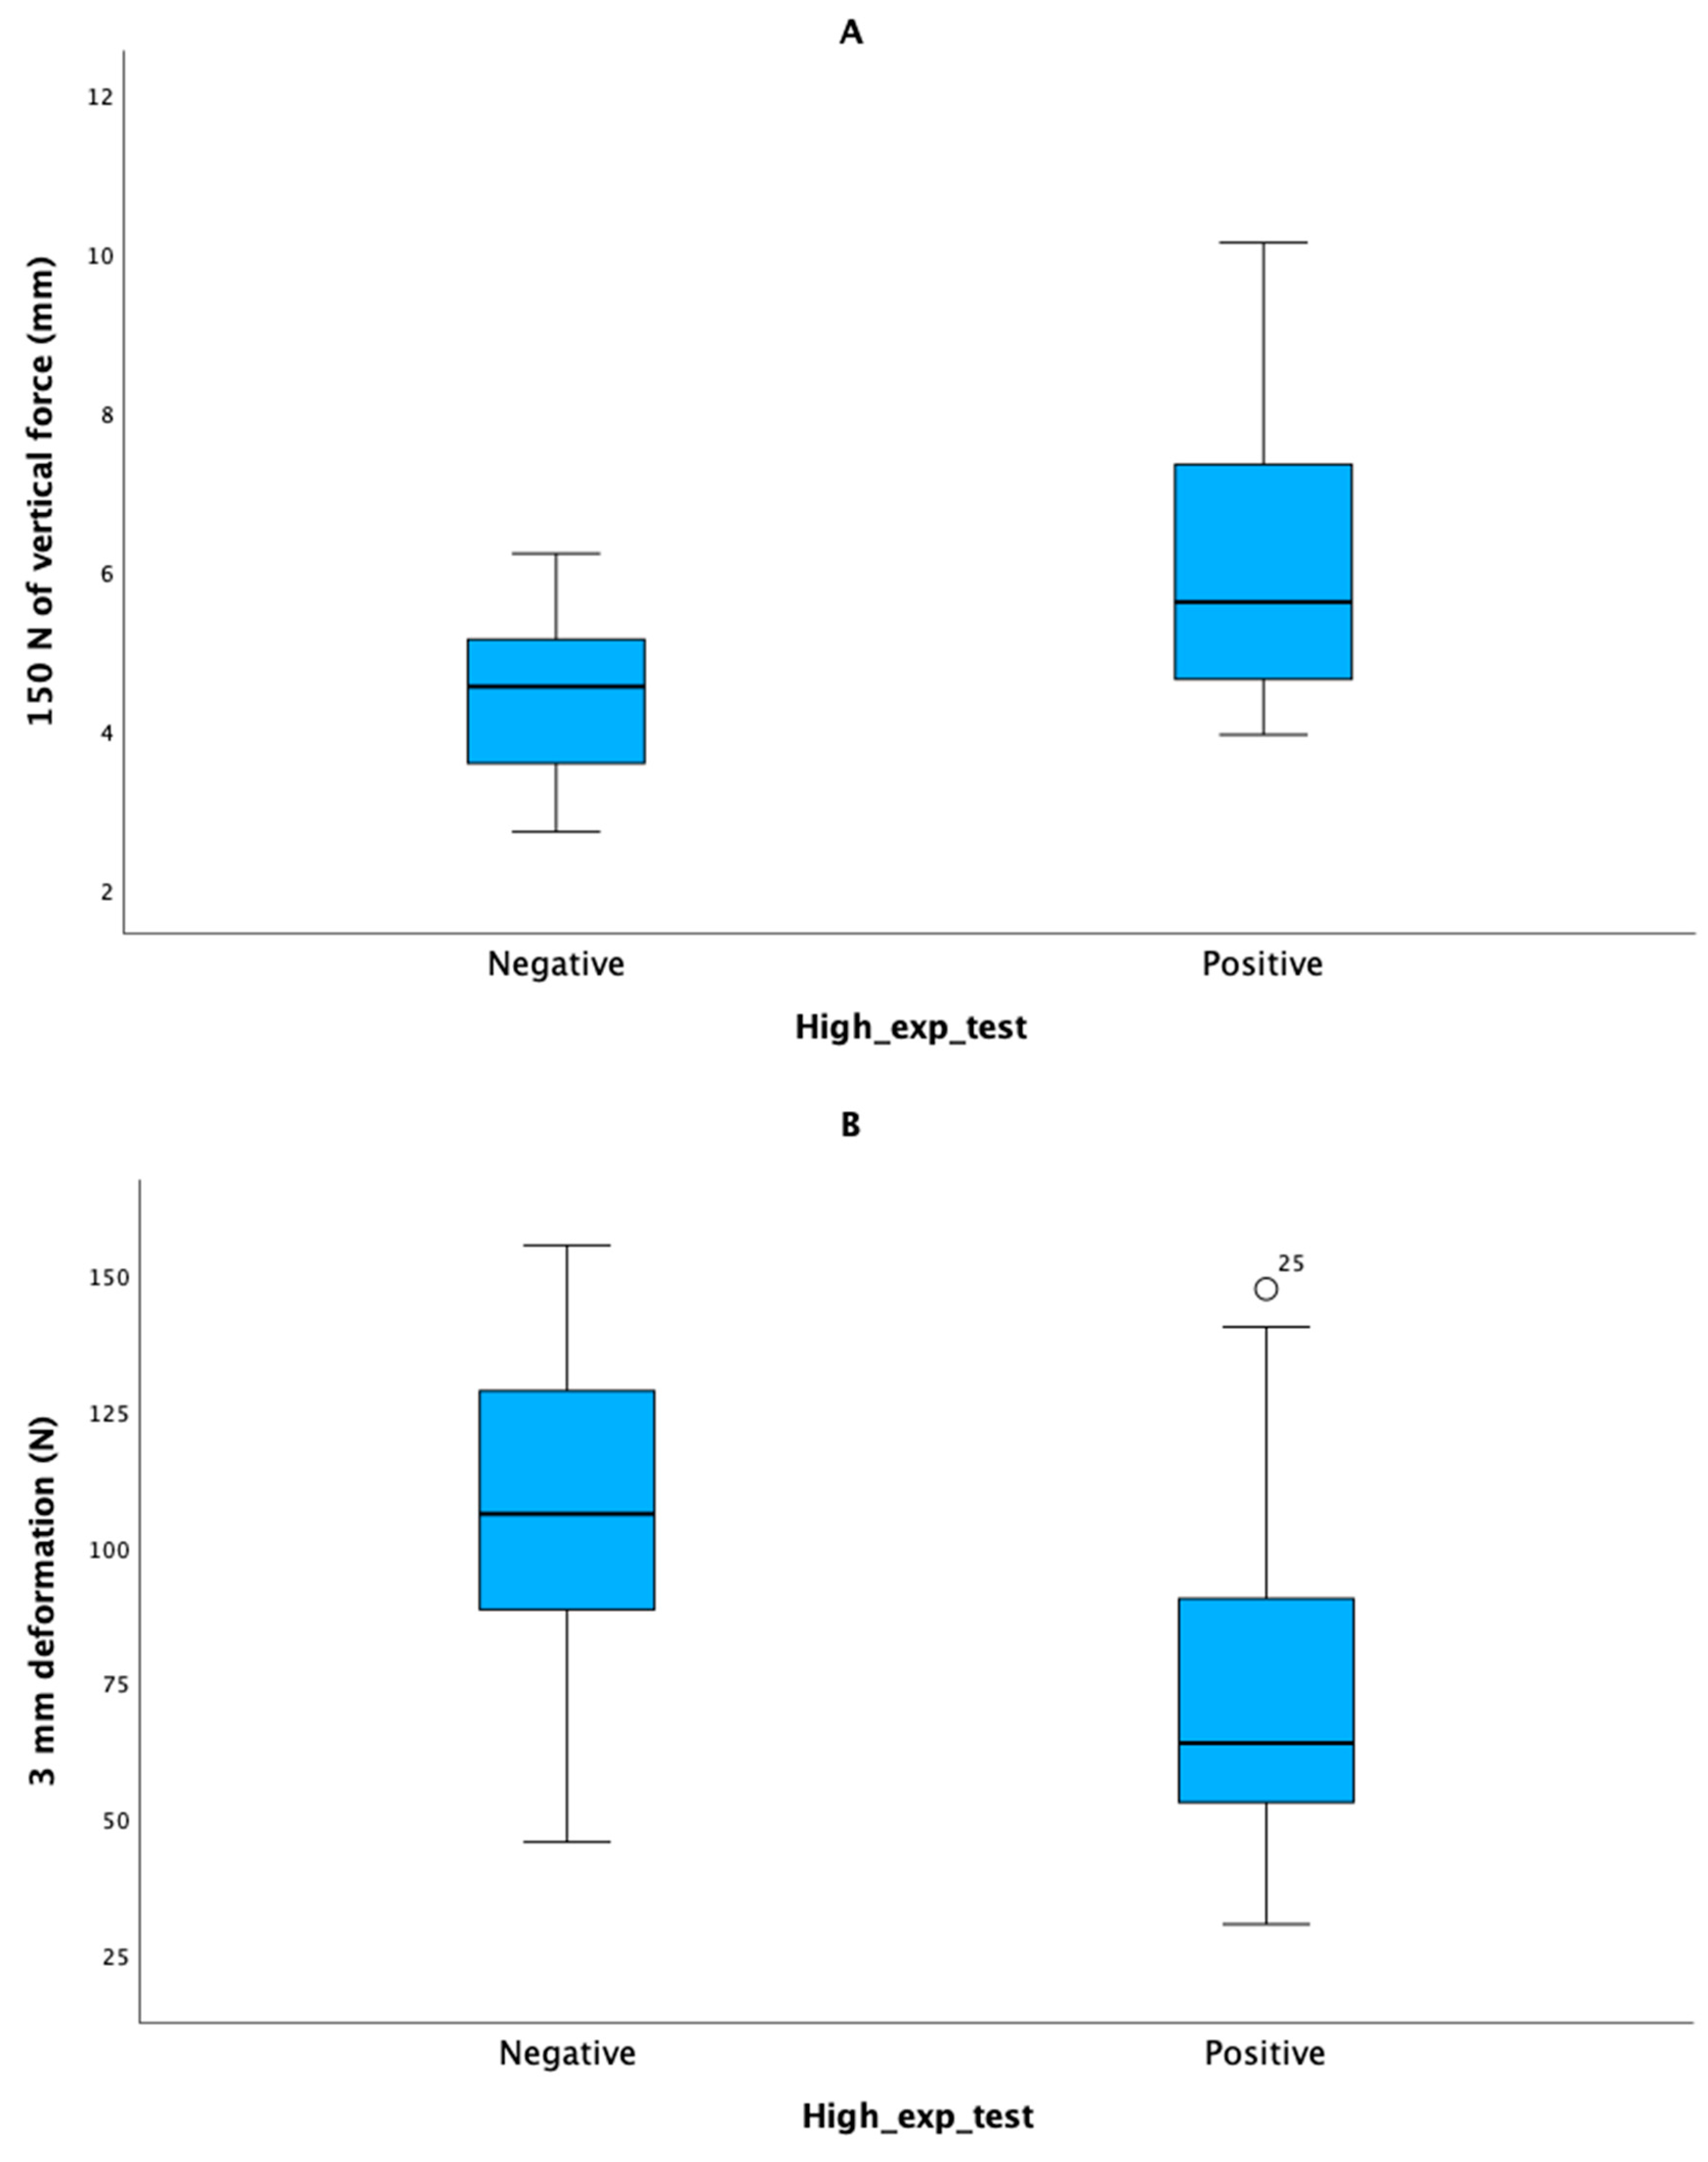
Figure 6.
Differences between positive and negative tests for the researcher with a high level of experience. Panel (A) (top): The compression device applied 150 N of vertical force. Panel (B) (middle): middle side. The medial longitudinal arch was deformed vertically 3 mm. Panel (C) (bottom): The medial longitudinal arch was deformed by 10% of the maximum height of the medial longitudinal arch.
Tests noted by the researcher to be positive were characterised by higher levels of deformation (5.62 [4.64–7.38] mm) than negative tests (4.56 [3.59–5.28] mm) for a compression level of 150 N (p = 0.003).
Orthoses with positive tests required lower levels of vertical force (63.9 [52.2–90.6] N) than orthoses with negative tests (106 [87.4–133] N) to yield 3 mm of deformation of the medial longitudinal arch (p = 0.003)
Finally, 10% of the medial longitudinal arch deformation was achieved with lower levels of vertical force in orthoses with positive tests (36.4 [31.1–40.8] N) compared with orthoses with negative tests (45.3 [37.5–58.7] N; p = 0.003).
4. Discussion
An ODT is performed when a clinician intends to evaluate the degree of stiffness that a polypropylene custom foot orthosis retains after use. This simple test does not require specific equipment; it can accordingly be performed when a patient is being clinically evaluated. Our findings showed that this test is valid for interpreting the degree of deformation suffered by a polypropylene custom foot orthosis. However, our data suggest that clinical experience is necessary to properly interpret an ODT.
The medial longitudinal arch is responsible for absorbing and distributing the weight-bearing loading that the foot supports during walking and running. In the non-weight-bearing position, there are no GRFs on the foot. However, during supporting activities GRFs exert pressure beneath both the rearfoot and the forefoot. Both the rearfoot and the forefoot tend to approximate closer together over the foot dorsum. The degree of dorsiflexion movement or arch collapse depends on the stiffness and flexibility-related characteristics of the joints located between the forefoot and the rearfoot; the joints compounding the medial column of the foot play particularly important roles [35]. Higher levels of medial arch collapse translate into both higher levels of tensile stress in plantar structures such as the plantar aponeurosis, plantar ligaments, and extrinsic foot tendons and higher levels of dorsal compression stress of medial column joints [36].
Furthermore, the windlass mechanism begins when GRFs acting over the hallux generate dorsiflexion movement between the first metatarsal and hallux (i.e., the metatarso-phalangeal joint) during the propulsive phase of the gait cycle [37]. Rotation of the hallux over the first metatarsal generates plantar aponeurosis tension due to its insertion in the proximal phalanx of the hallux. That process establishes the effective windlass mechanism [38]. Excessive arch foot collapse results in ineffective dorsiflexion of the first metatarso-phalangeal joint and delayed onset of the windlass mechanism [39]. That condition has been associated with painful osseous and soft tissue pathologies such as plantar fasciitis [38,40,41]. It has been demonstrated that restarting the windlass mechanism via plantar approaches ameliorates the pain of patients with persistent plantar fasciitis [42]. Therefore, appropriate stiffness of custom foot orthoses can help prevent excessive foot collapse and the delayed-onset windlass mechanism, thereby contributing to reducing the pain associated with plantar fasciitis.
The results of this study suggest that the ODT is useful for evaluating the effectiveness of the stiffness of custom polypropylene foot orthoses. Findings revealed that the application of a vertical force of to 150 N over the custom foot orthosis can deform an orthosis with positive tests by more than 5 mm compared with orthoses associated with a negative test, which exhibited reduced arch collapse (Figure 6A). This force is similar to what a clinician can exert with his thumb [32] when performing the ODT. Although, the medial longitudinal arch supports 179 N during walking and up to 358 N during running [43], a vertical force applied by a thumb appears sufficient to evaluate the degree of orthotic deformation.
The graphs of displacement versus force (Figure 5) revealed that the greatest disparity in displacement between orthoses, characterised by positive and negative tests, occurred during the initial 50 N; the remainder of the curve exhibited a constant difference in deformation. Similarly, 10% arch deformation took place below and above of 40 N of vertical force for the positive and negative test, respectively (Figure 6C). An excessive deformation of the orthoses is interpreted by clinicians as a failure of the orthosis to prevent foot collapse and establish the efficient windlass mechanism. These results suggest that failures in orthoses mainly manifest while the first 50 N of force is applied. Therefore, clinicians should identify this failure in orthoses early during the evaluation of the ODT.
Failure in the custom foot orthoses occurs as a consequence of repeated cycles of applied forces with each step that the patient takes. Those forces are correlated with use time and the patient’s weight, foot deformities, and type of activity. Evaluation of foot orthoses stiffness is widespread in clinical practice and is used to make decisions about the modifications required by custom foot orthoses. Kirby, who evaluated patients as they stood on orthoses, proposed that 5 mm of longitudinal medial arch deformation was excessive for relieving symptoms related to medial arch collapse [29]. Results of this study reveal that a vertical force of 150 N applied by the compression device to orthoses with a positive ODT deformed the orthoses by a median of 5.62 mm; orthoses with a negative ODT deformed by a median of 4.56 mm. A clinician’s thumb could not collapse the arch by more than 5 mm in the majority of orthoses with a negative test. According to our results, the hypothesis proposed by Kirby is supported; 5 mm of deformation should be considered the threshold for custom foot orthoses used to treat biomechanical pathologies.
Different custom foot orthoses intended to treat a variety of foot types were used in this study; different foot types generate different stresses, strains, and forces on dorsal arch support. Plantar pressures are increased in the midfoot in patients with flatfoot [13]. Therefore, clinicians tend to prescribe more rigid longitudinal medial arches for bearing midfoot plantar forces. New pes planus orthoses with added rearfoot and forefoot posts are expected to offer more resistance; pes cavus orthoses and used orthoses are expected to offer less resistance. However, this heterogeneity was not reflected in the ODT results (p = 0.003).
Finally, our results revealed that the opinions of the researcher with the fewest years of experience were incongruent with those of the more experienced researchers (p = 0.493 [−0.378–0.181]; p = 0.452 [−0.332–0.150]). These findings suggest that clinical experience is a factor that influences the interpretation of the ODT and highlight the need to establish teaching strategies that shorten the time necessary to identify the failure in custom foot orthose by the ODT.
It is necessary to carefully follow the test steps and conduct training to ensure consistent interpretation of the ODT results. Common errors that can improve reproducibility include not exerting a maximal force with the thumb over the orthosis, not applying enough resistance with the non-dominant hand to the lateral arch to prevent rotation of the orthosis, and not applying vertical force at the appropriate point (i.e., the apex of the medial longitudinal arch near the edge of the orthosis). Applying force to other areas of the medial longitudinal arch should be avoided because the applied lever arm of the thumb can vary and decrease the applied force. Furthermore, we propose a combination of applying a vertical force with the thumb and interpreting the deformation of the longitudinal arch with the patient standing on the orthoses to reduce resulting variability when working with novice clinicians.
Furthermore, this study included a small number of researchers evaluating ODT. Three researchers with different levels of experience were included in this study because the objective was to evaluate the impact of researcher expertise on the interpretation of this subjective test. Medical statistics [44] support the validity of the sampling compared with mechanical testing with current developed experiments; however, additional studies including a larger number of researchers with the same levels of experience should be conducted to ensure the reproducibility of this test. Finally, although ODT has been shown to be a valid method for assessing the deformation of polypropylene orthoses, this study does not directly address whether these insoles meet clinical needs or improve patient outcomes. Follow-on research should focus on this aspect.
This study is the first to evaluate the validity of the ODT and the impact of researcher expertise on the reproducibility test, a commonly used test in the clinical practice of podiatry.
5. Conclusions
Using a thumb to apply a maximal force on the dorsal surface of the orthosis yielded a degree of medial longitudinal arch deformation similar to that obtained by an electromechanical device. This finding demonstrates that the ODT is a valid method for evaluating the deformation of polypropylene orthoses.
A 5 mm displacement in the sagittal plane of the medial longitudinal arch after applying maximal force with a thumb should be considered a positive ODT. Furthermore, positive tests exhibited greater deformation during the initial 50 N of applied force, suggesting an early deformation of the orthosis during initial weight-bearing activities in those positive ODTs.
However, researcher expertise affected the interpretation of the ODT. A training routine focused on avoiding common errors is necessary to ensure the correct use and interpretation of the ODT.
Author Contributions
Conceptualization, A.S.-R., R.J.M.-B. and A.M.O.-G.; methodology, A.S.-R., R.J.M.-B. and M.A.M.; formal analysis, R.J.M.-B. and J.A.-B.; investigation, A.S.-R. and R.J.M.-B.; resources, M.A.M. and J.L.L.-M.; writing—original draft preparation, R.J.M.-B.; writing—review and editing, A.S.-R., M.A.M., J.A.-B., J.L.L.-M. and A.M.O.-G. All authors have read and agreed to the published version of the manuscript.
Funding
This research received no external funding.
Data Availability Statement
The original contributions presented in the study are included in the article; further inquiries can be directed to the corresponding author.
Conflicts of Interest
The authors declare no conflicts of interest.
References
- Manfredi-Márquez, M.J.; Tavara-Vidalón, S.P.; Tavaruela-Carrión, N.; Gómez Benítez, M.A.; Fernandez-Seguín, L.M.; Ramos-Ortega, J. Study of Windlass Mechanism in the Lower Limb Using Inertial Sensors. Int. J. Environ. Res. Public Health 2023, 20, 3220. [Google Scholar] [CrossRef] [PubMed]
- Aquino, A.; Payne, C. Function of the plantar fascia. Foot 1999, 9, 72–78. [Google Scholar] [CrossRef]
- Stearne, S.M.; McDonald, K.A.; Alderson, J.A.; North, I.; Oxnard, C.E.; Rubenson, J. The Foot’s Arch and the Energetics of Human Locomotion. Sci. Rep. 2016, 6, 19403. [Google Scholar] [CrossRef] [PubMed]
- Orejana-Garcia, A.; Pérez-Monzó, F. Tissue stress model. Clinical applications in foot pathology. Rev. Esp. Pod. 2018, 29, 101–112. [Google Scholar] [CrossRef]
- Hawke, F.; Burns, J.; Radford, J.A.; du Toit, V. Custom-made foot orthoses for the treatment of foot pain. Cochrane Database Syst. Rev. 2008, 3, CD006801. [Google Scholar] [CrossRef]
- Razeghi, M.; Batt, M.E. Biomechanical analysis of the effect of orthotic shoe inserts: A review of the literature. Sports Med. 2000, 29, 425–438. [Google Scholar] [CrossRef]
- Cheung, R.T.H.; Chung, R.C.K.; Ng, G.Y.F. Efficacies of different external controls for excessive foot pronation: A meta-analysis. Br. J. Sports Med. 2011, 45, 743–751. [Google Scholar] [CrossRef]
- Healy, A.; Farmer, S.; Pandyan, A.; Chockalingam, N. A systematic review of randomised controlled trials assessing effectiveness of prosthetic and orthotic interventions. PLoS ONE 2018, 13, e0192094. [Google Scholar] [CrossRef]
- Burns, J.; Wegener, C.; Begg, L.; Vicaretti, M.; Fletcher, J. Randomized trial of custom orthoses and footwear on foot pain and plantar pressure in diabetic peripheral arterial disease. Diabet. Med. 2009, 26, 893–899. [Google Scholar] [CrossRef]
- Paton, J.S.; Stenhouse, E.A.; Bruce, G.; Zahra, D.; Jones, R.B. A comparison of customised and prefabricated insoles to reduce risk factors for neuropathic diabetic foot ulceration: A participant-blinded randomised controlled trial. J. Foot Ankle Res. 2012, 5, 31. [Google Scholar] [CrossRef]
- Ruiz-Ramos, M.; Orejana-García, A.M.; Vives-Merino, I.; Bravo-Llatas, C.; Lázaro-Martínez, J.L.; Molines-Barroso, R.J. Effectiveness of the Fixtoe Device(R) in plantar pressure reduction: A preliminary study. BMC Musculoskelet. Disord. 2022, 23, 475. [Google Scholar] [CrossRef] [PubMed]
- Zhang, L.Y.; Liu, Q.L.; Yick, K.L.; Yip, J.; Ng, S.P. Analysis of Diabetic Foot Deformation and Plantar Pressure Distribution of Women at Different Walking Speeds. Int. J. Environ. Res. Public Health 2023, 20, 3688. [Google Scholar] [CrossRef] [PubMed]
- Deepashini, H.; Omar, B.; Paungmali, A.; Amaramalar, N.; Ohnmar, H.; Leonard, J. An insight into the plantar pressure distribution of the foot in clinical practice: Narrative review. Pol. Ann. Med. 2014, 21, 51–56. [Google Scholar] [CrossRef]
- Haris, F.L.; Liau, B.-Y.; Jan, Y.-K.; Akbari, V.B.H.; Primanda, Y.; Lin, K.-H.; Lung, C.-W. A Review of the Plantar Pressure Distribution Effects from Insole Materials and at Different Walking Speeds. Appl. Sci. 2021, 11, 11851. [Google Scholar] [CrossRef]
- Mientjes, M.I.V.; Shorten, M. Contoured cushioning: Effects of surface compressibility and curvature on heel pressure distribution. Footwear Sci. 2011, 3, 23–32. [Google Scholar] [CrossRef]
- Whittaker, G.A.; Munteanu, S.E.; Menz, H.B.; Tan, J.M.; Rabusin, C.L.; Landorf, K.B. Foot orthoses for plantar heel pain: A systematic review and meta-analysis. Br. J. Sports Med. 2018, 52, 322–328. [Google Scholar] [CrossRef]
- Hajizadeh, M.; Desmyttere, G.; Carmona, J.-P.; Bleau, J.; Begon, M. Can foot orthoses impose different gait features based on geometrical design in healthy subjects? A systematic review and meta-analysis. Foot 2020, 42, 101646. [Google Scholar] [CrossRef]
- Kirby, K.A.; Spooner, S.K.; Scherer, P.R.; Schuberth, J.M. Foot orthoses. Foot Ankle Spec. 2012, 5, 334–343. [Google Scholar] [CrossRef]
- Naderi, A.; Degens, H.; Sakinepoor, A. Arch-support foot-orthoses normalize dynamic in-shoe foot pressure distribution in medial tibial stress syndrome. Eur. J. Sport. Sci. 2019, 19, 247–257. [Google Scholar] [CrossRef]
- Hornestam, J.F.; Souza, T.R.; Arantes, P.; Ocarino, J.; Silva, P.L. The Effect of Walking Speed on Foot Kinematics is Modified When Increased Pronation is Induced. J. Am. Podiatr. Med. Assoc. 2016, 106, 419–426. [Google Scholar] [CrossRef]
- Redmond, A.C.; Landorf, K.B.; Keenan, A.M. Contoured, prefabricated foot orthoses demonstrate comparable mechanical properties to contoured, customised foot orthoses: A plantar pressure study. J. Foot Ankle Res. 2009, 2, 20. [Google Scholar] [CrossRef] [PubMed]
- Pelaez, A.S.T.; Farahpour, N.; Griffiths, I.B.; Moisan, G. Thick shells and medially wedged posts increase foot orthoses medial longitudinal arch stiffness: An experimental study. J. Foot Ankle Res. 2023, 16, 11. [Google Scholar] [CrossRef] [PubMed]
- Shahar, F.S.; Hamed-Sultan, M.T.; Lee, S.H.; Jawaid, M.; Md Shah, A.U.; Safri, S.N.A.; Sivasankaran, P.N. A review on the orthotics and prosthetics and the potential of kenaf composites as alternative materials for ankle-foot orthosis. J. Mech. Behav. Biomed. Mater. 2019, 99, 169–185. [Google Scholar] [CrossRef] [PubMed]
- Alfaro-Santafé, J.; Gómez-Bernal, A.; Lanuza-Cerzócimo, C.; Alfaro-Santafé, J.V.; Pérez-Morcillo, A.; Almenar-Arasanz, A.J. Effectiveness of Custom-Made Foot Orthoses vs. Heel-Lifts in Children with Calcaneal Apophysitis (Sever’s Disease): A CONSORT-Compliant Randomized Trial. Children 2021, 8, 963. [Google Scholar] [CrossRef]
- Jena, S.; Arunachalam, T.; Panda, S.K. Experimental and numerical investigation of a polypropylene orthotic device for assistance in level ground walking. Proc. Inst. Mech. Eng. H 2020, 234, 356–369. [Google Scholar] [CrossRef]
- Rogati, G.; Caravaggi, P.; Leardini, A.; Erani, P.; Fognani, R.; Saccon, G.; Boriani, L.; Baleani, M. A novel apparatus to assess the mechanical properties of Ankle-Foot Orthoses: Stiffness analysis of the Codivilla spring. J. Biomech. 2022, 142, 111239. [Google Scholar] [CrossRef]
- Fatone, S.; Owen, E.; Gao, F.; Shippen, G.; Orendurff, M.S.; Bjornson, K. Comparison of Sagittal Plane Stiffness of Nonarticulated Pediatric Ankle-Foot Orthoses Designed to be Rigid. J. Prosthet. Orthot. 2022, 34, e44–e49. [Google Scholar] [CrossRef]
- Choo, Y.J.; Chang, M.C. Commonly Used Types and Recent Development of Ankle-Foot Orthosis: A Narrative Review. Healthcare 2021, 9, 1046. [Google Scholar] [CrossRef]
- Kirby, K.A. Foot and Lower Extremity Biomechanics II: Precision Intricast Newsletters, 1997–2002; Precision Intricast Inc.: Payson, AZ, USA, 2002; Volume 2. [Google Scholar]
- Silva, R.; Veloso, A.; Alves, N.; Fernandes, C.; Morouço, P. A Review of Additive Manufacturing Studies for Producing Customized Ankle-Foot Orthoses. Bioengineering 2022, 9, 249. [Google Scholar] [CrossRef]
- Salles, A.S.; Gyi, D.E. An evaluation of personalised insoles developed using additive manufacturing. J. Sports Sci. 2013, 31, 442–450. [Google Scholar] [CrossRef]
- Nussbaum, M.A.; Johnson, H. Determination and evaluation of acceptable force limits in single-digit tasks. Hum. Factors 2002, 44, 545–556. [Google Scholar] [CrossRef] [PubMed]
- Barkoula, N.M.; Alcock, B.; Cabrera, N.O.; Peijs, T. Fatigue Properties of Highly Oriented Polypropylene Tapes and All-Polypropylene Composites. Polym. Polym. Compos. 2008, 16, 101–113. [Google Scholar] [CrossRef]
- Hallgren, K.A. Computing inter-rater reliability for observational data: An overview and tutorial. Tutor. Quant. Methods Psychol. 2012, 8, 23–34. [Google Scholar] [CrossRef] [PubMed]
- Pearce, C.J.; Calder, J.D. Surgical anatomy of the midfoot. Knee Surg. Sports Traumatol. Arthrosc. 2010, 18, 581–586. [Google Scholar] [CrossRef] [PubMed]
- Kirby, K.A. Longitudinal arch load-sharing system of the foot. Rev. Esp. Pod 2017, 28, 37–45. [Google Scholar] [CrossRef]
- Sichting, F.; Ebrecht, F. The rise of the longitudinal arch when sitting, standing, and walking: Contributions of the windlass mechanism. PLoS ONE 2021, 16, e0249965. [Google Scholar] [CrossRef]
- Aquino, A.; Payne, C. Function of the windlass mechanism in excessively pronated feet. J. Am. Podiatr. Med. Assoc. 2001, 91, 245–250. [Google Scholar] [CrossRef]
- Paton, J.S. The relationship between navicular drop and first metatarsophalangeal joint motion. J. Am. Podiatr. Med. Assoc. 2006, 96, 313–317. [Google Scholar] [CrossRef]
- Fuller, E.A. The windlass mechanism of the foot. A mechanical model to explain pathology. J. Am. Podiatr. Med. Assoc. 2000, 90, 35–46. [Google Scholar] [CrossRef]
- Bolgla, L.A.; Malone, T.R. Plantar Fasciitis and the Windlass Mechanism: A Biomechanical Link to Clinical Practice. J. Athl. Train. 2004, 39, 77–82. [Google Scholar]
- Abdalbary, S.A.; Alhaskawi, A.; Zhou, H.; Dong, Y.; Tu, T.; Li, P.; Lu, H. Predictive Measurement for Windlass Change in Length and Selected Treatment Outcomes in Chronic Plantar Fasciitis. J. Vis. Exp. 2024, 205, e65368. [Google Scholar] [CrossRef] [PubMed]
- Aminian, G.; Safaeepour, Z.; Farhoodi, M.; Pezeshk, A.F.; Saeedi, H.; Majddoleslam, B. The effect of prefabricated and proprioceptive foot orthoses on plantar pressure distribution in patients with flexible flatfoot during walking. Prosthet. Orthot. Int. 2013, 37, 227–232. [Google Scholar] [CrossRef] [PubMed]
- Miller, J.N.; Miller, J.C. Statistics and Chemometrics for Analytical Chemistry, 6th ed.; Pearson Education Limited: Essex, UK, 2010; pp. 74–106. [Google Scholar]


Disclaimer/Publisher’s Note: The statements, opinions and data contained in all publications are solely those of the individual author(s) and contributor(s) and not of MDPI and/or the editor(s). MDPI and/or the editor(s) disclaim responsibility for any injury to people or property resulting from any ideas, methods, instructions or products referred to in the content. |
© 2024 by the authors. Licensee MDPI, Basel, Switzerland. This article is an open access article distributed under the terms and conditions of the Creative Commons Attribution (CC BY) license (https://creativecommons.org/licenses/by/4.0/).