Abstract
Foam concrete has been used in various real-life applications for decades. Simple manufacturing methods, lightweight, high flowability, easy transportability, and low cost make it a useful construction material. This study aims to develop foam concrete mixtures for various civil and geotechnical engineering applications, such as in-fill, wall backfill and soil replacement work. A blended binder mix containing cement, fly ash and silica fume was produced for this study. Its compressive strength performance was compared against conventional general purpose (GP) cement-based foam concrete. Polypropylene (PP) fibre was used for both mixtures and the effect of various percentages of foam content on the compressive strength was thoroughly investigated. Additionally, two types of foaming agents were used to examine their impact on density, strength and setting time. One foaming agent was conventional, whereas the second foaming agent type can be used to manufacture permeable foam concrete. Results indicate that an increase in foam content significantly decreases the strength; however, this reduction is higher in GP mixes than in blended mixes. Nevertheless, the GP mixes attained two times higher compressive strength than the blended mix’s compressive strengths at any foam content. It was also found that the foaming agent associated with creating permeable foam concrete lost its strength (reduced by more than half), even though the density is comparable. The compressive stress–deformation behaviour showed that densification occurs in foam concrete due to its low density, and fibres contributed significantly to crack bridging. These two effects resulted in a long plateau in the compressive stress–strain behaviour of the fibre-reinforced foam concrete.
1. Introduction
Foam concrete has been used as a construction material for flooring systems in Europe and the United States since the first part of the 20th century and it was granted a patent in 1934 [1,2]. In general, foam concrete is a mixture of cement, water and air bubbles produced from a foaming agent. Consequently, foam concrete has a significantly lower density and strength than ordinary concrete [3,4]. Supplementary cementitious materials, such as fly ash and silica fume, can be used in foam concrete to reduce the percentage of cement usage [5].
Fresh foam concrete mix is highly flowable and self-compacted in nature. Therefore, it can safely and efficiently be placed in some confined or problematic areas, such as tunnels, trenches, pipes, wall backfills [6], road bases [5,7], soil replacement, concrete flooring, concrete panels, concrete blocks, roadside noise barriers [8,9,10,11,12,13], insulating materials [14,15], and other places where routine soil replacement works are difficult to maintain.
Typically, the cast density, thermal conductivity and the modulus of elasticity of foam concrete range from 200 to 1900 kg/m3, 0.1–0.7 W/mK and 1–8 GPa, respectively [7,16,17]. The compressive strength of foam concrete varies substantially depending on the mix design and density requirement. The stability of foam is crucial in manufacturing foam concrete. The instability of air bubbles can lead to a nonhomogeneous mix (segregation of the constituents) and a higher percentage of variation in the unit weight of foam concrete. Foam stability depends on many parameters, e.g., foaming agent type and concentration, w/c ratio of the mix, foam content, mixing method and duration, curing method and type of binders. As a result, controlling bubble stability remains an active field of research. In foam concrete, a highly influential parameter is the percentage of foam content that directly influences the strength, density and stability of the bubble networks of the product. The higher the rate of foam content, the lower the density and compressive strength of the foam concrete [18,19].
Therefore, it is important to investigate the effect of foam content and type on the stability of the foam concrete with varied density. In addition, the use of sustainable/recycled materials, such as fly ash, slag and silica fume as supplementary cementitious materials, is becoming important to achieve net-zero targets. Fly ash is a very common supplementary cementitious material that can reduce the permeability of concrete and increase the durability of concrete against elevated temperatures [20]. On the other hand, silica fumes are reported to improve the flexural and thermal behaviour of almost all types of concrete specimens [20,21]. Moreover, an extensive amount of research on the fresh and hardened state properties of plain foam concrete was conducted in the past [17,22,23,24,25,26,27,28,29,30,31,32,33]; however, research on fibre-reinforced foam concrete with a blend of cementitious materials is limited in the literature [34,35].
This study aims to reveal foam concrete mixes with various percentages of foam content and their ultimate strength prediction models relating to 3-day compressive strength. Two foam concrete mixes, each containing multiple percentages of foam content, are developed and their physical and mechanical properties are experimentally investigated and compared. This study terms one foam concrete mix as “Blended” and another as “GP cement”. The blended mix contains a blend of Australian general purpose (GP) cement with fly ash and silica fume as the binders. The GP cement mix contains only Australian GP cement as a binder.
The blended mix of the foam concrete developed in this study could be suitably used in various civil engineering fields. As the Blended mix replaces a certain percentage of Portland cement with supplementary cementitious materials, such as fly ash and silica fume, which are industrial by-products, the Blended foam concrete mix would be an environmentally friendly sustainable foam concrete mix for the construction industry. To summarise, the main objectives of this study are
- Developing a mix design with supplementary cementitious materials with varying foam content;
- Examining the effect of foam content on the density and compressive strength of the developed mix design and comparing it against conventional cement-based foam concrete;
- Comparing two types of foaming agents with different properties to explore their effect on the physical and mechanical properties of blended mixes.
2. Materials and Methods
2.1. Materials
To achieve the objectives of the study, the following variables are used:
- Two types of mix designs, designated as blended and GP (general purpose) cement
- Two different types of foaming agents: one foaming agent (AERLITE-IX™) is a conventionally used synthetic foaming liquid concentrate and another foaming agent (AQUAERiX™) is a permeable foam liquid concentrate. The foaming agents were sourced from Aerix Industries, Allentown, PA, USA.
The blended mixes were designed using cement, fly ash, silica fume, polypropylene (PP) fibres, water and foaming agents, whereas the GP mixes constitute cement, PP fibre, water and foaming agents. Details of these constituents are as follows:
2.1.1. Binders
Portland cement is known as general-purpose (GP) cement in Australia. Both GP cement and fly ash (Class F) were procured from Cement Australia Pty Ltd. (North Geelong VIC, Australia) and silica fume was supplied by Synergy Pigments Australia (Welshpool, Australia). According to the manufacturer specifications, the chemical composition of the fly ash is reported as follows—SiO2 (55.6%), CaO (3.5%), Al2O3 (27.2%), Fe2O3 (8.3%), K2O (0.85%), MgO (1.2%), Mn2O3 (0.1%), Na2O (0.36%), P2O5 (0.8%), SO3 (0.1%), TiO2 (1.5%), and moisture content of 0.1%. Loss of ignition and relative density were reported as 1.2% and 2.33, respectively. Fineness passing 45 µm sieve was 85%.
The particle size of the silica fume is approximately 100 times smaller than the average cement particles. The chemical composition of the silica fume is reported by the manufacturer as follows—SiO2 (93.16%), Fe2O3 (0.11%), Al2O3 (0.82%), CaO (0.3%), MgO (0.62%), K2O (0.51%), Na2O (0.43%), C (0.007%), SO3 (0.004%), Cl (0.003%), free Si (0.007%), and moisture content of 0.232%. Loss of ignition and relative density were reported as 3% and 660 kg/cm3, respectively. Fineness passing 45 µm sieve was 96.77%.
2.1.2. Foaming Agents
Both the conventional and permeable foam liquid concentrates used in this study are synthetic foaming agents. The former is utilised to produce general lightweight foam concrete, whereas the latter is applied to manufacture permeable low-density foam concrete where increased drainage is needed. The components of conventional synthetic foaming agent, as provided by the manufacturer datasheet, are water (40–50%), anionic surfactant (10–20%), amphoteric surfactant (5–15%), detergent (1–5%), isopropanol (1–5%), hexylene Glycol (1–5%), glycerine (<2%), FeSO4 (0.1–<1%), and ZiO (0.1–<1%). The components of the permeable foam liquid concentrate, however, are water (53–85%), ammonium alcohol (C6-10), ether sulphate (5–15%), cocamidopropyl betaine (4–7%), detergent (5–15%), and anionic surfactant (1–10%). The second type of foaming agent was selected to investigate the effect of permeability on the foam concrete properties since foam concrete is often used as soil replacement where permeability is desired.
2.1.3. PP Fibres
Generally, PP fibres control plastic shrinkage and prevent crack formation and propagation in the hardening phase of concrete [20,36]. Also, PP fibres enhance the tensile strength of concrete and help concrete elements achieve ductile behaviour [36]. This study procured PP fibres (commercial name: Danbar 900 g MicroPoly Fibres) from Danbar Micro Poly Fibres Australia (Horshan, VIC, Australia) and used them in fresh mixes of foam concrete to improve the deformation characteristics of the hardened foam concrete. The fibre length was 10–15 mm with a reported tensile strength of 650 MPa.
2.2. Mix Design
2.2.1. Effect of Foam Volume
Table 1 and Table 2 present the mix designs for blended and GP cement foam concrete with various percentages of foam contents, respectively. For this objective, conventional foam is used as a foaming agent to produce both mixes. The conventional foam concentrate was diluted with water at a ratio of 1:36. In the blended mixes, Blended-65, Blended-60, Blended-55, Blended-50, Blended-40 and Blended-30 corresponds to 35, 40, 45, 50, 60 and 70% of foam content, respectively. The mix ratio of binders (cement, fly ash and silica fume) in the blended mixes is 0.5:0.4:0.1, and the ratio of water to binders (w/b) is 0.4. PP fibres were used with an amount of 0.2% of the total volume to improve certain properties (tensile strength and shrinkage cracking) of the foam concrete.

Table 1.
Mix designs for the blended mixture.
Table 2.
Mix designs for the GP cement mixture.
In the GP cement mixes, GP cement-57, GP cement-51, GP cement-46, GP cement-41, GP cement-32, and GP cement-23 correspond to 43, 49, 54, 59, 68, and 77% of foam content, respectively. The ratio of water to cement (w/c) is maintained at 0.5 in the GP cement mixture.
The desired range of density of foam concrete is 400–1200 kg/m3, and one of the objectives of this study was to examine the effect of foam content. In this study, the foam content variation was considered within the range of 30–75% of the total volume. Considering the desired range of foam content and density, the slurry density was targeted at around 1700 kg/m3. The mix design was selected to achieve this initial slurry density. The slurry density before adding foam was 1685 ± 11.88 kg/m3 for the blended mix and 1705 ± 19.32 kg/m3 for the GP cement mix. Following the addition of the foam agent, the density was changed, which is reported in Section 3.1.
2.2.2. Effect of Foaming Agent
For this objective, both blended and GP cement mixtures were manufactured using these foaming agents, and the foam content percentage was kept at 50% for both mixes. The conventional foaming liquid and permeable foaming concentrate were diluted with water at 1:36 and 1:50 to produce foams, respectively, as per the manufacturer’s recommendation. The mix designs of blended and GP cement prepared with both foaming concentrates are given in Table 3.
Table 3.
Mix design of blended and GP cement manufactured using conventional foaming liquid and permeable foam concentrate.
2.2.3. Sample Preparation
To produce blended and GP mixes, the ingredients were first mixed in a dry condition in an automatic mixture machine for 2–3 min. Then, the required amount of water was added to the dry mix and the mixing continued for another 2–3 min. After that, the required foam volume was added to the mixture and the mixing was continued for an additional 2 min to obtain a homogeneous and stable cell structure. Afterwards, the fresh blended and GP cement mixtures were poured into cubes (100 mm) to set.
As both the mixtures are completely self-compacted, no compaction methods are applied to the mixes. Moreover, air curing was applied to the cube samples until the compressive strength tests were conducted. Compressive strength was conducted at 3, 7 and 28 days, and for each case, 3 samples were tested, resulting in a total of 108 samples (2 types of mixes × 6 foaming volumes × 3 curing duration × 3 samples). Additionally, 36 samples (2 types of mixes × 2 foaming agents × 3 curing duration × 3 samples) were fabricated to examine the effect of foaming agents.
2.3. Test Setup
Cast or wet density was measured for all the samples after 30 min of casting. Thus, it represents the density of fresh (wet) concrete. The wet density of the foam concrete was measured following the guidelines of ASTM C138/C138M-17a [37]. Figure 1 shows sample preparation, measuring wet density and final hardened samples. Initial and final setting times were measured for limited samples to obtain a general perception of the time required for the foam concrete to set since it can be significantly longer than ordinary concrete. Vicat apparatus was used to determine the initial and final setting time, as depicted in Figure 2a. The compressive strength tests of all the samples were conducted using an Instron universal testing machine at a displacement control rate of 0.25 mm/s. Figure 2b illustrates the test setup for determining compressive strength.
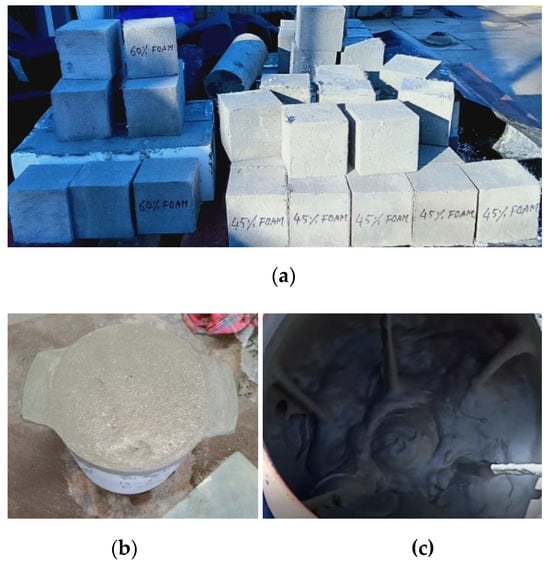
Figure 1.
Sample preparation and measurement of cast density, (a) Hardened samples (3 days old), (b) Measurement of cast density, (c) Mixing of fresh foam concrete.
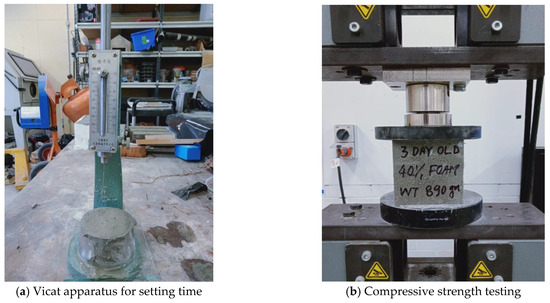
Figure 2.
Test setup for setting time and compressive strength.
3. Results and Discussion
3.1. Effect of Foam Content on Density
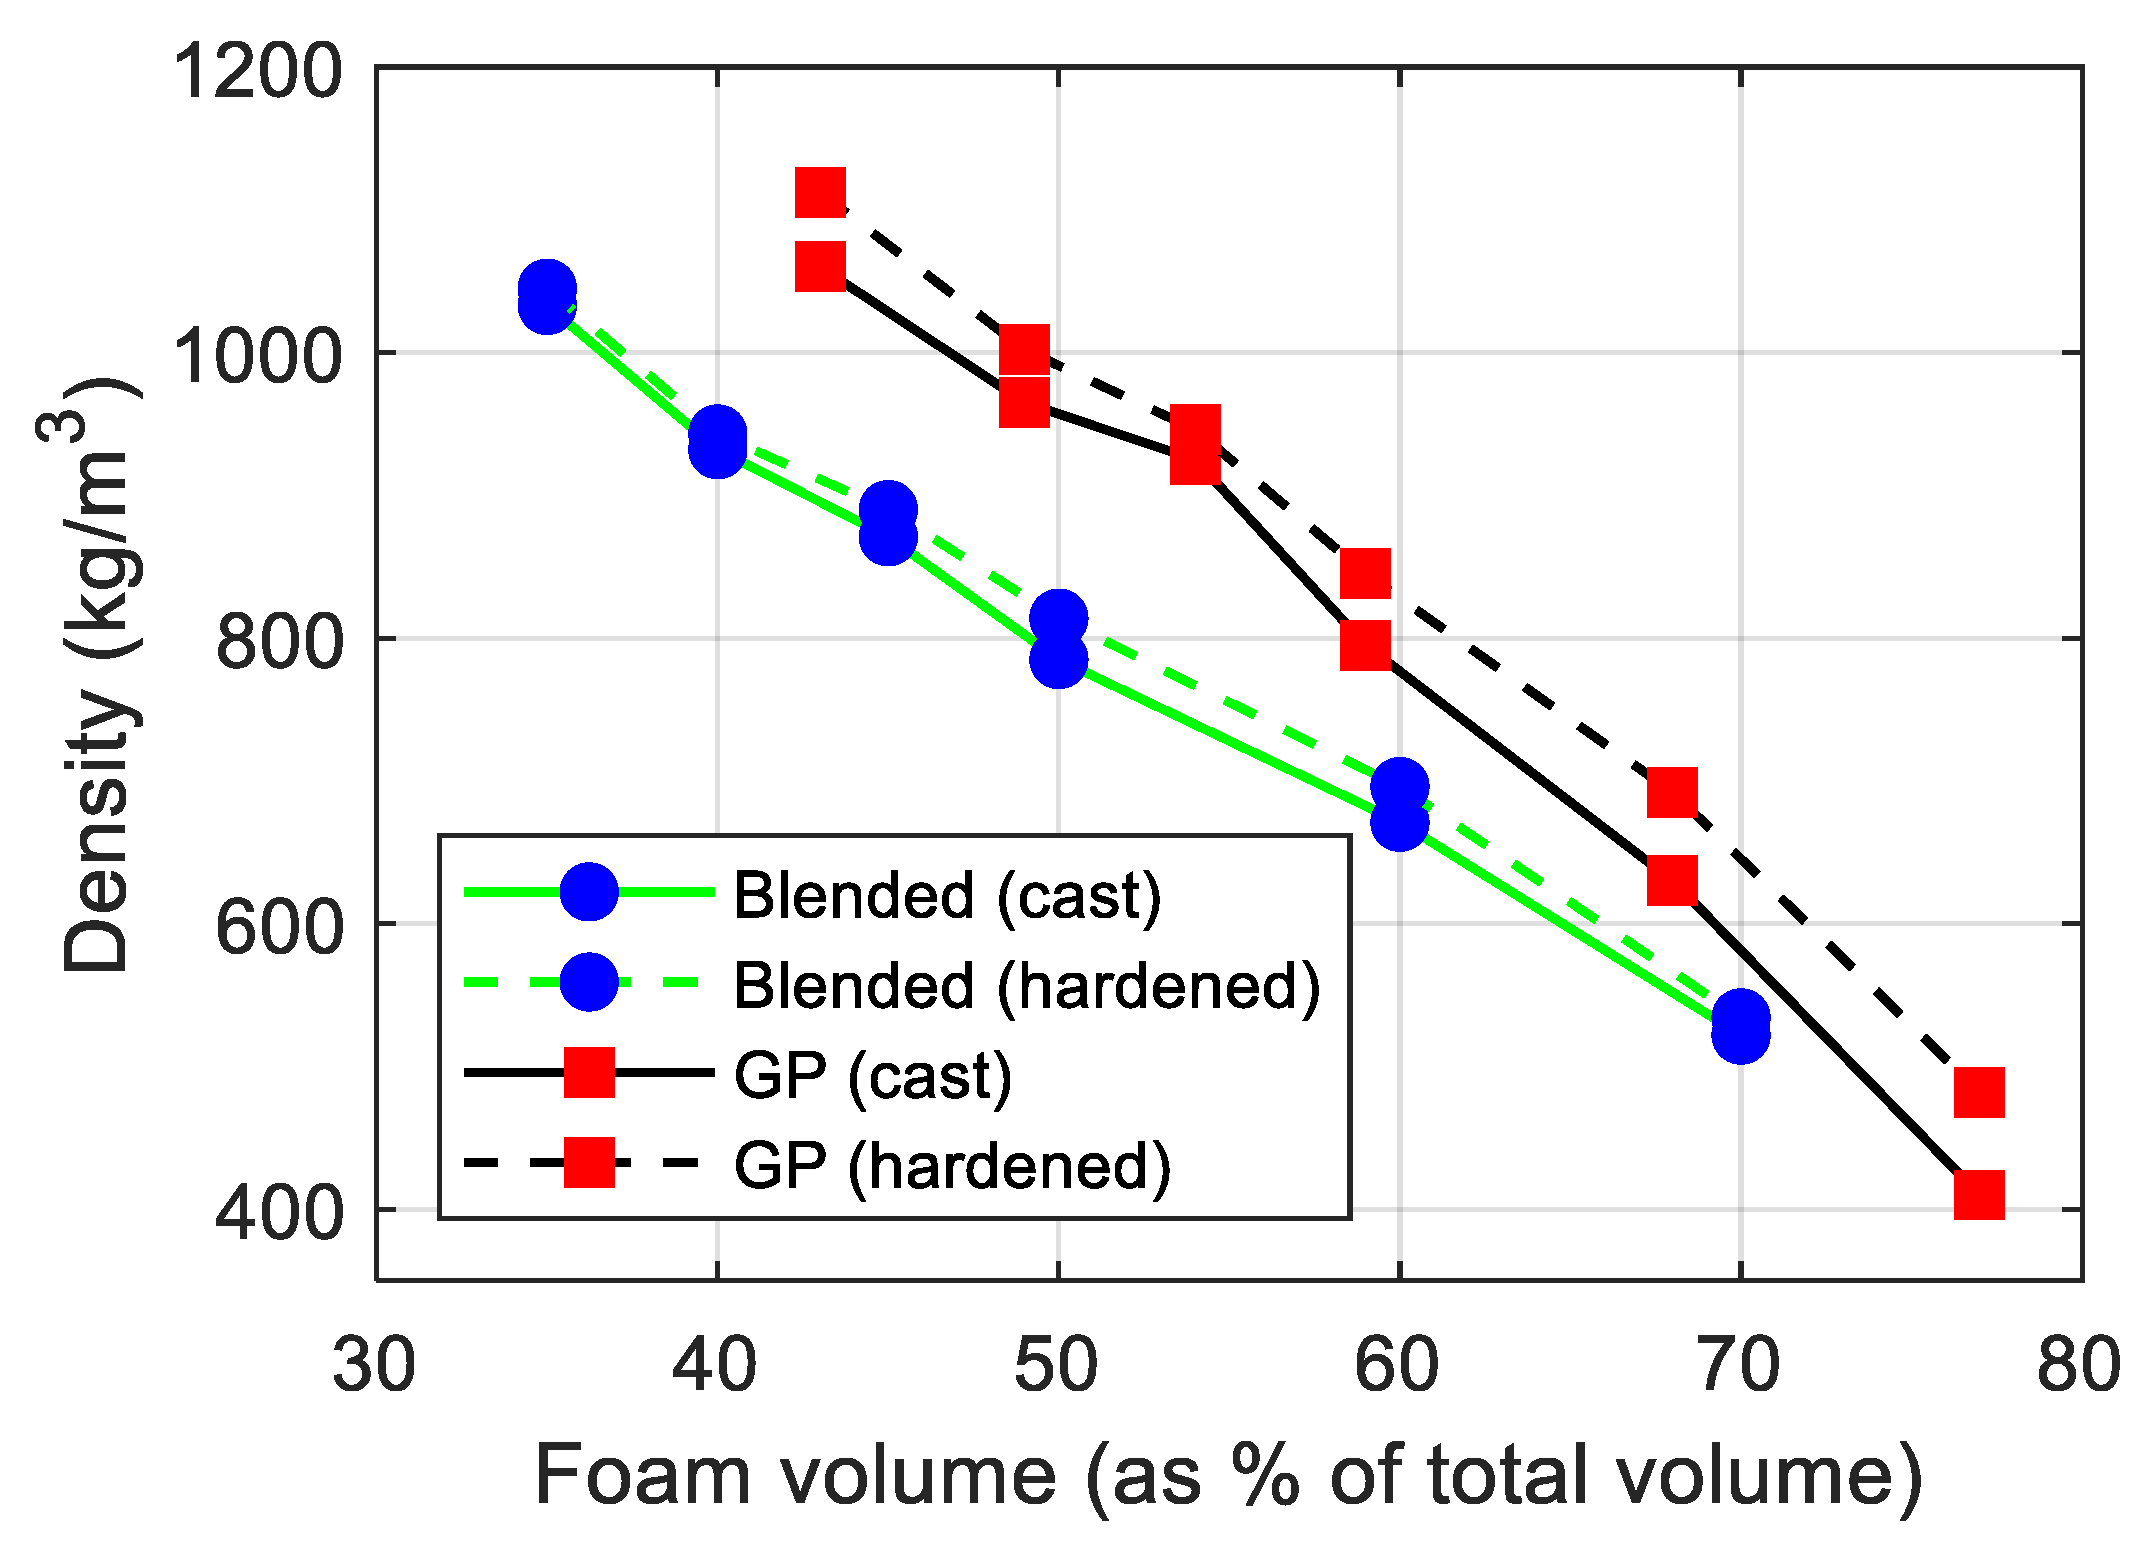
Figure 3 illustrates the changes in density of both types of cement mixes with increasing foam content. As expected, density reduced with increased foam volume. Change in density as a function of foam volume can be considered linear for blended mix within the range considered in this study. However, the GP cement mix’s density varies non-linearly as foam volume increases. Beyond 50% foam volume, the reduction in density is higher. As the foam amount increases, the possibilities of various bubble networks increase, which in turn can make some networks unstable, affecting the density.
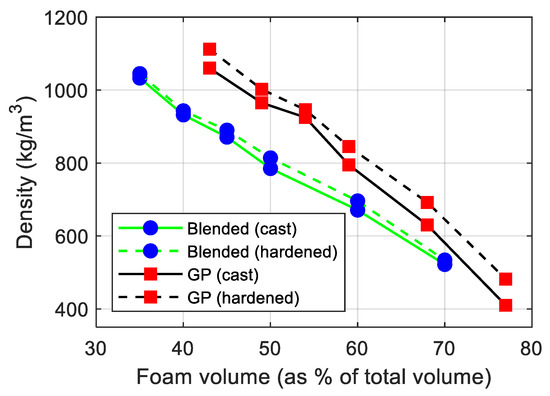
Figure 3.
Change in density of foam concrete with added foam content.
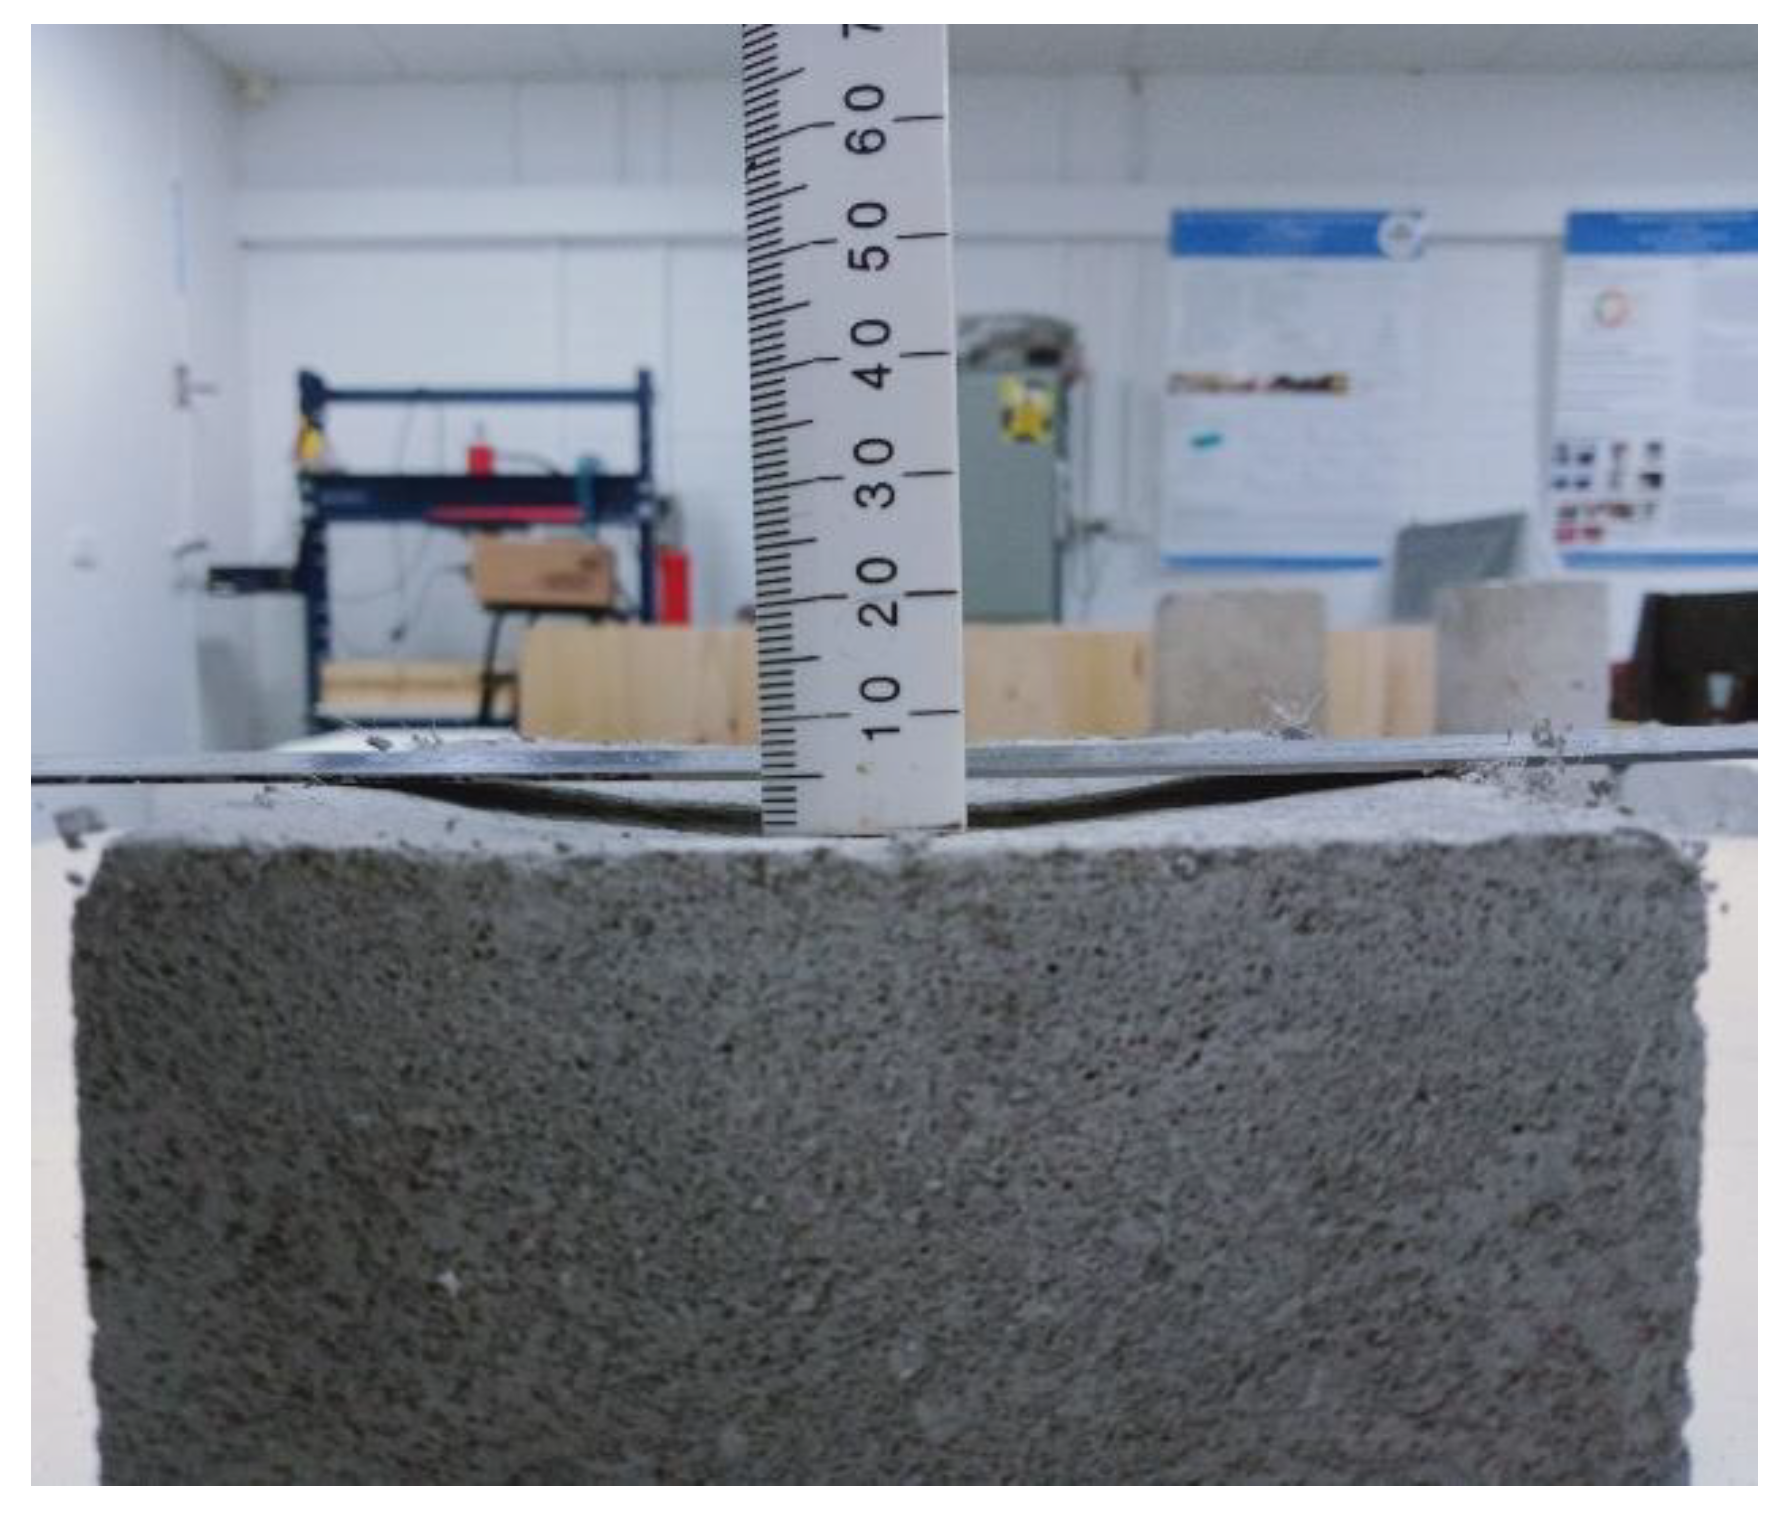
Even though the blended binder mix attained lower densities compared to its GP cement counterpart, it exhibited a more stable void network. For instance, GP mixes containing for than 50% foam volume witnessed a concave-shaped top surface with an approximate depth of 3–4 mm, as shown in Figure 4. This occurred after the foam concrete hardened and possibly due to the collapse of some void/bubble network within the samples. As the density decreases in foam concrete, stabilisation of the bubble network is difficult to achieve, resulting in dimensional instability [38]. However, this effect was negligible in the blended mix samples containing more than 50% foam volume. Lastly, this figure also compares the difference in fresh and hardened densities of both the mixes and the difference between these two was found to be negligible.
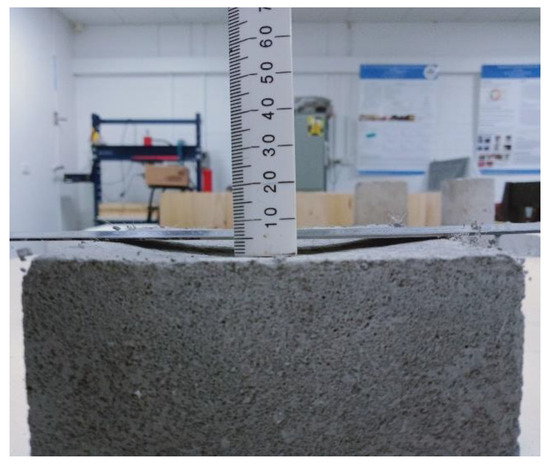
Figure 4.
Unstable void network for low-density foam concrete.
3.2. Effect of Foam Content on Compressive Strength
Figure 5 depicts the change in mean compressive strength with increased foam volume. It also compares the strength gain in 3, 7 and 28 days. The compressive strength of all the samples along with the standard deviation can be found in Appendix A. While comparing GP mix vs. blended mix, it is apparent that GP mixes attained significantly higher compressing strength than blended mixes. At approximately 45% foam volume, the 28-day compressive strength of the GP mix is almost 3.9 times higher than the same of the blended mix. In terms of strength gain, at 3 and 7 days, respectively, the GP mixes attained 45 and 62% of its 28-day strength (at 43% foam content), while these gains are 54 and 76% for the blended mix (at 45% foam content).
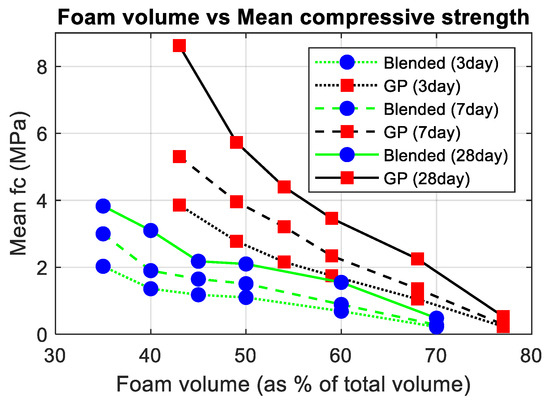
Figure 5.
Compressive strength as a function of foam volume.
The use of fly ash slows down the strength gain. Lam and Poon reported that a 45% replacement of cement using fly ash (with water to cement ratio of 0.4) reduced the 3-day compressive strength by 58% (from 35 MPa to 14.5 MPa) [39]. This reduction is 29% for 28-day compressive strength. They also found that for the same water-to-cement ratio, a binder with 55% cement, 40% fly ash and 5% silica fume yielded a reduction of 26% at 28-day compressive strength.
While compressive strength reduces with increasing foam volume, the difference in strength between GP and blended mix is found to be converging. This is possibly attributed to the unstable void network in blended mixes at higher foam content, as discussed before. Also, as the foam content increases, the properties of the mix are governed less by the properties of the binder. Therefore, the void network plays a more important role that is possibly responsible for the convergence of strength between blended and GP mixes. The compressive strength requirement for infill, as per Vic Roads Technical note TN007 [40], is 0.5–2 MPa, which was achieved for all the foam volume contents considered in this study, except the 70% foam volume case related to blended mix where the 28-day compressive strength was 0.48 MPa.
3.3. Effect of Foaming Agents
To compare the effect of foaming agents (conventional foaming liquid vs. permeable foaming concentrate), both blended and GP cement mixtures were manufactured with 50% foam volume. Table 4 compares the cast densities of blended and GP cement fabricated with conventional foaming liquid and permeable foaming agents. It is deduced from this table that foaming agent types may affect the density of the foam concrete. Regardless of the mix type, foam concrete prepared with permeable foaming concentrate shows lower density than that prepared with Aerlite-IX. Blended and GP cement mixes prepared using permeable foaming concentrate achieved 6% and 2% lower density than those produced utilising Aerlite-IX, respectively. The effect of foam agent types on the density variation could be significant depending on the foam percentage in the mixes.
Table 4.
The cast densities of the mixes prepared with conventional foaming liquid and permeable foaming concentrate.
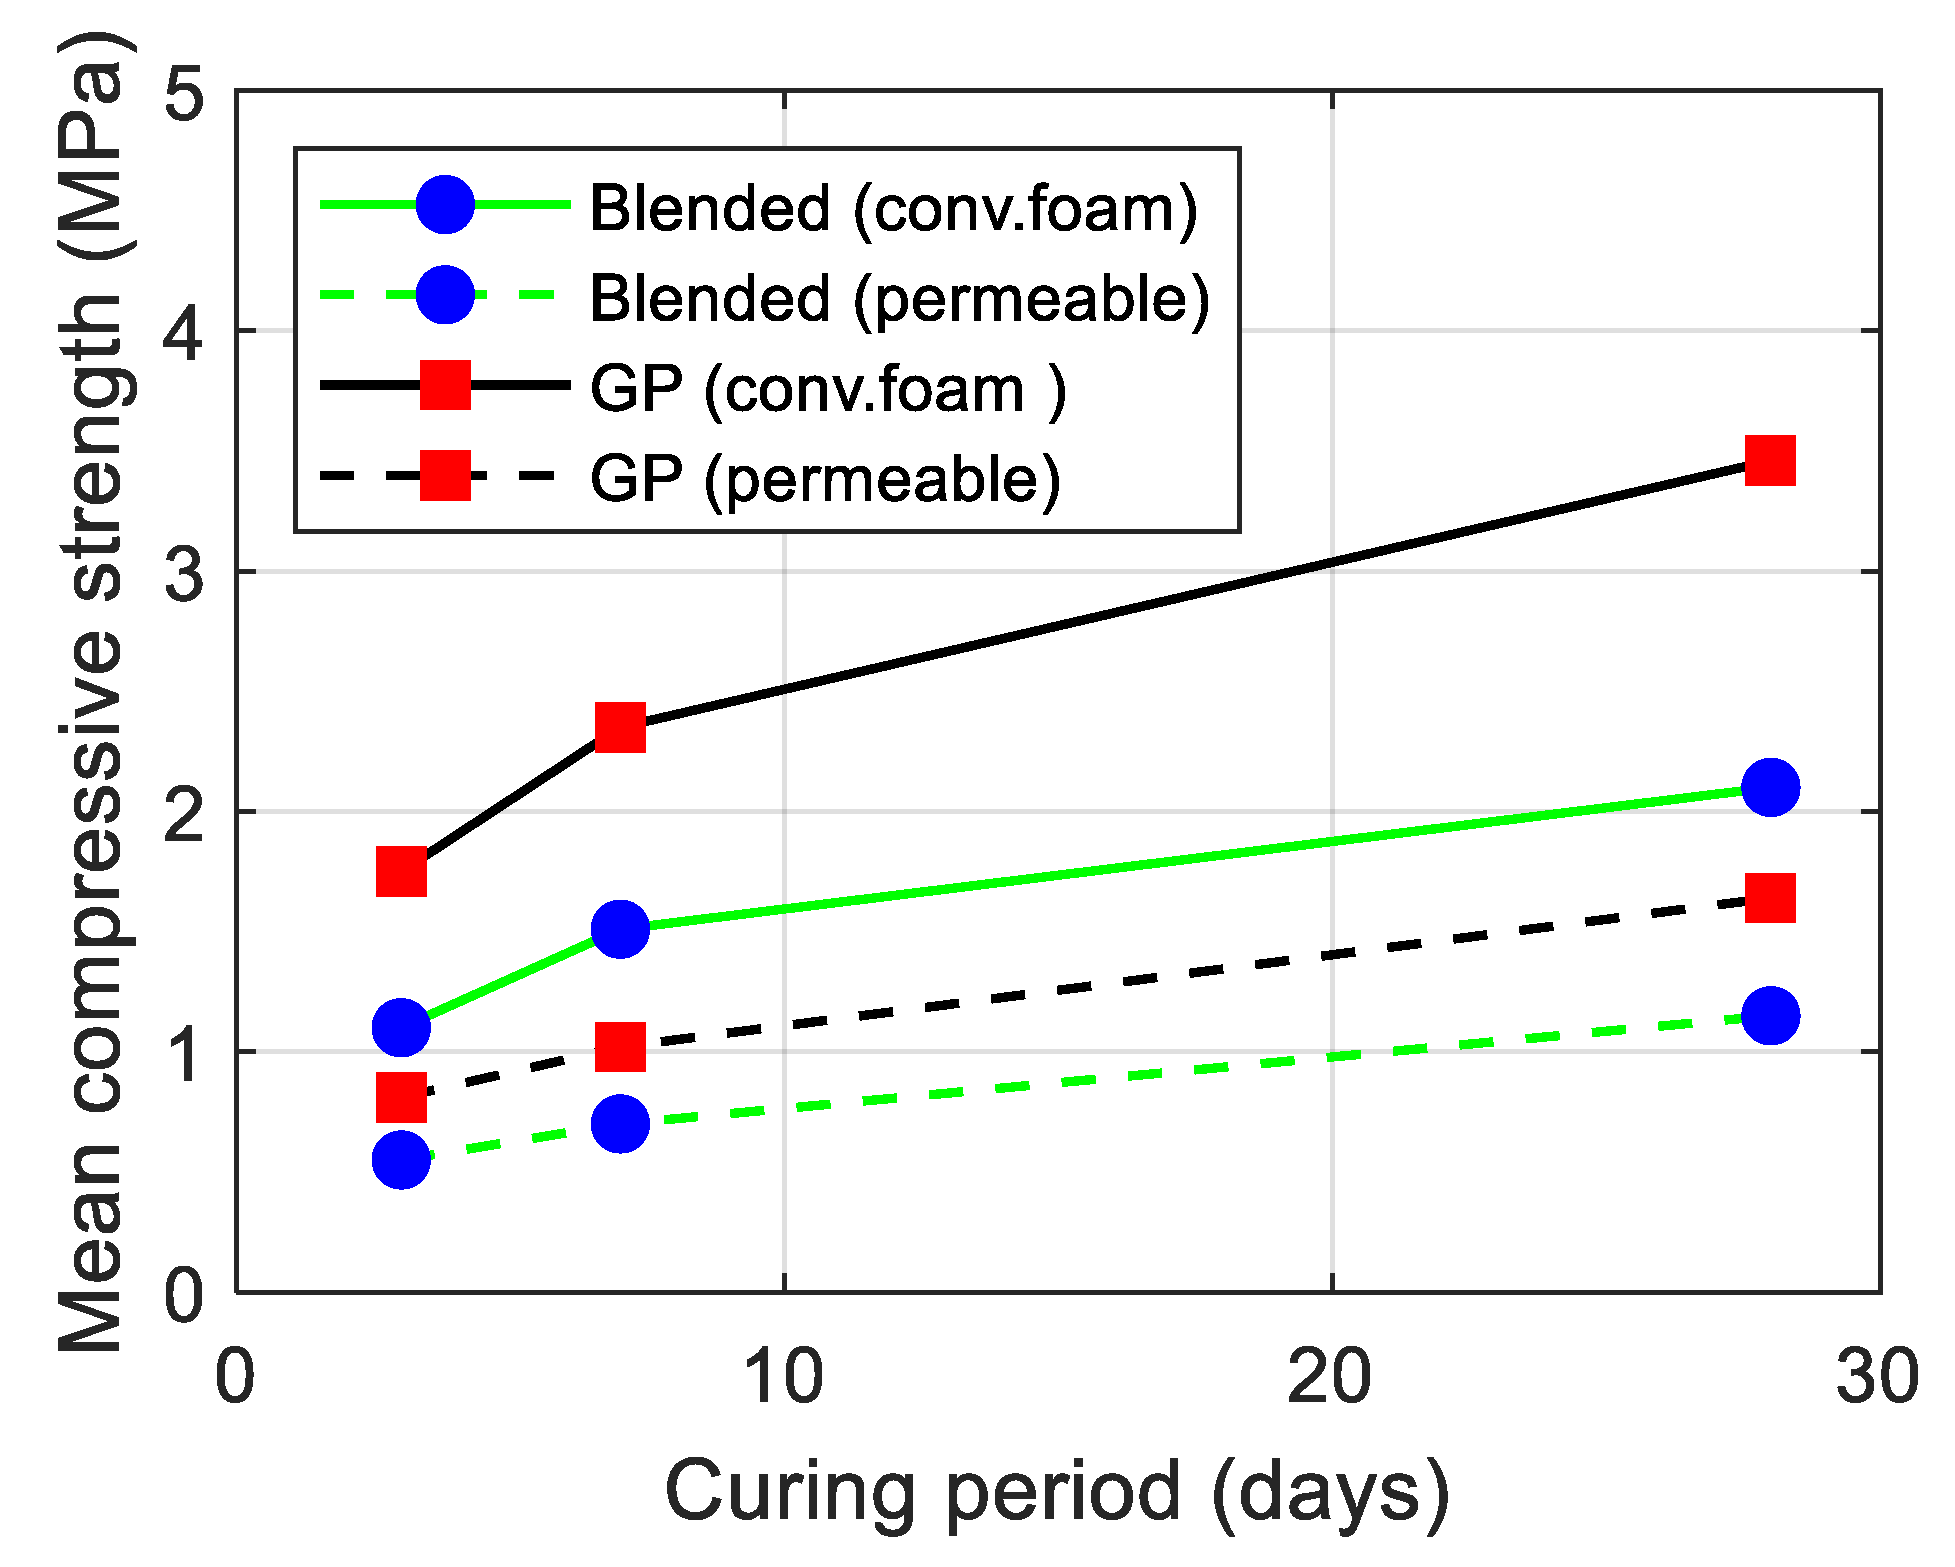
Figure 6 compares the compressive strength of the blended and GP cement cube samples prepared with conventional foaming liquid and permeable foaming concentrate. As shown in this figure, irrespective of age and foam concrete mix type, samples prepared with conventional foaming liquid have significantly higher compressive strength than those made of permeable foaming concentrate as a foam concentrate. With the 3-, 7- and 28-day compressive strength, the blended mixes prepared with permeable foaming concentrate were found to be 50, 54 and 45% lower compared to the same mixes manufactured using conventional foaming agents, respectively. Similarly, the 3-, 7- and 28-day compressive strength of the GP cement mixes prepared with permeable foaming concentrate are found to be 54, 56 and 53% lower compared to the same mixes manufactured using conventional foaming agents, respectively.
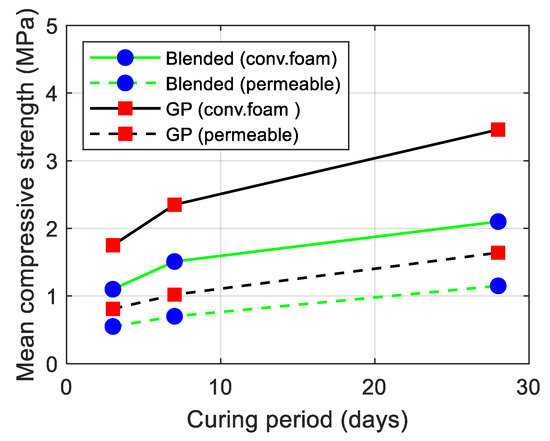
Figure 6.
Comparing compressive strength between two foaming agents.
Thus, compared to the ultimate strength of a foam concrete mix prepared with a conventional foaming agent, the strength of the same mix can be compromised by more than 50% when it is produced with permeable foaming concentrate. However, both the foaming agents attained the minimum strength requirement for infill (0.5–2 MPa, as per Vic Roads Australia) application, and the use of permeable foaming concentrate can be beneficial where drainage through the foam concrete is preferred.
Unlike ordinary concrete, the initial setting time of a foam concrete mix may vary from 6 to 7 h and the final setting time may vary between 11 and 22 h. Therefore, the setting time of the mixes was examined in this study. Both foam concrete specimens were prepared using 70% foam content to record the setting time. The 70% foam concrete was selected since it is the most common foam content utilised by the industry partner. Hence, the conventional foaming liquid concentrate was diluted with water at a ratio of 1:40 and the permeable foaming concentrate was diluted with water at 1:50 to obtain the required foam content.
The setting time of the blended and GP cement mixes was assessed using a Vicat apparatus and listed in Table 5. The foam concrete mix prepared with the conventional foaming liquid concentrate was observed to set faster than the same mix prepared with permeable foaming concentrate.
Table 5.
Setting time of the mixes prepared with conventional foaming liquid and permeable foaming concentrate.
3.4. Optical Microscopic Analysis of Hardened Foam Concrete
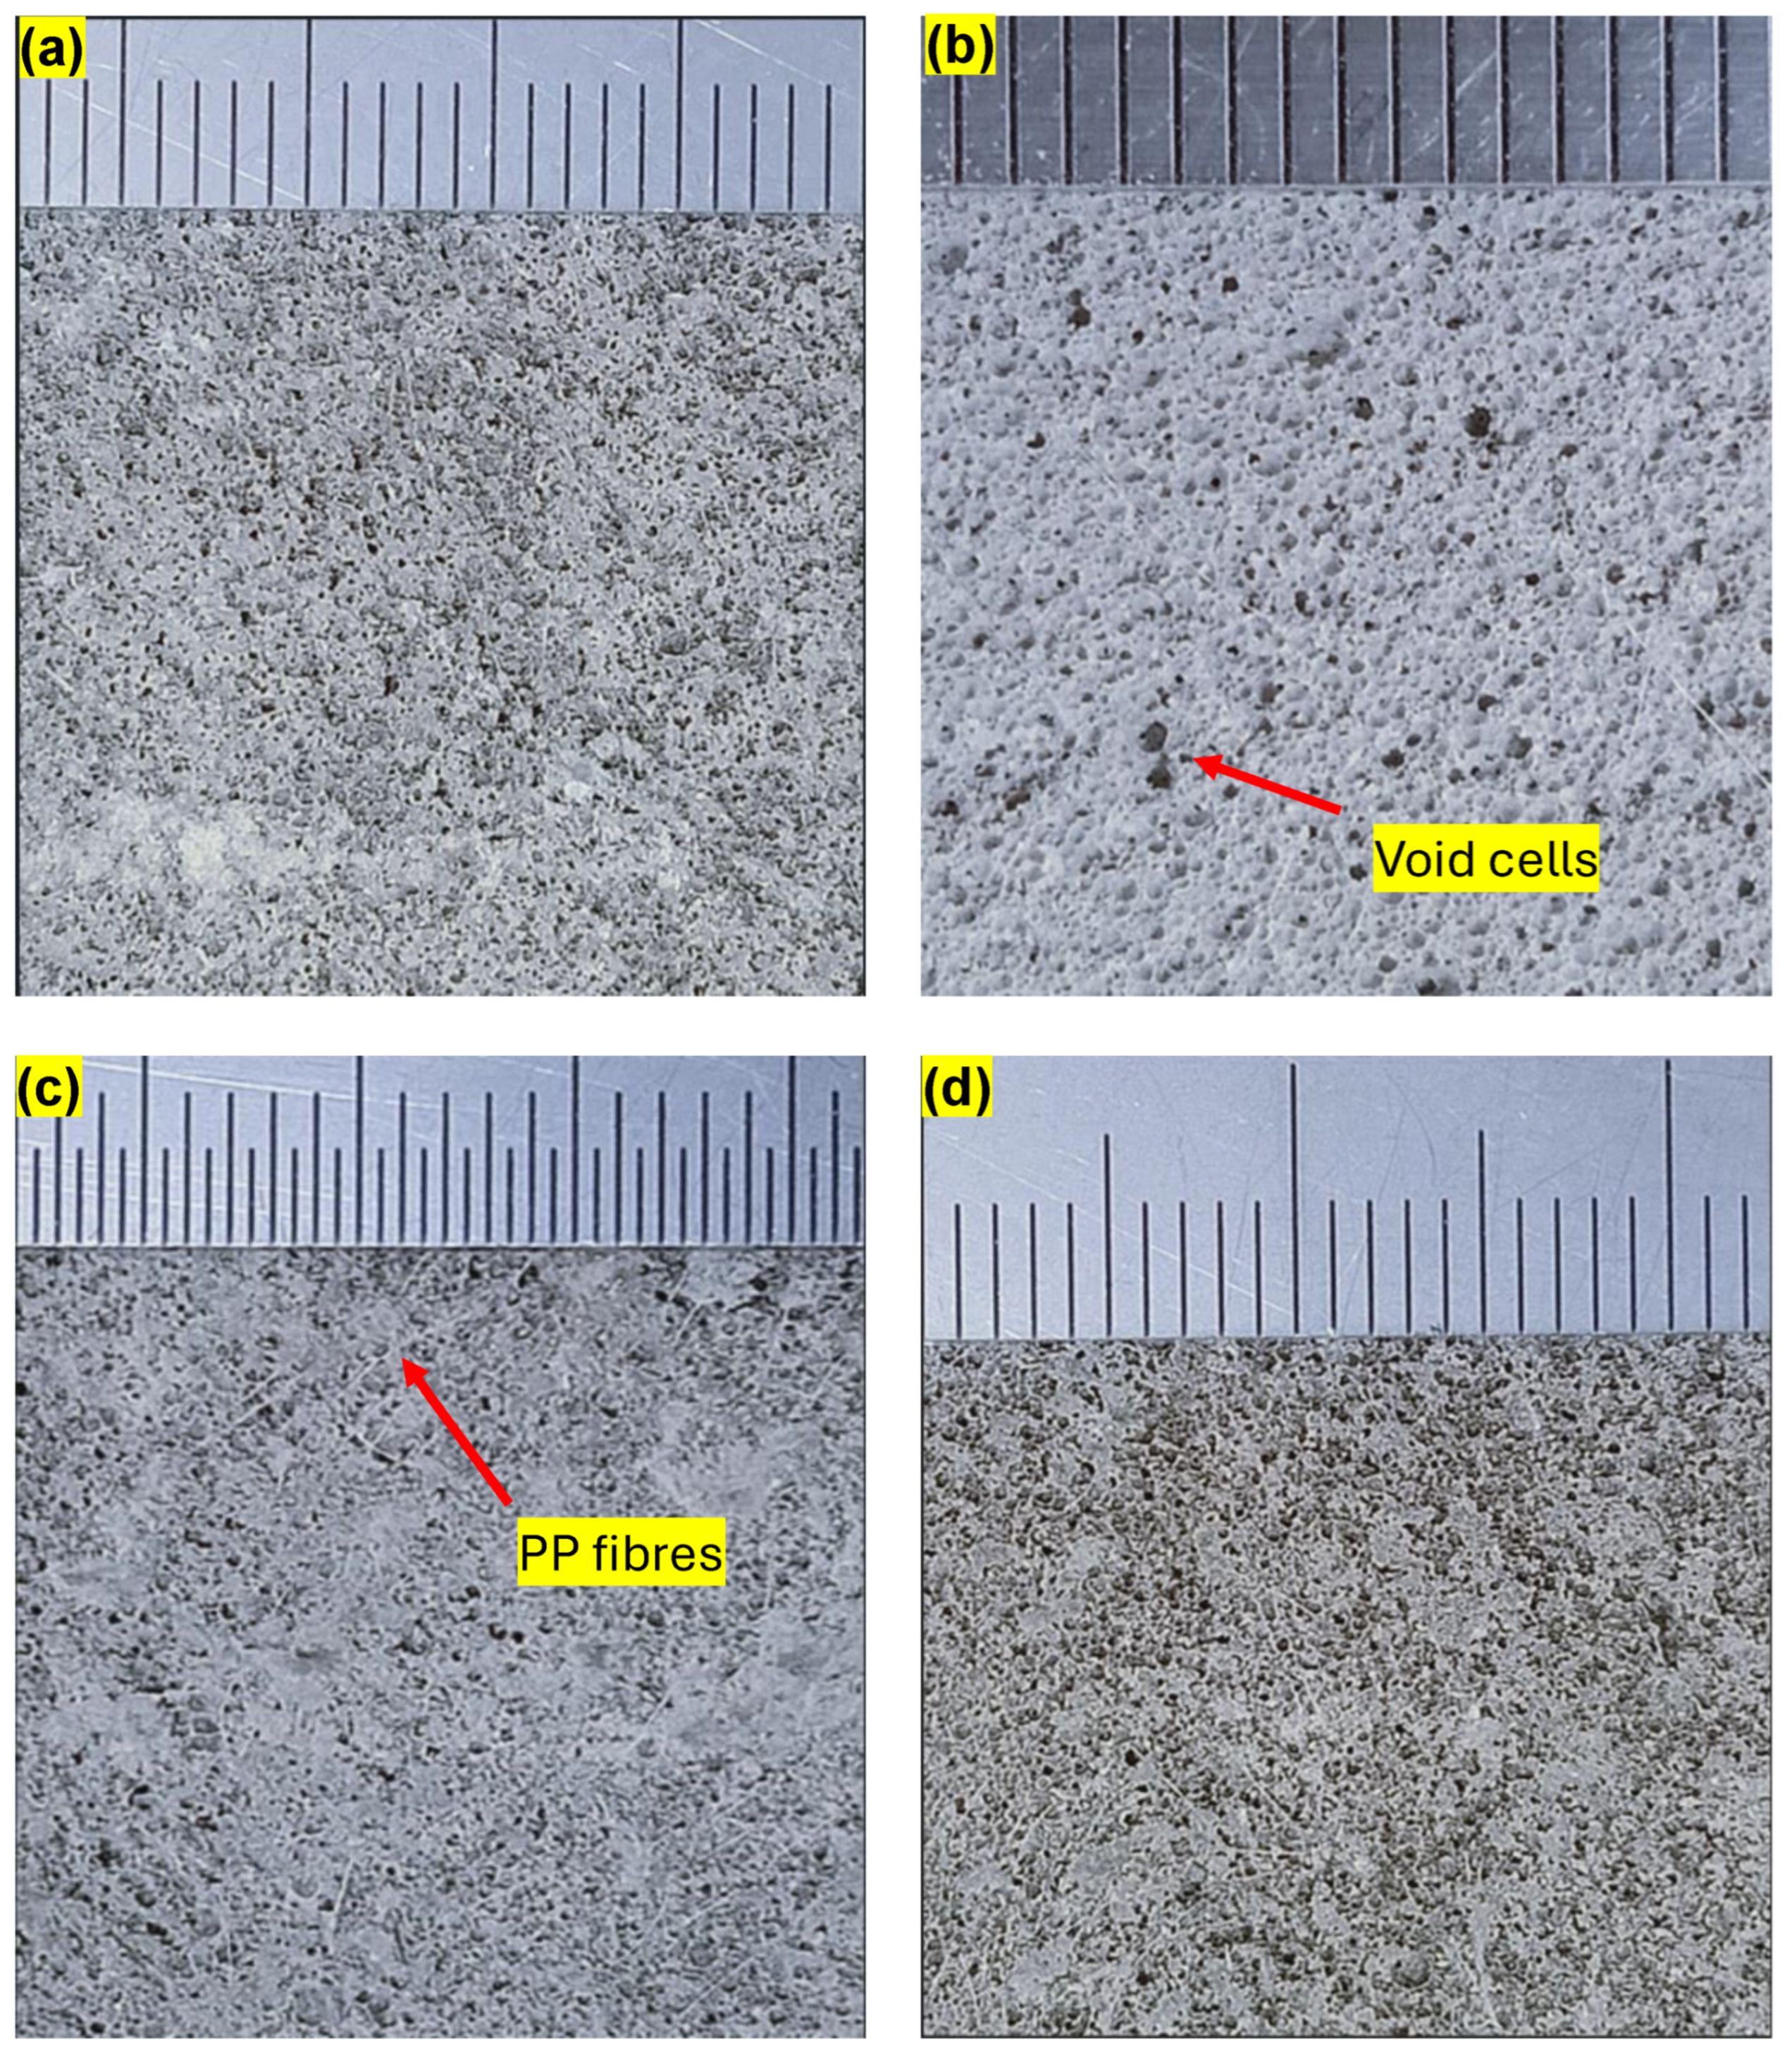
Figure 7a–d shows photographs of pore structures of hardened foam concrete specimens with a density of approximately 550 to 800 kg/m3. Numerous well-distributed air pockets/voids are observed in the foam concrete samples. Void sizes are found to be highly dependent on the percentage of foam content used. When the percentage of foam content is high, and the cement paste volume is kept low, easily moveable air bubbles tend to be close to each other during the mixing and before setting. As a result, bigger-sized air pockets are formed in the foam concrete with a high percentage of foam content, as shown in Figure 7b. Also, the water-to-cement and water-to-binder ratios can play an important role in forming air voids. If a higher percentage of water content is used in a mix, it reduces the viscosity of the cement paste. Consequently, bubbles in the fresh foam concrete mix coalesce easily and form larger-sized air pockets [41].
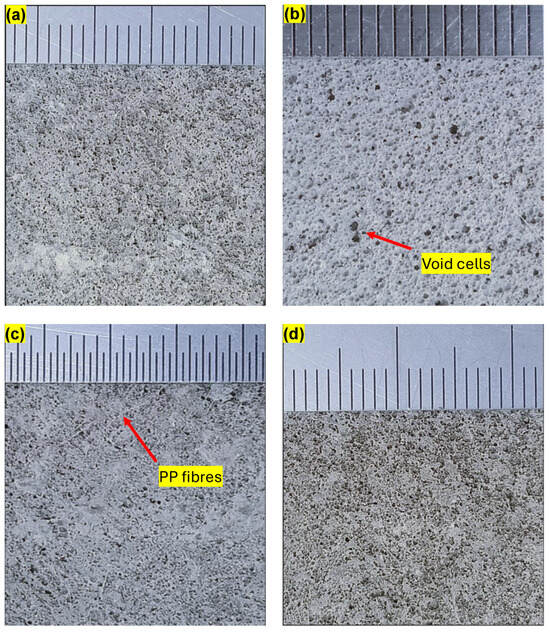
Figure 7.
Pore structures of hardened foam concrete: (a) GP cement mix with a foam content of 50%, (b) blended mix with a foam content of 70%, (c) GP cement mix with a foam content of 55% and (d) blended mix with a foam content of 50%.
Larger air pockets improve thermal insulation, which is beneficial if the product is intended to be used for building materials. However, larger air pockets decrease the strength of the material significantly. In contrast, bigger air pockets increase the permeability of foam concrete, which can be useful if foam concrete is intended to be used for soil replacement.
PP fibres are expected to restrict the movement of air bubbles. As a result, the formation of larger air pockets in fresh foam concrete were prevented. Foam concrete with smaller-sized air pockets contributes to achieving higher compressive strength. Also, PP fibres improve the tensile strength and ductility of the foam concrete by creating bridges between pores.
Fly ash (FA) and silica fume (SF) affect the formation of pore structures in foam concrete. Replacing Portland cement with FA decreases the apparent viscosity of the fresh cement paste [42]. Consequently, larger-sized air voids could be formed in the foam concrete with a compromise in compressive strength. In contrast, replacing Portland cement with SF enhances the plastic viscosity of the paste substantially because the specific surface areas of SF particles are approximately 50 times larger than that of cement particles [43]. Therefore, SF could contribute to preventing the free movement of air bubbles in the fresh cement paste, resulting in a more stable void network, as described in Section 3.1 and Section 3.2.
4. Material Behaviour of Foam Concrete
4.1. Stress–Deformation Behaviour of Foam Concrete
Constitutive law of concrete is often required for numerical simulation or prediction of strength. This section discusses the compressive stress vs. deformation behaviour of fibre-reinforced foam concrete under compression. The compressive strain was determined as the ratio of the machine head displacement to the original height (100 mm) of the prisms.
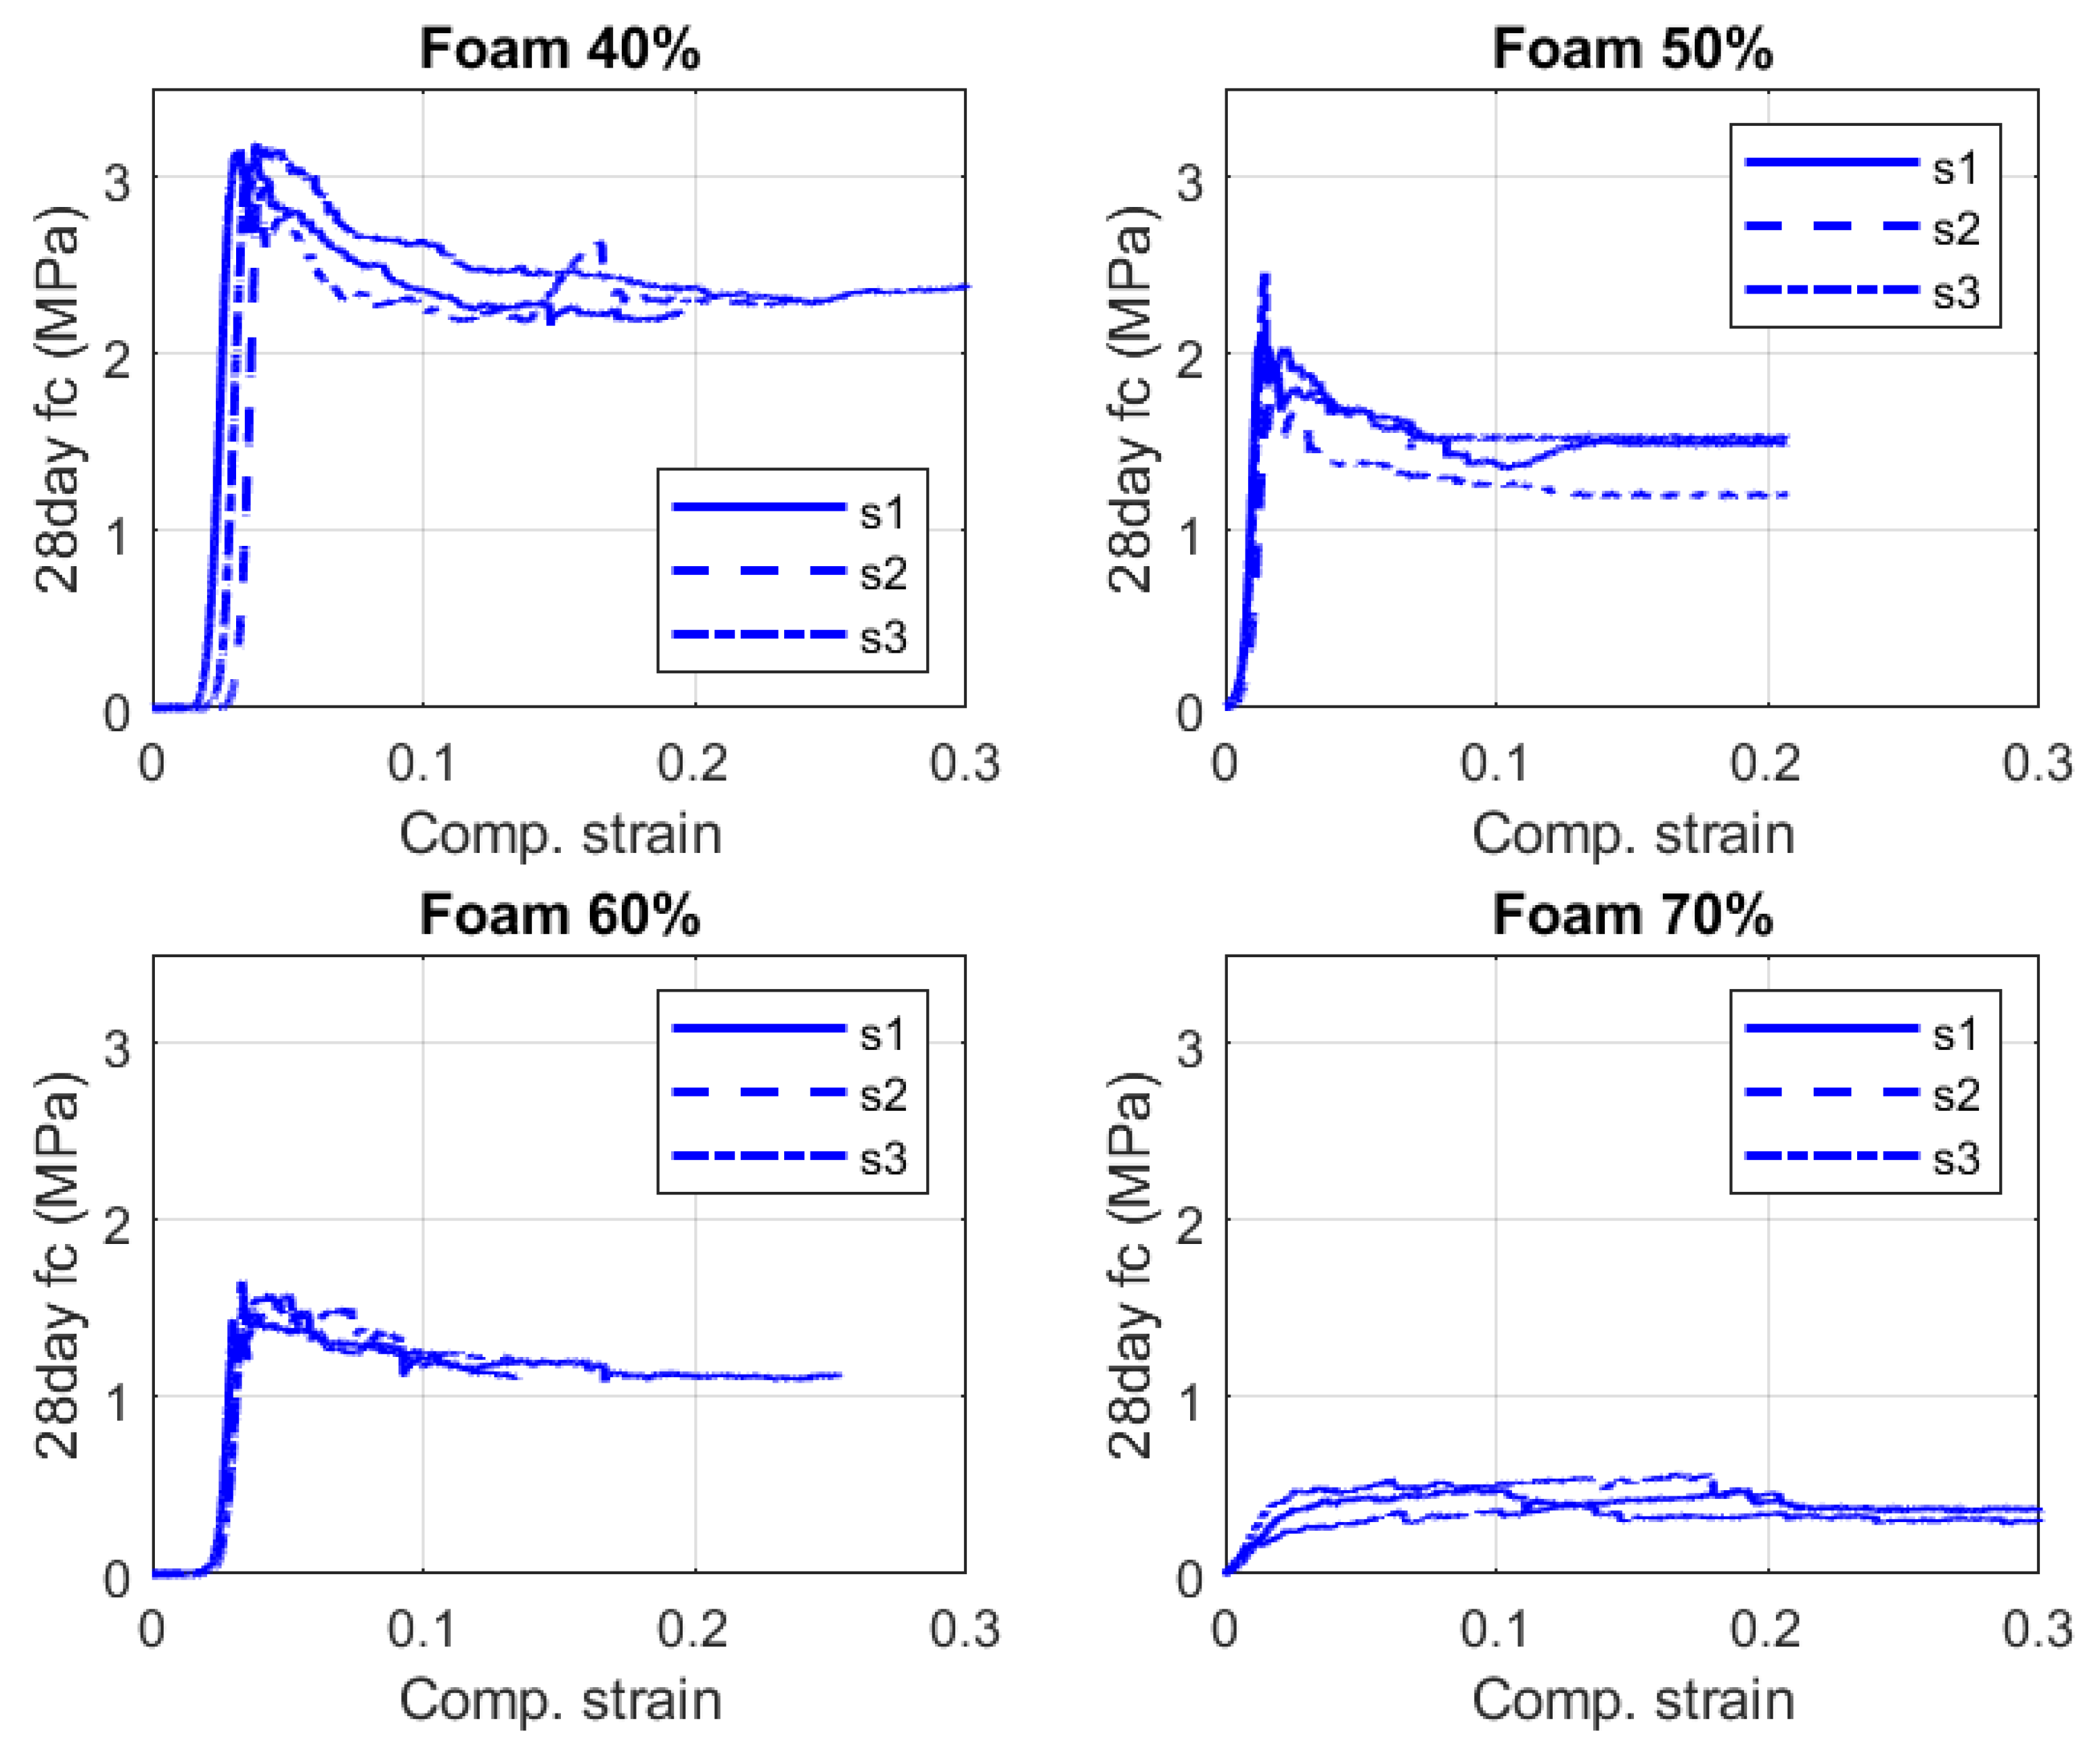
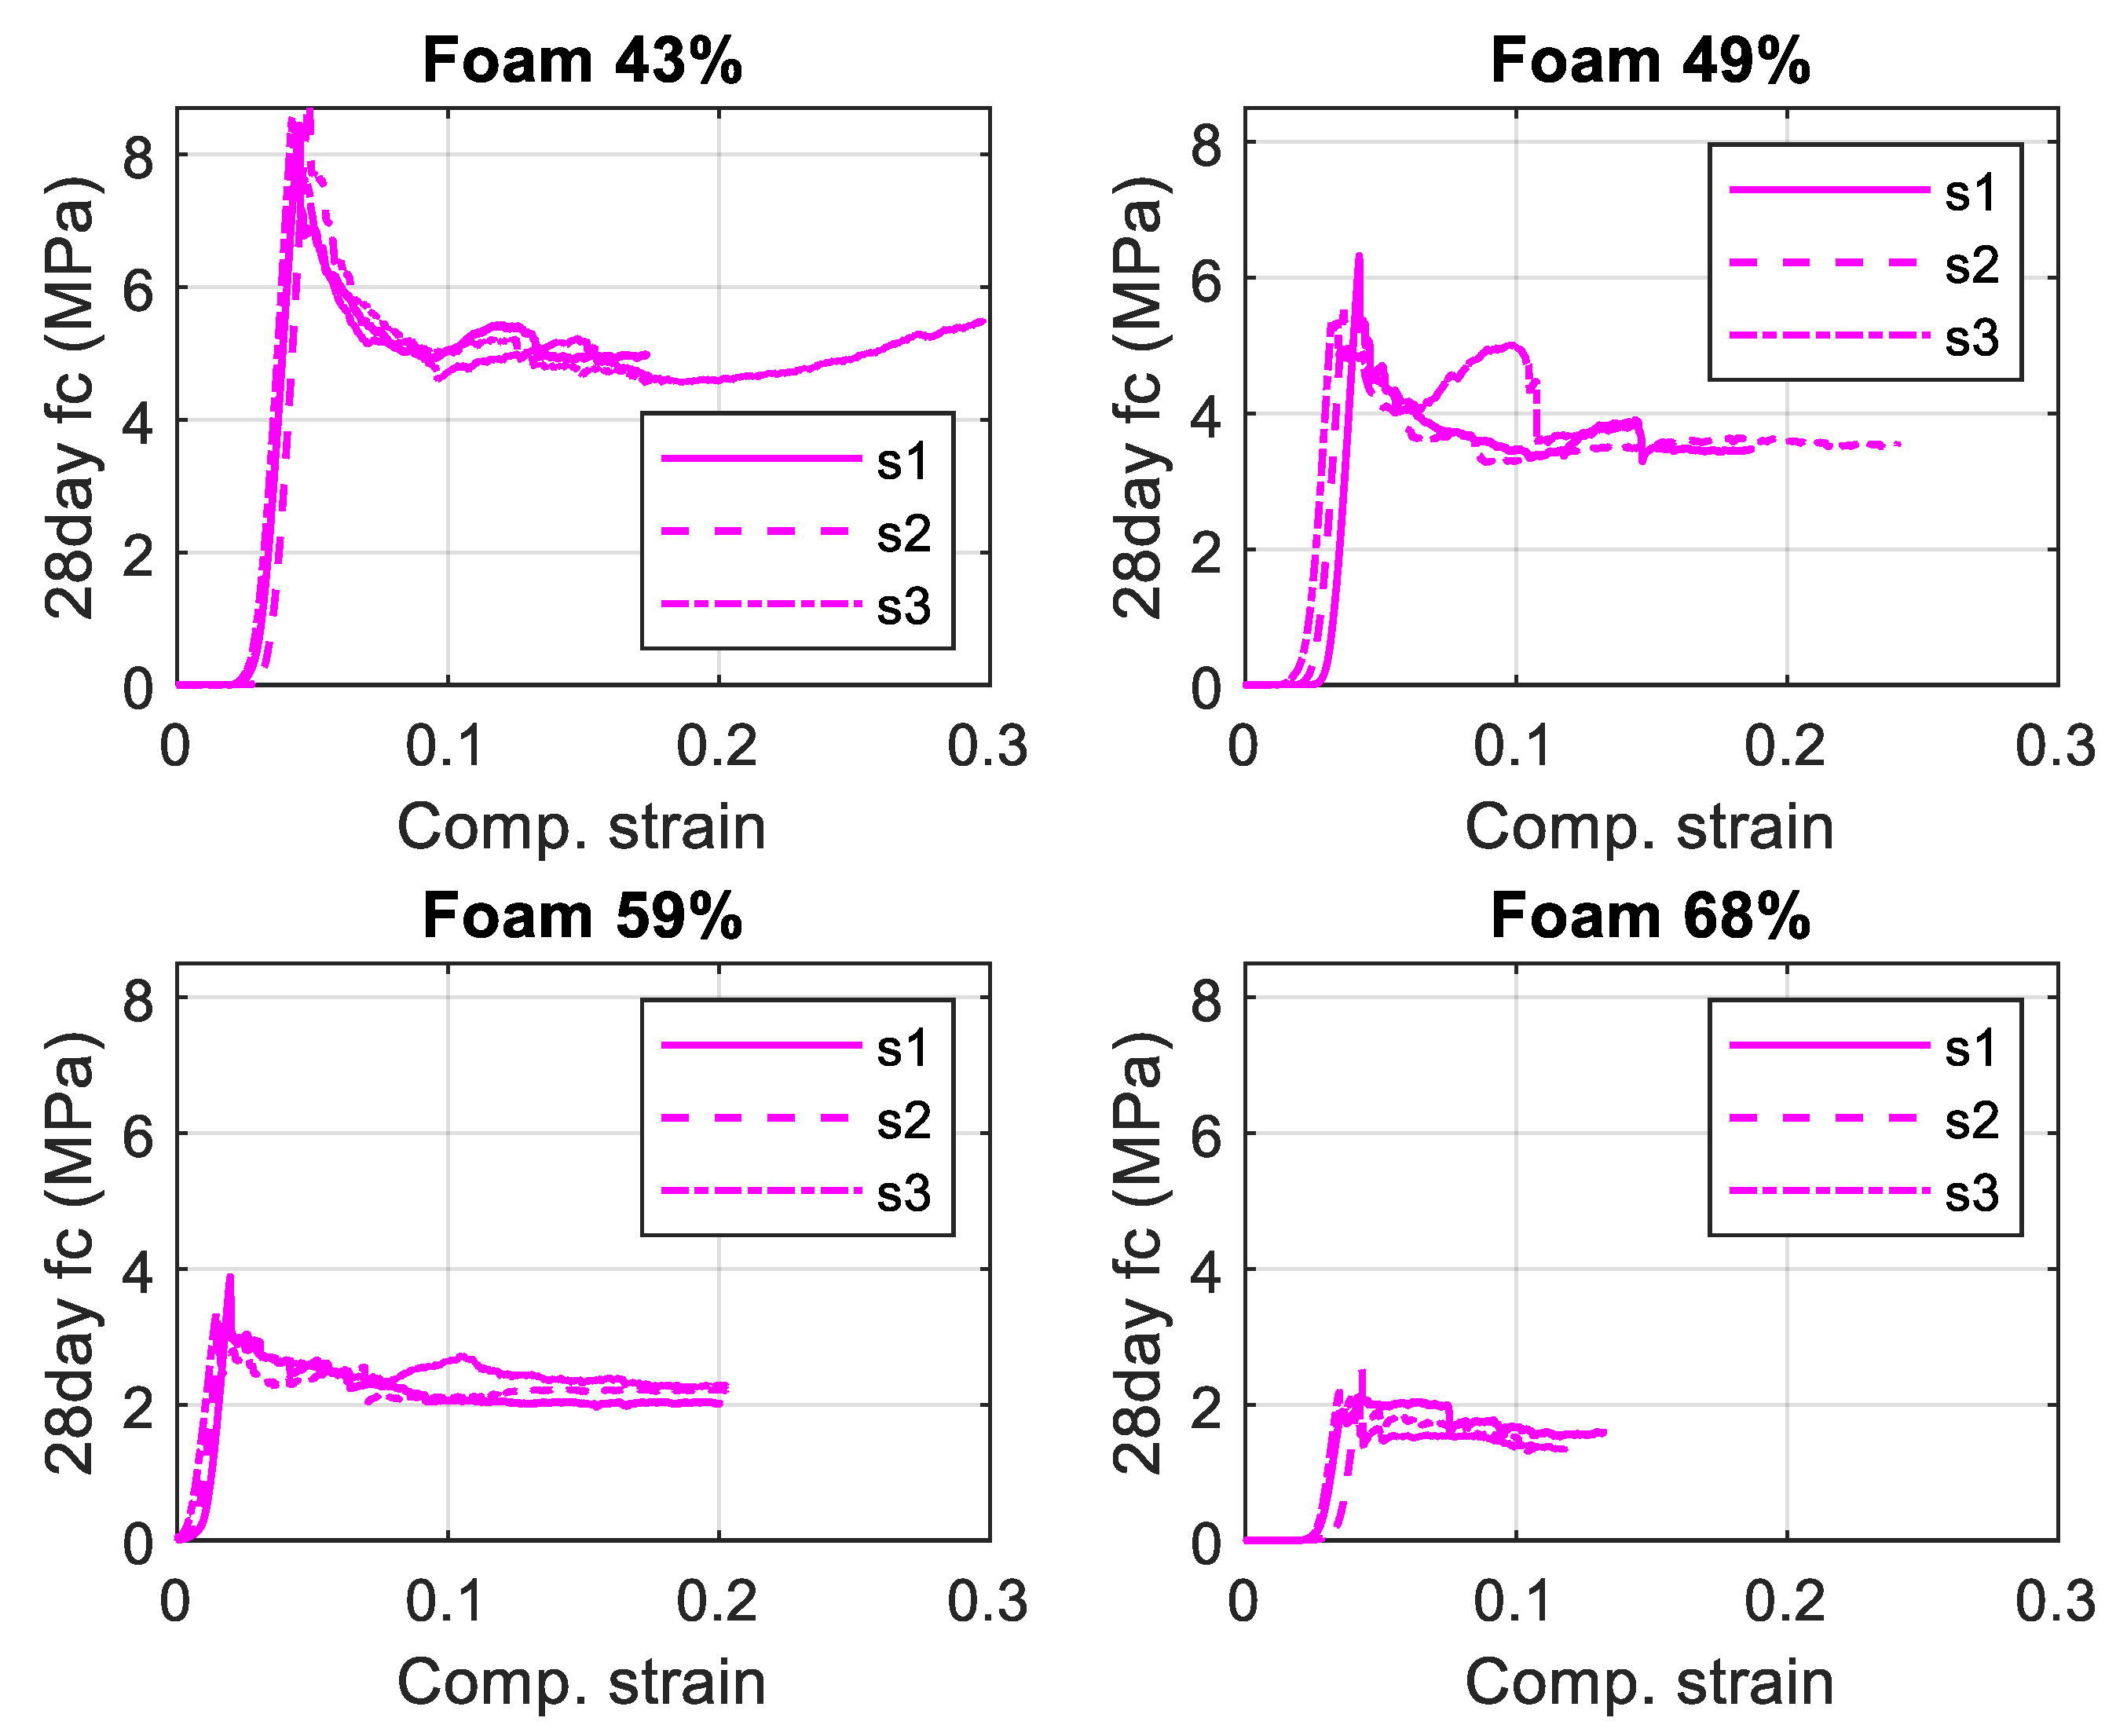
Figure 8 and Figure 9 depict the compressive stress vs. strain behaviour of blended and GP mixes, respectively, with increasing foam content. In general, both the mixes exhibited long plateau following the peak strength. This is due to the contribution of the fibre. However, there is a drop in peak stress in GP mixes with lower foam content (foam 43 and 49%) before reaching the plateau, whereas this drop is less in the blended mixes. The plateau is almost at the same level as the peak stress for higher foam content (59–70%). This happens due to the densification of the samples in the case of foam concrete due to its lower density, and, indeed, densification is higher for increased foam content due to its lower density.
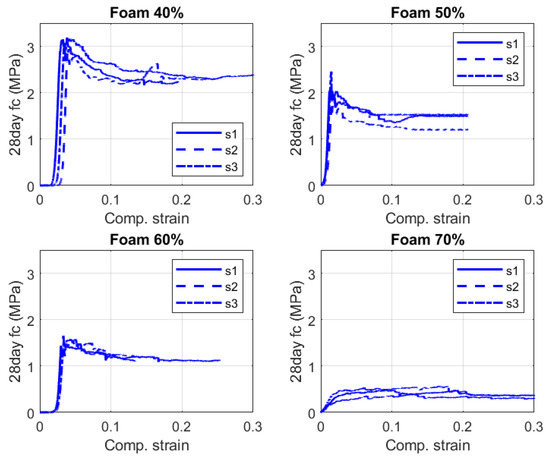
Figure 8.
Compressive stress vs. strain plot of blended mix (fc = compressive stress).
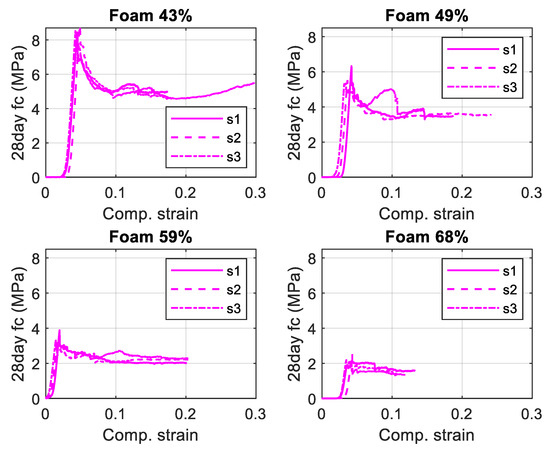
Figure 9.
Compressive stress vs. strain plot of GP mix (fc = compressive stress).
The effect of fibres on the compressive behaviour of normal concrete is mostly limited to the fracture energy. The improvement in load-carrying capacity is minimal for fibre-reinforced concrete. The compressive stress–strain behaviour remains very similar between plain concrete and fibre-reinforced concrete [42], albeit with slightly higher strength and toughness (area under the stress–strain curve). The increase in fracture energy/toughness is due to the effect of crack bridging (i.e., delayed crack opening), provided by the fibre. However, the behaviour of the foam concrete is found to be considerably different from plain or fibre-reinforced concrete.
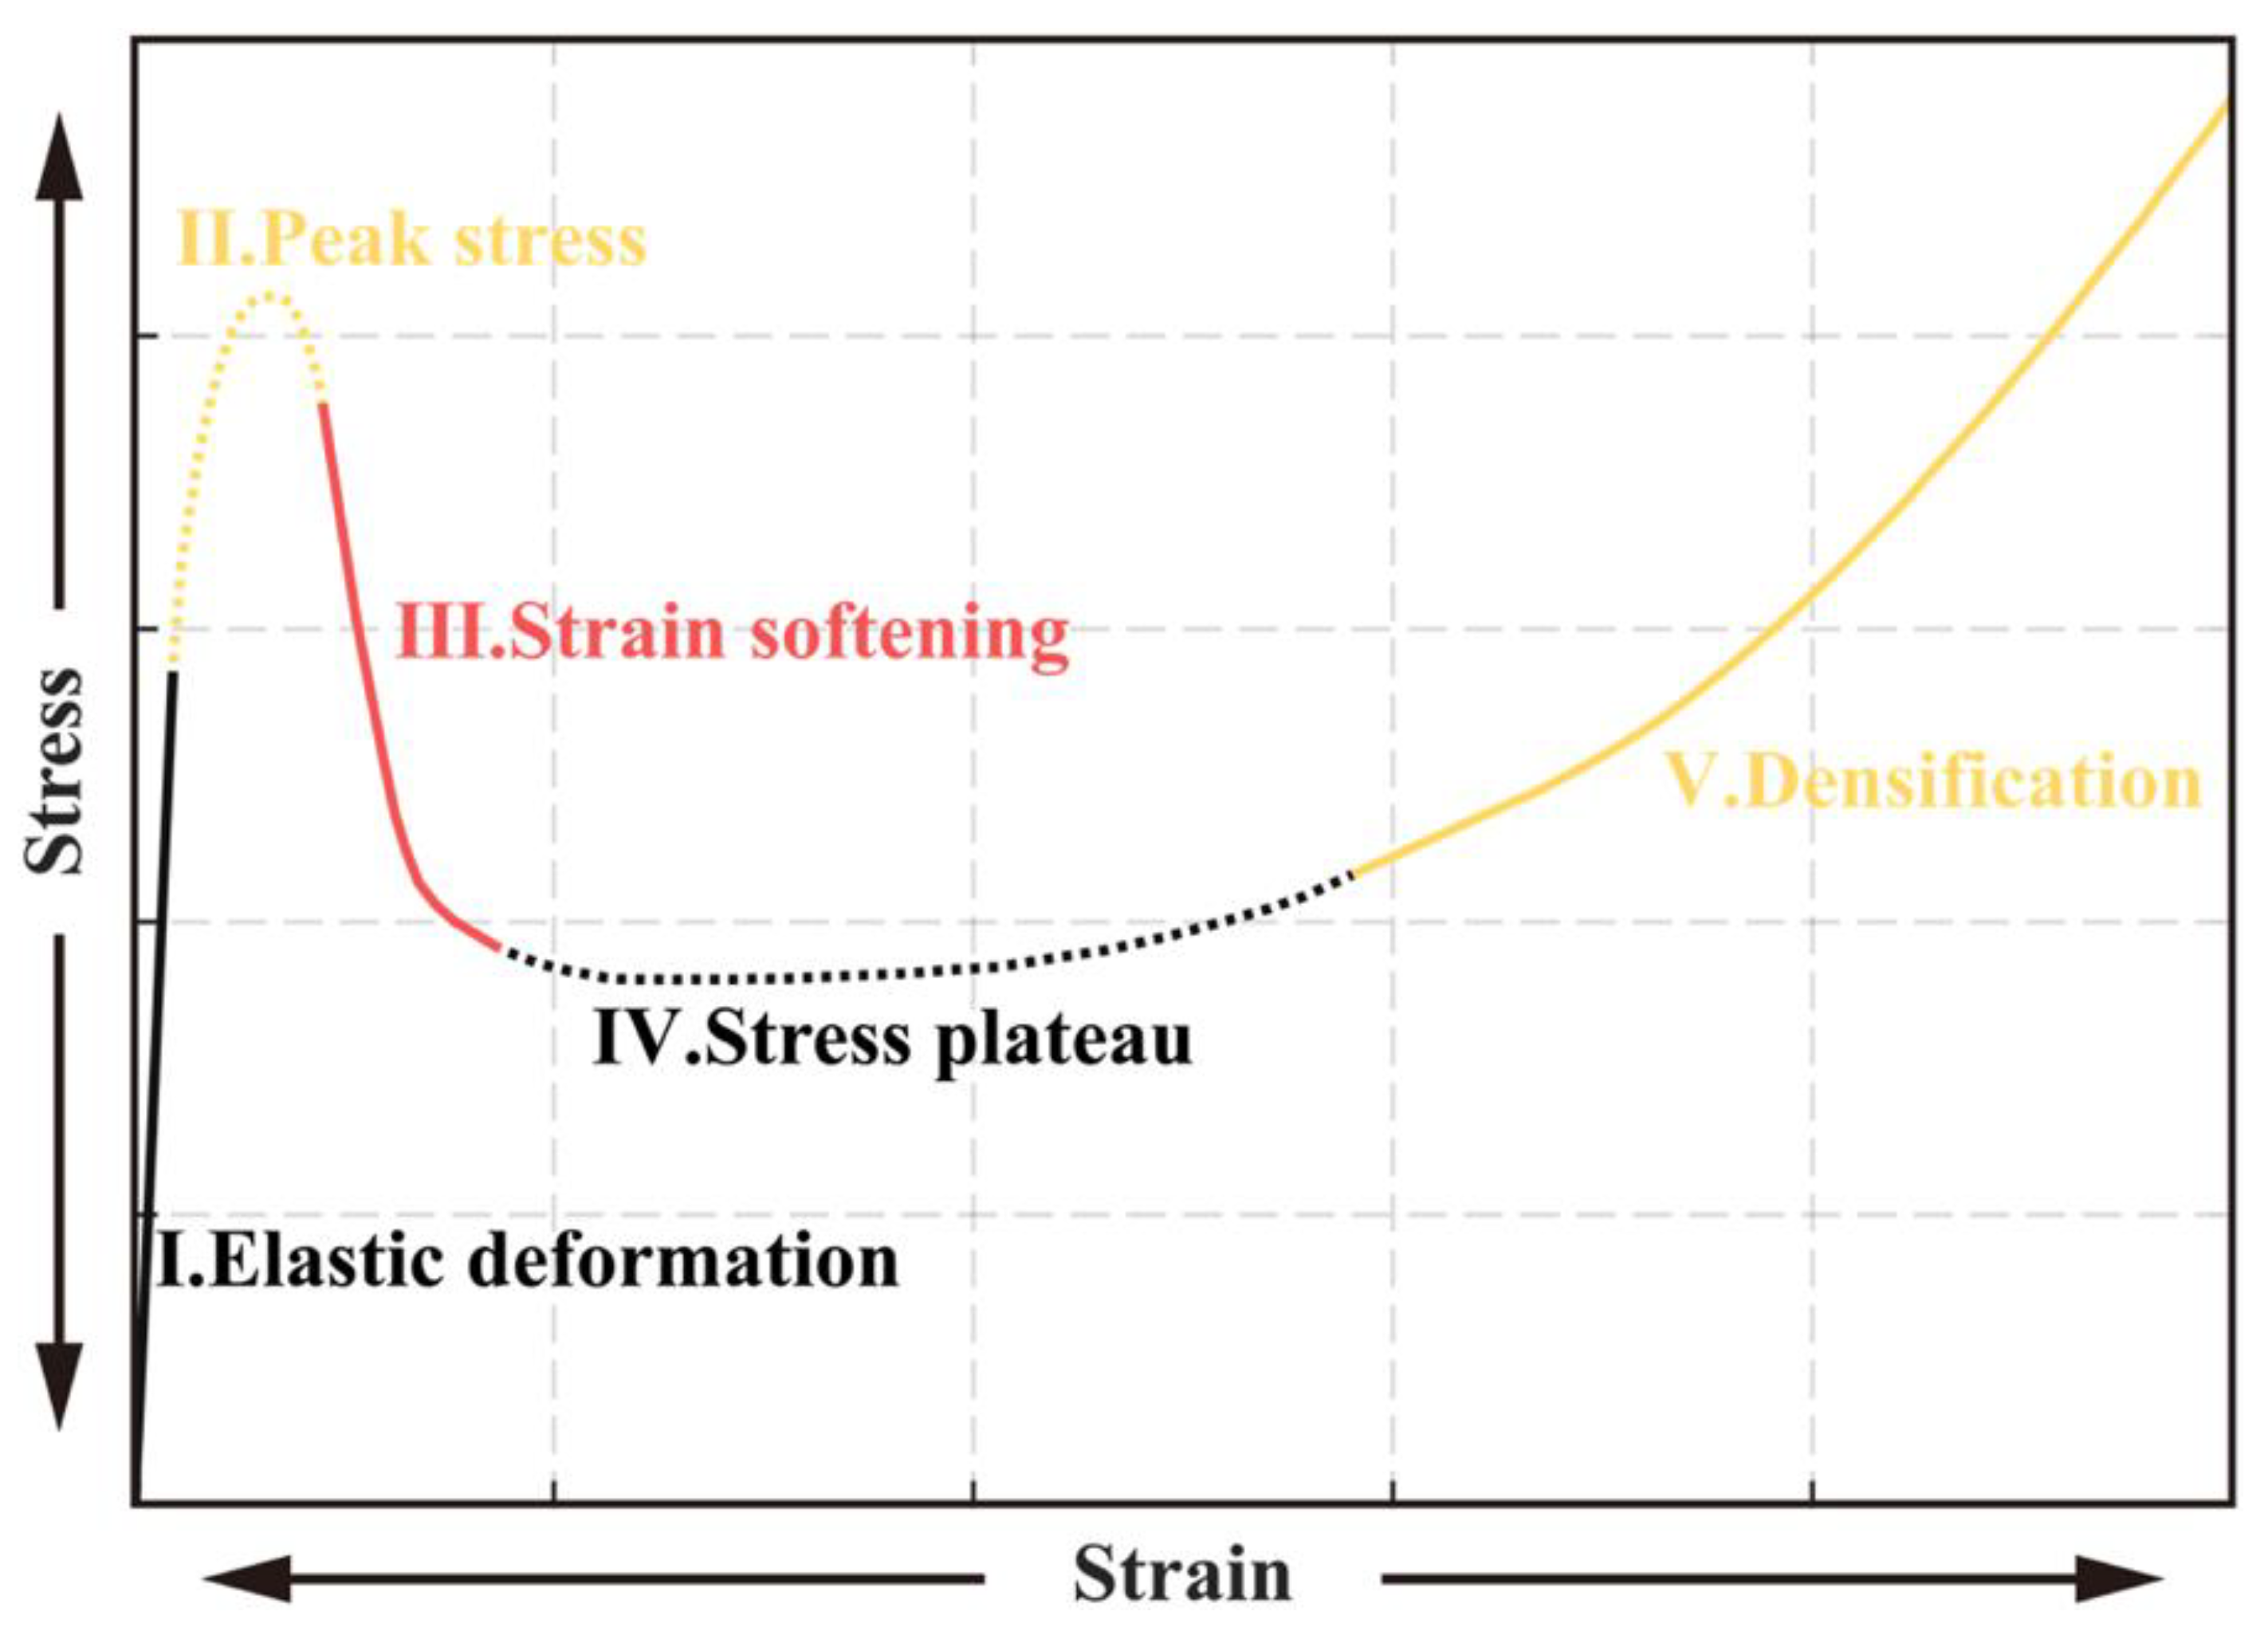
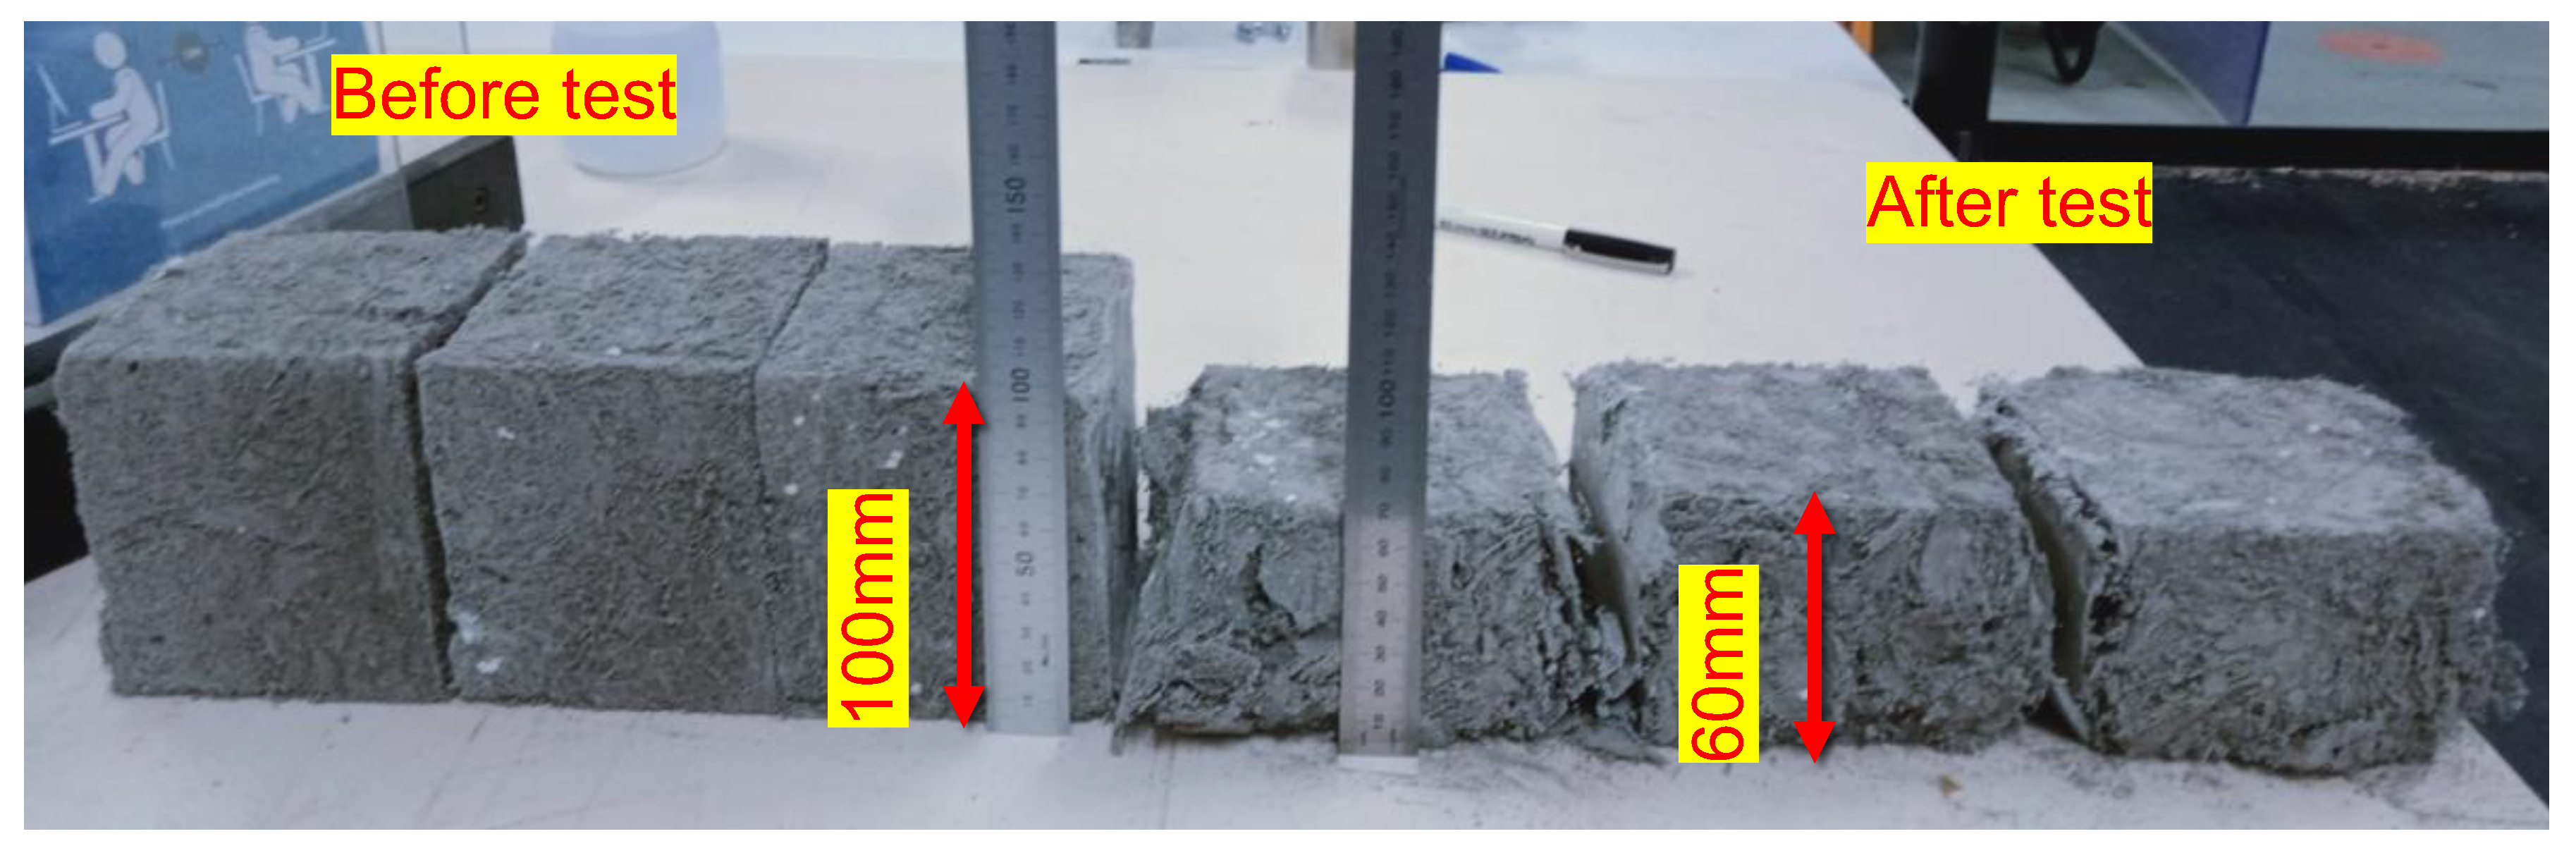
Figure 10 depicts the typical behaviour of foam concrete that also shows the densification effect, as mentioned before. The GP mix with 43% foam content behaves similarly to Figure 10 where a clear densification stage is obvious. However, the formation of multiple cracks and densification occurs concurrently in other situations, leading to a long stress plateau. The densification of samples is illustrated in Figure 11 and Figure 12 for blended and GP mixes, respectively. Densification is a common mechanism in porous materials with low hardness, e.g., densification in timber is common.

Figure 10.
Typical compressive stress vs. strain plot of foam concrete, reproduced with permission from [44].

Figure 11.
Failure modes after compression test (blended mix foam content 60%).
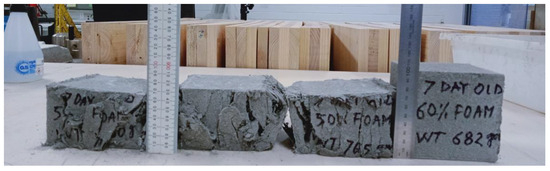
Figure 12.
Failure modes after compression test (GP mix foam content 59%).
4.2. Prediction of Compressive Strength
Based on the compressive strength test results, the 7-day and 28-day strength prediction formulas are established relating to the 3-day strength of the mix. Irrespective of the foam content, Equations (1) and (2) estimate the 7- and 28-day strength of the blended mix, respectively. Moreover, Equations (3) and (4) predict the 7- and 28-day strengths of the GP cement mix depending on the 3-day strength, respectively.
The 7- and 28-day strengths of the blended mix are 1.37 and 2.06 times the 3-day strengths, respectively. GP cement mix also presents almost the same coefficients, as shown in Equations (1)–(3).
where , , = 3-, 7- and 28-day compressive strengths of the blended mix, respectively, and , , = 3-, 7- and 28-day compressive strengths of GP mix, respectively.
5. Conclusions
This experimental study investigates the properties of two foam concrete mixes—blended and general purpose (GP) cement. The blended mix consisted of Portland cement and supplementary cementitious materials, such as fly ash and silica fume, as binders. In contrast, GP cement contained Portland cement only as a binder. PP fibres are used in both mixes. Also, the influence of foaming agent types on the properties of the foam concrete mixes was investigated. This study describes the effect of foaming agent types, foam content and supplementary cementitious materials on the density, setting time and compressive strength of the mixes.
The key conclusions of this study are as follows:
- The duration of the mixing of the constituents highly influences the strength and density of the foam concrete. Improper mixing does not yield homogeneous cell structures. Over-mixing destroys some percentage of air bubbles, leading to an increase in the density and a reduction in the volume of the product.
- The use of supplementary cementitious materials is becoming increasingly common to meet the sustainability goals of various projects. However, early strength gain was found to be lower for the blended mix. Therefore, if early strength gain is desirable/needed, admixture in the blended mix or GP mix can be used.
- Unlike ordinary concrete, the initial setting time of a foam concrete mix may vary from 6 to 7 h and the final setting time may vary between 11 and 22 h. The foam concrete mix prepared with the conventional foaming liquid concentrate was observed to set faster than the same mix prepared with permeable foaming concentrate (used for making permeable foam concrete). This should be noted when foam concrete is selected for a particular application.
- Foaming agent types substantially affect the strength and density of foam concrete mix. Irrespective of age and foam concrete mix type, samples prepared with conventional foaming liquid showed significantly higher strength (at least two times) and density than those made of permeable foaming concentrate as a foam concentrate.
- A higher percentage of foam content in a foam concrete mix results in the formation of larger-sized air pockets that enhance the thermal insulation and permeability of the product. However, larger air pockets decrease the strength of the product significantly.
- PP fibres help slow down the formation of bigger air pockets and contribute to achieving higher strength and ductility of the foam concrete by creating bridges between pores.
- The constitutive behaviour of the blended and GP mixes under compression was discussed. While both behave similarly, it is apparent that fibre-reinforced foam concrete behaves differently from fibre-reinforced plain concrete. A long post-peak plateau is observed in fibre-reinforced foam concrete, which is due to the combined effect of multiple crack formation and densification.
This study recommends investigating the effects of regional climate conditions on foam concrete mixes and the flexural and shrinkage behaviour of the mixes in a future study.
Author Contributions
Conceptualisation, M.S., S.K.S. and E.O.G.; Methodology, S.K.S.; Software, S.K.S. and M.S.; Validation, S.K.S. and M.S.; Formal Analysis, S.K.S. and M.S.; Investigation, M.S., S.K.S. and E.O.G.; Resources, M.S. and S.A.-D.; Data Curation, S.K.S.; Writing—Original Draft Preparation, M.S. and S.K.S.; Writing—Review and Editing, S.A.-D.; Visualisation, M.S. and S.K.S.; Supervision, M.S., E.O.G. and S.A.-D.; Project Administration, S.K.S.; Funding Acquisition, M.S. and E.O.G. All authors have read and agreed to the published version of the manuscript.
Funding
The authors would like to thank the Australian Federal Government’s Innovation Connection Scheme (Grant ID ICG001419) and Eifers Civil Pty Ltd. for providing funding for this project.
Institutional Review Board Statement
Not applicable.
Informed Consent Statement
Not applicable.
Data Availability Statement
Data can be made available upon request.
Conflicts of Interest
The authors declare that they have no known competing financial interests or personal relationships that could have appeared to influence the work reported in this paper. Author Estela Oliari Garcez was employed by Deakin during this research work and currently working in the company Arup. The authors declare that this study received funding from Eifers Civil Pty Ltd. The funder was not involved in the study design, collection, analysis, interpretation of data, the writing of this article or the decision to submit it for publication. Eifers provided permission to publish the results.
Appendix A. Compressive Strength Data
Table A1.
Compressive strength of the blended mixes.
Table A1.
Compressive strength of the blended mixes.
| Blended Mixes | 3 Day Strength (MPa) | 7 Day Strength (MPa) | 28 Day Strength (MPa) | |||||||||
|---|---|---|---|---|---|---|---|---|---|---|---|---|
| S1 | S2 | S3 | M ± SD | S1 | S2 | S3 | M ± SD | S1 | S2 | S3 | M ± SD | |
| Blended-65 | 1.72 | 2.18 | 2.18 | 2.03 ± 0.26 | 3.42 | 2.99 | 2.59 | 2.99 ± 0.42 | 3.75 | 3.88 | 3.87 | 3.83 ± 0.08 |
| Blended-60 | 1.32 | 1.42 | 1.35 | 1.36 ± 0.05 | 1.91 | 2.01 | 2.05 | 1.99 ± 0.08 | 3.15 | 2.98 | 3.18 | 3.1 ± 0.11 |
| Blended-55 | 1.39 | 1.09 | 1.06 | 1.17 ± 0.18 | 1.71 | 1.61 | 1.63 | 1.65 ± 0.05 | 2.19 | 2.26 | 2.10 | 2.18 ± 0.08 |
| Blended-50 | 1.11 | 1.09 | 1.11 | 1.10 ± 0.01 | 1.55 | 1.51 | 1.48 | 1.51 ± 0.04 | 2.04 | 1.82 | 2.46 | 2.11 ± 0.32 |
| Blended-40 | 0.74 | 0.71 | 0.61 | 0.68 ± 0.07 | 0.93 | 0.88 | 0.85 | 0.88 ± 0.04 | 1.44 | 1.65 | 1.58 | 1.56 ± 0.11 |
| Blended-30 | 0.20 | 0.23 | 0.25 | 0.23 ± 0.03 | 0.30 | 0.26 | 0.28 | 0.28 ± 0.02 | 0.48 | 0.57 | 0.40 | 0.48 ± 0.09 |
M = mean, SD = standard deviation.
Table A2.
Compressive strength of the GP mixes.
Table A2.
Compressive strength of the GP mixes.
| Blended Mixes | 3 Day Strength (MPa) | 7 Day Strength (MPa) | 28 Day Strength (MPa) | |||||||||
|---|---|---|---|---|---|---|---|---|---|---|---|---|
| S1 | S2 | S3 | M ± SD | S1 | S2 | S3 | M ± SD | S1 | S2 | S3 | M ± SD | |
| GP cement-57 | 3.77 | 3.97 | 3.85 | 3.86 ± 0.11 | 5.28 | 5.21 | 5.45 | 5.31 ± 0.12 | 8.44 | 8.89 | 8.54 | 8.62 ± 0.23 |
| GP cement-51 | 2.80 | 2.71 | 2.84 | 2.78 ± 0.07 | 4.12 | 3.79 | 4.00 | 3.97 ± 0.17 | 6.32 | 5.51 | 5.36 | 5.73 ± 0.52 |
| GP cement-46 | 2.05 | 2.14 | 2.32 | 2.17 ± 0.14 | 3.15 | 3.18 | 3.30 | 3.21 ± 0.08 | 4.37 | 4.56 | 4.27 | 4.40 ± 0.15 |
| GP cement-41 | 1.77 | 1.78 | 1.71 | 1.75 ± 0.04 | 2.62 | 2.18 | 2.22 | 2.34 ± 0.24 | 3.89 | 3.19 | 3.33 | 3.47 ± 0.37 |
| GP cement-32 | 1.12 | 0.97 | 1.07 | 1.06 ± 0.08 | 1.36 | 1.30 | 1.42 | 1.36 ± 0.06 | 2.07 | 2.50 | 2.19 | 2.26 ± 0.22 |
| GP cement-23 | 0.25 | 0.22 | 0.22 | 0.23 ± 0.01 | 0.31 | 0.28 | 0.28 | 0.29 ± 0.02 | 0.52 | 0.51 | 0.55 | 0.53 ± 0.02 |
M = mean, SD = standard deviation.
References
- Amran, M.; Onaizi, A.M.; Fediuk, R.; Danish, A.; Vatin, N.I.; Murali, G.; Abdelgader, H.S.; Mosaberpanah, M.A.; Cecchin, D.; Azevedo, A. An ultra-lightweight cellular concrete for geotechnical applications—A review. Case Stud. Constr. Mater. 2022, 16, e01096. [Google Scholar] [CrossRef]
- Sutmoller, N. An introduction to low-density cellular concrete and advanced engineered foam technology. In Proceedings of the Geo-Congress 2020, Minneapolis, MN, USA, 25–28 February 2020; American Society of Civil Engineers: Reston, VA, USA, 2020. [Google Scholar]
- Ramamurthy, K.; Nambiar, E.K.; Ranjani, G.I.S. A classification of studies on properties of foam concrete. Cem. Concr. Compos. 2009, 31, 388–396. [Google Scholar] [CrossRef]
- Ghorbani, S.; Sharifi, S.; De Brito, J.; Ghorbani, S.; Jalayer, M.A.; Tavakkolizadeh, M. Using statistical analysis and laboratory testing to evaluate the effect of magnetized water on the stability of foaming agents and foam concrete. Constr. Build. Mater. 2019, 207, 28–40. [Google Scholar] [CrossRef]
- Chen, Y.-G.; Guan, L.-L.; Zhu, S.-Y.; Chen, W.-J. Foamed concrete containing fly ash: Properties and application to backfilling. Constr. Build. Mater. 2021, 273, 121685. [Google Scholar] [CrossRef]
- Rezaei, M.; Bindiganavile, V. Application of cement-based foams for narrow-trench backfilling. Road Mater. Pavement Des. 2021, 22, 1799–1823. [Google Scholar] [CrossRef]
- Ye, Y.-Q.; Han, J.; Parsons, R.L. Lightweight Cellular Concrete Properties and Geotechnical Applications. In Proceedings of the Geo-Congress 2022, Charlotte, NC, USA, 20–23 March 2022. [Google Scholar]
- Jose, S.K.; Soman, M.; Evangeline, Y.S. Influence of mixture composition on the properties of foamed concrete. Mater. Today Proc. 2021, 42, 399–404. [Google Scholar] [CrossRef]
- Shang, X.; Qu, N.; Li, J. Development and functional characteristics of novel foam concrete. Constr. Build. Mater. 2022, 324, 126666. [Google Scholar] [CrossRef]
- Yang, D.; Liu, M.; Ma, Z. Properties of the foam concrete containing waste brick powder derived from construction and demolition waste. J. Build. Eng. 2020, 32, 101509. [Google Scholar] [CrossRef]
- Allouzi, R.; Al Qatawna, A.; Al-Kasasbeh, T. Lightweight Foamed Concrete Mixture for Structural Use. ACI Mater. J. 2020, 117. [Google Scholar]
- Tarasov, A.; Kearsley, E.P.; Kolomatskiy, A.; Mostert, H. Heat evolution due to cement hydration in foamed concrete. Mag. Concr. Res. 2010, 62, 895–906. [Google Scholar] [CrossRef]
- Neville, A.M. Properties of Concrete; Longman: London, UK, 1995; Volume 4. [Google Scholar]
- Gilka-Bötzow, A. Stabilität von Ultraleichten Schaumbetonen; Springer: Berlin/Heidelberg, Germany, 2016. [Google Scholar]
- Markin, V.; Nerella, V.N.; Schröfl, C.; Guseynova, G.; Mechtcherine, V. Material design and performance evaluation of foam concrete for digital fabrication. Materials 2019, 12, 2433. [Google Scholar] [CrossRef] [PubMed]
- Raj, A.; Sathyan, D.; Mini, K. Physical and functional characteristics of foam concrete: A review. Constr. Build. Mater. 2019, 221, 787–799. [Google Scholar] [CrossRef]
- Jones, M.; McCarthy, A. Preliminary views on the potential of foamed concrete as a structural material. Mag. Concr. Res. 2005, 57, 21–31. [Google Scholar] [CrossRef]
- Amran, Y.M.; Farzadnia, N.; Ali, A.A. Properties and applications of foamed concrete; a review. Constr. Build. Mater. 2015, 101, 990–1005. [Google Scholar] [CrossRef]
- Aldridge, D. Introduction to foamed concrete: What, why, how? In Use of Foamed Concrete in Construction, Proceedings of the International Conference held at the University of Dundee, Scotland, UK, 5 July 2005; Thomas Telford Publishing: London, UK, 2005. [Google Scholar]
- Shill, S.K.; Al-Deen, S.; Ashraf, M. Concrete durability issues due to temperature effects and aviation oil spillage at military airbase–A comprehensive review. Constr. Build. Mater. 2018, 160, 240–251. [Google Scholar] [CrossRef]
- Yassin, A.M.; Eldin, M.M.; Omar, M.S.; Hafez, M.A.; Elnaggar, M.A. Effect of nano-silica on the flexural behavior and mechanical properties of self-compacted high-performance concrete (SCHPC) produced by cement CEM II/AP (experimental and numerical study). Case Stud. Constr. Mater. 2024, 21, e03490. [Google Scholar] [CrossRef]
- Jones, M.; McCarthy, A. Behaviour and assessment of foamed concrete for construction applications. In Use of Foamed Concrete in Construction, Proceedings of the International Conference held at the University of Dundee, Scotland, UK, 5 July 2005; Thomas Telford Publishing: London, UK, 2005. [Google Scholar]
- Kozłowski, M.; Kadela, M. Mechanical characterization of lightweight foamed concrete. Adv. Mater. Sci. Eng. 2018, 2018, 6801258. [Google Scholar] [CrossRef]
- Shah, S.N.; Mo, K.H.; Yap, S.P.; Yang, J.; Ling, T.-C. Lightweight foamed concrete as a promising avenue for incorporating waste materials: A review. Resour. Conserv. Recycl. 2021, 164, 105103. [Google Scholar] [CrossRef]
- Richard, A.O.; Ramli, M. Experimental production of sustainable lightweight foamed concrete. Br. J. Appl. Sci. Technol. 2013, 3, 994–1005. [Google Scholar] [CrossRef]
- Hilal, A.A.; Thom, N.H.; Dawson, A.R. On void structure and strength of foamed concrete made without/with additives. Constr. Build. Mater. 2015, 85, 157–164. [Google Scholar] [CrossRef]
- Cong, M.; Bing, C. Properties of a foamed concrete with soil as filler. Constr. Build. Mater. 2015, 76, 61–69. [Google Scholar] [CrossRef]
- Abd, A.M.; Abd, S.M. Modelling the strength of lightweight foamed concrete using support vector machine (SVM). Case Stud. Constr. Mater. 2017, 6, 8–15. [Google Scholar] [CrossRef]
- Falliano, D.; De Domenico, D.; Ricciardi, G.; Gugliandolo, E. 3D-printable lightweight foamed concrete and comparison with classical foamed concrete in terms of fresh state properties and mechanical strength. Constr. Build. Mater. 2020, 254, 119271. [Google Scholar] [CrossRef]
- Yaseen, Z.M.; Deo, R.C.; Hilal, A.; Abd, A.M.; Bueno, L.C.; Salcedo-Sanz, S.; Nehdi, M.L. Predicting compressive strength of lightweight foamed concrete using extreme learning machine model. Adv. Eng. Softw. 2018, 115, 112–125. [Google Scholar] [CrossRef]
- Pan, Z.; Hiromi, F.; Wee, T. Preparation of high performance foamed concrete from cement, sand and mineral admixtures. J. Wuhan Univ. Technol. Mater. Sci. Ed. 2007, 22, 295–298. [Google Scholar] [CrossRef]
- Nguyen, T.T.; Bui, H.H.; Ngo, T.D.; Nguyen, G.D. Experimental and numerical investigation of influence of air-voids on the compressive behaviour of foamed concrete. Mater. Des. 2017, 130, 103–119. [Google Scholar] [CrossRef]
- Kunhanandan Nambiar, E.; Ramamurthy, K. Fresh state characteristics of foam concrete. J. Mater. Civ. Eng. 2008, 20, 111–117. [Google Scholar] [CrossRef]
- Castillo-Lara, J.F.; Flores-Johnson, E.A.; Valadez-Gonzalez, A.; Herrera-Franco, P.J.; Carrillo, J.G.; Gonzalez-Chi, P.; Li, Q. Mechanical properties of natural fiber reinforced foamed concrete. Materials 2020, 13, 3060. [Google Scholar] [CrossRef]
- Lim, S.K.; Tan, C.S.; Li, B.; Ling, T.-C.; Hossain, M.U.; Poon, C.S. Utilizing high volumes quarry wastes in the production of lightweight foamed concrete. Constr. Build. Mater. 2017, 151, 441–448. [Google Scholar] [CrossRef]
- Madhavi, T.C.; Raju, L.S.; Mathur, D. Polypropylene fiber reinforced concrete—A review. Int. J. Emerg. Technol. Adv. Eng. 2014, 4, 114–118. [Google Scholar]
- ASTM C138/C138M-17a; Standard Test Method for Density (Unit Weight), Yield, and Air Content (Gravimetric) of Concrete. ASTM International: West Conshohocken, PA, USA, 2023.
- Jones, M.R.; Ozlutas, K.; Zheng, L. Stability and instability of foamed concrete. Mag. Concr. Res. 2016, 68, 542–549. [Google Scholar] [CrossRef]
- Lam, L.; Wong, Y.; Poon, C.-S. Effect of fly ash and silica fume on compressive and fracture behaviors of concrete. Cem. Concr. Res. 1998, 28, 271–283. [Google Scholar] [CrossRef]
- Technical Note TN 007—Flowable Fill, Vic Roads May 2008. Available online: https://www.vicroads.vic.gov.au/~/media/files/technical-documents-new/technical-notes/technical-note-tn-007--flowable-fill.pdf (accessed on 1 September 2024).
- Gencel, O.; Bilir, T.; Bademler, Z.; Ozbakkaloglu, T. A detailed review on foam concrete composites: Ingredients, properties, and microstructure. Appl. Sci. 2022, 12, 5752. [Google Scholar] [CrossRef]
- Ma, J.; Zhang, H.; Wang, D.; Wang, H.; Chen, G. Rheological properties of cement paste containing ground fly ash based on particle morphology analysis. Crystals 2022, 12, 524. [Google Scholar] [CrossRef]
- Liu, H.; Duan, G.; Zhang, J.; Yang, Y. Rheological properties of paste for self-compacting concrete with admixtures. Arch. Civ. Eng. 2022, 68, 585–599. [Google Scholar]
- Ruan, B.; Li, J.; Gan, Y.; Huang, J. Mesoscopic simulation of the mechanical behaviour of foam concrete subjected to large compressive deformation. Constr. Build. Mater. 2024, 418, 135367. [Google Scholar] [CrossRef]


Disclaimer/Publisher’s Note: The statements, opinions and data contained in all publications are solely those of the individual author(s) and contributor(s) and not of MDPI and/or the editor(s). MDPI and/or the editor(s) disclaim responsibility for any injury to people or property resulting from any ideas, methods, instructions or products referred to in the content. |
© 2024 by the authors. Licensee MDPI, Basel, Switzerland. This article is an open access article distributed under the terms and conditions of the Creative Commons Attribution (CC BY) license (https://creativecommons.org/licenses/by/4.0/).