Article

Virtual Screening and Molecular Dynamics Simulation to Identify Inhibitors of the m6A-RNA Reader Protein YTHDC1

Institute for Advanced Study, Shenzhen University, Shenzhen 518060, China
*
Author to whom correspondence should be addressed.
These authors contributed equally to this work.
Appl. Sci. 2024, 14(18), 8391; https://doi.org/10.3390/app14188391
Submission received: 3 June 2024 / Revised: 16 August 2024 / Accepted: 13 September 2024 / Published: 18 September 2024
(This article belongs to the Special Issue Recent Advances in Medicinal and Synthetic Organic Chemistry)

Abstract

:
YTHDC1 (YTH domain containing 1), a crucial reader protein of N6-methyladenosine (m6A) mRNA, plays a critical role in various cellular functions and is considered a promising target for therapeutic intervention in acute myeloid leukemia and other cancers. In this study, we identified orthosteric small-molecule ligands for YTHDC1. Using a molecular docking approach, we screened the eMolecules database and recognized 15 top-ranked ligands. Subsequently, molecular dynamics simulations and MM/PBSA analysis were used to assess the stability and binding free energy of these potential hit compounds in complex with YTHDC1. Notably, five compounds with IDs of ZINC82121447, ZINC02170552, ZINC65274016, ZINC10763862, and ZINC02412146 exhibited high binding affinities and favorable binding free energies. The results also showed that these compounds formed strong hydrogen bonds with residues SER378, ASN363, and ASN367 and interacted with the aromatic cage of the YTHDC1 reader protein through TRP377, TRP428, and hydrophobic residue LEU439. To assess their viability as lead compounds, we conducted absorption, distribution, metabolism, excretion, and toxicity (ADMET) studies to reveal promising features for these identified small molecules, shedding light on their pharmacokinetic and safety profiles.

1. Introduction

N6-methyladenosine (m6A) [1], which is methylated adenosine at the nitrogen-6 position of the base, plays a key role in epigenetics [2] and epitranscriptomics [3]. In addition, m6A alteration (or modification) of RNA, identified first in the 1970s [4], is the most typical and prevalent mRNA alteration found in viral RNAs and the most eukaryotic species. In the transcriptome, m6A is present at a frequency of 0.15 to 0.6% of all adenosines [5]. Its modification is a dynamically reversible biological process, and it generally occurs in a conserved motif defined as “DRACH” (D = A or G or U, R = A or G, H = A or C or U) [6]. Furthermore, m6A modification is a post-transcriptional regulatory marker in various RNAs, such as mRNAs, rRNAs (ribosomal RNAs), circRNAs (circular RNAs), tRNAs (transfer RNAs), micro RNAs (miRNAs) [7,8], and lncRNAs (long non-coding RNAs). As such, m6A modification plays vital roles in various biological processes, such as RNA splicing regulation, translation, translocation, and stability [8,9,10], and it is responsible for moderating various biological functions, such as brain development [11], heat shock response [12], chromatin accessibility [13], viral replications [14], the immune response to infection [15], and tumorigenesis [16].
N6-methyladenosine alteration is carried out by three main classes of epitranscriptome proteins: writers, erasers, and readers [8]. Reading proteins act as readers, methyltransferases act as writers, and dimethyltransferases act as erasers. Methyltransferase complexes, such as METTL3, METTL14, VIRMA, WTAP, ZC3H13, and RBM15/15B, catalyze m6A methylation [17]. The methylation is reversed by m6A erasers, such as ALKBH3/5 and FTO [18]. Readers recognize the m6A alteration on noncoding RNAs or mRNAs and mediate various events that include mRNA stability, splicing, export, translation efficiency, and biogenesis of miRNA [19,20,21,22,23,24]. The YTH (YT521-B homology) domain family members, such as YTHDF1/2/3 and YTHDC1/2, are considered the most important m6A readers [25]. Different readers have different m6A positioning functions and distinctive mechanisms for various biological functions. Readers unique to the m6A cytoplasm are YTHDF1/2/3, whereas readers in the nucleus are YTHDC1/2 [26].
YTHDC1 promotes exon inclusion in targeted transcripts and facilitates embryonic development. It specifically recognizes the sequence G(m6A)C with its YTH domain to identify m6A modification [27]. After recognition, YTHDC1 unites with m6A-altered pre-RNAs to recruit the SRSF3 (serine and arginine-rich splicing factor 3). However, it inhibits SRSF10 (serine and arginine-rich splicing factor 10) binding to nuclear spots. As a result, the export of mRNA to the cytoplasm from the nucleus is promoted and exon inclusion splicing is then favored [22]. YTHDC1 can recognize various types of RNAs, such as m6A-altered CarRNAs (chromosome-related regulatory RNAs) that include ERNA (enhancer RNA), PaRNA (promoter-related RNA), and repetitive RNA (transposable element transcript RNA). YTHDC1 promotes the interpretation and decay of CarRNAs and regulates the transcription and state of the chromatin [28]. Recent studies [16,19,26] revealed that YTHDC1 has a vital role in cancer and other disorders. YTHDC1 mediates various biological processes, such as metastasis, angiogenesis, chemoresistance, and cancer cell proliferation [29,30,31,32]. Furthermore, YTHDC1 can alter the immune response in lung cancer [33] and has been recognized as a pharmaceutical target in the treatment of acute myeloid leukemia (AML) [34]. These results indicate that YTHDC1 has the potential to enhance the therapeutic efficacy of immunotherapy treatments.
Structure-based virtual screening is typically used in computer-aided drug design for discovering new scaffolds and identifying lead compounds. Molecular docking, a widely adopted method to perform virtual screening [35], has been used for screening large in-house and commercial compound libraries [36]. Molecular dynamics (MD) simulations have been commonly applied to generate an ensemble of protein conformations, to investigate cryptic drug binding sites on the protein, and to optimize structures of protein–drug complexes [37]. It has also been demonstrated that MD simulations can be performed after the virtual screening to enhance the human selection process [38]. Molecular mechanics/Poisson Boltzmann surface area (MM/PBSA) analysis has been employed to evaluate docking poses, determine structural stability, and estimate binding affinities [39]. Evaluating the absorption, distribution, metabolism, elimination, and toxicity (ADMET) properties as early as possible is essential to determine the efficacy and safety of lead compounds as therapeutics. Various inhibitors have been identified in the ongoing quest to elucidate the regulatory functions of YTHDC1 and explore its potential as a therapeutic target. While these compounds offer promising avenues for drug development, understanding their interaction dynamics with YTHDC1 is imperative for optimizing their efficiency. We have extracted ligands co-crystallized with the YTHDC1 domain from the Protein Data Bank (PDB) to perform MD simulations and MM/PBSA analysis. These computational approaches offer robust avenues for probing the stability and binding affinities of these newly reported inhibitors, thus providing critical insights into their potential as effective modulators of YTHDC1. To the best of our knowledge, no approved inhibitors are presently known for YTH domain members. For METTL3, highly effective and specific inhibitors have been presented recently [40,41,42]. A few studies [43,44,45,46] have reported small-molecule ligands with micromolar affinity for YTHDC1 m6A reader domain, and some [47,48,49,50,51,52] have reported inhibitors for the m6A eraser FTO. For three YTHDF domains (YTHDF1/2/3), no ligands have been disclosed yet [53]. The uniqueness of this field and the role of YTHDC1 in the biological functions and in regulating the viral life cycle make YTHDC1 a fascinating target in the design of chemical probes and chemotherapy drugs. Thus, a complete understanding of the YTHDC1 molecular recognition mechanism is necessary.
In the present study, a structure-based virtual screening analysis was performed to identify potential inhibitors for YTHDC1 from a database with a large number of small molecules using the molecular docking approach, MD simulations, MM/PBSA analysis, and ADMET profiling. Such a comprehensive investigation identified small molecules with high binding affinities for YTHDC1. Identified molecules exhibited favorable conformations and stable complex formation with YTHDC1, formed strong hydrogen bonds with SER378, ASN363, and ASN367 residues, and interacted with the aromatic cage of YTHDC1 through residues TRP377 and TRP428, and hydrophobic residue LEU439. The identified small molecules are predicted to demonstrate favorable pharmacokinetic and ADMET properties. These small molecules can be the foundation for designing and optimizing novel inhibitory substances and compounds against YTHDC1. The screening steps were carried out in a hierarchical way, as summarized in Figure 1.

2. Materials and Methods

2.1. Preparation of Ligand Library

The eMolecules database (www.emolecules.com/, accessed on 29 January 2024) is a free search engine for chemical molecules and was used as the source for ligand collection. This study included an initial screening using a database containing approximately 1.2 million small molecules. The virtual screening process employed the Autodock Vina version 1.2 [54] tool using the structure of PDB ID 4R3I [27], which produced a docked complex between YTHDC1 and 6MZ that is close to the crystal structure and a docking score of 7.05. This produced a shortlist of the 1500 top-ranked small molecules with the highest docking scores. This primary selection process ensured that the chosen molecules possessed the most promising binding affinities, as determined by the docking scores obtained from Autodock Vina. Further refinement selected the first 820 compounds from this subset based on drug likeness and molecular similarity.

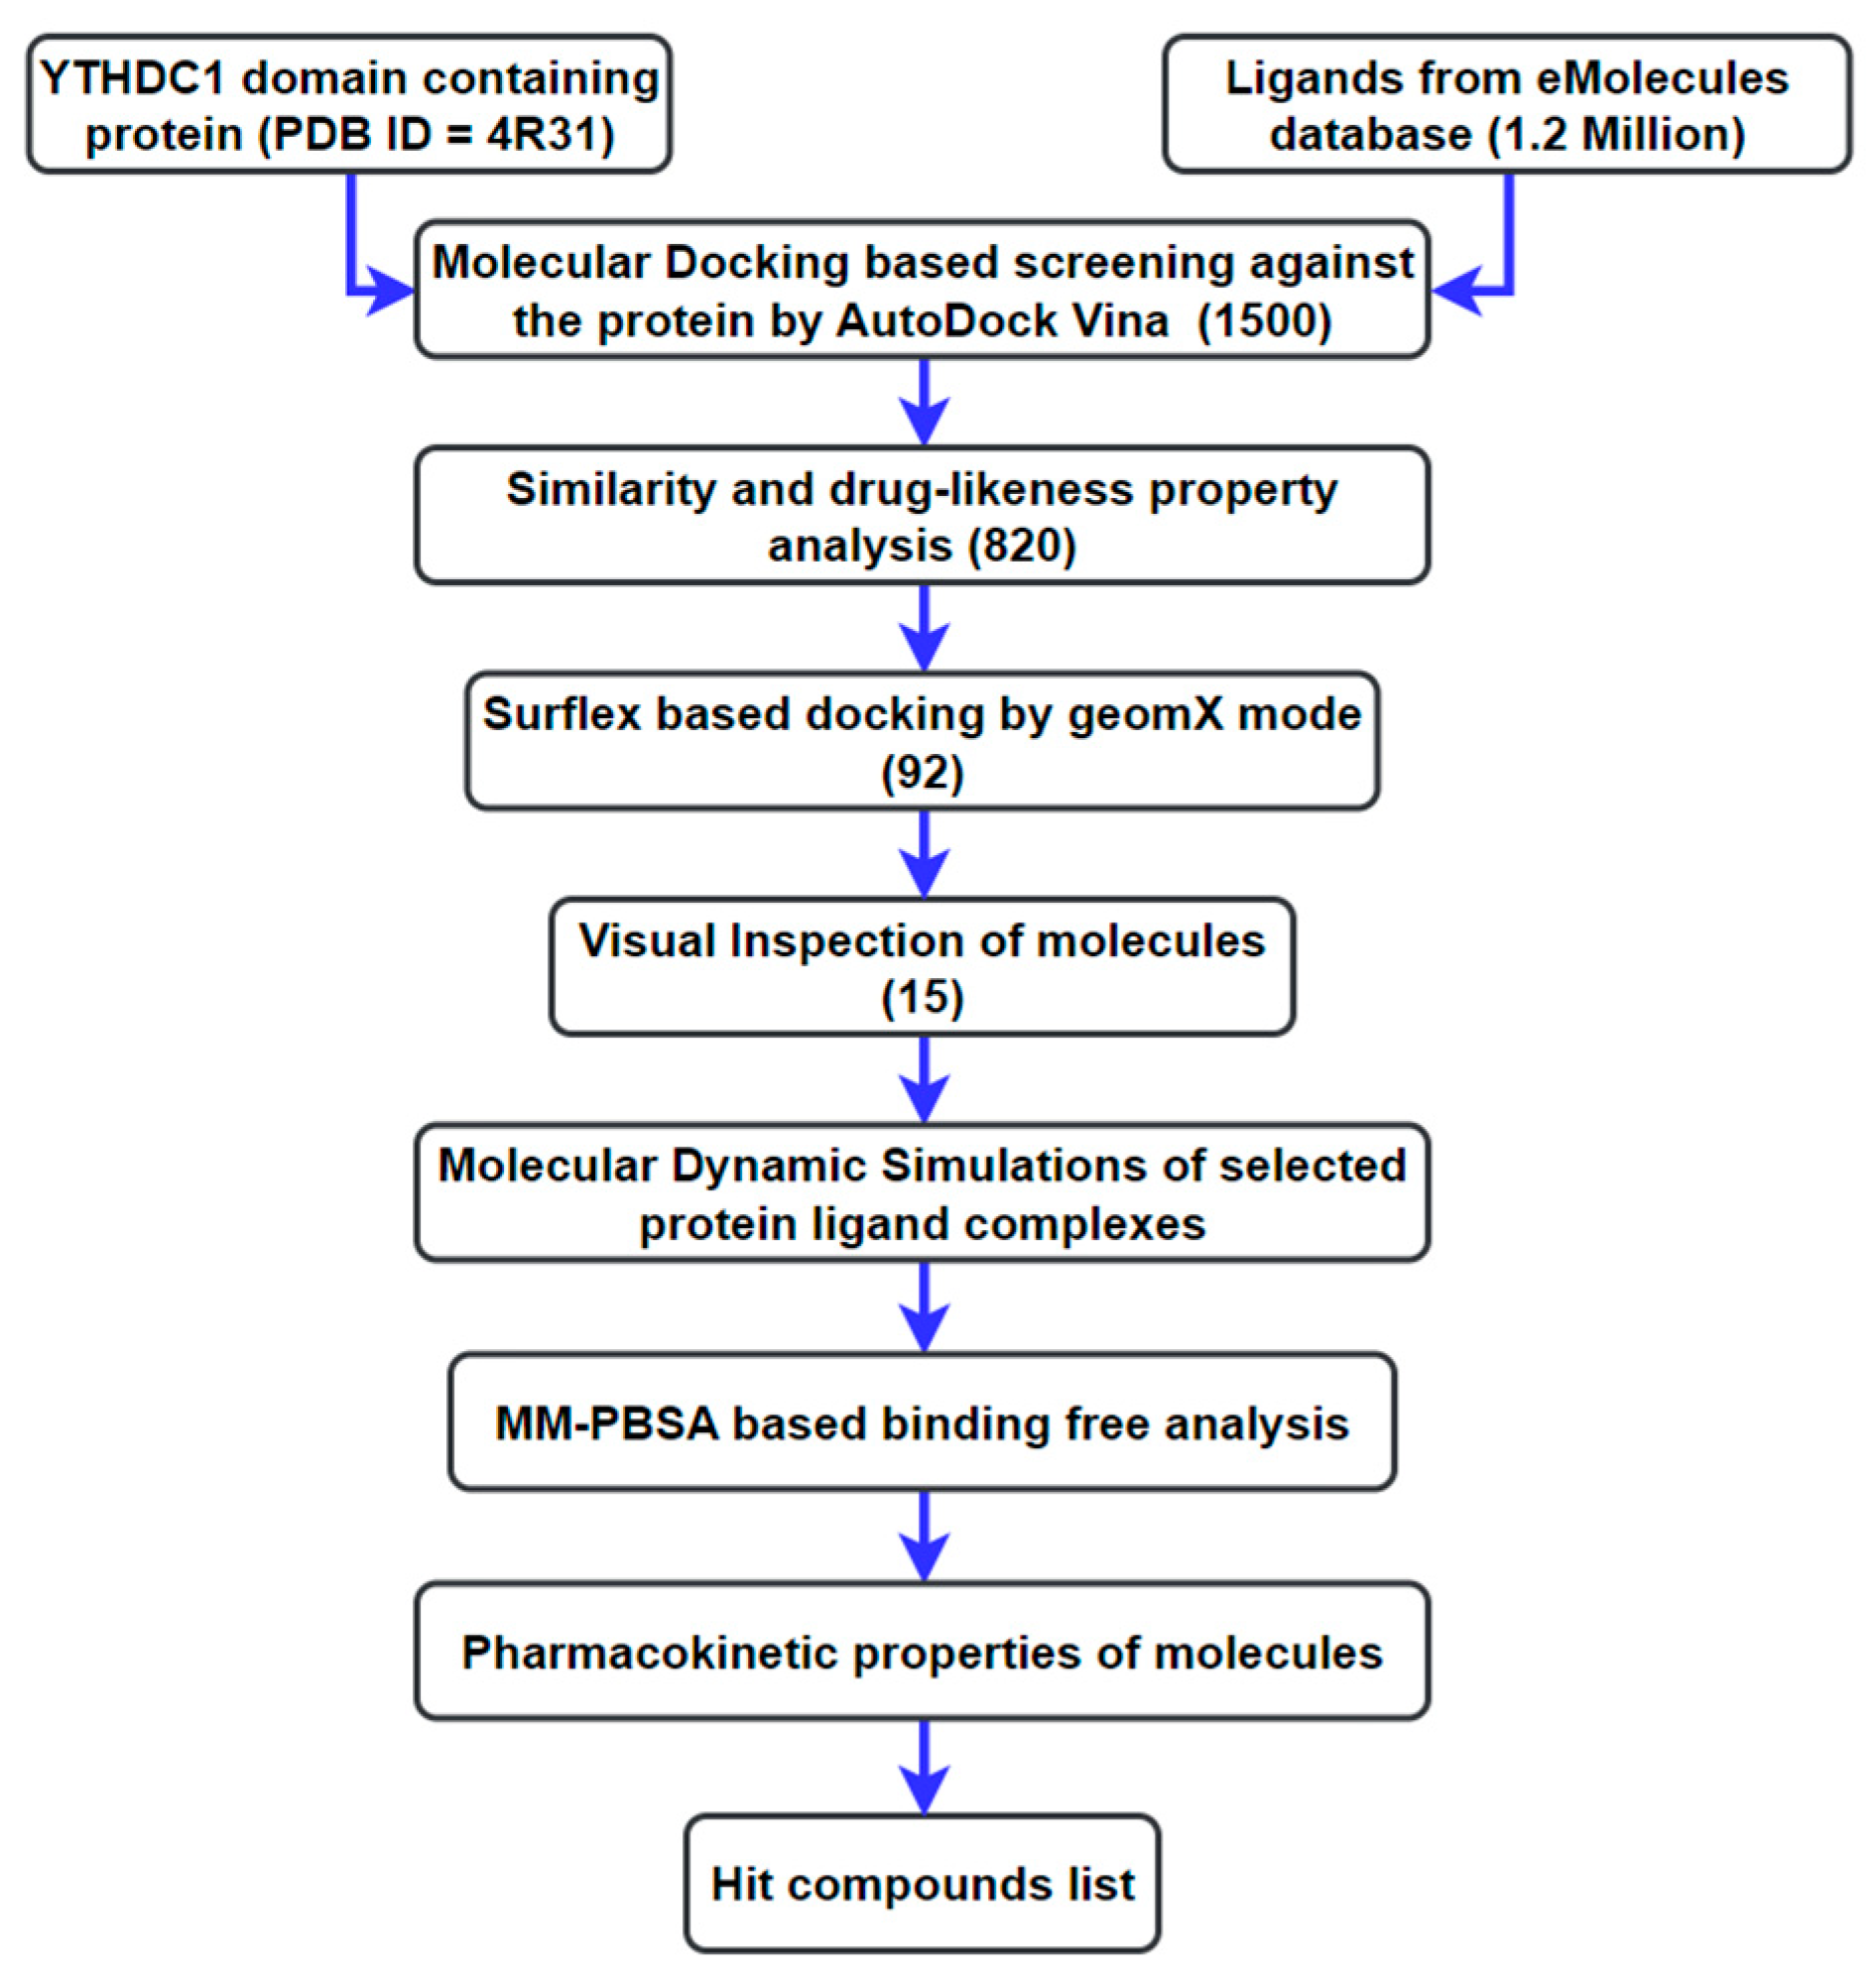
2.2. Preparation of the Receptor and Docking-Based Screening

The 3D structure (PDB ID: 4R3I, X-ray crystal structure, resolution of 1.80 Å [27]) was modified to generate the structure of the YTH domain of YTHDC1 in the complex with N6-methyladenosine-5′-monophosphate (6MZ), where the RNA other than the m6A residue was removed and the missing atoms for 6MZ was then added using Chimera. Another protein structure (PDB ID: 2YUD) shows the apo-state YTHDC1, which was used to compare the holo-state YTHDC1 in the complex with 6MZ(4R3I). The 3D structures of 4R3I and 2YUD were obtained from the Protein Data Bank (PDB) website (rcsb.org). For calibration, the X-ray structures of protein–ligand complexes for these 11 ligands were downloaded from the RCSB Protein Data Bank (PDB Code: 6T10, 6T11, 6T12, 6T01, 6T06, 6T0A, 6T0C, 6T0D, 6SZ7, 6SZT, 6SZX). MD simulations were then performed to provide dynamic and energetic insights for the interactions between YTHDC1 proteins and ligands in the aforementioned nine complexes. In the protein preparation step, we only used chain A of the structure 4R3I for study and removed all other chains and water molecules. Atom types were assigned to protein atoms. Hydrogen atoms and AMBER charges were added. The docking of 6MZ was performed with Surflex-Dock [55] in both the screen mode and the Geom X mode, with docking scores of 8.1 and 9.1, respectively. With the threshold set to 0.5 and the bloat settings used as the default, a ligand-based protocol was produced using 6MZ. The docking procedure was completed utilizing the default settings. The screening and docking of the 820 shortlisted compounds were performed using Geom X mode. When compared to the screen mode, which has a spin density of 3, this mode’s spin density for search was higher (set to 9). As a result, as the search was denser, the accuracy of the hit ranking was enhanced based on the docking score. In Surflex, flexible ligands were docked into binding sites using the Hammerhead procedure. In this method, fragments of ligands were produced and aligned to recognized probes, and the ligands’ remaining fragments were docked to them. The weighted sum of the atomic van der Waals surface distances between the protein and ligand was used to determine the scores. The scoring function included the terms entropic, hydrophobic, solvation, polar, crash, and repulsive. The results indicated binding affinity expressed in −log 10 units (Kd). Surflex docking resulted in 92 compounds with docking scores higher than that of the 6MZ, which was 9.1, and they were then inspected visually and shortlisted into 15 compounds with high binding affinity and strong interactions with pocket regions. In UCSF Chimera [56], high-affinity small molecules were visualized and analyzed. Docking results were visualized using BIOVIA Discovery Studio version 22.1 [57] to confirm the binding positions of the small molecules.

2.3. MD Simulations

2.3.1. Screening

MD simulations of the top 15 selected protein–ligand complexes were performed using GROMACS software version 2019.3 [58] to assess the suitability and stability of the protein–ligand interactions. The topology files of ligands were created using the CgenFF server [59]. Complexes were subjected to the force field of CHARMM36 [60]. The protonation states for titratable residues in YTHDC1 were determined with H++ [61] and DelPhiPKa [62] servers to be in a default protonation state (Figure S9). The system was situated 10 Å from the box edge in a cubic box. A TIP3P water model [63] was applied for each complex. To neutralize the system, Cl−ions were added as counterions. Typically, physiological conditions involve a salt concentration of 150 mM NaCl; this was not included in the molecular dynamic simulations. The reason to omit additional salt was to focus on the specific interactions between the proteins and ligands without the potential interference of ionic strength. Such a setup simplifies the system and can gain preliminary insights into the binding mode under neutral conditions. The steepest descent algorithm was subsequently used to minimize the system energy. Next, the NPT, or the constant number of particles (N), constant pressure (P), and constant temperature (T), as well as the NVT, or the constant number of particles (N), constant volume (V), and constant temperature (T), equilibration phases of the 100-ps simulations were applied to energy-minimized systems. Using the Parrinello–Rahman method [64], isotropic pressure coupling for 2 ps with an isothermal compressibility of 4.5 × 10⁻⁵ bar−1 was carried out to maintain a pressure of 1 bar −1. A velocity-rescaling thermostat [65] was applied to keep a constant temperature of 300 K. The particle mesh Ewald (PME) method was used to treat electrostatic interactions [66]. The van der Waals with the force-switch modifier [67] and Coulomb interactions were truncated at 1.2 nm. Systems were subjected to a production run of 10 ns each, during which conformations were stored every 10 ps. For the complexes of the protein with 6MZ and the 15 selected compounds, 100-ns simulations were performed, and the frames were saved every 100 ps. The GROMACS RMS utilities were used for root mean square deviation (RMSD) analysis. The MM/PBSA method was utilized in MD simulations to determine the binding energies of the 15 complexes.

2.3.2. Calibration

To evaluate the performance of MM/PBSA method in predicting binding affinity of ligands with YTHDC1, we performed MM/PBSA analysis on 11 ligands of YTHDC1, which were selected from 30 YTHDC1 binders reported in a study with high-throughput protein crystallography [43]. MMFF94x [68] force field parameters were used for each ligand. We used Gaussian 09 [69] to optimize the ligands’ hydrogen atoms via Hartree–Fock calculations with a 6-31G* basis set. Following this, the restrained electrostatic potential (RESP) [70] method was used to compute partial atomic charges based on calculations at the HF/6-31G* level. Each protein–ligand complex was neutralized by introducing sodium or chlorine ions as counter ions and was subsequently immersed in a cuboid box filled with TIP3P water while maintaining a 10 Å distance between the solute and the faces of the box.
MD simulations were executed using the AMBER16 package [71], with the AMBER ff14SB force fields [72] applied to the protein. Note that the binding free energy obtained by using two different force fields (Charmm and Amber) would not differ much, as seen in study [73], which critically assessed the performance of MM/PBSA using different force fields. We used the SHAKE algorithm to constrain all hydrogen-involved covalent bonds, allowing for a 2-fs time step. Long-range electrostatic interactions were managed using the PME approach. Each system underwent two sequential minimization steps before the heating process. Initially, 4000 minimization cycles were run while restraining all heavy atoms with a spring constant of 50 kcal/(mol·Å2), leaving solvent and hydrogen atoms unrestricted. This was followed by an unrestrained minimization involving 2000 steepest descent cycles and 2000 conjugate gradient cycles. The entire system was subsequently heated from absolute zero to 300 K for 50 ps while employing Langevin dynamics under constant volume conditions. An equilibrium state was achieved for 400 ps at a constant 1-atm pressure, with all heavy atoms weakly restrained with 10 kcal/(mol·Å2) during the heating phases. The production phase employed an NPT ensemble, maintaining the system at 300 K and 1 atm pressure with a Nose–Hoover thermostat [74] and a Parrinello–Rahman barostat [64], respectively, for 200 ns of simulation.

2.4. Energy Calculation of the Protein–Ligand Interactions Based on MM/PBSA

The free energy of the binding of complexes was computed using the MM/PBSA method that combines molecular mechanics methods with the Born method and the surface area continuum solvation model. For each protein–ligand complex, the MM/PBSA binding free energy can be determined using the following formula [75]:
G b i n d = G c o m p l e x     ( G p r o t e i n + G l i g a n d ) =   E M M + G P B + G n o n p o l a r T S
EMM denotes the gas-phase interaction energy between a ligand and protein, including the van der Waals and electrostatic energies, and ∆GPB and ∆Gnonpolar represent the polar and nonpolar components of solvation-free energies, respectively. TS represents the conformational entropy change for ligand binding [76].
A single-trajectory MM/PBSA protocol, which makes use of the protein–ligand complex simulation, was utilized. MM/PBSA computations were carried out in the final 5 ns of the production trajectory. A total of 80 snapshots for each system were taken along the trajectory at intervals of 1 ns. For all complexes, the binding free energies were computed using the g_mmpbsa tool [77].

2.5. ADMET Profiling

The ADMET properties of top-ranked small molecules with low docking scores and high binding free energies were determined using the pkCSM server (available at biosig.unimelb.edu.au/pkcsm/, accessed on 2 February 2024). Five key properties for ADMET were calculated using the SMILES format, including the surface area and lipophilicity (LogP). Absorption properties included investigations into caco-2 permeability, water solubility, and intestinal absorption (human). Distribution properties covered the fraction unbound (human), the blood–brain barrier (BBB) permeability, and the central nervous system (CNS) permeability. Metabolism properties were explored for the CYP2D6 substrate and inhibitor. The excretion property was characterized by the total clearance. Toxicity properties were investigated using AMES toxicity, hepatotoxicity, and skin sensitization.

3. Results and Discussion

The structure of the YTH domain of YTHDC1 in the complex with the ligand 6MZ was first analyzed to determine the critical amino acids involved in the recognition of m6A (Figure 2A). Notably, the 6MZ engages the binding site that primarily contains hydrophobic residues. YTHDC1’s YTH domain contains an aromatic cage that has evolved precisely to bind m6A [27]. The methyl group of m6A interacts strongly with aromatic residues TRP377, TRP428, and hydrophobic residues LEU439. Notably, both residues TRP377 and TRP428 are conserved in YTH domain family proteins. The mutation in TRP377 and TRP428 residues completely disrupts the binding of 6MZ to m6A RNA [43]. Moreover, the adenine ring of m6A forms three hydrogen bonds with residues SER378, ASN363, and ASN367. This study [43] screened and identified 30 fragments representing 10 different chemotypes. Key interactions in most of the 30 fragments included hydrogen bonds with SER378 and van der Waals contacts within an aromatic cage. One study [44] found that the YTHDC1 aromatic cage recognizes the m6A nucleoside. Three residues (SER378, ASN363, and ASN367) form hydrogen bonds with the nucleobase. The ligand–protein binding is further strengthened by the methyl group with van der Waals interactions with the lipophilic binding site. This recognition was also confirmed by another study [45] that found that m6A’s methyl group contributed to binding by interacting with two residues (TRP377 and TRP428) that also form an aromatic cage. The study [46] designed a potent ligand that interacted strongly with YTHDC1 through TRP377, TRP428, and LEU439.
Most residues directly connected to m6A do not undertake apparent changes in the YTHDC1 holo and apo forms [27]. This observation was also found in the new complex of m6A-YTHDC1 (PDB ID: 6ZCN) [45]. We checked whether the binding of a ligand with the YTHDC1 domain affects the structure. The structural comparison was carried out between the apo state of YTHDC1 (2YUD) and the complex upon ligand binding (Figure 2B). The overall RMSD between the two structures was 1.10 Å. The conserved residues TRP377, TRP428, and LEU439 are critical residues for binding, forming an aromatic cage for the binding of m6A. These residues and their side-chain orientations are conserved and do not undergo considerable changes. However, the side chain of residue ASN363 is slightly different. One study [45] found a different conformation for the binding residues in a new apo YTHDC1 structure with two YTH domains in an asymmetric unit (PDB ID: 6ZD9). 6ZD9’s chains, A and B, showed different orientations for the MET438 residue. The conformation of Chain A more closely resembled the canonical one. However, in chain B, a side chain flipping of the MET438 residue from the solvent into the binding pocket was observed, which resulted in one impeded aromatic cage to bind m6A. We also performed a docking study of the native ligand m6A using the same pipeline and parameters as employed for our virtual screening (Figure S7). The score obtained is 9.11 kcal/mol, which serves as a reference to compare the binding affinities of our top candidate ligands, which had docking scores ranging from −11.03 to −9.6 kcal/mol. The docking score of m6A falls within this range, indicating that our identified ligands exhibit comparable or better binding affinities to the YTHDC1 protein than the native m6A ligand.

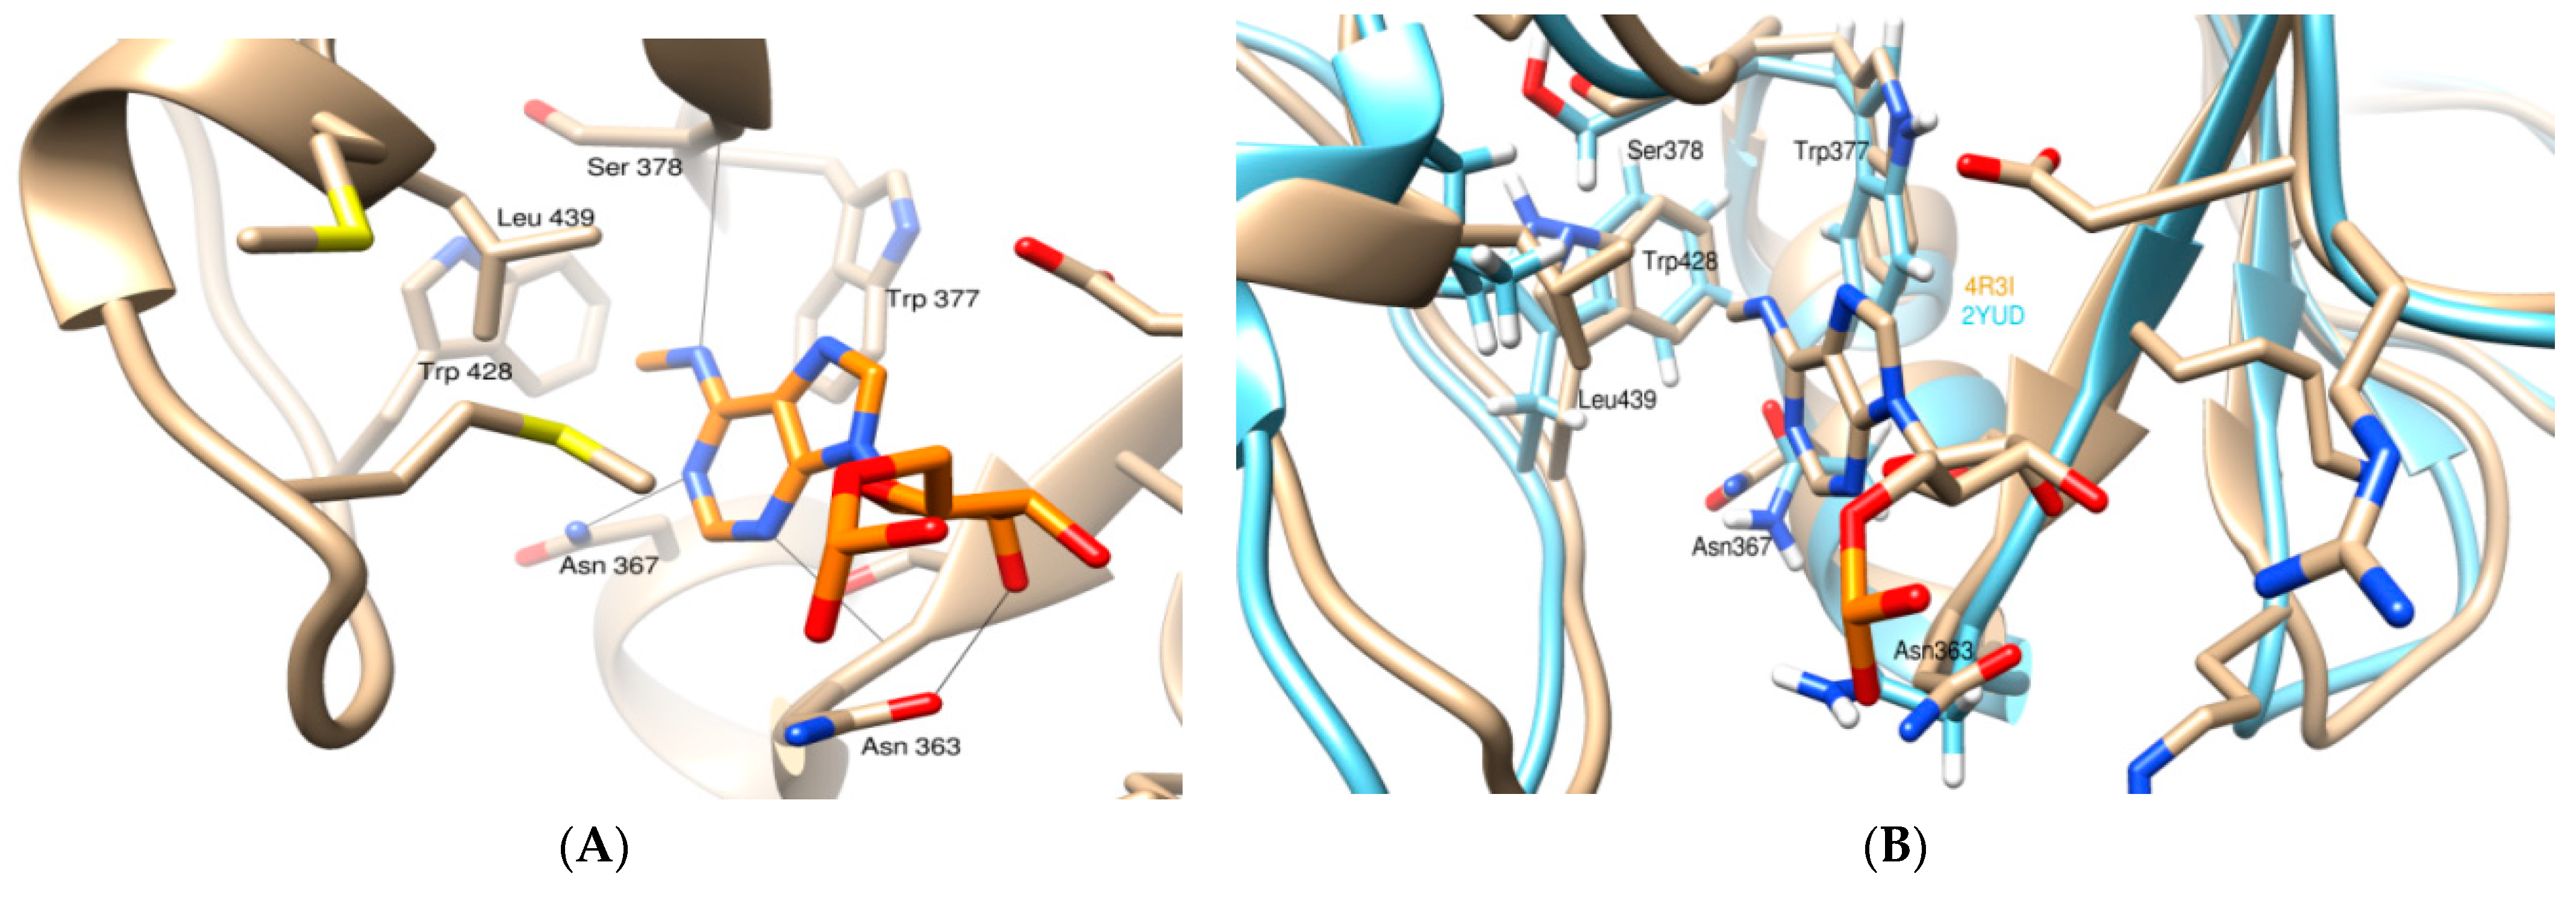
3.1. Molecular Docking Analysis

The docking scores of 1500 small molecules from molecular docking in Autodock Vina are listed in Table S1. While docking scores provide an initial indication of potential binding interactions, they are supplemented with molecular dynamics (MD) simulations and MM/PBSA calculations in this study to more accurately assess the stability and binding affinity of the small molecules with the target protein. From 1500 small-molecule ligands, the first 820 were selected based on drug likeness and similarity. To be more precise, molecules that showed a 2D Tanimoto coefficient higher than 0.65 in relation to the reference molecule designated as 6MZ were eliminated. Moreover, Lipinski’s Rule of Five was followed to establish the drug-likeness criteria. These 820 molecules were docked to the m6A reader protein active site using Geom X mode. After the results were obtained, 92 compounds with the highest Surflex-GeomX score were examined visually for the following interactions: (1) hydrogen bond interactions with residues SER378, ASN363, and ASN367, (2) interactions with aromatic residues TsRP377, TRP428, and hydrophobic residue LEU439, (3) surface complementarity, and (4) other interactions. After visual inspection, 15 compounds were selected, which are listed in Table 1. Note that visual inspection was preferred over relying solely on the best docking scores to select the 15 compounds. Reasons for this include the following: (1) visual inspection enables a more nuanced assessment, considering factors such as the precise fit within the binding pocket and potential off-target interactions, whereas docking scores often oversimplify the complex interactions within biological systems. (2) We can recognize subtle yet critical features that automated scoring systems might overlook, such as specific bonding patterns or functional group orientations. (3) Visual inspection serves as a vital validation step, ensuring selected compounds have the highest potential for success by evaluating factors beyond numerical scores, such as dynamic interactions and solvent effects.
The complexes of these 15 ligands with YTHDC1 were visualized using USCF Chimera (Figure S1) and BIOVIA Discovery Studio (Figure S2). Figure 3 illustrates the 3D structures and 2D interaction plots for the top five small molecules (ZINC65274016, ZINC82121447, ZINC02412146, ZINC12780673, and ZINC64755558) identified as potential inhibitors of the YTHDC1 protein. The interactions between the ligands and the protein are highlighted to show the different types of bonds and forces contributing to the binding affinity and stability of these complexes. Hydrogen bonds are represented by dashed green lines and are significant for the specificity and stability of the ligand–protein complex. In the top five molecules, these bonds are predominantly formed with residues ASN367, ASN363, and SER378. Van der Waals interactions are shown as light green lines, involving non-covalent contacts between the ligand and the protein within the binding pocket. π–π Stacking is depicted by magenta lines, occurring between the aromatic rings of the ligands and the aromatic residues of the protein, particularly TRP377 and TRP428, which enhance the binding strength in the aromatic cage of YTHDC1. π–σ Bonding, represented by purple lines, occurs between the aromatic rings of the ligands and sigma bonds within the protein. π–Alkyl and π–Sulfur/π–Cation/Anion interactions are shown in plum and orange colors, respectively. These interactions occur between the aromatic rings of the ligands and the alkyl groups and sulfur atoms or charged atoms of the protein, further stabilizing the ligand within the binding site.

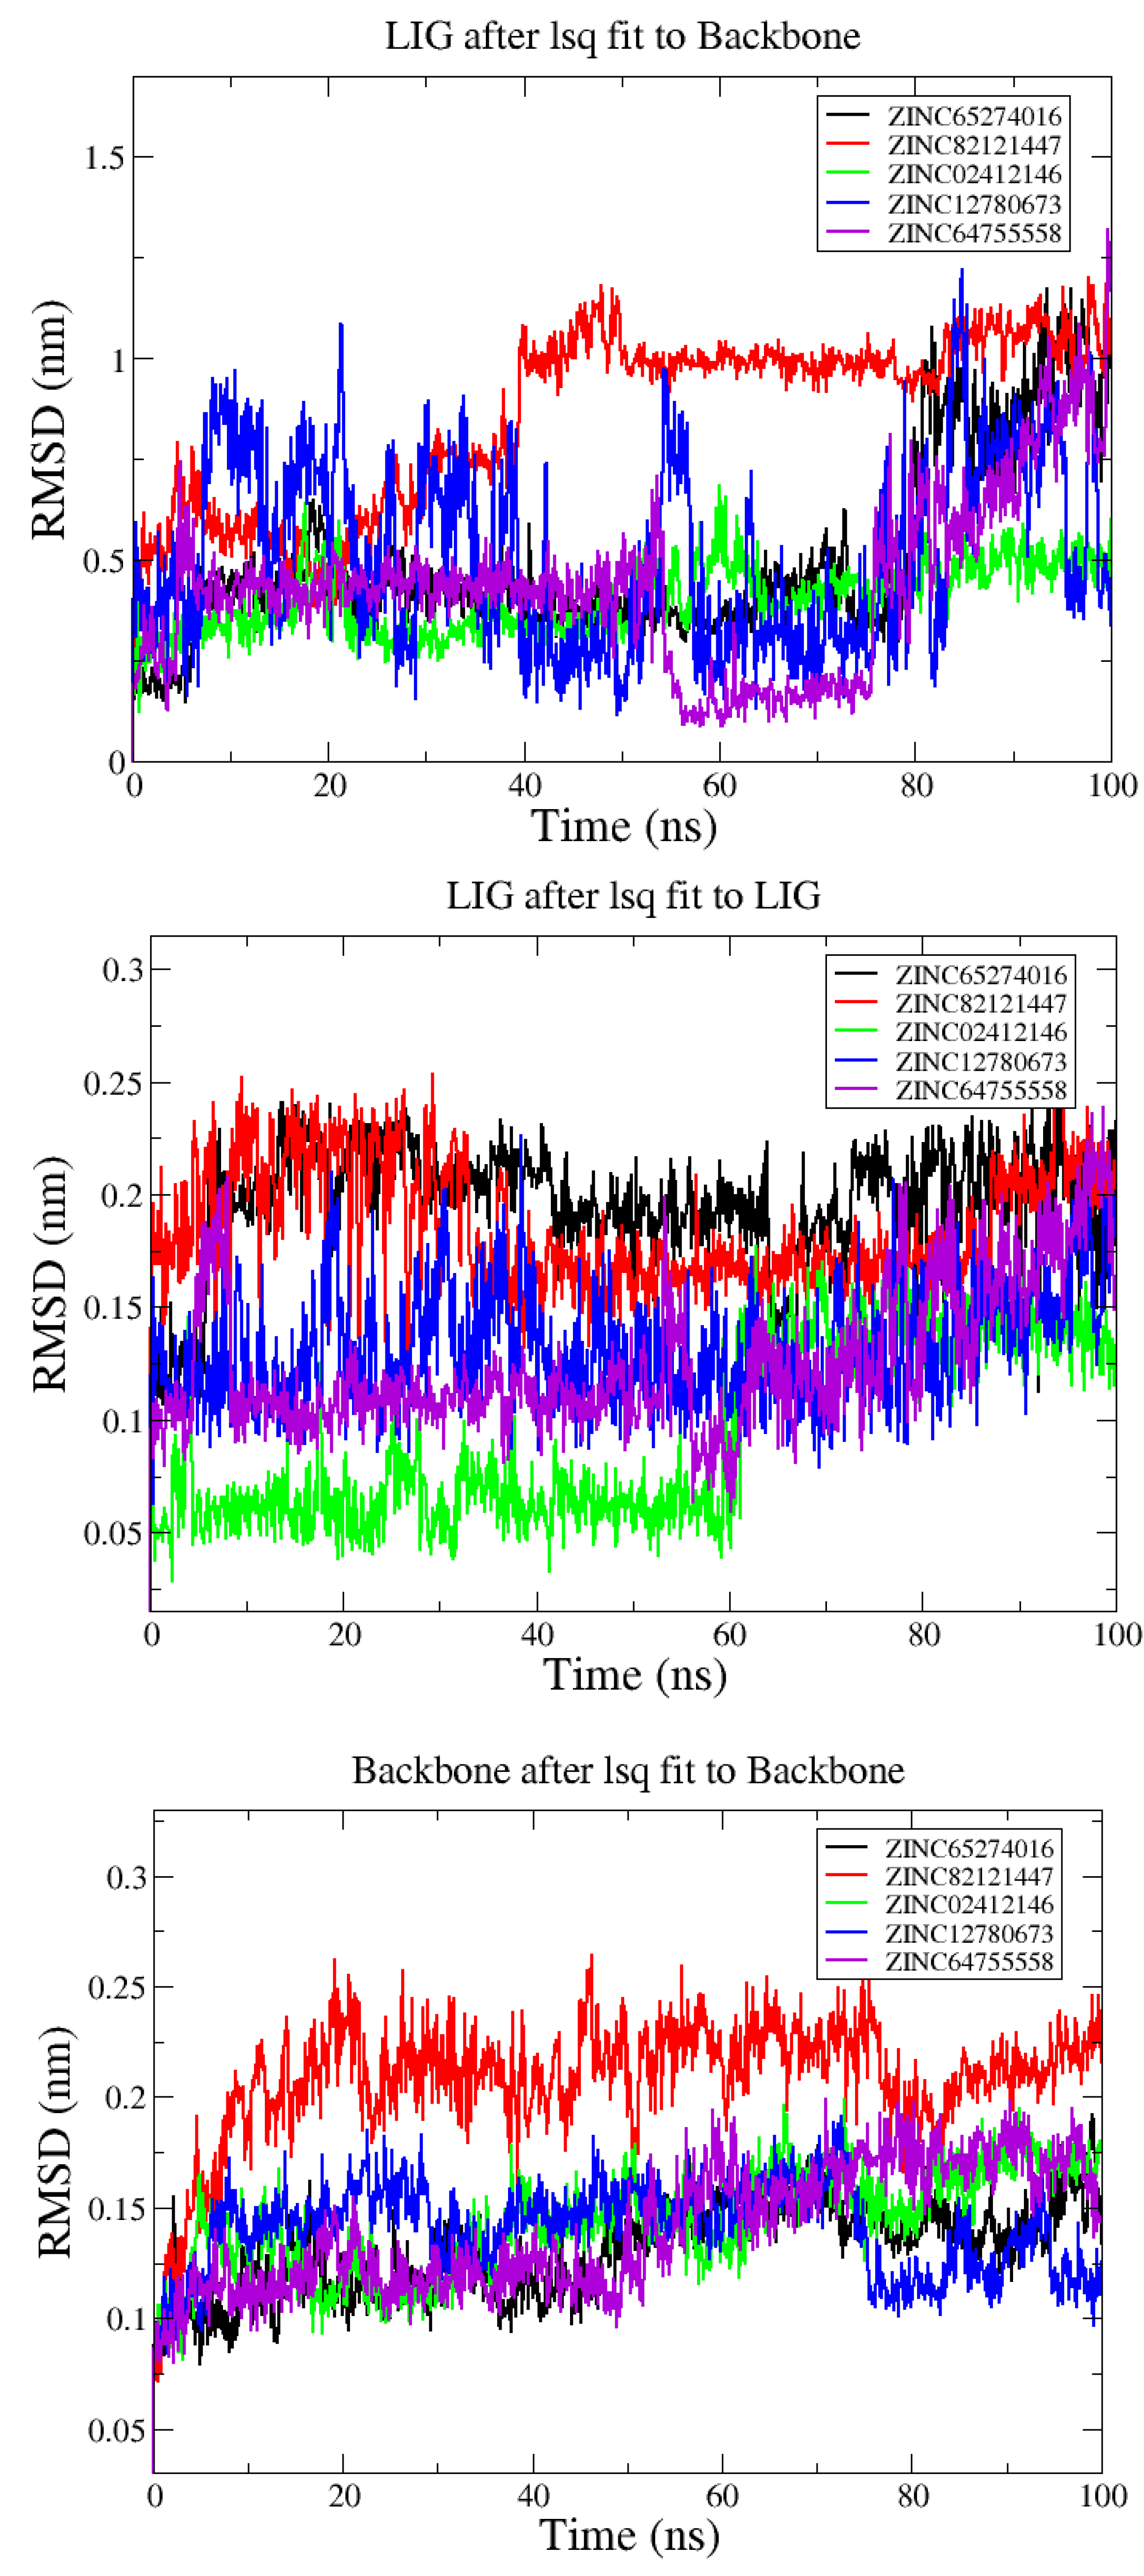
3.2. Analysis from MD Simulations

MD simulations were performed on YTHDC1 in a complex with 6MZ. The ligand was observed to stay inside the pocket within a 100-ns simulation, suggesting that the m6A alone binds to YTHDC1, although it is part of the RNA complex [27].
MD simulations were then conducted for the 15 protein–ligand complexes in Table 1 to investigate the compound’s overall binding stability (Figure S3). The starting poses for the simulation studies were obtained from the Geom-X docking experiment. The simulations were performed for 100 ns, and the information retrieved through trajectories was used to examine the conformational stability of the complexes. During the simulation, the RMSD of the protein backbone atoms was computed to evaluate the system stability. For the production run, RMSDs of both the ligand and the protein backbone were calculated and plotted for all systems. The interaction patterns were found to maintain the docking-predicted hydrogen bonds and hydrophobic contacts throughout the MD simulations. For ZINC82121447, the ligand flipped around 40 ns, and the part outside of the pocket was found to enter in the pocket of YTHDC1. However, ZINC82121447 remained inside the pocket during 100ns simulation, as seen from the distance between the center of mass (COM) of the protein and the COM of the ligand (Figure S5). Two compounds, ZINC58341263 and ZINC91526763, were observed by visual inspections to get out of the pocket during the simulation time and showed large RMSDs and distances between the COMs of protein and ligand (Figures S3 and S6). The obtained low-RMSD values for the top five protein–ligand complexes (Figure 4) showed that the ligands and protein backbone were structurally stable. The average RMSD of ligand atoms (protein backbone atoms) was computed to be 0.20 (0.22), 0.15 (0.12), 0.21 (0.12), 0.13 (0.12), and 0.13 (0.15) nm for ZINC65274016, ZINC82121447, ZINC02412146, ZINC12780673, and ZINC64755558, respectively. Moreover, the presence of plateaus in RMSD curves of almost all complexes except ZINC58341263 and ZINC12780673 confirmed the stability throughout the simulations. Note that the MD trajectory of the last 80 ns was used in the calculation of the binding free energy based on MM/PBSA, which is reported in Section 3.4.

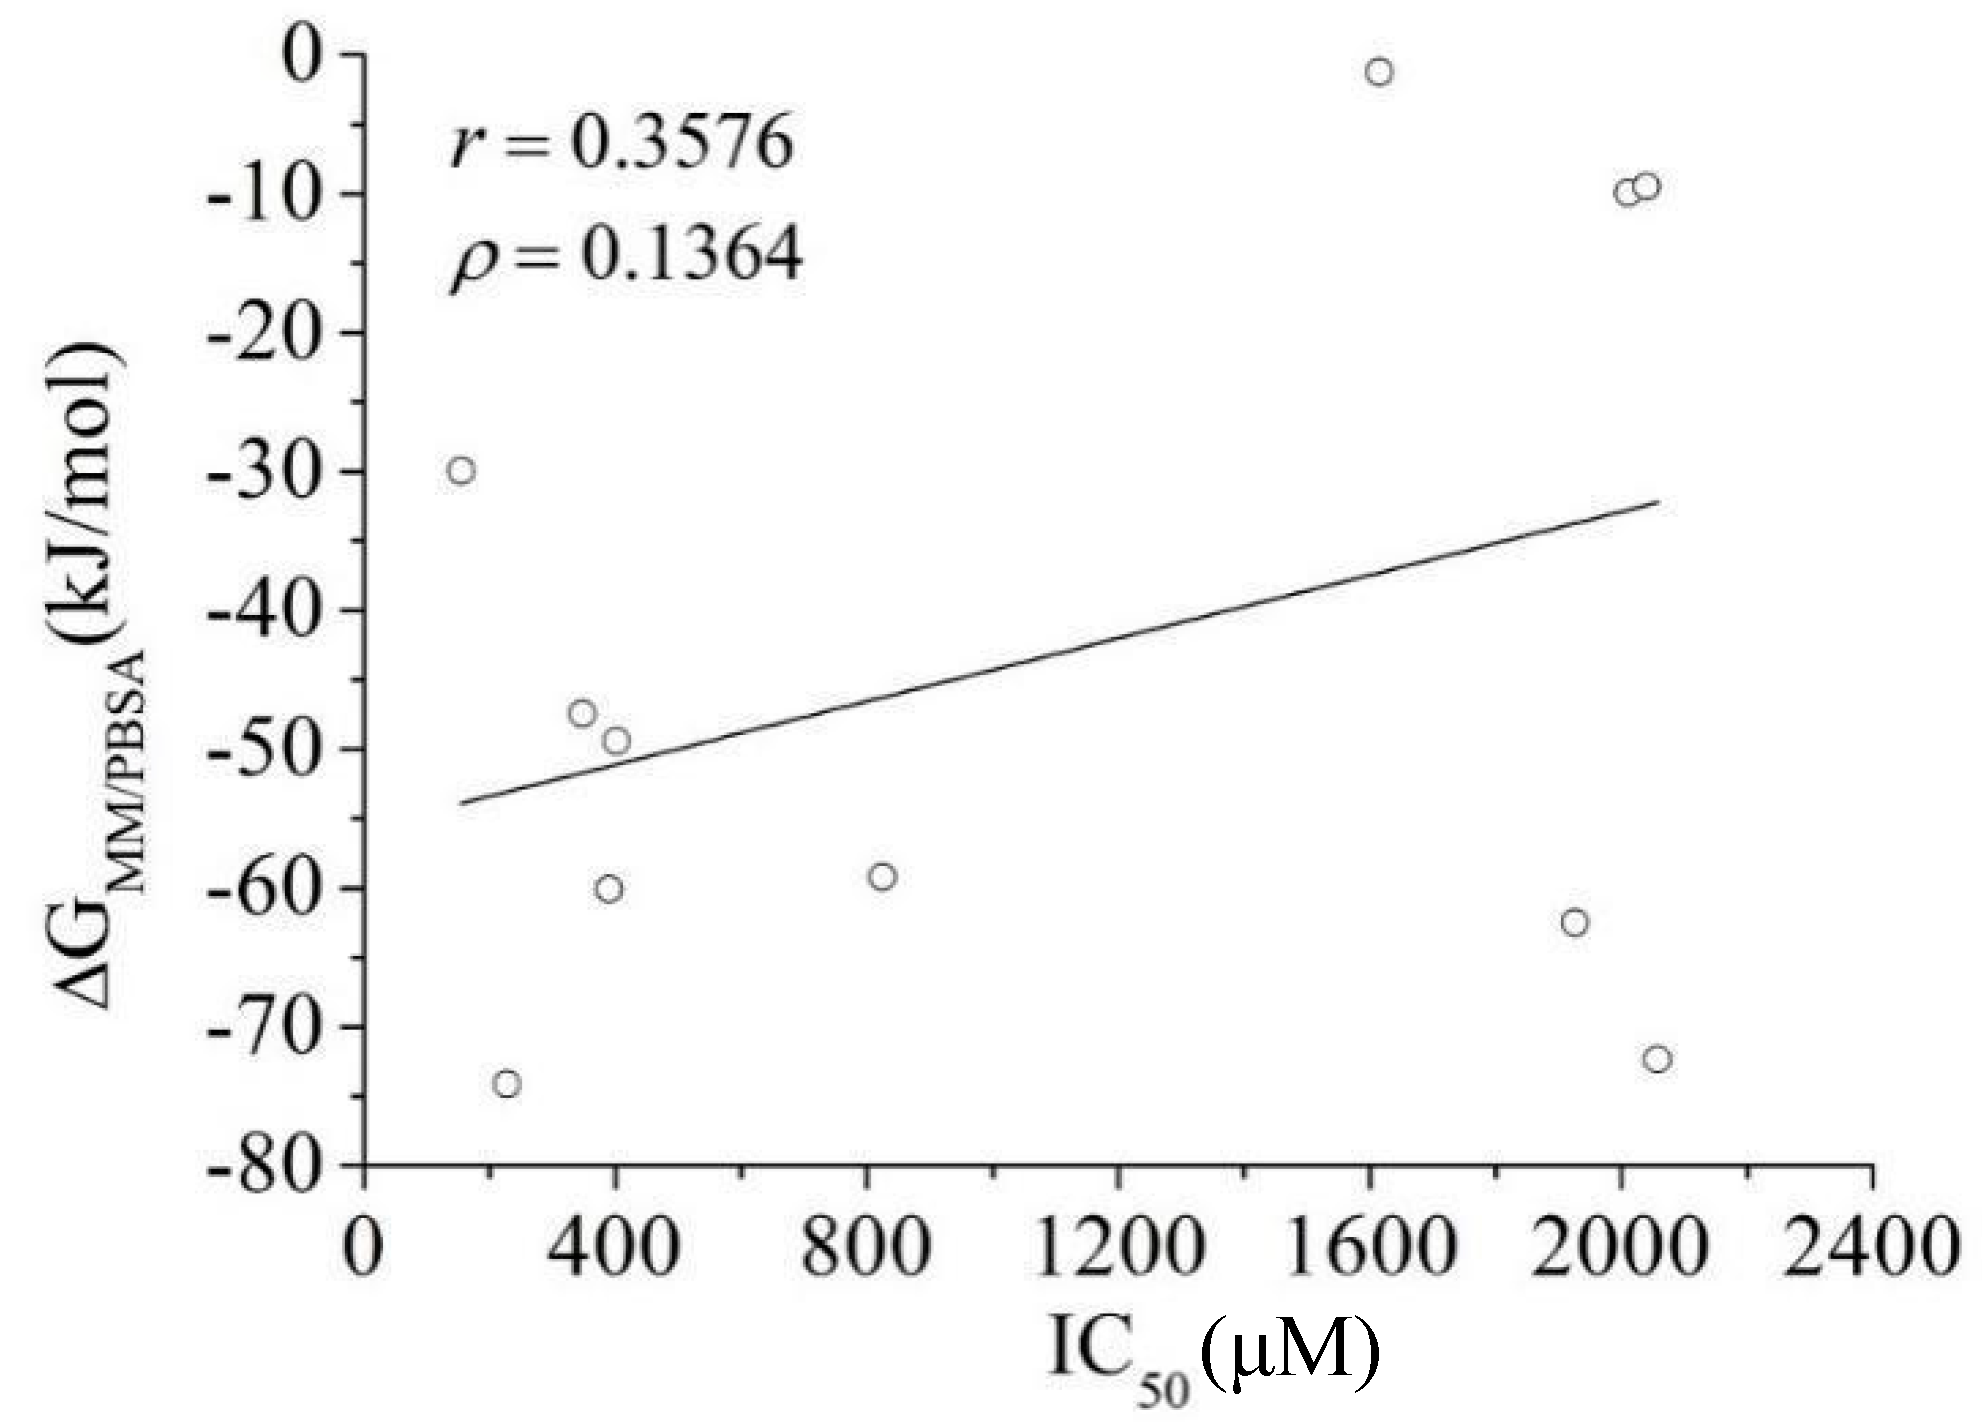
3.3. MM/PBSA Binding Free Energy Calculation: Calibration

RMDS analyses, after MD simulations for the 11 known inhibitors, suggested that both ligands and the protein are stable (Figure S4). Finally, the MM/PBSA methodology was applied to determine the complex’s binding free energy. Table 2 provides the binding free energies obtained via the MM/PBSA calculations. These calculations involve evaluating various energy components, including van der Waals interactions, electrostatic forces, calculations from the Poisson–Boltzmann equation, and non-polar solvation energies. Together, these components contribute to determining overall binding free energies, providing essential insights into the intricate nature of protein–ligand complexes.
The scatter plot in Figure 5 shows the relationship between two key parameters: IC50 values, representing the inhibitory potency of a set of compounds, and ΔGMM/PBSA (ΔGbind in Table 2), which indicate the calculated binding free energy of these compounds with YTHDC1 from MM/PBSA analysis. The Spearman’s rank correlation coefficient between the two parameters is as low as 0.14, indicating that ranking ligands based on their ΔGMM/PBSA is not reliable. However, the Pearson correlation coefficient between experimental IC50 values and ∆GMM/PBSA is encouraging (0.36), suggesting that a compound can be judged with satisfying confidence to be a strong or weak binder if its ΔGMM/PBSA is low enough. Note that 5 out of 7 compounds with ΔGMM/PBSA lower than −40 kJ/mol are strong binders with IC50 values lower than 1000, while 3 out of 4 compounds with ΔGMM/PBSA higher than −40 kJ/mol are weak binders with IC50 values remarkably larger than 1000.

3.4. MM/PBSA Binding Free Energy Calculation: Screening

The binding free energies of the 15 complexes were then calculated with the MM/PBSA method for compound prioritization and re-ranking. For the binding free energy, MM/PBSA was used because they are widely applied due to their computational efficiency [60,78]. In this method, the final state of the system is sampled, and the solvent is implicitly treated to reduce computation time. In total, 80 snapshots were collected for each system at 1-ns intervals along with the last 80-ns trajectory. The average binding energy with standard deviation was calculated as well. The binding free energies for these compounds are shown in Table 3. The ranking of the compounds was performed based on the predicted binding free energy. Notably, the compound ZINC82121447 exhibited the lowest value of −114.03 ± 3.10.8 kJ/mol. Other compounds, ZINC02170552, ZINC65274016, ZINC10763862, and ZINC02412146, also showed highly favorable values of −83.2656 ± 20.4, −75.24 ± 8.4, −73.359 ± 8.4, and −67.716 ± 9.4kJ/mol, respectively.
Five compounds (Table 4) were selected as potential hits based on the docking score, visual inspection, protein–ligand interactions, stability of the bound ligand, and predicted values for binding free energy. Van der Waals interactions contributed primarily to their favorable binding. Electrostatic interaction contributed less, except in the case of the first compound. This shows that van der Waals interactions played an essential role between the ligand and the protein in this study. Moreover, MM/PBSA analysis for 15 compounds is listed in Table S3.

3.5. ADMET Profiling

Understanding the ADMET characteristics of compounds is crucial for rational drug development and has become an important part of drug discovery in the search for new therapies. These properties include several kinds of characteristics that control the fate of ligands in biological systems, impacting their effectiveness and safety. Clarifying the ADMET profile of ligands can accelerate the drug development process, enabling the identification of candidates with optimal pharmacokinetic profiles and reduced toxicity liabilities. The predicted ADMET properties of the 15 compounds are listed in Table S2. The ADMET properties of the top five compounds are listed in Table 5.
Absorption, the initial step in drug bioavailability, dictates the extent to which a ligand enters systemic circulation following administration. The absorption properties of the small molecules were assessed via (1) water solubility (in log mol/L), (2) caco-2 permeability (in log Papp in 10−6 cm/s), and (3) human intestinal absorption (in % absorbed). The water solubility shows molecule solubility in water at 25 °C. Caco-2 is a human intestinal mucosa method that measures the absorption range of oral drugs. Intestinal absorption measures the proportion of compounds observed in the small intestine in humans. A compound is considered poorly absorbed if it has low intestinal absorption (<30%). The predicted values of water solubility indicate that ZINC82121447, ZINC02412146, and ZINC02170552 have moderate solubility while ZINC65274016 and ZINC10763862 are soluble. ZINC02412146 shows lower caco-2 permeability and others indicate good permeability comparatively. ZINC65274016 and ZINC10763862 show excellent values for intestinal absorption, which is 90% for oral drugs, and ZINC02170552 shows 50% intestinal adsorption.
Distribution encompasses the dissemination of ligands throughout bodily tissues, influenced by factors such as (1) Fu (human fraction unbound); (2) BBB (logBB) permeability; and (3) CNS (logPS) permeability. The fraction of unbound measures the fraction of unbound drugs in the plasma. The ability of a drug to enter the brain, which helps in drug efficacy, is measured using logBB or logPS. A logBB > 0.3 means that it readily crosses the BBB, while a logBB value less than −1 indicates poor distribution in the brain. A logPS value > −2 suggests it can penetrate the CNS, and a logPS value < −3 means that the compound is unable to penetrate. Among the five compounds, only ZINC02412146 shows a higher fraction of unbound values, which suggests that a larger portion of this compound is available for interaction with its target. All five compounds except ZINC65274016 have relatively poor BBB permeability and thus are unlikely to penetrate the BBB. ZINC65274016, ZINC10763862, and ZINC02170552 have the least negative values of CNS permeability, so they might have better potential for exerting effects within the central nervous system.
Metabolism governs the biotransformation of chemical compounds within the body, impacting their pharmacological activity and toxicity. Computational tools, such as molecular docking and pharmacophore modeling, facilitate the prediction of ligand metabolism pathways and interactions with CYP2D6 as a substrate or inhibitor. None of the compounds listed are expected to interact significantly with the CYP2D6 enzyme either as substrates or inhibitors.
Excretion governs the elimination of chemical compounds and their metabolites from the body, predominantly through renal and hepatic pathways. Computational models, such as clearance prediction algorithms and renal function estimators, aid in assessing ligand excretion kinetics. Among the top five ligands, ZINC65274016 represents relatively high total clearance, indicating faster removal of the compound from the body.
Toxicity assessment is crucial for evaluating the safety profile of a drug. Toxic effects can result from the primary action of the drug, its metabolites, or off-target interactions. Three categorical parameters (AMES toxicity, hepatotoxicity, and skin sensitization) were used to evaluate the toxicities of the molecules. The first parameter indicates whether a compound is mutagenic and hence likely to be a carcinogen. Hepatoxicity shows whether a compound is associated with disrupted liver function. The third parameter checks whether a compound is associated with skin sensitization. ZINC02412146 does not exhibit hepatotoxicity, AMES toxicity, or skin sensitization.

4. Conclusions

In this study, an exhaustive computational investigation was conducted to identify potential small-molecule ligands targeting the m6A reader protein YTHDC1 from a vast repository of compounds housed within the eMolecules database. Through a rigorous high-throughput virtual screening process, five lead ligands—ZINC82121447, ZINC02170552, ZINC65274016, ZINC10763862, and ZINC02412146—were identified based on their remarkable binding scores, ranging from −11.03 −9.6 kcal/mol, and with corresponding binding free energies spanning from −114.03 ± 10.8 to −9.9990 ± 72.6kJ/mol. Subsequent molecular dynamics simulations validated the stability of these ligand–protein complexes, affirming the potential interactions between the ligands and YTHDC1. Notably, these top-ranking ligands exhibited robust hydrogen bond formations with critical residues such as SER378, ASN363, and ASN367, and effectively engaged the aromatic cage of YTHDC1, interacting with residues TRP377 and TRP428. Nevertheless, ZINC82121447 deserves further attention in the future, as the RMSD of the protein is significantly higher than the ones in other cases, and thus, it is of highest binding affinity and flipped inside the binding pocket during the simulation.
A detailed MM/PBSA analysis shed light on the underlying energetics governing ligand binding, with van der Waals interactions emerging as the primary driving force behind favorable ligand–protein interactions. While the majority of identified ligands showcased promising binding attributes, four ligands demonstrated unfavorable binding free energies, indicating potential limitations in their interaction with YTHDC1. A comprehensive ADMET profiling of the ligands yielded satisfactory results in accordance with Lipinski’s rule of five, underscoring their potential as viable drug candidates.
We note that docking simulations cannot correctly rank true binders among a large number of decoys (false binders) because the scoring functions used by docking programs are just rough approximations of binding energy [79]. Although the selected five compounds possess quite high docking scores, there is a risk that most if not all of them could be false binders. Due to the qualitative nature of MM/PBSA analysis, the correlation of binding free energy given by MM/PBSA with experimental IC50 values is not definitive enough. More accurate computational methods such as free energy perturbation could be the next option [80]. We note that the potency of the suggested inhibitors is comparable to existing ones that were verified experimentally; however, the studyhas demonstrated to be an encouraging attempt to identify alternative inhibitors, which are structurally divergent to existing compounds. In the near future, the potency of these proposed compounds may be enhanced via computational approaches together with medicinal chemistry experts [81]. Looking ahead, further study aims may transition from computational predictions to experimental validation, with planned biochemical and structural investigations to verify the efficacy and specificity of the identified ligands in vitro. This holistic approach underscores the immense potential of computational methodologies in accelerating the discovery of novel therapeutics targeting m6A reader proteins, with significant implications for advancing our understanding of RNA epigenetics and its role in disease pathogenesis.

Supplementary Materials

The following supporting information can be downloaded at: https://www.mdpi.com/article/10.3390/app14188391/s1, Figure S1: 3D interaction plots for 15 protein-ligand complexes identified through Molecular docking process, highlighting hydrogen bonds (dashed green lines), Van der Waals interactions (light green lines), π–π stacking (magenta lines), π–σ bonding (purple lines), and other key interactions stabilizing the ligand–protein complexes; Figure S2: 2D interaction plots for 15 selected protein-ligand complexes, providing detailed insights into interactions between protein and ligands. Different colors indicate different types of bonds; Figure S3: RMSD plots of ligand and protein backbone atoms for 15 small-molecules, which are split into three plots (suffix 1–3 of plot names) for clarity. A1–A3 show the RMSDs of ligand after the protein-ligand complex being aligned according to the backbone of protein, which quantify the changes of binding poses of ligands relative to the starting poses; B1–B3 show the RMSDs of ligand after the ligand being aligned to the ligand itself, which access the conformational changes of ligands; C1–C3 show the RMSDs of protein backbone after the protein being aligned with respect to its backbone, which evaluate the conformational changes of protein backbone; Figure S4: RMSD plots of protein (black) and ligand (red) for 11 known inhibitors from an experimental study. Black lines show the RMSDs of protein (all atoms of the protein) after the protein being aligned with respect to itself, which evaluate the conformational changes of protein; Red lines show the RMSDs of ligand after the ligand being aligned to the ligand itself, which access the conformational changes of ligands. The RMSDs of some ligands (such as 6T0D, 6T06 and 6T0A) fluctuates between two values, suggesting frequent transitions between two stable conformations. Since the RMSDs are as low as 0.1–0.15, these molecules can be considered to be stable; Figure S5: Distances between the center of mass (COM) of the protein and the COM of the ligand during the 100-ns simulations for the top five compounds ranked by docking scores; Figure S6: Distances between the center of mass (COM) of the protein and the COM of the ligand during the 100-ns simulations for all the 15 compounds; Figure S7: The ligand 6MZ is docked into active site by GeomX mode (docked pose in purple color for carbon atoms); Figure S8: Detailed molecular structures of the top-ranked ligands identified as potential YTHDC1 inhibitors; Figure S9: pKa of titratable residues predicted by H++ (orange) and DelPhiPKa (blue) servers. The protonation states for titratable residues of ARG, LYS, GLU, ASP and HIS were thus determined to be in their default protonation state; Table S1: 1500 small-molecules, from eMolecules, sorted with docking scores using Autodock Vina; Table S2: ADMET profiling results of top 5 small-molecules. Absorption, distribution, metabolism, extinction, and toxicity parameters are highlighted with blue, light gray, green, gold, and orange colors, respectively. * Stands for ZINC; Table S3: MM/PBSA analysis of top 15 compounds are listed below; Table S4: Composition of the simulated systems for the selected 15 compounds, which includes the number of atoms of the YTHDC1 protein (receptor atoms), the number of atoms of the ligands (ligand atoms), the number of water molecule and the number of salt ions in each simulation box.

Author Contributions

Conceptualization, W.L. and N.S.; methodology, M.A. and N.S.; software, M.A. and N.S; validation, M.A. and N.S; formal analysis, X.W. and W.L.; investigation, N.S., W.L. and X.W.; resources, W.L.; data curation, N.S. and M.A.; writing—original draft preparation, M.A. and N.S.; writing—review and editing, M.A., X.W. and W.L.; visualization, M.A. and N.S.; supervision, W.L.; project administration, W.L.; funding acquisition, W.L. All authors have read and agreed to the published version of the manuscript.

Funding

This work was supported by the Shenzhen Science and Technology Innovation Commission (Grant No. 20220809164213001) and the Natural Science Foundation of Guangdong Province, China (Grant Nos. 2023A1515010471 and 2020A1515010984).

Institutional Review Board Statement

Not applicable.

Informed Consent Statement

Not applicable.

Data Availability Statement

The data presented in this study are available in article and Supplementary Materials, further inquiries can be directed to the corresponding author.

Acknowledgments

We thank Mehreen Gul for technical support in data analysis.

Conflicts of Interest

The authors declare no conflicts of interest.

References

  1. Deng, L.J.; Deng, W.Q.; Fan, S.R.; Chen, M.F.; Qi, M.; Lyu, W.Y.; Qi, Q.; Tiwari, A.K.; Chen, J.-X.; Zhang, D.-M.; et al. m6A modification: Recent advances, anticancer targeted drug discovery and beyond. Mol. Cancer 2022, 21, 52. [Google Scholar] [CrossRef] [PubMed]
  2. He, C. Grand challenge commentary: RNA Epigenetics? Nat. Chem. Biol. 2010, 6, 863–865. [Google Scholar] [CrossRef] [PubMed]
  3. Saletore, Y.; Meyer, K.; Korlach, J.; Vilfan, I.D.; Jaffrey, S.; Mason, C.E. The birth of the Epitranscriptome: Deciphering the function of RNA Modifications. Genome Biol. 2012, 13, 175. [Google Scholar] [CrossRef] [PubMed]
  4. Desrosiers, R.; Friderici, K.; Rottman, F. Identification of methylated nucleosides in messenger RNA from Novikoff hepatoma cells. Proc. Natl. Acad. Sci. USA 1974, 71, 3971–3975. [Google Scholar] [CrossRef] [PubMed]
  5. Dominissini, D.; Moshitch-Moshkovitz, S.; Schwartz, S.; Salmon-Divon, M.; Ungar, L.; Osenberg, S.; Cesarkas, K.; Jacob-Hirsch, J.; Amariglio, N.; Kupiec, M.; et al. Topology of the human and mouse m6A RNA methylomes revealed by m6A-seq. Nature 2012, 485, 201–206. [Google Scholar] [CrossRef]
  6. Fu, Y.; Dominissini, D.; Rechavi, G.; He, C. Gene expression regulation mediated through reversible m6A RNA methylation. Nat. Rev. Genet. 2014, 15, 293–306. [Google Scholar] [CrossRef]
  7. Liu, N.; Pan, T. N6-methyladenosine-encoded epitranscriptomics. Nat. Struct. Mol. Biol. 2016, 23, 98–102. [Google Scholar] [CrossRef]
  8. Shi, H.; Wei, J.; He, C. Where, when, and how: Context-dependent functions of rna methylation writers, readers, and erasers. Mol. Cell 2019, 74, 640–650. [Google Scholar] [CrossRef]
  9. Yang, Y.; Hsu, P.J.; Chen, Y.S.; Yang, Y.G. Dynamic transcriptomic m(6)A decoration: Writers, erasers, readers and functions in RNA metabolism. Cell Res. 2018, 28, 616–624. [Google Scholar] [CrossRef]
  10. Zhao, B.S.; Roundtree, I.A.; He, C. Post-transcriptional gene regulation by mRNA modifications. Nat. Rev. Mol. Cell Biol. 2017, 18, 31–42. [Google Scholar] [CrossRef]
  11. Widagdo, J.; Anggono, V. The m6A-epitranscriptomic signature in neurobiology: From neurodevelopment to brain plasticity. J. Neurochem. 2018, 147, 137–152. [Google Scholar] [CrossRef]
  12. Zhou, J.; Wan, J.; Gao, X.W.; Zhang, X.Q.; Jaffrey, S.R.; Qian, S.B. Dynamic m6A mRNA methylation directs translational control of heat shock response. Nature 2015, 526, 591–594. [Google Scholar] [CrossRef] [PubMed]
  13. Liu, J.; Do, X.Y.; Chen, C.Y.; Chen, C.; Liu, C.; Xu, M.M.; Zhao, S.Q.; Shen, S.; Gao, Y.W.; Han, D.L.; et al. N6-methyladenosine of chromosome-associated regulatory RNA regulates chromatin state and transcription. Science 2020, 367, 580–586. [Google Scholar] [CrossRef] [PubMed]
  14. Tsai, K.; Bogerd, H.P.; Kennedy, E.W.; Emery, A.; Swanstrom, R.; Cullen, B.R. Epitranscriptomic addition of m6A regulates HIV-1 RNA stability and alternative splicing. Genes Dev. 2021, 35, 992–1004. [Google Scholar] [CrossRef] [PubMed]
  15. Winkler, R.; Gillis, E.; Lasman, L.; Safra, M.; Geula, S.; Soyris, C.; Nachshon, A.; Tai-Schmiedel, J.; Friedman, N.; Le-Trilling, V.T.; et al. m6A modification controls the innate immune response to infection by targeting type I interferons. Nat. Immunol. 2019, 20, 173–182. [Google Scholar] [CrossRef]
  16. Wang, S.; Chai, P.; Jia, R.; Jia, R. Novel insights on m6A RNA methylation in tumorigenesis: A double-edged sword. Mol. Cancer 2018, 17, 101. [Google Scholar] [CrossRef]
  17. Liu, J.Z.; Yue, N.; Han, D.L.; Wang, X.; Fu, Y.; Zhang, L.; Jia, G.F.; Yu, M.; Lu, Z.K.; Deng, X.; et al. A METTL3-METTL14 complex mediates mammalian nuclear RNA N6-adenosine, methylation. Nat. Chem. Biol. 2014, 10, 293–295. [Google Scholar] [CrossRef]
  18. Wang, T.; Kong, S.; Mei, T.; Ju, S. The potential role of RNA N6-methyladenosine in Cancer progression. Mol. Cancer 2020, 19, 88. [Google Scholar] [CrossRef]
  19. Zhao, X.; Yang, Y.; Sun, B.F.; Shi, Y.; Yang, X.; Xiao, W.; Hao, Y.J.; Ping, X.L.; Chen, Y.S.; Wang, W.J.; et al. FTO-dependent demethylation of N6-methyladenosine regulates mRNA splicing and is required for adipogenesis. Cell Res. 2014, 24, 1403–1419. [Google Scholar] [CrossRef]
  20. Xiao, W.; Adhikari, S.; Dahal, U.; Chen, Y.S.; Hao, Y.J.; Sun, B.F.; Sun, H.Y.; Li, A.; Ping, X.L.; Lai, W.Y.; et al. Nuclear m(6)A reader YTHDC1 regulates mRNA splicing. Mol. Cell 2016, 61, 507–519. [Google Scholar] [CrossRef]
  21. Spitale, R.C.; Flynn, R.A.; Zhang, Q.C.; Crisalli, P.; Lee, B.; Jung, J.W.; Kuchelmeister, H.Y.; Batista, P.J.; Torre, E.A.; Kool, E.T.; et al. Structural imprints in vivo decode RNA regulatory mechanisms. Nature 2015, 519, 486–490. [Google Scholar] [CrossRef] [PubMed]
  22. Roundtree, I.A.; Luo, G.Z.; Zhang, Z.; Wang, X.; Zhou, T.; Cui, Y.; Sha, J.; Huang, X.; Guerrero, L.; Xie, P.; et al. YTHDC1 mediates nuclear export of N6-methyladenosine methylated mRNAs. Elife 2017, 6, e31311. [Google Scholar] [CrossRef] [PubMed]
  23. Wang, X.; Zhao, B.S.; Roundtree, I.A.; Lu, Z.; Han, D.; Ma, H.; Weng, X.; Chen, K.; Shi, H.; He, C. N(6)-methyladenosine modulates messenger RNA translation efficiency. Cell 2015, 161, 1388–1399. [Google Scholar] [CrossRef]
  24. Alarcón, C.R.; Lee, H.; Goodarzi, H.; Halberg, N.; Tavazoir, S.F. N6-methyladenosine marks primary microRNAs for processing. Nature 2015, 519, 482–485. [Google Scholar] [CrossRef]
  25. Yan, H.; Zheng, L.; Cui, X.; Zheng, X.; Li, R. Roles and mechanisms of the m6A reader YTHDC1 in biological processes and diseases. Cell Death Discov. 2022, 8, 237. [Google Scholar] [CrossRef] [PubMed]
  26. Zhao, Y.C.; Shi, Y.F.; Shen, H.F.; Xie, W.X. m6A-binding proteins: The emerging crucial performers in epigenetics. J. Hematol. Oncol. 2020, 13, 35. [Google Scholar] [CrossRef]
  27. Xu, C.; Wang, X.; Liu, K.; Roundtree, I.A.; Tempel, W.; Li, Y.; Lu, Z.; He, C.; Min, J. Structural basis for selective binding of m6A RNA by the YTHDC1 YTH domain. Nat. Chem. Biol. 2014, 10, 927–929. [Google Scholar] [CrossRef] [PubMed]
  28. Xu, Y.; Zhang, W.; Shen, F.; Yang, X.; Liu, H.; Dai, S.; Sun, X.; Huang, J.; Guo, Q. YTH Domain Proteins: A Family of m6A Readers in Cancer progression. Front. Oncol. 2021, 11, 629560. [Google Scholar] [CrossRef]
  29. Rong, D.; Wu, F.; Lu, C.; Sun, G.; Shi, X.; Chen, X.; Dai, Y.; Zhong, W.; Hao, X.; Zhou, J.; et al. m6A modification of circHPS5 and hepatocellular carcinoma progression through HMGA2 expression. Mol. Ther. Nucleic Acids 2021, 26, 637–648. [Google Scholar] [CrossRef]
  30. Rao, X.; Lai, L.; Li, X.; Wang, L.; Li, A.; Yang, Q. N6-methyladenosine modification of circular RNA circ-ARL3 facilitates Hepatitis B virus-associated hepatocellular carcinoma via sponging miR-1305. IUBMB Life 2021, 73, 408–417. [Google Scholar] [CrossRef]
  31. Zhou, K.; Sun, Y.; Dong, D.; Zhao, C.; Wang, W. EMP3 negatively modulates breast cancer cell DNA replication, DNA damage repair, and stem-like properties. Cell Death Dis. 2021, 12, 844. [Google Scholar] [CrossRef] [PubMed]
  32. Shi, Y.; Lim, S.K.; Liang, Q.; Iyer, S.V.; Wang, H.Y.; Wang, Z.; Xie, X.; Sun, D.; Chen, Y.J.; Tabar, V.; et al. Gboxin is an oxidative phosphorylation inhibitor that targets glioblastoma. Nature 2019, 567, 341–346. [Google Scholar] [CrossRef] [PubMed]
  33. Liu, Z.; Wang, T.; She, Y.; Wu, K.; Gu, S.; Li, L.; Dong, C.; Chen, C.; Zhou, Y. N6-methyladenosine-modified circIGF2BP3 inhibits CD8 T-cell responses to facilitate tumor immune evasion by promoting the deubiquitination of PD-L1 in non-small cell lung cancer. Mol. Cancer 2021, 20, 105. [Google Scholar] [CrossRef] [PubMed]
  34. Cheng, Y.; Xie, W.; Pickering, B.F.; Chu, K.L.; Savino, A.M.; Yang, X.; Luo, H.; Nguyen, D.T.; Mo, S.; Barin, E.; et al. N6-Methyladenosine on mRNA facilitates a phase-separated nuclear body that suppresses myeloid leukemic differentiation. Cancer Cell 2021, 39, 958–972. [Google Scholar] [CrossRef]
  35. Ferreira, L.G.; Santos, R.N.D.; Oliva, G.; Andricopulo, A.D. Molecular docking and structure-based drug design strategies. Molecules 2015, 20, 13384–13421. [Google Scholar] [CrossRef]
  36. Singh, N.; Ying, S.-Q.; Li, W. Identification of novel inhibitors of type-I mycobacterium tuberculosis fatty acid synthase using docking-based virtual screening and molecular dynamics simulation. Appl. Sci. 2021, 11, 6977. [Google Scholar] [CrossRef]
  37. Kerrigan, J.E. Molecular dynamics simulations in drug design. In Silico Models for Drug Discovery. Methods in Molecular Biology (Methods and Protocols); Kortagere, S., Ed.; Humana Press: Totowa, NJ, USA, 2013; Volume 993, pp. 95–113. [Google Scholar]
  38. Cournia, Z.; Allen, B.K.; Beuming, T.; Pearlman, D.A.; Radak, B.K.; Sherman, W. Rigorous free energy simulations in virtual screening. J. Chem. Inf. Model 2020, 60, 4153–4169. [Google Scholar] [CrossRef]
  39. Poli, G.; Granchi, C.; Rizzolio, F.; Tuccinardi, T. Application of MM/PBSA methods in virtual screening. Molecules 2020, 25, 1971. [Google Scholar] [CrossRef]
  40. Moroz-Omori, E.V.; Huang, D.; Bedi, R.K.; Cheriyamkunnel, S.J.; Bochenkova, E.; Dolbois, A.; Rzeczkowski, M.D.; Li, Y.; Wiedmer, L.; Caflisch, A. METTL3 inhibitors for Epitranscriptomic modulation of cellular processes. ChemMedChem 2021, 16, 3035–3043. [Google Scholar] [CrossRef]
  41. Yankova, E.; Blackaby, W.; Albertella, M.; Rak, J.; De Braekeleer, E.; Tsagkogeorga, G.; Pilka, E.S.; Aspris, D.; Leggate, D.; Hendrick, A.G.; et al. Small-molecule inhibition of METTL3 as a strategy against myeloid leukaemia. Nature 2021, 593, 597–601. [Google Scholar] [CrossRef]
  42. Dolbois, A.; Bedi, R.K.; Bochenkova, E.; Müller, A.; Moroz-Omori, E.V.; Huang, D.; Caflisch, A. 1,4,9-Triazaspiro[5.5]Undecan-2-One derivatives as potent and selective METTL3 inhibitors. J. Med. Chem. 2021, 64, 12738–12760. [Google Scholar] [CrossRef] [PubMed]
  43. Bedi, R.K.; Huang, D.; Wiedmer, L.; Li, Y.; Dolbois, A.; Wojdyla, J.A.; Sharpe, M.E.; Caflisch, A.; Sledz, P. Selectively disrupting M6A-dependent protein–RNA interactions with fragments. ACS Chem. Biol. 2020, 15, 618–625. [Google Scholar] [CrossRef] [PubMed]
  44. Li, Y.; Bedi, R.K.; Nai, F.; von Roten, V.; Dolbois, A.; Zálešák, F.; Nachawati, R.; Huang, D.; Caflisch, A. Structure-based design of ligands of the M6A-RNA reader YTHDC1. Eur. J. Med. Chem. Rep. 2022, 5, 100057. [Google Scholar] [CrossRef]
  45. Li, Y.; Bedi, R.K.; Wiedmer, L.; Sun, X.; Huang, D.; Caflisch, A. Atomistic and thermodynamic analysis of N6-Methyladenosine (M6A) recognition by the reader Domain of YTHDC1. J. Chem. Theory Comput. 2021, 17, 1240–1249. [Google Scholar] [CrossRef]
  46. Zálešák, F.; Nai, F.; Herok, M.; Bochenkova, E.; Bedi, R.K.; Li, Y.; Errani, F.; Caflisch, A. Structure-based design of a potent and selective YTHDC1 ligand. J. Med. Chem. 2024, 67, 9516–9535. [Google Scholar] [CrossRef]
  47. Centore, R.C.; Charles, M.; Arora, M.; Chen, Y.; Watson, M.; Sawant, J.; Kelley, C.; Czekalska, M.; Rebmann, M.; Ghandi, M.; et al. Abstract 3231: Pharmacological inhibition of the m6A RNA reader, YTHDC1, as a novel approach to targeting biomolecular condensates in cancer. Cancer Res. 2024, 84, 3231. [Google Scholar] [CrossRef]
  48. Selberg, S.; Yu, L.Y.; Bondarenko, O.; Kankurim, E.; Seli, N.; Kovaleva, V.; Herodes, K.; Saarma, M.; Karelson, M. Small-molecule inhibitors of the RNA M6A demethylases FTO potently support the survival of dopamine neurons. Int. J. Mol. Sci. 2021, 22, 4537. [Google Scholar] [CrossRef] [PubMed]
  49. Hess, M.E.; Hess, S.; Meyer, K.D.; Verhagen, L.A.W.; Koch, L.; Brönneke, H.S.; Dietrich, M.O.; Jordan, S.D.; Saletore, Y.; Elemento, O.; et al. The Fat mass and obesity associated gene (Fto) regulates activity of the dopaminergic midbrain circuitry. Nat. Neurosci. 2013, 16, 1042–1048. [Google Scholar] [CrossRef]
  50. Zheng, G.; Cox, T.; Tribbey, L.; Wang, G.Z.; Iacoban, P.; Booher, M.E.; Gabriel, G.J.; Zhou, L.; Bae, N.; Rowles, J.; et al. Synthesis of a FTO inhibitor with anticonvulsant activity. ACS Chem. Neurosci. 2014, 5, 658–665. [Google Scholar] [CrossRef]
  51. Huang, Y.; Yan, J.; Li, Q.; Li, J.; Gong, S.; Zhou, H.; Gan, J.; Jiang, H.; Jia, G.-F.; Luo, C.; et al. Meclofenamic acid selectively inhibits FTO demethylation of M6A over ALKBH5. Nucleic Acids Res. 2015, 43, 373–384. [Google Scholar] [CrossRef]
  52. Huang, Y.; Su, R.; Sheng, Y.; Dong, L.; Dong, Z.; Xu, H.; Ni, T.; Zhang, Z.S.; Zhang, T.; Li, C.; et al. Small-molecule targeting of oncogenic FTO demethylase in acute myeloid leukemia. Cancer Cell 2019, 35, 677–691.e10. [Google Scholar] [CrossRef] [PubMed]
  53. Nai, F.; Nachawati, R.; Zálešák, F.; Wang, X.; Li, Y.; Caflisch, A. Fragment ligands of the m6A-RNA reader YTHDF2. ACS Med. Chem. Lett. 2022, 13, 1500–1509. [Google Scholar] [CrossRef] [PubMed]
  54. Trott, O.; Olson, A.J. AutoDock Vina: Improving the speed and accuracy of docking with a new scoring function, efficient optimization, and multithreading. J Comput. Chem. 2010, 31, 455–461. [Google Scholar] [CrossRef] [PubMed]
  55. Jain, A.N. Surflex:  Fully automatic flexible molecular docking using a molecular similarity-based search engine. J. Med. Chem. 2003, 46, 499–511. [Google Scholar] [CrossRef]
  56. Pettersen, E.F.; Goddard, T.D.; Huang, C.C.; Couch, G.S.; Greenblatt, D.M.; Meng, E.C.; Ferrin, T.E. UCSF Chimera—A visualization system for exploratory research and analysis. J. Comput. Chem. 2004, 25, 1605–1612. [Google Scholar] [CrossRef]
  57. BIOVIA, DS, version 22.1; Dassault Systèmes: San Diego, CA, USA, 2022.
  58. Spoel, D.V.D.; Lindahl, E.; Hess, B.; Groenhof, G.; Mark, A.E.; Berendsen, H.J.C. GROMACS: Fast, flexible, and free. J. Comput. Chem. 2005, 26, 1701–1718. [Google Scholar] [CrossRef] [PubMed]
  59. Vanommeslaeghe, K.; MacKerell, A.D. Automation of the CHARMM general force field (CGenFF) I: Bond perception and atom typing. J. Chem. Inf. Model. 2012, 52, 3144–3154. [Google Scholar] [CrossRef]
  60. Vanommeslaeghe, K.; Hatcher, E.; Acharya, C.; Kundu, S.; Zhong, S.; Shim, J.; Darian, E.; Guvench, O.; Lopes, P.; Vorobyov, I.; et al. CHARMM general force field: A force field for drug-like molecules compatible with the CHARMM all-atom additive biological force fields. J. Comput. Chem. 2010, 31, 671–690. [Google Scholar] [CrossRef]
  61. Anandakrishnan, R.; Aguilar, B.; Onufriev, A.V. H++ 3.0: Automating pK prediction and the preparation of biomolecular structures for atomistic molecular modeling and simulation. Nucleic Acids Res. 2012, 40, W537–W541. [Google Scholar] [CrossRef]
  62. Wang, L.; Zhang, M.; Alexov, E. DelPhiPKa web server: Predicting pKa of proteins, RNAs and DNAs. Bioinformatics 2015, 32, 614–615. [Google Scholar] [CrossRef]
  63. Mark, P.; Nilsson, L. Structure and dynamics of the TIP3P, SPC, and SPC/E Water models at 298 K. J. Phys. Chem. A 2001, 105, 9954–9960. [Google Scholar] [CrossRef]
  64. Parrinello, M.; Rahman, A. Polymorphic transitions in single crystals: A new molecular dynamics method. J. App. Phy. 1981, 52, 7182–7190. [Google Scholar] [CrossRef]
  65. Bussi, G.; Donadio, D.; Parrinello, M. Canonical sampling through velocity rescaling. J. Chem. Phys. 2007, 126, 014101. [Google Scholar] [CrossRef]
  66. Darden, T.; York, D.; Pedersen, L. Particle mesh Ewald: An N⋅log(N) method for Ewald sums in large systems. J. Chem. Phys. 1993, 98, 10089–10092. [Google Scholar] [CrossRef]
  67. Steinbach, P.J.; Brooks, B.R. New spherical-cutoff methods for long-range forces in macromolecular simulation. J. Comput. Chem. 1994, 15, 667–683. [Google Scholar] [CrossRef]
  68. Halgren, H.T. Merck molecular force field. I. Basis, form, scope, parameterization, and performance of MMFF94. J. Comput. Chem. 1996, 17, 490–519. [Google Scholar] [CrossRef]
  69. Frisch, M.J.; Trucks, G.W.; Schlegel, H.B.; Scuseria, G.E.; Robb, M.A.; Cheeseman, J.R.; Scalmani, G.; Barone, V.P.; Mennucci, B.; Petersson, G.A.; et al. Gaussian 09, Revision C.01; Gaussian, Inc.: Wallingford, CT, USA, 2016. [Google Scholar]
  70. Bayly, C.I.; Cieplak, P.; Cornell, W.; Kollman, P.A. A well-behaved electrostatic potential based method using charge restraints for deriving atomic charges: The RESP model. J. Phys. Chem. 1993, 97, 10269–10280. [Google Scholar] [CrossRef]
  71. Case, D.A.; Cheatham, T.E., III; Darden, T.; Gohlke, H.; Luo, R.; Merz, K.M., Jr.; Onufriev, A.; Simmerling, C.; Wang, B.; Woods, R. The Amber biomolecular simulation programs. J. Comput. Chem. 2005, 26, 1668–1688. [Google Scholar] [CrossRef]
  72. Maier, J.A.; Martinez, C.; Kasavajhala, K.; Wickstrom, L.; Hauser, K.E.; Simmerling, C. ff14SB: Improving the accuracy of protein side chain and backbone parameters from ff99SB. J. Chem. Theory Comput. 2015, 11, 3696–3713. [Google Scholar] [CrossRef]
  73. Xu, L.; Sun, H.; Li, Y.; Wang, J.; Hou, T. Assessing the performance of MM/PBSA and MM/GBSA methods. 3. The impact of force fields and ligand charge models. J. Phys. Chem. 2013, 117, 8408–8421. [Google Scholar] [CrossRef]
  74. Evans, D.J.; Holian, B.L. The Nose-Hoover thermostat. J. Chem. Phys. 1985, 83, 4069–4074. [Google Scholar] [CrossRef]
  75. Yunta, M.J.R. Docking and ligand binding affinity: Uses and pitfalls. Am. J. Model. Opt. 2016, 4, 74–114. [Google Scholar] [CrossRef]
  76. Hou, T.; Wang, J.; Li, Y.; Wang, W. Assessing the performance of the molecular mechanics/Poisson Boltzmann surface area and molecular mechanics/generalized Born surface area methods. II. The accuracy of ranking poses generated from docking. J. Comput. Chem. 2011, 32, 866–877. [Google Scholar] [CrossRef] [PubMed]
  77. Kumari, R.; Kumar, R.; Consertium, O.S.D.D.; Lynn, A. g_mmpbsa—A GROMACS tool for high-throughput MM/PBSA calculations. J. Chem. Inf. Model. 2014, 54, 1951–1962. [Google Scholar] [CrossRef]
  78. Wright, D.W.; Hall, B.A.; Kenway, O.A.; Jha, S.; Coveney, P.V. Computing clinically relevant binding free energies of HIV-1 protease inhibitors. J. Chem. Theory Comput. 2014, 10, 1228–1241. [Google Scholar] [CrossRef]
  79. Su, M.; Yang, Q.; Du, Y.; Feng, G.; Liu, Z.; Li, Y.; Wang, R. Comparative assessment of scoring functions: The CASF-2016 update. J. Chem. Inf. Model. 2019, 59, 895–913. [Google Scholar] [CrossRef]
  80. Singh, N.; Li, W. Absolute binding free energy calculations for highly flexible protein MDM2 and its inhibitors. Int. J. Mol. Sci. 2020, 21, 4765. [Google Scholar] [CrossRef]
  81. Jorgensen, W.L. Efficient drug lead discovery and optimization. Acc. Chem. Res. 2009, 42, 724–733. [Google Scholar] [CrossRef]
Figure 1. Flow chart for a comprehensive structure-based virtual screening method using molecular docking approach, MD simulations, MM/PBSA analysis, and ADMET profiling.
Applsci 14 08391 g001
Figure 2. (A) The critical amino acids that recognize m6A are labeled in black. The methylated residue (6MZ) is shown in Licorice representation with carbon atoms in orange, nitrogen atoms in blue, and oxygen atoms in red. PDB accession code 4R3I has been used to generate the figures. (B) Structural comparison between apo-state YTHDC1 (2YUD) and YTHDC1 in the complex with 6MZ (4R3I).
Applsci 14 08391 g002
Figure 3. (AE) The 3D surface structure with 3D and 2D interactions for the top five small molecules (ZINC65274016, ZINC82121447, ZINC02412146, ZINC12780673, and ZINC64755558) identified as potential inhibitors of the YTHDC1 protein.
Applsci 14 08391 g003
Figure 4. RMSD analysis of MD simulation trajectories: (Top) The RMSDs of a ligand after the protein–ligand complex being aligned according to the backbone of the protein via a least square (lsq) fitting, which quantifies the changes that the binding poses of ligands relative to the starting poses. The lower deviations patterns highlight the dynamic stability of each ligand except ZINC82121447. (Middle) The graph is the RMSDs of a ligand after the ligand being aligned to the ligand itself, which accesses the conformational changes of ligands and provides insights into the dynamic behavior of the ligands. The relatively lower values highlight the structural stability with moderate flexibility over the simulation period. (Bottom) The plot shows the RMSDs of a protein backbone after the protein being aligned with respect to its backbone, which evaluate the conformational changes of the protein backbone. The lower values indicate the protein structures are quite stable except ZINC82121447.
Applsci 14 08391 g004
Figure 5. Correlation between experimental IC50 values and ∆GMM/PBSA. r and ρ represent the Pearson correlation coefficient and Spearman’s rank correlation coefficient, respectively.
Applsci 14 08391 g005
Table 1. Binding affinities of the studied small molecules with the target protein (See Figure S8 for the structures of the listed molecules).
NoMoleculeHydrogen Bonds Autodock Score (kcal/mol)GeomX Score (kcal/mol)Hydrogen Bonding Residues
1ZINC652740164−10.77−10.94Asn367, Ser378, Asn363, Arg475
2ZINC821214472−9.13−10.20Ser378, Asp476
3ZINC024121462−8.95−10.27Asn363, Arg475
4ZINC127806733−8.90−9.87Asn367, Ser378, Arg475
5ZINC647555584−8.90−10.16Asn367, Ser378, Asn363, Asp476
6ZINC008071174−8.73−9.84Asn367, Ser378, Asn363, Arg475
7ZINC915267634−8.44−10.21Asn367, Asn363, Ser378, Asp476
8ZINC013306112−8.43−9.94Asn367, Asn363
9ZINC021705522−8.25−9.38Asn367, Asn363
10ZINC067645613−8.23−9.77Asn367, Asn363, Ser378
11ZINC107638623−8.10−10.12Asn367, Ser378, Lys361
12ZINC677269264−8.07−9.6Asn367, Asn363, Ser378, Asp476
13ZINC653841504−7.89−10.29Asn367, Asn363, Ser378, Asp476
14ZINC583412633−7.87−11.03Asn367, Ser378, Arg475
15ZINC679819803−7.56−10.24Asn363, Asn367, Ser378
Table 2. MM/PBSA-based binding free energies (in kJ/mol) with various energy components. Standard errors of the means are shown in parentheses. IC50 is in the unit of μM.
PDB IDEvdWEelecGpbGnpGbindIC50
6T10−100.6 (0.6)−56.3 (1.9)121.5 (2.0)−12.1 (0.1)−47.4 (1.5)348
6T11−103.6 (0.7)−84.4 (1.8)149.7 (1.6)−11.1 (0.0)−49.4 (1.3)402
6T12−116.6 (0.6)−67.6 (1.6)137.7 (1.9)−12.6 (0.1)−59.2 (1.3)825
6T01−121.9 (0.7)−62.0 (1.7)123.6 (1.3)−12.2 (0.0)−72.4 (1.3)2057
6T060.0 (0.0)−0.1 (0.0)−9.8 (4.8)0.0 (0.2)−9.9 (5.0)2010
6T0A−22.0 (2.5)−12.9 (1.9)28.2 (3.6)−2.8 (0.3)−9.5 (2.8)2040
6T0C−101.3 (0.6)−49.9 (1.9)132.1 (1.7)−10.8 (0.0)−30.0 (1.4)155
6T0D−109.7 (0.8)−72.0 (1.4)133.4 (1.4)−11.7 (0.1)−60.1 (1.4)391
6SZ7−1.3 (0.5)−0.8 (0.5)1.1 (2.6)−0.3 (0.1)−1.2 (2.5)1615
6SZT−134.4 (0.7)−56.5 (2.6)141.1 (2.4)−12.8 (0.0)−62.5 (1.4)1926
6SZX−149.4 (1.0)−56.8 (1.8)146.5 (1.9)−14.3 (0.1)−74.1 (1.2)228
Table 3. MM/PBSA calculated binding free energies of the compounds. The uncertainty is measured with a standard deviation.
No.Compound IDBinding Energy (kJ/mol)
1ZINC82121447−114.03 ± 10.8
2ZINC02170552−83.26 ± 20.4
3ZINC65274016−75.24 ± 8.4
4ZINC10763862−73.36 ± 8.4
5ZINC02412146−67.71 ± 9.4
6ZINC12780673−67.54 ± 3.4
7ZINC65384150−66.7 ± 20.2
8ZINC00807117−66.6 ± 9.8
9ZINC01330611−64.4 ± 10.1
10ZINC06764561−63.8 ± 17.6
11ZINC64755558−63.7 ± 31.1
12ZINC67726926−63.07 ± 28.8
13ZINC67981980−38.6 ± 8.9
14ZINC58341263−18.1 ± 26.5
15ZINC91526763−9.99 ± 72.6
Table 4. MM/PBSA results for the considered putative hits. Listed energies are in kJ/mol. The uncertainty is measured with a standard deviation.
CompoundEvdWEelecGpbGnpGbind
ZINC82121447−92.04 ± 6.8 6−872.1 ± 1.3 863.04 ± 8.2−12.9 ± 0.2 −114.03 ± 10.8
ZINC02170552−132.7 ± 3.1218.7 ± 11.1 −153.5 ± 16.9 −15.71 ± 0.1 −83.2 ± 20.4
ZINC65274016−165.36 ± 3.9 −59.02 ± 5.2 165.36 ± 0.62−16.17 ± 0.08 −75.24 ± 8.4
ZINC10763862−168.37 ± 6.5 −121.9 ± 5.8 233.28 ± 4.7 −16.26 ± 0.3−73.35 ± 8.4
ZINC02412146−158.42 ± 6.1 −50.07 ± 3.4 157.87 ± 6.3 −17.09 ± 0.2−67.72 ± 9.4
6MZ−137.79 ± 14.1−72.43 ± 35.3190.8 ± 43.815.31 ± 1.0−34.75 ± 16.4
Table 5. ADMET profiling results of the top five small molecules.
LigandLogPSurface AreaAbsorptionDistributionMetabolismExcretionToxicity
Water SolubilityCaco-2 PermeabilityIntestinal AbsorptionFraction UnboundBBB PermeabilityCNS PermeabilityCYP2D6 SubstrateCYP2D6 InhibitorTotal ClearanceAMES ToxicityHepatoxicitySkin Sensitization
011.52155.18−3.0750.36365.090.186−1.569−3.284NoNo0.442NoYesNo
021.94130.964−3.321.31298.7850.1630.369−3.001NoNo0.507YesYesNo
034.16167.32−4.9090.68790.420.07−0.283−2.289NoNo1.106NoYesNo
043.27154.98−4.4561.25590.190−0.502−2.584NoNo0.257YesYesNo
051.89143.24−3.1860.18273.460.319−0.936−3.442NoNo−0.296NoNoNo
01: ZINC82121447, 02: ZINC02170552, 03: ZINC65274016, 04: ZINC10763862, 05: ZINC02412146.
Disclaimer/Publisher’s Note: The statements, opinions and data contained in all publications are solely those of the individual author(s) and contributor(s) and not of MDPI and/or the editor(s). MDPI and/or the editor(s) disclaim responsibility for any injury to people or property resulting from any ideas, methods, instructions or products referred to in the content.

