
The Identification and Influence Factor Analysis of Landslides Using SBAS-InSAR Technique: A Case Study of Hongya Village, China

Abstract
:1. Introduction
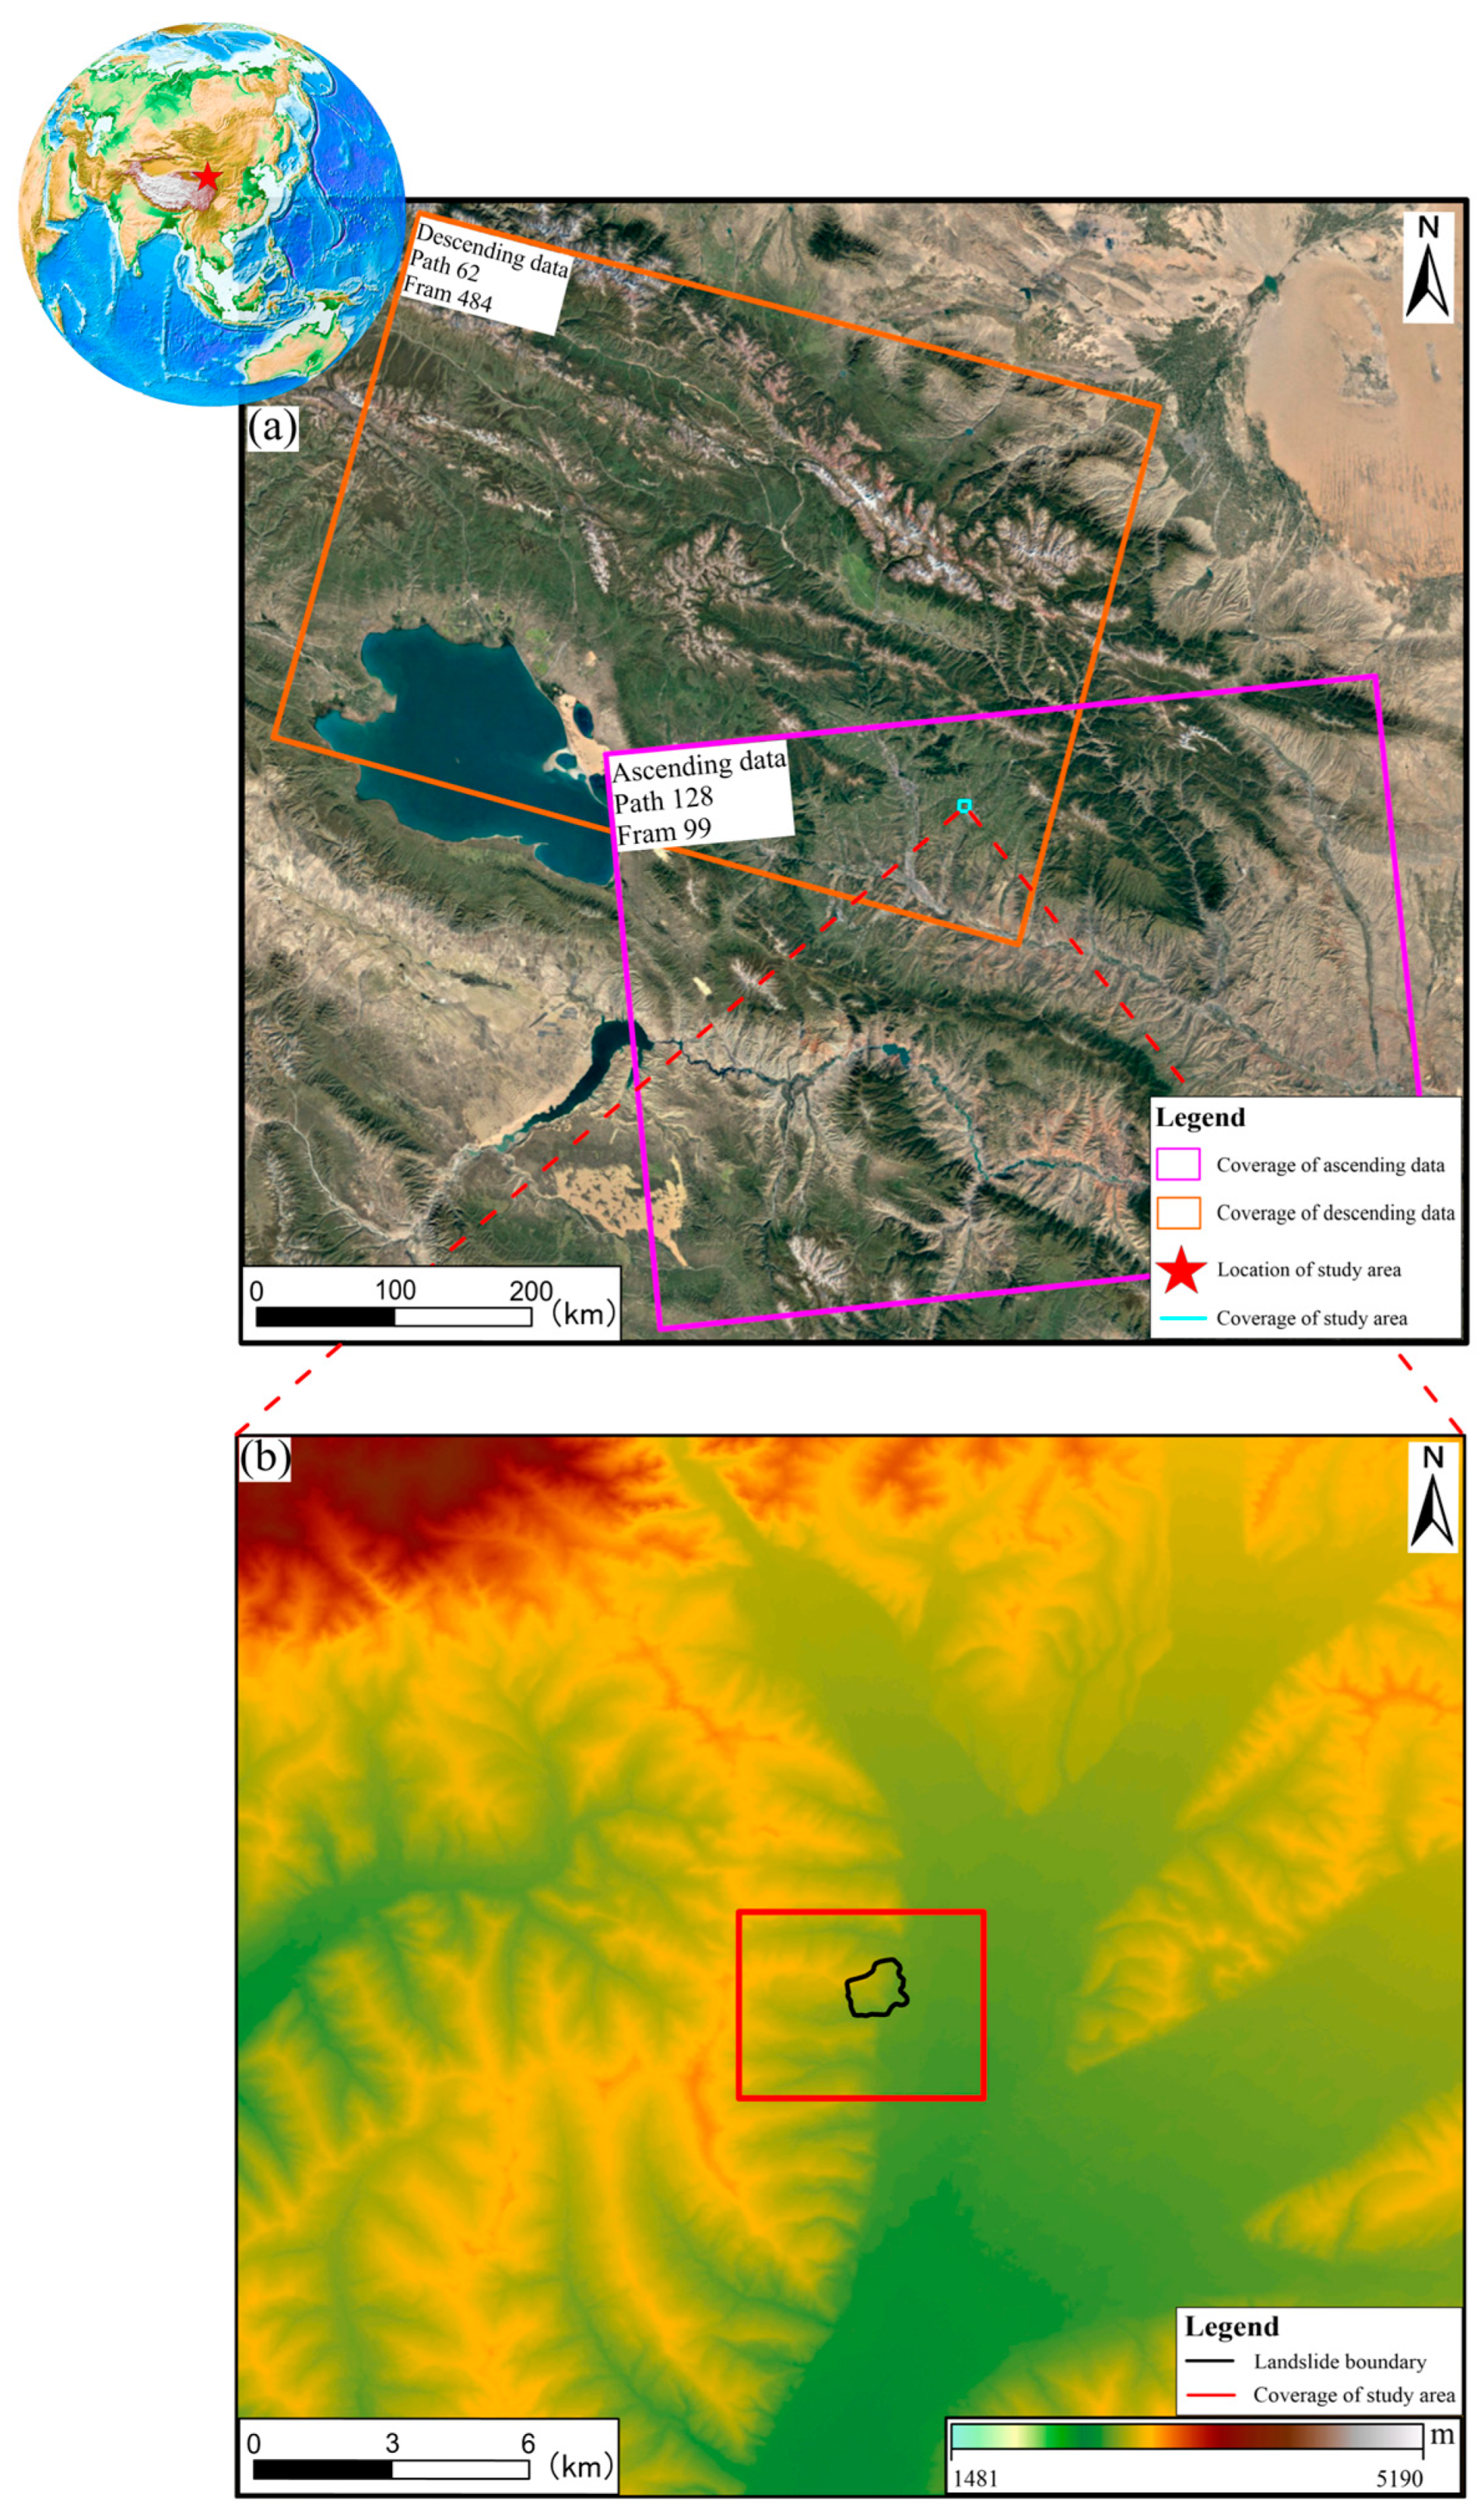
2. Study Area
3. Methodology
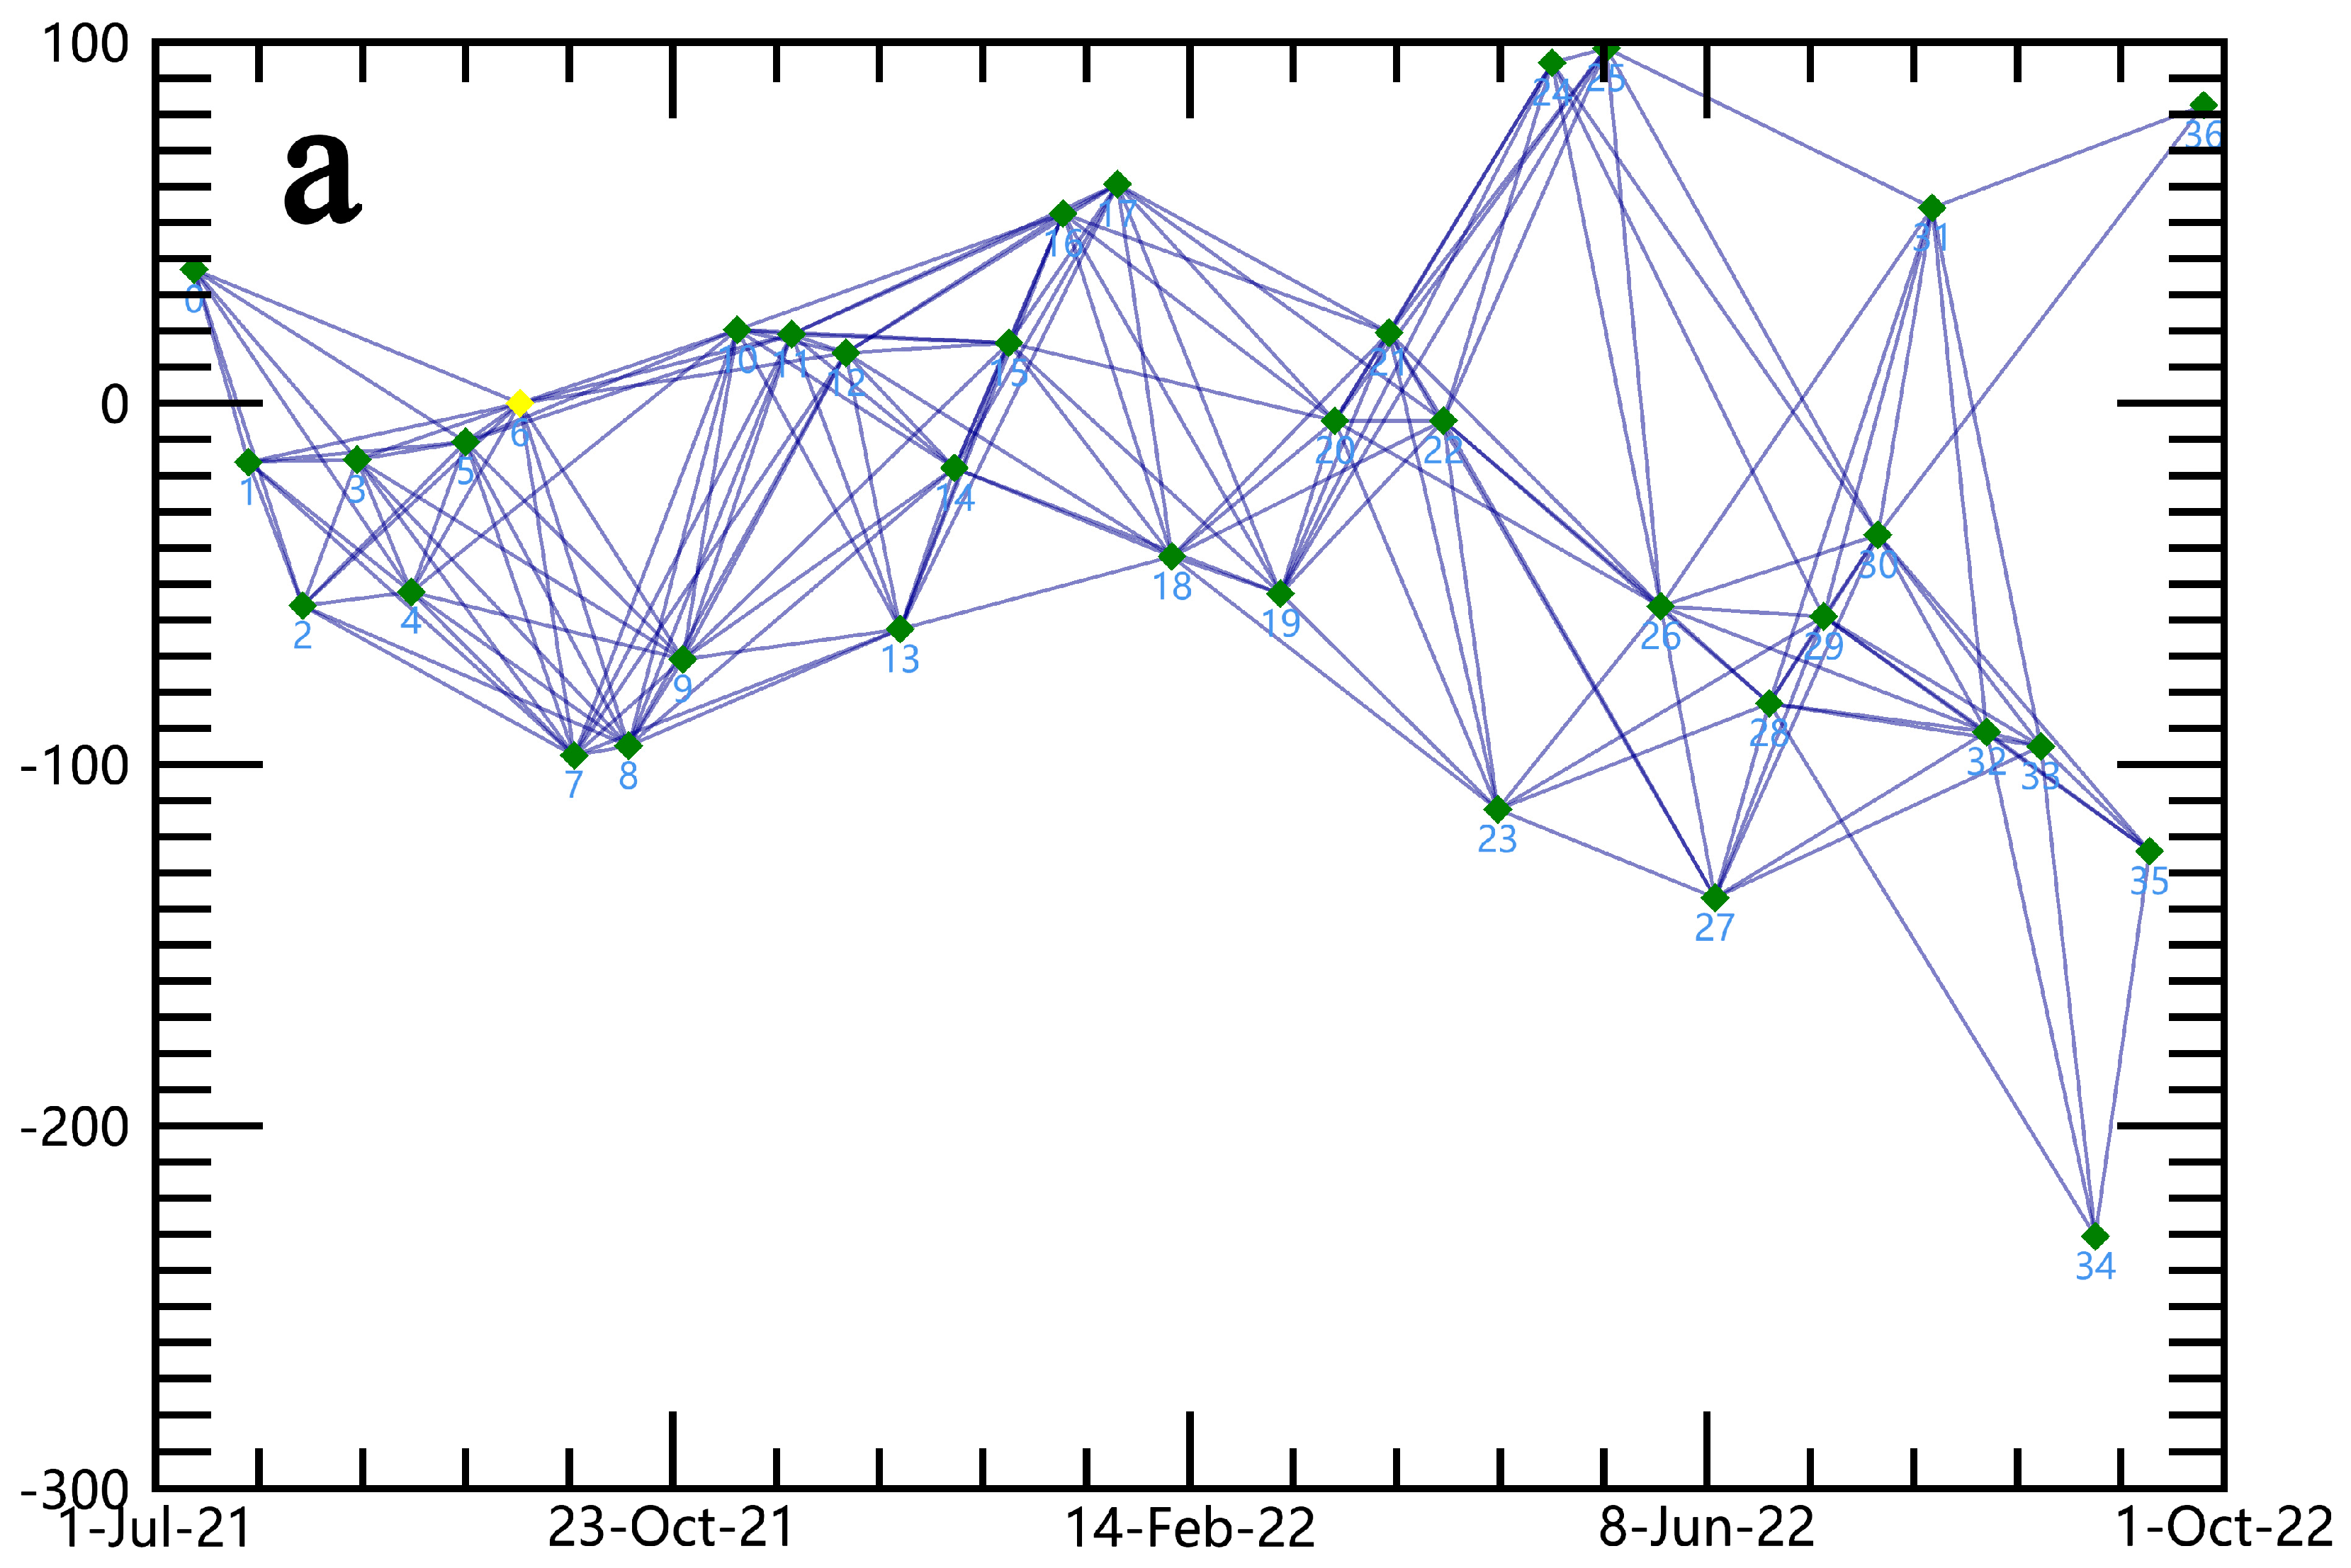
3.1. Data
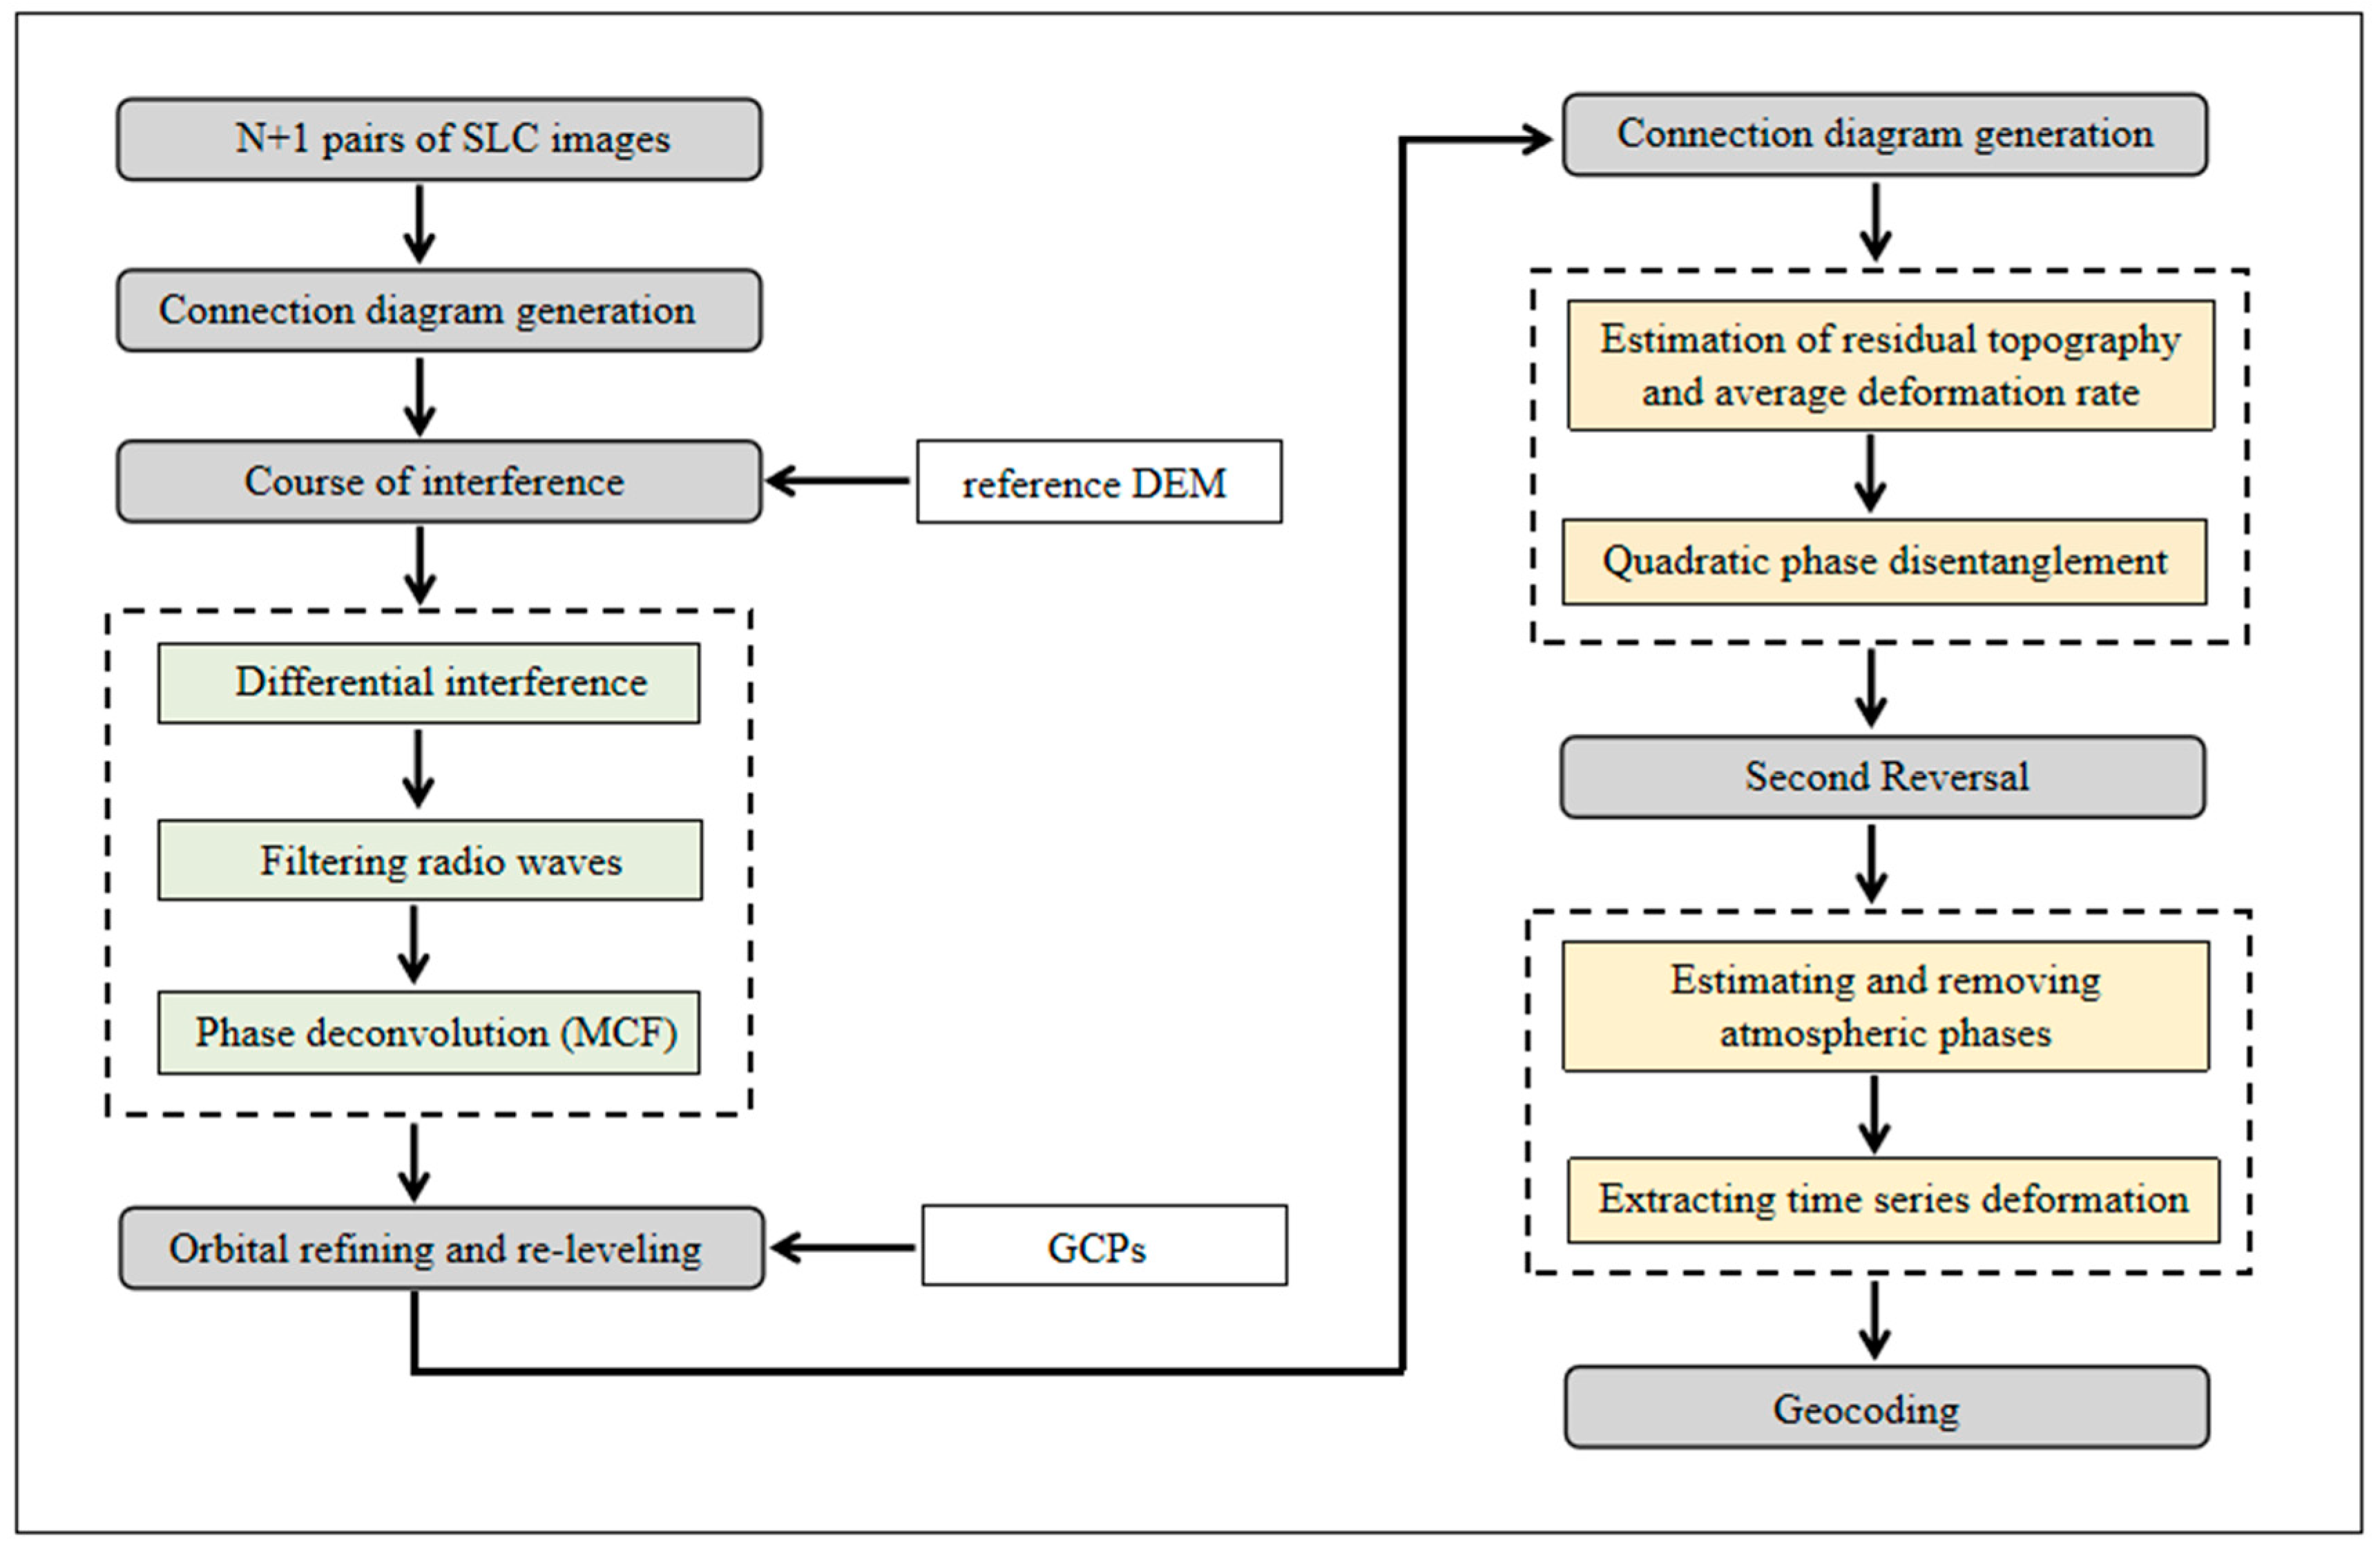
3.2. Methodological Procedure
- (1)
- SAR images of the same region arranged chronologically were obtained. One image was selected as the reference for alignment. The remaining SAR imagery were aligned to the reference image by setting suitable temporal and spatial baseline thresholds, and we generated up to interferometric pairs of the SAR images.
- (2)
- The combined image pairs were subjected to differential interferometry to generate time-series interferograms of multiple primary images. The interferometric phase composition is described as follows:
- (3)
- Ground control points (GCPs) were selected for orbital refinement and re-deplatforming to correct the orbital parameters, and to estimate and remove residual phases and phase changes.
- (4)
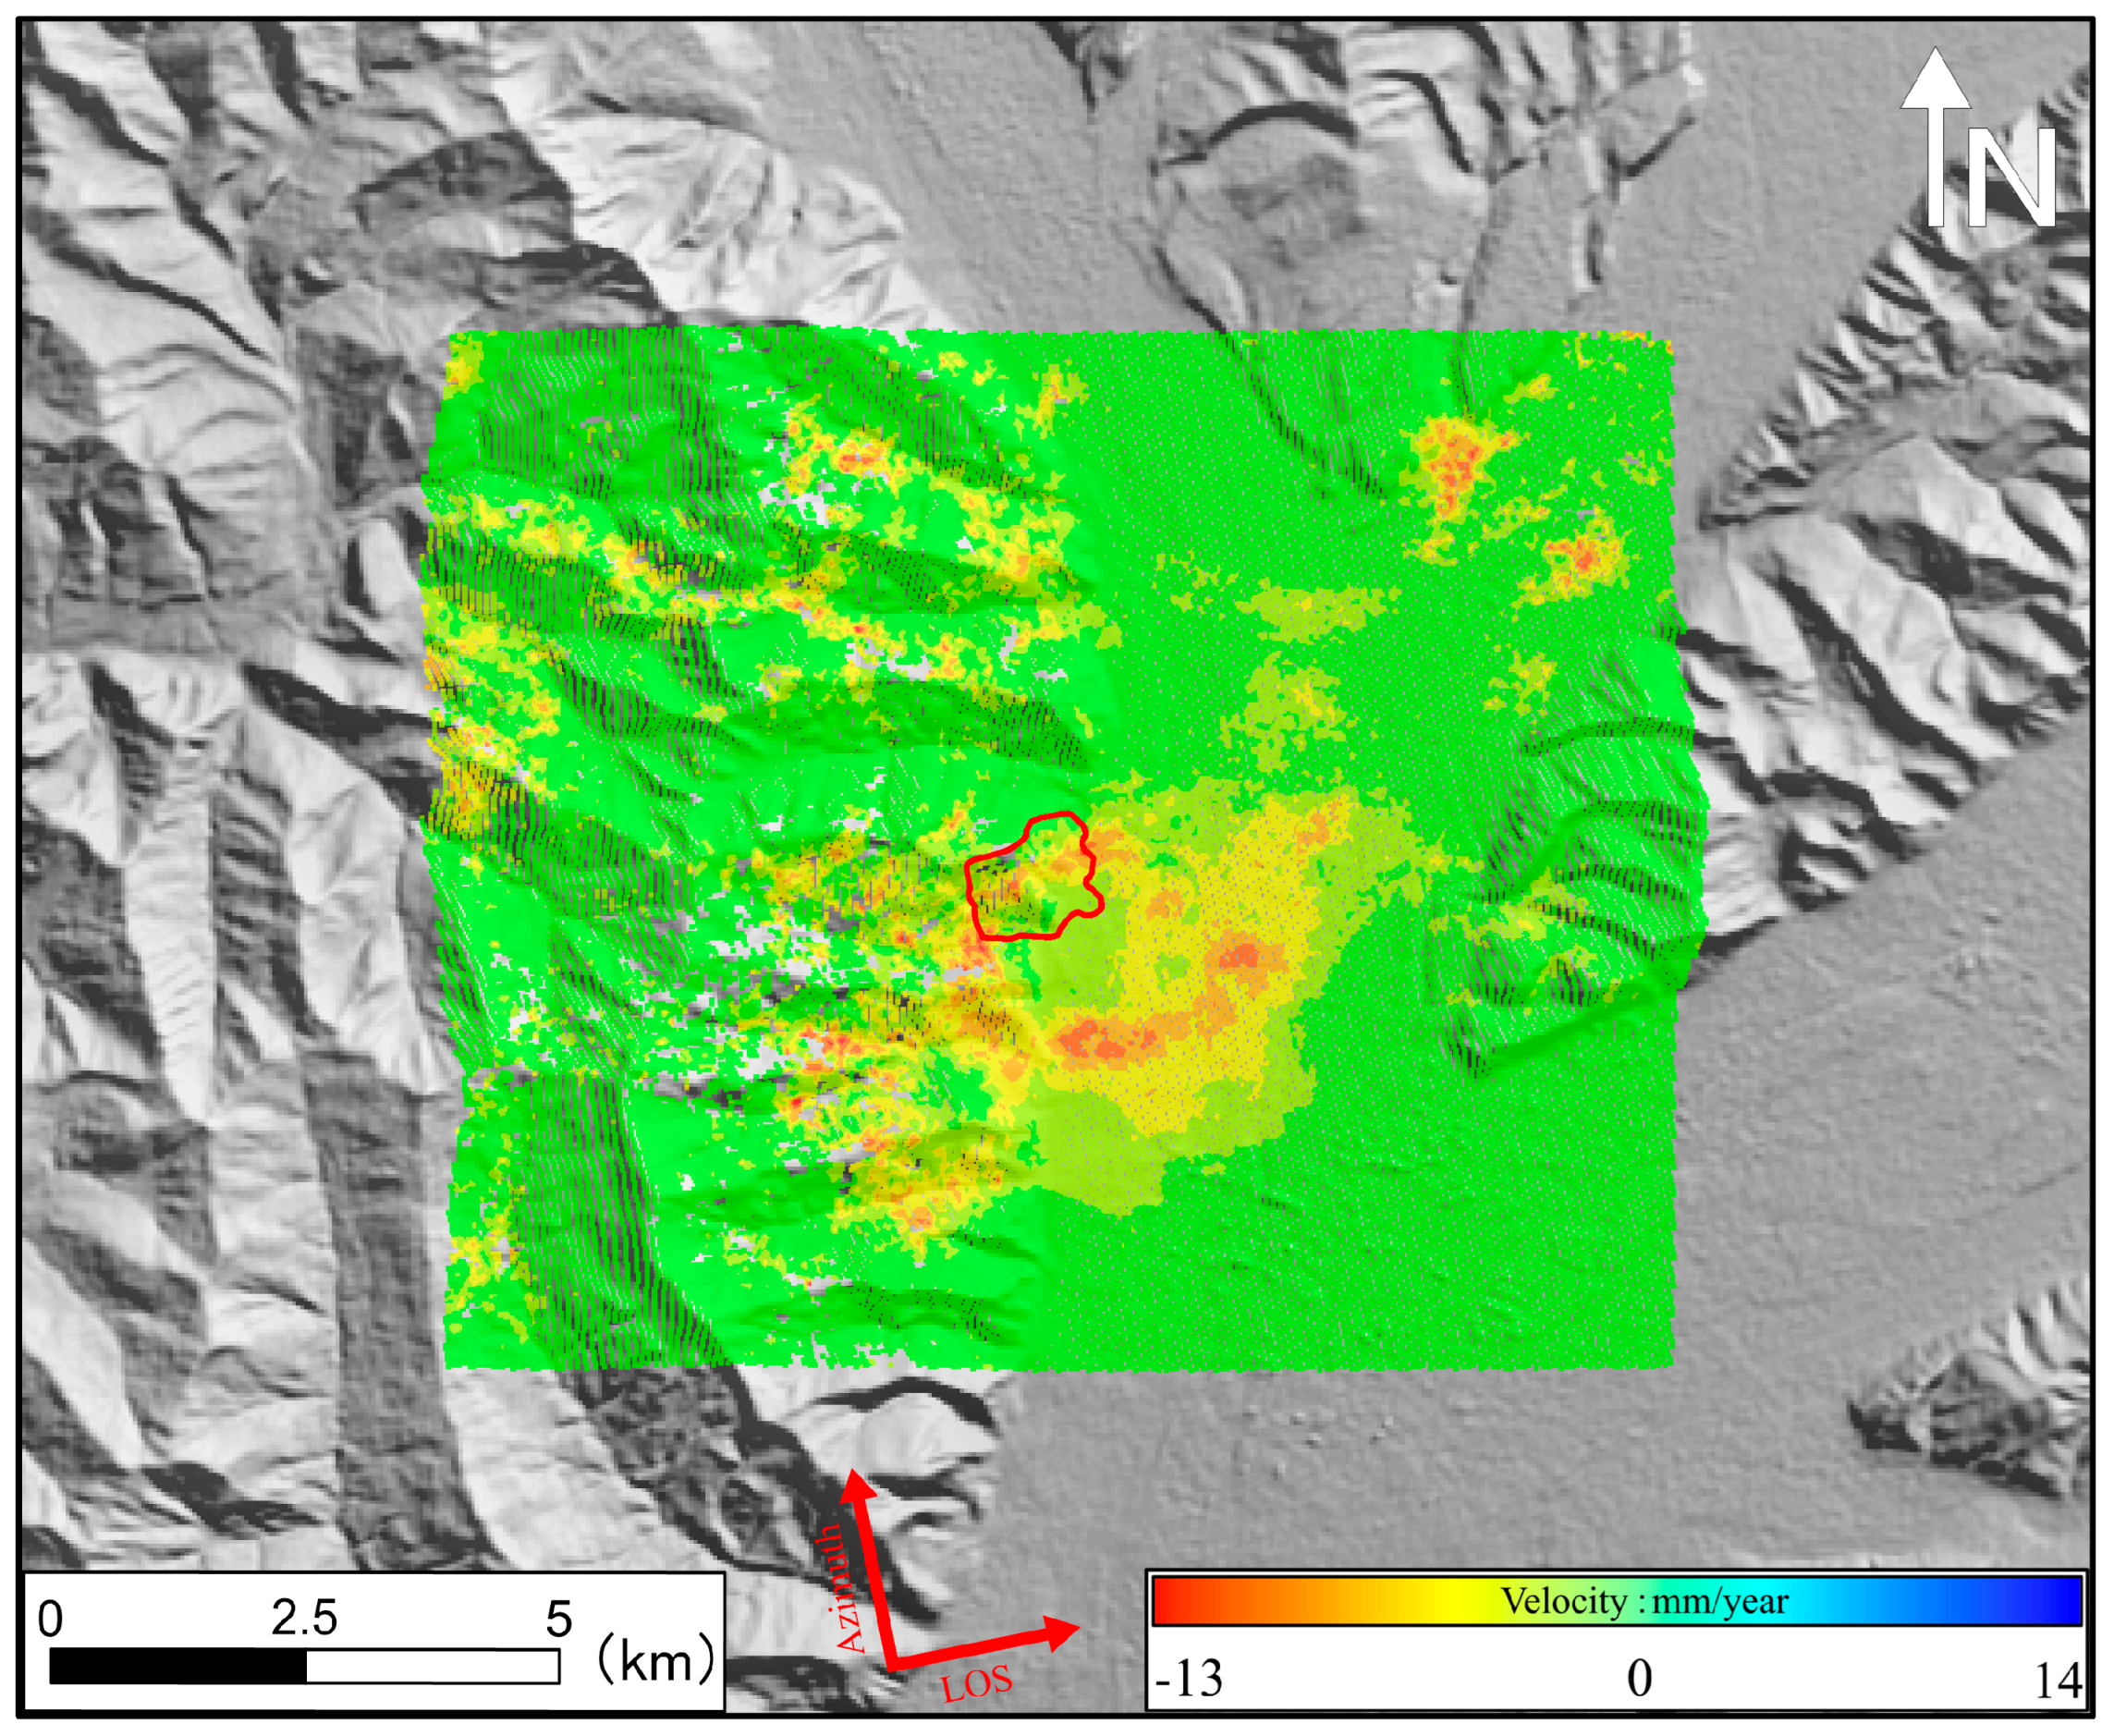
- Based on a linear model, the residual elevation and deformation rates were estimated first. Unwrapped phases underwent secondary unwrapping, followed by spatial high-pass filtering and temporal low-pass filtering to remove atmospheric phases. This process inversely deduces the temporal deformation sequences and average deformation rates. Finally, geographic encoding was performed to obtain the temporal deformation sequences and average deformation rates in geographic coordinates.
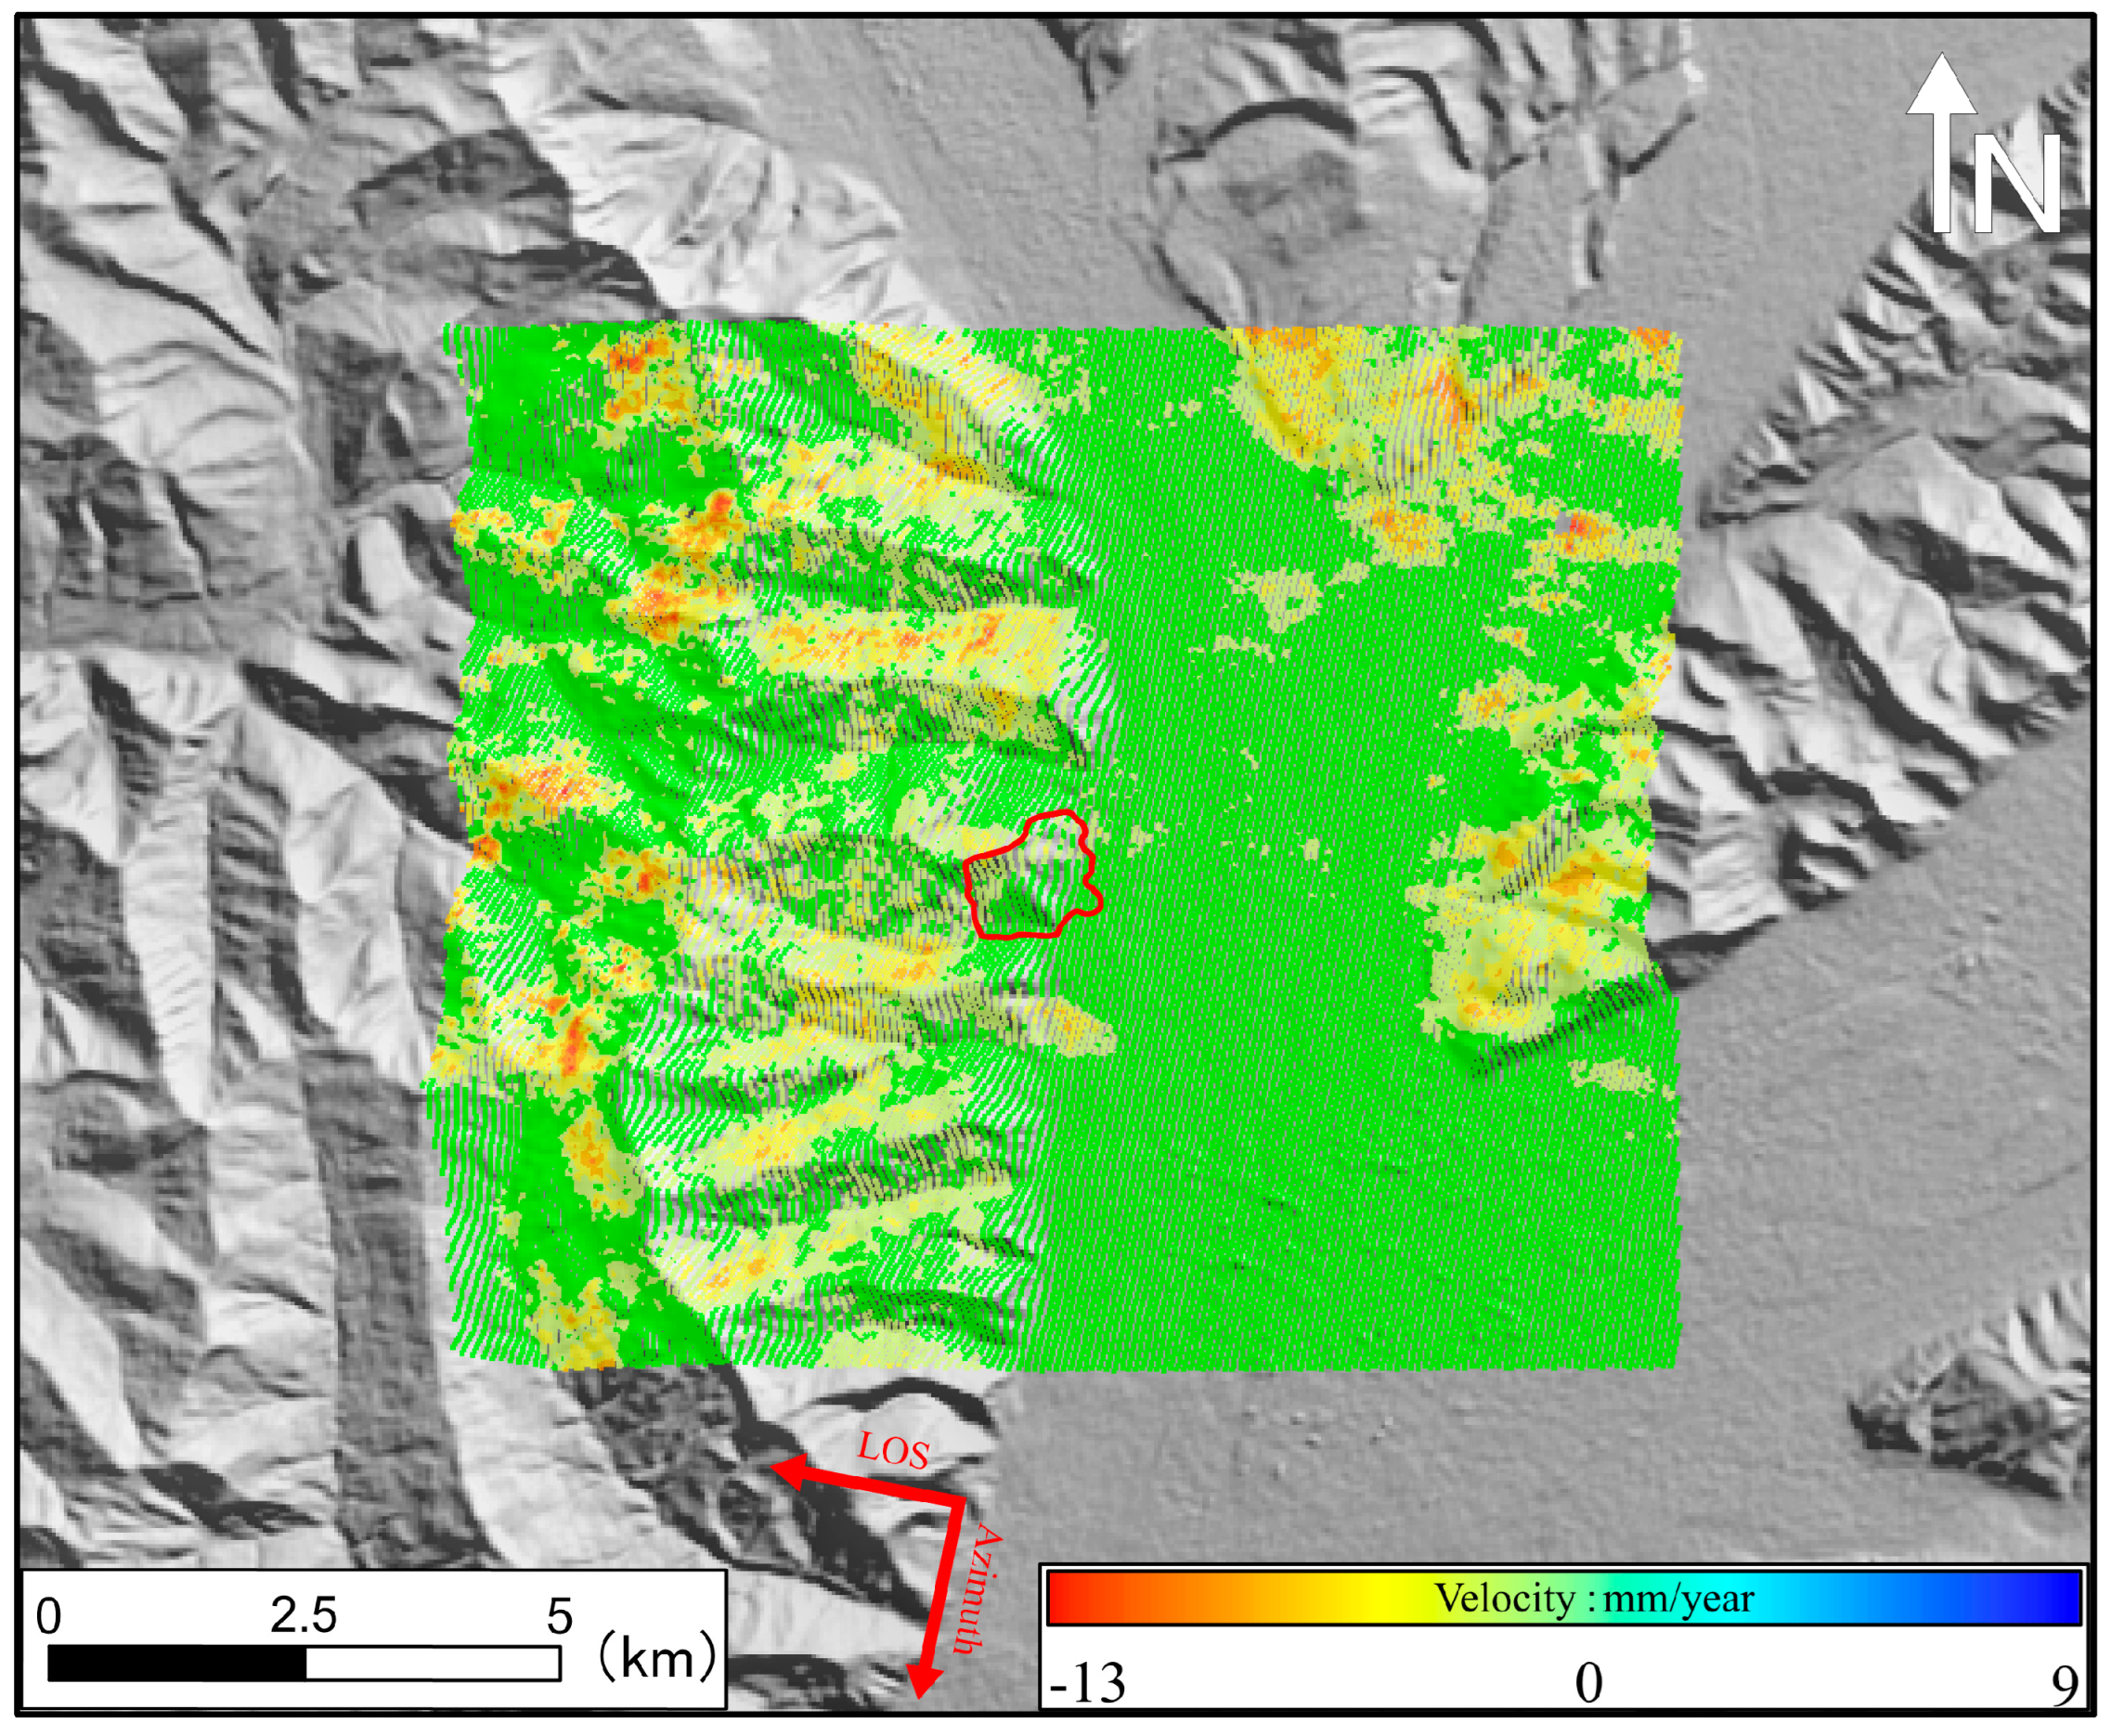
4. Results
5. Discussion
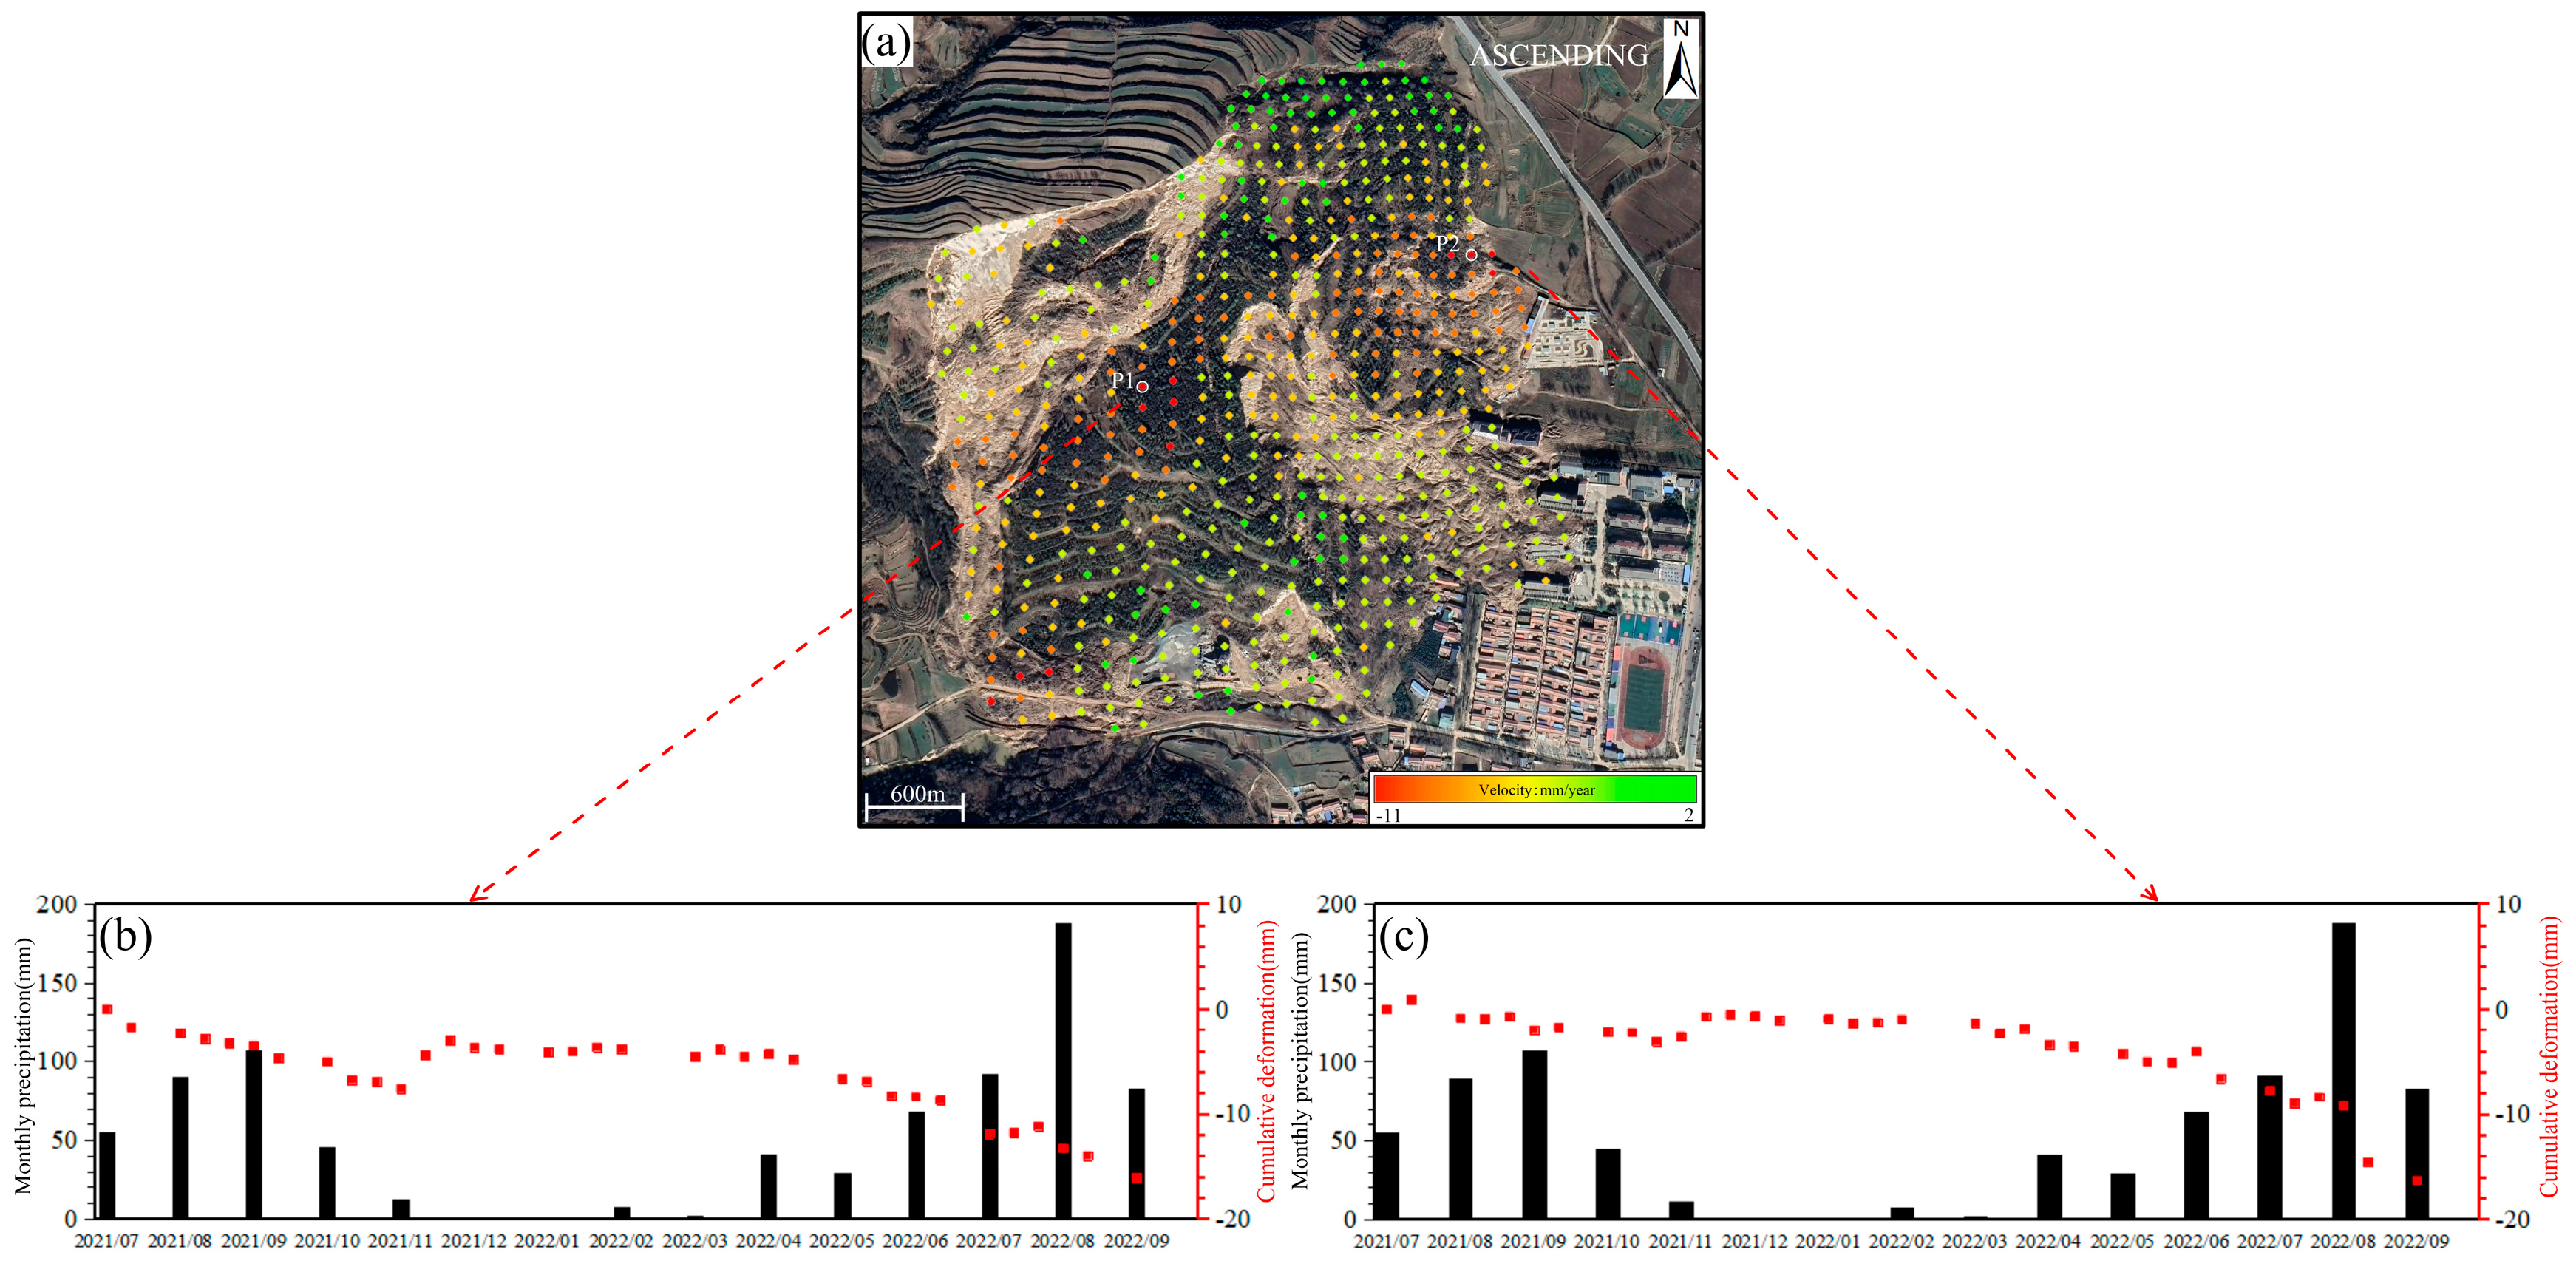
5.1. Relationship between Rainfall and Landslides
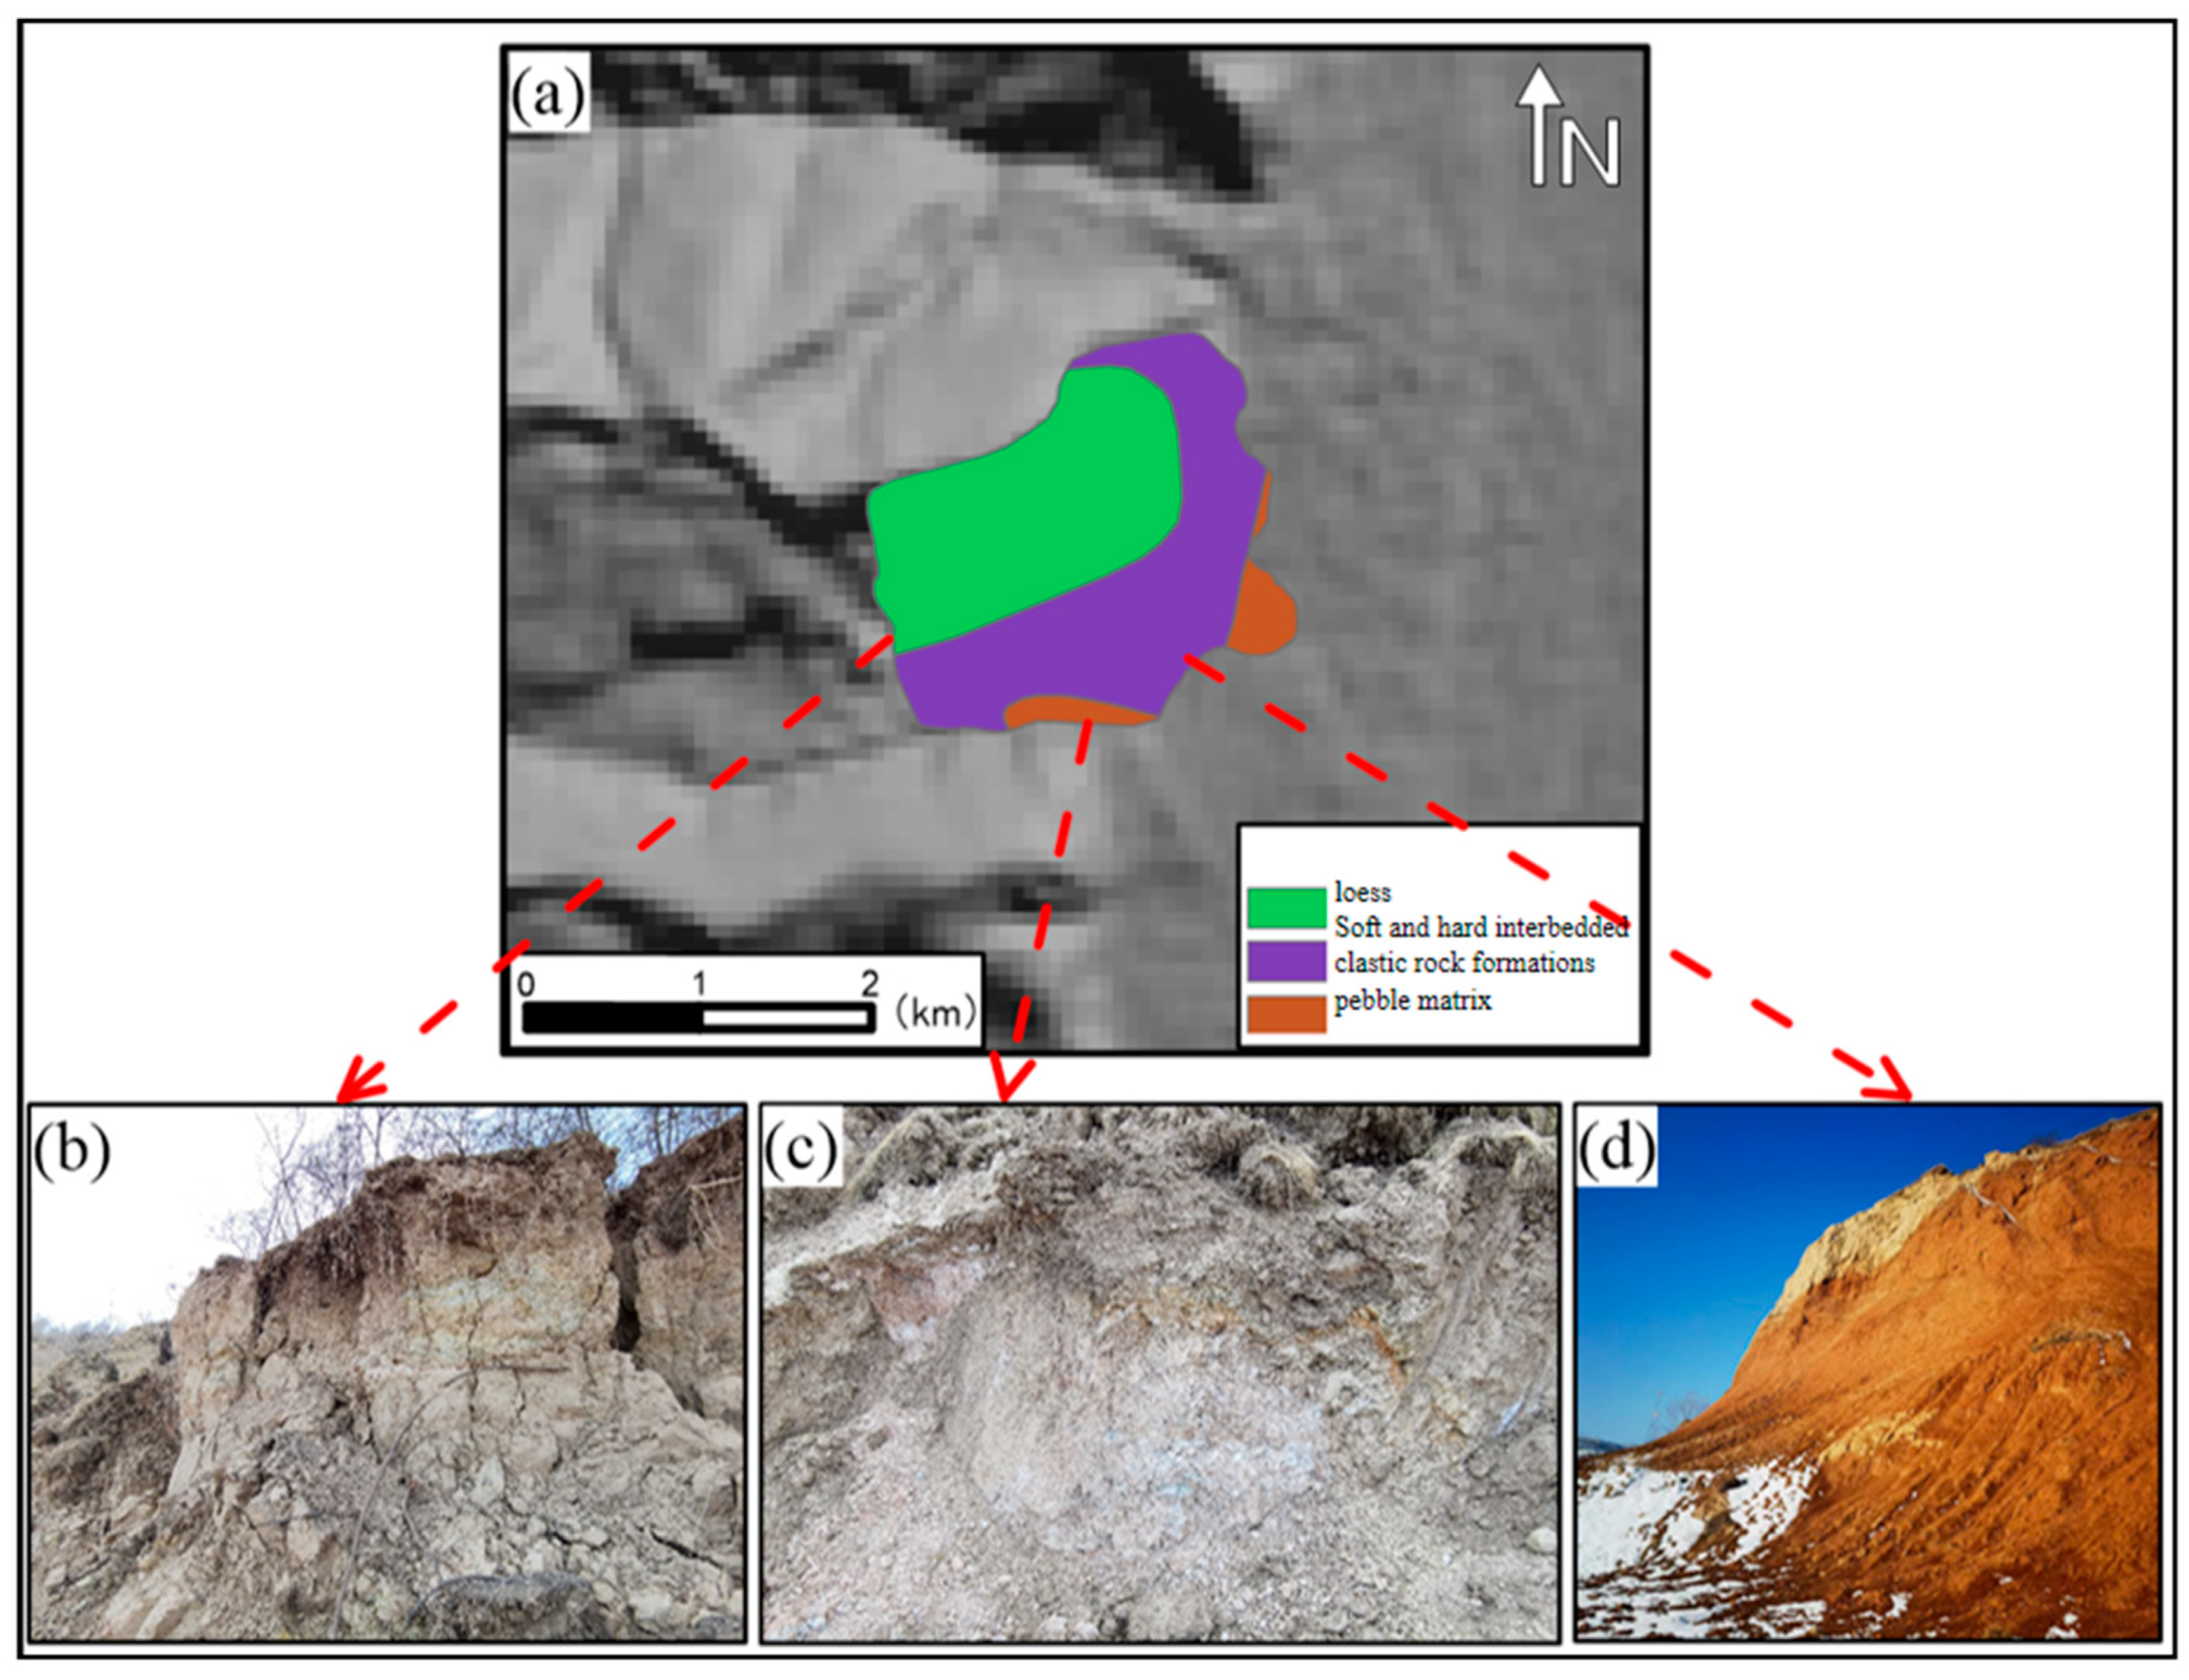
5.2. Relationship between Stratigraphic Lithology and Landslides
6. Conclusions
Author Contributions
Funding
Institutional Review Board Statement
Informed Consent Statement
Data Availability Statement
Acknowledgments
Conflicts of Interest
Abbreviations
| CNY | Chinese Yuan |
| InSAR | Interferometric synthetic aperture radar |
| SBAS-InSAR | Small baseline subset interferometric synthetic aperture radar |
| GPS | Global position system |
| GIS | Geographic information system |
| PS-InSAR | Persistent scatterer interferometric synthetic aperture radar |
| SAR | Synthetic aperture radar |
| IW | InSAR wide |
| AW3D | ALOS World 3D |
| DSM | Digital surface model |
| DEM | Digital elevation model |
| POD | Precision orbit data |
| ENVI | Environment for visualizing images |
| SVD | Singular value decomposition |
| LOS | Line of sight |
| MCF | Minimum cost flow |
| GCPs | Ground control points |
References
- Kavzoglu, T.; Sahin, E.K.; Colkesen, I. Landslide susceptibility mapping using GIS-based multi-criteria decision analysis, support vector machines, and logistic regression. Landslides 2013, 11, 425–439. [Google Scholar] [CrossRef]
- Chen, W.; Li, Y. GIS-based evaluation of landslide susceptibility using hybrid computational intelligence models. Catena 2020, 195, 104777. [Google Scholar] [CrossRef]
- Yang, W.; Qi, W.; Zhou, J. Decreased post-seismic landslides linked to vegetation recovery after the 2008 Wenchuan earthquake. Ecol. Indic. 2018, 89, 438–444. [Google Scholar] [CrossRef]
- Sangeeta; Maheshwari, B.K. Spatial predictive modeling of rainfall- and earthquake-induced landslide susceptibility in the Himalaya region of Uttarakhand, India. Environ. Earth Sci. 2022, 81, 237. [Google Scholar] [CrossRef]
- Huang, F.; Yao, C.; Liu, W.; Li, Y.; Liu, X. Landslide susceptibility assessment in the Nantian area of China: A comparison of frequency ratio model and support vector machine. Geomatics, Nat. Hazards Risk 2018, 9, 919–938. [Google Scholar] [CrossRef]
- Xie, Z.; Chen, G.; Meng, X.; Zhang, Y.; Qiao, L.; Tan, L. A comparative study of landslide susceptibility mapping using weight of evidence, logistic regression and support vector machine and evaluated by SBAS-InSAR monitoring: Zhouqu to Wudu segment in Bailong River Basin, China. Environ. Earth Sci. 2017, 76, 313. [Google Scholar] [CrossRef]
- Liu, H.; Zhou, B.; Bai, Z.; Zhao, W.; Zhu, M.; Zheng, K.; Yang, S.; Li, G. Applicability Assessment of Multi-Source DEM-Assisted InSAR Deformation Monitoring Considering Two Topographical Features. Land 2023, 12, 1284. [Google Scholar] [CrossRef]
- Singh, H.; Pandey, A.C. Land deformation monitoring using optical remote sensing and PS-InSAR technique nearby Gangotri glacier in higher Himalayas. Model. Earth Syst. Environ. 2020, 7, 221–233. [Google Scholar] [CrossRef]
- Ganesh, B.; Vincent, S.; Pathan, S.; Garcia Benitez, S.R. Machine learning based landslide susceptibility mapping models and GB-SAR based landslide deformation monitoring systems: Growth and evolution. Remote Sens. Appl. Soc. Environ. 2023, 29, 100905. [Google Scholar] [CrossRef]
- Dai, C.; Li, W.; Wang, D.; Lu, H.; Xu, Q.; Jian, J. Active Landslide Detection Based on Sentinel-1 Data and InSAR Technology in Zhouqu County, Gansu Province, Northwest China. J. Earth Sci. 2021, 32, 1092–1103. [Google Scholar] [CrossRef]
- Chen, G.; Li, X.; Chen, W.; Cheng, X.; Zhang, Y.; Liu, S. Extraction and application analysis of landslide influential factors based on LiDAR DEM: A case study in the Three Gorges area, China. Nat. Hazards 2014, 74, 509–526. [Google Scholar] [CrossRef]
- Wang, H.; Guo, Q.; Ge, X.; Tong, L. A Spatio-Temporal Monitoring Method Based on Multi-Source Remote Sensing Data Applied to the Case of the Temi Landslide. Land 2022, 11, 1367. [Google Scholar] [CrossRef]
- Zhao, C.; Kang, Y.; Zhang, Q.; Lu, Z.; Li, B. Landslide Identification and Monitoring along the Jinsha River Catchment (Wudongde Reservoir Area), China, Using the InSAR Method. Remote Sens. 2018, 10, 993. [Google Scholar] [CrossRef]
- Rudy, A.C.; Lamoureux, S.F.; Treitz, P.; Short, N.; Brisco, B. Seasonal and multi-year surface displacements measured by DInSAR in a High Arctic permafrost environment. Int. J. Appl. Earth Obs. Geoinf. 2018, 64, 51–61. [Google Scholar] [CrossRef]
- Goorabi, A.; Karimi, M.; Yamani, M.; Perissin, D. Land subsidence in Isfahan metropolitan and its relationship with geological and geomorphological settings revealed by Sentinel-1A InSAR observations. J. Arid. Environ. 2020, 181, 104238. [Google Scholar] [CrossRef]
- Han, Y.; Zhao, Y.; Zhang, Y.; Wang, X.; Wu, L.; Ding, P.; Jin, L. Monitoring and analysis of land subsidence in modern Yellow River Delta using SBAS-InSAR Technology. IOP Conf. Ser. Earth Environ. Sci. 2021, 643, 012166. [Google Scholar] [CrossRef]
- Bao, L.; Xing, X.; Chen, L.; Yuan, Z.; Liu, B.; Xia, Q.; Peng, W. Time Series Deformation Monitoring over Large Infrastructures around Dongting Lake Using X-Band PSI with a Combined Thermal Expansion and Seasonal Model. J. Sens. 2021, 2021, 6664933. [Google Scholar] [CrossRef]
- Bayaraa, M.; Rossi, C.; Kalaitzis, F.; Sheil, B. Entity Embeddings in Remote Sensing: Application to Deformation Monitoring for Infrastructure. Remote Sens. 2023, 15, 4910. [Google Scholar] [CrossRef]
- Zhang, L.; Dai, K.; Deng, J.; Ge, D.; Liang, R.; Li, W.; Xu, Q. Identifying Potential Landslides by Stacking-InSAR in Southwestern China and Its Performance Comparison with SBAS-InSAR. Remote Sens. 2021, 13, 3662. [Google Scholar] [CrossRef]
- Roy, P.; Martha, T.R.; Khanna, K.; Jain, N.; Kumar, K.V. Time and path prediction of landslides using InSAR and flow model. Remote Sens. Environ. 2022, 271, 112899. [Google Scholar] [CrossRef]
- He, Y.; Wang, W.; Zhang, L.; Chen, Y.; Chen, Y.; Chen, B.; He, X.; Zhao, Z. An identification method of potential landslide zones using InSAR data and landslide susceptibility. Geomatics, Nat. Hazards Risk 2023, 14, 2185120. [Google Scholar] [CrossRef]
- Fobert, M.-A.; Singhroy, V.; Spray, J.G. InSAR Monitoring of Landslide Activity in Dominica. Remote Sens. 2021, 13, 815. [Google Scholar] [CrossRef]
- Tomás, R.; Zeng, Q.; Lopez-Sanchez, J.M.; Zhao, C.; Li, Z.; Liu, X.; Navarro-Hernández, M.I.; Hu, L.; Luo, J.; Díaz, E.; et al. Advances on the investigation of landslides by space-borne synthetic aperture radar interferometry. Geo Spat. Inf. Sci. 2023, 27, 602–623. [Google Scholar] [CrossRef]
- Cook, M.; Brook, M.; Cave, M. Interferometric Synthetic Aperture Radar (InSAR) and field-based observations of rainfall-triggered landslides from the November 2021 storm, Gisborne/Tairāwhiti, New Zealand. New Zeal. Geogr. 2023, 79, 138–152. [Google Scholar] [CrossRef]
- Chen, L.; Ma, P.; Yu, C.; Zheng, Y.; Zhu, Q.; Ding, Y. Landslide susceptibility assessment in multiple urban slope settings with a landslide inventory augmented by InSAR techniques. Eng. Geol. 2023, 327, 107342. [Google Scholar] [CrossRef]
- Gao, B.; He, Y.; Chen, X.; Zheng, X.; Zhang, L.; Zhang, Q.; Lu, J. Landslide Risk Evaluation in Shenzhen Based on Stacking Ensemble Learning and InSAR. IEEE J. Sel. Top. Appl. Earth Obs. Remote Sens. 2023, 16, 1–18. [Google Scholar] [CrossRef]
- Guo, R.; Li, S.; Chen, Y.N.; Li, X.; Yuan, L. Identification and monitoring landslides in Longitudinal Range-Gorge Region with InSAR fusion integrated visibility analysis. Landslides 2020, 18, 551–568. [Google Scholar] [CrossRef]
- Bekaert, D.P.S.; Handwerger, A.L.; Agram, P.; Kirschbaum, D.B. InSAR-based detection method for mapping and monitoring slow-moving landslides in remote regions with steep and mountainous terrain: An application to Nepal. Remote Sens. Environ. 2020, 249, 111983. [Google Scholar] [CrossRef]
- Guo, H.; Yi, B.; Yao, Q.; Gao, P.; Li, H.; Sun, J.; Zhong, C. Identification of Landslides in Mountainous Area with the Combination of SBAS-InSAR and Yolo Model. Sensors 2022, 22, 6235. [Google Scholar] [CrossRef]
- Li, Y.; Feng, X.; Li, Y.; Jiang, W.; Yu, W. Detection and analysis of potential landslides based on SBAS-InSAR technology in alpine canyon region. Environ. Sci. Pollut. Res. Int. 2024, 31, 6492–6510. [Google Scholar] [CrossRef]
- Dong, J.; Niu, R.; Li, B.; Xu, H.; Wang, S. Potential landslides identification based on temporal and spatial filtering of SBAS-InSAR results. Geomatics, Nat. Hazards Risk 2022, 14, 52–75. [Google Scholar] [CrossRef]
- Yuan, M.; Li, M.; Liu, H.; Lv, P.; Li, B.; Zheng, W. Subsidence Monitoring Base on SBAS-InSAR and Slope Stability Analysis Method for Damage Analysis in Mountainous Mining Subsidence Regions. Remote Sens. 2021, 13, 3107. [Google Scholar] [CrossRef]
- Gnyawali, K.; Dahal, K.; Talchabhadel, R.; Nirandjan, S. Framework for rainfall-triggered landslide-prone critical infrastructure zonation. Sci. Total Environ. 2023, 872, 162242. [Google Scholar] [CrossRef] [PubMed]
- Zhang, Z.; Zeng, R.; Meng, X.; Zhao, S.; Wang, S.; Ma, J.; Wang, H. Effects of changes in soil properties caused by progressive infiltration of rainwater on rainfall-induced landslides. Catena 2023, 233, 107475. [Google Scholar] [CrossRef]
- Chen, M.; Yang, X.; Zhou, J. Spatial distribution and failure mechanism of water-induced landslides in the reservoir areas of Southwest China. J. Rock. Mech. Geotech. Eng. 2023, 15, 442–456. [Google Scholar] [CrossRef]
- Mora, O.; Lanari, R.; Mallorqui, J.J.; Berardino, P.; Sansosti, E. A New Algorithm for Monitoring Localized Deformation Phenomena Based on Small Baseline Differential SAR Interferograms; IGARSS IEEE: New York, NY, USA, 2002. [Google Scholar]
- Lanari, R.; Mora, O.; Manunta, M.; Mallorqui, J.J.; Berardino, P.; Sansosti, E. A small-baseline approach for investigating deformations on full-resolution differential SAR interferograms. IEEE Trans. Geosci. Remote Sens. 2004, 42, 1377–1386. [Google Scholar] [CrossRef]
- Liu, X.; Zhao, C.; Yin, Y.; Tomás, R.; Zhang, J.; Zhang, Q.; Wei, Y.; Wang, M.; Lopez-Sanchez, J.M. Refined InSAR method for mapping and classification of active landslides in a high mountain region: Deqin County, southern Tibet Plateau, China. Remote Sens. Environ. 2024, 304, 114030. [Google Scholar] [CrossRef]
- Zhou, C.; Cao, Y.; Yin, K.; Wang, Y.; Shi, X.; Catani, F.; Ahmed, B. Landslide Characterization Applying Sentinel-1 Images and InSAR Technique: The Muyubao Landslide in the Three Gorges Reservoir Area, China. Remote Sens. 2020, 12, 3385. [Google Scholar] [CrossRef]
- Yao, J.; Yao, X.; Liu, X. Landslide Detection and Mapping Based on SBAS-InSAR and PS-InSAR: A Case Study in Gongjue County, Tibet, China. Remote Sens. 2022, 14, 4728. [Google Scholar] [CrossRef]
- Su, X.-J.; Zhang, Y.; Meng, X.-M.; Yue, D.-X.; Ma, J.-H.; Guo, F.-Y.; Zhou, Z.-Q.; Rehman, M.U.; Khalid, Z.; Chen, G.; et al. Landslide mapping and analysis along the China-Pakistan Karakoram Highway based on SBAS-InSAR detection in 2017. J. Mt. Sci. 2021, 18, 2540–2564. [Google Scholar] [CrossRef]
- Su, X.; Zhang, Y.; Meng, X.; Rehman, M.U.; Khalid, Z.; Yue, D. Updating Inventory, Deformation, and Development Characteristics of Landslides in Hunza Valley, NW Karakoram, Pakistan by SBAS-InSAR. Remote Sens. 2022, 14, 4907. [Google Scholar] [CrossRef]
- Lu, H.; Li, W.; Xu, Q.; Yu, W.; Zhou, S.; Li, Z.; Zhan, W.; Li, W.; Xu, S.; Zhang, P.; et al. Active landslide detection using integrated remote sensing technologies for a wide region and multiple stages: A case study in southwestern China. Sci. Total Environ. 2024, 931, 172709. [Google Scholar] [CrossRef] [PubMed]
- Dong, J.; Zhang, L.; Li, M.; Yu, Y.; Liao, M.; Gong, J.; Luo, H. Measuring precursory movements of the recent Xinmo landslide in Mao County, China with Sentinel-1 and ALOS-2 PALSAR-2 datasets. Landslides 2017, 15, 135–144. [Google Scholar] [CrossRef]
- Ran, P.; Li, S.; Zhuo, G.; Wang, X.; Meng, M.; Liu, L.; Chen, Y.; Huang, H.; Ye, Y.; Lei, X. Early identification and influencing factors analysis of active landslides in mountainous areas of Southwest China using SBAS-InSAR. Sustainability 2023, 15, 4366. [Google Scholar] [CrossRef]
- Zhang, C.; Li, Z.; Yu, C.; Chen, B.; Ding, M.; Zhu, W.; Yang, J.; Liu, Z.; Peng, J. An integrated framework for wide-area active landslide detection with InSAR observations and SAR pixel offsets. Landslides 2022, 19, 2905–2923. [Google Scholar] [CrossRef]
- Dong, J.; Zhang, L.; Tang, M.; Liao, M.; Xu, Q.; Gong, J.; Ao, M. Mapping landslide surface displacements with time series SAR interferometry by combining persistent and distributed scatterers: A case study of Jiaju landslide in Danba, China. Remote Sens. Environ. 2018, 205, 180–198. [Google Scholar] [CrossRef]


| Wavelength | Ascending/ Descending Orbit | Time | Revisit Cycle | Resolution | Angle of Incidence | Imaging Mode | Polarization Mode | Number of Images (Scenes) |
|---|---|---|---|---|---|---|---|---|
| 5.6 cm/C Band | Ascending track | July 2021 to September 2022 | 12 Days | 20 m | 41.7° | IW | VV | 37 |
| 5.6 cm/C Band | Descending track | July 2021 to October 2022 | 12 Days | 20 m | 41.5° | IW | VV | 38 |
Disclaimer/Publisher’s Note: The statements, opinions and data contained in all publications are solely those of the individual author(s) and contributor(s) and not of MDPI and/or the editor(s). MDPI and/or the editor(s) disclaim responsibility for any injury to people or property resulting from any ideas, methods, instructions or products referred to in the content. |
© 2024 by the authors. Licensee MDPI, Basel, Switzerland. This article is an open access article distributed under the terms and conditions of the Creative Commons Attribution (CC BY) license (https://creativecommons.org/licenses/by/4.0/).
Share and Cite
Wei, Z.; Li, Y.; Dong, J.; Cao, S.; Ma, W.; Wang, X.; Wang, H.; Tang, R.; Zhao, J.; Liu, X.; et al. The Identification and Influence Factor Analysis of Landslides Using SBAS-InSAR Technique: A Case Study of Hongya Village, China. Appl. Sci. 2024, 14, 8413. https://doi.org/10.3390/app14188413
Wei Z, Li Y, Dong J, Cao S, Ma W, Wang X, Wang H, Tang R, Zhao J, Liu X, et al. The Identification and Influence Factor Analysis of Landslides Using SBAS-InSAR Technique: A Case Study of Hongya Village, China. Applied Sciences. 2024; 14(18):8413. https://doi.org/10.3390/app14188413
Chicago/Turabian StyleWei, Zhanxi, Yingjun Li, Jianhui Dong, Shenghong Cao, Wenli Ma, Xiao Wang, Hao Wang, Ran Tang, Jianjun Zhao, Xiao Liu, and et al. 2024. "The Identification and Influence Factor Analysis of Landslides Using SBAS-InSAR Technique: A Case Study of Hongya Village, China" Applied Sciences 14, no. 18: 8413. https://doi.org/10.3390/app14188413