Featured Application
Determination the scale of hazard caused by episodic water runoff in rural areas will allow better management of the land and limit its negative effects.
Abstract
There has been an increase in the frequency of hazards associated with meteorological and hydrological phenomena. One of them is flash floods occurring episodically in areas of concentrated runoff—valleys without permanent drainage. In the opinion of residents and local authorities, these are potentially safe areas—they are not threatened by floods and are therefore often occupied by buildings. The importance of addressing flash floods in land use planning is essential for sustainable development and disaster risk reduction. The objective of this research was to assess the level of the hazard and to evaluate its presence in land use planning activities. This manuscript fills a research gap, as to date flash flood threats have not been analyzed for individual buildings located in catchments of dry valleys in temperate climates. More than 12,000 first-order catchments were analyzed. The study covered an upland area located in East Poland, which is characterized by high population density and dispersed rural settlement. Within the 10 municipalities, buildings located on potential episodic runoff lines were identified. Qualitative assessment was applied to ascertain the susceptibility of catchments to flash floods. Such criteria as slopes, size, shape of the catchment area, and land cover, among others, were used. Between 10 and 20% of the buildings were located on episodic runoff lines, and about 900 sub-catchments were highly or very highly susceptible to flash floods. The way to reduce the negative effects of these phenomena is to undertake proper land use planning based on knowledge of geohazards, including flash floods. However, an analysis of available planning documents shows that phenomena of this type are not completely taken into account in spatial management processes.
1. Introduction
Hydrological phenomena associated with rapid runoff after rainfall of more than average intensity are among the natural hazards that are still poorly recognized. This is primarily due to their local nature. The heavy rainfall that causes them can occur almost anywhere [1,2]. This makes it difficult to forecast and therefore warn of the danger. At the same time, due to their negative social and economic effects, these incidents are receiving more and more attention. This is particularly true of flash floods [3,4,5,6,7]. These floods are characterized by a short duration and high flow rates [8,9]. The spatial distribution of flash floods is determined primarily by climatic conditions and terrain. They occur primarily in mountainous and upland areas [4,10,11]. In the latter case, surface runoff forms quickly due to higher gradients and agricultural land use [12,13,14].
Rapid episodic runoff can form outside river valley areas [14,15,16]. A concentration of runoff in the bottom of dry valleys of various ranks may appear. Intense hydrological and geomorphological processes can then pose a threat to the network of settlements and infrastructure located in the bottoms of such landforms. In agricultural areas, rapid surface runoff after heavy downpours causes intense erosion, which can lead to the destruction of crops or the road network [14,17]. Accumulated material covers fields, roads, and farms [15,16]. In Poland, runoff in the bottoms of dry valleys does not pose a direct threat to human health and life but can cause significant property damage.
Intense episodic runoff can occur at any location: the only precondition is the occurrence of rainfall of a certain intensity and amount. The identification of threatened areas is more complicated than in the case of floods occurring in river bottoms. This is because flash floods often occur in areas not covered by a network of standard meteorological and hydrological measurements. Therefore, our knowledge of the frequency, intensity, and spatial distribution of such phenomena is limited. Heavy rainfall in temperate climates usually covers a small area of tens of square kilometers [18,19]. Such incidents are usually studied post factum on the basis of geomorphological effects [14,20,21,22]. In the upland part of Poland, heavy rainfalls of 20–30 mm·h−1 occur every year [16,18], with those exceeding 50 mm·h−1 once every 10 years [17]. On the other hand, the probability of rainfall of >100 mm is 1% in the upland areas of Poland [23].
Due to the inability to predict the locations of flash floods, the only way to delineate threatened areas is to analyze the susceptibility of catchments to intense surface runoff and flash flood phenomena. Susceptible catchments are identified on the basis of analysis of various criteria in a GIS environment [24,25,26,27,28,29,30]. The most common methods for assessing vulnerability to flash floods are the analytical hierarchy process (AHP), weight of evidence (WoE) and frequency ratio (FR), and artificial neural networks (ANN). When assessing catchment susceptibility, the most commonly used indicators include slope, elevation, curvature, stream density, lithology, distance from stream, land use, the TWI (topographic wetness index), and the SPI (stream power index) [31,32,33,34,35]. The resultant models make it possible to pinpoint areas prone to flash floods. However, it is necessary to have an extensive database of these phenomena to develop and validate the models. It should be also noted that analyses of this type have been performed primarily for urbanized areas [36,37,38].
The identification of susceptible catchments is very important from the point of view of land use planning [8,39] because it allows planners to limit the negative effects of flash floods [40,41,42]. At the same time, the results of many climate change models indicate an increase in the frequency of extreme precipitation events [43]. The threat of such phenomena is on the rise, and at the same time the number of new buildings is also increasing. It is emphasized that the rational use of land is a very good way for humans to adapt to projected climate change [44,45]. At the same time, it should be emphasized that the lack of permanent drainage and locations other than the bottoms of river valleys can mean that investors and local authorities are unaware of the threat to development posed by flash floods.
It is difficult to determine precisely the scale of the threat of flash floods in Poland. A flash flood is a short-lived local phenomenon that is not usually recorded by hydrological monitoring systems. The primary source of information is publications describing their hydrological and geomorphological effects. For the period 1932–2009 for the entire area of Poland, Bryndal [10] was able to identify 108 flash floods described in publications. In turn, Rodzik et al. [14] found that in the Lublin Upland area in the second half of the twentieth century, there were approximately 40 heavy rainfall incidents which led to flash floods. The true number of flash flood events is certainly greater. According to Polish Fire Department data, 20,000–30,000 interventions in connection with excessive rainfall and flooding are registered annually in Poland [46]. Of course, not all of these phenomena can be considered flash floods. However, according to insurance companies, in June 2020 in Poland, affected residents reported more than 50,000 cases of damage related to flash floods [47].
Our study fills the research gap concerning a lack of connection between the results of environmental (hydrological) studies and land use planning practice. The research published to date has been primarily in the nature of hydrological studies (detailed assessment of the degree of threat of flash floods) without taking into account the existing planning reality.
This study had the following specific objectives: (a) identification of catchment areas with buildings located on episodic surface runoff lines; (b) assessment of the number of buildings potentially threatened in catchments with a big share of arable land; (c) assessment of the susceptibility of these catchments to flash floods; (d) for the most susceptible catchments, determining whether this threat is present in the planning documents for these areas. In our study, we tested the following research hypothesis: in areas with high susceptibility to flash floods, this threat is present in planning documents.
This study was undertaken in selected rural municipalities of Lublin. Buildings located in areas threatened by potential dynamic runoff and flash floods were identified in first-order catchments without permanent drainage. Due to the lack of sufficient data on real flash flood events, it was not possible to develop models to assess the probability of their occurrence. While the intensity of this threat was not specified, areas with favorable episodic surface runoff formation were identified. A simple susceptibility assessment based on publicly available data was conducted, as this did not require a database of past meteorological and hydrological events. Simple qualitative assessment of the catchment’s susceptibility to flash floods was made on the basis of commonly applied criteria. This method can be applied by anyone preparing planning documents with a basic knowledge of GIS. The extent to which this problem is present in documents related to local land use planning for these catchments was then analyzed. This type of detailed assessment has not been undertaken before in Poland. Studies that have been conducted have focused primarily on permanently drained and somewhat larger catchments [48,49].
Identification of sites and areas threatened by flash floods allows the determination of detailed development rules to reduce the effects of the phenomenon not only within the parcels with buildings but also on the type of land cover and changes in the functional and spatial structure. It can also be useful in designing or upgrading traffic routes to reduce the loss of infrastructure and the danger to users during an emergency. It can support crisis management and the activities of relevant services. It is necessary to rely on solutions that can mitigate the threat, that is, prevent potential losses in the event of a phenomenon.
2. Study Area
The study covered rural areas of eastern Poland covering the Lublin Upland and Roztocze (Figure 1). The bedrock of the region contains lithologically diverse Cretaceous and Paleogene carbonate rocks. Overlying these are Tertiary limestones and varied Pleistocene sediments—clays, sands, gravels, and loess. The surface of the Lublin Upland is highest in the central and eastern parts. In the northeastern and northwestern directions, it descends to an altitude of about 200 m above sea level. Individual mesoregions have the character of plateaus, plains, and hilly elevations. Roztocze forms a range of hills about 180 km long. The maximum heights here reach almost 400 m above sea level. The western part is characterized by the presence of a rolling top cut by dry valleys and ravines. In the central and eastern parts, there are poorly diversified and spur hills [50]. The loess-covered areas are characterized by the most varied terrain in places with a dense network of gullies. Annual precipitation is about 550–600 mm; in the Roztocze, it is slightly higher (600–650 mm), and the average unit outflow reaches 4.0 l/s-km2. Precipitation occurs primarily in the summer season often in the form of downpours and thunderstorms. The Lublin Upland and Roztocze is an area of quite frequent occurrence of violent precipitation. Their sum reaches 20–30 mm and in some cases even 100 mm [19]. The duration of the precipitation can be short—from a few to tens of minutes. In the second half of the twentieth century, more than a dozen rainfalls with daily totals >100 mm were recorded. The geomorphological effects of some of them have been described in detail in Piaski Szlacheckie in 1956, in Dzierzkowice in 1969, and in Kazimierz Dolny in 1981 [14].
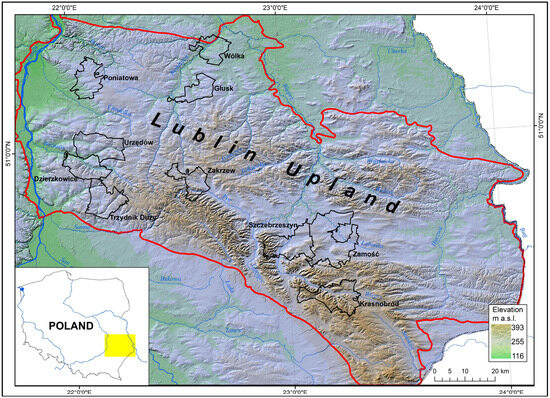
Figure 1.
Location of studied municipalities (black polygons). Red outline—border of Lublin Upland.
The Lublin Upland and the western part of Roztocze is a typically agricultural region, with farmland occupying 70–80% of the area. The occurrence of fertile soils makes it an important agricultural production area in Poland. Population density ranges from 70 to 90 people per km2 and is slightly lower than the average for Poland. A characteristic feature is the presence of a mosaic of crops resulting from the significant fragmentation of farms and fields [51]. Recently, there has been an expansion of the settlement network alongside a simultaneous decrease in the area used for agriculture due to depopulation and the aging rural population [52]. Central and eastern Roztocze is characterized by greater forest cover. It is protected within the Roztocze National Park and the system of landscape parks.
The preliminary analysis covered 116 municipalities with a total area of 13,000 km2. Ten municipalities with the highest building density, exceeding 4.7 buildings per square kilometer, were selected for analysis. The potential threat of episodic runoff is greatest in these regions. They are located in the southern part of Lublin Voivodeship, either in the Lublin Upland or Roztocze, in eastern Poland (Figure 1).
The studied municipalities are characterized by various types of land relief—an important factor in flash floods. The most varied municipalities are Krasnobród, where the local relief reaches 139 m and the average slope is 5.43°, Szczebrzeszyn (133.6 m; 4.77°), and Zamość (128.2 m; 2.63°). More intensive relief is found in the municipalities of Urzędów (108.6 m; 3.42°), Dzierzkowice (106.2 m; 4.92°), Zakrzew (93.6 m; 4.25°), Trzydnik Duży (93.3 m; 3.39°), and Poniatowa (81.2 m; 2.42°). In contrast, the municipalities of Głusk (55.3 m; 2.30°) and Wólka (59.0 m; 2.86°) have the least varied terrain. Studied municipalities are characterized by varying population density from 225 persons/km2 in Głusk to only 35.3 persons/km2 in Zakrzew (Table 1). Some of the analyzed municipalities are undergoing development, while others are socio-economically stagnant. Among them are mainly agricultural municipalities, such as Trzydnik Duży. In general, these areas have low forest cover (as low as 7.4%). The exception is Krasnobród, where more than half of the area is covered by forest. The size of the built-up and urbanized land index indicates urban–rural units (Krasnobród, Poniatowa, Szczebrzeszyn). Directly bordering Lublin are the municipalities of Głusk and Wólka, where the built-up area is increasing intensively due to suburbanization. The same is true for the rural municipality of Zamość, which surrounds the city of Zamość.

Table 1.
Selected characteristics of surveyed municipalities after Local Data Bank [50,53].
3. Methods
3.1. Data Sources
This study used publicly available data, published on the Geoportal of Spatial Information Infrastructure (in Poland) and managed by the Central Office of Geodesy and Cartography [54]. The elevation data (DTM—digital terrain model) made available there were acquired as part of the ISOK (National Guard Information System) project. DTM is a product created from processing LIDaR survey data and is made available as a collection of raster tiles with a resolution of 1 × 1 m [55]. An essential operation that had to be performed before proceeding with analysis was the removal of any drainless depressions so that the DTM was hydrologically correct (Figure 2). A number of derived layers were generated from the DTM, which were then used to delineate catchment boundaries and develop their morphometric characteristics.
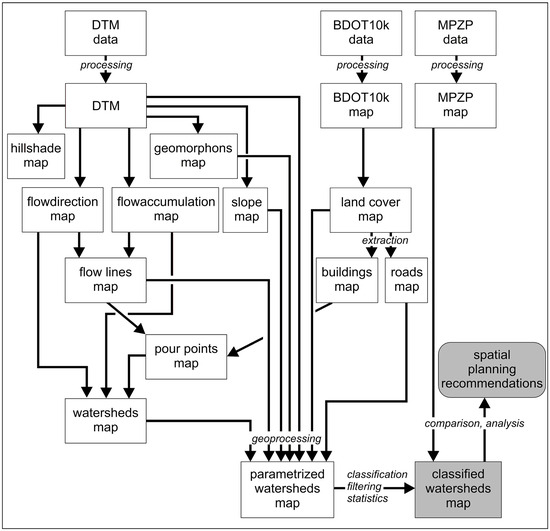
Figure 2.
Workflow model of data processing and calculations.
The second dataset used in the study was the National Database of Topographic Objects 10k (BDOT10k), developed at an accuracy equivalent to a scale of 1:10,000 [56,57]. BDOT10k contains information on water and communications networks, land development, land cover and land use, buildings, protected areas, and territorial division units. These collections are available on websites of provinces and are constantly updated by local government authorities (data used present the current state of topographic elements).
The third element was vector data created from the transformation of the Local Spatial Development Plan (MPZP) of Krasnobród municipality into digital form. For the other highly susceptible municipalities, local spatial development plans available online in the form of raster files were used. For each commune in Poland, where such a plan is elaborated, it is available on a separate website. In our case, the websites of studied municipalities are listed in the Supplementary File S1.
A land cover map, a road map, and a buildings layer were generated from the 10k Database of Topographic Objects (BDOT10k). We decided to use level 2 of the database because it contained an appropriate level of detail (15 categories) (Figure 2).
3.2. GIS Analysis
The first step of the analysis was to identify buildings that are located on the line of potential episodic runoff; the next was to determine how susceptible the catchments of these runoffs are. Each municipality in Lublin Upland was studied in this way. However, as was mentioned before, for the detailed studies, ten municipalities with the highest building density threatened by the flash floods were chosen.
A simple assumption was made: the greater the susceptibility of the catchment to episodic runoff (flash floods), the greater the threat to buildings located at the mouth of the catchment. In order to delineate the boundaries of catchments associated with settlement and potentially threatened by flash floods, it was first necessary to create flow direction and flow accumulation layers based on potential runoff lines (flowlines). It was assumed, following Janicki [18], that the minimum catchment area in which a flash flood can form in the Lublin Upland is 0.5 ha. The layer of flowlines was juxtaposed with the layer of buildings, and those that were no more than 2 m from the flowlines were selected. Then, on each flowline, the point closest to each building (pour point) was determined and used in the next step to determine the catchment that collects water flowing into the vicinity of the building.
In many cases, the identified buildings lay along the same line of runoff, and the designated catchments overlapped. The procedure for dealing with these cases is explained later in the manuscript. In the next step, a slope layer (measured in degrees) and geomorphon map [57] were calculated from the DTM, which classifies the topography of the area into 10 main geomorphometric units (Figure 2 and Figure 3).
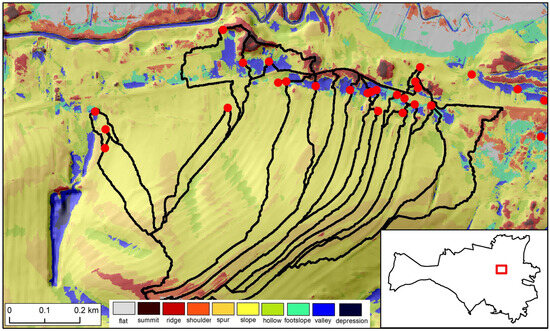
Figure 3.
Example of geomorphon map, part of Krasnobród municipality. Borders of catchments drawn with black lines; red dots indicate pour points of catchments.
Detailed analyses were performed for 12,024 catchments covering a total of 339.96 km2. It should be noted here that the catchment areas did not coincide with the boundaries of municipalities and often included areas beyond. Data processing and analytical procedures used geoprocessing models created in ArcGIS Pro 3.0. In the next step, the total area and area shares of forests were identified. Only catchments with an area of less than 10 km2 and a forest share of less than 50% were included in the analyses. The possibility of rapid surface runoff was considered low for the large area occupied by the forest [8,10,12,14]. At the same time, a limit on the catchment area was introduced to keep them comparable.
In total, nine catchment parameters were evaluated by adopting the following principles based on the available literature (Table 2) [17,18,31,32,33,34,35,36,50,51,58,59,60]:
Table 2.
Evaluation criteria.
- (a)
- Proportion of arable land—a greater proportion of arable land increases the susceptibility to flash floods: faster and more intense formation of surface runoff; crops tend to have sparse vegetation, due to which they do not retain water.
- (b)
- Proportion of forest—a greater proportion of forests reduces susceptibility due to less intense surface runoff.
- (c)
- Catchment area—a smaller catchment area increases susceptibility: flash floods form locally in small catchments.
- (d)
- Share of geomorphons—specific types of geomorphons promote the formation of surface runoff and its concentration. These were classified on the basis of their location in topography to identify those associated with land depressions and concentrated runoff.
- (e)
- Slope of valley sides—steeper slopes and higher gradients increase susceptibility due to more surface runoff and water delivery to valley bottoms.
- (f)
- Catchment shape—the more circular the catchment area, the higher the susceptibility because water inflow to the valley floor is more spread out over time.
- (g)
- Slope of valley bottom—a more sloped valley bottom increases the susceptibility due to faster surface runoff.
- (h)
- Road density—higher road density increases the susceptibility because impermeable roads are places where surface runoff rapidly forms.
- (i)
- Local relief—higher relative heights increase susceptibility to faster surface runoff.
Subsequently, the catchments were assigned points for each characteristic, using the criteria summarized in Table 2. Some of the features, due to their higher influence on the formation of flash floods, were given more weight by doubling the number of points (share of arable land, geomorphon type, and mean slope).
After the catchments were assigned scores for each criterion, they were summed (Formula (1)), and the catchments were classified according to the criteria summarized in Table 3. Categories were distinguished by dividing the set into five equal ranges:
where FF is susceptibility to flash flood formation, Wi is weight of parameter, xi is parameter, and n is number of parameters.
Table 3.
Rules for determining catchment susceptibility categories.
In the next step, the number of catchments was reduced by combining those that lay on the same runoff line and had outlets (closing points) that were close to each other (Figure 4). The smaller catchments were removed, leaving the larger catchments with the lowest outlets. However, any smaller catchments located inside larger ones but not supplied from the main runoff line were left as separate sites for analysis. In this way, the number of catchments was reduced from 12,024 to 5468.
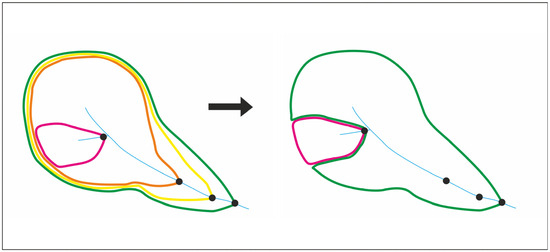
Figure 4.
Scheme of watersheds merging during delimitation of buildings threatened by flash floods. Colors indicate different watersheds linked to individual buildings (left side) and borders of final watersheds included in analysis (right). Colors of outlines of watersheds express the degree of susceptibility to flash floods.
3.3. Spatial Plannning and Flash Flood Threat
To study planning conditions, a selection of municipal documents was made. Ten studies (text and graphic annexes) and more than 20 local plans or their amendments (text and graphic annexes) were critically analyzed. Of the latter, only those referring to areas containing highly (4) or very highly (5) susceptible catchment areas were selected. We examined to what extent the threat had been identified in a given municipality, how it was presented in documents, and what measures were indicated to reduce the threat. Susceptibility analysis of the catchments indicates the areas most at risk, while analysis of land use documents makes it possible to determine whether the threat is noticed. It allows us to test our research hypothesis.
Land use planning takes into account various considerations which arise from the specific characteristics of a given unit, as well as legal regulations governing the use of the natural environment. Following the implementation of the EU Flood Directive [61] into Poland’s Water Law [62], there is a mandatory requirement to take into account flood risk, which is determined in flood hazard maps (FHMs), flood risk maps (MRPs), and flood risk management plans (FMPs). The law on land use planning and development specifies land use and zoning rules [63]. In turn, the law on the protection of agricultural and forestry land [64] limits the possibility of allocating land with the highest production values for non-agricultural purposes. For years, the Polish land use planning system at the local level included a study of the conditions and directions of spatial development with two elements (mandatory for the area within the municipal boundaries, in the form of an internal management act defining the directions of spatial policy of the municipality) and a local spatial development plan (mandatory only in certain cases and an act of local law). The 2023 amendment to the law on land use planning and development [65] introduced a new document, the municipality’s general plan, in place of the study. In the absence of a local plan, zoning decisions are issued in two versions. The location of a public purpose investment is determined by a decision on the location of a public purpose investment, and the land use and development conditions for other investments are determined by a decision on development conditions. Since they apply to individual parcels of land and do not cover the same multidirectional conditions as local plans, they are considered a source of disturbance to spatial order [66]. According to the environmental protection law [67], the basic document in which the natural conditions for land use planning are presented is an ecophysiographic study.
4. Results
4.1. Spatial Diversity of Catchment Susceptibility
In each municipality, buildings have been identified that may be affected by flash floods (Table 4). Numbers range from 652 in Dzierzkowice municipality to 2668 in Zamość municipality. In terms of municipalities with a high share of threatened buildings in the total number, Szczebrzeszyn (21.8%) and Zakrzew (20.5%) stand out. The lowest shares are in Zamość (9.8%) and Trzydnik (10.5%). The remaining six municipalities’ shares range from 13 to 19%.
Table 4.
Number of buildings located on flowlines (threatened by flash floods) in relation to the number of buildings in the municipality.
The subindices used to assess the susceptibility of the analyzed catchments show great variation in each of the municipalities (Table 5). The average share of arable land in the catchments ranges from 51.1% (Urzędów) to 88.9% (Zakrzew), with the highest values reaching 100%. The average share of forested area within the studied catchments across a single municipality ranges from 0.7% (Zamość) to 10.8% (Krasnobród). The individual catchment with the largest forested area was in Poniatowa (49.9%) and the smallest (1.1%) in Głusk. The average catchment area is greatest in Zamość (0.16 km2) and smallest in Dzierzkowice (0.1 km2). The biggest catchment area exceeds 8 km2 in Poniatowa, Urzędów, and Zamość. The steepest average slope (4.3°) was found across catchments in Krasnobród and the lowest in Poniatowa (2.5°), while the highest value in a single catchment was 17.2° in Dzierzkowice. The highest mean value of relative elevation (34.9 m; local relief) was found across catchments in Krasnobród and the lowest (13.3 m) across catchments in Wólka. The highest relief in an individual catchment (104.4 m) was recorded in Szczebrzeszyn. The distribution of maximum values of catchment circularity was broad, ranging from 0.33 (Dzierzkowice) to 0.47 (Trzydnik). The average slope of the drainage line ranged from 2.1° (Poniatowa) to 3.8° (Dzierzkowice), and the individual area with the highest area slope was in the catchment area in Szczebrzeszyn, at 18.9°. The average density of the road network ranged from 6.6 km/km2 (Krasnobród) to 4.5 km/km2 (Zakrzew). The highest value was 47.7 km/km2 (Zakrzew).
Table 5.
Values of subindices in catchments located in the studied municipalities.
The largest number of catchments (2979) were classified as category 3 for susceptibility, and this category dominated in each municipality both numerically (Table 6) and in terms of area (Table 7). In second place, numerically speaking, came category 2 (1437). In terms of the share of area across all catchments, category 2 catchments (Table 7) were also the second most common in most municipalities, with the exception of Dzierzkowice, Krasnobród, Szczebrzeszyn, and Zakrzew, where category 4 catchments covered a larger relative area. Category 4 was in third place in terms of the number of catchments (844) and in terms of area in most municipalities. Category 1 (153 catchments) ranked fourth, and the shares of its area did not exceed 1% in six municipalities. An exception here was the municipality of Wólka, where the share of category 1 catchments exceeded 7%. The highest category (55 catchments) was found in seven municipalities and was most represented in Zakrzew (19), where it also occupies the largest area (2.64%).
Table 6.
The number of watersheds in municipalities by class of flash flood susceptibility (susceptibility classes according to Table 3).
Table 7.
The number of catchments in municipalities by class of flash flood susceptibility (susceptibility classes according to Table 3).
The highest susceptibility was found in municipalities characterized by varied topography (Krasnobród, Szczebrzeszyn, Zakrzew), but it is important to keep in mind the role of this factor in the assessment—several criteria result from the morphometry of the area.
In Dzierzkowice municipality, all studied catchments are located on the slopes of the Wyżnica river valley. Moderately susceptible catchments (203) are the most numerous group, forming larger clusters in western and eastern parts of the municipality (Figure 5). Highly susceptible catchments (125) are located in the central, steeper part of valley. Głusk municipality is located in the northern, lower part of Lublin Upland; hence, catchments of moderate susceptibility (387) prevail. These are located on gently sloping river valleys in the central and eastern parts of the municipality. Low-susceptibility catchments (194) are located in the northwest and west of the municipality. In Krasnobród municipality, moderately susceptible catchments are the most common (167) and are concentrated in the west. Most are located on moderate slopes. High-susceptibility catchments (108) are situated on steeper slopes, mainly in central and northeastern areas of the municipality. In Poniatowa, moderately susceptible catchments are the most numerous (209). These catchments are located in central and eastern parts of the municipality. There are also many catchments with low susceptibility (202) dispersed across the region. In Szczebrzeszyn municipality, most of the catchments are located on the slopes of the Wieprz valley. Moderately susceptible catchments (359) are the most numerous, and these are chiefly found in the central area. High-susceptibility catchments (161) are concentrated on the left side of the Wieprz. In this municipality, very highly susceptible catchments also occur (12). They occupy small areas on the strongly dissected slope to the left of the Wieprz river valley. In Trzydnik Duży municipality, two big groups of catchments prevail: moderately (300) and highly (124) susceptible. They occur mainly on the slopes of the Karasiówka river valley (eastern part) and in the northwest (Figure 5). Very highly susceptible small catchments (16) occur in upper parts of the Karasiówka and Tuczyn valleys. In Urzędów municipality, susceptible catchments are located on the slopes of the Urzędówka and Podlipie river valleys. Moderately susceptible catchments (302) are the most common. These are located in the central area of the municipality. Highly susceptible catchments (102) are located mainly in the lower part of the Urzędówka valley. Wólka municipality is located in the northern, lower part of Lublin Upland. Moderately susceptible catchments are the most common (207), located in the municipality’s central part, followed by low-susceptibility catchments (165). In Zakrzew municipality, moderately susceptible catchments prevail (241). They are located in the central and western parts. The second most common group is the high-susceptibility catchments (81), which mainly occur in the east. The greatest number of very highly susceptible catchments occur in this municipality (19). Zamość municipality is located in an extensive depression, which is reflected in the distribution of susceptibility. The most dominant type is moderate susceptibility (604), which occurs throughout the municipality. Low-susceptibility catchments (374) follow a similar spatial distribution (Figure 5).
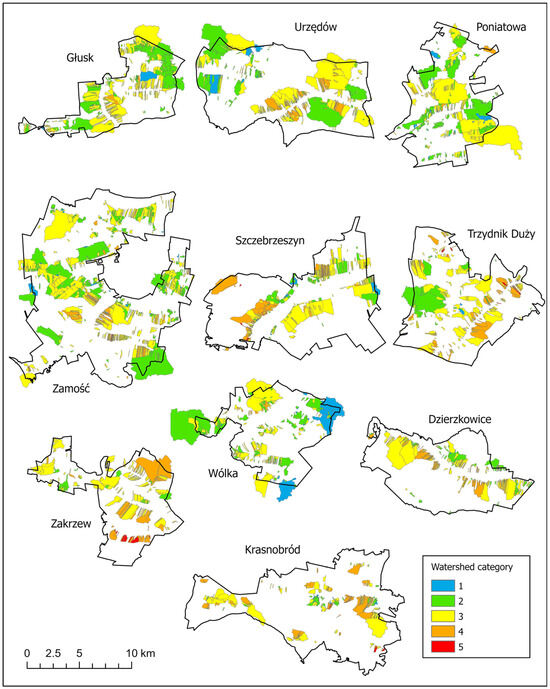
Figure 5.
Classified watersheds in analyzed communes (susceptibility classes according to Table 3).
4.2. Flash Flood Hazard in Local Land Use Planning
The studied municipalities are diverse in terms of size, land use, and spatial development potential (Table 8). The studied municipalities are quite distinct in terms of their socio-economic profiles. Permits and construction notifications in 2018–2023 identify municipalities with a buoyant construction industry, mainly involved in building single-family housing (Głusk, Wólka), which is confirmed by the number of housing units completed per 1000 residents. These two municipalities are seeing intensive suburbanization. From the point of view of preserving spatial order and rational development, an essential element is to ensure the municipalities are covered by local plans. The worst situations are found in Trzydnik Duży, Szczebrzeszyn, and Zamość, where there are no local plans. For parcels of land that are not covered by local plans, decisions on development conditions are issued. Statements for the years 2009–2022 show intensive movement in this regard, with up to 3675 decisions in the case of Zamość municipality (Table 8).
Table 8.
Land use planning activities and documents in the studied municipalities after Local Data Bank [53].
A detailed analysis of planning documents (Table 9) allows us to conclude that local governments make little use of planning instruments to reduce flood risk, especially the risk from flash floods. Studies for agricultural areas indicate increasing small-scale retention of water through afforestation (including watershed areas) by introducing midfield hedges. A little more attention is paid to reducing hazards in river valleys. Only one document, the Krasnobród study [68], defines the principles of spatial policy for dry valleys. Due to, among other things, the need to provide conditions for the free flow of periodic waters, the study establishes the protection of dry valleys and valley depressions from development that obliterates their guiding features and threatens their main functions. It also indicates the need for local plans to prohibit the construction of buildings in this location, to ban the construction of embankments and fences transverse to the axis of the valleys, and to provide culverts for transport routes which cross the valleys. The study also highlights the need to establish permanent vegetation to reduce erosion, mainly through afforestation, especially of slopes, but with a ban on afforestation of water runoff lines. It allows development of sloping zones only where they do not disturb the geodynamic balance of the slopes. The analyzed local plans specify detailed principles and methods of development:
Table 9.
Actions identified in planning documents that may affect the reduction of flash floods.
- For urbanized areas and within the development areas of various functions—the principles for the formation of a proper functional and spatial structure, guidelines for technical and road infrastructure networks, the permissible minimum proportion of biologically active areas, the principles of discharge of rainwater into the ground, the maintenance of tree plantings, the principles of distribution, and the technical parameters of buildings;
- For agricultural areas—maintenance of an appropriate share of green areas, especially in watershed zones and areas prone to soil erosion (forests, permanent grassland, wasteland), the creation of buffer zones (wooded and shrubby) on agricultural land, the maintenance of midfield and roadside hedges, the introduction of phytomelioration, the maintenance of naturally valuable enclaves, the development of small retention of water, and the prohibition of development.
An analysis of the texts and graphic appendices of local plans shows that flood hazard is addressed only when such areas are indicated on hazard maps and in plans drawn up after the current legislation came into force. Rural areas where agricultural use predominates and which are outside the flood plains of large rivers are not seen as problematic in this regard. The problem is usually publicized in the media after the occurrence of flash floods, especially in mountain and upland catchments. Most planners do not know the criteria for determining flood extents, so MZPs and MRPs require more complete consideration of the flash flood hazard. Even if flood risk is indicated in the study, the spatial extent is generally not presented. The only basis for absolute adherence to detailed determinations (including the prohibition of development) in planning documents comes from the constraints imposed by legal regulations.
5. Discussion
The analyses carried out indicated a potential threat to buildings and infrastructure associated with the occurrence of episodic surface runoff. The analyzed municipalities have from 600 to more than 2500 buildings located on runoff lines. The probability of flash floods occurring is difficult to assess due to ongoing changes in climate and the relatively short period covered by relevant studies. Due to the large number of variables and the scope of the study, hydrological modeling was not conducted. Instead, catchments were identified where natural conditions and land use favor the formation of surface runoff. The way to reduce this threat is appropriate land management. Land use planning should be a platform to integrate naturalists, planners, and the public. However, it turns out that even the most basic hydrological knowledge is not used in the rational use of space in the case of phenomena such as flash floods. Our research has indicated that in areas prone to such phenomena, specific planning conditions are not included in the relevant documents. This poses specific threats to existing and future buildings. The analyses conducted did not confirm the research hypothesis—the existence of a potentially high threat does not affect its recognition and prevention in spatial planning.
The problem of flash floods should be considered in a multifaceted manner, taking into consideration the use of the catchment to the intensity of urbanization processes. The peculiarities of how sub-catchments function, the possibilities for retention, and the situation regarding water runoff and its consequences cannot be overlooked. Realistically, when it comes to future changes, municipalities will need to exert control over new buildings and infrastructure. When deciding on a location for new construction, it is advisable to try to exclude susceptible catchments from development or adopt spatial and technical solutions that will limit material losses due to flooding. In relation to agricultural land, measures including better retention of water in the ground and slowing of runoff must be indicated. The way in which sub-catchments are used and managed already ’at the source’ of the formation of the flash floods can reduce the threat in river valleys. In some of the analyzed territorial units (Poniatowa, Trzydnik Duży, Urzędów), small rivers were not included in the flood hazard assessment and do not lie within the scope of the MZP and MRP sheets.
The functional and spatial structure, as well as the local natural system, should be shaped taking into account the problem of flash floods, through the designation of zones subject to this hazard. On the other hand, currently there is no formal basis for excluding the threatened areas from development. This only occurs in cases where flood risk is indicated on the MZP. There is no administrative–legal instrument that requires such exclusions in other river valleys or dry sub-catchments which are susceptible to flash floods. In the current situation, the focus should be on limiting intense socio-economic functions, ensuring that any development is in a suitable location, meeting the technical conditions of buildings and land use requirements in developed plots (such as the proportion of biologically active areas), and delineating potential runoff lines and ensuring runoff of water resulting from flash floods. The role of municipal studies is minor due to the legal nature of these documents.
Improving the flood risk management process is necessary, but ‘the reduction of flood risk, understood globally as a combination of hazard, exposure, and susceptibility, is a rather distant goal’ [69]. The United States is considered the world leader in flood risk reduction. EU countries are adopting various risk reduction strategies [70]. Certainly, coordination of top-down and bottom-up efforts is essential. In both the United States [71] and Europe, the approach to countering flood risk is changing. Increasing resilience should primarily involve preventive measures which reduce the exposure of people and property to flood risk by prohibiting or discouraging development in high-risk areas. Direct tools can include land use planning and the insurance system. Of particular importance is increasing risk awareness, which is not helped by the episodic nature of flash floods. Educating the public, local authorities and urban planners about flash floods is a key challenge. With the intensification of episodic extreme hydrometeorological phenomena, the threat of flooding will increasingly occur outside river valleys. Private investors must be aware of the potential threat, relevant legislation must be implemented, and local governments must uphold compliance. It is important to raise the vulnerability to flooding and therefore to prepare the public for such phenomena and the ability to recover from floods. It allows to connect the policies and the actors of flash flood risk management [72].
Local authorities and residents should be involved in flood risk management, as it is on private properties that a number of risk-reducing measures can be taken, such as increasing the retention of water [68,73]. Authorities in many countries encourage changes in land use, recommending wetland restoration, afforestation, and more extensive farming, but without full public participation it will be difficult to achieve these goals [74]. Land use planning should be more widely integrated into risk reduction and flood prevention at the local scale [35,36,37,75,76].
It should be noted that due to the very high fragmentation of land ownership in the study area, carrying out coordinated measures to reduce soil erosion processes or flash floods is difficult. For example, the introduction of grass waterways or small retention reservoirs is basically not used here so far. Despite the occasional occurrence of high-intensity hydrological and geomorphological phenomena, no comprehensive programs have been implemented. On the other hand, it should be noted that the mosaic of land cover signaled earlier, as well as the processes of land abandonment, are beneficial when it comes to preventing these negative events.
Flood risk management requires multi-sectoral cooperation that coordinates relevant institutions and government entities at different levels of territorial division. The lack of harmonization of policies with the activities of entities responsible for risk management—i.e., civil protection, land use planning, and sectoral programming (e.g., water management)—is not only a systemic problem in Poland. There are many cases where costly structural measures are taken that do not bring the expected benefits. Studies published to date indicate that the opportunities provided by proper land use planning are not fully utilized for flood prevention [39,40,75,76]. The analysis made for small river basins in Lublin Province also indicated that this threat is not recognized in the spatial management process. Relevant provisions are not present in the planning documents of the most susceptible catchments. At the same time, flash floods have occurred in recent years in the Lublin highlands in areas designated as susceptible [49].
Due to the increase in the frequency of extreme weather events, the formation of safe spaces in rural areas is becoming a focus of attention in land use planning [77,78,79]. Studies conducted around the world indicate that the threat of floods, including flash floods, is a serious social problem that reduces living comfort [80,81,82,83,84]. Methodologies for studying the optimal use of land to reduce hazard risks are also being developed. However, far more attention is being paid to the role of land use planning in reducing the risk of flash floods in urban areas than in rural areas [85,86,87,88].
6. Conclusions
Studies have shown the existence of a potential threat to the settlement network located outside river valleys. At the same time, this threat is not recognized in municipalities that are characterized by high susceptibility to flash floods. For areas that are highly susceptible to flash floods, more detailed analyses should be carried out using hydrological and statistical models. At the same time, there is a need for the creation of a database on flash floods that allows the probability of occurrence of such phenomena to be determined. In our opinion, educating society, local authorities, and urban planners about flash floods is a key challenge. Flash floods outside river valleys are not taken into account at the stage of land use planning in areas where there is no permanent drainage. It is, therefore, necessary to implement specific planning procedures and educate residents. Such activities are essential for protecting human lives, reducing economic losses, and ensuring sustainable development in this period of global climate change. Threatened areas should be indicated when preparing local plans, and detailed arrangements should be specified. In catchments in areas used for agriculture, special attention should be paid to increasing retention through proper land cover and in urbanized areas, to maintaining the highest possible shares of biologically active areas and restrictions on the location of new buildings.
Supplementary Materials
The following supporting information can be downloaded at https://www.mdpi.com/article/10.3390/app14188425/s1.
Author Contributions
Conceptualization, L.G. and W.Z.; methodology, L.G. and B.B.-Z.; software, L.G.; validation, L.G.; investigation, L.G., W.Z. and B.B.-Z.; writing—original draft preparation, L.G., W.Z. and B.B.-Z. writing—review and editing, L.G., W.Z. and B.B.-Z.; visualization, L.G.; supervision, W.Z. All authors have read and agreed to the published version of the manuscript.
Funding
This research received no external funding.
Institutional Review Board Statement
Not applicable.
Data Availability Statement
The original contributions presented in the study are included in the article/Supplementary Material, further inquiries can be directed to the corresponding author.
Conflicts of Interest
The authors declare no conflicts of interest.
References
- Gaume, E.; Borga, M. Post-flood field investigations in upland catchments after major flash floods: Proposal of a methodology and illustrations. J. Flood Risk Manag. 2008, 1, 175–189. [Google Scholar] [CrossRef]
- Borga, M.; Anagnostou, E.N.; Blöschl, G.; Creutin, J.D. Flash flood forecasting, warning and risk management: The HYDRATE project. Environ. Sci. Policy 2011, 14, 834–844. [Google Scholar] [CrossRef]
- Gaume, E.; Bain, V.; Bernardara, P.; Newinger, O.; Barbuc, M.; Bateman, A.; Blaškovičova, L.; Blöschl, G.; Borga, M.; Dumitrescu, A.; et al. A compilation of data on European flash floods. J. Hydrol. 2009, 367, 70–78. [Google Scholar] [CrossRef]
- Marchi, L.; Borga, M.; Preciso, E.; Gaume, E. Characterization of selected extreme flash floods in Europe and implications for flood risk management. J. Hydrol. 2010, 394, 118–133. [Google Scholar] [CrossRef]
- Lumbroso, D.; Gaume, E. Reducing the uncertainty in indirect estimates of extreme flash flood discharges. J. Hydrol. 2012, 414–415, 16–30. [Google Scholar] [CrossRef]
- Gourley, J.J.; Hong, Y.; Flamig, Z.L.; Arthur, A.; Clark, R.; Calianno, M.; Ruin, I.; Ortel, T.; Wieczorek, M.E.; Kirstetter, P.-E.; et al. A unified flash flood database across the United States. Bull. Am. Meteorol. Soc. 2013, 94, 799–805. [Google Scholar] [CrossRef]
- Ma, M.; He, B.; Wan, J.; Jia, P.; Guo, X.; Gao, L.; Maguire, L.W.; Hong, Y. Characterizing the Flash Flooding Risks from 2011 to 2016 over China. Water 2018, 10, 704. [Google Scholar] [CrossRef]
- Bryndal, T. Powodzie błyskawiczne w małych zlewniach karpackich—Wybrane aspekty zarządzania ryzykiem powodziowym. Ann. Univ. Paedagog. Cracoviensis Stud. Geogr. 2014, 170, 69–80. [Google Scholar]
- Pociask-Karteczka, J.; Żychowski, J.; Bryndal, T. Zagrożenia związane z wodą—Powodzie błyskawiczne. Gospod. Wodna 2017, 2, 37–42. [Google Scholar]
- Bryndal, T. Local flash floods in Central Europe: A case study of Poland. Nor. Geogr. Tidsskr.–Nor. J. Geogr. 2015, 69, 288–298. [Google Scholar] [CrossRef]
- Mertz, R.; Blöschl, G. A process typology of regional floods. Water Resour. Res. 2003, 39, 1340. [Google Scholar]
- Starkel, L. Heavy rains and floods in Europe during last millenium. Pr. Geogr. 2000, 107, 55–62. [Google Scholar]
- Michalczyk, Z.; Janicki, G.; Rodzik, J.; Siwek, K. Hydrogeomorfologiczne skutki intensywnych opadów na międzyrzeczu Bystrzycy i Giełczwi (Wyżyna Lubelska). Przegląd Naukowy. Inżynieria Kształtowanie Sr. 2008, 17, 30–41. [Google Scholar]
- Rodzik, J.; Janicki, G.; Zagórski, P.; Zgłobicki, W. Deszcze nawalne na Wyżynie Lubelskiej i ich wpływ na rzeźbę obszarów lessowych. Dok. Geogr. 1998, 11, 45–68. [Google Scholar]
- Janicki, G.; Kociuba, W.; Rodzik, J.; Zgłobicki, W. Ekstremalne procesy geomorfologiczne we wschodniej części Wyżyn Polskich—Warunki występowania i oddziaływanie na rzeźbę. Pr. Stud. Geogr. 2010, 45, 11–28. [Google Scholar]
- Janicki, G.; Rodzik, J.; Chabudziński, Ł.; Franczak, Ł.; Siłuch, M.; Stępniewski, K.; Dyer, J.L.; Kołodziej, G.; Maciejewska, E. Monitoring of fluvial transport in small upland catchments-methods and preliminary results. Ann. UMCS Sec. B 2014, 69, 49–60. [Google Scholar] [CrossRef]
- Rodzik, J.; Janicki, G. Local downpours and their erosion effects. Global Chang. 2003, 10, 49–66. [Google Scholar]
- Janicki, G. System stoku zmywowego i jego modelowanie statystyczne—Na przykładzie Wyżyn Lubelsko-Wołyńskich; MCS University Press: Lublin, Poland, 2016. [Google Scholar]
- Siwek, K. Zróżnicowanie opadów atmosferycznych na Lubelszczyźnie w latach 1951–2000. Ph.D. Thesis, UMCS, Lublin, Poland, 2006. [Google Scholar]
- Ziemnicki, S. Skutki deszczu nawalnego we wsi Piaski Szlacheckie pod Krasnymstawem. Gospod. Wodna 1956, 11, 476–480. [Google Scholar]
- Gil, E. Spływ wody i procesy geomorfologiczne w zlewniach fliszowych podczas gwałtownej ulewy w Szymbarku w dniu 7 czerwca 1985 roku. Dok. Geogr. 1998, 11, 85–107. [Google Scholar]
- Bryndal, T.; Cabaj, W.; Ciupa, T. Gwałtowne wezbrania małych cieków w Niecce Nidziańskiej. Przegląd Geogr. 2008, 80, 127–146. [Google Scholar]
- Suligowski, R. The spatial distribution of probable maximum precipitation (PMP) over the Kielce Upland in one day and multi-day intervals. Meteorol. Hydrol. Water Manag. Res. Oper. Appl. 2013, 1, 39–44. [Google Scholar] [CrossRef]
- Bajabaa, S.; Masoud, M.; Al-Amri, N. Flash flood hazard mapping based on quantitative hydrology, geomorphology and GIS techniques (case study of Wadi Al Lith, Saudi Arabia). Arab. J. Geosci. 2014, 7, 2469–2481. [Google Scholar] [CrossRef]
- Costache, R.; Pham, Q.B.; Sharifi, E.; Linh, N.T.T.; Abba, S.; Vojtek, M.; Vojteková, J.; Nhi, P.T.T.; Khoi, D.N. Flash-Flood Susceptibility Assessment Using Multi-Criteria Decision Making and Machine Learning Supported by Remote Sensing and GIS Techniques. Remote Sens. 2020, 12, 106. [Google Scholar] [CrossRef]
- Xiong, J.; Li, J.; Wang, W.; Guo, L. A GIS-Based Support Vector Machine Model for Flash Flood Vulnerability Assessment and Mapping in China. ISPRS Int. J. Geo-Inf. 2019, 8, 297. [Google Scholar] [CrossRef]
- Abdelkareem, M. Targeting flash flood potential areas using remotely sensed data and GIS techniques. Nat. Hazards 2017, 85, 19–37. [Google Scholar] [CrossRef]
- Costache, R.; Zaharia, L. Flash-flood potential assessment and mapping by integrating the weights-of-evidence and frequency ratio statistical methods in GIS environment—Case study: Bâsca Chiojdului River catchment (Romania). J. Earth Syst. Sci. 2017, 126, 59. [Google Scholar] [CrossRef]
- Liu, C.; Li, Y. GIS-based dynamic modelling and analysis of flash floods considering land-use planning. Int. J. Geogr. Inf. Sci. 2017, 31, 481–498. [Google Scholar] [CrossRef]
- Pham, B.T.; Avand, M.; Janizadeh, S.; Phong, T.V.; Al-Ansari, N.; Ho, L.S.; Das, S.; Le, H.V.; Amini, A.; Bozchaloei, S.K.; et al. GIS Based Hybrid Computational Approaches for Flash Flood Susceptibility Assessment. Water 2020, 12, 683. [Google Scholar] [CrossRef]
- Bui, D.T.; Tsangaratos, P.; Ngo, P.T.; Pham, T.D.; Pham, B.T. Flash flood susceptibility modeling using an optimized fuzzy rule based feature selection technique and tree based ensemble methods. Sci. Total Environ. 2019, 668, 1038–1054. [Google Scholar] [CrossRef] [PubMed]
- Khosravi, K.; Pham, B.T.; Chapi, K.; Shirzadi, A.; Shahabi, H.; Revhaug, I.; Prakash, I.; Tien Bui, D. A comparative assessment of decision trees algorithms for flash flood susceptibility modeling at Haraz watershed, northern Iran. Sci. Total Environ. 2018, 627, 744–755. [Google Scholar] [CrossRef]
- Khosravi, K.; Pourghasemi, H.R.; Chapi, K.; Bahri, M. Flash flood susceptibility analysis and its mapping using different bivariate models in Iran: A comparison between Shannon’s entropy, statistical index, and weighting factor models. Environ Monit Assess 2016, 188, 656. [Google Scholar] [CrossRef]
- Youssef, A.M.; Pradhan, B.; Sefry, S.A. Flash flood susceptibility assessment in Jeddah city (Kingdom of Saudi Arabia) using bivariate and multivariate statistical models. Environ. Earth Sci. 2016, 75, 12. [Google Scholar] [CrossRef]
- Saleh, A. Flash Flood Susceptibility Modelling: A Review. IOP Conf. Ser. Mater. Sci. Eng. 2020, 712, 012005. [Google Scholar] [CrossRef]
- Díez-Herrero, A.; Garrote, J. Flood Risk Assessments: Applications and Uncertainties. Water 2020, 12, 2096. [Google Scholar] [CrossRef]
- Cheng, Z.; Georgakakos, K.P.; Spencer, C.R.; Banks, R. Numerical Modeling of Flash Flood Risk Mitigation and Operational Warning in Urban Areas. Water 2022, 14, 2494. [Google Scholar] [CrossRef]
- Hamilton, K.; Smith, S.R.; Wright, C.; Buchhorn, Y.M.; Peden, A.E. Predicting and Changing Intentions to Avoid Driving into Urban Flash Flooding. Water 2022, 14, 3477. [Google Scholar] [CrossRef]
- Franczak, P.; Listwan-Franczak, K.; Działek, J.; Biernacki, W. Planowanie przestrzenne na obszarach zalewowych w zlewniach górskich różnego rzędu w dorzeczu górnej Wisły oraz górnej i środkowej Odry. Pr. Stud. Geogr. 2016, 61, 25–45. [Google Scholar]
- Neuvel, J.M.M. Geographical Dimensions of Risk Management. The Contribution of Spatial Planning and Geo-ICT to Risk Reduction. Ph.D. Thesis, Wageningen University, Wageningen, The Netherlands, 2009. [Google Scholar]
- Ran, J.; Nedovic-Budic, Z. Integrating spatial planning and flood risk management: A new conceptual framework for the spatially integrated policy infrastructure. Comput. Environ. Urban Syst. 2016, 57, 68–79. [Google Scholar] [CrossRef]
- Gralepois, M. What Can We Learn from Planning Instruments in Flood Prevention? Comparative Illustration to Highlight the Challenges of Governance in Europe. Water 2020, 12, 1841. [Google Scholar] [CrossRef]
- Christensen, J.H.; Christensen, O.B. Climate modelling: Severe summertime flooding in Europe. Nature 2003, 421, 805–806. [Google Scholar] [CrossRef]
- Wilson, E. Adapting to Climate Change at the Local Level: The Spatial Planning Response. Local Environ. 2006, 11, 609–625. [Google Scholar] [CrossRef]
- Onur, A.Z.; Tezer, A. 2015. Ecosystem services based spatial planning decision making for adaptation to climate changes. Habitat Int. 2015, 47, 267–278. [Google Scholar] [CrossRef]
- Powodzie błyskawiczne—Coraz Częstsze Zmartwienie Samorządów. Available online: https://wodnesprawy.pl/powodzie-blyskawiczne-coraz-czestsze-zmartwienie-sa (accessed on 18 May 2024).
- Powodzie Błyskawiczne Coraz Częstsze Zjawisko w Polskich Miastach. Available online: https://piu.org.pl/blogpiu/powodzie-blyskawiczne-coraz-czestsze-zjawisko-w-polskich-miastach (accessed on 18 May 2024).
- Bryndal, T. Identyfikacja małych zlewni podatnych na formowanie gwałtownych wezbrań (na przykładzie Pogórza Dynowskiego, Strzyżowskiego i Przemyskiego. Przegląd Geogr. 2011, 83, 27–49. [Google Scholar] [CrossRef]
- Baran-Zgłobicka, B.; Godziszewska, D.; Zgłobicki, W. The Flash Floods Risk in the Local Spatial Planning (Case Study: Lublin Upland, E Poland). Resources 2021, 10, 14. [Google Scholar] [CrossRef]
- Uziak, S.; Turski, R. (Eds.) Środowisko przyrodnicze Lubelszczyzny; Lubelskie Towarzystwo Naukowe: Lublin, Poland, 2009. [Google Scholar]
- Baran-Zgłobicka, B.; Zgłobicki, W. Mosaic landscapes of SE Poland: Should we preserve them? Agrofor. Syst. 2012, 85, 351–365. [Google Scholar] [CrossRef]
- Zgłobicki, W.; Karczmarczuk, K.; Baran-Zgłobicka, B. Intensity and Driving Forces of Land Abandonment in Eastern Poland. Appl. Sci. 2020, 10, 3500. [Google Scholar] [CrossRef]
- Bank Danych Lokalnych. Available online: https://bdl.stat.gov.pl/bdl/start (accessed on 23 May 2024).
- Geoportal Infrastruktury Informacji Przestrzennej (w Polsce). Główny Urząd Geodezji i Kartografii. Available online: https://www.geoportal.gov.pl/ (accessed on 5 February 2024).
- Woźniak, P. High Resolution Elevation Data in Poland. In Geomorphometry for Geosciences; Adam Mickiewicz Uniwersity: Poznań, Poland, 2015; pp. 13–14. [Google Scholar]
- Chrobak, T.; Łabaj, A.; Bolibok, A. (Eds.) Baza danych obiektów topograficznych. Podręcznik dla uczestników szkolenia z możliwości, form i metod zastosowania bazy danych obiektów topograficznych; GUGiK: Warszawa, Poland, 2014. [Google Scholar]
- Jasiewicz, J.; Stepinski, T.F. Geomorphons—A Pattern Recognition Approach to Classification and Mapping of Landforms. Geomorphology 2013, 182, 147–156. [Google Scholar] [CrossRef]
- Regionalna Infrastruktura Informacji Przestrzennej Województwa Lubelskiego. Available online: https://gis.lubelskie.pl/bezplatne-dane/ (accessed on 30 May 2024).
- Ostrowski, J.; Czarnecka, H.; Glowacka, B.; Krupa-Marchlewska, J.; Zaniewska, M.; Sasim, M.; Moskwicki, T.; Dobrowolski, A. Nagłe powodzie lokalne (flash flood) w Polsce i skala ich zagrożeń. In Wpływ Zmian Klimatu na Środowisko, Gospodarkę i Społeczeństwo. Tom 3, Klęski Żywiołowe a Bezpieczeństwo Wewnętrzne Kraju; Lorenc, H., Ed.; Wydawnictwo IMGW-PIB: Warszawa, Poland, 2012; pp. 123–149. [Google Scholar]
- Weingartner, R.; Barben, M.; Spreafico, M. Floods in mountain areas—An overview based on examples from Switzerland. J. Hydrol. 2003, 282, 10–24. [Google Scholar] [CrossRef]
- Dyrektywa 2007/60/WE Parlamentu Europejskiego i Rady z dnia 23 Października 2007 r. w Sprawie Oceny Ryzyka Powodziowego i Zarządzania nim. Dziennik Urzędowy Unii Europejskiej, L. 228 z 06.11.2007 r. Available online: https://sip.lex.pl/akty-prawne/dzienniki-UE/dyrektywa-2007-60-we-w-sprawie-oceny-ryzyka-powodziowego-i-zarzadzania-nim-67719456 (accessed on 5 February 2024).
- Ustawa z dnia 20 lipca 2017 r. Prawo wodne. Dziennik Ustaw 2017 poz. 1566 z późn. zm. Available online: https://isap.sejm.gov.pl/isap.nsf/DocDetails.xsp?id=WDU20170001566 (accessed on 5 February 2024).
- Ustawa z dnia 27 Marca 2003 r. o Planowaniu i Zagospodarowaniu Przestrzennym. Dziennik Ustaw 2004 nr 80 poz. 714 z późn. zm. Available online: https://isap.sejm.gov.pl/isap.nsf/DocDetails.xsp?id=wdu20030800717 (accessed on 5 February 2024).
- Ustawa z Dnia 3 Lutego 1995 r. o Ochronie Gruntów Rolnych i Leśnych. Dziennik Ustaw 1995 nr 16 poz. 78 z późn. zm. Available online: https://isap.sejm.gov.pl/isap.nsf/DocDetails.xsp?id=wdu19950160078 (accessed on 5 February 2024).
- Ustawa z Dnia 7 Lipca 2023 r. o Zmianie Ustawy o Planowaniu i Zagospodarowaniu Przestrzennym Oraz Niektórych Innych Ustaw. Dziennik Ustaw 2023 poz. 1688. Available online: https://isap.sejm.gov.pl/isap.nsf/DocDetails.xsp?id=WDU20230001688 (accessed on 5 February 2024).
- Nowak, M.J. Decyzje o Warunkach Zabudowy i Zagospodarowania Terenu w Gospodarowaniu i Zarządzaniu Przestrzenią; CeDeWu: Warszawa, Poland, 2012. [Google Scholar]
- Ustawa z Dnia 27 Kwietnia 2001 r. Prawo ochrony Środowiska. Dziennik Ustaw 2001 nr 62 poz. 627 z późn. zm. Available online: https://isap.sejm.gov.pl/isap.nsf/DocDetails.xsp?id=wdu20010620627 (accessed on 5 February 2024).
- Studium Uwarunkowań i Kierunków Zagospodarowania Miasta i Gminy Krasnobród. Załącznik do uchwały Rada Miasta. 2017. Available online: http://archiwum.krasnobrod.pl/dat/attach/2017-05/19048_studium-kierunki-krasnobrod_wylozenie.pdf (accessed on 5 February 2024).
- Kundzewicz, Z.W.; Hegger, D.L.T.; Matczak, P.; Driessen, P.P.J. Flood-risk reduction: Structural measures and diverse strategies [Opinion]. Proc. Natl. Acad. Sci. USA 2018, 115, 12321–12325. [Google Scholar] [CrossRef] [PubMed]
- Driessen, P.P.J.; Hegger, D.L.T.; Kundzewicz, Z.W.; Van Rijswick, H.F.M.W.; Crabbé, A.; Larrue, C.; Matczak, P.; Pettersson, M.; Priest, S.; Suykens, C.; et al. Governance Strategies for Improving Flood Resilience in the Face of Climate Change. Water 2018, 10, 1595. [Google Scholar] [CrossRef]
- Tullos, D. Opinion: How to achieve better flood-risk governance in the United States. Proc. Natl. Acad. Sci. USA 2018, 115, 3731–3734. [Google Scholar] [CrossRef] [PubMed]
- Sapountzaki, K.; Wanczura, S.; Casertano, G.; Greiving, S.; Xanthopoulos, G.; Ferrara, F.F. Disconnected policies and actors and the missing role of spatial planning throughout the risk management cycle. Nat. Hazards 2011, 59, 1445–1474. [Google Scholar] [CrossRef]
- Raikes, J.; Smith, T.F.; Jacobson, C.; Baldwin, C. Pre-disaster planning and preparedness for floods and droughts: A systematic review. Int. J. Disaster Risk Reduct. 2019, 38, 101207. [Google Scholar] [CrossRef]
- Rouillard, J.J.; Reeves, A.D.; Heal, K.V.; Ball, T. The role of public participation in encouraging changes in rural land use to reduce flood risk. Land Use Policy 2014, 38, 637–645. [Google Scholar] [CrossRef]
- Neuvel, J.M.M.; Van Den Brink, A. Flood risk management in Dutch local spatial planning practices. J. Environ. Plan. Manag. 2009, 52, 865–880. [Google Scholar] [CrossRef]
- Franczak, P.; Listwan, K. Ryzyko powodziowe w małych zlewniach górskich a sposoby zagospodarowania obszarów zalewowych zapisane w aktach planistycznych. Studium przypadku Makowa Podhalańskiego i Kasinki Małej. In Współczesne problemy i kierunki badawcze w geografii tom 3; Liro, J., Liro, M., Krąż, P., Eds.; Instytut Geografii i Gospodarki Przestrzennej UJ: Kraków, Poland, 2015; pp. 45–61. [Google Scholar]
- Meng, M.; Dabrowski, M.; Stead, D. Enhancing Flood Resilience and Climate Adaptation: The State of the Art and New Directions for Spatial Planning. Sustainability 2020, 12, 7864. [Google Scholar] [CrossRef]
- Tate, E.; Rahman, A.; Emrich, C.T.; Sampson, C.C. Flood exposure and social vulnerability in the United States. Nat. Hazards 2021, 106, 435–457. [Google Scholar] [CrossRef]
- Fox, S.; Agyemang, F.; Hawker, L.; Neal, J. Integrating social vulnerability into high-resolution global flood risk mapping. Nat. Commun. 2024, 15, 3155. [Google Scholar] [CrossRef]
- Chaladdee, A.; Kim, S.M.; Nitivattananon, V.; Pal, I.; Roy, J.; Roachanakanan, T. Trend Analysis of Mainstreaming Flood Risk Reduction into Spatial Planning in Thailand. Sustainability 2022, 14, 1119. [Google Scholar] [CrossRef]
- Kocsis, I.; Bilașco, Ș.; Irimuș, I.-A.; Dohotar, V.; Rusu, R.; Roșca, S. Flash Flood Vulnerability Mapping Based on FFPI Using GIS Spatial Analysis Case Study: Valea Rea Catchment Area, Romania. Sensors 2022, 22, 3573. [Google Scholar] [CrossRef]
- Lazarević, K.; Todosijević, M.; Vulević, T.; Polovina, S.; Momirović, N.; Caković, M. Determination of Flash Flood Hazard Areas in the Likodra Watershed. Water 2023, 15, 2698. [Google Scholar] [CrossRef]
- Chakraborty, L.; Thistlethwaite, J.; Minano, A.; Henstra, D.; Scott, D. Leveraging Hazard, Exposure, and Social Vulnerability Data to Assess Flood Risk to Indigenous Communities in Canada. Int. J. Disaster Risk Sci. 2021, 12, 821–838. [Google Scholar] [CrossRef]
- Kocur-Bera, K. Kształtowanie bezpiecznej przestrzeni obszarów wiejskich w aspekcie występowania ekstremalnych zjawisk pogodowych; Wydawnictwo Uniwersytetu Warmińsko-Mazurskiego: Olsztyn, Poland, 2016. [Google Scholar]
- Bach, P.M.; Kuller, M.; McCarthy, D.T.; Deletic, A. A spatial planning-support system for generating decentralised urban stormwater management schemes. Sci. Total. Environ. 2020, 726, 138282. [Google Scholar] [CrossRef] [PubMed]
- Simperler, L.; Himmelbauer, P.; Ertl, T.; Stoeglehner, G. Prioritization of stormwater management sites in urban areas. J. Environ. Manag. 2020, 265, 110507. [Google Scholar] [CrossRef]
- Gandini, A.; Garmendia, L.; Prieto, I.; Álvarez, I.; San-José, J.-T. A holistic and multi-stakeholder methodology for vulnerability assessment of cities to flooding and extreme precipitation events. Sustain. Cities Soc. 2020, 63, 102437. [Google Scholar] [CrossRef]
- Palacio-Aponte, A.G.; Ortíz-Rodríguez, A.J.; Sandoval-Solis, S. Methodological framework for territorial planning of urban areas: Analysis of socio-economic vulnerability and risk associated with flash flood hazards. Appl. Geogr. 2022, 149, 102809. [Google Scholar] [CrossRef]


Disclaimer/Publisher’s Note: The statements, opinions and data contained in all publications are solely those of the individual author(s) and contributor(s) and not of MDPI and/or the editor(s). MDPI and/or the editor(s) disclaim responsibility for any injury to people or property resulting from any ideas, methods, instructions or products referred to in the content. |
© 2024 by the authors. Licensee MDPI, Basel, Switzerland. This article is an open access article distributed under the terms and conditions of the Creative Commons Attribution (CC BY) license (https://creativecommons.org/licenses/by/4.0/).