Article

Numerical Study on Heat Transfer and Thermal–Mechanical Performance of Actively Cooled Channel of All-Movable Rudder under Supercritical Pressure

1
Guangdong Aerospace Research Academy, Guangzhou 511458, China
2
Institute of Mechanics, Chinese Academy of Sciences, Beijing 100190, China
*
Author to whom correspondence should be addressed.
Appl. Sci. 2024, 14(18), 8434; https://doi.org/10.3390/app14188434
Submission received: 30 August 2024 / Revised: 15 September 2024 / Accepted: 17 September 2024 / Published: 19 September 2024

Abstract

:
The utilization of an actively cooled thermal protection system is widely recognized as an effective approach to decrease the temperature of components exposed to severe aerodynamic heating. In this study, two cooling schemes with different flow paths and structural configurations were proposed, and six cooling channel designs were developed by modifying the leading-edge details. A numerical analysis on the heat transfer and thermal–mechanical performance was conducted under actual flight conditions (30 km altitude, Mach 8). The results highlight an optimal design scheme that balances temperature control and minimized coolant flow rates. The channel flow field demonstrated its superiority by effective convective heat transfer and improved fluid mixing facilitated through recirculation zones and turbulence at the bends. Structural assessments showed that the optimal scheme not only provided better cooling but also preserved the structural integrity. Overall, the study offers a practical and effective thermal protection approach for air rudders subjected to severe heat.

1. Introduction

Hypersonic vehicles (HVs) are next-generation aircrafts capable of long-duration cruising in the near-space atmosphere at speeds exceeding Mach 5, primarily designed for space transportation, surveillance, and military operations [1]. During high-speed flight, the outer surfaces of HVs experience significant compression, friction, and viscous dissipation with the surrounding atmosphere, resulting in intense aerodynamic heating [2]. The air rudder is a crucial component within the control system of HVs that protrudes from the streamlined fuselage surface. Under extreme heat conditions, it becomes vulnerable to reaching elevated temperatures, which can lead to material failure or actuation malfunction and pose substantial safety risks to HVs [3,4]. To address these challenges, a thermal protection system (TPS) is essential. The TPS is an integrated set of technologies and components specifically designed to shield vehicle structures from overheating in harsh thermal environments. For the air rudder, the TPS functions to manage and mitigate thermal loads, thereby maintaining survivable temperatures, ensuring standard functionality, and preserving the structural integrity.
According to the protection mechanism and operational characteristics, the TPS can be categorized into three types: passive, semi-passive, and actively cooled [5,6]. Considering the structural and functional attributes of the air rudder, as well as the peak and distribution characteristics of the surface heat flux, not all TPSs are suitable for implementation. For instance, utilizing a passive heat-sink TPS in an air rudder would significantly increase its mass burden and fail to meet the lightweight requirements. Moreover, employing a semi-passive ablative TPS may alter the shape of the air rudder and impact its maneuvering function. Lastly, incorporating a passive multilayer insulating TPS for air rudders becomes redundant when an internal low-temperature environment isn’t required. In this scenario, passive hot structures [7] become the most prevalent and extensively utilized type because of their exceptionally high-temperature resistance, light weight, ease of assembly, and absence of additional energy consumption. Common materials for hot structures include high-melting-point alloy, carbon fiber-reinforced carbon (C/C) matrixes, and carbon fiber-reinforced silicon carbide (C/SiC) matrixes. The Hopper vehicle [8] utilizes C/SiC composites for rudders, elevons, and body caps with a maximum temperature of 1700 K. The X-33 aircraft [9] employs C/C composites to protect its aerosurface leading edges from high heating. Taking the X-43 vehicle as an example [10], the control surface is made of hybrid materials consisting of Haynes 230 superalloy for the main framework and C/C composites for the leading edge.
However, superalloys have a limited capacity for withstanding high temperatures, C/C composites are susceptible to oxidation at elevated temperatures (above 500 °C), and C/SiC composites are prone to fatigue microcracks due to their inherent brittleness. Consequently, the design of hot structures heavily relies on advancements in the thermal resistance of materials, which hinders product upgrades. Recently, there has been significant interest in the semi-passive heat-pipe-cooled TPS [11], as it enables the efficient transfer of substantial aerodynamic heat from the stagnation zone of high heat fluxes to the flat-tail region of low heat fluxes and radiates this heat into the surrounding atmosphere. Steeves et al. [12] suggested integrating flat heat pipes into the leading edges to enhance heat conduction and dissipation. Through an isothermal analytical approximation method, they demonstrated the feasibility of utilizing a composite material consisting of the niobium alloy Cb-752 in conjunction with a lithium working medium for cooling leading edges with a radius of 3 mm under flight conditions ranging from Mach 6 to 8. Xiao et al. [13] developed a conjugated-based, three-dimensional numerical method to investigate the heat transfer characteristics and limitations of the heat-pipe-cooled TPS. Liu et al. [14] employed a three-dimensional numerical method to predict the thermal performance of a platelet heat-pipe-cooled TPS. The results demonstrated that the TPS design, incorporating IN718 as the solid material and sodium as the working fluid, successfully satisfies the cooling requirements for a leading edge with a radius of 15 mm under flight conditions of Mach 8 at an altitude of 34 km. In Ref. [15], utilizing the well-established numerical methods, the feasibility of a platelet heat-pipe-cooled leading edge with sodium and lithium as the working medium is discussed under nominal and failure conditions. Calculations of the temperature and stress were performed for different wall materials and thicknesses to study the structural robustness.
Despite the numerous advantages of heat-pipe-cooled TPSs, their broader application in air rudders has been limited due to the restricted capacity for bearing heat loads and the complexities entailed in the design, fabrication, and operation. In contrast, the actively cooled TPS [16,17] has emerged as a superior alternative for critical components operating in extreme thermal environments. This is particularly true for future HVs that will require faster speeds, longer cruising durations, and stronger maneuverability. The implementation of the actively cooled TPS can be achieved through various methods, including convective cooling [18,19,20], film cooling [21], and transpiration cooling [22]. Convective cooling offers a simpler and more feasible solution compared to the latter two cooling methods. Dechaumphai et al. [23] present an integrated fluid–thermal–structural finite element approach to study the response of hydrogen-cooled leading edges subjected to intense aerodynamic heating. Maruyama et al. [24] theoretically investigated the transient heat transfer by combined conduction, convection, and radiation in a semitransparent porous medium, considering gas injection through the layer. The results demonstrated that the actively cooled TPS alters the temperature distribution in the solid matrix and significantly reduces the time required to reach steady-state conditions. Additionally, it was found that the thickness of the porous layer and the radiation properties substantially impact the temperature distribution and insulation performance. Calmidi and Mahajan [25] conducted an experimental and numerical study on forced convection in highly porous metal foams, finding that foam–water combinations exhibit significantly higher thermal dispersion than foam–air combinations. The numerical model was validated and further utilized to investigate various combinations of solid materials and fluids. Rakow and Waas [26] present a thermo-mechanical analysis of actively cooled metal foam sandwich panels using experimental and analytical approaches. By pumping compressed air through the metal foam core, this actively cooled system could effectively eliminate elevated temperatures and control the thermo-mechanical deformation. Using a finite difference method, Liu et al. [27] modeled both traditional and actively cooled TPSs. The numerical predictions indicate that the conventional TPS fails to ensure that the internal titanium alloy structure remains within the operating temperature limit, whereas active cooling offers a viable solution. Ferrari et al. [28] proposed an actively cooled TPS composed of a porous ceramic core and ceramic matrix composite material, which enhances heat dissipation by introducing flowing gas into the core layer. Simulation methods were utilized to identify porous materials with optimal mechanical and thermal flow dynamic properties, while additive manufacturing techniques were employed to fabricate leading-edge components. Finally, experimental verification was conducted in a plasma wind tunnel. Xie et al. [29] proposed an actively cooled TPS based on a corrugated sandwich structure, studying the influence effect of the inlet velocity and flow direction on its thermal characteristics, and its response under thermal–mechanical loading. In Ref. [30], the authors introduce another actively cooled TPS using pyramid core sandwich panels with cooling channels in the top panel to maintain a safe temperature range for the underlying structure. The study analyzed the flow fields and mechanisms in four types of cooling channels and discusses the impact of the flow conditions on the thermal–fluid performance. Qiao et al. [31] studied the thermal–hydraulic performance of bend tubes with different section shapes (circular, rectangular, and pentagonal) in an actively cooled TPS for hypersonic aircraft. Through a comparative analysis, they proposed a diamond-shaped channel using RP-3 as the coolant. The feasibility and advantages of this design were subsequently verified through numerical simulation. In Ref. [32], the previously proposed “Diamond” channel was further improved by adding discrete inclined ribs. The cooling effects and the impacts of different parameters were numerically investigated. To address the complex and time-consuming issue of evaluating the actively cooled effects through experimental or numerical methods, Hu et al. [33] propose an efficient analytical model capable of accurately predicting the maximum temperature and temperature distribution. Recently, the layout of the active cooling network throughout the aircraft was analyzed by Gou et al. [34,35] from a thermal management perspective. This analysis covered various components, such as the windward and leeward sides of the fuselage and the wings, air rudders, and power systems. Moreover, fractal channels have received much attention. As bionic channels, they produce significantly efficient cooling channels by mimicking natural evolution and may be an ideal candidate for the cooling channels of air rudders. Chen et al. [36] propose a combined parametric model to describe fractal channels of Y, V, and T shapes and provide a fast-parametric modeling method. The results indicate that, among these configurations, the V-shaped network exhibits a better cooling performance, while the Y-shaped network demonstrates a superior flow performance.
It is evident that there exists a substantial research gap concerning active cooling thermal protection systems (TPSs) for air rudders. Hence, this work proposed two distinct cooling schemes with varying flow paths and structural designs and developed six cooling channel configurations by modifying the leading-edge details. The cooling efficiency was assessed under simulated flight conditions (30 km altitude, Mach 8), with an emphasis on managing the temperatures and optimizing the coolant flow rates. Both series and parallel cooling circuit arrangements were analyzed, incorporating suitable settings for the inlet flow rates and temperatures. A thorough evaluation was performed to assess the temperature distributions, flow dynamics, and thermal–mechanical behaviors of the different cooling channel designs. These findings establish a foundation for future research and practical applications of actively cooled air rudders.

2. Numerical Modeling

2.1. Physical Model Details

2.1.1. Description of Active Cooling System and Simplified All-Movable Rudder

The active cooling system for HVs proposed in this paper, as illustrated in Figure 1, is an extension of the conventional active regenerative cooling technology. In this system, a portion of the low-temperature fuel is directly pumped into the cooling channels of the combustor wall to absorb the heat generated by combustion. Simultaneously, another portion of the low-temperature fuel is circulated through a network of cooling channels to dissipate the excess heat from the aerodynamically heated components, such as the wings, cones, air rudders, and elevators. Subsequently, these elevated-temperature fuels are injected into the combustion chamber where they undergo chemical reactions to generate thrust as required. As a thermal protection method of HVs, the active cooling system can not only reduce the wall temperature of the engine and various high-temperature components but can also increase the fuel temperature so as to reduce the ignition delay time and improve the combustion efficiency.
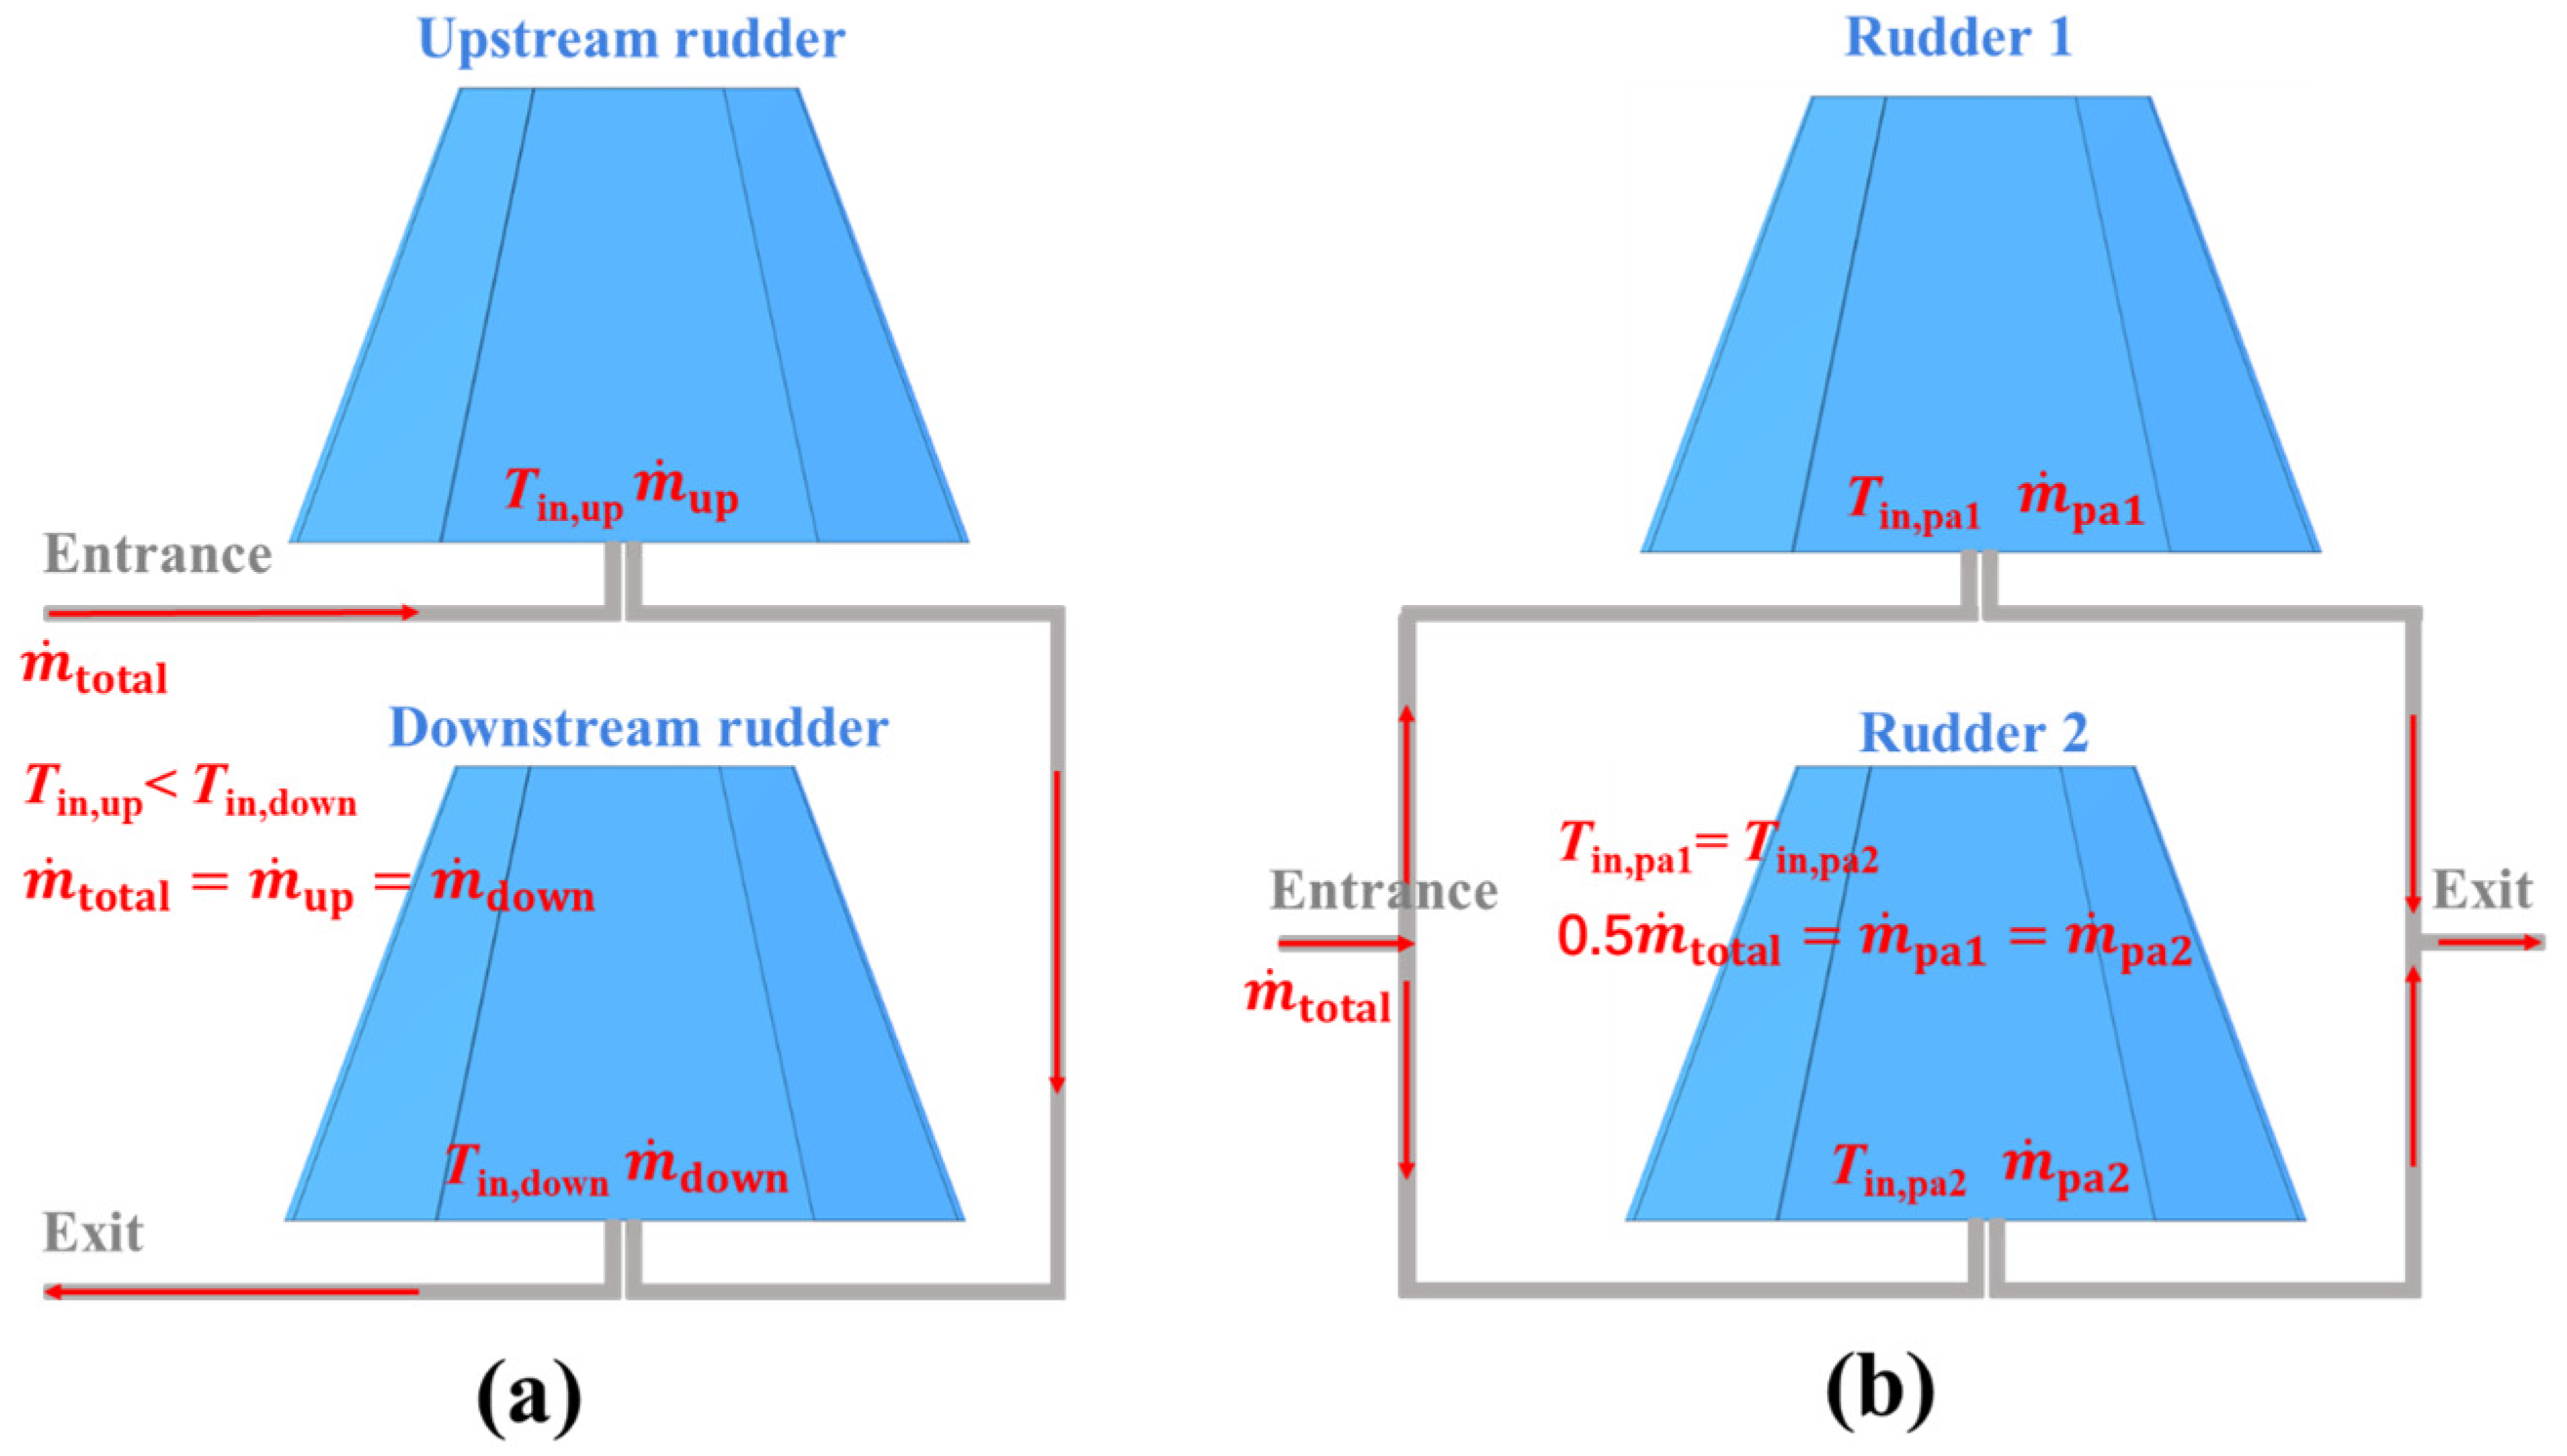
The all-movable rudder, with its fully-rotational characteristic, can provide greater control force and higher rudder effectiveness during high-speed flight. For the effective management of the aerodynamic heat from the two rudders located at the tail of the vehicle, it is crucial to appropriately distribute the coolant supply pipeline layout throughout the fuselage in order to improve the performance of the active cooling system. The coolant supply pipeline for the two rudders is determined by the thermal management strategy and typically involves two configurations, as shown in Figure 2: series and parallel arrangements. In the series arrangement, both rudders are assumed to have identical inlet mass flow rates and are equal to the total mass flow rate of the rudder branch. However, due to heat transfer from the rudder surface and heat exchange at the rudder shaftgaps, the downstream rudder experiences a higher inlet temperature compared to that of the upstream one. Conversely, in the parallel arrangement, both rudders are assumed to receive equal mass flow rates—each half of the total flow rate—while maintaining the same inlet temperature for both rudders.
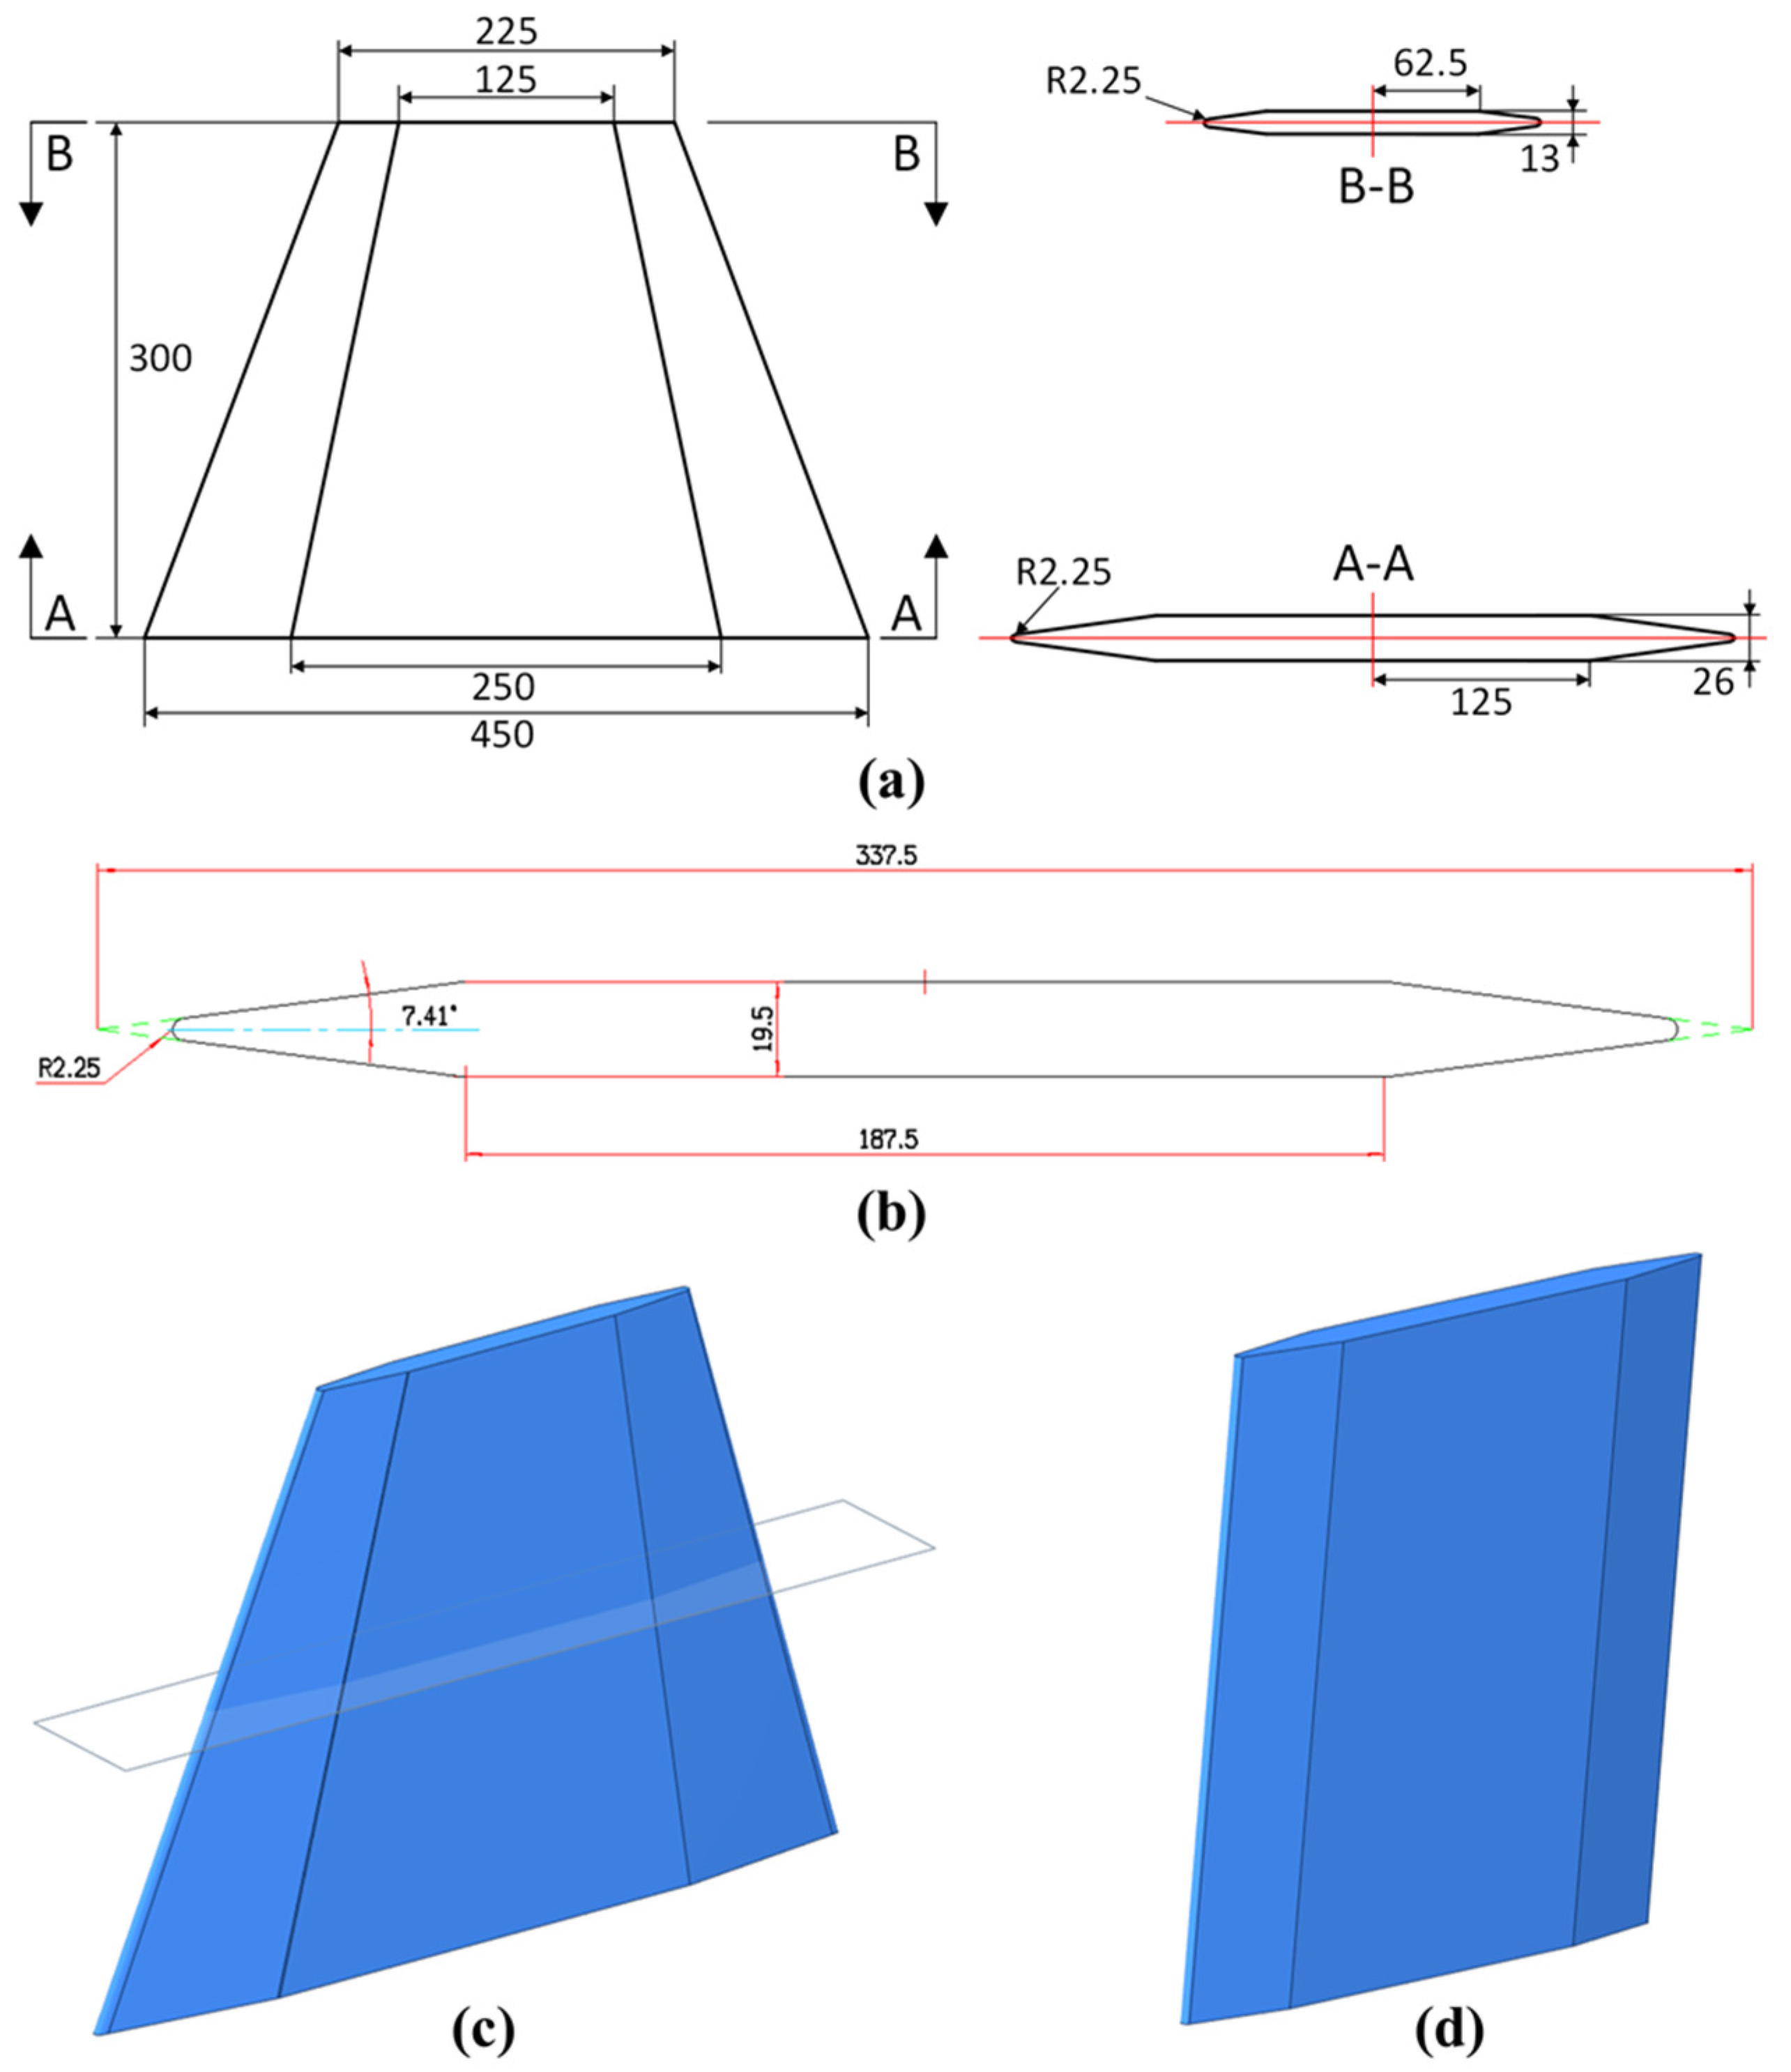
Figure 3 provides an overview of the geometry and cross-section dimensions of the all-movable rudder investigated in this study. The key dimensions include a spread length of 300 mm (measured from the rudder root to the tip), a chord length of 450 mm at the rudder root with a thickness of 26 mm, and a chord length at the rudder tip of 225 mm with a thickness of 13 mm. Moreover, the leading and trailing edges are chamfered with a radius of 2.25 mm to balance the aerodynamic heat and drag.
However, the intricate geometric features of the all-movable rudder, including forward and backward sweeps as well as variable cross sections, made the actual design process exceedingly challenging. Consequently, to simplify the design process and reduce the computational cost, a preliminary design was implemented, using a simplified one with no forward or backward sweeps, while maintaining a consistent cross section. This approach aimed to satisfy the periodic boundary conditions required for the subsequent single-channel analysis. Specifically, the cross-sectional dimensions at 150 mm (axially) from the rudder root were used.

2.1.2. Two Actively Cooled Options for the Simplified All-Movable Rudder

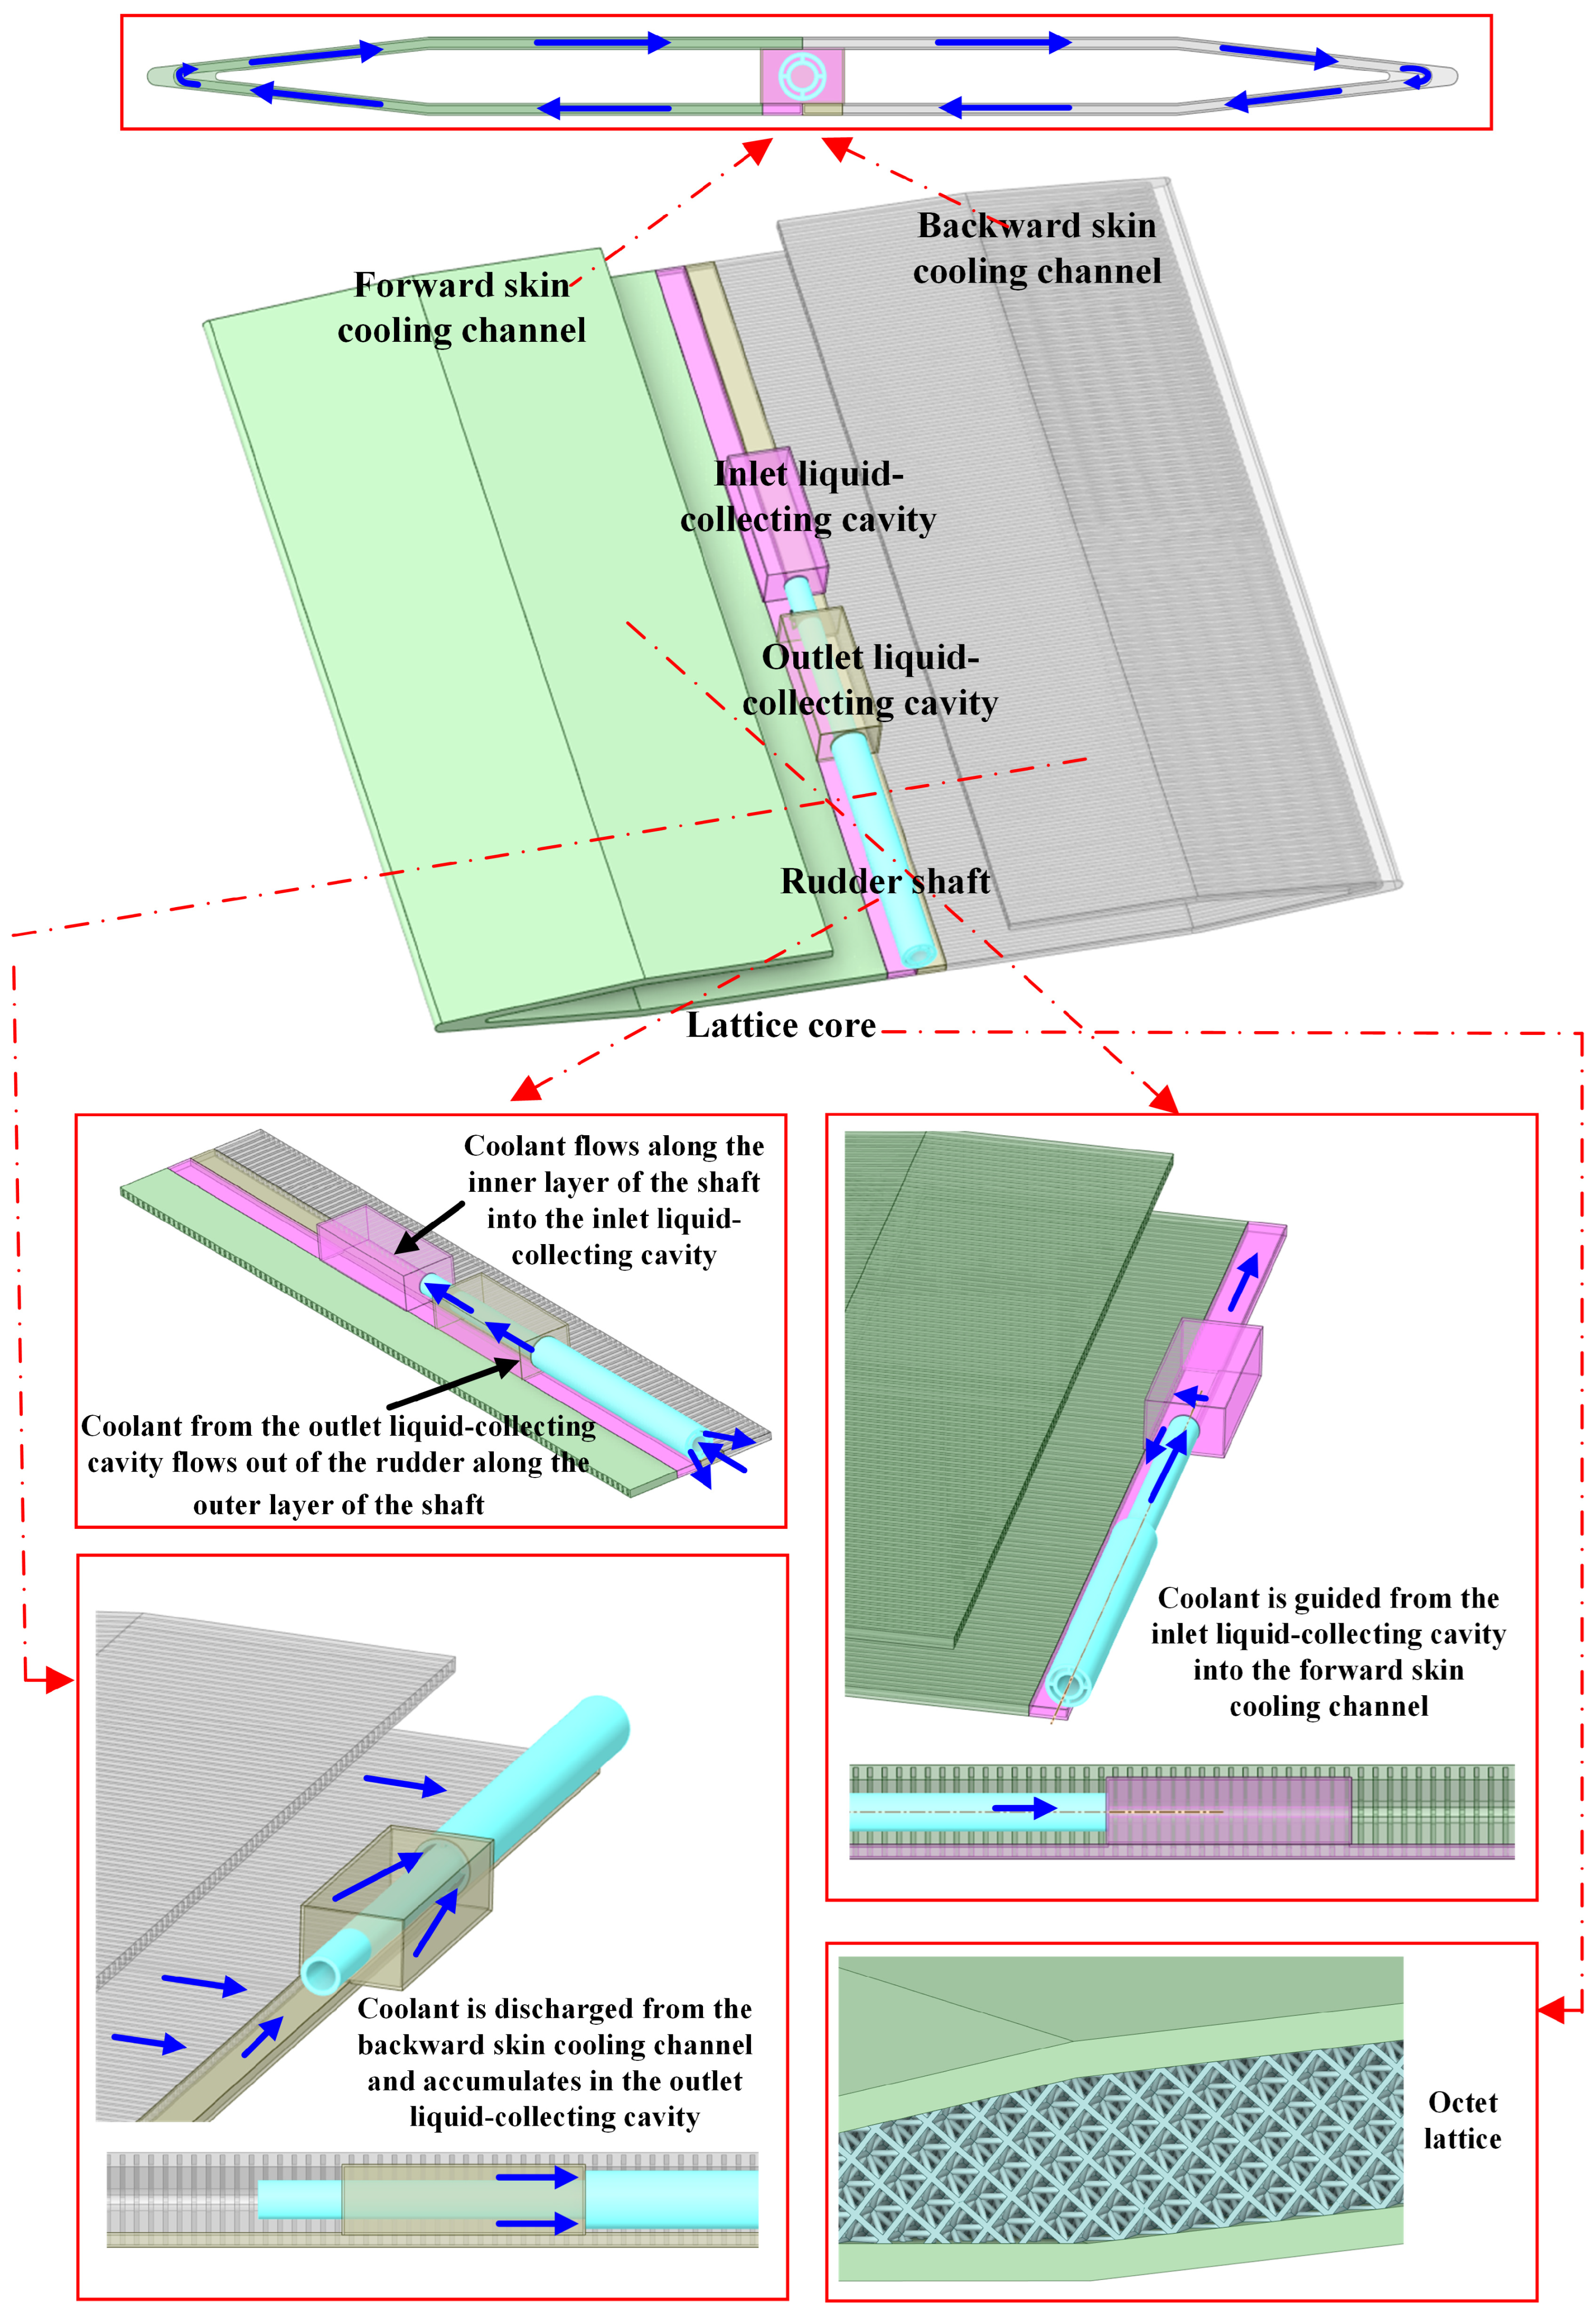
Two different active convection cooling schemes are proposed for this simplified all-movable rudder. Figure 4 shows the structural layout of the first scheme, denoted as A1, where “1” represents the standard configuration. The rudder mainly consists of five parts: the rudder shaft, the inlet liquid-collecting cavity, the skin (containing the cooling channels), the outlet liquid-collecting cavity, and the lattice core layer. (i) The rudder shaft comprises two layers: the inner layer serves as the coolant inflow channel, while the outer layer functions as the coolant outflow channel. (ii) The inlet liquid-collecting cavity is used to revive the coolant flowing from the inner layer of the rudder shaft and towards the cooling channels of the skins. (iii) The skin functions as a carrier for the cooling channels (the forward skin cooling channel and backward skin cooling channel) in the active cooling system. These channels encircle the rudder within the skin, with the inlet connected to the inlet liquid-collecting cavity and the outlet connected to the outlet liquid-collecting cavity. The internal coolant flows along the cooling channels and convectively exchanges heat with the skin, removing most of the heat energy. (iv) The outlet liquid-collecting cavity gathers the heated coolant from the cooling channel and directs it into the outer layer of the rudder shaft. (v) The lattice core layer is the main bearing structure of the air rudder and has superior strength, stiffness, and lightweight characteristics over conventional beam–rib structures. It also enhances structural heat transfer and reduces thermal stress.
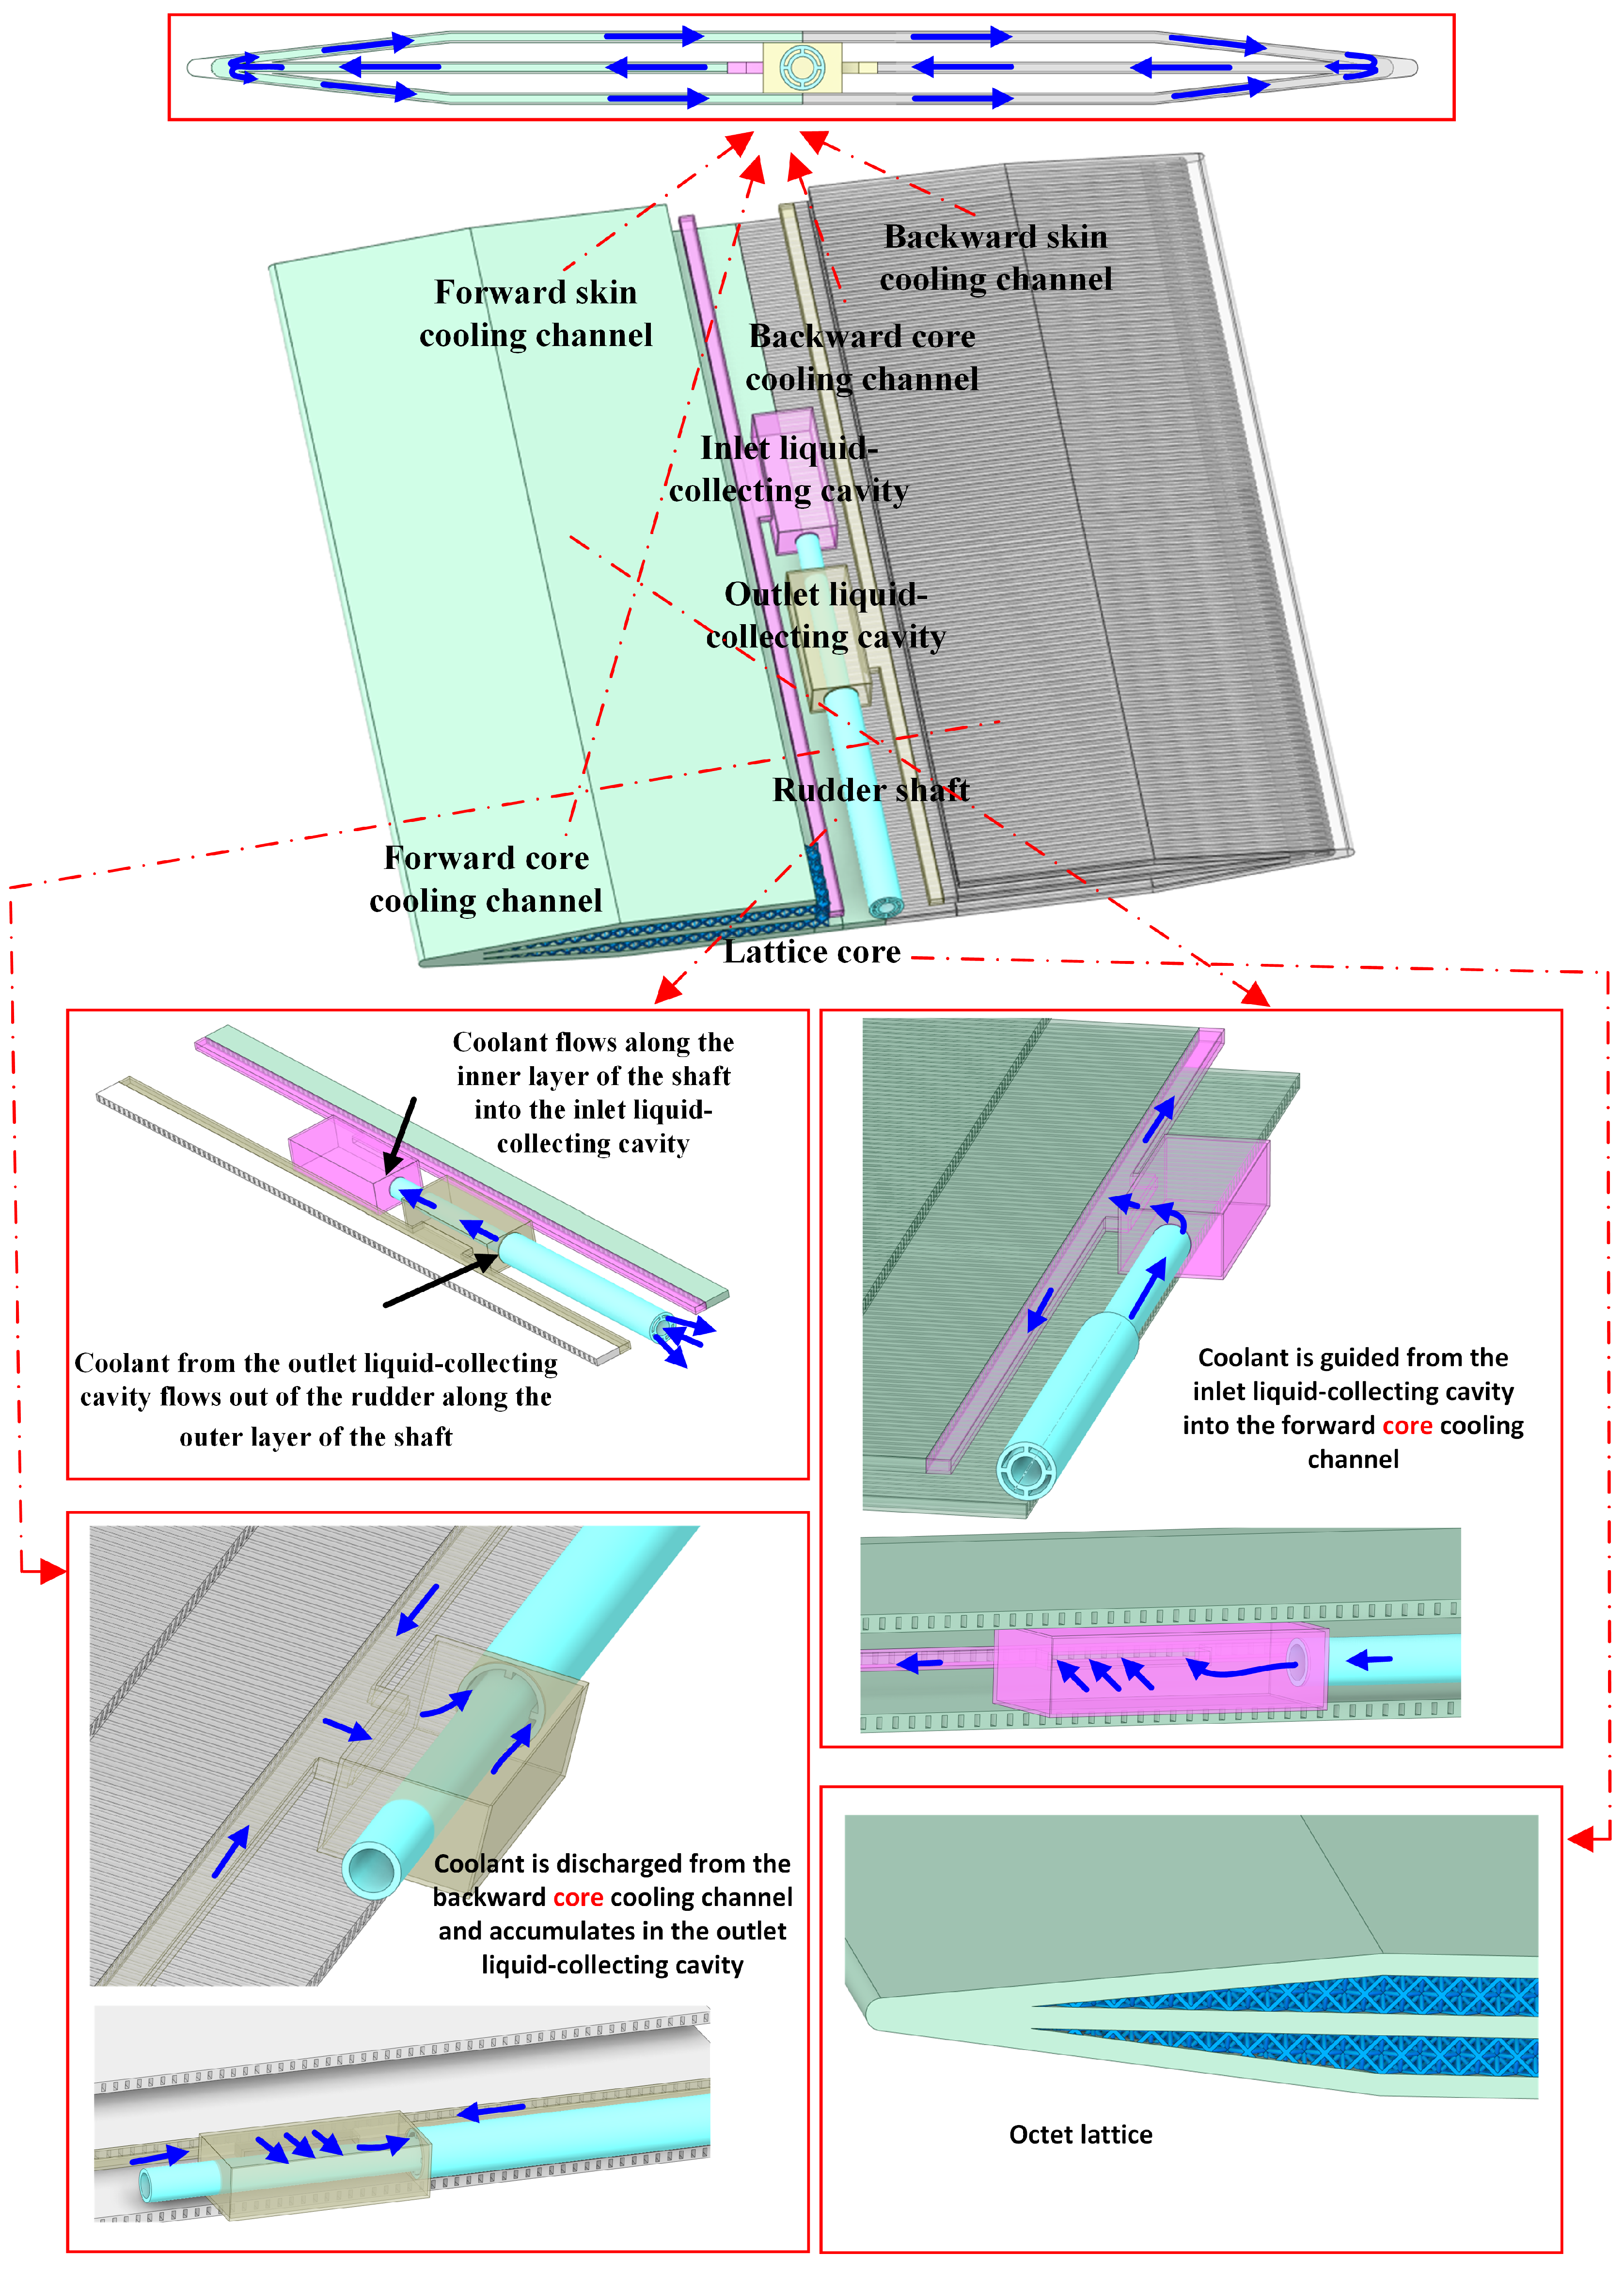
The structural layout of the second scheme, denoted as B1, is illustrated in Figure 5. In comparison to the previous scheme, this scheme incorporates forward and backward core cooling channels while modifying the structure of the inlet liquid- and outlet liquid-collecting cavities. These changes can all be more vividly illustrated by the flow of the coolant: Firstly, the coolant is directed through the inner layer of the rudder shaft to reach the inlet liquid-collecting cavity and is subsequently guided towards the inlet of the forward core cooling channel. From this point, it traverses along the forward core cooling channel until it reaches the leading edge, where it bifurcates. Subsequently, the coolant sequentially flows through both the forward and backward skin cooling channels before converging at the trailing edge. Finally, it follows along the backward core cooling channel to reach the outlet liquid-collecting cavity and exits via the outer layer of the rudder shaft.

2.1.3. Periodic Modeling of Cooling Channels

The cooling channels in both Schemes A1 and B1 are arranged periodically in the direction of the rudder axis, excluding the inlet liquid- and outlet liquid-collecting cavities. This arrangement facilitates analysis and design using representative cells with periodic boundary conditions. Furthermore, considering that the aerodynamic heating of the rudder is more severe in the forward half compared to the backward half, this study solely modeled the forward half of the simplified rudder.
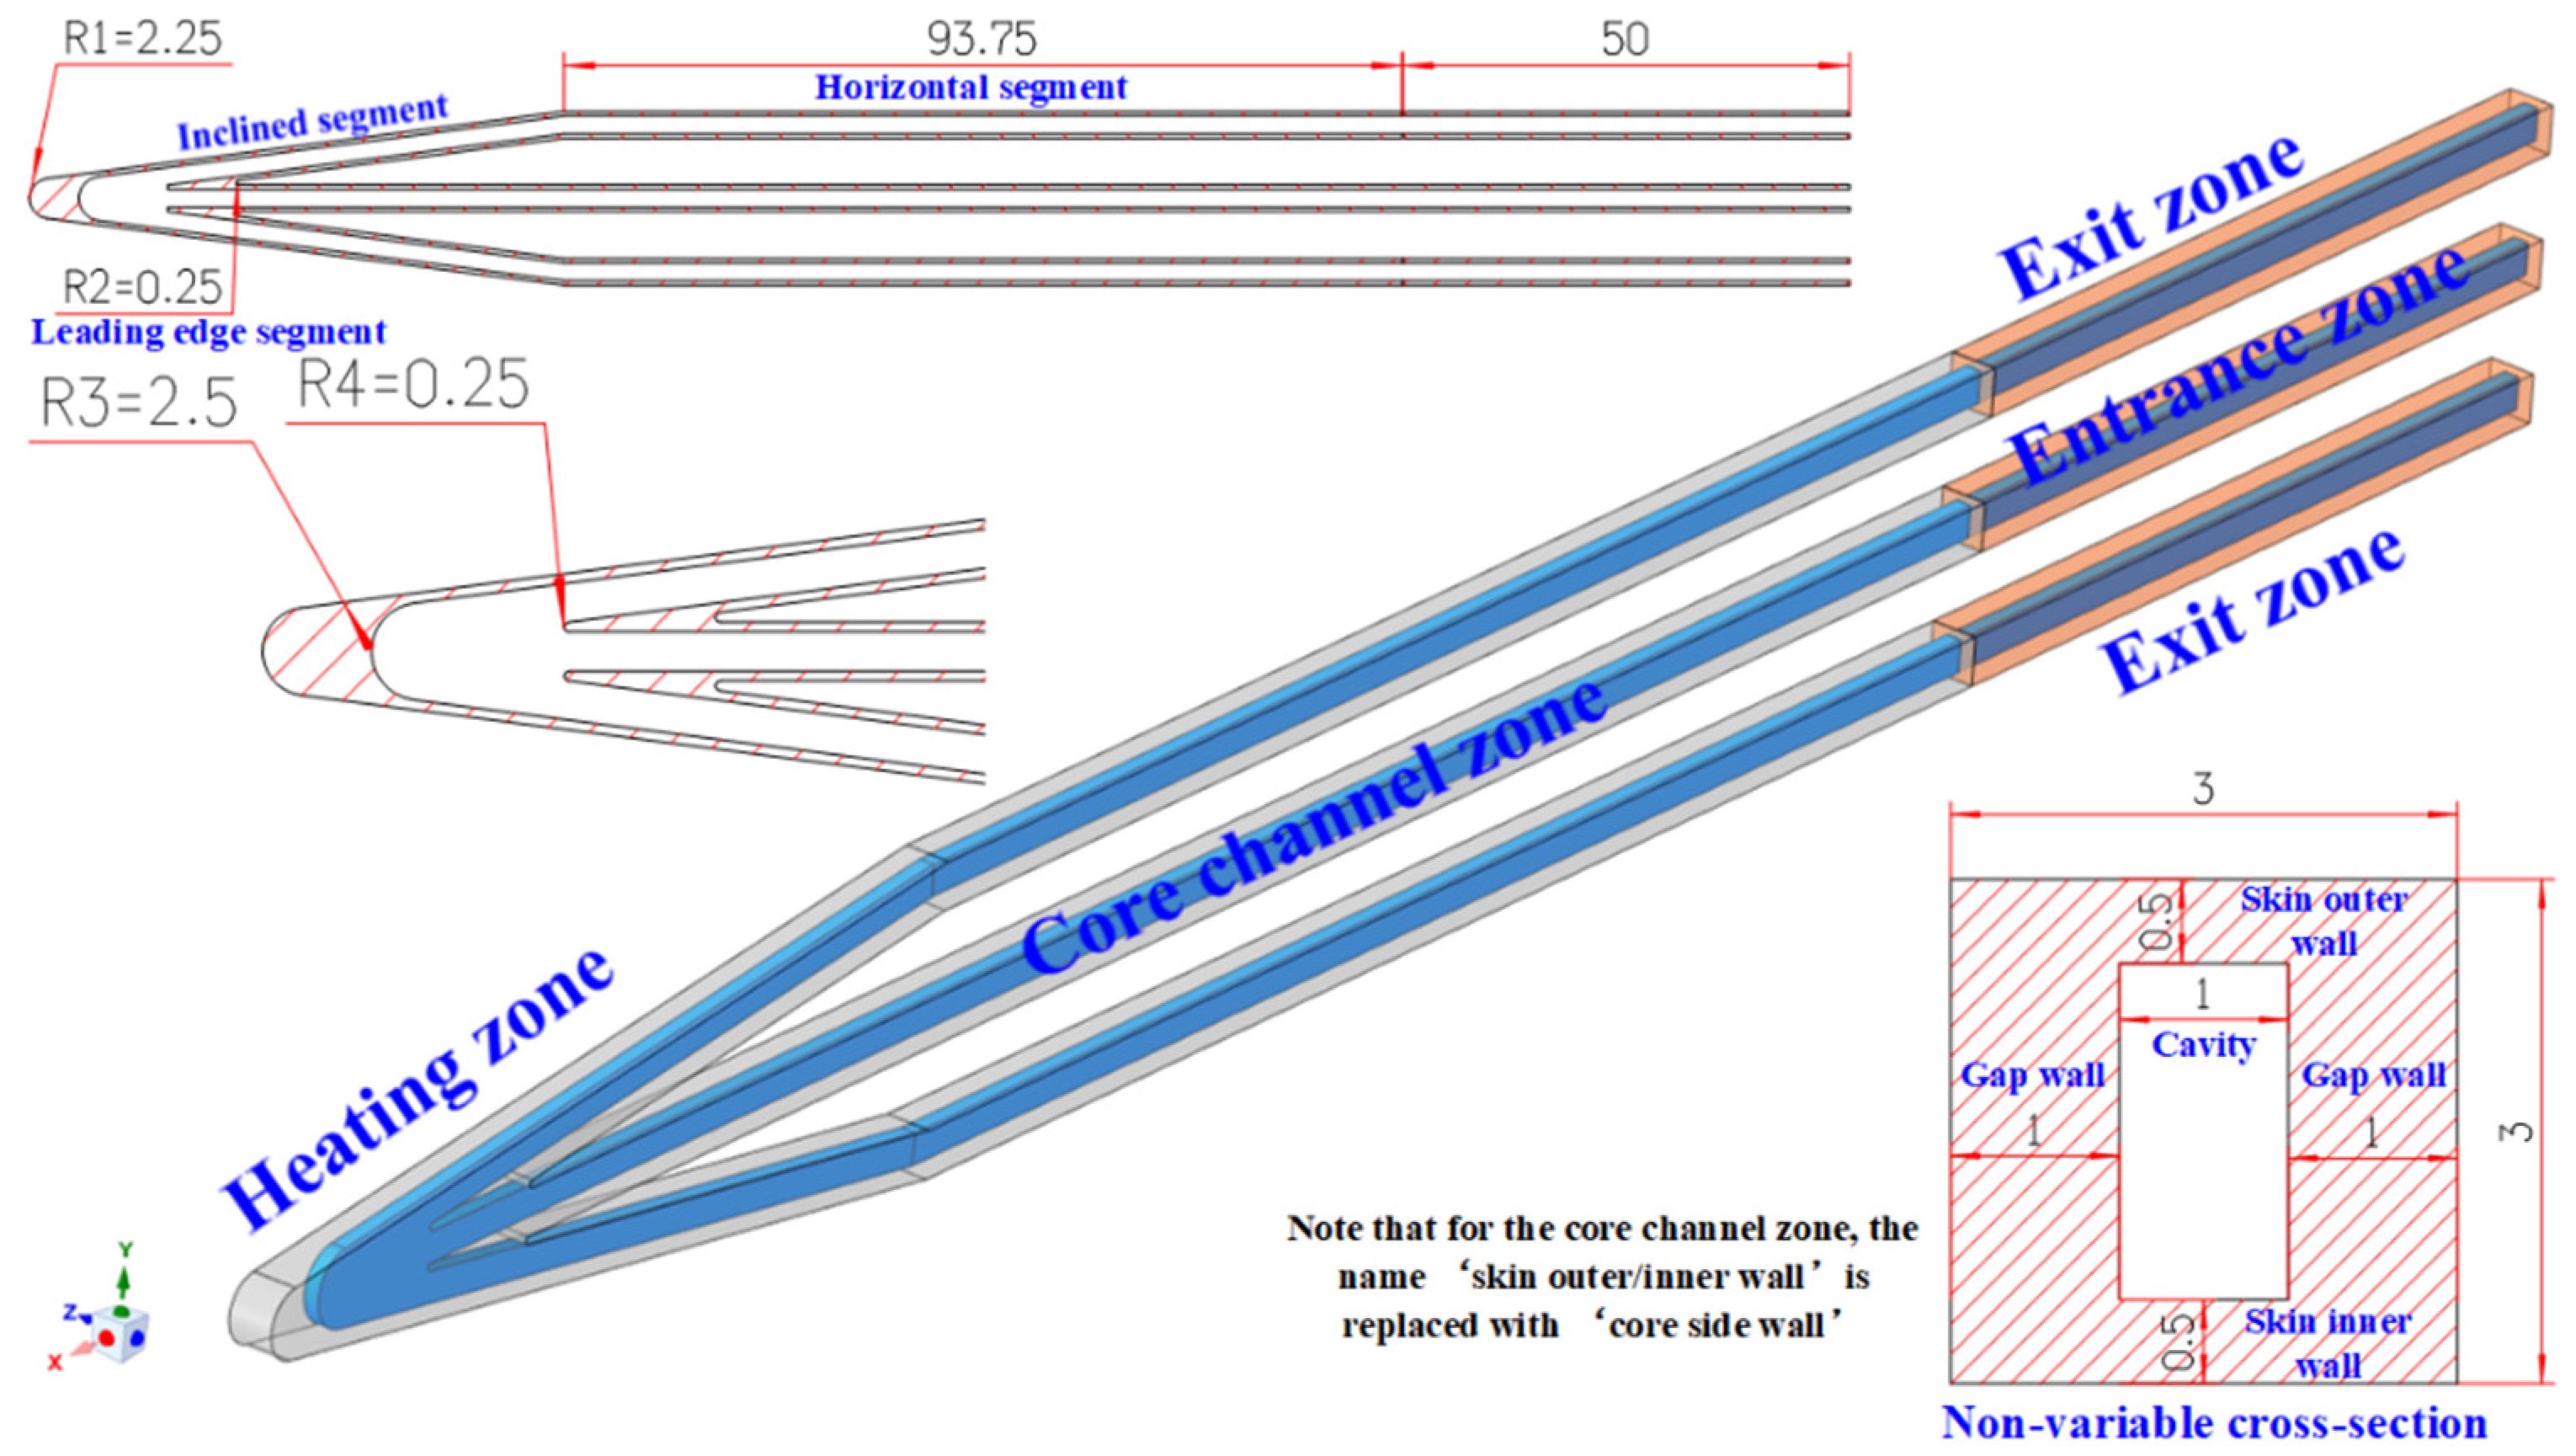
The physical model depicted in Figure 6 illustrates a representative cell of the cooling channel in Scheme A1, where the x direction is the chord direction, and the z direction is the rudder axis direction (also the gravity direction). It consists of an entrance zone, a heating zone, and an exit zone. Both the entrance and exit zones have lengths of 50 mm and are designed to be adiabatic. The purpose of the entrance zone is to ensure complete fuel flow development before heating occurs, while the inclusion of the exit zone aims to minimize any computational impact caused by the outflow boundary conditions. The heating zone corresponds to the forward half of the simplified rudder and consists of three segments: a horizontal segment with a length of 93.75 mm, an inclined segment with a half-inclination angle of 7.41° (as shown in Figure 3), and a leading-edge segment characterized by the outer chamfering radius R1 = 2.25 mm, the inner chamfering radius R2 = 1 mm, the channel outer radius R3 = 2.5 mm, as well as the channel inner radius R4 = 0.5 mm. From a cross-sectional perspective, the representative unit of the cooling channel consists of a solid wall and fluid cavity. The wall can be further divided into the skin outer wall, the skin inner wall, and the gap wall. It should be noted that the cross-sectional dimensions undergo continuous variation in the leading-edge segment of the heating zone (not depicted in the figure) while remaining consistent in both the horizontal and inclined segments of the heating zone, as well as in the entrance/exit zones. These non-variable cross-section dimensions include skin inner-/outer-wall thicknesses of 0.5 mm, a gap wall thickness of 1 mm (indicating a channel spacing of 2 mm), and a cavity area measuring 1 mm × 2 mm.
The physical model of the representative cell of the cooling channel in Scheme B1 is illustrated in Figure 7. It comprises the entrance zone, the core channel zone, the heating zone, and the exit zone. Notably, the core channel zone is located near the mid-plane (x-z plane) within the rudder and represents the main difference between Scheme B1 and Scheme A1. It connects to the entrance zone at one end and to the leading-edge segment of the heating zone at the other. Furthermore, the heating zone is still composed of a horizontal segment, inclined segment, and leading-edge segment. However, there are variations in terms of the inner chamfering radius (R2) (0.25 mm) and channel inner radius (R4) (0.25 mm) for the leading-edge segment compared to those in Scheme A1. All other aspects including the outer chamfering radius (R1), channel outer radius (R3), as well as the geometry of the entrance/exit zones remain unchanged from those utilized in Scheme A1. Lastly, the dimensions of those non-variable cross sections are the same as in Scheme A1, except that the wall names are different, changing from “skin inner/outer wall” to “core side wall’’.
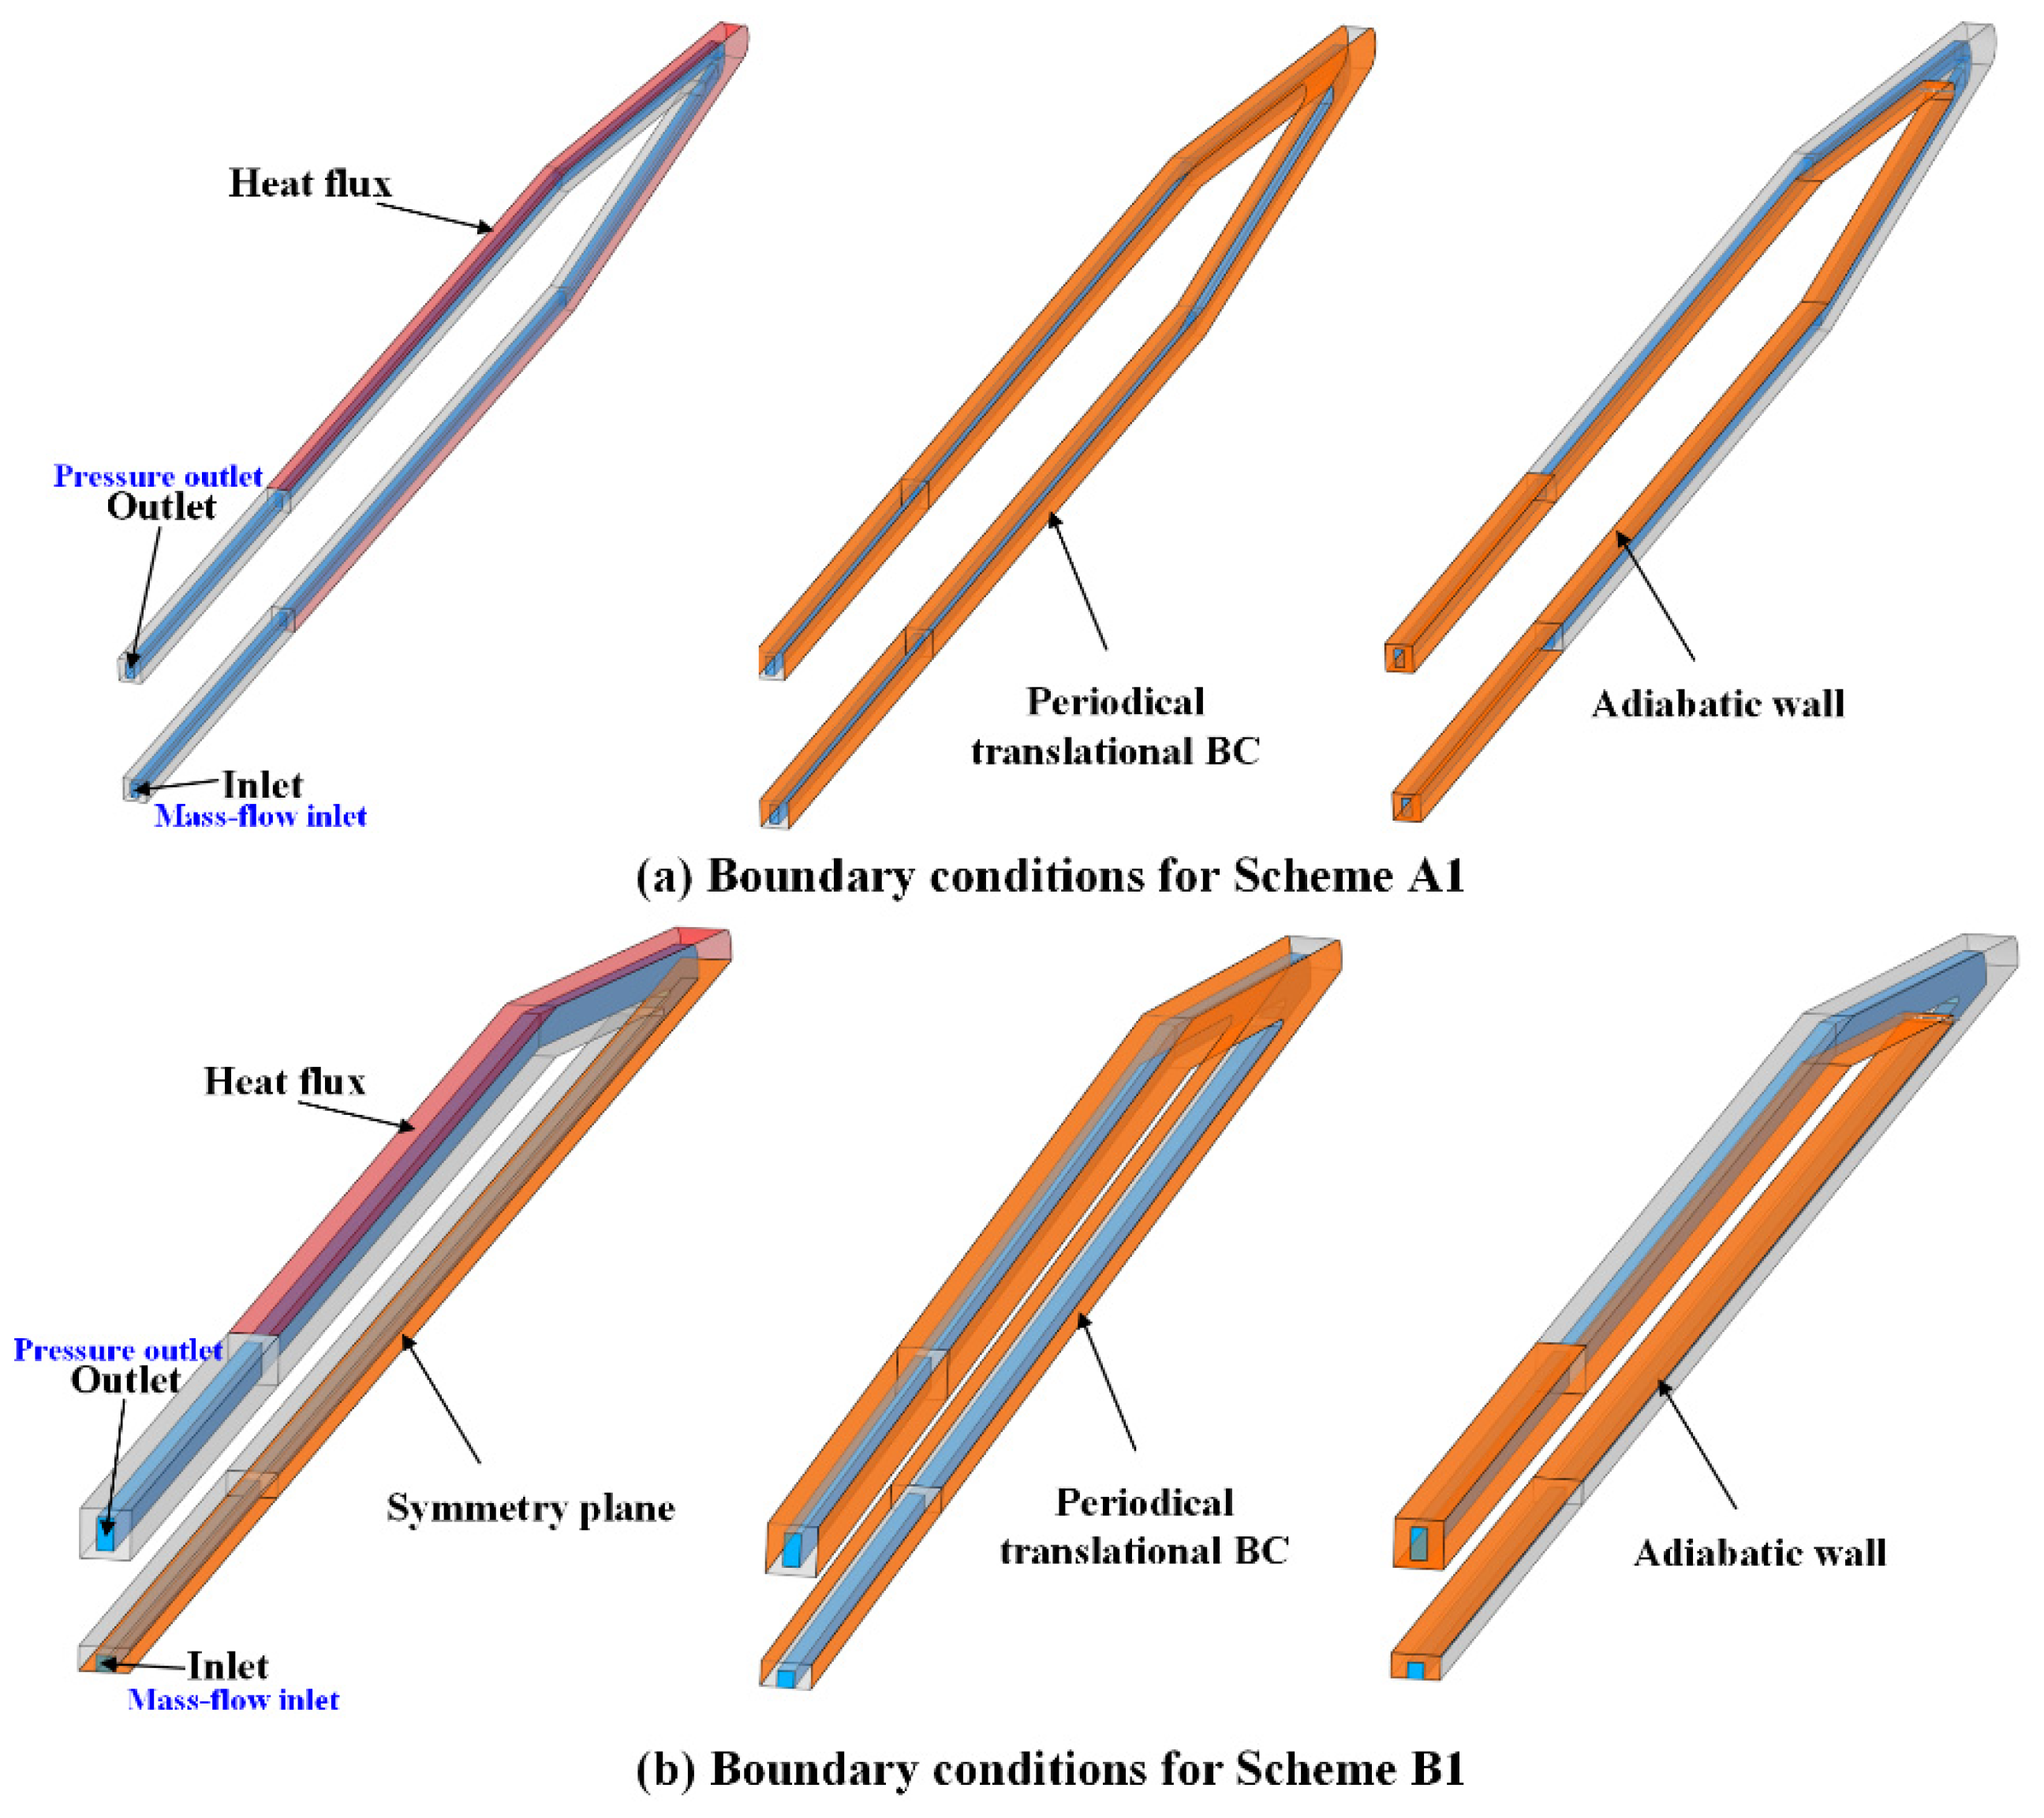
The boundary conditions (BCs) of the representative units of the cooling channel in Schemes A1 and B1 are shown in Figure 8. In Scheme A1, mass flow inlet and pressure outlet BCs are defined, while heat flux BCs are applied to the surface of the skin outer wall within the heating zone. The surfaces of the gap wall are designated as periodical, translational BCs. Additionally, adiabatic wall BCs are assigned to both the surfaces of the skin inner/outer wall within the entrance/exit zones and to the surfaces of the skin inner wall within the heating zone. In Scheme B1, for the sake of reducing the computation, the x-z mid-plane is defined as a symmetry plane and the representing cell is modeled symmetrically. The inlet/outlet, heating flux, periodic translational, and adiabatic BCs are similar to those defined in Scheme A1.
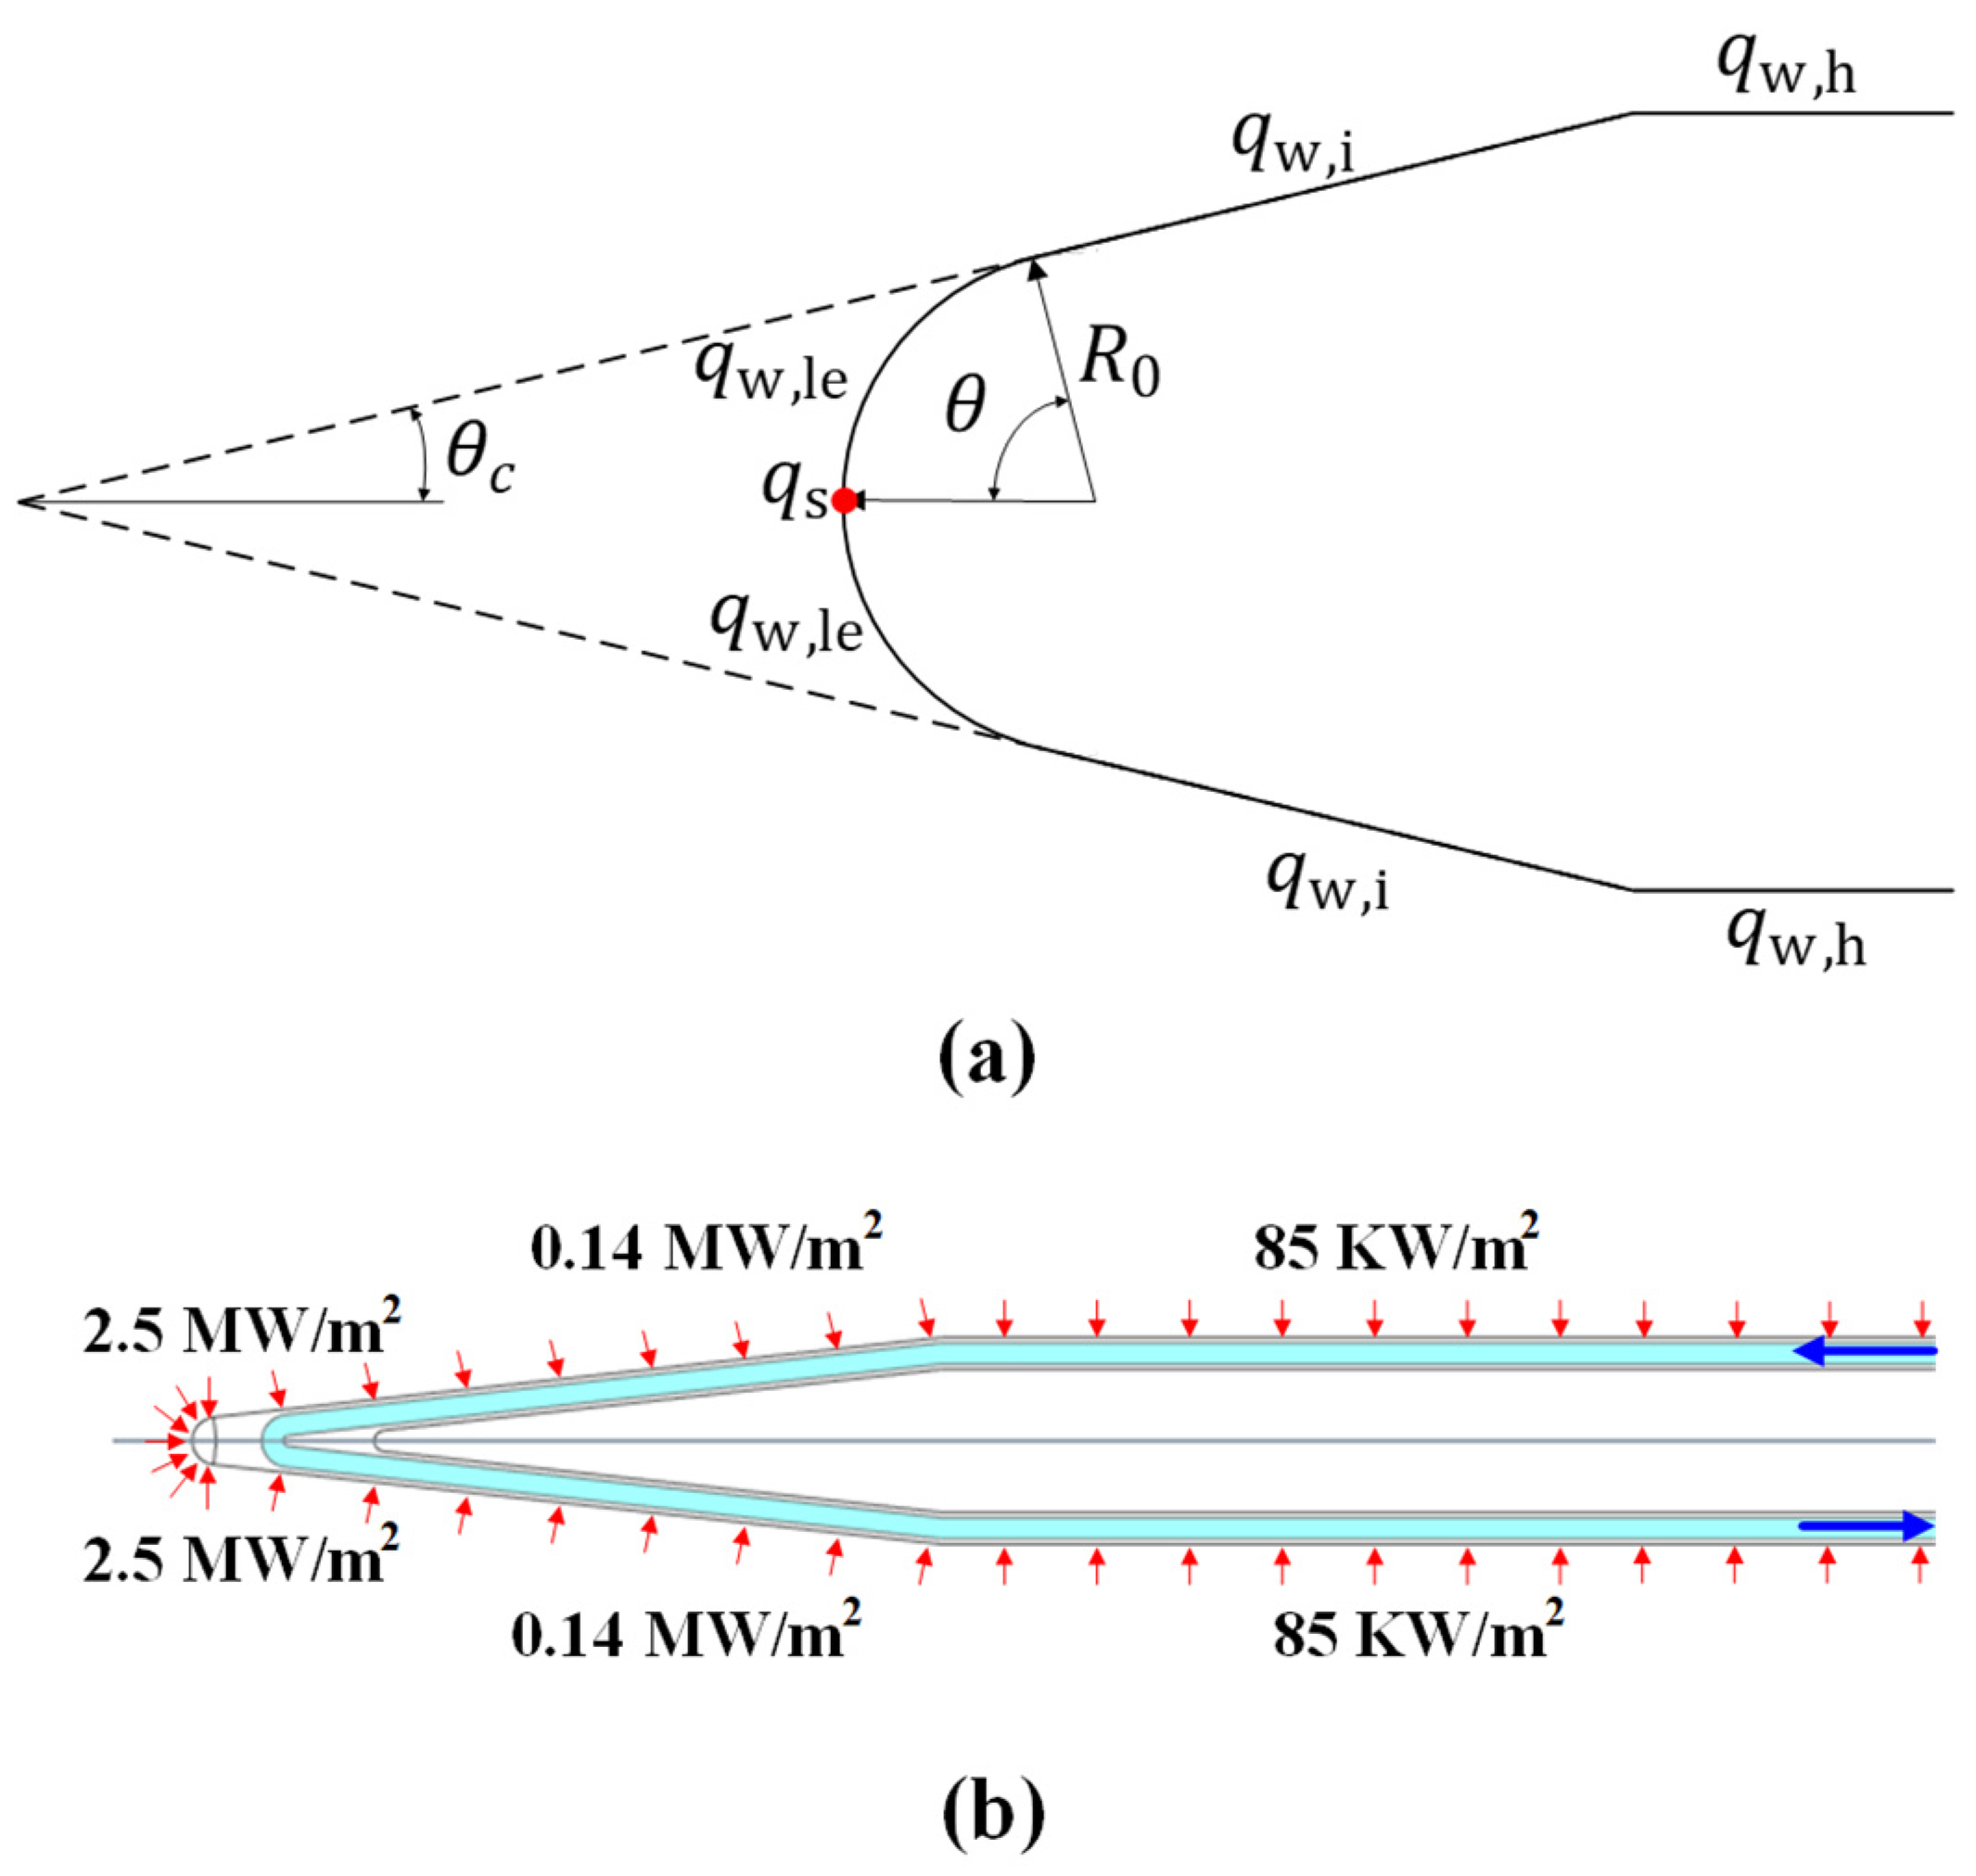
The heat flux BCs are imposed on the outside wall of the leading-edge segment, inclined segment, and horizontal segment with varying magnitudes, as depicted in Figure 9. These heat fluxes are determined using engineering correlations (the altitude and speed are 30 km and 8 Mach, respectively) and subsequently refined through homogenization. For the leading-edge segment, it can be considered as an infinitely long cylinder. Then, the heat flux q w , l e can be determined as follows:
q w , l e = q s p h / 2
q s p h = 2 θ s i n θ 1 1 / γ M a 2 c o s 2 θ + 1 / γ M a 2 D θ 0.5 q s
where q s p h refers to the heat flux within a sphere with the same radius as the cylinder; θ is the angle between the radius vector and the flight direction ( γ = 1.4 ); M a is the incoming stream Mach number; D θ is a geometrically relevant parameter and can be found in Ref. [37]; q s is the heat flux at the stagnation point from the modified Lee formula, as follows:
q s = 0.5 2 P r 2 / 3 ρ s * μ s * d u e d x s h s h w
where P r = 0.71 is the Prandtl number; ρ s * and μ s * denote the thermos-physical properties of the stationary air based on the reference enthalpy; d u e / d x s refers to the velocity gradient at the stationary point; and h s and h w are the enthalpies of the stationary point and the wall, respectively.
The heat flux upon the inclined segment ( q w , i ) can be similarly concerted by the heat flux on the surface of the cone, as follows:
q w , i = q c o n e / 2
q c o n e = A θ c s / R 0 B θ c + s / R 0 3 0.5 q s
where θ c is the cone half angle, and A θ c , B θ c , and s / R 0 are geometrically relevant parameters and can be found in Ref. [37].
The heat flux upon the horizontal segment ( q w , h ) [38] can be calculated as follows:
q w , h = 0.332 P r 2 / 3 R e l o c a l 0.5 ρ s * μ s * h s h w
where R e l o c a l is the local Reynolds number.

2.1.4. Material Properties of Coolants and Channel Structures

In the present study, n-decane (C10H22), commonly used as a simplified surrogate model for aviation kerosene, was adopted as a coolant. The critical parameters of n-decane have been reported to be 645.5 K and 2.39 MPa [39]. Typically, the operational pressure in the cooling channel exceeds the critical pressure. In this scenario, significant changes occur in its thermo-physical properties near the pseudo-critical temperature. Accurately describing these properties is critical for numerical simulations of the flow and heat transfer. Therefore, in this work, the SUPERTRAPP program developed by the National Institute of Standards and Technology (NIST) was used to determine the thermo-physical properties of n-decane. The retrieved detailed property data can be interpolated at a total of 50 points using the piecewise linear interpolation function within ANSYS Fluent 21.0 software. Figure 10 depicts the temperature-dependent variation in the density, thermal conductivity, isobaric specific heat capacity, and dynamic viscosity of n-decane within a temperature range from 300 K to 1000 K under pressure conditions of 3 MPa. Furthermore, it should be noted that the pyrolysis of n-decane can be safely ignored herein due to the fact that the maximum temperature does not exceed 900 K in all the cases.
A nickel-based, high-temperature alloy was selected as the structural material for the solid channel component, and its thermal and mechanical properties are presented in Table 1. It should be noted that this study did not consider the temperature dependency of the solid material, as the stress results served solely as a reference for selecting the cooling scheme rather than as a decisive factor. It is assumed that the maximum von Mises stresses in the structure should not exceed 600 MPa.

2.2. Governing Equations and Solution Strategy

The steady flow and heat transfer of the fluid in cooling channels are governed by the conservation equations of mass, momentum, and energy, as follows:
Mass conservation equation:
ρ u i x i = 0
Momentum conservation equation:
ρ u i u j x j = P ¯ x i + x j μ u i x j + u j x i 2 3 μ u k x k δ i j + x j ρ u i u j + ρ a i
Energy conservation equation:
ρ u i H x i = x i λ c p + μ t P r t H x i
where ρ , μ , λ , and c p are the density, dynamic viscosity, thermal conductivity, and specific heat capacity of the fluid, respectively; u i is the velocity component in the x , y , and z coordinates; P ¯ is the average pressure; δ i j is the Kronecker delta function that equals unity if i = j and zero otherwise; u i is the velocity component fluctuation and ρ u i u j is therefore the turbulent stress; a i is the acceleration component in the x , y , and z coordinates; H is the specific enthalpy; P r t = μ t / ρ / λ t / ρ c p is the turbulent Prandta number; μ t is the turbulent viscosity; λ t is the turbulent thermal conductivity. It is important to note that the energy equation presented here is a simplified form: the source term is subtracted because the chemical reaction of the coolant is not considered, and the pressure and viscosity terms are neglected because of the variable property flow.
The selection of an appropriate turbulence model is crucial for accurately simulating supercritical flow and heat transfer. Recently, several turbulence models have been comparatively studied in relevant numerical simulations [40]. It has been observed that the Shear Stress Transport k-ω (SST k-ω) turbulence model demonstrates a superior predictive performance. Consequently, in this work, the SST k-ω turbulence model was employed to simulate the turbulence flow and heat transfer. Its governing equations are presented below:
Turbulent kinetic energy equation:
ρ u i k x i = x j Γ k k x j + G k Y k
Specific dissipation rate equation:
ρ u i ω x i = x j Γ ω ω x j + G ω Y ω + D ω
where k is the turbulent kinetic energy; ω is the specific dissipation; Γ k = μ + u t / σ k and Γ ω = μ + u t / σ ω are the effective diffusivities of k and ω , respectively; σ k and σ ω are the inverse of the turbulent Prandtl numbers for k and ω , respectively; G k is the generation of turbulent kinetic energy caused by the mean velocity gradient; G ω is the generation of the specific dissipation; Y k and Y ω are the dissipations of k and ω due to turbulence, respectively; D ω is the cross-diffusion term.
For the solid domain, the temperature is governed by the heat conduction equation, as follows:
x i λ s ρ s c p , s T x i = 0
where λ s , ρ s , and c p , s are the thermal conductivity, density, and specific heat of the solid material, respectively. Thermal stresses can arise due to temperature differences in the cooling channels. For brevity, the fundamental equations related to the linear elasticity problem are not provided here.
The governing equations for flow and heat transfer were solved using the commercial software ANSYS Fluent 21.0. The coupling of pressure and velocity was achieved through the implementation of the SIMPLEC (Semi-Implicit Method for Pressure-Linked Equations—Consistent) algorithm. In the spatial discretization module, the Green–Gauss node-based method was employed to solve the gradients, while the pressure was determined using the PRESTO! approach. A second-order upwind scheme was utilized to solve the momentum, turbulent kinetic energy, and specific dissipation rate equations. The calculations were terminated when all the equation residuals fell below 10−5, ensuring mass and energy conservation preservation. Additionally, ANSYS Mechanical was employed to determine the deformation and stress distribution for thermal–mechanical problems.

2.3. Analysis Cases and Mesh Sensitivity

The basic cases named Scheme A1 and Scheme B1 are introduced in Section 2.1.2. To find more improved solutions, several retrofitting options for the leading edge illustrated in Figure 11 were also studied. Among them, Scheme B1-M extends the core channel by 7.5 mm towards the leading-edge segment based on Scheme B1, while Scheme A2 reduces the channel outer radius (R3) and channel inner radius (R4) based on Scheme A1. Additionally, Scheme B2 decreases the channel outer radius (R3) from Scheme B1 but keeps the channel inner radius (R4) unchanged. Lastly, for Scheme B2-M, a length of 10.5 mm is added to the core channel towards its leading-edge segment.
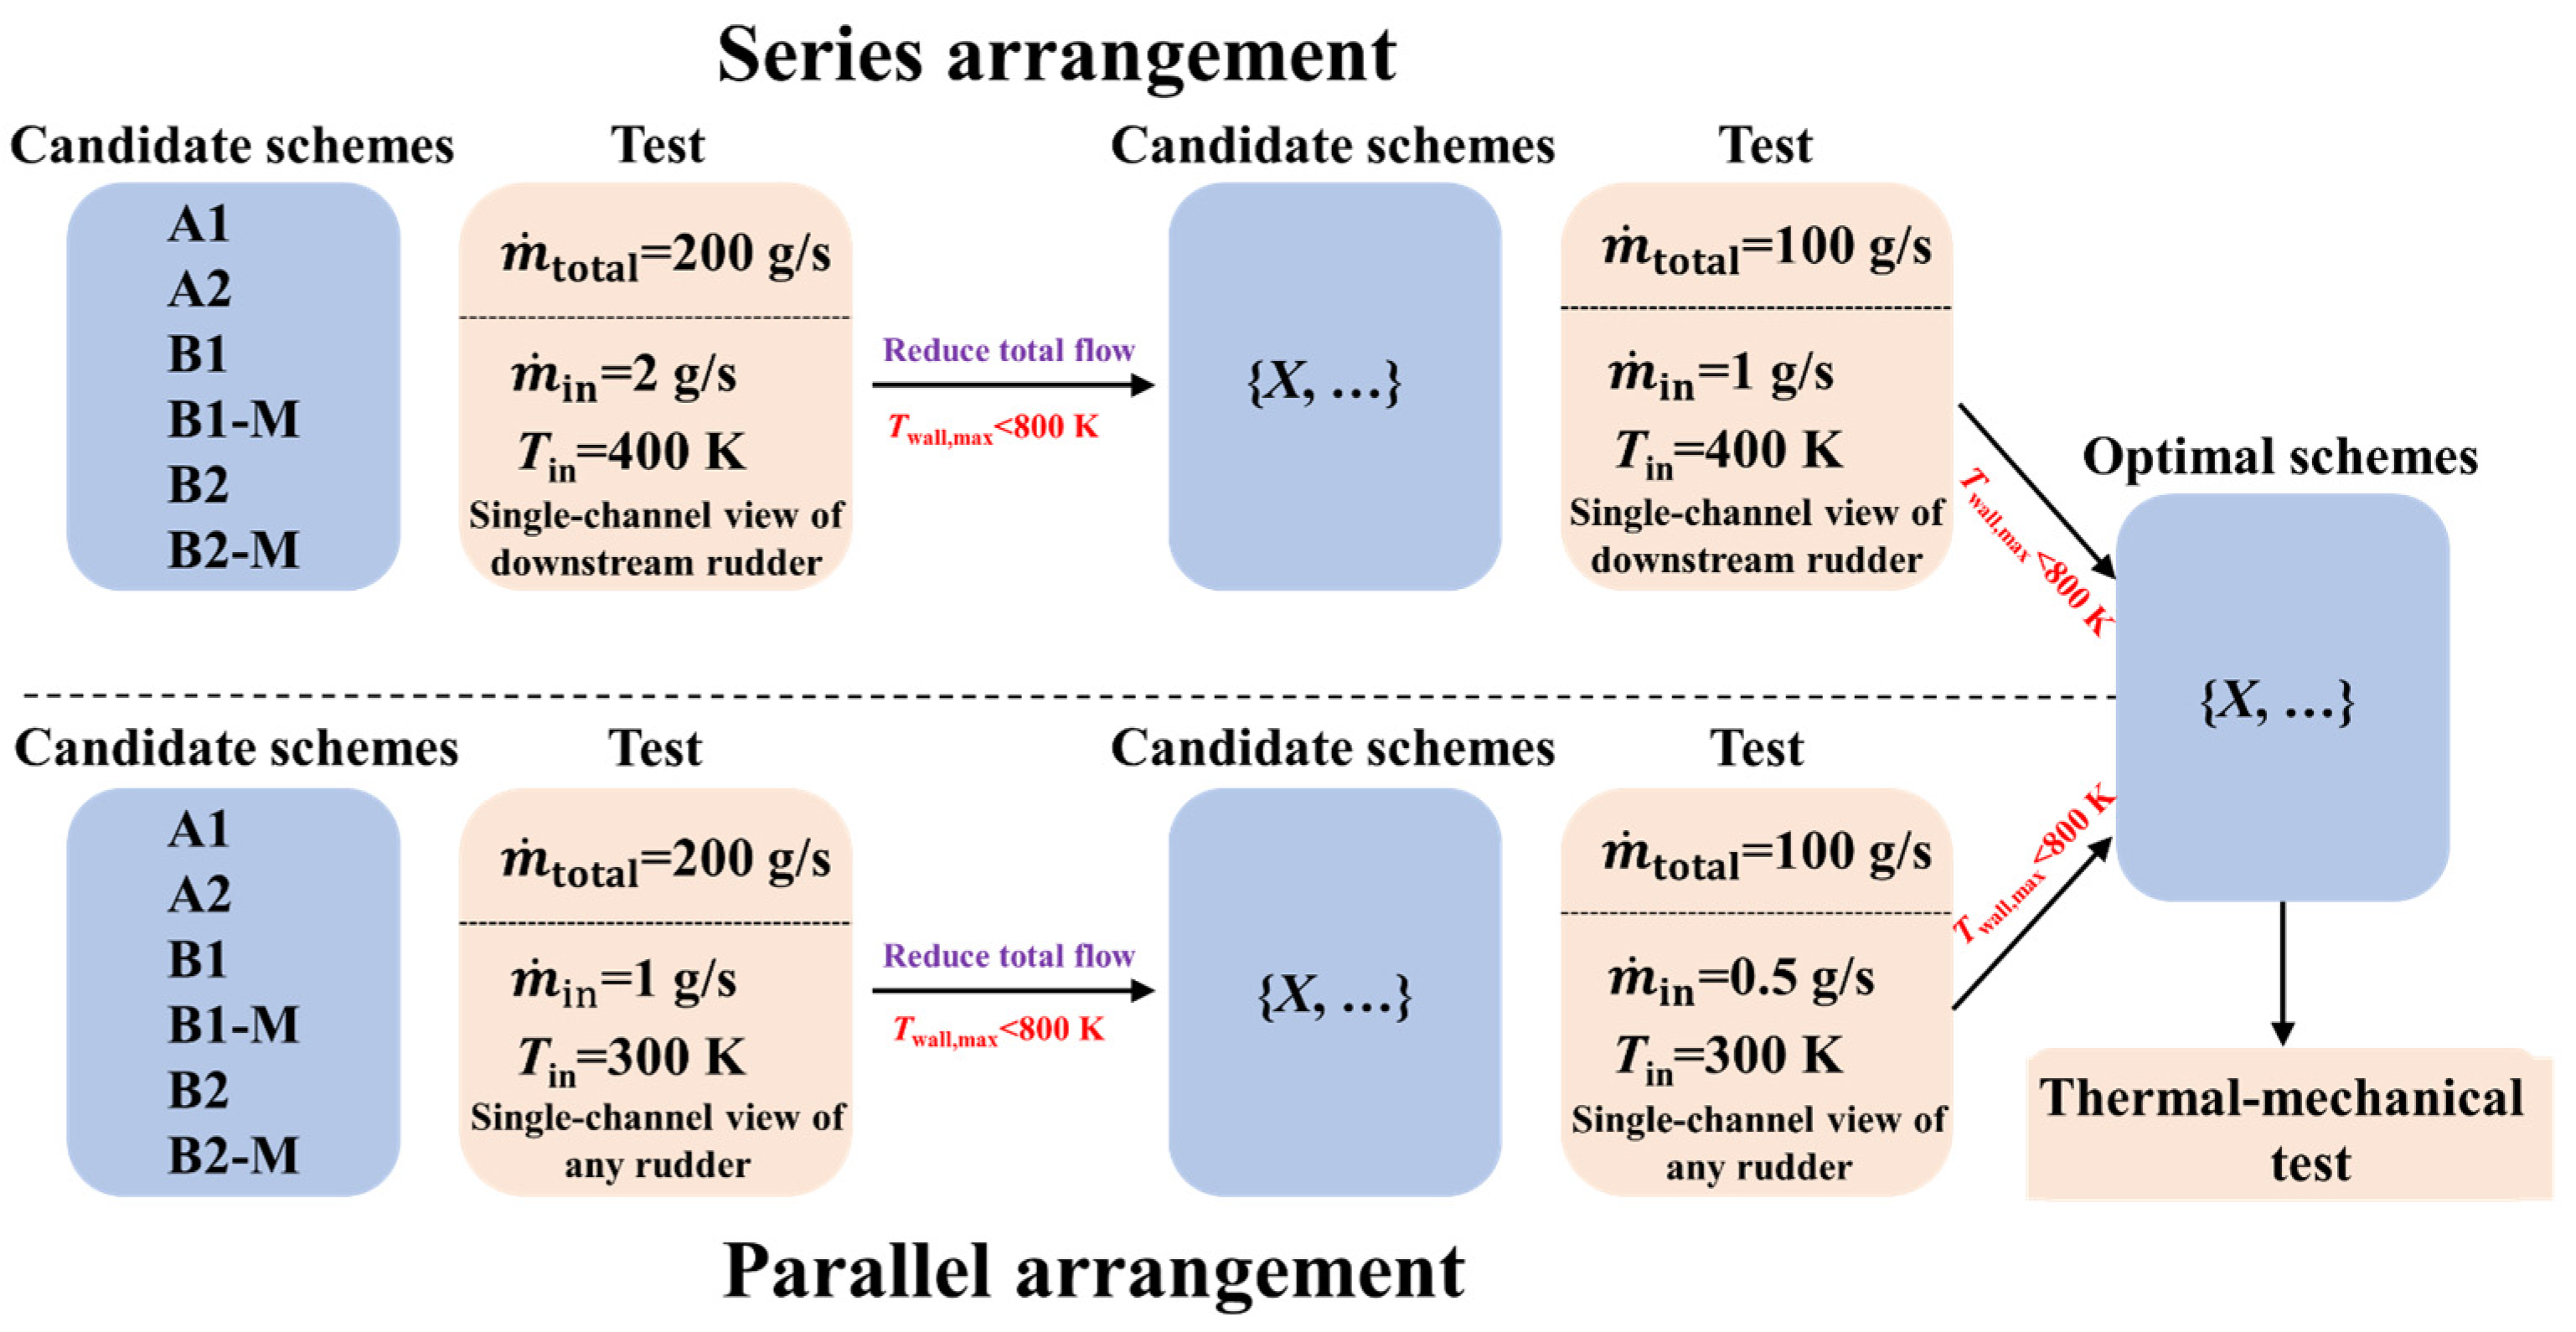
For a high-speed vehicle, an efficient cooling channel design must balance optimizing the cooling performance with minimizing the coolant flow rate. To evaluate potential cooling channel schemes for two all-movable rudders operating at an altitude of 30 km and Mach 8, two total coolant supply rates of the rudder branches—200 g/s and 100 g/s—were analyzed for both the series and parallel pipeline configurations. In the series configuration, at a total coolant flow rate of 200 g/s, both rudders received 200 g/s of coolant, with the upstream rudder having an inlet temperature of 300 K and the downstream rudder reaching 400 K. When the flow rate was reduced to 100 g/s, both rudders received 100 g/s, with the upstream rudder at 300 K and the downstream rudder at 400 K. In the parallel configuration, at a 200 g/s total coolant flow, each rudder received 100 g/s at an inlet temperature of 300 K. At the reduced total flow rate of 100 g/s, each rudder was supplied with 50 g/s, maintaining an inlet temperature of 300 K.
The flow rate for each individual cooling channel was determined by dividing the total flow rate to a rudder by 100, given that 100 cooling channels are arranged within a 300 mm span. Figure 12 outlines the competitive selection process for cooling channels from the perspective of a single channel, with an 800 K temperature limit serving as the core criterion. For the series pipeline configuration, six cooling channel schemes were initially evaluated at a flow rate of 2 g/s and an inlet temperature of 400 K. Those that met the temperature standard proceeded to the second round, where the flow rate was reduced to 1 g/s and the inlet temperature was maintained at 400 K. In the parallel pipeline configuration, the systems were first tested under a flow rate of 1 g/s with an inlet temperature of 300 K. Systems that met the criteria advanced to the second round, with conditions adjusted to a 0.5 g/s flow rate and a 300 K inlet temperature. The operating pressure was maintained at 3 MPa, and variations in the thermo-physical properties due to pressure changes were neglected, with gravity considered along the z-direction. Finally, the selected preferred solution was investigated for its thermal–mechanical performance to determine the structural integrity. Please refer to Table 2 for details regarding all cases.
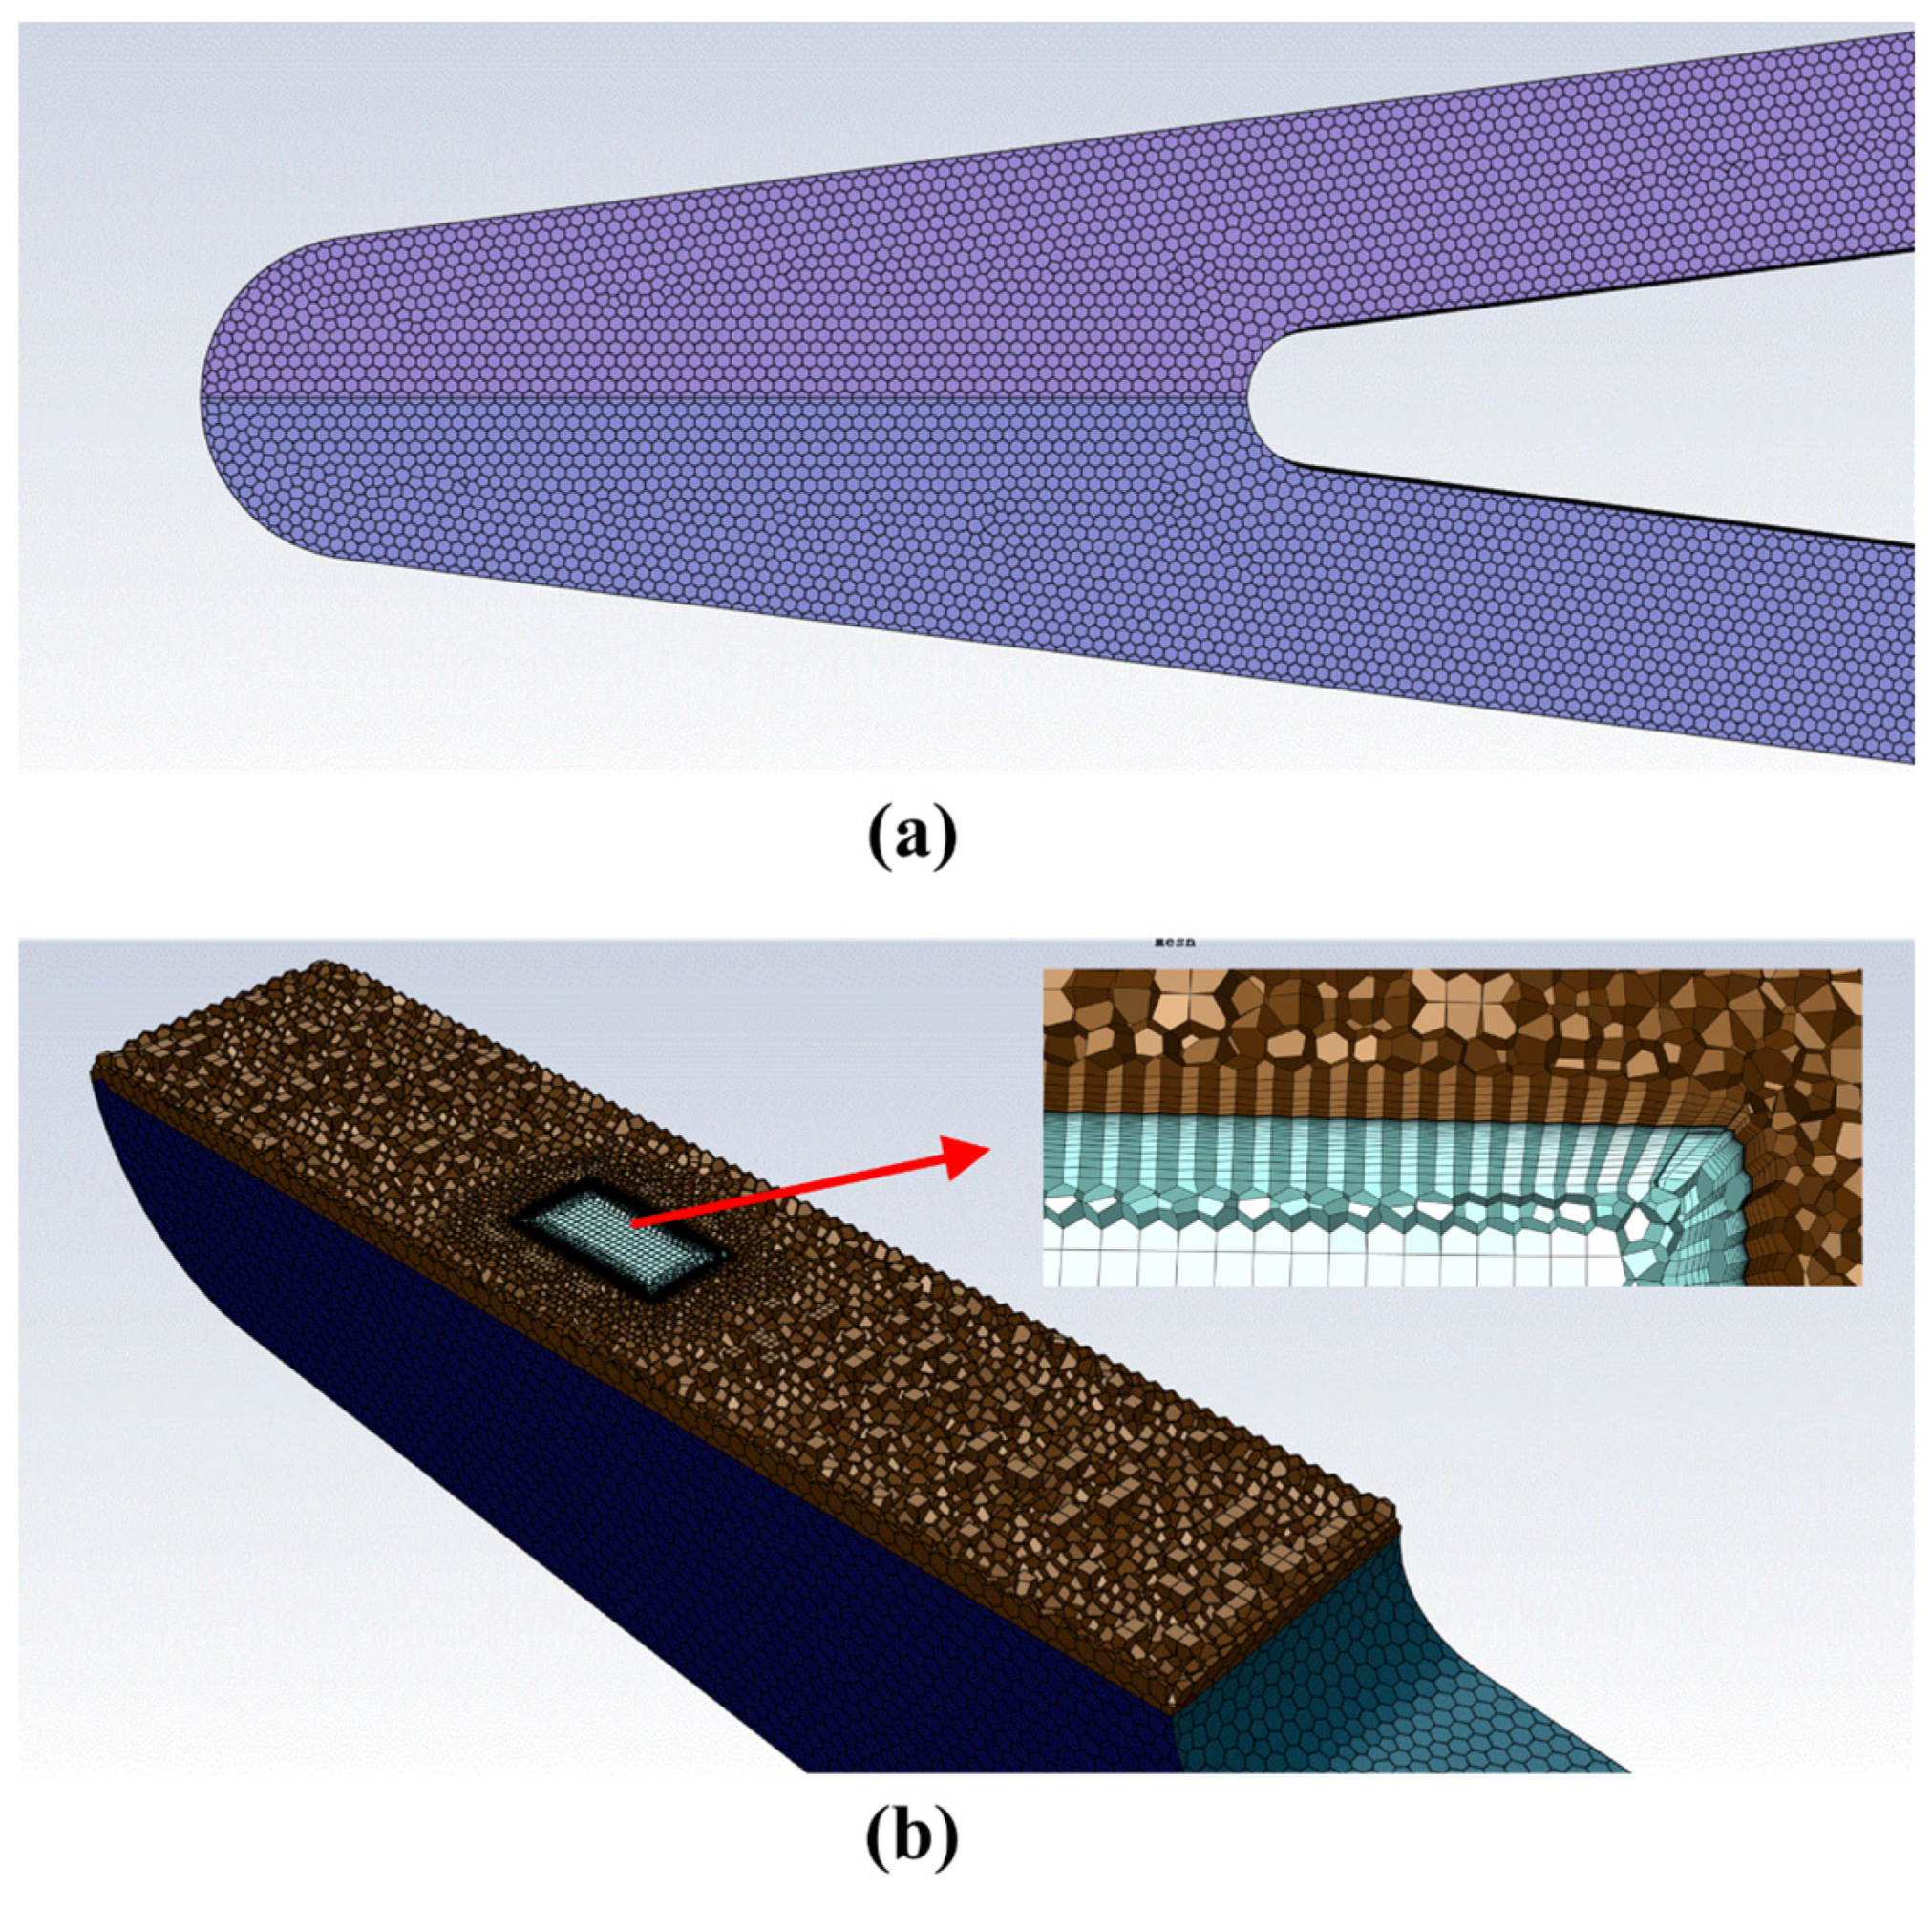
The significance of high-quality mesh in numerical computations cannot be overstated. In this paper, the pre-processing software Fluent Meshing was utilized to generate three-dimensional hybrid meshes for our computational model. Both the solid and fluid domains were discretized using poly-hexcore, ensuring the filling state of the hexahedral grids in the core region and the polyhedral grids in the transition region. To maintain a non-dimensional distance ( y + < 1 ), the boundary layer grids were produced in the near-wall region, with a first-layer height of 0.001 mm and a transition ratio of 0.272. Figure 13 illustrates the mesh details for the medium mesh at the leading edge of Scheme A1. The local size is set to 0.075 mm. The boundary layer cells are allocated to the fluid–solid-coupled boundary, with 20 layers of graded fluid cells and 5 layers of graded solid cells.
The mesh sensitivity analysis was conducted using Scheme A1 as an example, as presented in Table 3. Three different mesh resolutions were considered: coarse (3.26 million), medium (5.33 million), and fine (11.18 million). Monitoring variables were the outer-wall temperature at the leading edge ( T w , l e ) and the pressure drop between the inlet and outlet ( Δ P ). To evaluate the mesh quality, the deviation ( ε ) was defined as the relative error between the results computed from the fine mesh and those computed from the other mesh. It can be observed that deviations in T w , l e for coarse and medium meshes are 1.00% and 0.18%, respectively, while deviations in Δ P for corresponding meshes are 6.47% and 0.36%, respectively. Based on these findings, it can be concluded that the medium mesh exhibits sufficient density for Scheme A1, and similar-scale meshes will be adopted for simulations of other schemes.

3. Results and Discussion

3.1. Model Validation

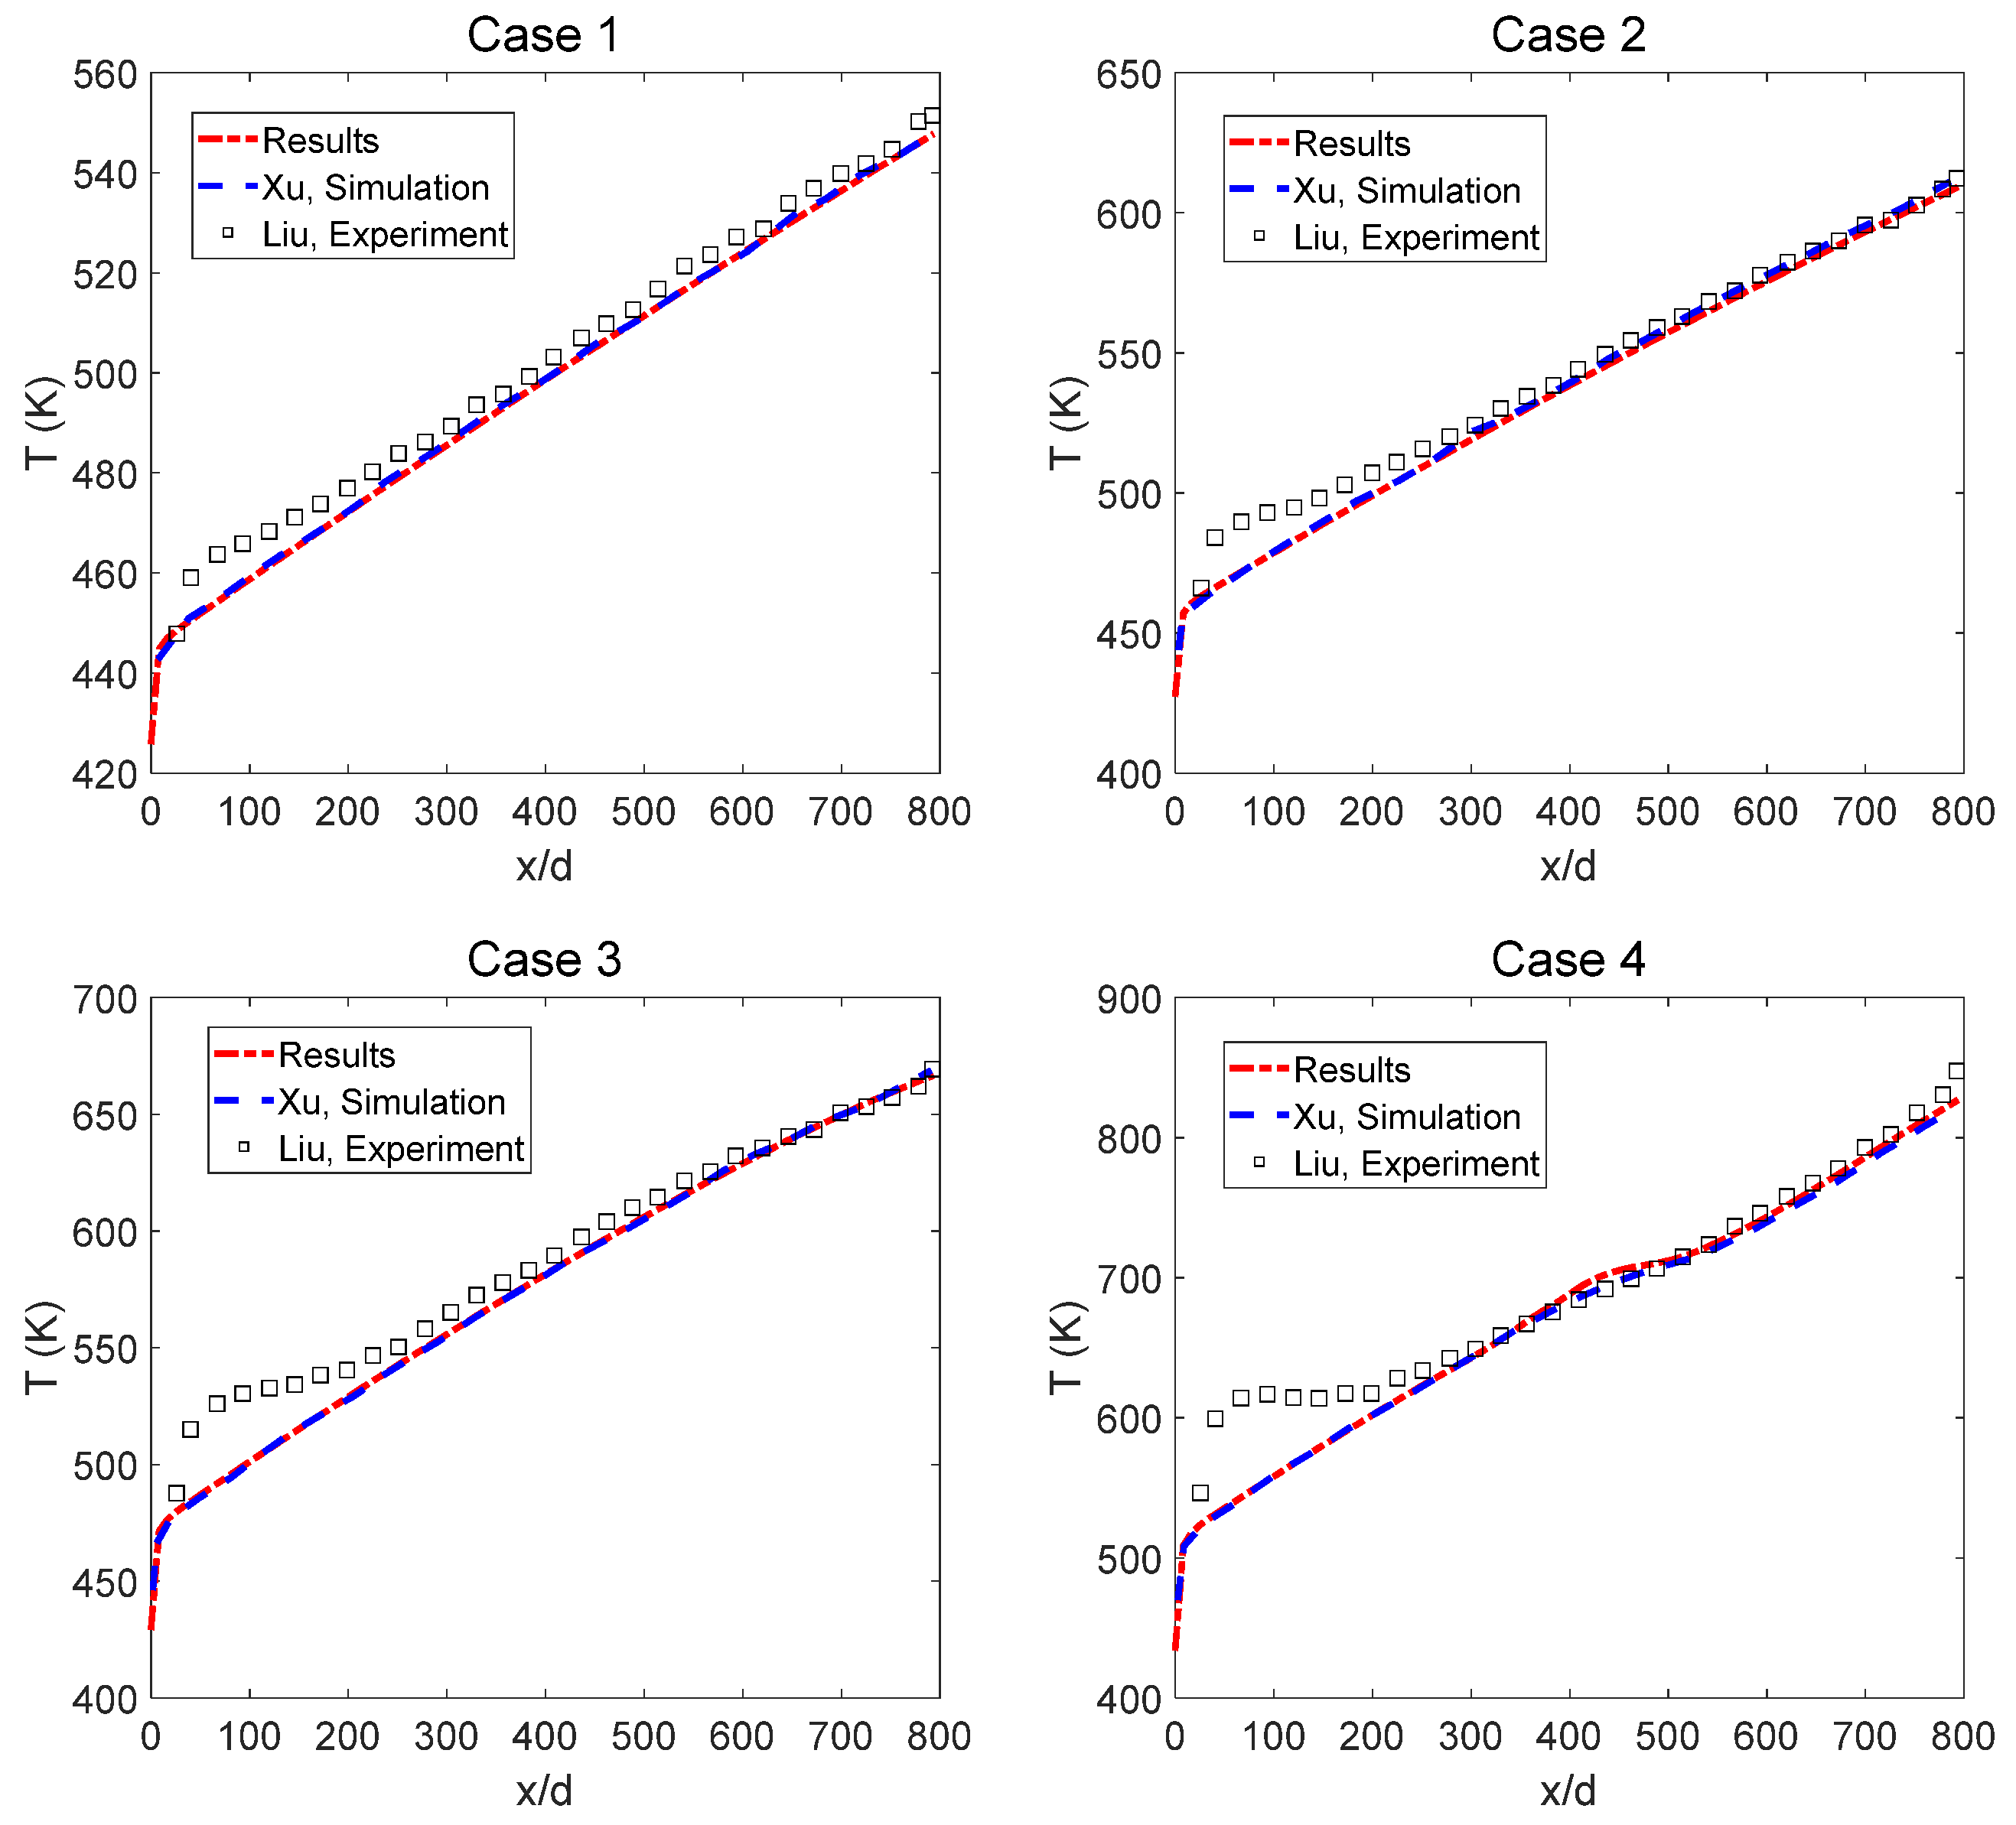
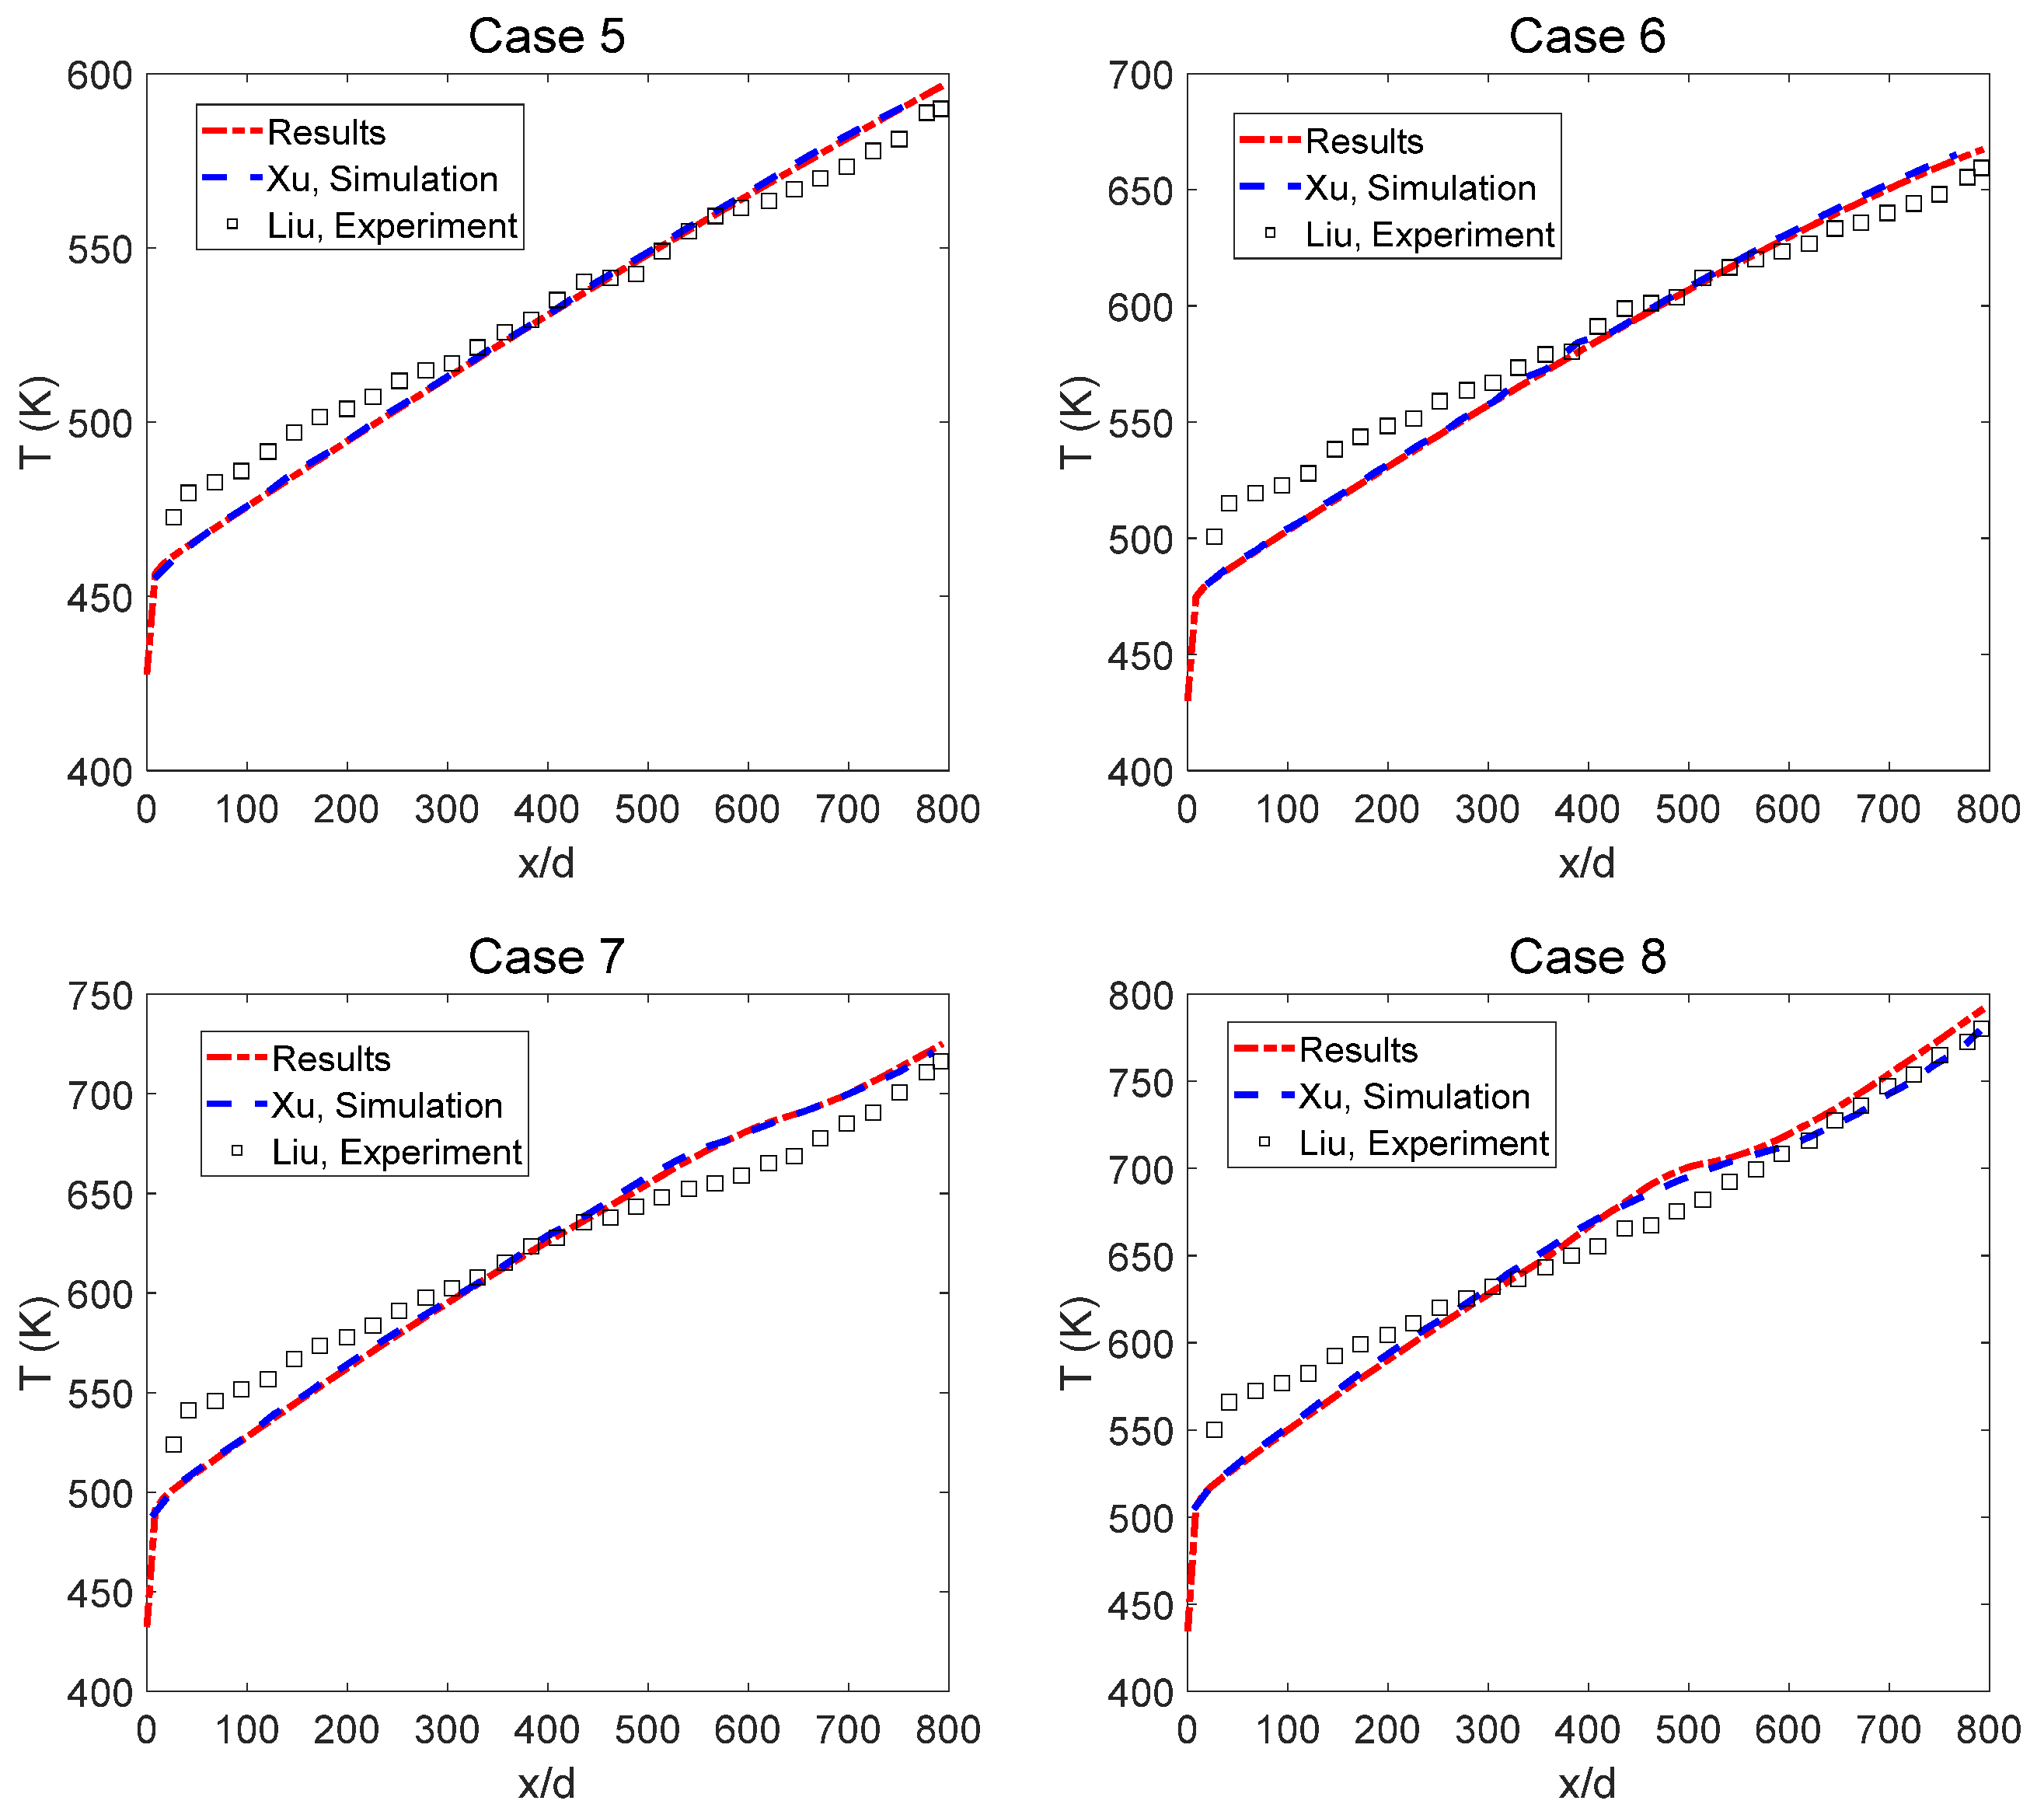
To the best of our knowledge, there is a lack of experimental studies investigating the flow and heat transfer characteristics of supercritical n-decane in channels similar to those depicted in Figure 6 and Figure 7. Hence, comparisons between the simulation results and experimental data obtained from the flow of supercritical n-decane through a vertical circular tube [41] as well as aviation kerosene RP-3 flowing through a U-turn tube [42] were carried out to validate our simulation method and turbulence model.
The first validation example involves a vertical tube with an inner diameter of 0.95 mm, an outer diameter of 2 mm, and a length of 977.5 mm. These analysis cases, referred to as Cases 1–8 in Ref. [43], operate at a pressure of 3 MPa and an inlet temperature of 423.15 K. Among these cases, Cases 1–4 have an inlet Reynolds number of 2700, while Cases 5–8 have a higher Reynolds number of 4000. The wall heat flux ranges from 72 kW/m2 to 393 kW/m2. Table 4 summarizes the detailed operating conditions. In the second example, the curved section of the U-turn pipe has a radius of 20 mm, while the tube features an inner diameter of 1.82 mm and a wall thickness of 0.19 mm. The experimental conditions include an operating pressure of 4 MPa, an inlet temperature of 523 K, and a mass flow rate of 1178 kg/(m2·s). Four different heat flux conditions are considered: 200 kW/m2, 400 kW/m2, 500 kW/m2, and 600 kW/m2. Thermo-physical data for aviation kerosene can refer to the ten-component surrogate model in Ref. [44].
The findings depicted in Figure 14 and Figure 15 suggest that the CFD model employing the SST k-ω turbulence model yielded accurate outcomes for both Reynolds numbers, with only minor deviations observed in the inlet region. The disparities, except for Case 3 and Case 4, are negligible, ranging from approximately 3% to 6%. Even with variances of 6.56% and 11.62% for Case 3 and Case 4, respectively, these values still fall within acceptable engineering limits. The prediction of the wall temperature in Figure 16 exhibits excellent agreement with the experimental data for three different heat fluxes of 200, 500, and 600 kW/m2. For a wall heat flux of 400 kW/m2, the average and maximum deviations are 4.22% and 5.83%, respectively.

3.2. Temperature Test for Competitive Selection of Optimal Channel Scheme

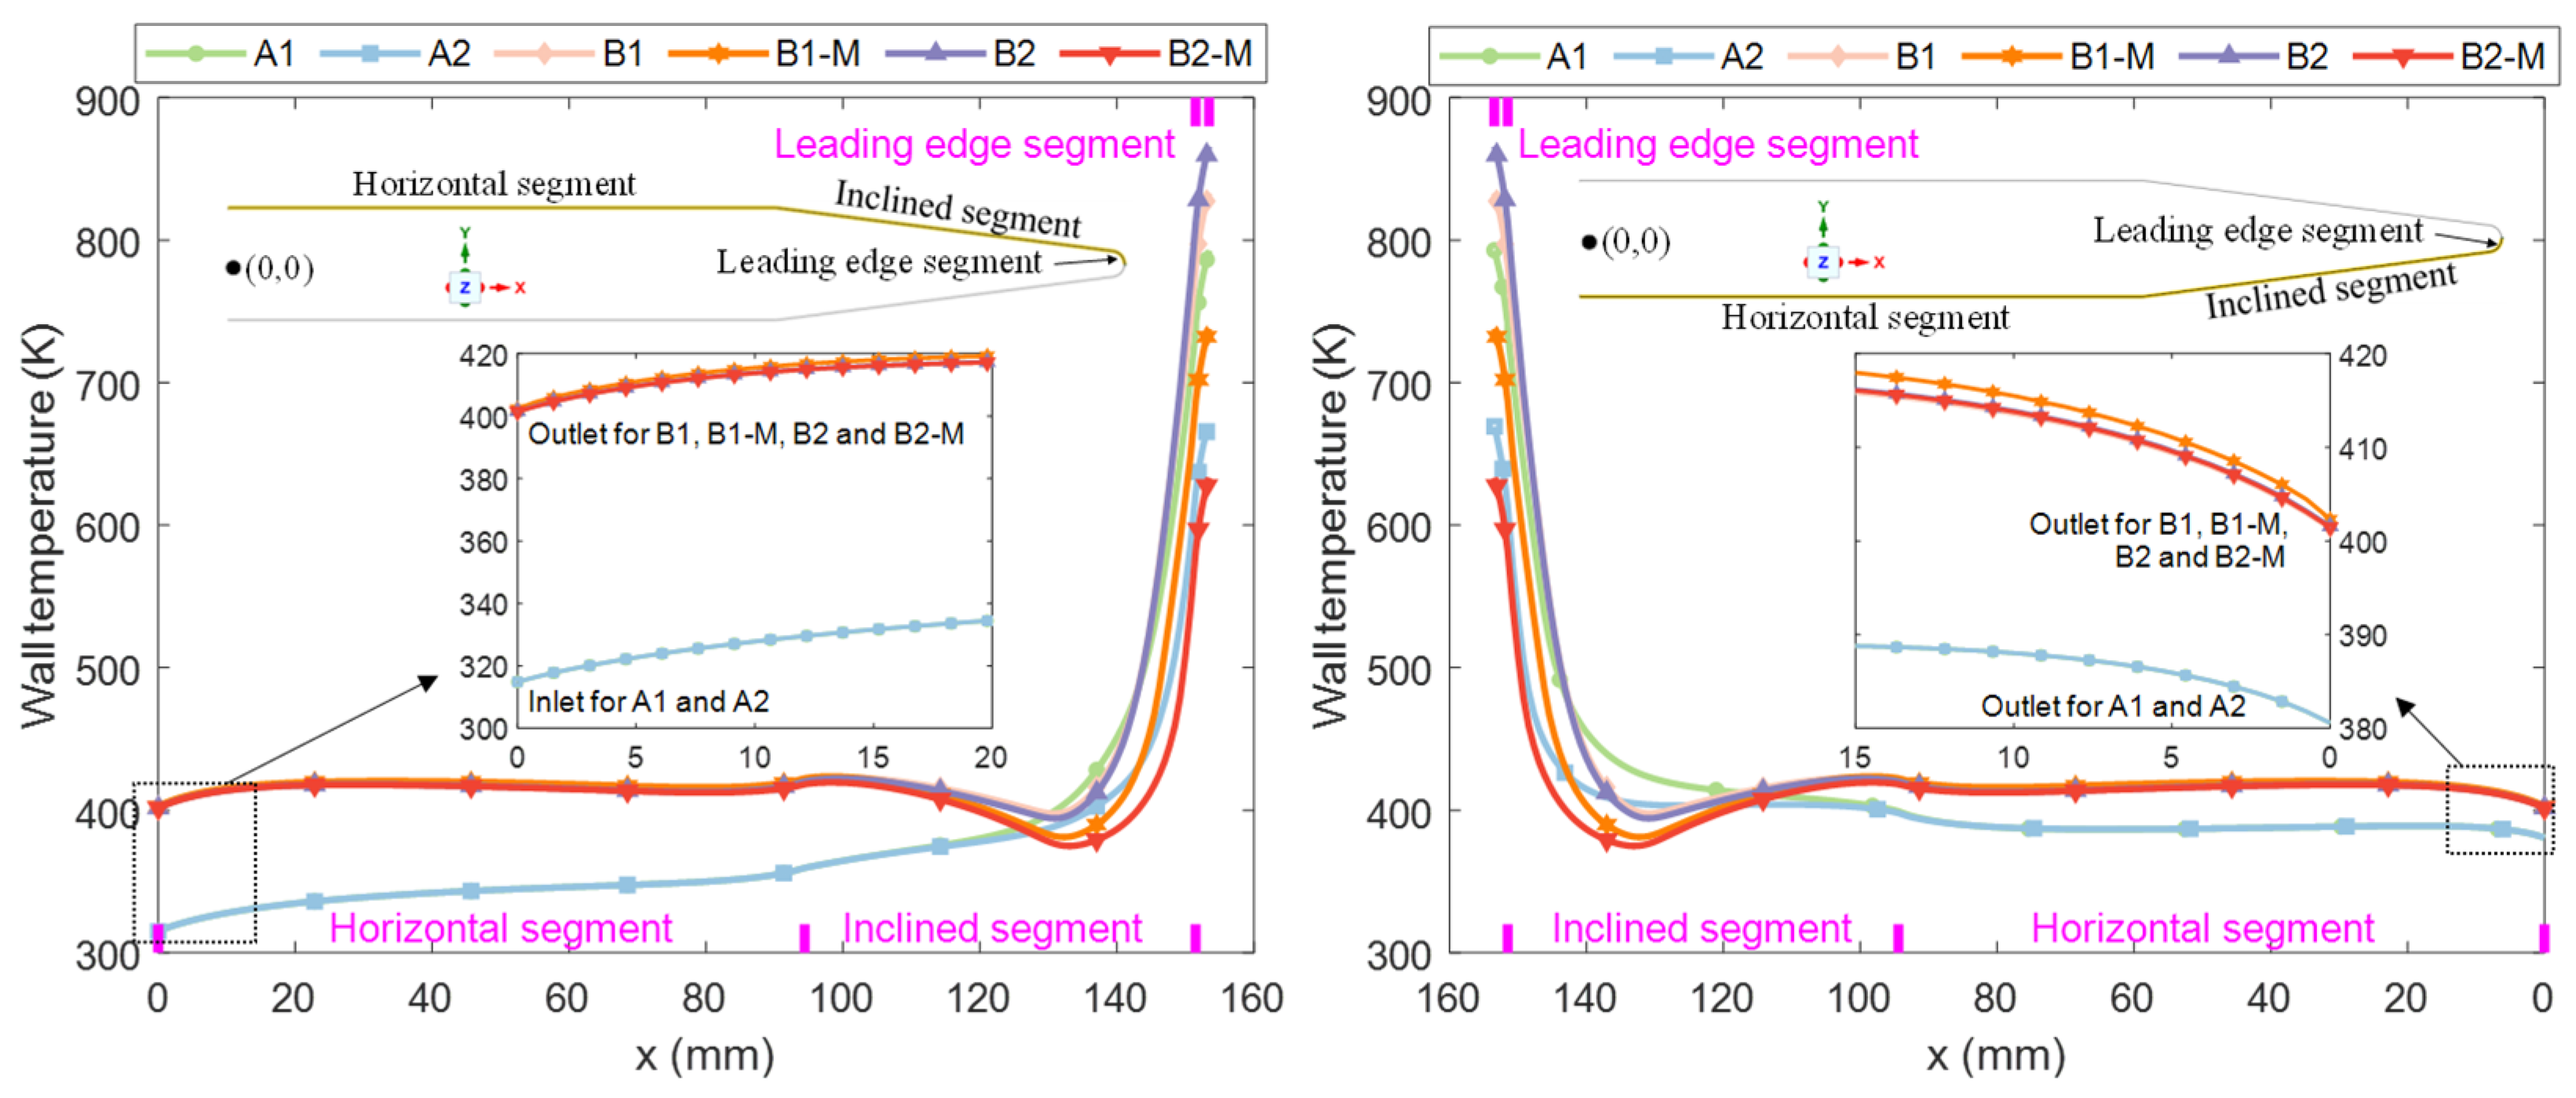
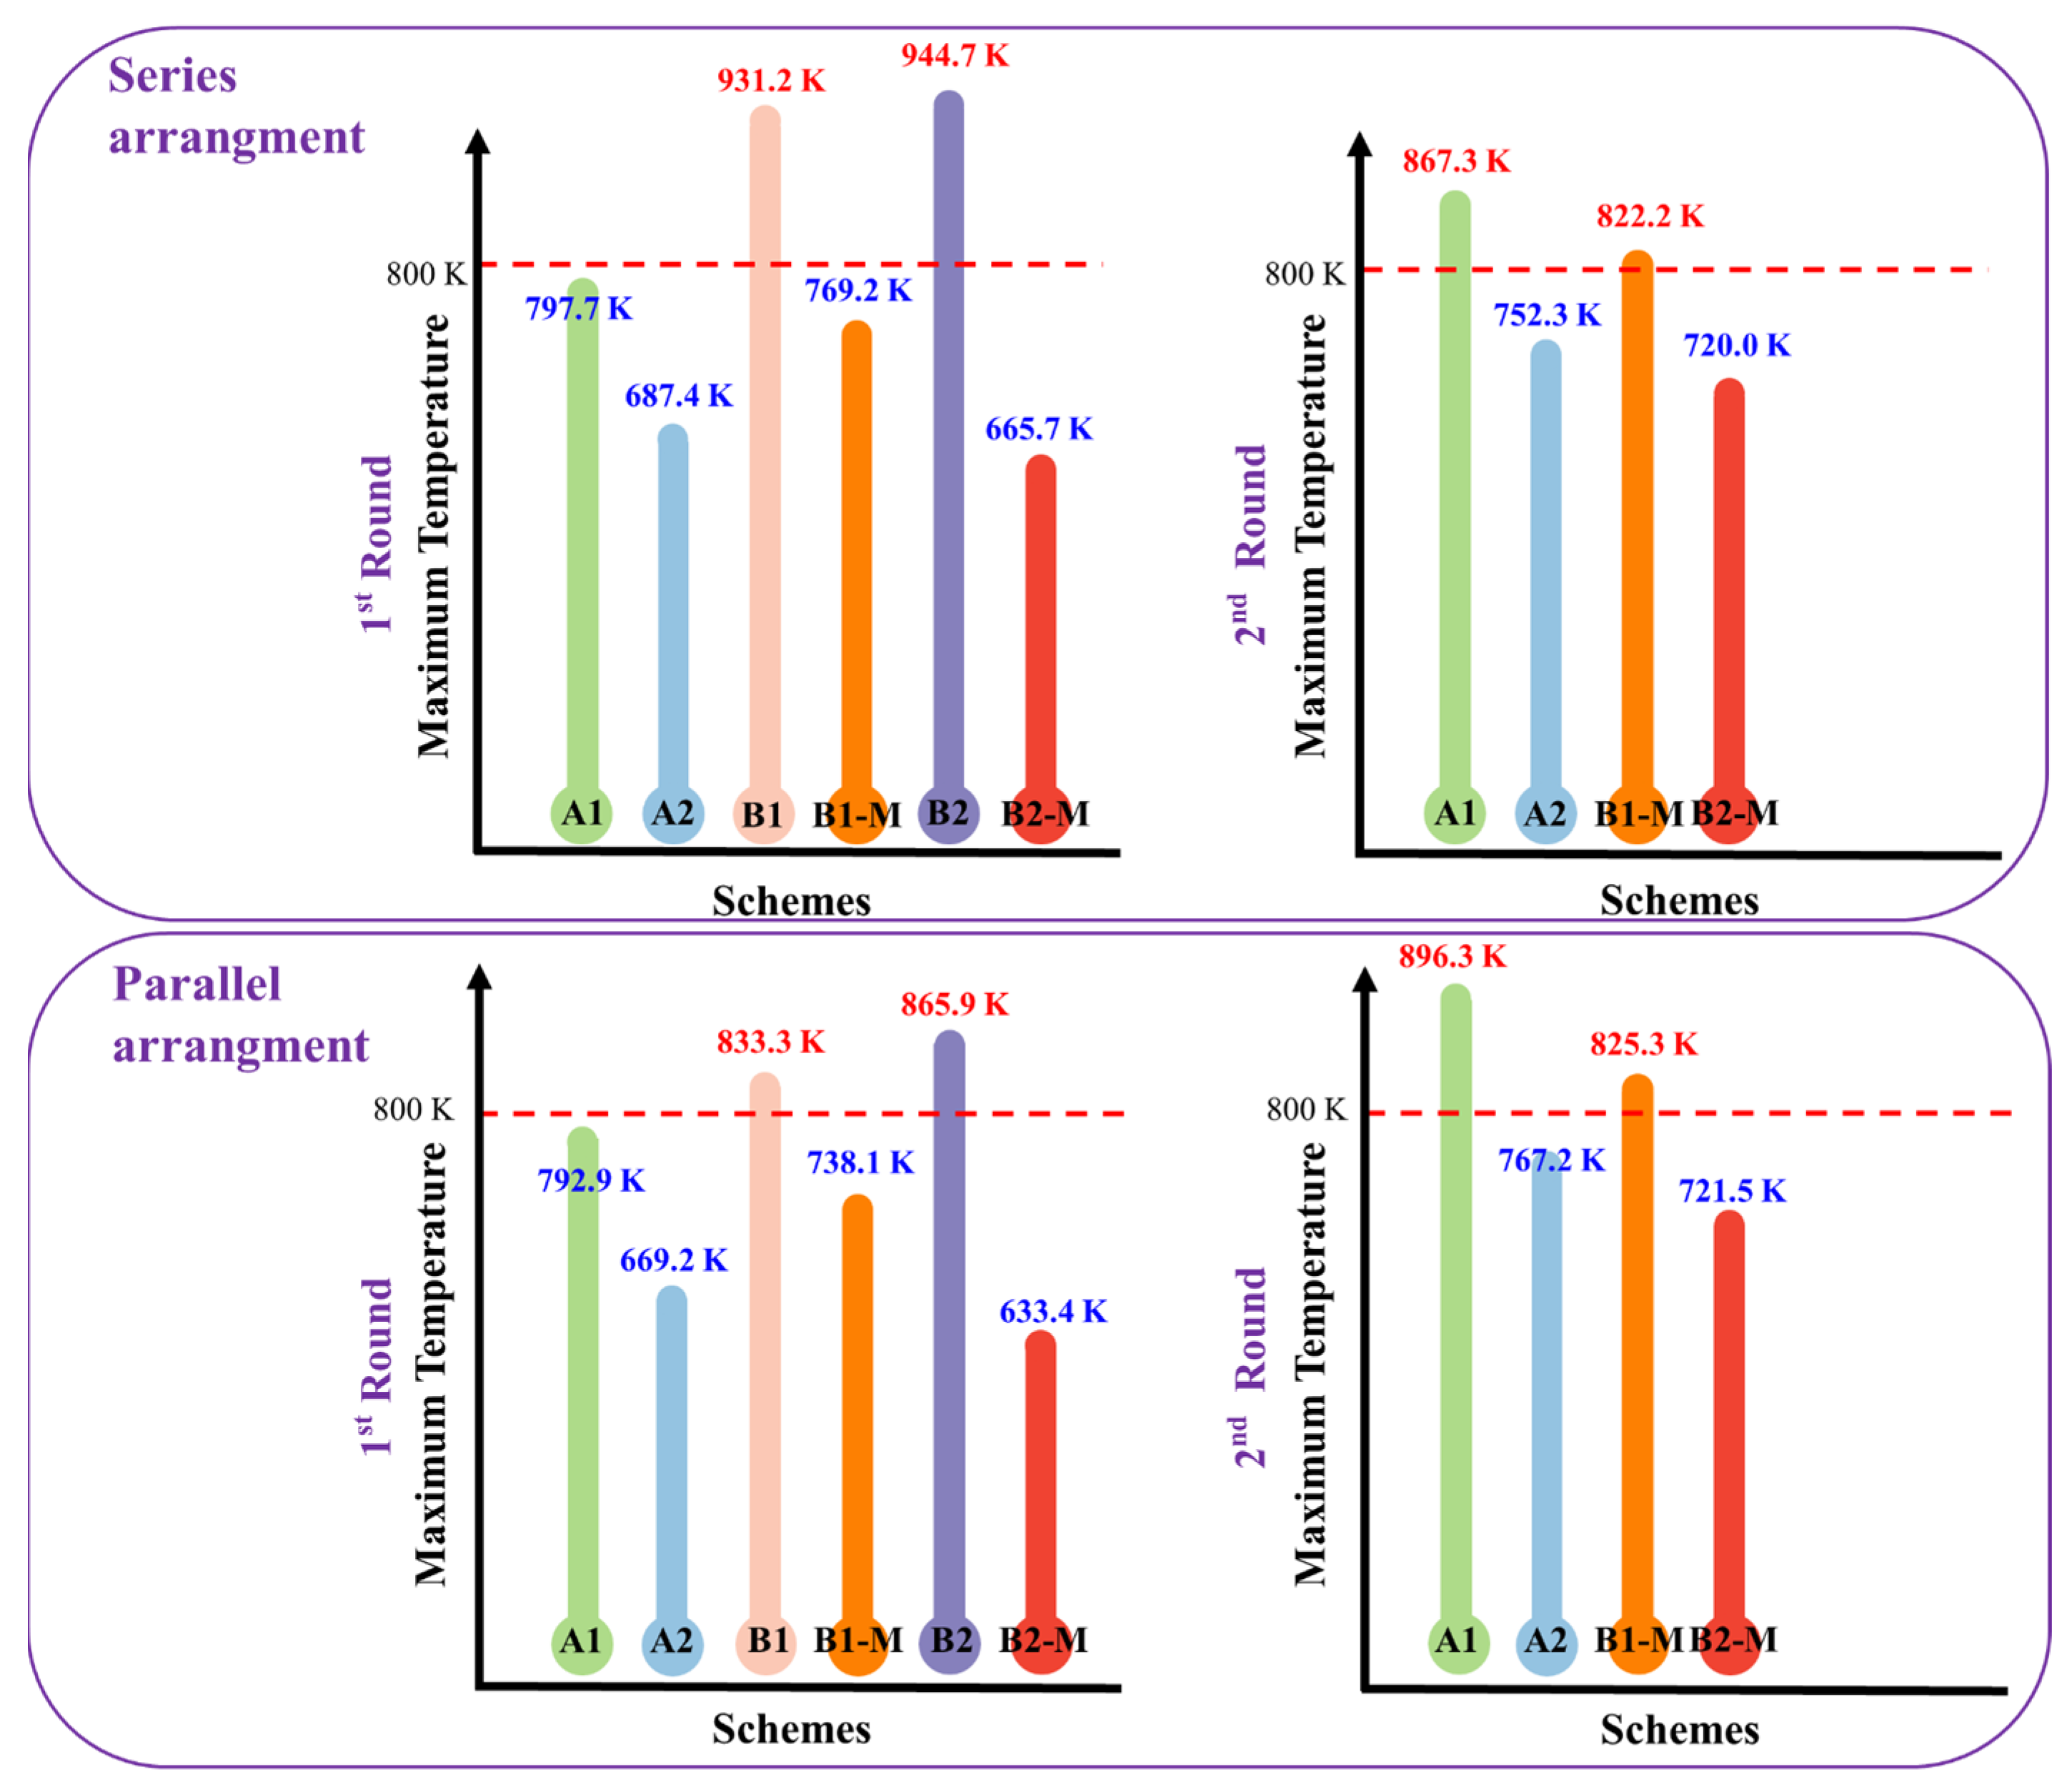
Firstly, the cooling channel in the all-movable rudder located downstream in the series arrangement was considered. Figure 17 illustrates the temperature distribution of the six different cooling schemes during the first round of testing, where the inlet flow rate was 2 g/s, and the inlet temperature was 400 K. The maximum outer-wall temperatures in the positive interval of the y-axis are all located at the tip of the leading-edge segment and are arranged in descending order as follows: 944.7 K (B2), 931.2 K (B1), 797.7 K (A1), 769.2 K (B1-M), 687.4 K (A2), and 665.7 K (B2-M). It is evident that B1 and B2 significantly surpass the evaluation threshold of 800 K. A1 barely meets the test requirements, but any decrease in the flow rate is expected to result in failure. B1-M also meets the standard, albeit with a narrow margin of only 30 K. Encouragingly, both A2 and B2-M demonstrate exceptional cooling performances by being 112.6 K and 134.3 K below the temperature limit, respectively. It is also important to note the differences in the outer-wall temperature distribution between the category A and category B cooling channels due to their distinct flow paths. For A1 and A2, the outer-wall temperature increases along the positive x-axis (flow direction), with a notable spike near the leading-edge segment. In contrast, for B1, B1-M, B2, and B2-M, the temperature sharply decreases along the negative x-axis (flow direction) in the leading-edge region, followed by slight undulations in the inclined segment, and stabilizes in the horizontal segment with outlet temperatures around 440 K. Figure 17 (right) shows the outer-wall temperatures along the negative y-axis. For B1, B1-M, B2, and B2-M, the temperature profiles are symmetrically distributed relative to the symmetry plane. In contrast, for A1 and A2, the outer-wall temperatures gradually decline along the negative x-axis (flow direction), reaching an outlet temperature of around 435 K.
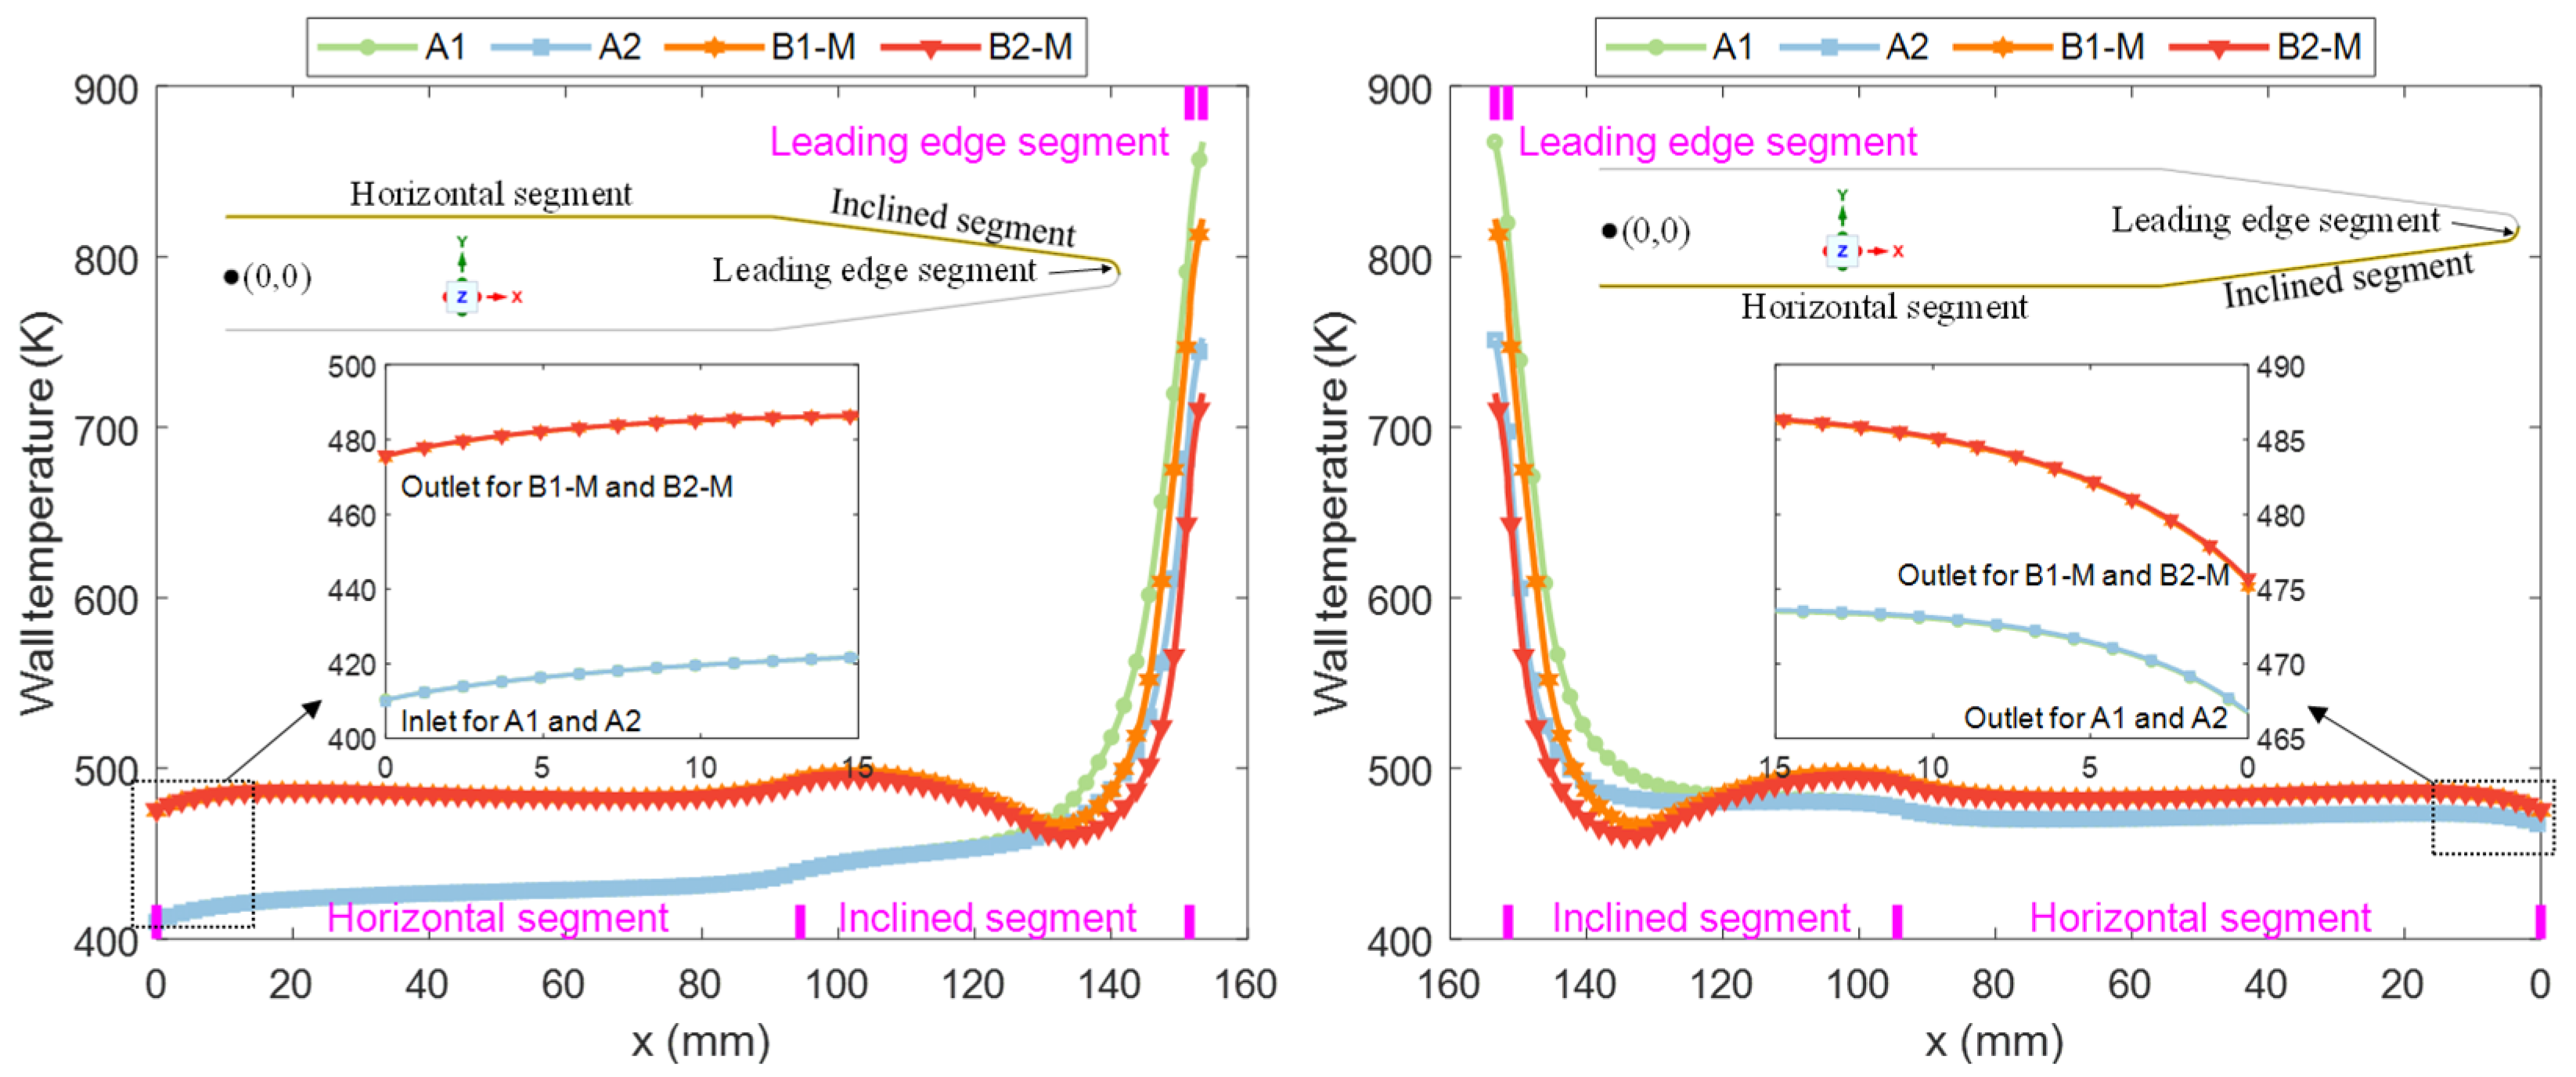
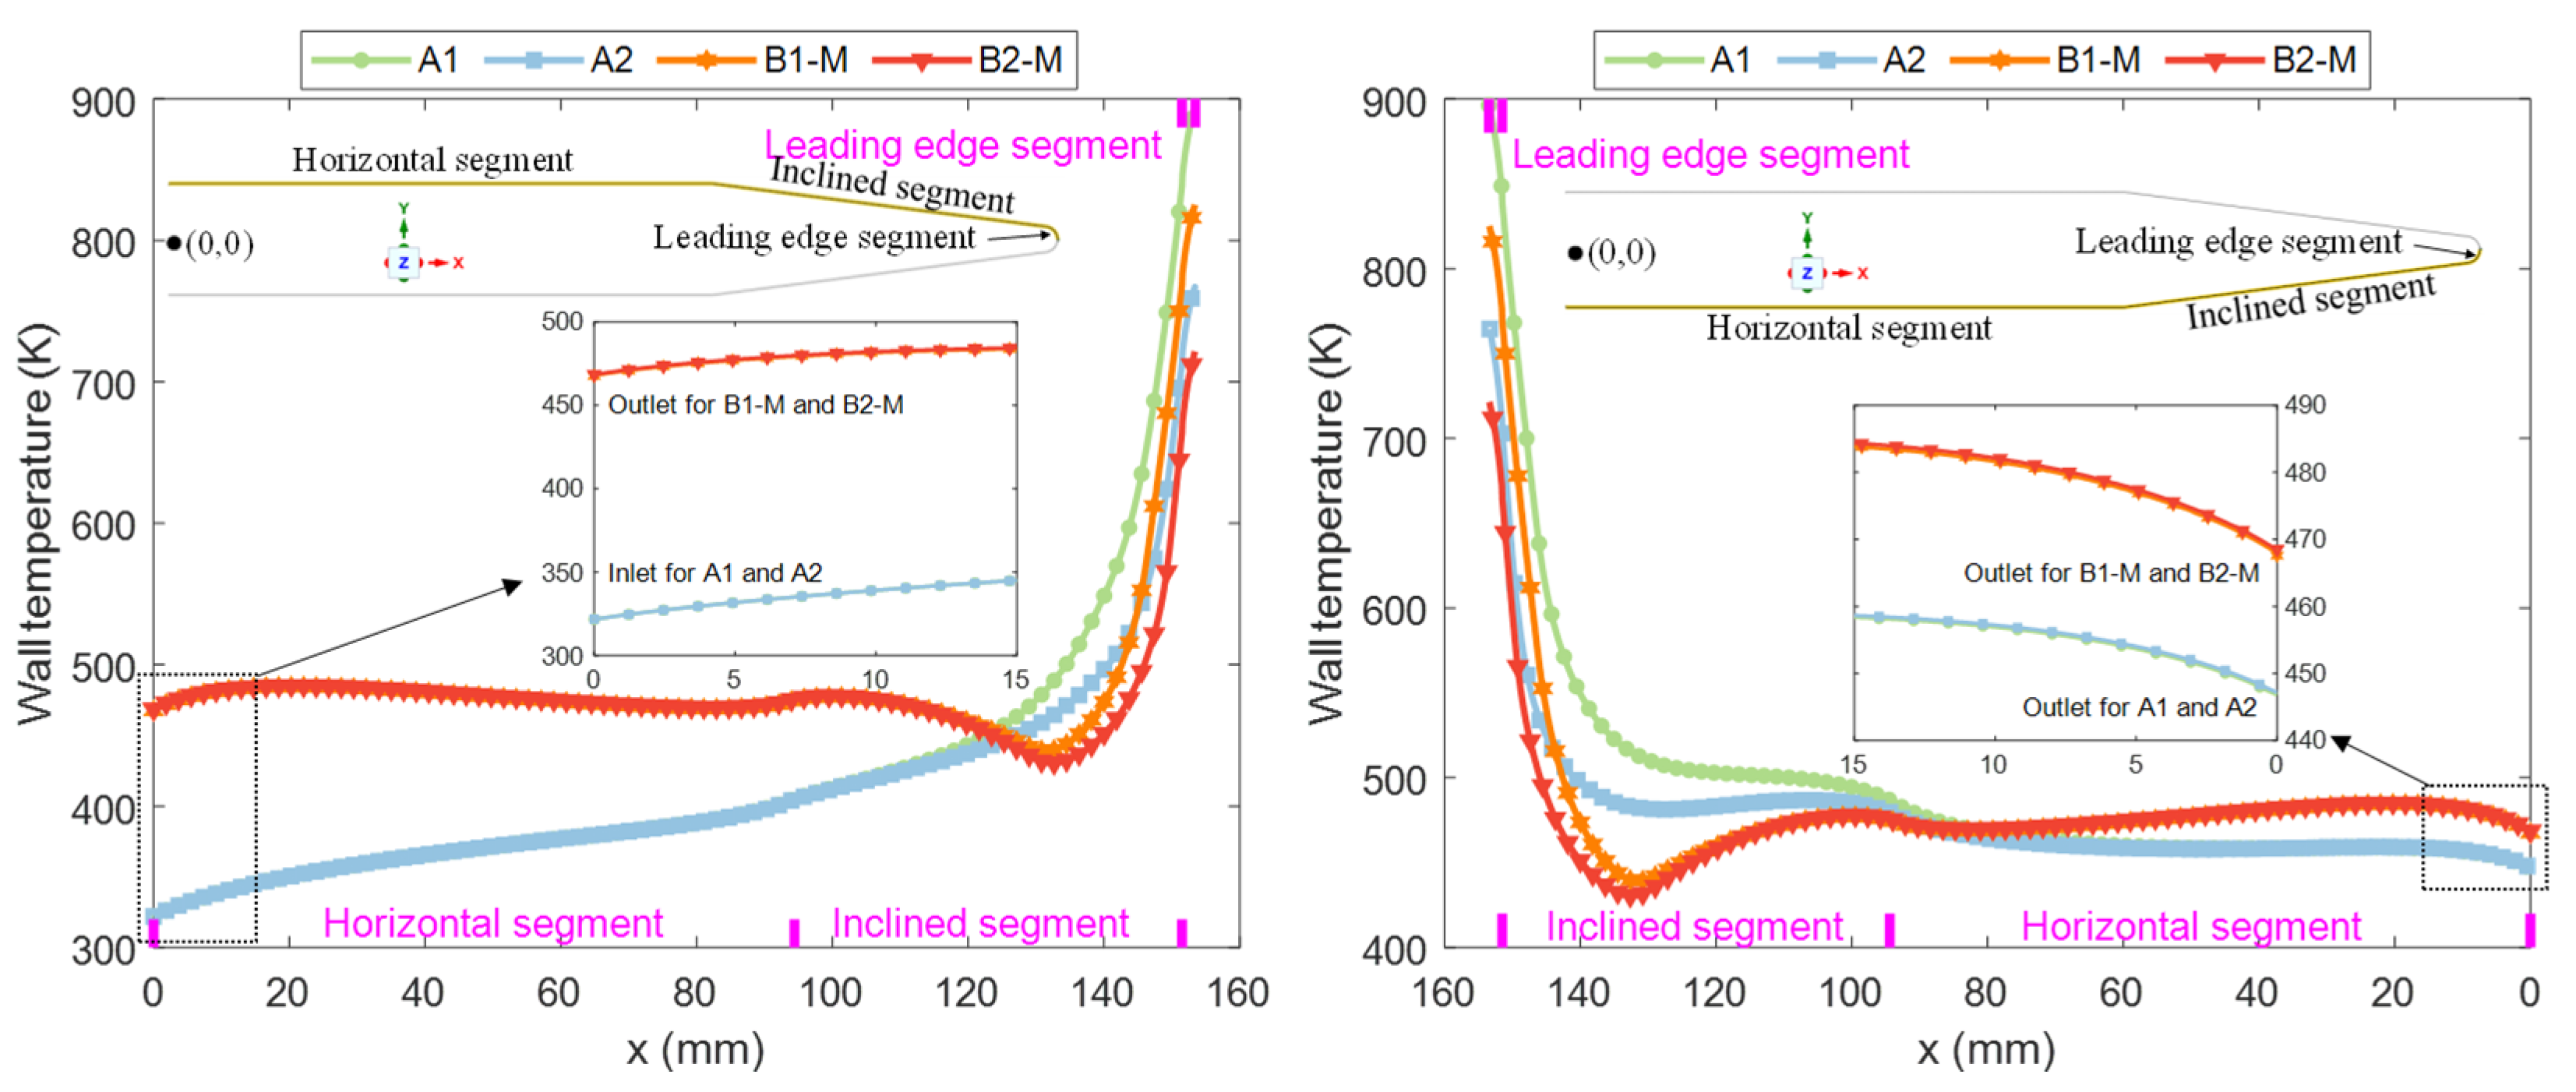
Figure 18 illustrates the temperature distribution along the outer wall of the cooling channels A1, A2, B1-M, and B2-M during the second-round tests. In this round, a reduced inlet velocity of 1 g/s was employed while maintaining an inlet temperature of 400 K. The impact of the decreased flow rate on the temperature distribution was immediately apparent: it resulted in a larger temperature difference between the inlet- and outlet-wall temperatures for both the category A and category B channels. Specifically, the outlet temperatures for A1 and A2 were approximately 467 K, whereas B1-M and B2-M exhibited outlet temperatures around 475 K. Moreover, the inclined segment in the category B channels displayed a more pronounced decrease in temperature. Finally, focusing on the critical performance assessment as anticipated, A1 and B1-M, which barely met the previous requirements, exceeded their respective maximum allowable temperatures with values reaching 867.3 K and 822.2 K, respectively, during this round of testing. Conversely, both A2 and B2-M comfortably passed once again without exceeding any of the limits set forth by our study criteria. Notably, even under further reduced flow conditions, channel B2-M demonstrated a peak temperature as low as 720 K, which is significantly below our predetermined threshold, suggesting its potential to meet all the requirements.
Figure 18 presents the outer-wall temperature distributions for the cooling channels A1, A2, B1-M, and B2-M during the second-round tests, where the inlet velocity was reduced to 1 g/s while the inlet temperature remained at 400 K. The impact of the reduced flow rate on the temperature distribution was immediately evident: the lower flow rate resulted in a greater temperature differential between the inlet- and outlet-wall temperatures for both the category A and category B channels. Specifically, the outlet-wall temperatures for A1 and A2 were approximately 467 K, while B1-M and B2-M exhibited outlet temperatures of around 475 K. Additionally, the category B channels displayed a more pronounced temperature drop in the inclined segment. Finally, focusing on the critical performance assessment, as expected, A1 and B1-M, which barely passed the previous round, exceeded the temperature limit in this round, with maximum temperatures of 867.3 K and 822.2 K, respectively. In contrast, A2 and B2-M comfortably passed the test once again. Notably, B2-M exhibited a peak temperature of only 720 K, which is 80 K below the threshold, suggesting it could still meet the requirements even under further reduced flow conditions.
The results of the two rounds of testing for the parallel arrangement are presented in Figure 19 and Figure 20. Figure 19 shows the temperature distribution from the first round, where the flow rate was 1 g/s, and the inlet temperature was 300 K. The overall distribution pattern remains consistent with the previous observations, so it is not described further here. However, it is important to note that the temperature difference between the outlet and inlet is significantly larger compared to that of the series arrangement. Specifically, the outlet-wall temperatures for the category A channels are approximately 380 K, while for the category B channels, the outlet temperatures are around 400 K. The maximum temperatures are arranged in descending order as follows: 865.9 K (B2), 833.3 K (B1), 792.9 K (A1), 738.1 K (B1-M), 669.2 K (A2), and 633.4 K (B2-M). Once again, A1, A2, B1-M, and B2-M passed the test. Figure 20 presents the results of the second round, where the flow rate was reduced to 0.5 g/s, and the inlet temperature remained at 300 K. The difference between the inlet and outlet wall temperatures became even more pronounced, with A1 and A2 showing outlet wall temperatures of 447 K, and B1-M and B2-M showing around 470 K. In the final evaluations, A2 and B2-M successfully passed this round of testing as well, with maximum temperatures closely resembling those observed in the series arrangement, at 767.2 K and 721.5 K, respectively.
Figure 21 provides a summary of the tests conducted for both the series and parallel arrangements. Overall, B1 and B2 proved to be ineffective designs, exhibiting poor cooling performances. While A1 and B1-M passed the initial round of testing, they were unable to handle the challenge posed by the reduced flow rates. In contrast, A2 and B2-M demonstrated excellent cooling efficiencies, with B2-M in particular showing the potential for maintaining the performance even under further reduced flow conditions.

3.3. Flow Characteristics

A quantitative analysis of the outer-wall temperature in the cooling channel is provided above. However, it is crucial to gain a profound understanding of the underlying mechanisms governing the distinct heat transfer observed in all the considered configurations. Here, we present an in-depth discussion of the flow and temperature fields in the leading-edge segment within each channel configuration.
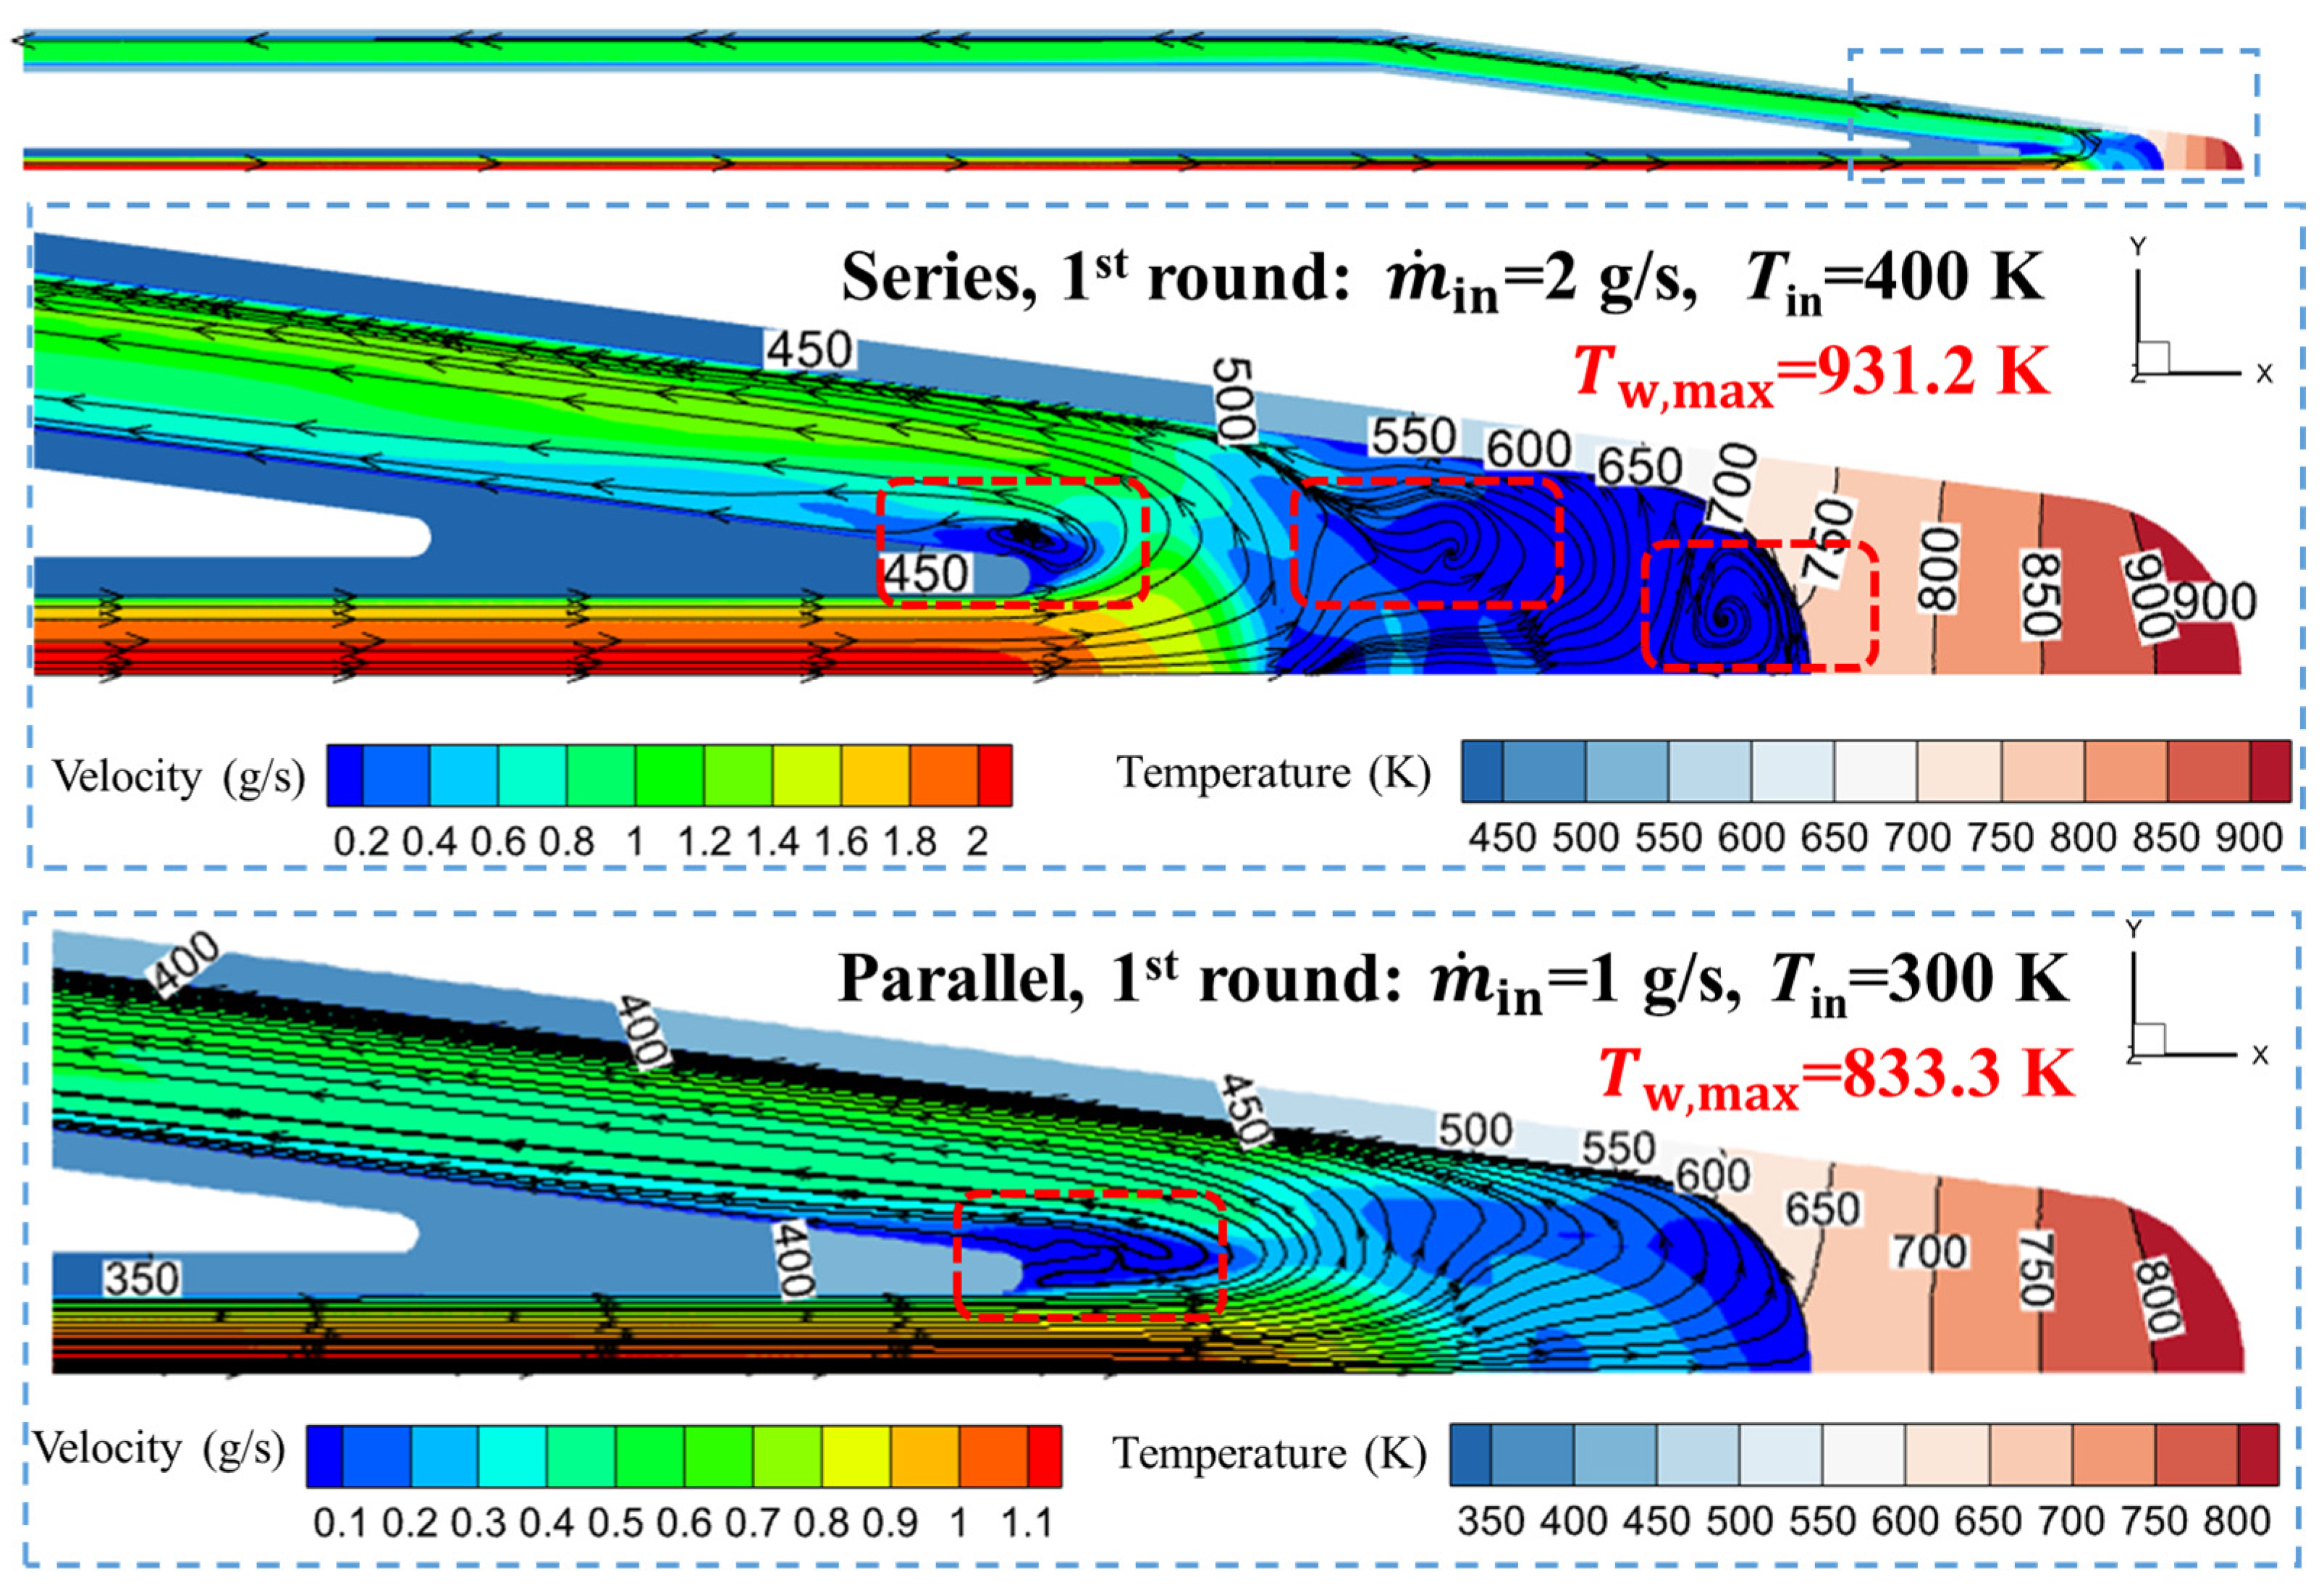
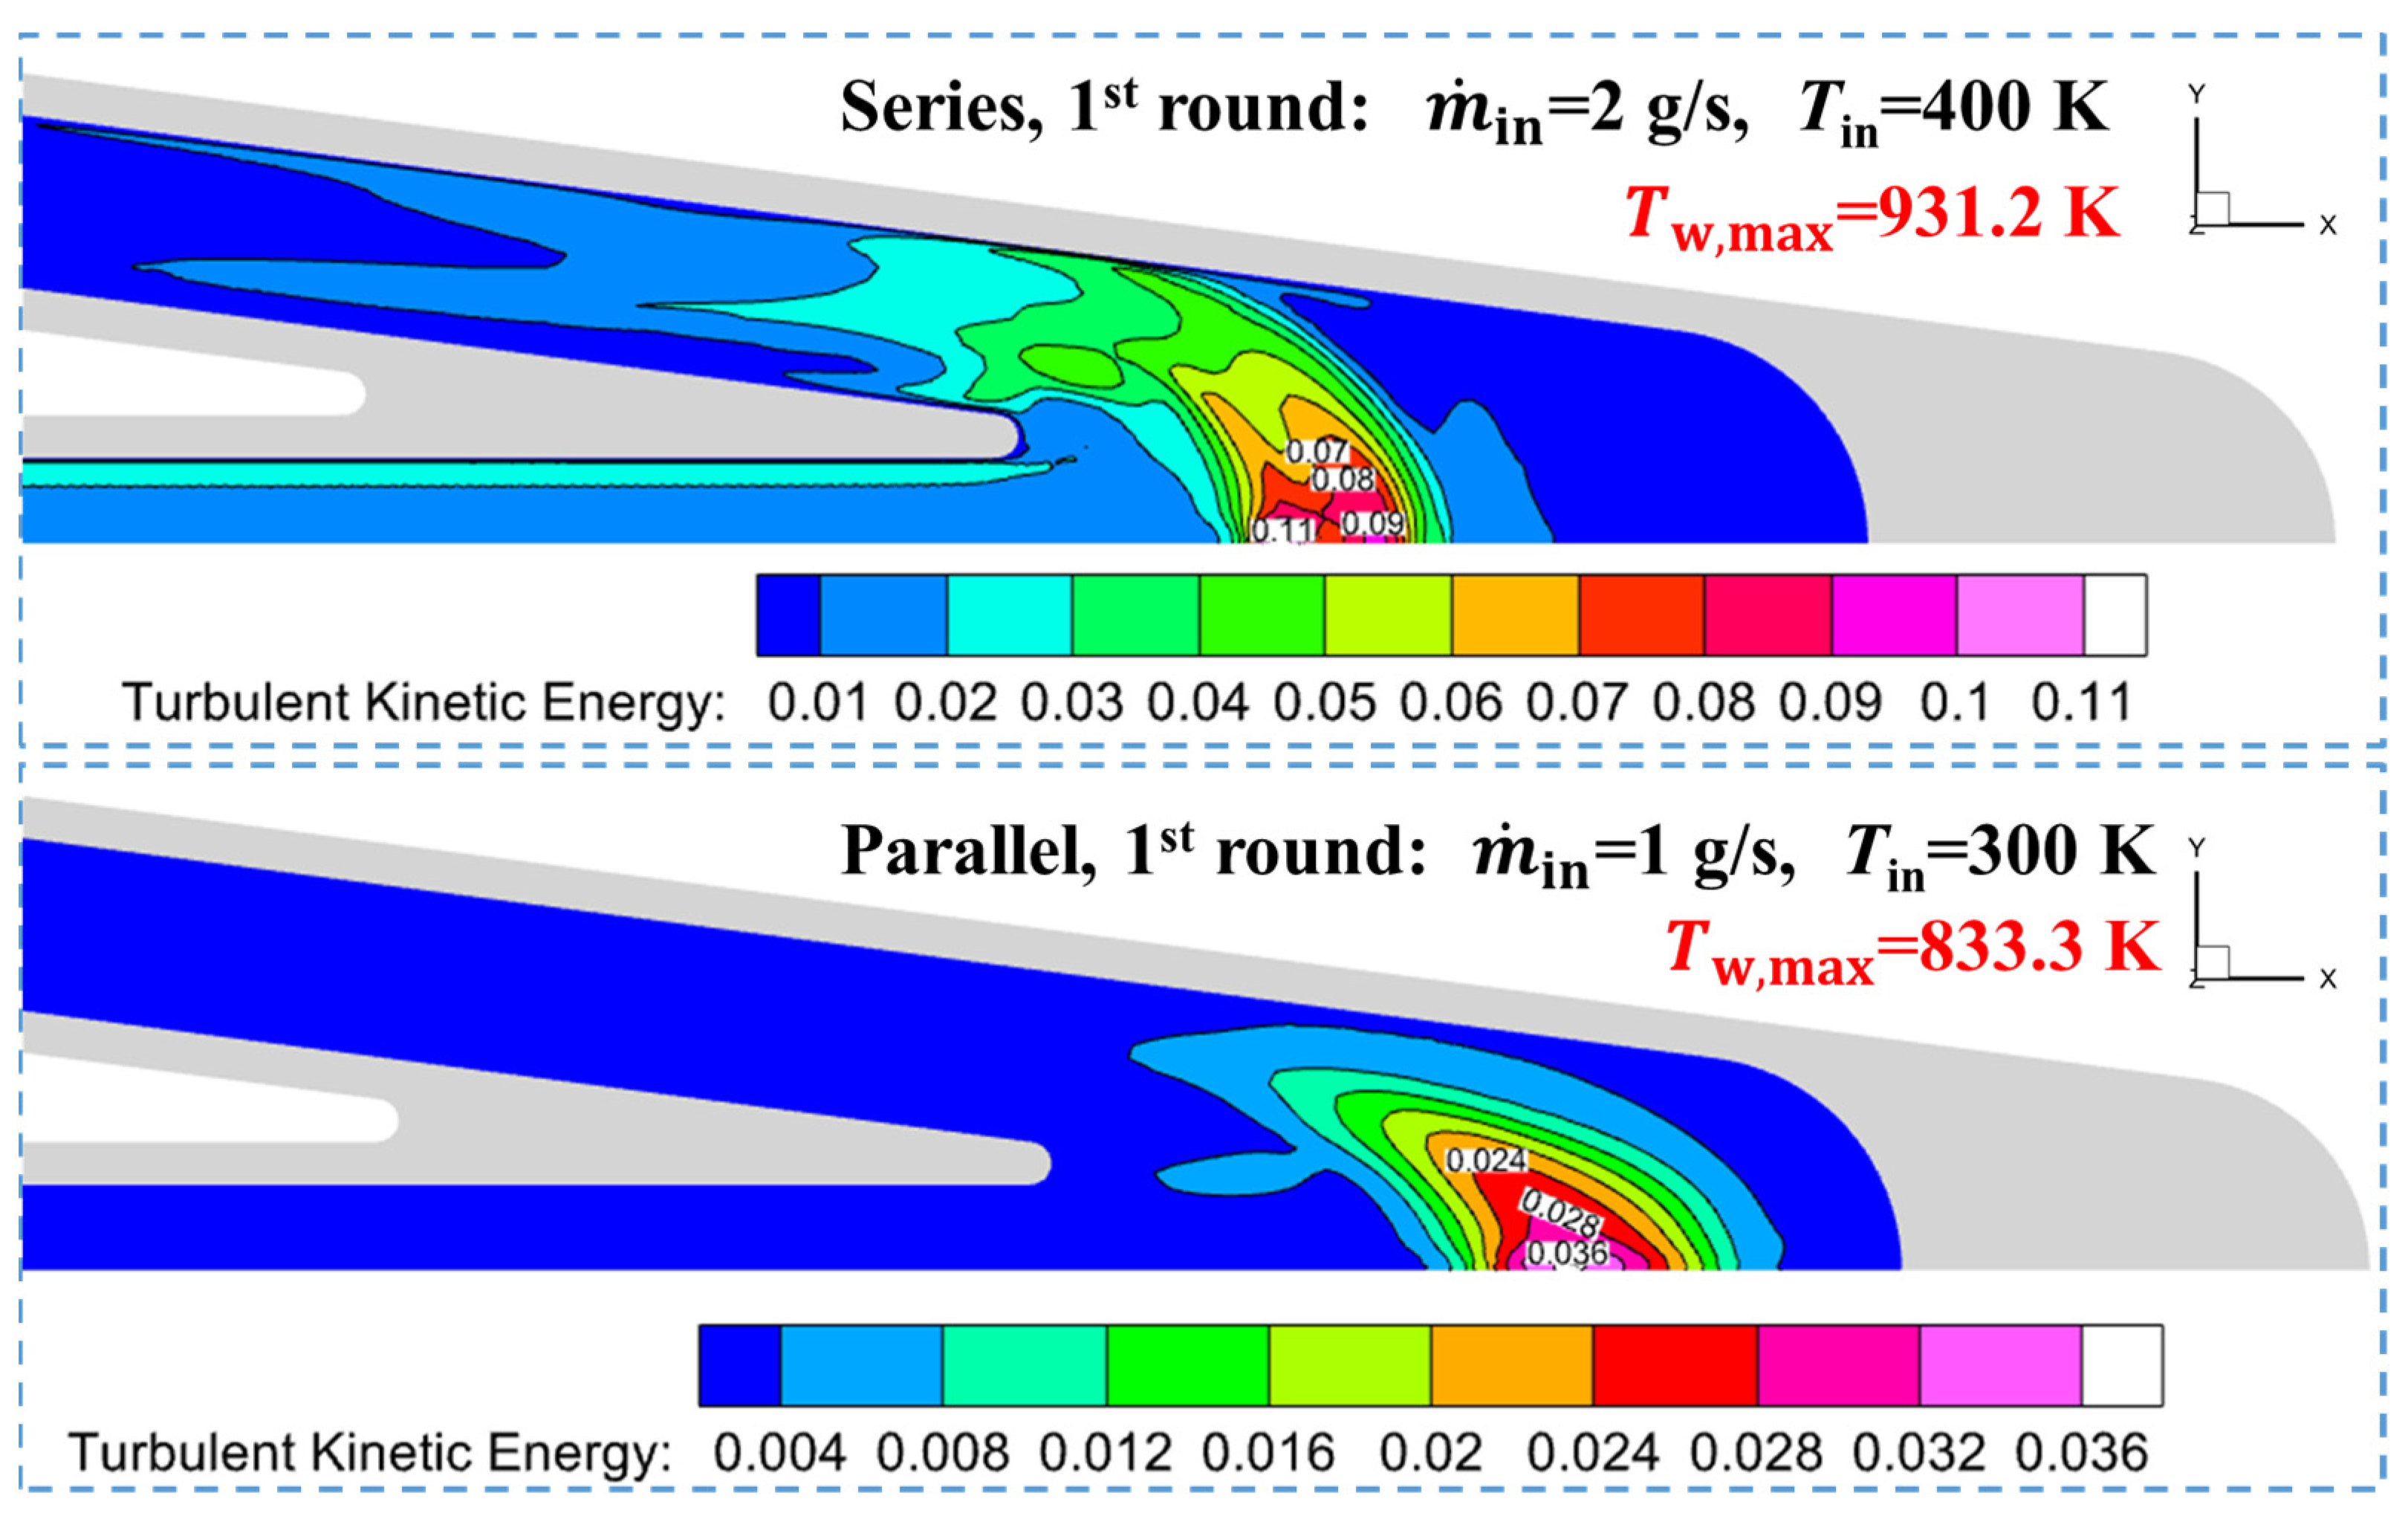
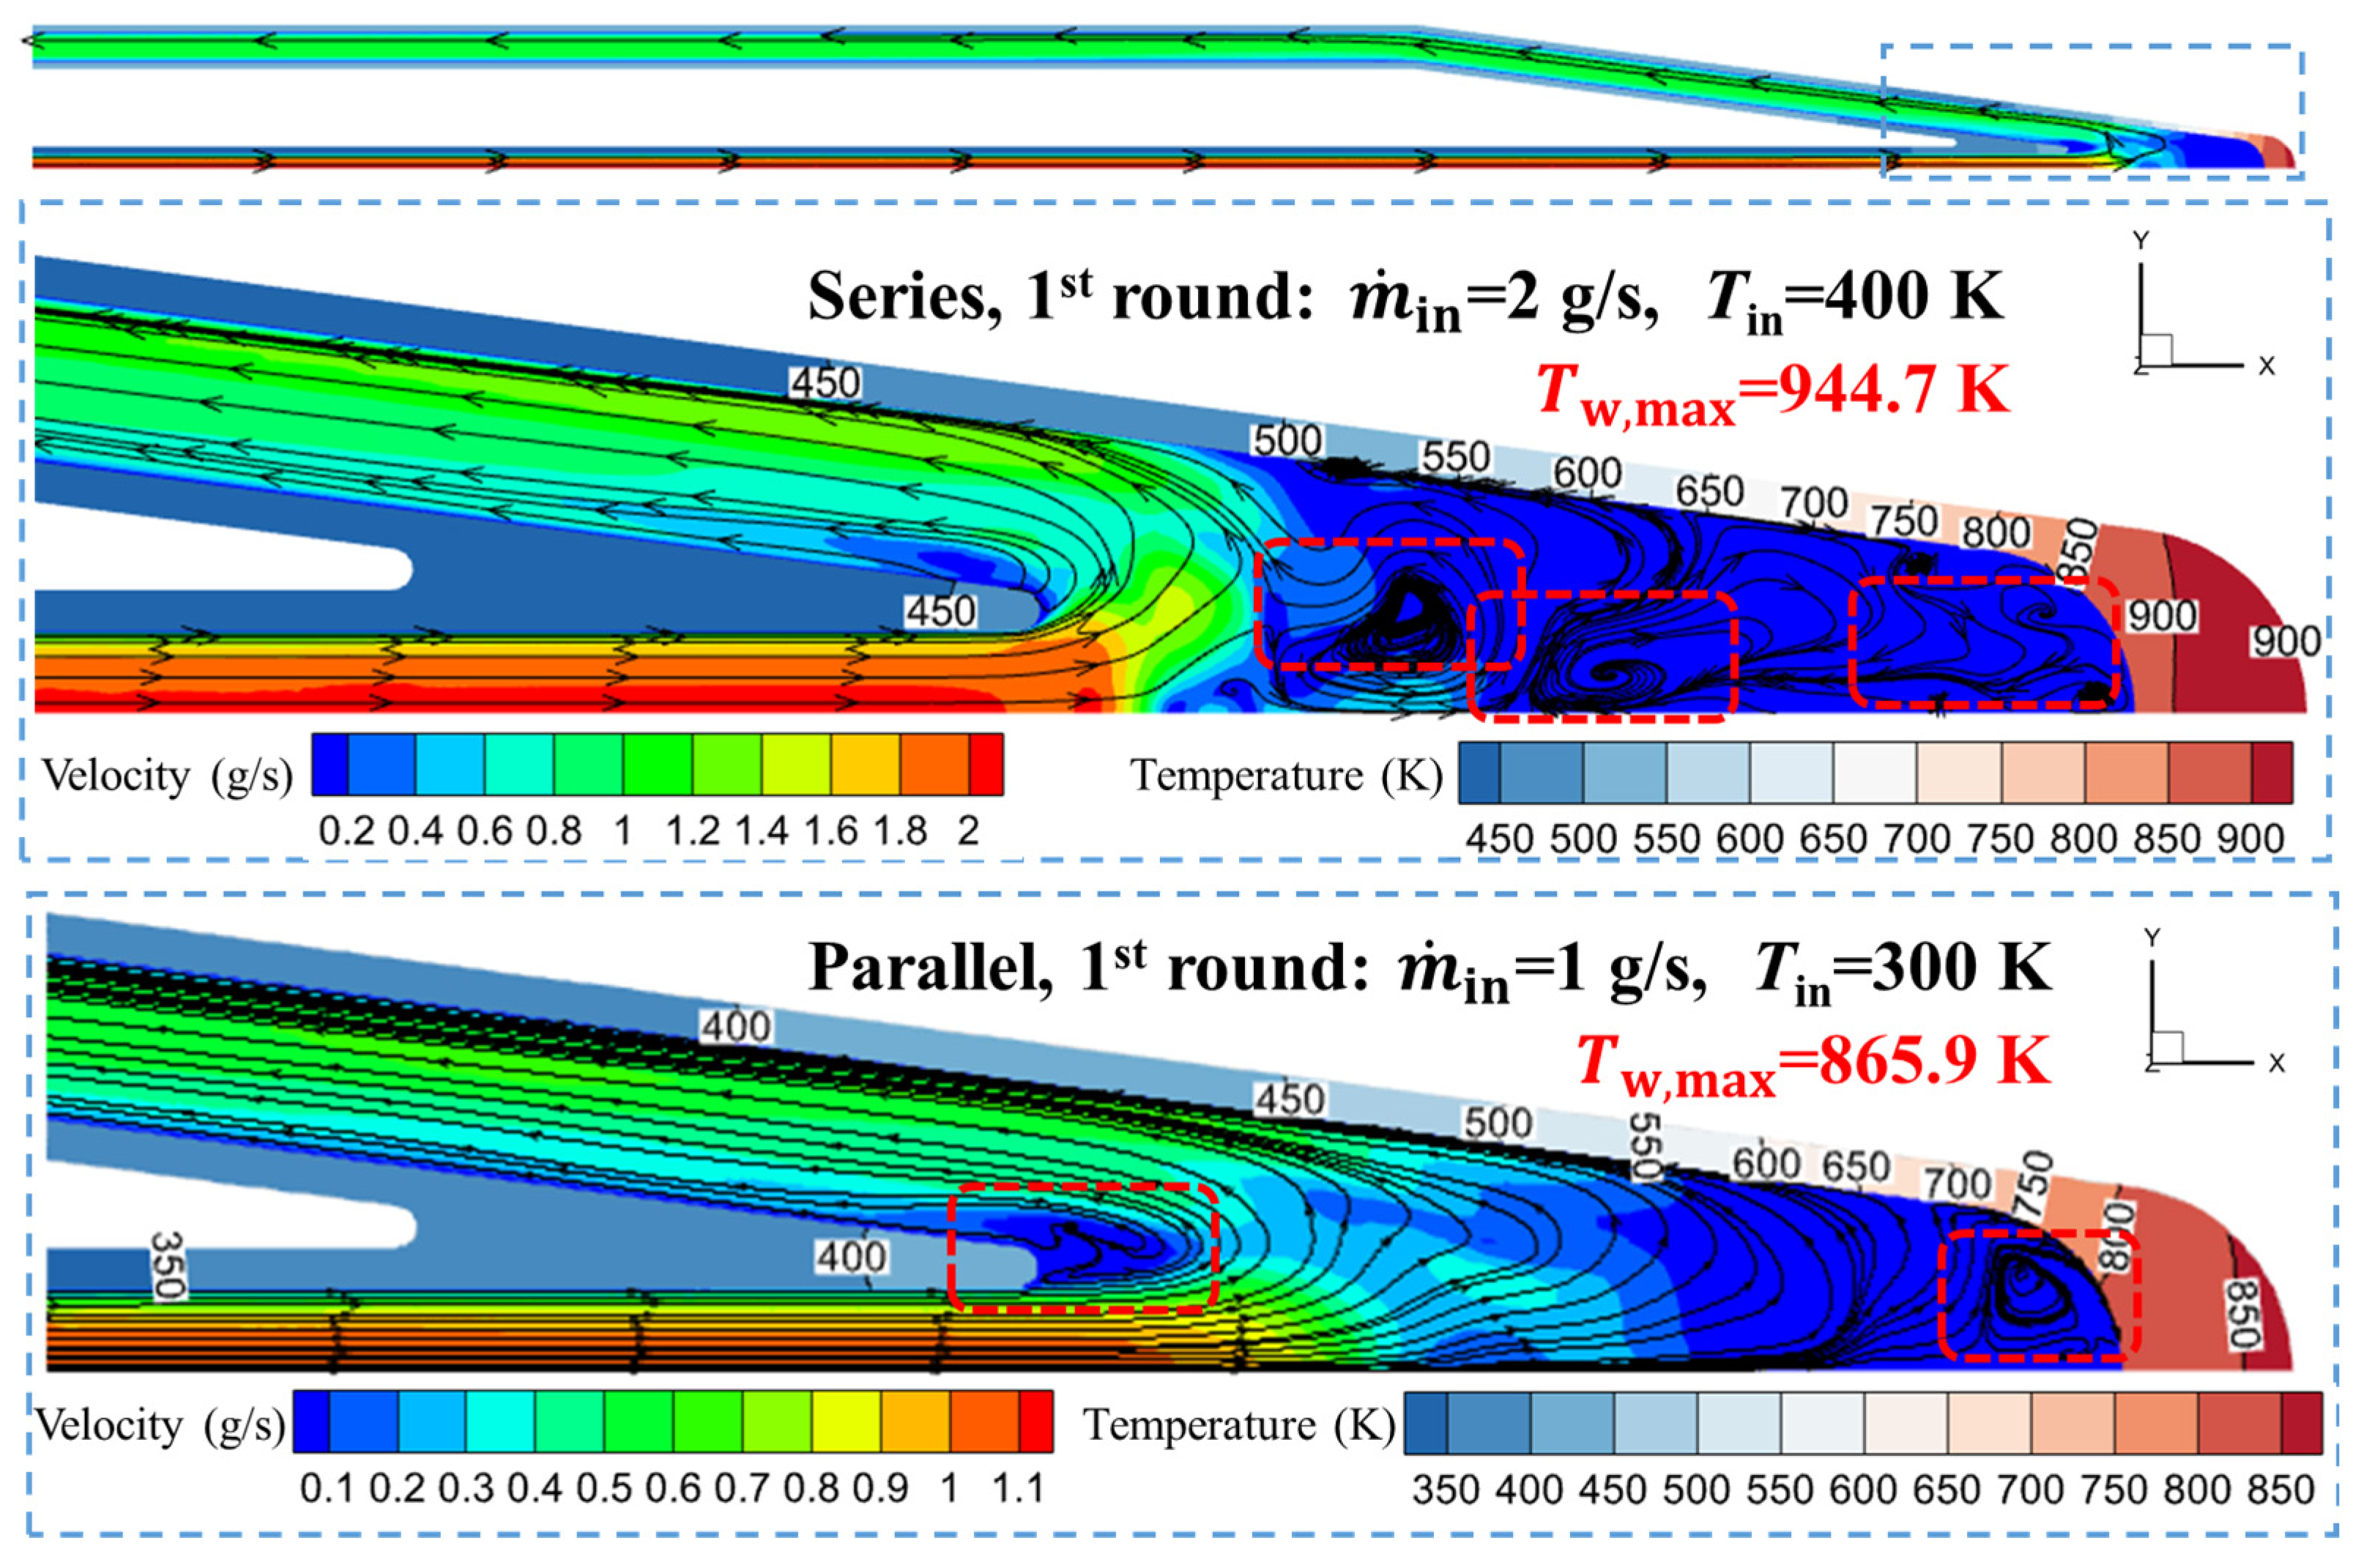
We first analyze the flow characteristics to explain the poor performance of the B1 and B2 channels during the initial tests in both the series and parallel arrangements. Figure 22 shows the wall temperature distribution and streamline patterns on the streamwise–spanwise (x-y) plane for Scheme B1. When the flow rate is 2 g/s and the inlet temperature is 400 K, multiple recirculation zones appear. These zones are located near the inner wall, bends, and heated surfaces, as highlighted by the red dashed box. While recirculation zones generate localized turbulence, as seen in Figure 23, which could enhance heat transfer, they also cause stagnation. In these stagnation regions, the flow velocity approaches zero due to the large cavity size. This reduces the cooling efficiency, leading to poor heat removal. At a reduced flow rate of 1 g/s and an inlet temperature of 300 K, the flow remains mostly laminar. This is consistent with the low turbulent kinetic energy (TKE) shown in Figure 23. In this condition, the fluid near the outer wall moves slowly. This limits heat transfer, causing high wall temperatures. A small recirculation zone forms near the inner-wall bend, but it has a minimal impact on the outer-wall cooling.
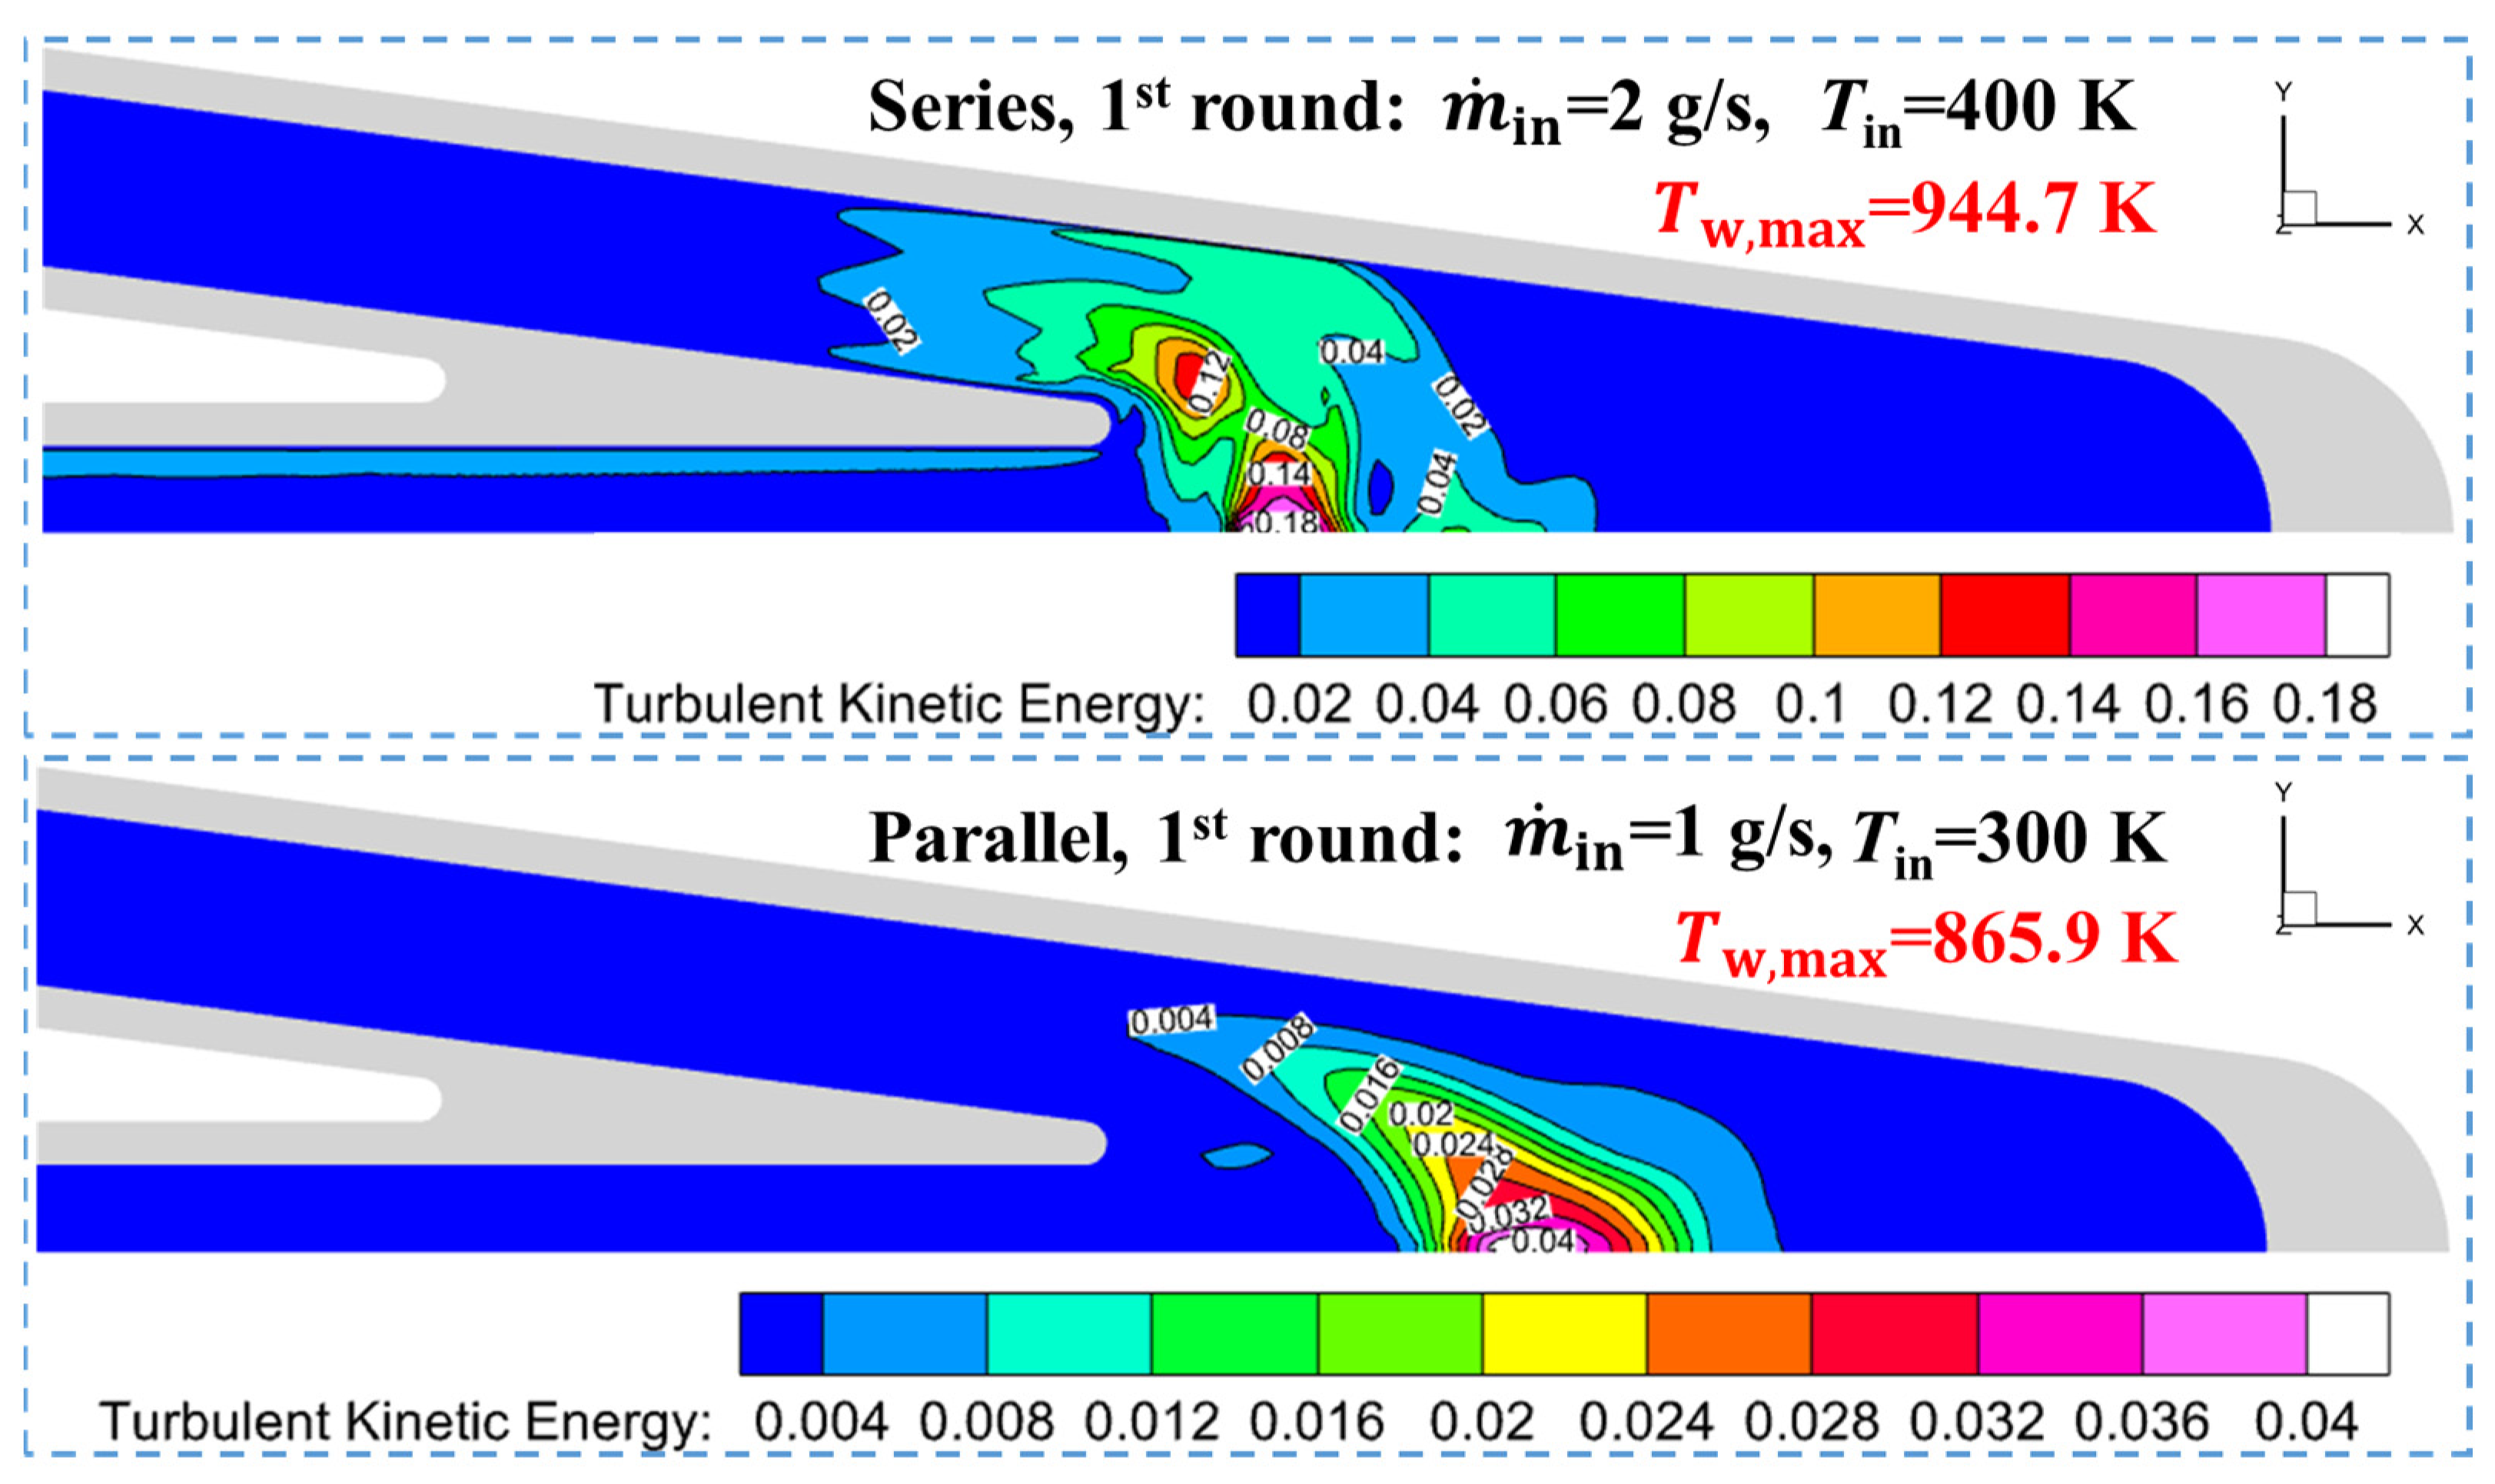
Figure 24 presents the temperature distribution and flow streamlines for the B2 channel. At a flow rate of 2 g/s and an inlet temperature of 400 K, the B2 channel exhibits more complex recirculation or stagnation zones due to its larger cavity compared to B1. While these chaotic flow structures generate higher turbulence intensity, as shown in Figure 25, the turbulence occurs in the center of the cavity, far from the walls, and thus fails to enhance heat transfer. Under reduced flow rate conditions, B2 develops additional recirculation zones compared to B1. These regions of nearly stagnant fluid offer no improvement in heat transfer.
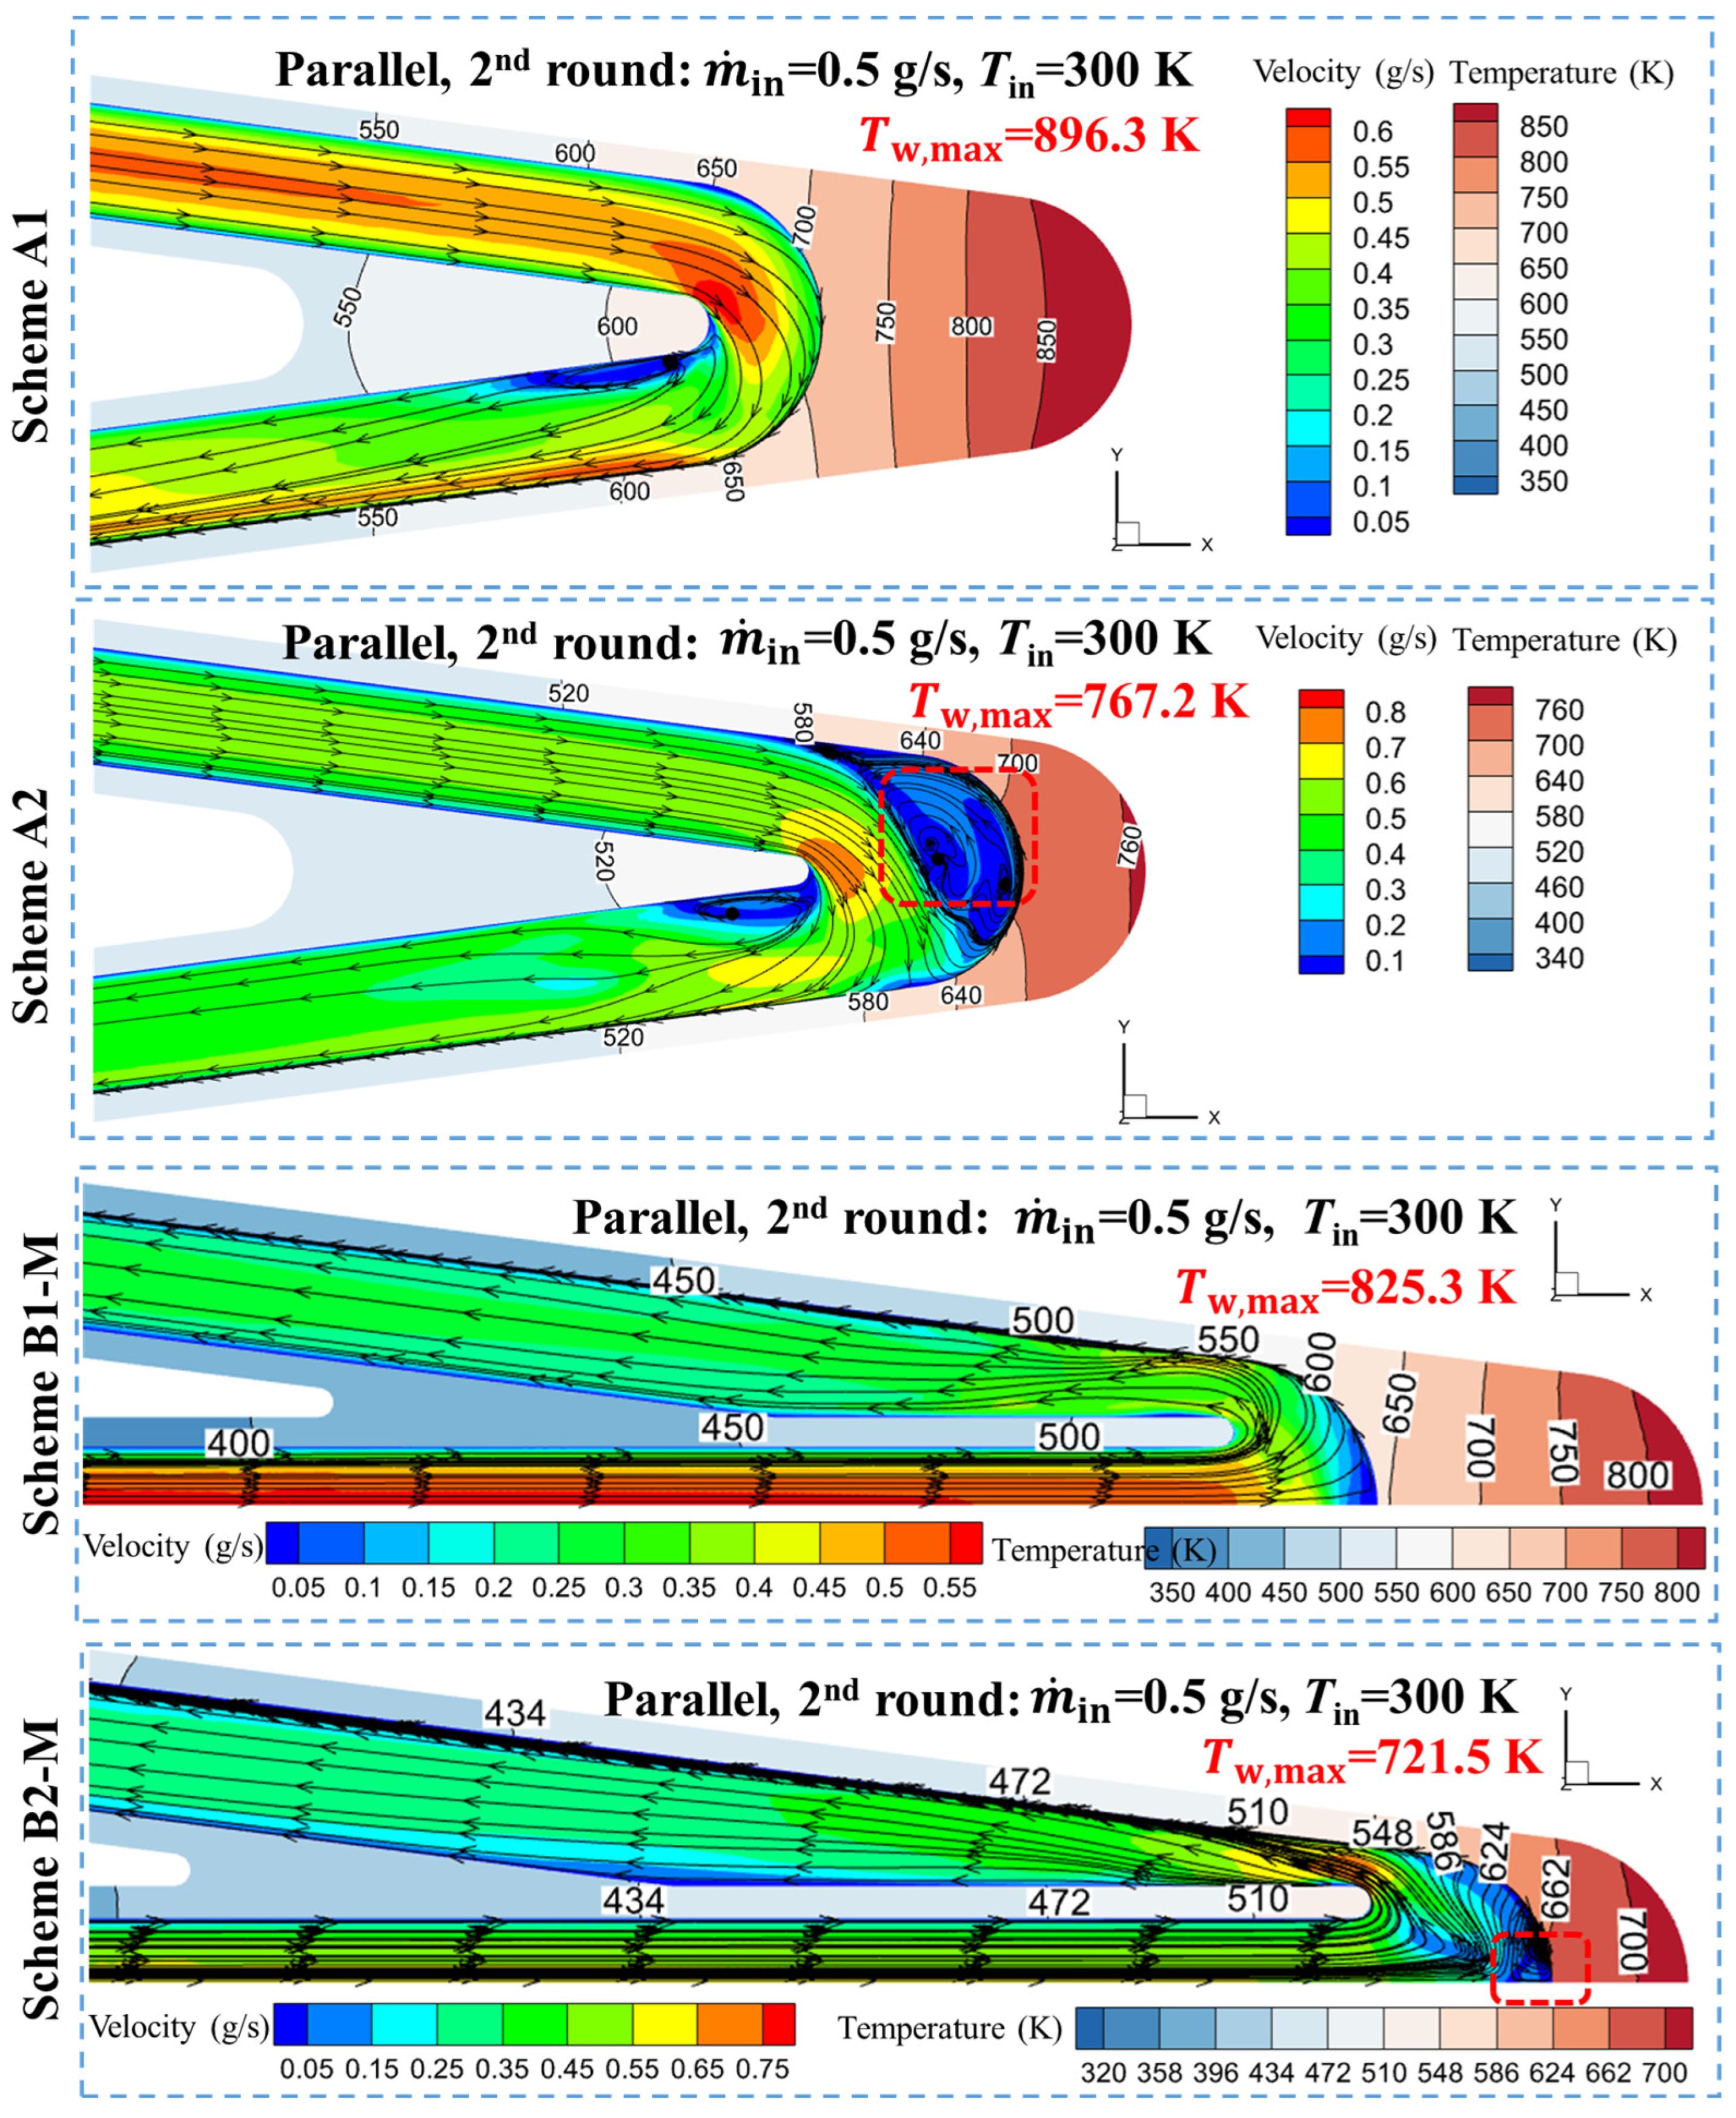
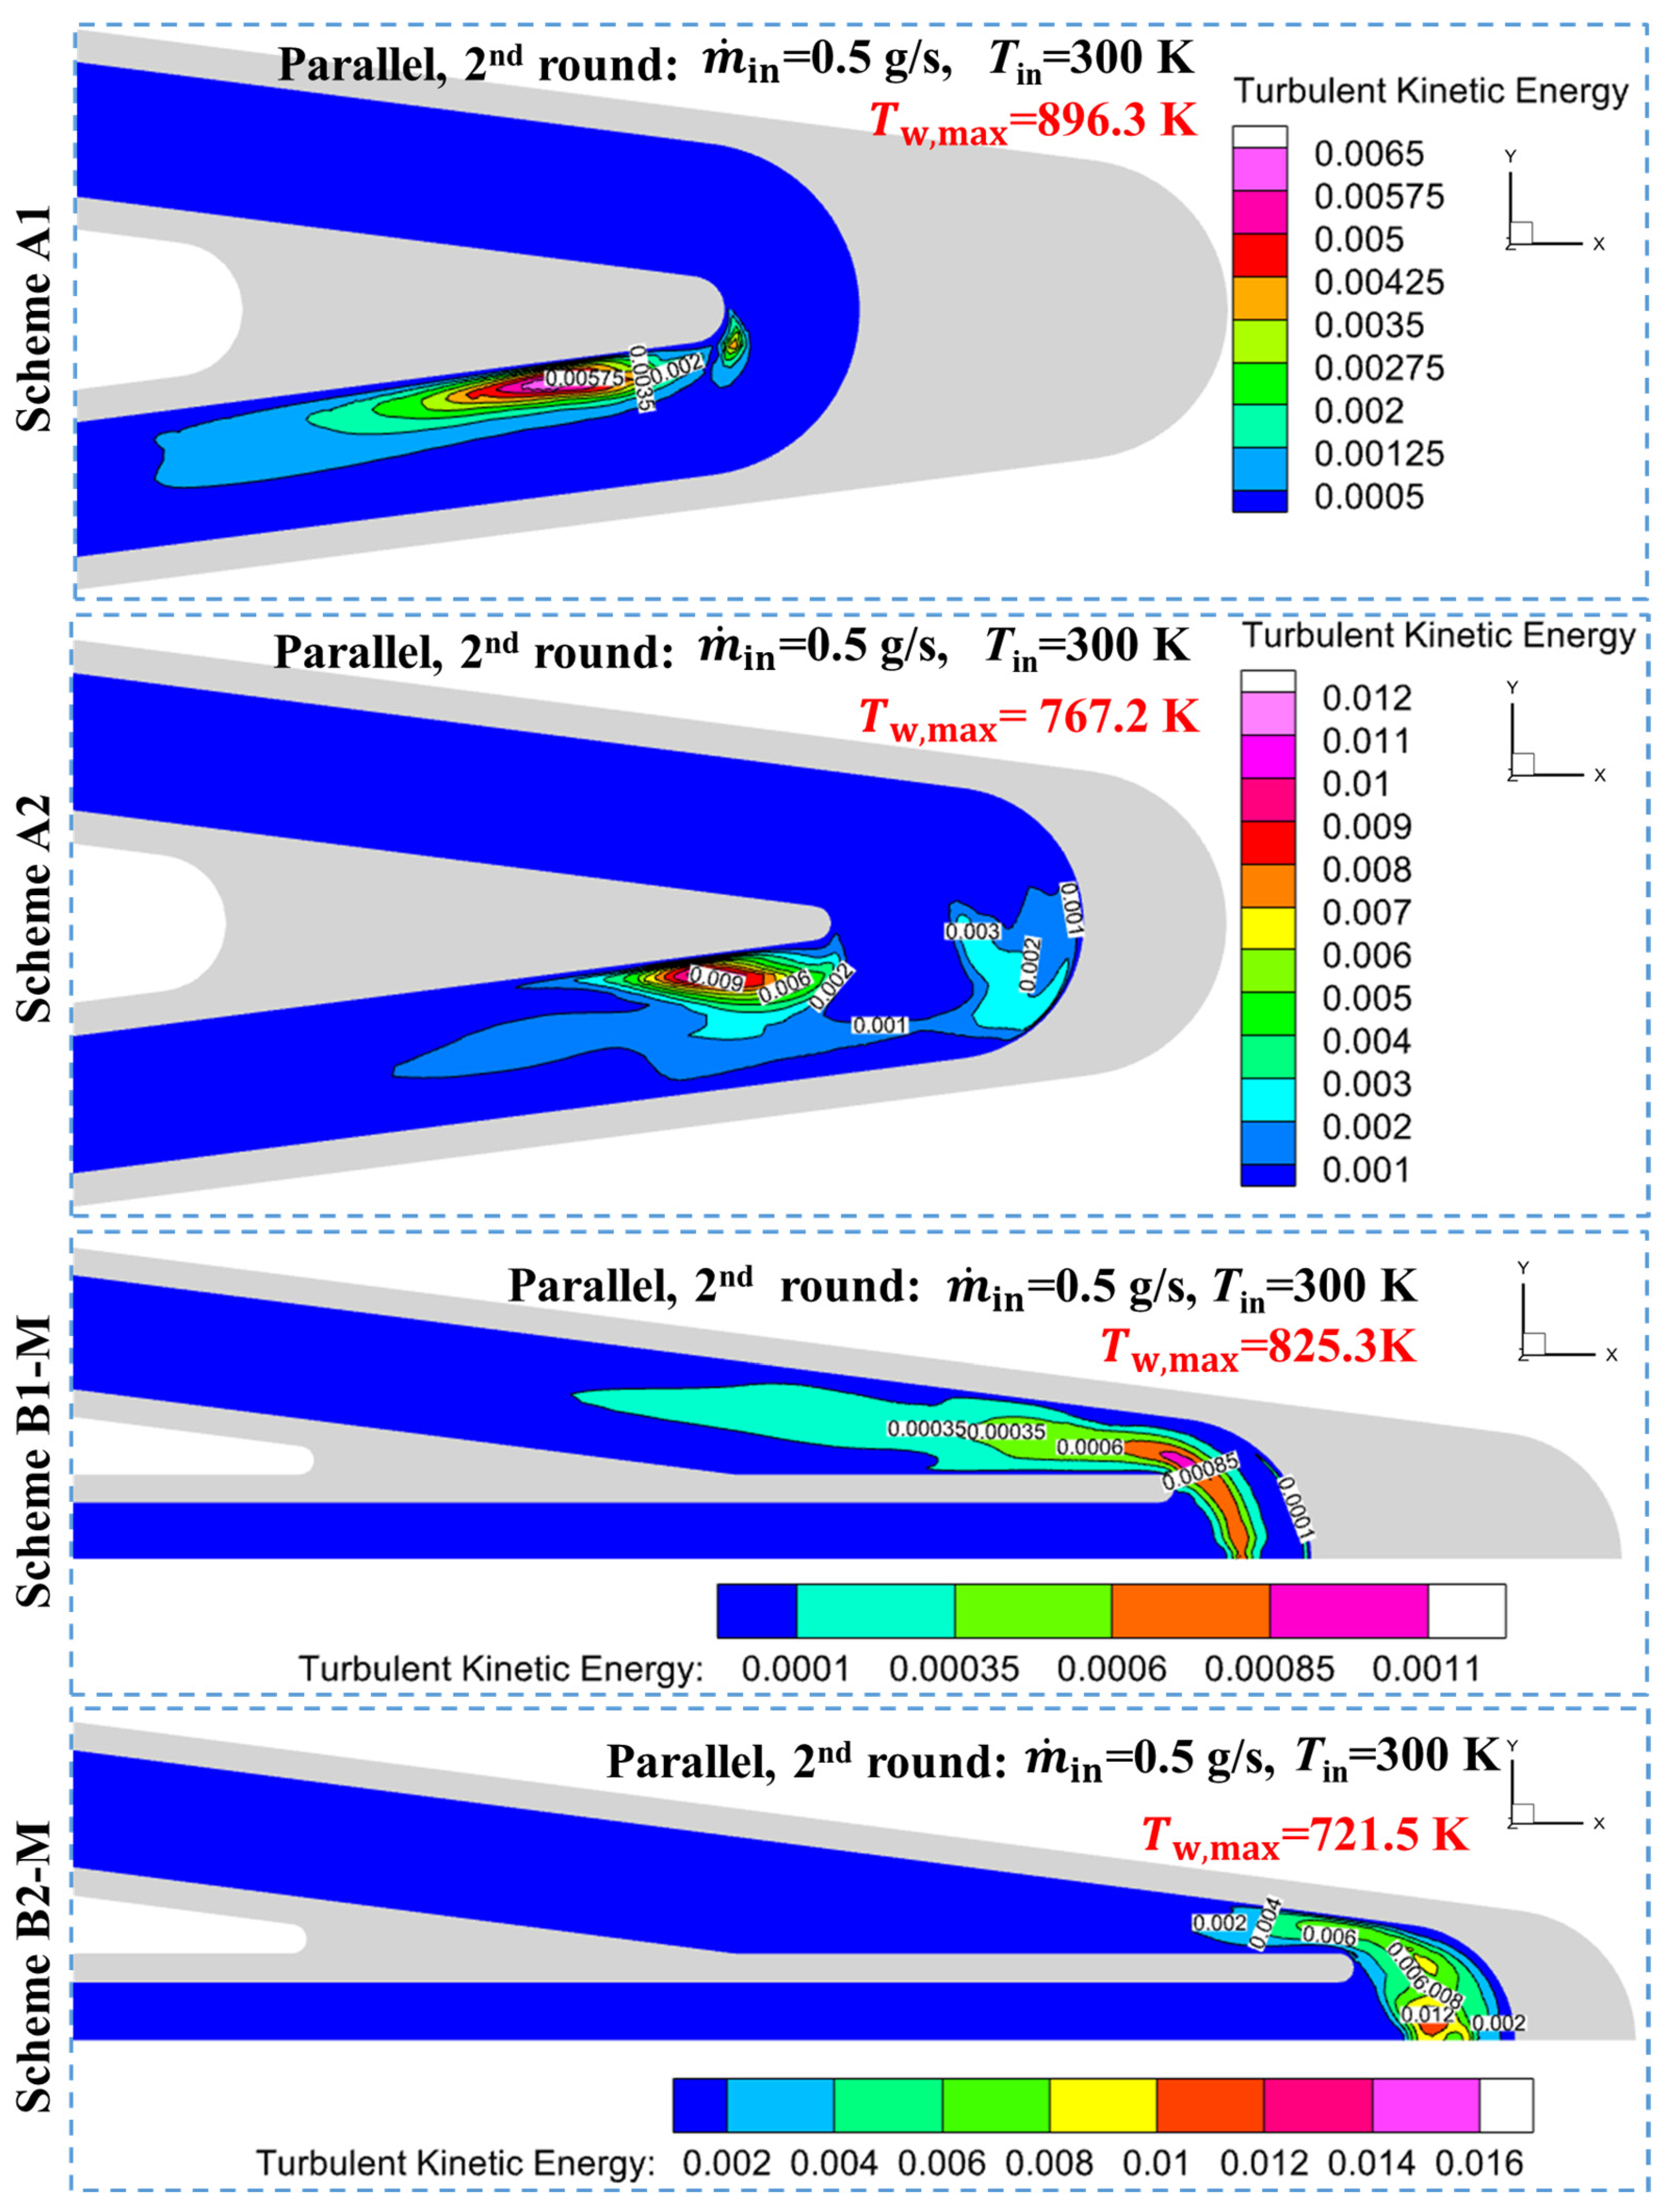
The performances of the more effective cooling channels were analyzed under the conditions of the second-round test with an inlet flow rate of 0.5 g/s and an inlet temperature of 300 K. Figure 26 illustrates the temperature distribution and streamline characteristics for channels A1, A2, B1-M, and B2-M. It is evident that A1 and B1-M predominantly exhibited laminar flow features, which aligns with the low TKE shown in Figure 27. In contrast, A2 developed extensive recirculation zones at the leading-edge segment. These recirculation zones were closely adjacent to the leading-edge wall, continuously increasing the mixing of fluid near the wall and thereby enhancing the thermal energy exchange between the coolant and the channel walls. Additionally, B1-M formed small recirculation zones near the wall, which led to increased turbulence and significantly improved the heat transfer performance.
Overall, the B1 and B2 channels, due to their larger cavity geometries, exhibit distinct thermal behavior at varying flow rates. At low flow rates, the coolant primarily experiences laminar flow, where the heat transfer is driven by natural convection. This results in a low heat transfer efficiency and limited cooling performance. As the flow rate increases, complex flow structures, such as recirculation zones and stagnation regions, develop within the cavity. Although these flow disturbances generate increased turbulence, the turbulence is concentrated away from the channel walls, particularly near the core of the cavity. Consequently, these flow structures provide minimal enhancement to the wall heat transfer, leading to a suboptimal cooling performance despite higher flow velocities. In contrast, A1 and B1-M demonstrate better performances. Although both also exhibit laminar flow at low speeds, they differ from B1 and B2 by maintaining relatively higher flow velocities near the leading-edge wall, while the flow in B1 and B2 is nearly stagnant. The superior performances of A2 and B2-M are attributed not only to convective heat transfer but also to the mixing of high-temperature and low-temperature fluids facilitated by the recirculation zones near the leading-edge wall and the turbulence generated at the bends. This enhanced fluid mixing significantly improves the thermal energy exchange and heat transfer efficiency.

3.4. Thermal–Mechanical Test

In order to evaluate the structural integrity of the channel, a thermal–mechanical-coupled analysis was subsequently conducted to investigate the distribution of the deformation and thermal stresses. Fixed boundary conditions were applied at the end faces (inlet and outlet) of all the channel configurations, disregarding aerodynamic forces but considering the operational pressure on the inner surfaces and global solid temperature field.
A preliminary thermal–mechanical analysis using the parallel arrangement was conducted under the first-round test condition, with an inlet flow rate of 1 g/s and an inlet temperature of 300 K. The results indicate that the maximum displacements of category A and category B exhibit similarity, as presented in Table 5. However, they demonstrate distinct deformation patterns, which are illustrated in Figure 28 for category A(represented by Scheme A1) and category B (represented by Scheme B1). The deformations in category A resemble bending deformations, with the maximum displacement occurring at the tip of the leading edge. Conversely, the deformations in category B resemble bulking deformations, with the maximum displacement observed at the junction of the inclined segment and horizontal segment.
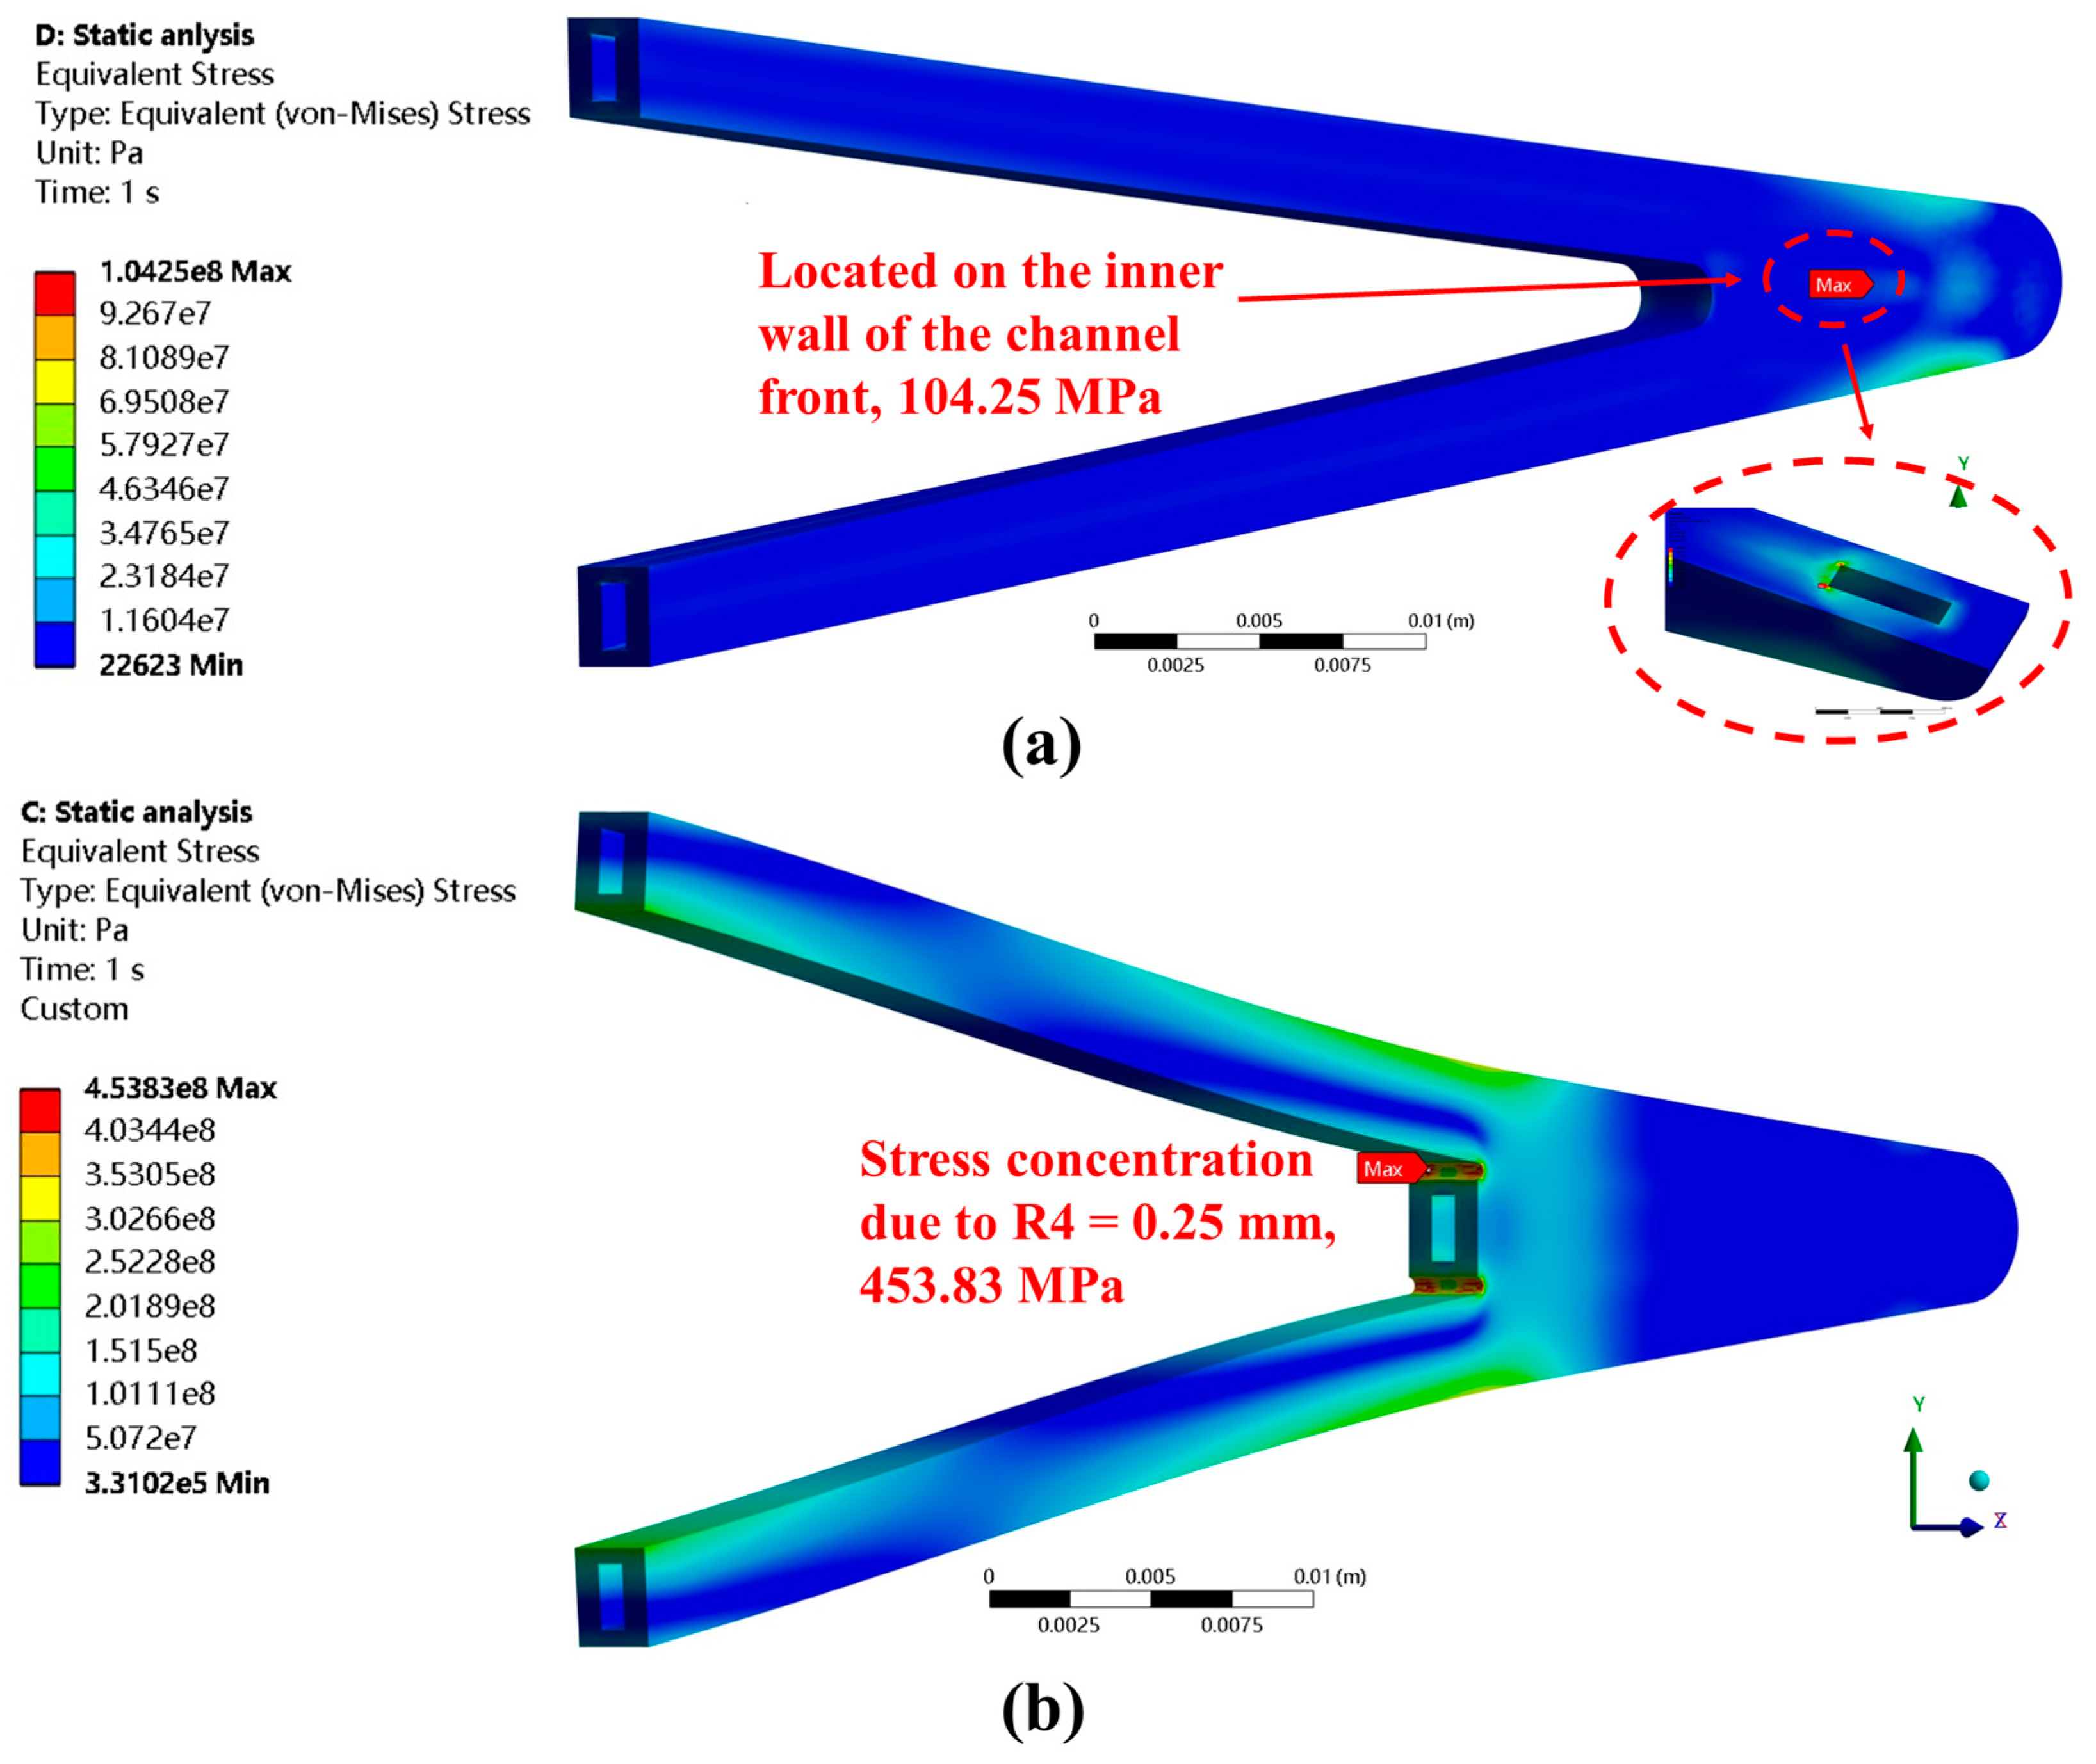
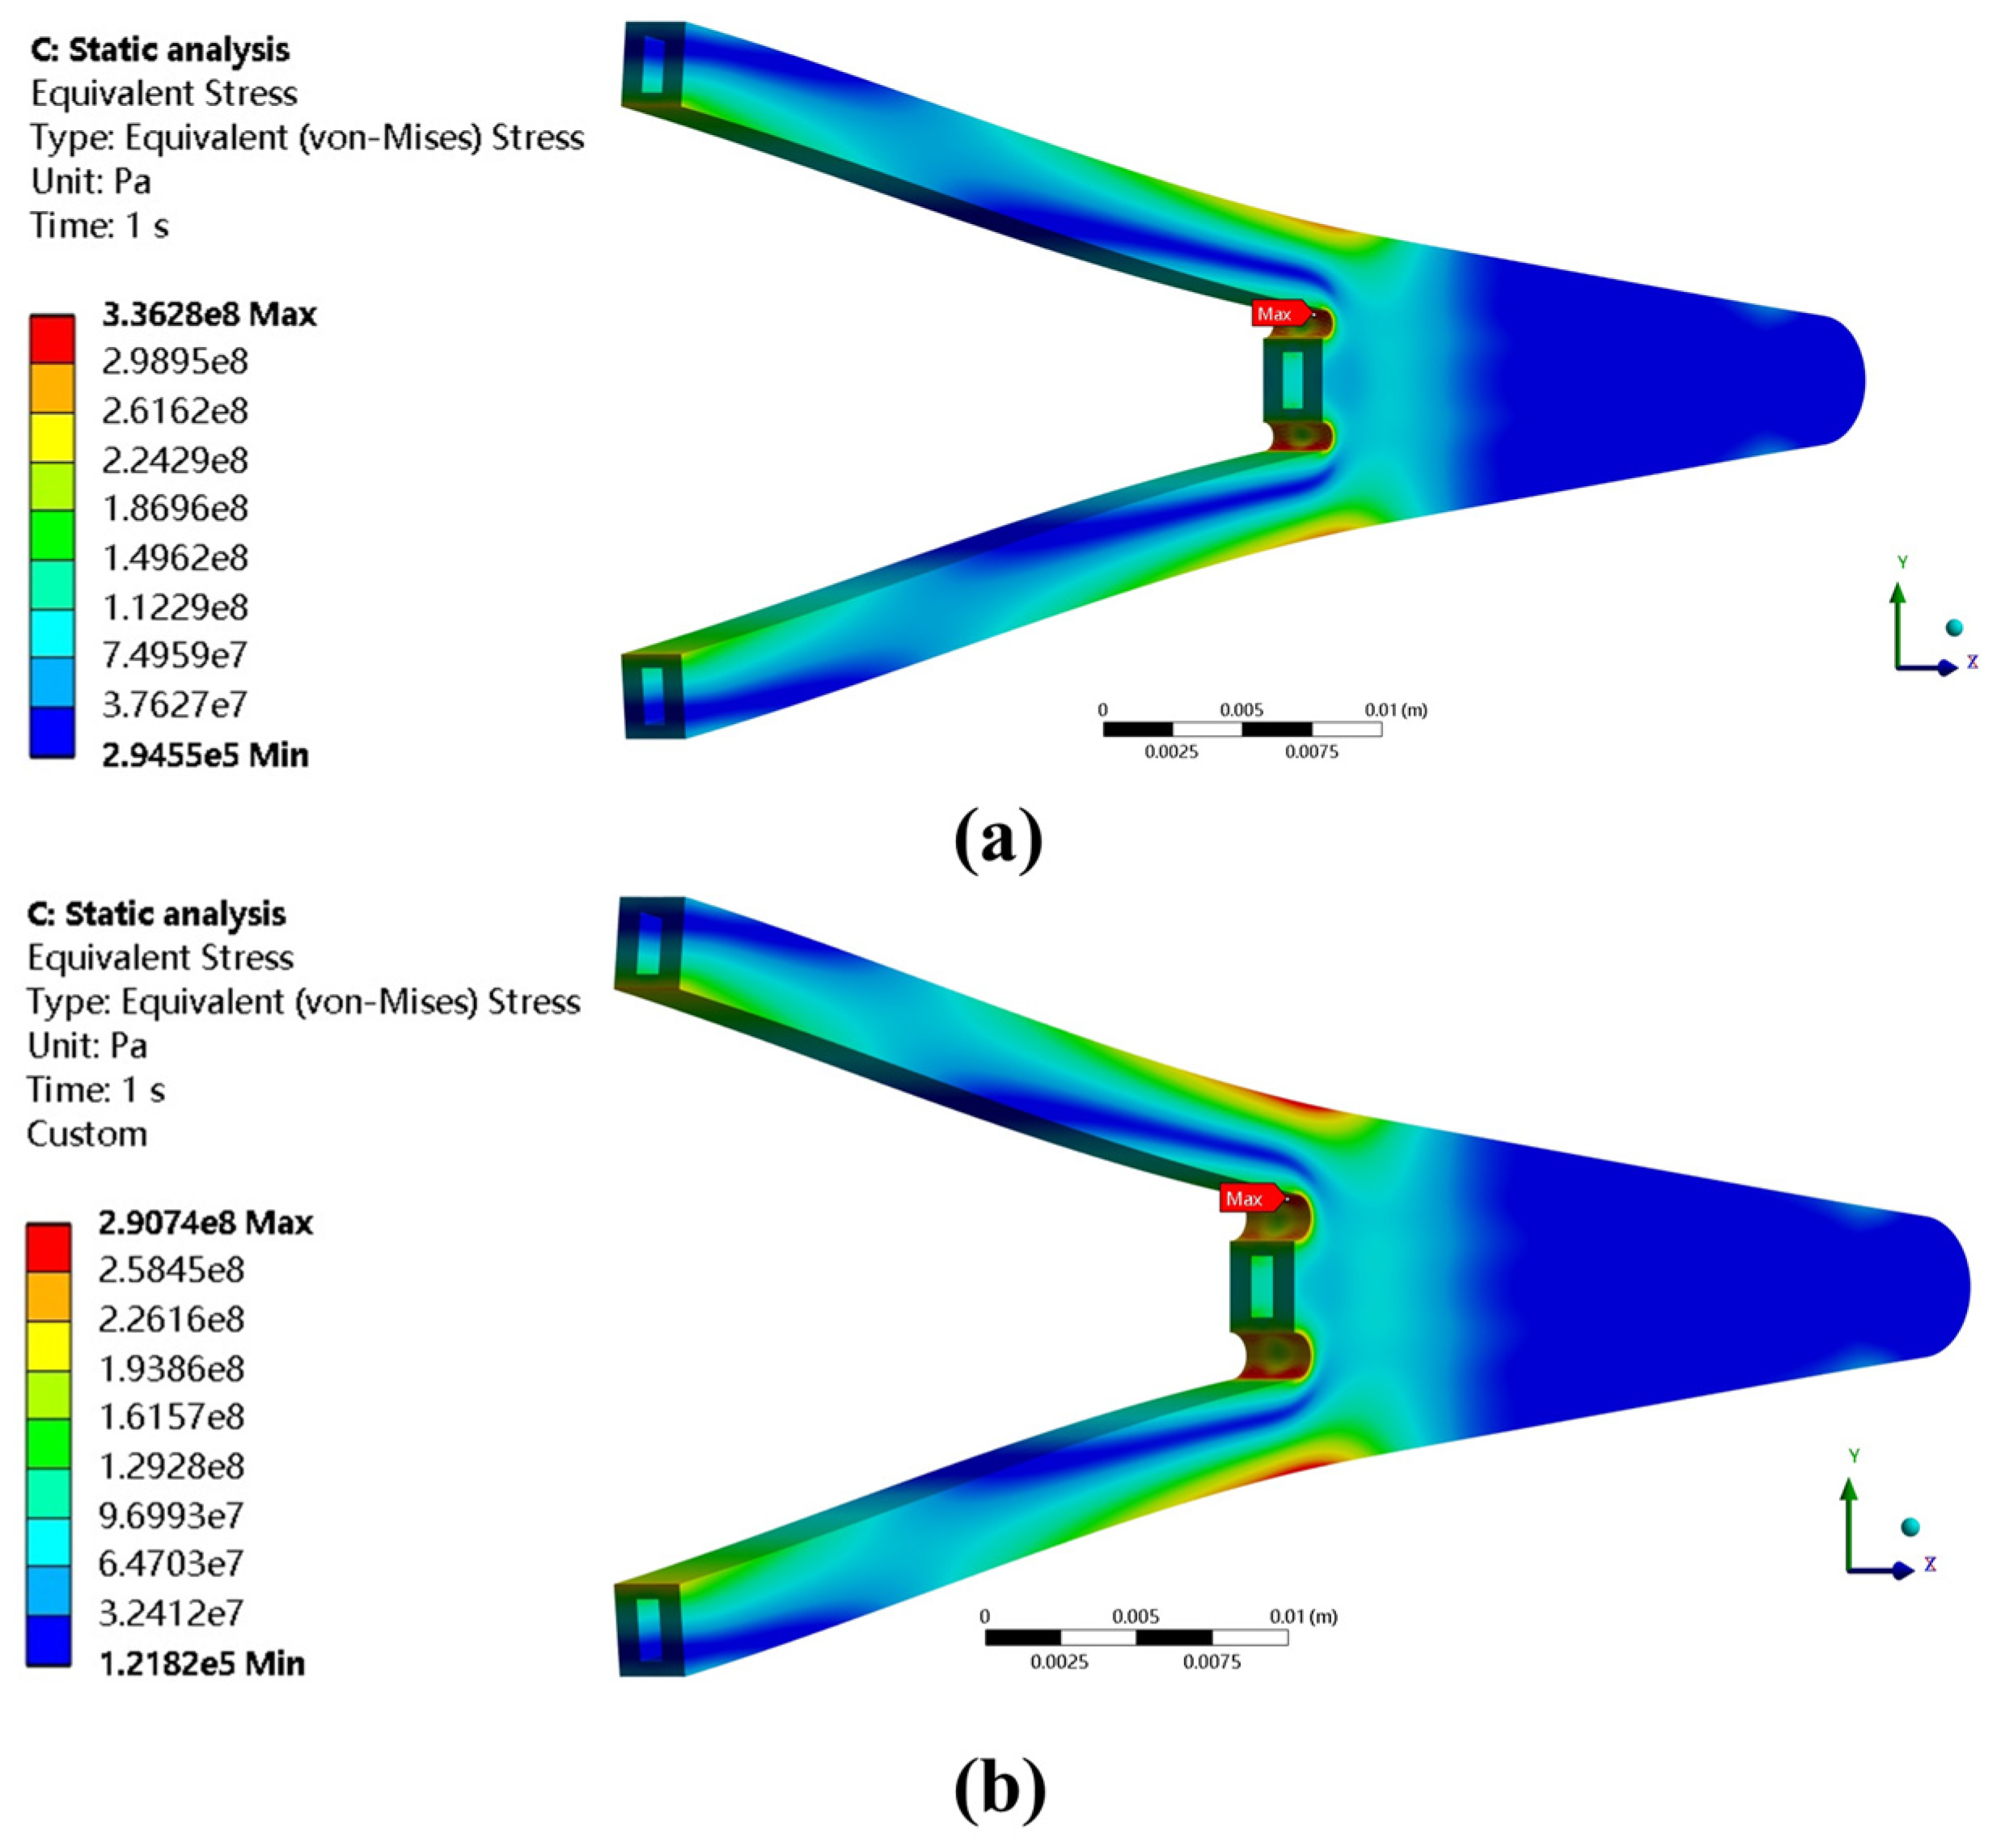
Category A and B also exhibited very different maximum von Mises stresses, as shown in Table 5. The magnitude of the stresses suggests that the operating pressure applied on the inner wall of the channel had a negligible impact on the stress results, with thermal stresses induced by temperature gradients being the primary contributing factor. Figure 29 illustrates the locations where the maximum stresses occurred in category A (represented by Scheme A2) and category B(represented by Scheme B2-M). For category A, the maximum von Mises stresses were observed at the inner wall of the channel front, reaching 98.83 MPa and 104.25 MPa for A1 and A2, respectively, which are significantly lower than the acceptable limit of 600 MPa. In the case of category B, the peak values of the Mises stresses were consistently observed at joints between the inclined channel and core channel. These excessive stresses resulted not only from thermal effects but were also due to the stress concentration caused by the geometric factors (R4 = 0.25 mm for category B, as shown in Figure 11) at these locations. The maximum stresses for category B all exceed 450 MPa, yet they remain below the threshold of 600 MPa. To address concerns about the stress concentration in the B configuration, a small test was conducted where R4 was extended to 0.5 mm and 0.75 mm. The results are shown in Figure 30. As observed, increasing R4 leads to a significant reduction in the maximum structural stress. When R4 is increased to 0.5 mm, the maximum stress decreases to 336.28 MPa. With R4 extended to 0.75 mm, the maximum stress further decreases to 290.74 MPa. The additional weight introduced by these modifications is negligible. Therefore, concerns regarding the structural integrity of the B2-M configuration can be dismissed.
The findings suggest that both Schemes A2 and B2-M exhibit superior cooling performances and maintain sufficient structural integrity.

4. Conclusions

In this study, the active cooling of all-movable rudders under severe thermal loads was investigated using supercritical n-decane as the coolant. Two cooling schemes with different flow paths and structural configurations were proposed, and six cooling channel designs were developed by altering the leading-edge details. The cooling performance was evaluated under actual flight conditions (30 km altitude, Mach 8), focusing on temperature control and reducing the coolant flow rates. Both series and parallel configurations of the cooling circuits were considered, with appropriate settings for the inlet flow rates and temperatures. A comprehensive analysis was conducted to evaluate the temperatures, flow fields, and thermal–mechanical characteristics of the different cooling channels. The following conclusions are drawn:
(1) In both the series and parallel arrangements of the two rudders, Schemes B1 and B2 exhibited inadequate cooling, with temperatures exceeding the 800 K threshold, indicating poor performances under the tested conditions. Schemes A1 and B1-M showed moderate performances but risked failure at lower flow rates. In contrast, Schemes A2 and B2-M displayed superior cooling efficiencies, maintaining temperatures well below the threshold and performing effectively under reduced flow conditions;
(2) Flow field analyses revealed that Schemes B1 and B2, due to their larger cavity geometries, exhibited primarily laminar flow and developed stagnation regions, leading to low cooling efficiencies. Schemes A1 and B1-M outperformed them due to their higher flow velocities near the leading-edge wall. The superior performances of A2 and B2-M are attributed not only to convective heat transfer but also to the mixing of high-temperature and low-temperature fluids facilitated by the recirculation zones near the leading-edge wall and the turbulence generated at the bends;
(3) Structural assessments showed that Schemes A1 and B2-M not only improved cooling but also maintained the structural integrity. Category A and category B exhibited distinct deformation patterns, which were dictated by their respective structural configurations. Notably, category B experienced significantly higher Mises stresses compared to category A, with stress peaks consistently occurring at the junction of the inclined channel and core channel, which can be mitigated by increasing the geometric radius R4.
As the aircraft performance continues to improve, the application of active cooling on the control surfaces of hypersonic vehicles will become realistic. The cooling channel design and performance evaluation methods proposed in this study offer an effective way to address the thermal protection issues of hypersonic vehicle control surfaces. Additionally, this work lays the groundwork for optimizing the overall thermal management systems of hypersonic vehicles.

Author Contributions

Conceptualization, T.W. and T.L.; methodology, T.W. and T.L.; software, T.W. and S.L.; validation, T.W. and S.L.; writing—original draft preparation, T.W.; writing—review and editing, T.W.; supervision, J.S. and T.L. All authors have read and agreed to the published version of the manuscript.

Funding

This research was funded by the National Science Foundation for Post-Doctoral Scientists of China, grant number 325042, and the High-Level Innovation Research Institute Program of Guangdong Province (No. 2020B0909010003).

Data Availability Statement

The original contributions presented in the study are included in the article, further inquiries can be directed to the corresponding author.

Acknowledgments

The authors would like to thank Chenwu Wu from the Institute of Mechanics, Chinese Academy of Sciences, for his valuable suggestions on the conceptual and methodological aspects of this paper, as well as the reviewers for their insightful comments on this study.

Conflicts of Interest

The authors declare no conflicts of interest.

References

  1. Sziroczak, D.; Smith, H. A Review of Design Issues Specific to Hypersonic Flight Vehicles. Prog. Aerosp. Sci. 2016, 84, 1–28. [Google Scholar] [CrossRef]
  2. Gaitonde, D.V. Progress in Shock Wave/boundary Layer Interactions. Prog. Aerosp. Sci. 2015, 72, 80–99. [Google Scholar] [CrossRef]
  3. Song, L.; Gao, T.; Tang, L.; Du, X.; Zhu, J.; Lin, Y.; Shi, G.; Liu, H.; Zhou, G.; Zhang, W. An All-movable Rudder Designed by Thermo-elastic Topology Optimization and Manufactured by Additive Manufacturing. Comput. Struct. 2021, 243, 106405. [Google Scholar] [CrossRef]
  4. Shi, G.; Jia, Y.; Hao, W.; Wu, W.; Li, Q.; Lin, Y.; Du, Z. Optimal Design of Rudder Structures Based on Data-driven Method. Chin. J. Theor. Appl. Mech. 2023, 55, 2577–2587. (In Chinese) [Google Scholar]
  5. Uyanna, O.; Najafi, H. Thermal Protection Systems for Space Vehicles: A Review on Technology Development, Current Challenges and Future Prospects. Acta Astronaut. 2020, 176, 341–356. [Google Scholar] [CrossRef]
  6. Le, V.T.; Ha, N.S.; Goo, N.S. Advanced Sandwich Structures for Thermal Protection Systems in Hypersonic Vehicles: A Review. Compos. Part B-Eng. 2021, 226, 109301. [Google Scholar] [CrossRef]
  7. Glass, D.E. Ceramic Matrix Composite (CMC) Thermal Protection Systems (TPS) and Hot Structures for Hypersonic Vehicles. In Proceedings of the 15th AIAA Space Planes and Hypersonic Systems and Technologies Conference, Dayton, OH, USA, 28 April–1 May 2008; p. 2682. [Google Scholar]
  8. Behrens, B.; Müller, M. Technologies for Thermal Protection Systems Applied on Re-useable Launcher. Acta Astronaut. 2004, 55, 529–536. [Google Scholar] [CrossRef]
  9. Letchworth, G. X-33 Reusable Launch Vehicle Demonstrator, Spaceport and Range. In Proceedings of the AIAA Space 2011 Conference & Exposition, Long Beach, CA, USA, 27–29 September 2011; p. 7314. [Google Scholar]
  10. Leonard, C.P.; Amundsen, R.M.; Bruce, W.E. Hyper-X Hot Structures Design and Comparison with Flight Data. In Proceedings of the AIAA/CIRA 13th International Space Planes and Hypersonics Systems and Technologies Conference, Capua, Italy, 16–20 May 2005; p. 3438. [Google Scholar]
  11. Blet, N.; Lips, S.; Sartre, V. Heats Pipes for Temperature Homogenization: A Literature Review. Appl. Therm. Eng. 2017, 118, 490–509. [Google Scholar] [CrossRef]
  12. Steeves, C.A.; He, M.Y.; Kasen, S.D.; Valdevit, L.; Wadley, H.N.G.; Evans, A.G. Feasibility of Metallic Structural Heat Pipes as Sharp Leading Edges for Hypersonic Vehicles. ASME J. Appl. Mech. 2009, 76, 031014. [Google Scholar] [CrossRef]
  13. Xiao, G.; Du, Y.; Gui, Y.; Liu, L.; Yang, X.; Wei, D. Heat Transfer Characteristics and Limitations Analysis of Heat-pipe-cooled Thermal Protection Structure. Appl. Thermal Eng. 2014, 70, 655–664. [Google Scholar]
  14. Liu, H.; Liu, W. A Numerical Model for the Platelet Heat-pipe-cooled Leading Edge of Hypersonic Vehicle. Acta Astronaut. 2016, 118, 210–217. [Google Scholar] [CrossRef]
  15. Liu, H.; Liu, W. Thermal–structural Analysis of the Platelet Heat-pipe-cooled Leading Edge of Hypersonic Vehicle. Acta Astronaut. 2016, 127, 13–19. [Google Scholar]
  16. Zhu, Y.; Peng, W.; Jiang, P.; Xu, R. Review on Active Thermal Protection and its Heat Transfer for Airbreathing Hypersonic Vehicles. Chin. J. Aeronaut. 2018, 31, 1929–1953. [Google Scholar] [CrossRef]
  17. Zhang, S.; Li, X.; Zuo, J.; Qin, J.; Cheng, K.; Feng, Y.; Bao, W. Research Progress on Active Thermal Protection for Hypersonic Vehicles. Prog. Aerosp. Sci. 2020, 119, 100646. [Google Scholar] [CrossRef]
  18. Helenbrook, R.G.; Anthony, F.M. Design of a Convective Cooling System for a Mach 6 Hypersonic Transport Airframe; NASA Technical Report; NASA-CR-1918; NASA: Washington, DC, USA, 1971. [Google Scholar]
  19. Anthony, F.M.; Dukes, W.H.; Helenbrook, R.G. Internal Convective Cooling Systems for Hypersonic Aircraft; NASA Technical Report; NASA-CR-2480; NASA: Washington, DC, USA, 1975. [Google Scholar]
  20. Youn, B.; Mills, A.F. Cooling Panel Optimization for the Active Cooling System of a Hypersonic Aircraft. AIAA J. Thermophys. Heat Tran. 1995, 9, 136–143. [Google Scholar] [CrossRef]
  21. Zhang, J.; Zhang, S.; Wang, C.; Tan, X. Recent Advances in Film Cooling Enhancement: A Review. Chin. J. Aeronaut. 2020, 33, 1119–1136. [Google Scholar] [CrossRef]
  22. Naved, I.; Hermann, T.; McGilvray, M. Numerical Simulation of Transpiration Cooling for a High-speed Vehicle with Substructure. AIAA J. 2021, 59, 3043–3053. [Google Scholar] [CrossRef]
  23. Dechaumphai, P.; Thornton, E.A.; Wieting, A.R. Flow-thermal-structural Study of Aerodynamically Heated Leading Edges. J. Spacecr. Rockets 1989, 26, 201–209. [Google Scholar] [CrossRef]
  24. Maruyama, S.; Viskanta, R.; Aihara, T. Active Thermal Protection System Against Intense Irradiation. AIAA J. Thermophys. Heat Tran. 1989, 3, 389–394. [Google Scholar] [CrossRef]
  25. Calmidi, V.V.; Mahajan, R.L. Forced Convection in High Porosity Metal Foams. ASME J. Heat Transf. 2000, 122, 557–565. [Google Scholar] [CrossRef]
  26. Rakow, J.F.; Waas, A.M. Response of Actively Cooled Metal Foam Sandwich Panels Exposed to Thermal Loading. AIAA J. 2007, 45, 329–336. [Google Scholar] [CrossRef]
  27. Liu, S.; Zhang, B. Effects of Active Cooling on the Metal Thermal Protection Systems. Aerosp. Sci. Technol. 2011, 15, 526–533. [Google Scholar] [CrossRef]
  28. Ferrari, L.; Barbato, M.; Esser, B.; Petkov, I.; Kuhn, M.; Gianella, S.; Barcena, J.; Jimenez, C.; Francesconi, D.; Liedtke, V.; et al. Sandwich Structured Ceramic Matrix Composites with Periodic Cellular Ceramic Cores: An Active Cooled Thermal Protection for Space Vehicles. Compos. Struct. 2016, 154, 61–68. [Google Scholar] [CrossRef]
  29. Xie, G.; Wang, C.; Ji, T.; Sunden, B. Investigation on Thermal and Thermomechanical Performances of Actively Cooled Corrugated Sandwich Structures. Appl. Therm. Eng. 2016, 103, 660–669. [Google Scholar] [CrossRef]
  30. Xie, J.; Zhang, R.; Xie, G.; Manca, O. Thermal and Thermomechanical Performance of Actively Cooled Pyramidal Sandwich Panels. Int. J. Therm. Sci. 2019, 139, 118–128. [Google Scholar] [CrossRef]
  31. Qiao, Y.; Liu, P.; Liu, W.; Liu, Z. Analysis and Optimization of Flow and Heat Transfer Performance of Active Thermal Protection Channel for Hypersonic Aircraft. Case Stud. Therm. Eng. 2022, 39, 102476. [Google Scholar] [CrossRef]
  32. Qiao, Y.; Liu, W.; Liu, Z. Design and Optimization Study of Discrete Inclined Ribs Enhanced Bend Tube Based on “Diamond” Active Cooling Thermal Protection Systems of Hypersonic Aircraft. Appl. Therm. Eng. 2023, 228, 120526. [Google Scholar] [CrossRef]
  33. Hu, G.; Zhong, F.; Chen, K. An Analytical Model for Maximum Temperature and Temperature Distribution of Plate Structure with Active Cooling. Acta Mech. Sin. 2023, 39, 322290. [Google Scholar] [CrossRef]
  34. Gou, J.; Chang, Y.; Yan, Z.; Chen, B.; Gong, C. The Design of Thermal Management System for Hypersonic Launch Vehicles Based on Active Cooling Networks. Appl. Therm. Eng. 2019, 159, 113938. [Google Scholar] [CrossRef]
  35. Gou, J.; Yan, Z.; Hu, J.; Gao, G.; Gong, C. The Heat Dissipation, Transport and Reuse Management for Hypersonic Vehicles Based on Regenerative Cooling and Thermoelectric Conversion. Aerosp. Sci. Technol. 2021, 108, 106373. [Google Scholar] [CrossRef]
  36. Chen, W.; Men, Z.; Liu, S. Fast Parameterized Fractal Modeling of Active Heat Transfer Channel. Appl. Therm. Eng. 2022, 209, 118297. [Google Scholar] [CrossRef]
  37. Lees, L. Laminar Heat Transfer over Blunt-nosed Bodies at Hypersonic Flight Speeds. Jet Propuls. 1956, 26, 259–269. [Google Scholar] [CrossRef]
  38. Rubesin, M.W.; Johnson, H.A. A Critical Review of Skin-friction and Heat Transfer Solutions of the Laminar Boundary Layer of a Flat Plate. ASME Trans. 1949, 71, 383–388. [Google Scholar] [CrossRef]
  39. Li, Y.; Xie, G.; Sunden, B. Flow and Thermal Performance of Supercritical n-decane in Double-layer Channels for Regenerative Cooling of a Scramjet Combustor. Appl. Therm. Eng. 2020, 180, 115695. [Google Scholar] [CrossRef]
  40. Tao, Z.; Cheng, Z.; Zhu, J.; Li, H. Effect of Turbulence Models on Predicting Convective Heat Transfer to Hydrocarbon Fuel at Supercritical Pressure. Chin. J. Aeronaut. 2016, 29, 1247–1261. [Google Scholar] [CrossRef]
  41. Liu, B.; Zhu, Y.; Yan, J.; Lei, Y.; Zhang, B.; Jiang, P. Experimental Investigation of Convection Heat Transfer of n-decane at Supercritical Pressures in Small Vertical Tubes. Int. J. Heat Mass Tran. 2015, 91, 734–746. [Google Scholar] [CrossRef]
  42. Fu, Y.; Wen, J.; Tao, Z.; Xu, G.; Huang, H. Experimental Research on Convective Heat Transfer of Supercritical Hydrocarbon Fuel Flowing Through U-turn Tubes. Appl. Therm. Eng. 2017, 116, 43–55. [Google Scholar] [CrossRef]
  43. Xu, K.; Ruan, B.; Meng, H. Validation and Analyses of RANS CFD Models for Turbulent Heat Transfer of Hydrocarbon Fuels at Supercritical Pressures. Int. J. Therm. Sci. 2018, 124, 212–226. [Google Scholar] [CrossRef]
  44. Zhong, F.; Fan, X.; Yu, G.; Li, J. Heat Transfer of Aviation Kerosene at Supercritical Conditions. AIAA J. Thermophys. Heat Tran. 2009, 23, 543–550. [Google Scholar] [CrossRef]
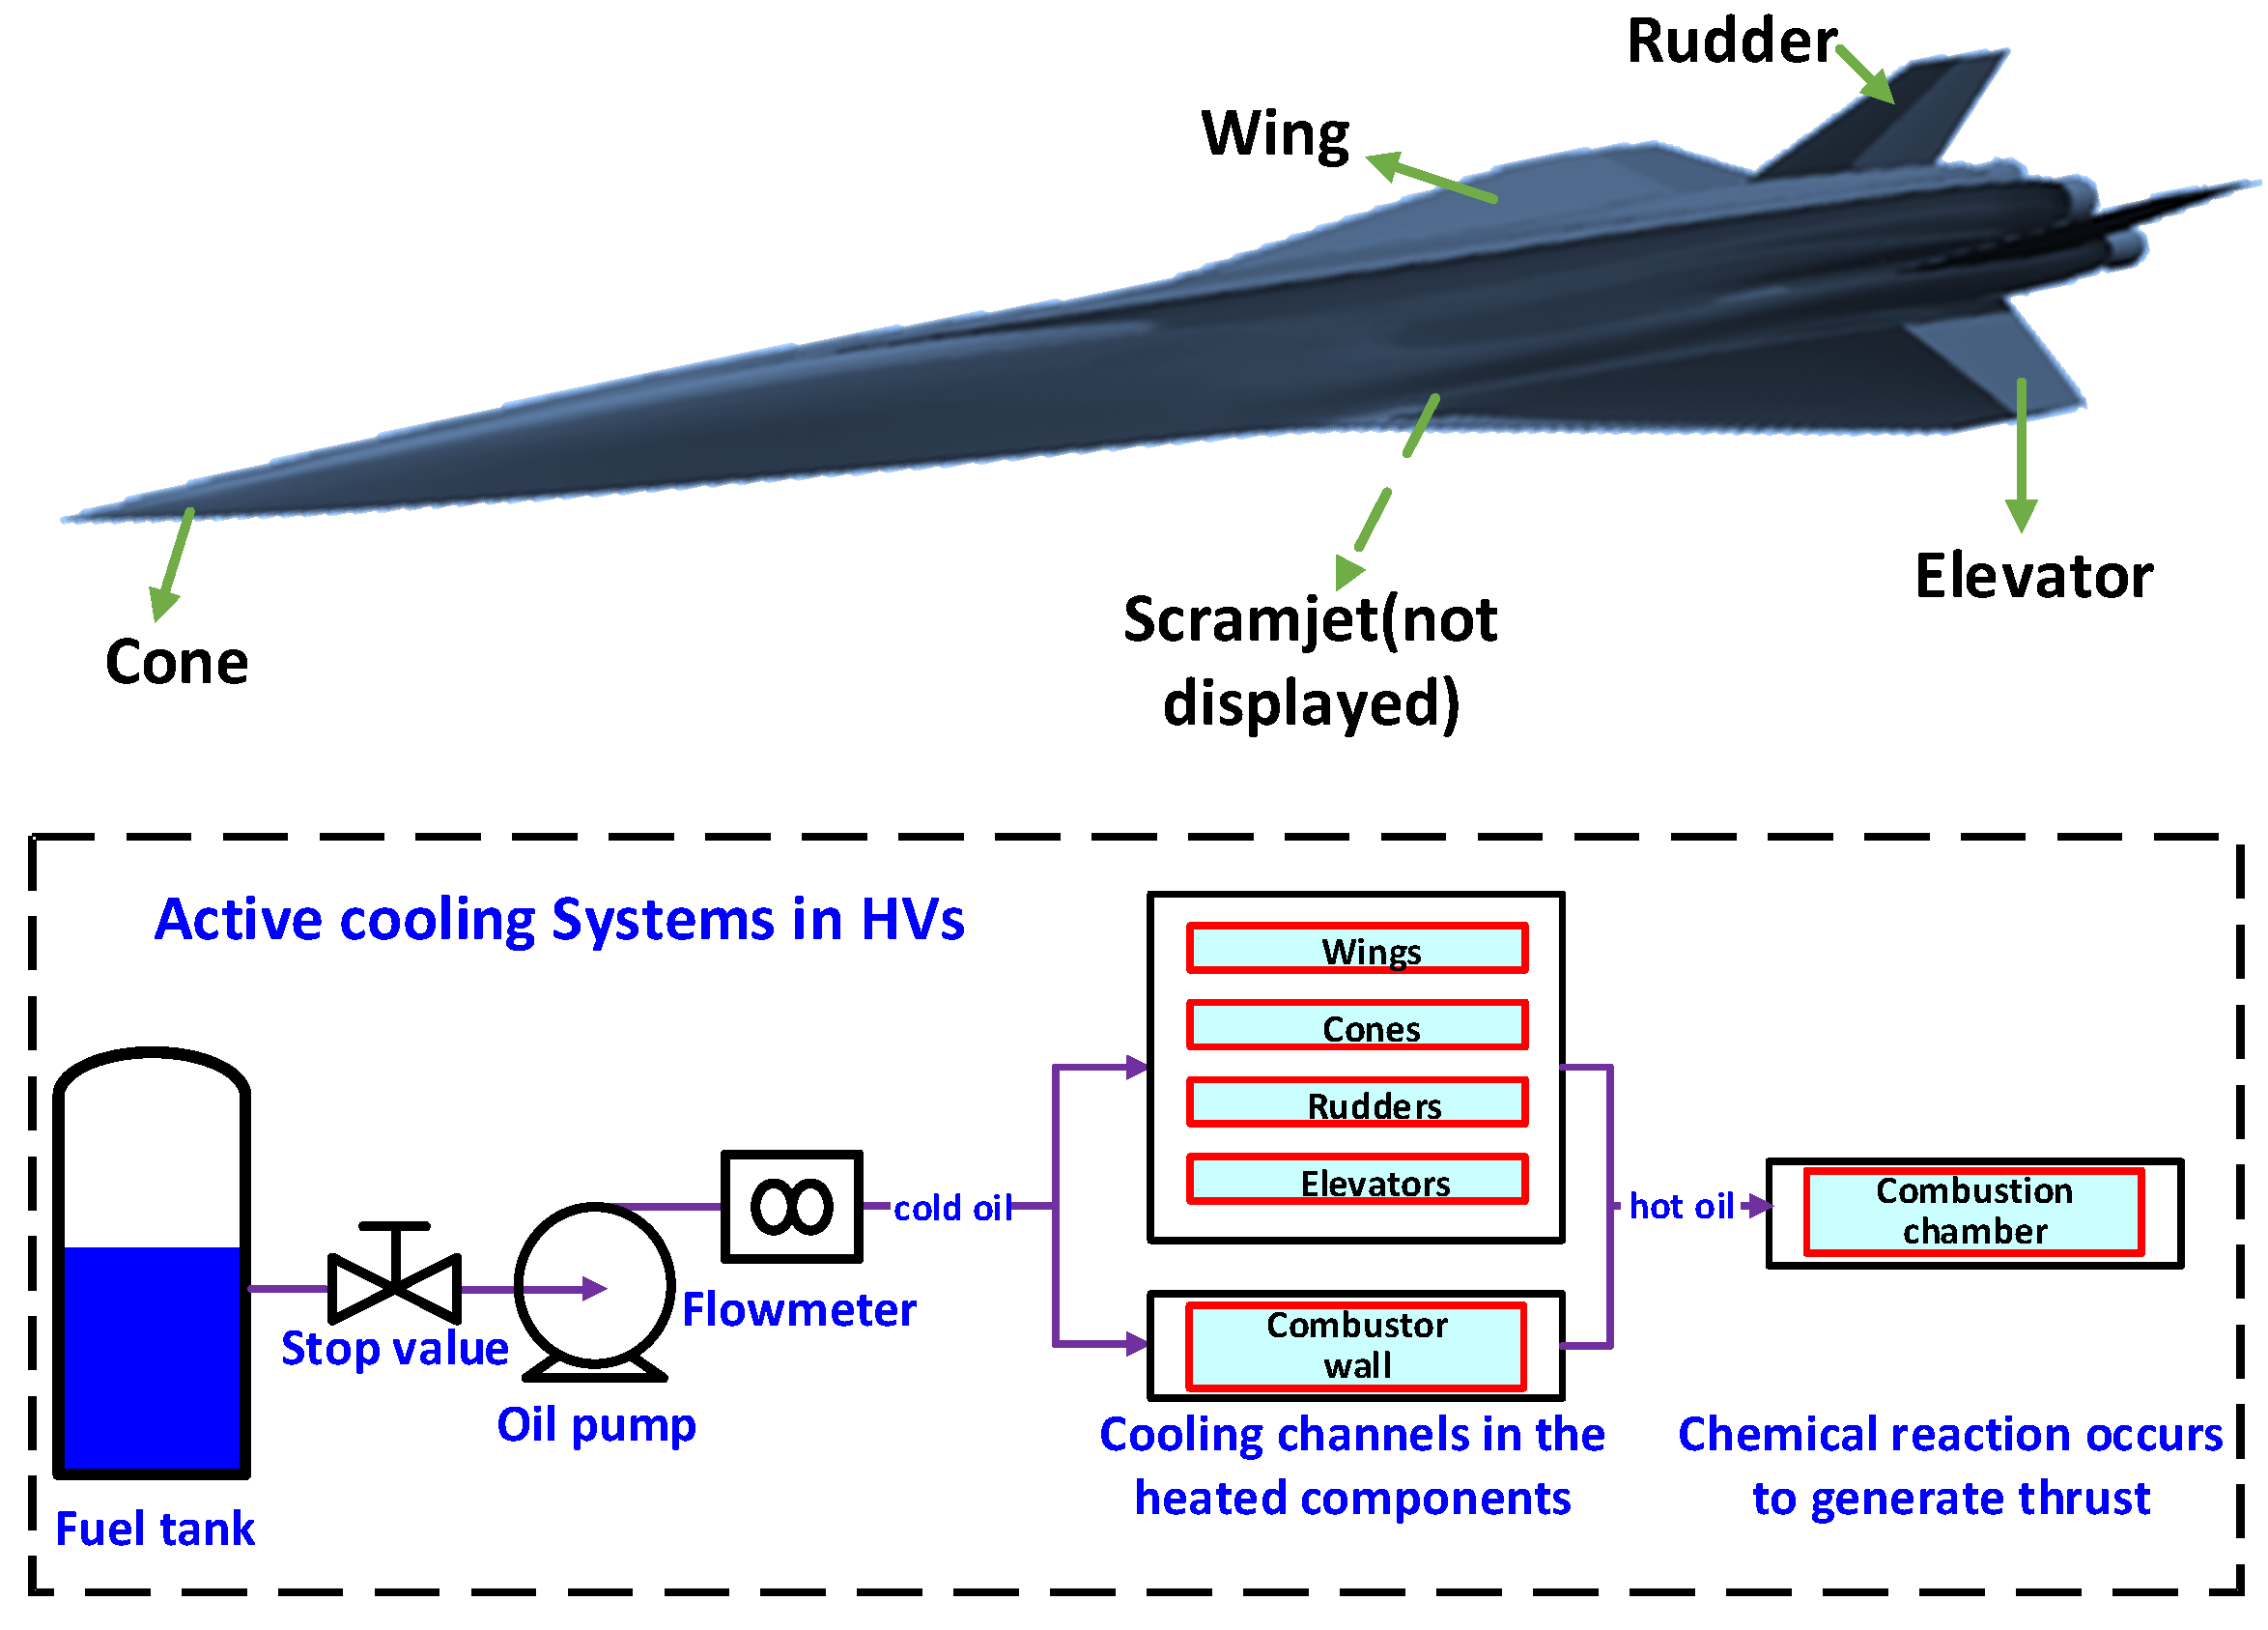
Figure 1. An active cooling system concept in hypersonic vehicles.
Applsci 14 08434 g001
Figure 2. Arrangements of coolant supply pipelines for two all-movable rudders: (a) Series arrangement; (b) Parallel arrangement.
Applsci 14 08434 g002
Figure 3. Geometry model and dimensions. (a) Geometry and cross-section dimensions (mm); (b) Dimensions of the mid-section at 150 mm (axial) from the rudder root (mm); (c) All-movable rudder; (d) Simplified rudder.
Applsci 14 08434 g003
Figure 4. The structural layout of actively cooled Scheme A1.
Applsci 14 08434 g004
Figure 5. The structural layout of actively cooled Scheme B1.
Applsci 14 08434 g005
Figure 6. The representative cell of the cooling channel in Scheme A1.
Applsci 14 08434 g006
Figure 7. The representative cell of the cooling channel in Scheme B1.
Applsci 14 08434 g007
Figure 8. The BCs of the representative units of the cooling channel in Schemes A1 and B1.
Applsci 14 08434 g008
Figure 9. The heat flux imposed on the outside wall of the leading-edge segment, inclined segment, and horizontal segment. (a) 2D schematic for heat flux computation; (b) Heat flux calculated by empirical formulae and homogenization (channel interior details using Scheme A1 as an example).
Applsci 14 08434 g009
Figure 10. The temperature-dependent variation in n-decane under 3 MPa. (a) Density; (b) Thermal conductivity; (c) Isobaric specific heat capacity; (d) Dynamic viscosity.
Applsci 14 08434 g010
Figure 11. Leading-edge details in six different actively cooled configurations (mm).
Applsci 14 08434 g011
Figure 12. Cases studies for competitive selection of the optimal channel scheme.
Applsci 14 08434 g012
Figure 13. Mesh distribution for the medium mesh at the leading edge of Scheme A1. (a) Local mesh size of 0.075 mm; (b) Mesh details near the fluid–solid-coupled boundary.
Applsci 14 08434 g013
Figure 14. Comparison of calculated wall temperatures with experimental data [41] for Cases 1–4 of a vertical circular pipe (simulation results of Xu can be found in Ref. [43]).
Applsci 14 08434 g014
Figure 15. Comparison of calculated wall temperatures with experimental data [41] for Cases 5–8 of a vertical circular pipe (simulation results of Xu can be found in Ref. [43]).
Applsci 14 08434 g015
Figure 16. Contrast between calculated wall temperatures and experimental data [42] for a U-turn tube.
Applsci 14 08434 g016
Figure 17. The outer-wall temperature distributions for the cooling channels A1, A2, B1-M, and B2-M during the first-round tests in the series arrangement.
Applsci 14 08434 g017
Figure 18. The outer-wall temperature distributions for the cooling channels A1, A2, B1-M, and B2-M during the second-round tests in the series arrangement.
Applsci 14 08434 g018
Figure 19. The outer-wall temperature distributions for the cooling channels A1, A2, B1-M, and B2-M during the first-round tests in the parallel arrangement.
Applsci 14 08434 g019
Figure 20. The outer-wall temperature distributions for the cooling channels A1, A2, B1-M, and B2-M during the second-round tests in the parallel arrangement.
Applsci 14 08434 g020
Figure 21. Overall performances of six cooling channels in the tests conducted for both series and parallel arrangements.
Applsci 14 08434 g021
Figure 22. The wall temperature distribution and streamline patterns on the streamwise–spanwise plane (x-y plane) for Scheme B1 (the red dashed box represents the recirculation zone).
Applsci 14 08434 g022
Figure 23. TKE distribution on streamwise–spanwise plane (x-y plane) for Scheme B1.
Applsci 14 08434 g023
Figure 24. The wall temperature distribution and streamline patterns on the streamwise–spanwise plane (x-y plane) for Scheme B2 (the red dashed box represents the recirculation zone).
Applsci 14 08434 g024
Figure 25. TKE distribution on streamwise–spanwise plane (x-y plane) for Scheme B2.
Applsci 14 08434 g025
Figure 26. Wall temperature distribution and streamline characteristic on streamwise–spanwise plane (x-y plane) of Schemes A1, A2, B1-M, and B2-M (the red dashed box represents the recirculation zone).
Applsci 14 08434 g026
Figure 27. TKE distribution on streamwise–spanwise plane (x-y plane) for Schemes A1, A2, B1-M, and B2-M.
Applsci 14 08434 g027
Figure 28. The contours of deformation obtained from the thermal-mechanical analysis. (a) Scheme A1; (b) Scheme B1. (Note that “E” in the legend represents “exponent” in scientific notation, indicating the power of 10 which a number is multiplied).
Applsci 14 08434 g028
Figure 29. The contours of von Mises stress for inclined and leading-edge segments. (a) Scheme A2; (b) Scheme B2-M. (Here the core channel is truncated to better show the position of maximum stress).
Applsci 14 08434 g029
Figure 30. The reduction in the stress concentration resulting from increasing R4. (a) R4 = 0.5 mm; (b) R4 = 0.75 mm.
Applsci 14 08434 g030
Table 1. Properties of the nickel-based, high-temperature alloy.
Thermal PropertiesThermal Conductivity
(W/m·K)
Specific Heat
(J/kg·K)
Expansion Coefficient
(1/K)
Value91.74460.61.2 × 10−5
Mechanical PropertiesDensity
(kg/m3)
Young’s Modulus
(Gpa)
Poisson’s Ratio
Value89001900.31
Table 2. Cases for analysis.
Test TypeBranch ConfigurationTest RoundBranch Total Flow RateSingle-Channel BC ConditionsCandidate Schemes
Temperature testSeries arrangementFirst200 g/s m ˙ i n = 2   g / s ,
T i n = 400   K
Schemes A1, A2, B1, B1-M, B2, B2-M
Second100 g/s m ˙ i n = 1   g / s ,
T i n = 400   K
Schemes that met T w , m a x < 800   K in the first test round
Parallel arrangementFirst200 g/s m ˙ i n = 1   g / s ,
T i n = 300   K
Schemes A1, A2, B1, B1-M, B2, B2-M
Second100 g/s m ˙ i n = 0.5   g / s ,
T i n = 300   K
Schemes that met T w , m a x < 800   K in the first test round
Thermal–mechanical test--- Temperature field, fixed BC, channel pressureOptimal schemes
Table 3. Mesh sensitivity tests of the flow and heat transfer of Scheme A1.
Mesh ResolutionNumber T w , l e , K ε , % Δ P , kPa ε , %
Coarse3.26 million799.431.002.606.47
Medium5.33 million792.920.182.770.36
Fine11.18 million791.51-2.78-
Table 4. Operating conditions of Cases 1 to 8 in the first validation example.
Cases T i n (K) p i n (MPa) u i n (m/s)Rein q w (kW/m2)
1 423.1531.1474270072
2 114
3 163
4 294
5423.1531.74000154
6 240
7 319
8 393
Table 5. The maximum displacements and von Mises stresses of the various cooling schemes.
SchemeA1A2B1B1-MB2B2-M
D m a x , mm0.4490.4200.4150.4160.4140.410
σ m a x , MPa98.83104.25463.04467.65463.21453.83
Disclaimer/Publisher’s Note: The statements, opinions and data contained in all publications are solely those of the individual author(s) and contributor(s) and not of MDPI and/or the editor(s). MDPI and/or the editor(s) disclaim responsibility for any injury to people or property resulting from any ideas, methods, instructions or products referred to in the content.