Article

A Circle Center Location Algorithm Based on Sample Density and Adaptive Thresholding

1
School of Economics, Wuhan Textile University, Wuhan 430200, China
2
School of Electronic and Electrical Engineering, Wuhan Textile University, Wuhan 430200, China
*
Author to whom correspondence should be addressed.
Appl. Sci. 2024, 14(18), 8453; https://doi.org/10.3390/app14188453
Submission received: 15 August 2024 / Revised: 12 September 2024 / Accepted: 16 September 2024 / Published: 19 September 2024

Abstract

:
How to acquire the exact center of a circular sample is an essential task in object recognition. Present algorithms suffer from the high time consumption and low precision. To tackle these issues, we propose a novel circle center location algorithm based on sample density and adaptive thresholding. After obtaining circular contours through image pre-processing, these contours were segmented using a grid method to obtain the required coordinates. Based on the principle of three points forming a circle, a data set containing a large number of samples with circle center coordinates was constructed. It was highly probable that these circle center samples would fall within the near neighborhood of the actual circle center coordinates. Subsequently, an adaptive bandwidth fast Gaussian kernel was introduced to address the issue of sample point weighting. The mean shift clustering algorithm was employed to compute the optimal solution for the density of candidate circle center sample data. The final optimal center location was obtained by an iteration algorithm. Experimental results demonstrate that in the presence of interference, the average positioning error of this circle center localization algorithm is 0.051 pixels. Its localization accuracy is 64.1 % higher than the Hough transform and 86.4 % higher than the circle fitting algorithm.

1. Introduction

The localization of circle centers has extensive applications in various fields. It is widely used for precise optical system targeting of circular objects, non-contact measurements of industrial circular components, quality assessment of industrial parts, and high-precision measurement methods for roundness errors, which have become hot topics in the field of industrial metrology [1,2,3,4]. This paper presents a novel circle detection method based on the adaptive artificial fish swarm algorithm by determining the circle center and the radius of circular parts. A new fitness function was developed to evaluate the similarity of a candidate circle with a real circle. Based on the fitness values, a batch of encoded candidate circles was modified through the algorithm in order for them to match with the actual circles on the edge map [2]. In the process of automatic laser cladding of the water wall, a method for obtaining the center of the pipe was proposed to guarantee high fitting accuracy under the condition of small arc [3]. A highly efficient circle positioning algorithm called the two-step optimization Hough transform was proposed. Using the image feature of the printed circuit board circular identifier, the target circle was obtained using adaptive image pre-processing. It was successfully applied to a vision positioning system of a solder paste printing machine [4]. Circle center location is one essential process of systems, like the accurate positioning of circular markers’ centers in photogrammetry or automatic camera calibration based on real image coordinates, as it directly determines the accuracy of measurement results [5]. Reference [6] proposes a method to calculate projection point of circle center using concentric circles. The method can be used to obtain the projection point of a circle center accurately and stably, and it does not have intrinsic projection errors. In the optical measurement field, circular artificial markers are the most widely used. The localization of circular markers is of primary importance in the measurement process. The high-precision circle center location of a wafer can implement the automatic acquisition of the special die, which is one of the most significant steps in wafer surface defect detection. Reference [7] proposed a novel circle center location method for the large-scale wafer. Furthermore, in terms of improving industrial automation levels and ensuring production safety, the identification and precise localization of circular targets also play significant roles [8,9].
In laser scanning for large-scale 3D surface measurements, the height of a specific point on the target surface, corresponding to the objective spot, is determined by the position of the imaged spot on the CCD surface. The accurate determination of the laser spot position is a key factor in determining the measurement resolution [10]. In laser communication systems, a spot positioning method based on a four-quadrant detector has a higher positioning accuracy in the stable communication area of the system [11].
Reference [12] harnesses machine learning capabilities for precise circle detection, enhancing spatial awareness and facilitating UAV navigation in environments where circular features hold paramount significance. It can address the intricate challenges associated with optimized path scheduling and precise circle detection within unmanned aerial vehicles. In detecting defects of the color contact lenses, one significant defect is the “center deviation defect”, where the colored area deviates from the center point. Reference [13] proposes a method that utilizes image processing and analysis techniques for detecting such defects. The approach involves employing semantic segmentation to simplify the image and reduce noise interference, utilizing the Hough circle transform algorithm to measure the deviation of the center point of the colored area in color contact lenses. A method for detecting particles in intracellular images and estimating their radii by using the circle fitting algorithm is proposed. The edge points of a detected particle are distinguished by the intensity difference between the particle and the background. The edge points are extracted and fitted by a circle by a voting technique [14]. The multiple circle detection problem was considered on the basis of given data point set. The incremental algorithm for searching for an approximate globally optimal k-partition was proposed. The algorithm locates either a globally optimal k-partition or a locally optimal k-partition close to the global one [15].
Currently, there are three commonly used algorithms for circle center localization: template matching, Hough transform, and circle fitting.
(1) Template matching: The template matching algorithm requires selecting a region of interest containing circular features as a template. A sliding window is then used to traverse the entire image. During each sliding process, the similarity between the current window and the circular feature template image is calculated. Once the traversal is complete, the position of the corresponding circle image with the highest similarity is determined, completing the localization. This algorithm requires traversing the entire image, resulting in a large computational cost and time consumption. Additionally, the creation of the template has certain requirements, which is considered as a pre-condition, and may not be feasible in some cases.
(2) Hough transform: The basic idea of the standard Hough transform algorithm is to transfer the image space into parameter space through a spatial domain transformation. Then, using a parameter form that satisfies most of the boundary points to vote in the parameter space, the information required is determined by the local maximum in the accumulator space. In most cases, the circular parameter space is three-dimensional, and the accumulation of parameters in three-dimensional space incurs significant spatial and temporal costs [1]. Therefore, this method has not been widely applied in practice.
Despite its advantages of high accuracy and strong anti-interference capabilities, the three-dimensional parameter space required for this method results in significant time consumption and space complexity, making it unsuitable for practical applications. To speed up the circle detection using the Hough transform, scholars have proposed various improved Hough transform methods for circle detection. However, these improved methods often sacrifice detection accuracy and anti-interference capabilities.
(3) Circle fitting: Most circle fitting algorithms utilize the least squares polynomial curve fitting method. They minimize the sum of squared distances between the data points and the fitted circle, solving an optimization problem that minimizes an objective function to obtain the best parameters for the fitted circle. However, since polynomial fitting is linear, it is prone to underfit when the feature space is large. Therefore, for nonlinear features such as irregular edges, gradient descent is needed for optimization, which can significantly affect accuracy. This algorithm requires fitting a regular circular contour before matching the circle center for localization. These two operations may amplify the error in circle center coordinates.
In this paper, we propose a new circle center localization algorithm based on sample density and adaptive thresholding. After initial image pre-processing steps, such as denoising, threshold segmentation, and mathematical morphology, the region where the circle is located is identified. Within this region, the algorithm extracts the contour of the circle, obtaining the pixels on the circle contour. To reduce the computational complexity of the Hough transform and improve the accuracy of curve fitting, we introduce the Center Localization Based on Sample Density and Adaptive Threshold (CLSDAT) algorithm based on the concept of sample density and adaptive thresholding. It employs the mean shift clustering algorithm to determine the optimal solution for the density of candidate circle center samples. By using a fast Gaussian kernel with an adaptive bandwidth, the algorithm addresses the issue of sample point weighting.

2. Theoretical Design of CLSDAT

The proposed CLSDAT algorithm mainly contains three steps as follows.

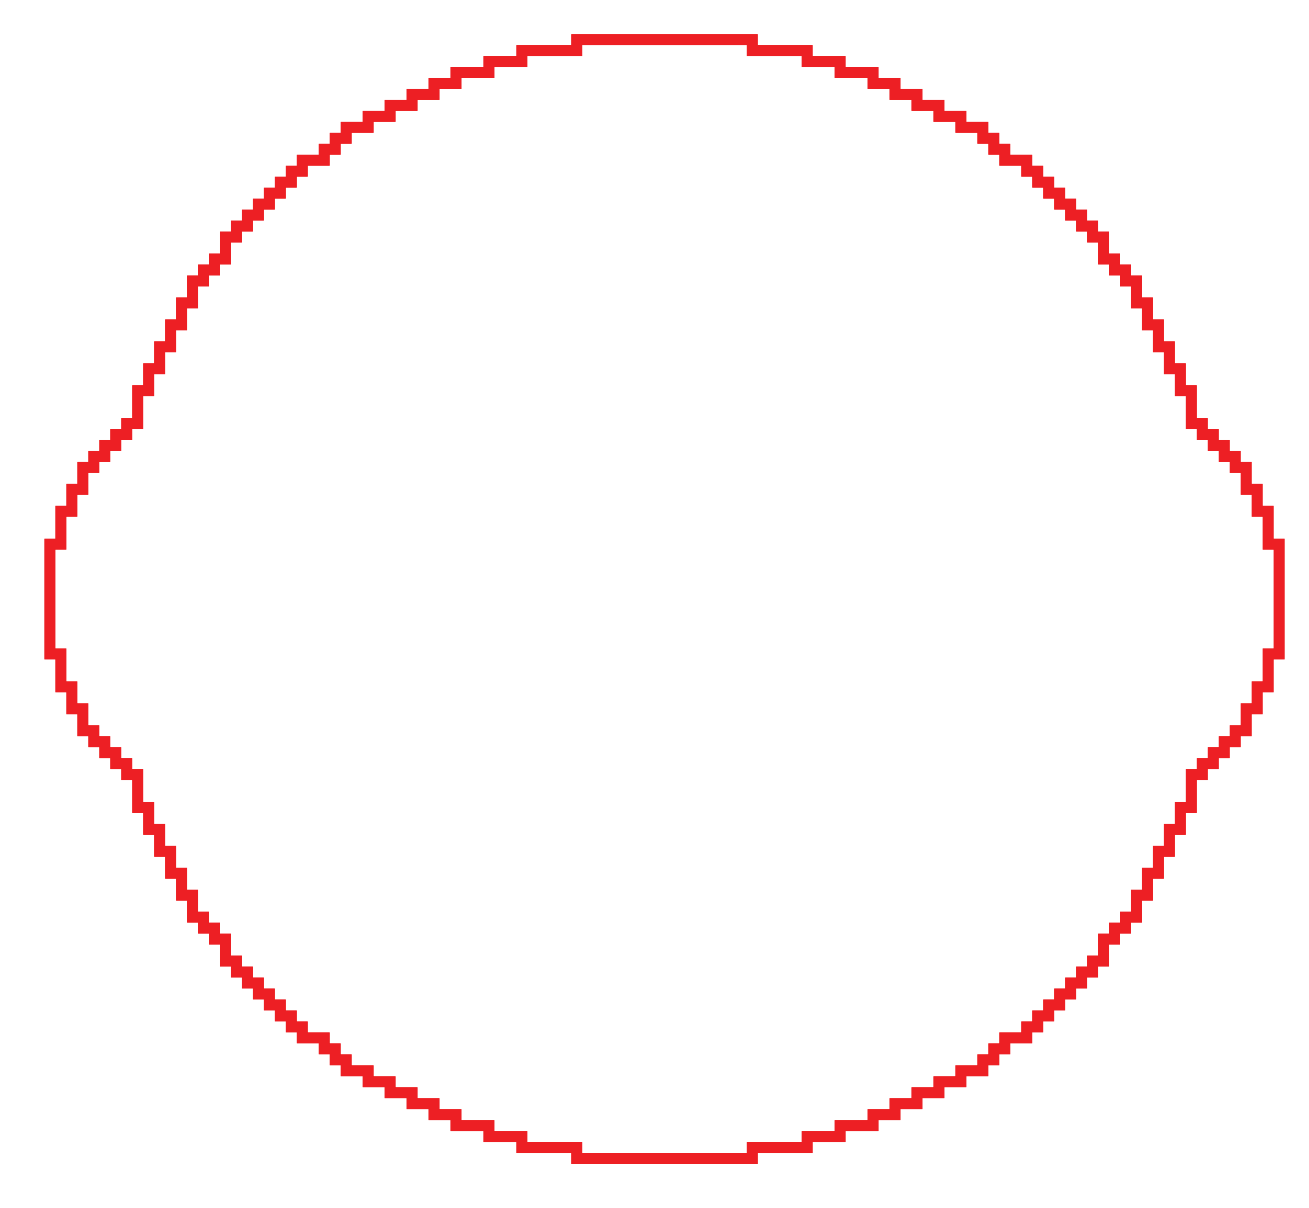
2.1. Obtaining Pixel Points on the Circular Contour by Grid Method

After obtaining the circular contour, the minimum bounding rectangle is chosen. Within this rectangle, a set of horizontal and vertical lines are evenly drawn, as shown in Figure 1a,b, respectively. Each line intersects with the circular contour at two points. The coordinates of the intersection points of the horizontal line set with the circular arc form set S 1 , while the coordinates of the intersection points of the vertical line set with the circular arc form set S 2 . Finally, the data from these two sets are combined and recorded in the data set W.
In theory, the smaller the spacing between the lines, the larger the number of valid data points within the data set. According to the CLSDAT algorithm proposed in this paper, the ability to overcome interference and reduce errors increases with a larger number of valid data points. However, this also significantly increases the computational complexity. To minimize the computational load while ensuring positioning accuracy, the CLSDAT algorithm adopts a stepwise incremental approach to increase the number of dividing lines. Based on the final positioning accuracy, an appropriate number of valid data points is determined.

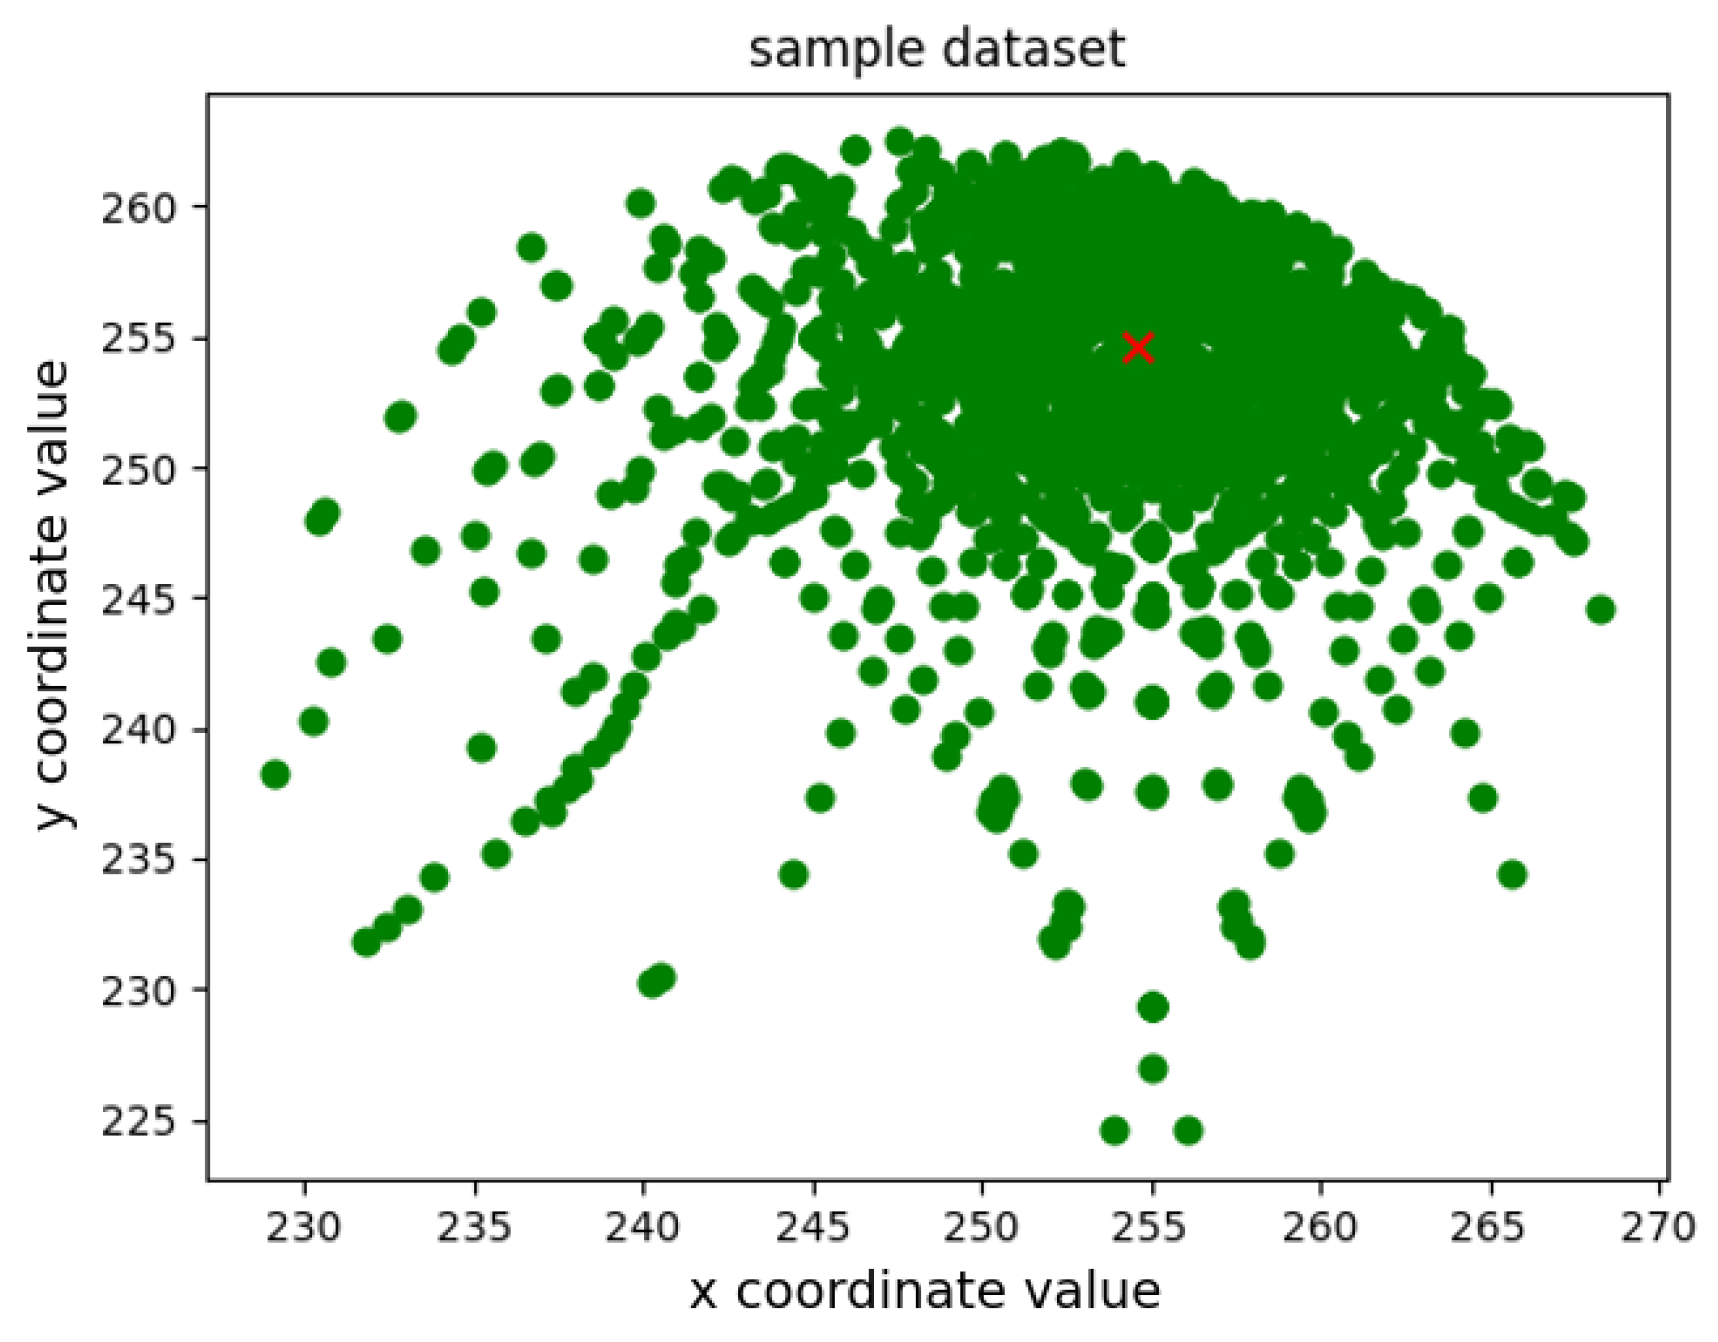
2.2. Constructing a Data Set of Selected Circle Center Samples

As shown in Figure 2, three randomly selected pixel coordinates from data set W are used to connect any two points to form a chord corresponding to the respective circular arc in the circular contour. Normal lines are drawn from the midpoints of the two chords, which must intersect at a single point. This intersection point is recorded as O i , i = 1 , 2 , , n . Thus, the intersection point represents the center of the circle determined by these three coordinate points. In the ideal case, if all the points are from the same standard circle, all the obtained centers should converge to the same point. However, due to the imperfectly standardized circular contour obtained from image pre-processing, the calculated center coordinates may be in the vicinity of the true center coordinates. A significant portion of the calculated center coordinates will be close to or overlap with the true center position.
By changing only one of the three coordinate points, it is possible to construct different circles and obtain different center coordinate data. By selecting any three-pixel coordinates from data set W, according to the combination formula in the probability theory, the number (n) of circle center sample data points satisfies Equation (1), where N is the number of pixels of the circle outline. For example, 60 coordinates of circular contour pixels correspond to 34,220 center sample data points. If the number of center sample data points is too large, random sampling can be used to obtain the desired center sample data set.
n = C N 3 = N ! 3 ! ( N 3 ) !
After traversing the coordinate data set (W), the coordinates of the center points O 1 to O n of the selected circle are obtained, and they are saved in data set P, which is called the sample data set of the selected circle center.

2.3. Calculating the Optimal Solution for the Coordinate of the Circle Center

The candidate circle center sample data set exhibits clear and common characteristics, and there are no different types of data points. In this case, clustering algorithms that converge at the maximum data density are suitable, such as the K-means and mean shift clustering algorithms. The K-means algorithm requires specifying the number of clusters (K) in advance and is sensitive to the initial cluster centers. The mean shift algorithm is a non-parametric probability density estimation method that utilizes the gradient of pixel feature points’ probability density function. Through iterative computations, the mean shift algorithm converges to the local maxima of the probability density function, enabling target localization and tracking. Furthermore, it has the ability to track deformable objects in real time and exhibits robustness against variations, rotations, and other object movements. The mean shift algorithm is an automatic iterative tracking method where the mean shift compensation vectors continually move along the gradient direction of the density function. Under certain conditions, the mean shift algorithm can converge to local optimal points, accurately positioning moving objects. Therefore, the mean shift algorithm is chosen to compute the optimal solution for the density of the candidate circle center sample data [16]. This algorithm does not require specifying the number of clusters and is suitable for being driven by natural data. It performs well in terms of consistency and accuracy.

2.3.1. Mean Shift Vector and Its Clustering Algorithm

Given that the sample data points P i ( i = 1 , 2 , , n ) exist in a D-dimensional space, Equation (2) represents the mean shift vector expression at point P, which can be any point in the sample data points P i . The mean shift vector at point P represents the vector sum of the total k data points within the high-dimensional sphere S r centered at P with a radius of r.
M b ( p ) = 1 k p i S r ( p i p )
In the sample data set P i , an initial point P is randomly selected. After calculating the mean shift vector for the first time, the center of the high-dimensional sphere S r is moved to the endpoint of this vector. Then, this endpoint becomes the new P point, and the above operation is repeated to calculate the current mean shift vector. This process is repeated until the moving distance reaches a pre-defined threshold, at which point the iteration is terminated.
Usually, the direction of the mean shift vector points towards the densest direction of data points. However, there can be exceptions. For example, if the S r region is chosen to be large, and if a vector in this region has a relatively large magnitude and points in the opposite direction of the dense direction of the sample data, it can cause interference to the next mean shift vector movement. This issue can be addressed by introducing a kernel function and weight coefficients.

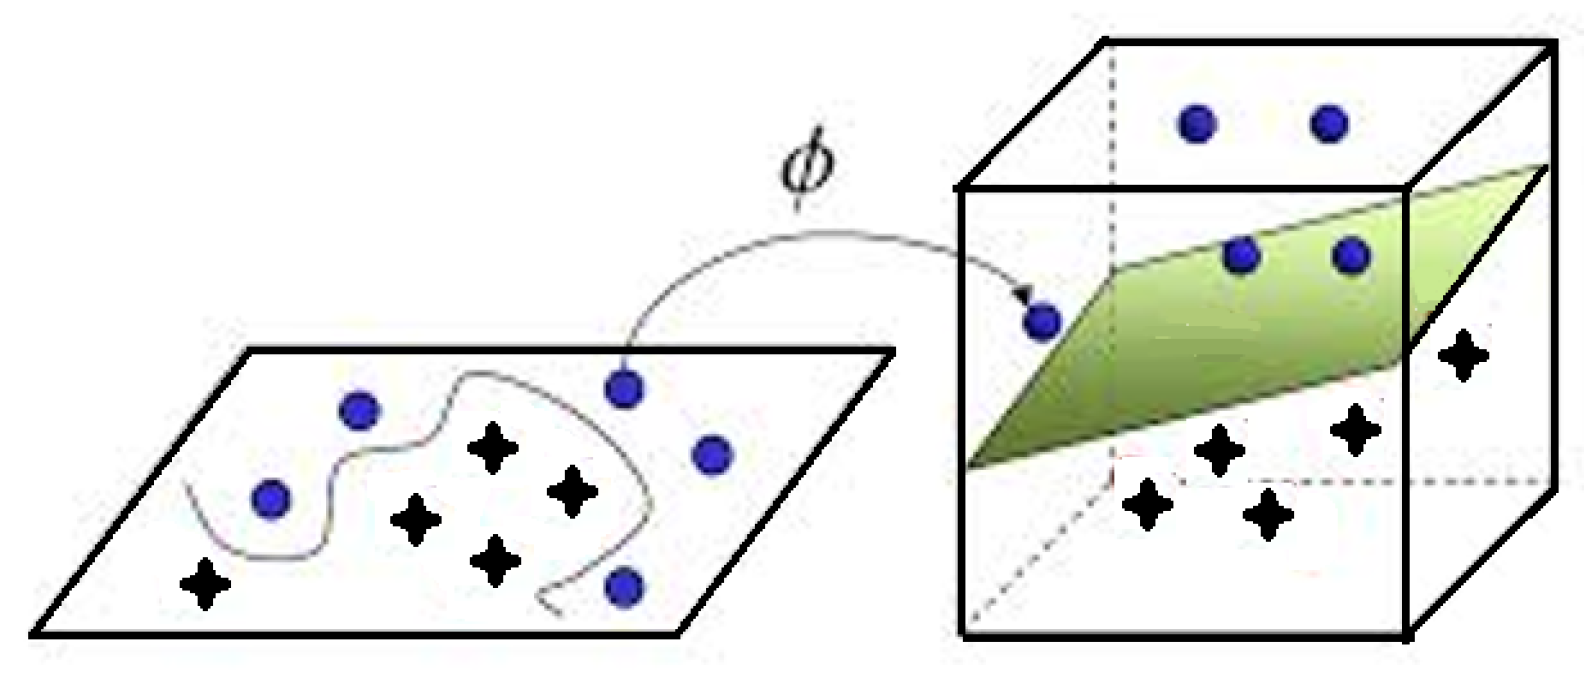
2.3.2. Kernel Method and Kernel Function

The kernel method maps data sets that cannot be well separated in a low-dimensional space to three-dimensional space or even a higher-dimensional space, making it easier to find a hyperplane for linear separation of these data sets, as shown in Figure 3.
During the process of using the kernel method to map the low-dimensional data to a higher-dimensional space and finding a hyperplane for linear separation of the data sets, some difficulties may arise. For example, as the dimension increases, the computational complexity grows exponentially, while the computational capacity of devices is limited. When there are many data samples, time consumption is also significant because each data point needs to be transformed to the higher-dimensional space before subsequent operations can be performed.
Typically, in non-training data model instance learning, the focus is on the characteristics of these instance data. The inner product of vectors is commonly used to represent the characteristics. The inner product in the higher-dimensional space after vector mapping can be achieved by scaling in a low-dimensional space and adding dimensional constants. This is known as the Kernel Trick.
K ( X 1 , X 2 ) = φ ( X 1 ) T φ ( X 2 )
Here, K is the kernel function, X 1 and X 2 are data points in a low-dimensional space, and φ function is their mapping function.

2.3.3. Introducing Gaussian Kernel Function and Weight Coefficient for Mean Shift Vector

There are several commonly used kernel functions, including linear kernel, Gaussian kernel, and polynomial kernel. The choice of the kernel function depends on the number of data samples and the relationship between their features. Here are three principles for selecting kernel functions:
  • If the number of data samples is large enough and the data features are also significant, the linear kernel should be prioritized.
  • If the number of data samples is moderate and there are relatively few data points, the Gaussian kernel should be preferred.
  • If the number of data samples is large but the number of features is relatively small, it may be necessary to manually define some features and use the linear kernel.
Additionally, the Gaussian kernel is a highly effective function for implementing non-linear data classification. It can be used to solve complex data modeling problems and can improve the algorithm’s performance while reducing computation time.
In the created candidate circle center sample data, the majority of the data points are expected to be in the vicinity of the true center data. Since there are fewer features and the efficiency of constructing the sample data are also considered, the Gaussian kernel function is introduced, as shown in Equation (4).
K ( X 1 , X 2 ) = e X 1 X 2 2 2 σ 2
This equation measures the distance between the sample data points X 1 and X 2 , with σ being the variance of the data points involved in the operation.
Using the Gaussian kernel function instead of 1 / k gives the mean shift vector in the form shown in Equation (5), where G ( p ) is a unit Gaussian kernel function with bandwidth b.
M b ( p ) = i = 1 n G ( p i p b i ) ( p i p ) i = 1 n G ( p i p b 1 )

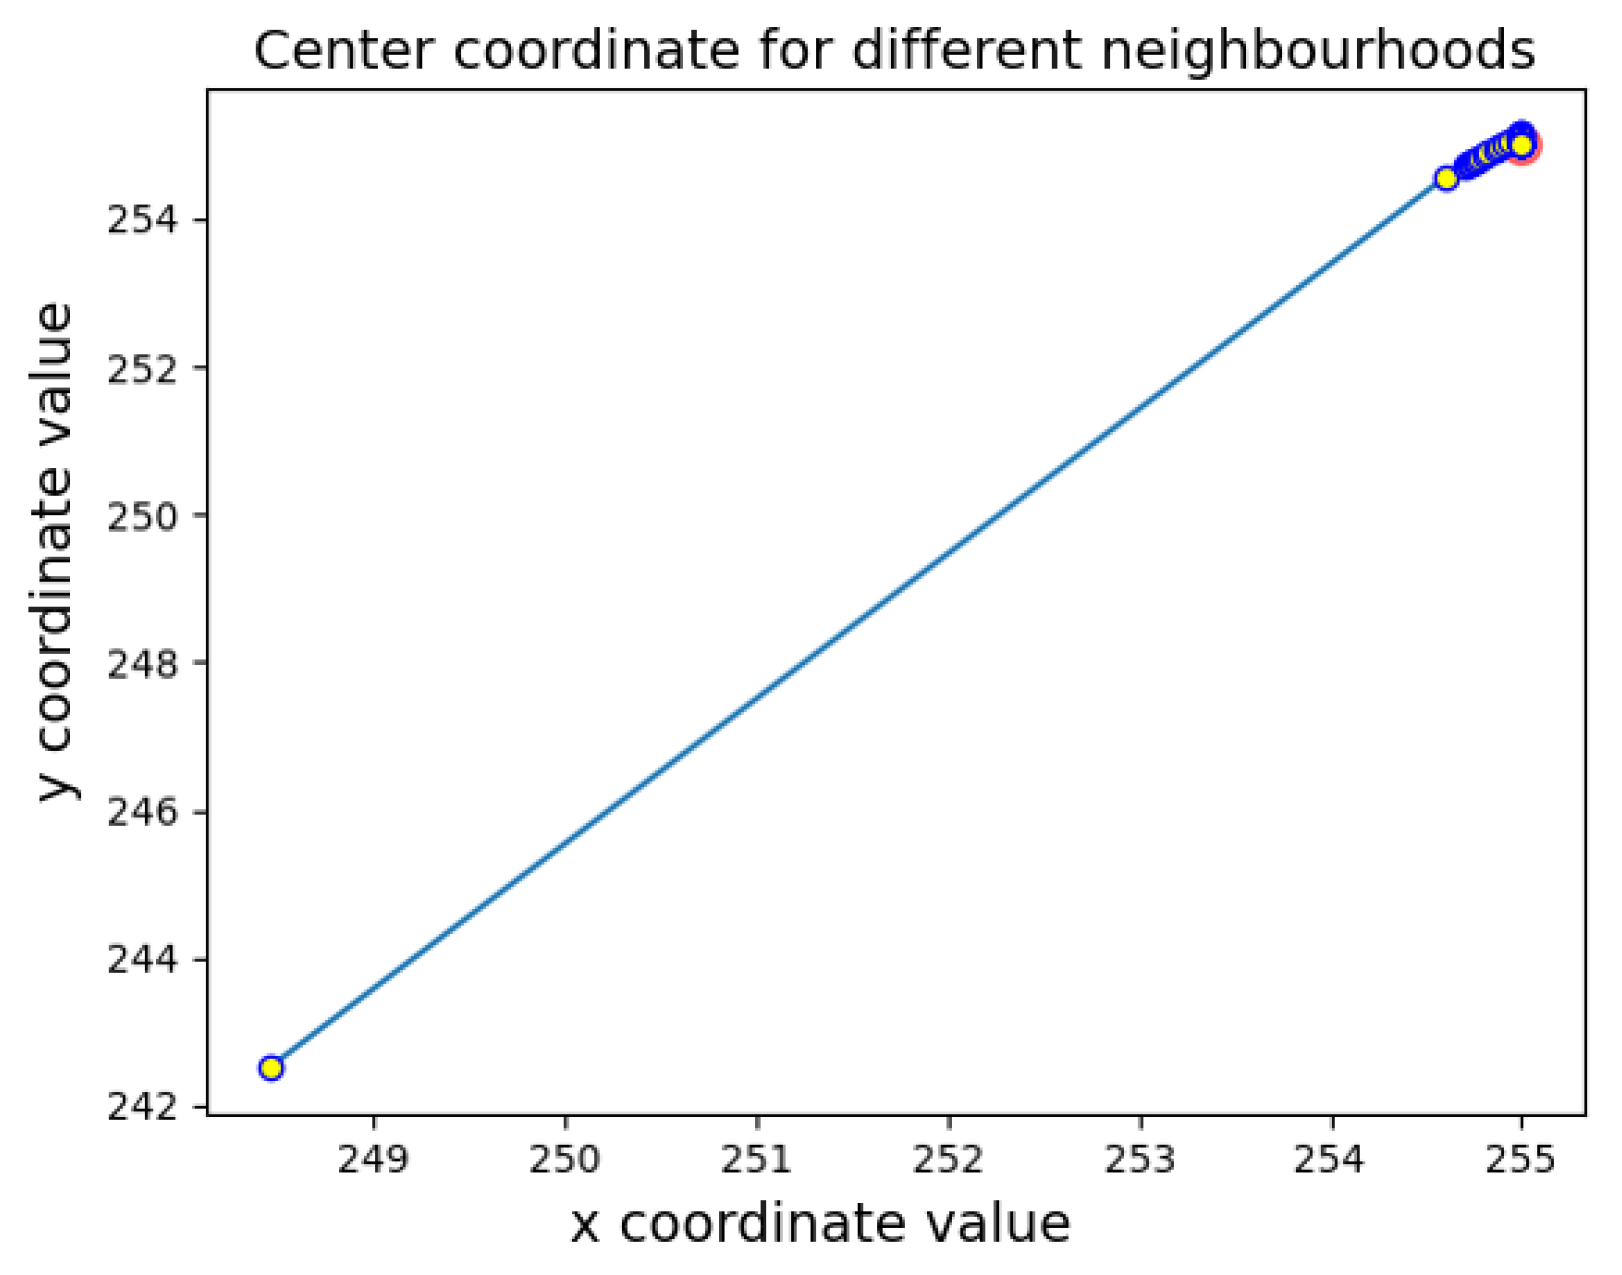
2.4. Calculating the Center Coordinate with Different Sample Density Iteration

The density of the circle center samples, denoted as ρ , is used to measure the number of circle center coordinates within a unit area. It is defined as shown in Equation (6).
ρ = T A
where A is the area of the statistical region in pixels, and T is the number of circle center coordinates in that region.
In a circle center sample data set, as shown in Figure 4, most of the samples are concentrated near the true center due to the imperfect alignment of the contour points on the circular contour. This region exhibits high density, while other regions have lower sample densities.
In each iteration, an optimal circle center can be determined. With this optimal center as the reference, different sample densities are selected based on the distance from the optimal center. The width of the kernel function is automatically determined based on the number of sample points. This process generates a set of circle center coordinates, as shown in Figure 5. The standard circle used in Figure 5 has a center coordinate of (255, 255). It can be observed that the iteration results quickly converge to the standard center.

2.5. Determining the Adaptive Threshold

During the iteration process, the optimal circle center needs to be determined based on the distance between each iteration’s circle center and the standard center. After completing the entire iteration process, the minimum distance value among all distances is selected as the optimal circle center, allowing for an adaptive search to be carried out for the best circle center. The minimum distance value in Figure 6 corresponds to the 21st iteration.

3. Algorithm Verification

To validate the effectiveness of the proposed circle center localization algorithm, a test is conducted using standard circles with center coordinates (255, 255).
Due to the human-induced interference contained in the template matching method, it is not compared. The Hough transform, circle fitting method, and the proposed CLSDAT algorithm in this paper are employed to detect the standard circles to compare their accuracy and efficiency. The experiments are conducted on a computer with an Intel(R) Core(TM) i7-10870H CPU operating at a frequency of 2.2 GHz, 16 GB memory with a frequency of 2133 MHz, running on a 64-bit Win10 operating system.
A total of 10 positioning experiments are performed, with each experiment involving a different standard circle with a known and fixed center coordinate. Table 1 presents the experimental results for the three circle center localization algorithms, where the average error represents the average of the errors from the 10 positioning experiments and serves as a measure of accuracy. A smaller average error indicates better performance.
The Hough transform algorithm requires setting a threshold on the number of data points that constitute a circle. In this experiment, the threshold is set to 100, which means if there are 100 or more data points, it is considered as a circle formed by these points.
The circle fitting algorithm utilizes the method of least squares, which is a statistics-based detection method. It finds the best function fit for a set of data points by minimizing the sum of squared errors. Therefore, it does not require setting any parameters beforehand.
The CLSDAT algorithm proposed in this paper constructs the sample data set with 60 divisions in both the horizontal and vertical directions, resulting in a total of 68,440 sample points.
Figure 7 is the standard circle with additional interference. The experimental results of the interfered circle are shown in Table 2.
From Table 1 and Table 2, the following observations can be made:
(1)
The Hough transform exhibits high accuracy and strong anti-interference capabilities. However, in practical experiments, it was found that the Hough transform may detect multiple centers, requiring appropriate parameter settings to eliminate interference.
(2)
The circle fitting algorithm has the lowest accuracy among the three circle center localization algorithms. It is also more susceptible to interference.
(3)
The proposed CLSDAT algorithm achieves the highest accuracy, efficiently eliminating the impact of interference.

4. Conclusions

This paper proposes a circle center localization algorithm based on sample density and adaptive thresholding, exhibiting the following highlights:
  • Construction of a circle center sample data set: The algorithm constructs a sample data set of circle centers, which contains a large amount of data by forming a circle center point based on any three contour pixels.
  • Utilization of mean shift clustering algorithm: The algorithm employs the mean shift clustering algorithm to calculate the optimal solution for the density of candidate circle center sample data. It introduces a fast Gaussian kernel with an adaptive bandwidth to address the weighting issue of sample points, improving the efficiency and accuracy of the algorithm.
  • Iterative algorithm with adaptive threshold: By seeking the region with the highest sample density using an iterative algorithm, the algorithm excludes points that are far from the target circle center based on the circle center sample density and adaptive thresholding. This effectively filters out bad data and enhances the robustness of the algorithm.
By leveraging these techniques, the proposed algorithm achieves accurate circle center localization and demonstrates improved robustness in dealing with various scenarios.
Experimental results demonstrate that the proposed algorithm achieves high accuracy, with a positioning error of only 0.051 pixels. It also exhibits strong resistance to interference, as the positioning accuracy remains nearly unchanged even when interference is introduced. In the presence of interference, the algorithm outperforms the Hough transform by 64.1% and the circle fitting algorithm by 86.4% in terms of the localization accuracy. However, due to the requirement for multiple iterations, it involves a longer processing time. When time consumption is not a primary concern, increasing the amount of circle center sample data can further improve the accuracy of the algorithm.

Author Contributions

Conceptualization, F.Z.; methodology, Y.M.; software, H.C.; validation, Y.M.; formal analysis, Z.C.; investigation, Y.M.; resources, Z.C.; data curation, Y.M.; writing—original draft preparation, Z.C.; writing—review and editing, F.Z.; visualization, F.Z.; supervision, F.Z.; project administration, Y.M.; funding acquisition, F.Z. All authors have read and agreed to the published version of the manuscript.

Funding

This research was funded by National Natural Science Foundation of China of Funder, grant number 62001333.

Institutional Review Board Statement

Not applicable.

Informed Consent Statement

Not applicable.

Data Availability Statement

The data present in this study are available upon request from the corresponding author. The data are not publicly available due to privacy restrictions.

Acknowledgments

The authors express sincere gratitude for the support received from various project funds, which were instrumental in facilitating the successful completion of this research endeavor. In addition, the authors wish to thank the reviewers for their useful and constructive comments.

Conflicts of Interest

The authors declare no conflicts of interest.

Abbreviations

The following abbreviations are used in this manuscript:
CLSDATCenter Localization Based on Sample Density and Adaptive Threshold

References

  1. Wang, S.; Zheng, P.; Kong, Y.; Zhu, Y.; Wang, G.; Zhang, X. A novel method for roundness error based on searching the center of the circle. Meas. Sci. Technol. 2022, 33, 095008. [Google Scholar] [CrossRef]
  2. Wang, W.; Lu, K.; Hong, R.; Chen, P.; Zhang, J.; Wang, B. A Machine Vision Method for Automatic Circular Parts Detection Based on Optimization Algorithm. In Intelligent Computing Theories and Application; Springer International Publishing: Berlin/Heidelberg, Germany, 2017; pp. 600–611. [Google Scholar] [CrossRef]
  3. Wang, M.; Ma, H. A method of circle center fitting for water wall cladding. Measurement 2022, 202, 111783. [Google Scholar] [CrossRef]
  4. Qi, M.; Wang, Y.; Chen, Y.; Xin, H.; Xu, Y.; Meng, H.; Wang, A. Center detection algorithm for printed circuit board circular marks based on image space and parameter space. J. Electron. Imaging 2022, 32, 011002. [Google Scholar] [CrossRef]
  5. Wu, K.; Ying, Q.; Wang, W.; Zhang, L.; Cheng, R.; Huang, Q. Calculation method of projection point of circle center in camera calibration. In Proceedings of the Tenth International Symposium on Precision Mechanical Measurements, Qingdao, China, 15–17 October 2021; Yu, L., Yang, L.X., Xia, H., Eds.; SPIE: Pontoise, France, 2021. [Google Scholar] [CrossRef]
  6. Lu Xiaodong, X.J.; Qican, Z. High Camera Calibration Method Based on True Coordinate Computation of Circle Center. Chin. J. Lasers 2020, 47, 0304008. [Google Scholar] [CrossRef]
  7. Deng, S.; You, J.; Tang, L.; Su, X. Circle Center Automatic Extraction and Sorting based on Improved Circular Target. Int. J. Perform. Eng. 2019, 15, 1417. [Google Scholar] [CrossRef]
  8. Zeng, J.; Wang, Y.; Wu, H.; Liu, G. Research on the Positioning Method of Steel Belt Anchor Holes Applied in Coal Mine Underground. Appl. Sci. 2024, 14, 4360. [Google Scholar] [CrossRef]
  9. Hou, W. Research on automatic hole making technology of industrial robot based on Hough circle detection algorithm. Int. J. Wirel. Mob. Comput. 2023, 24, 352–360. [Google Scholar] [CrossRef]
  10. Tan, Y.; Ali, M.; Lin, F.; Su, Z.; Liao, W.H.; Wong, H. Study on laser spot size measurement by scanning-slit method based on back-injection interferometry. Opt. Laser Technol. 2024, 172, 110472. [Google Scholar] [CrossRef]
  11. Wei, J.; Zhu, H.; Wang, Y.; Sun, N.; Liu, F.; Zhang, J.; Chen, Y.; Liu, J. Spot position scheme on a quadrant detector for a spaceborne laser communication system. Appl. Opt. 2024, 63, 3162. [Google Scholar] [CrossRef] [PubMed]
  12. Mishra, P.; Mishra, N. Machine Learning Approach for Unmanned Aerial Vehicle’s Path Scheduling and Precise Circle Detection. In Proceedings of the 2024 IEEE International Conference on Interdisciplinary Approaches in Technology and Management for Social Innovation (IATMSI), Gwalior, India, 14–16 March 2024; Volume 2, pp. 1–6. [Google Scholar] [CrossRef]
  13. Kim, G.N.; Kim, S.H.; Joo, I.; Kim, G.B.; Yoo, K.H. Center Deviation Measurement of Color Contact Lenses Based on a Deep Learning Model and Hough Circle Transform. Sensors 2023, 23, 6533. [Google Scholar] [CrossRef] [PubMed]
  14. Kumagai, S.; Hotta, K. Particle detection in intracellular images and radius estimation by circle fitting. IEEJ Trans. Electr. Electron. Eng. 2015, 10, 181–185. [Google Scholar] [CrossRef]
  15. Scitovski, R.; Marošević, T. Multiple circle detection based on center-based clustering. Pattern Recognit. Lett. 2015, 52, 9–16. [Google Scholar] [CrossRef]
  16. Cariou, C.; Le Moan, S.; Chehdi, K. A Novel Mean-Shift Algorithm for Data Clustering. IEEE Access 2022, 10, 14575–14585. [Google Scholar] [CrossRef]
Figure 1. Grid method for dividing circles. (a) Horizontal straight line dividing circle. (b) Vertical straight line dividing circle.
Applsci 14 08453 g001
Figure 2. Two chords determine the circle center.
Applsci 14 08453 g002
Figure 3. Two-dimensional mapping to high-dimensional partitioning.
Applsci 14 08453 g003
Figure 4. Data set of circle center samples.
Applsci 14 08453 g004
Figure 5. Center iteration process by different sampling density.
Applsci 14 08453 g005
Figure 6. Iteration process.
Applsci 14 08453 g006
Figure 7. Interfered standard circle.
Applsci 14 08453 g007
Table 1. Positioning errors of different circle central location algorithms (Unit: Pixels).
NumberHough TransformCircle FittingCLSDAT
10.0860.2560.040
20.1020.1420.065
30.1570.2500.082
40.0850.3120.060
50.1640.2370.051
60.1160.2590.034
70.1280.3860.077
80.1610.4310.061
90.1060.3740.051
100.1270.3420.024
Average error0.1230.2990.055
Table 2. Positioning errors under interfered standard circle. (Unit: Pixels).
NumberHough TransformCircle FittingCLSDAT
10.1050.3520.035
20.1620.4120.044
30.1320.3250.063
40.1210.2160.062
50.1640.4740.041
60.1540.3790.058
70.1730.2620.062
80.1620.3710.066
90.1360.5530.052
100.1150.3980.021
Average error0.1420.3740.051
Disclaimer/Publisher’s Note: The statements, opinions and data contained in all publications are solely those of the individual author(s) and contributor(s) and not of MDPI and/or the editor(s). MDPI and/or the editor(s) disclaim responsibility for any injury to people or property resulting from any ideas, methods, instructions or products referred to in the content.

