Article

Assessment of the Water Quality of WWTPs’ Effluents through the Use of Wastewater Quality Index

1
“Georgi Benkovski” Air Force Academy, 1 St. St. Cyril and Methodius Str., 5855 Dolna Mitropolia, Bulgaria
2
Faculty of Chemistry and Pharmacy, Sofia University “St. Kliment Ohridski”, 1164 Sofia, Bulgaria
3
Faculty of Hydraulic Engineering, University of Architecture, Civil Engineering and Geodesy, 1046 Sofia, Bulgaria
*
Author to whom correspondence should be addressed.
Appl. Sci. 2024, 14(18), 8467; https://doi.org/10.3390/app14188467
Submission received: 16 August 2024 / Revised: 10 September 2024 / Accepted: 13 September 2024 / Published: 20 September 2024
(This article belongs to the Special Issue Validation and Measurement in Analytical Chemistry: Practical Aspects)

Abstract

:
Evaluating the efficiency of wastewater treatment plants (WWTPs) and their impact on receiving surface water bodies is a complex and highly significant task due to its regulatory implications for both environmental and public health. The monitoring of many water quality parameters related to the compliance of treated wastewater with environmental standards has led to the development of a unitless metric, the Wastewater Quality Index (WWQI), which serves as a practical tool for regulatory authorities. The aim of this research is to propose an appropriate WWQI methodology, incorporating a set of water quality indicators and a weighting approach, to evaluate wastewater effluents under operational monitoring. In this study, WWQI was successfully applied to access the operation of 21 WWTPs’ effluents within a single monitoring campaign, outside the mandatory monitoring schemes. The WWQI was computed for physical-chemical parameters including chemical oxygen demand (COD), total nitrogen (TN), total phosphorus (TP), total suspended solids (TSS), electrical conductivity (EC) and pH, priority substances (Cd, Ni and Pb) and a specific contaminant (Cr) using the weighted approach in the WWQI calculation, based on equal weighting, expert judgement and PCA weighing using factor loadings. The three approaches give similar results for the calculated WWQI. The expert judgment approach is more suitable for evaluating WWTP performance during a single monitoring campaign due to its simplicity compared to the PCA-based approach and its ability to prioritize specific water quality parameters over an equal weightage method.

1. Introduction

About 80% of the water used is discharged to the natural water bodies without treatment. This makes water pollution ubiquitous and a globally (un)recognized problem [1]. Wastewater treatment plants (WWTPs) are designed to treat used water. As such, they have greatly improved the discharged water quality. However, treated effluents still contain a complex mixture of organic and inorganic pollutants, suspended solids, nutrients, bacteria, microbes, etc., whose environmental effects might be unknown. Furthermore, the effects could be unnoticed, or with great variability [2,3]. Acting as point sources of contamination, the WWTPs can completely deteriorate the water composition of the receiving surface water bodies [4]. The discharges into rivers act as supplemental water, where the element composition and microbial community of WWTP effluent and natural surface water often differ considerably [5]. Yet, treated wastewater from urban and industrial sources is considered an alternative water resource for crop irrigation, protecting aquifers from overexploitation and enabling sustainable water use [6]. Treated water use can negatively affect the environment through increased salinity, the introduction of pollution and pH change. Detailed analysis of different parameters is, consequently, needed to establish compliance with environmental quality standards [7].
Legislation in the field of water quality is vast. Depending on the water’s intended use or the geographical region, numerous legislative documents apply. In Bulgaria, next to the national legislation, the European Directives also apply. Directive 91/271/EEC deals with the requirements (concentrations or percentage of reduction) for discharges from urban WWTPs [8]. Directive 2013/39/EU for priority substances sets limits for Cd, Ni and Pb in surface water bodies (SWBs) [9]. Finally, the maximum allowable concentrations for the most common physical-chemical parameters in the surface waters are set by Ordinance N-4 [10]. The use of so many legislative documents is necessary to ensure that treated waters do not negatively affect the SWBs.
To optimize the treatment processes, a unitless number [11]—the Wastewater Quality Index (WWQI), was introduced as an assessment tool of the overall wastewater quality. It takes into consideration all the monitored chemical, physical and microbiological quality parameters. Often, the interpretation of such huge quality sets is very difficult and requires the application of sophisticated statistical methods. In contrast, a single number (ranging from 1 to 100) is preferred in checking compliance with the established water quality standards [12]. The higher the WWQIs, the more efficient the treatment is, and the wastewater effluents are meeting the WWTPs’ design objectives. In contrast, the influents generally have low WWQI values. This renders them harmful if released untreated directly into the water bodies. Therefore, the use of the WWQI benefits the decision makers to rapidly assess the wastewater quality and compare different treatment processes. Different sets of parameters are usually selected for devising the WWQI. Some authors select the minimum required four parameters [6,13], other investigators prefer fewer than 10—i.e., eight [7,11,14,15] or nine [16]—and few research groups use 10–20 (13 [17], 14 [18] or 15 [19]), while there are reports that use 21 [20,21] and even 23 water quality parameters [22]. The most parameters required by a method is 26 [23]. One of the pitfalls of the WWQI approach is that it establishes relationships between water quality indicators not allowing a straightforward interpretation of what causes the specific value of the WWQI, thus eclipsing or over-emphasizing a single bad parameter value.
The selection of parameters to be used in devising the WQI models is often based on the data (un)availability [24] and obtainability, expert opinion and the environmental significance or application type (e.g., drinking water, surface water, underground water, wastewater, etc.) [25]. The Canadian Council of Ministers of the Environment (CCME) WQI is currently one of the most widely used methods to evaluate surface water for the protection of aquatic life in accordance with specific guidelines due to its simplicity, possibility to vary the study parameters at different locations and adaptability to different legal requirements and different water uses [26,27,28,29]. The sampling protocol requires at least four parameters, sampled at least four times, which is suitable for water quality assessment of the mandatory sampling, but renders the method useless in random checks.
Since many WQIs exist [30,31], weighted [6,13,14,15,17,21,22] and unweighted [7,11,16,18,19,20] approaches are undertaken to assess the WWTPs’ performance. The weights are assigned according to the parameters’ relative importance for water quality. Usually, the highest weights are assigned to parameters that have major effects on water quality and are very important for water quality compliance. The minimum weight is usually assigned to parameters which are not considered harmful. A different approach utilizes the parameters with the lowest permissible limits as being the most harmful even on slight concentration fluctuations. Subsequently, the highest weights are assigned to low permissible limits’ parameters, while the high permissible limits’ parameters allow relatively fewer chances of pollution and, therefore, low weightings are assigned [32]. One approach is to assign equal weightage to all the studied parameters; another is based on an expert judgement [33]. Assigning equal weights to the selected parameters acknowledges their similar importance in the assessment and is close to the approach followed in the Water Framework Directive (WFD) [34]. Experts’ opinions are used for the variables’ choice and their weight assignments. In a third approach, the weights are defined as functions of the standards proposed in the water quality guidelines [35]. Regardless of the approach used, the weighting can deteriorate the final WWQI calculated value due to possible changes in the expert panel or when the guidelines are improved. Therefore, the weighting should be decided according to the use of water or to be determined locally. As different experts give sometimes different weights for the same parameters [21,36], Principal Component Analysis (PCA) was used to assign the weight based on the estimated eigenvalues and component loading for each parameter using the recommended standards for the corresponding parameters [37]. The PC-weight assignment has been used to monitor temporal wastewater quality [38], overcoming the shortness of the CCME WQI approach. PCA-based WQI minimizes the subjectivity and uncertainty from overrating or underrating [39], despite its inconsistencies [40].
The present work aims to evaluate the water quality of WWTPs’ effluents by combining physical-chemical parameters, specific contaminants, a priority substance and common wastewater quality indices, in a single monitoring campaign, outside the mandatory monitoring schemes. For this reason, a weighted approach incorporating the deviations from environmental legislation norms, based on (i) equal weightage, (ii) expert judgement and (iii) PCA estimated factor loadings was introduced to the calculation of WWQI.

2. Materials and Methods

2.1. Sampling and Sample Preparation

Samples of 21 treated wastewater effluents at the outlets of the studied WWTPs were collected in August 2018 in typical hot weather conditions (>30 °C) without stormy events (Table 1).
The plants were selected based on their wide range of p.e. and the rivers they discharge in (Figure 1).
Based on the sensitivity of the receiving SWBs, maximum allowable concentrations (MACs) for certain parameters are devised in the respective legislation (Table 2). Directive 91/271/EEC establishes the maximum allowable concentrations for chemical oxygen demand (COD), total nitrogen (TN), total phosphorus (TP) and total suspended solids (TSS) for the discharges. Directive 2013/39/EU sets the limits for the priority pollutants Cd, Ni and Pb. The national legislative document (Ordinance N-4) determines the maximum allowable concentrations for achieving at least a moderate status of the SWBs (lakes and rivers) for pH, electrical conductivity (EC) and Cr. According to the same document, the MAC for Cr is set at 32 µg/L for both the oxidation states—Cr (III) and Cr (VI).
For the determination of the physical-chemical parameters, the water samples were collected in glass bottles and directly stored at 4 °C. The 50 mL samples for ICP-MS analysis were filtered with a 25 mm PES sterile syringe filter (0.45 µm), inserted into glass bottles, acidified with 1.5 mL conc. HNO3 (67–69% Fisher Chemicals, Pittsburgh, PA, USA, TraceMetal Grade), stored at 4 °C and transported to the laboratory premises [41]. Upon receipt, the samples were analyzed in triplicate.

2.2. Physicochemical Analysis

The detailed measurement conditions and quality control (QC) measures are published elsewhere [41]. Briefly, the ICP-MS analysis of Cd, Cr, Ni and Pb was carried out using an ICP-MS PerkinElmer SCIEX—ELAN DRC-e instrument (MDS Inc., Concord, ON, Canada). The spectrometer was optimized to minimize CeO+/Ce+ and Ba2+/Ba+ values and provide the maximum intensity of the analytes. The use of a standard reference material NIST 1640a (Trace Elements in Natural Water) proved the accuracy of the measurement results as the analytical recovery (95–108%) was considered satisfactory.
Cuvette tests LCK 314, LCK 138 and LCK 348 for the determination of COD, TN and TP, respectively, were used following the producer’s sample preparation steps (Hach Lange GmbH, Berlin, Germany). The detailed procedure is described in previous studies [41,42,43,44,45]. A portable spectrophotometer DR 3900 (Hach Lange GmbH, Berlin, Germany) was used for the determination of COD, TN and TP at 448, 370 and 890 nm, respectively. For the determination of pH and EC, a combined instrument SensIon+ MM734 (Hach Lange GmbH, Berlin, Germany) was used and the requirements of ISO 11923 [46] were followed for the determination of TSS using glass-fiber filters. All the measurements were performed at the accredited under ISO 17025 [47] water quality laboratory at the University of Architecture, Civil Engineering and Geodesy.

2.3. Principal Component Analysis

Multivariate analysis and visualization of wastewater effluents’ datasets are achieved through the application of Principal Component Analysis (PCA) [48,49]. The PCA is used for dimensionality reduction of interrelated variables, keeping the variation in the original data as much as possible [50]. The latent factors (principal components) identify the variance sources and data structure, where the first few components, those with eigenvalues higher than 1, preserve the significant part of dataset variation [51]. The principal components (PCs) are calculated from the original input data matrix as a product of two orthogonal factor matrices: factor loadings and factor scores. Factor loadings present the weights of original variables in the formation of new variables (factors or PCs) and give information about the principal component origin. Factor scores present the projections of the original data on PCs and could be used for the identification of similarity groups between investigated samples.
Before the PCA analysis, the input data were auto-scaled and Venetian blinds as a cross-validation procedure was applied. All multivariate statistics models were performed in MATLAB R2021a using PLS Toolbox 9.0 (Eigenvector Research Inc., Manson, WA, USA).

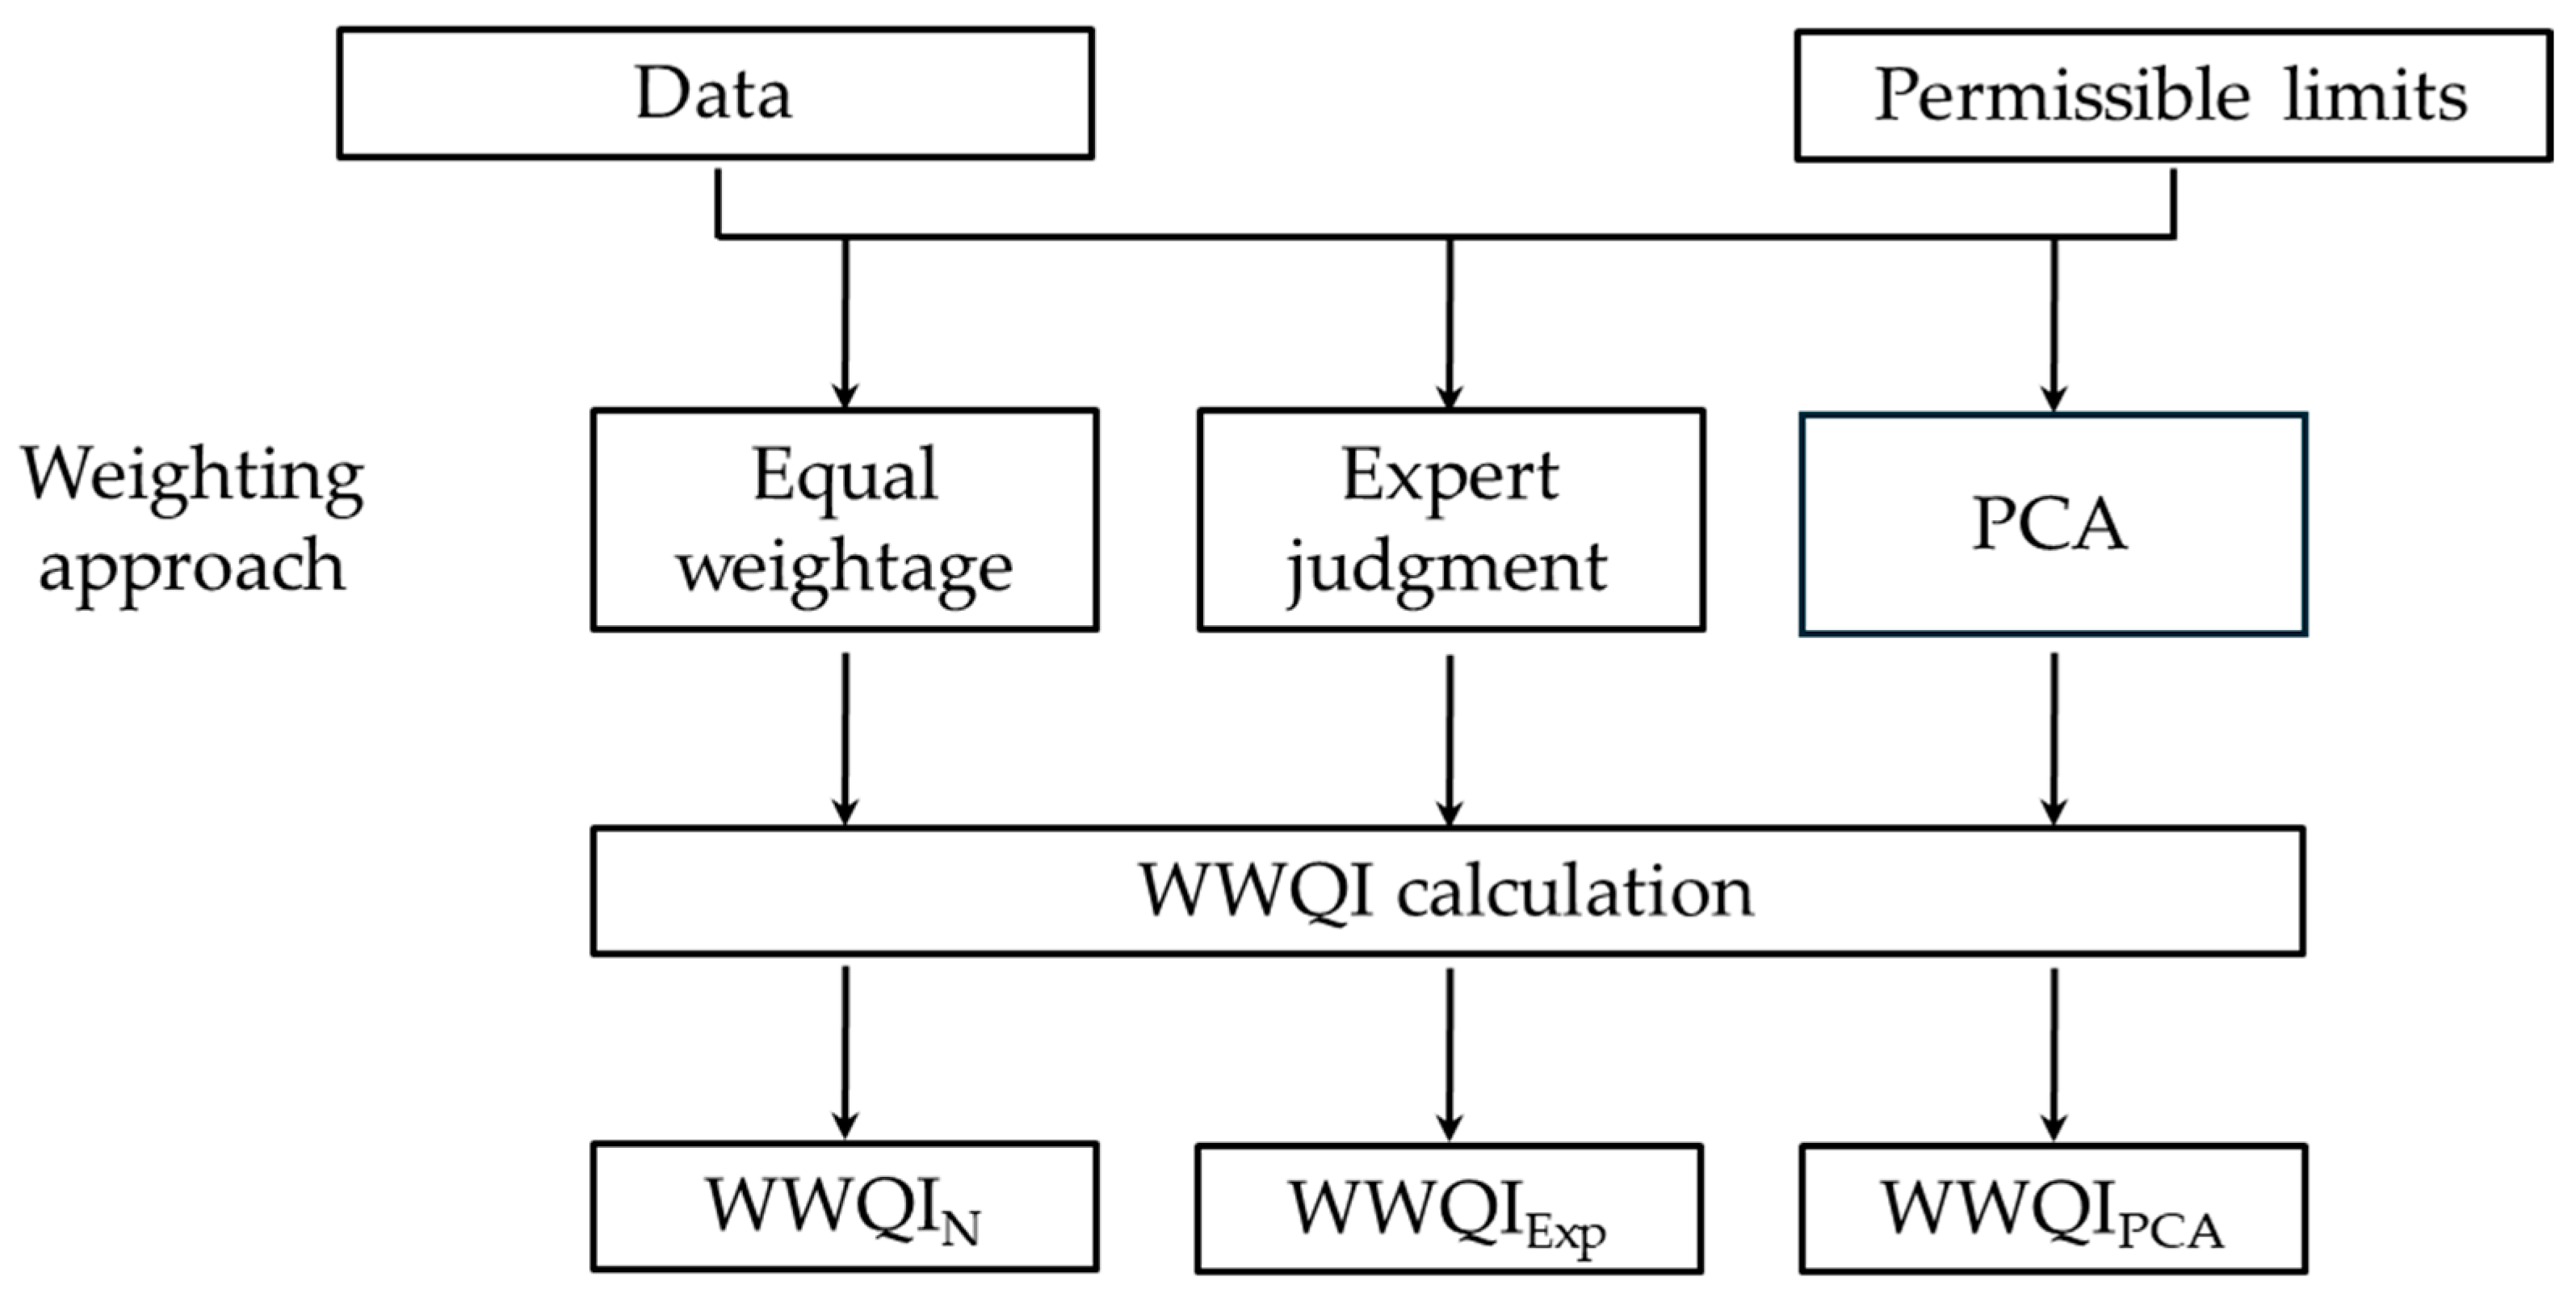
2.4. Calculation of the Wastewater Quality Index

The flow chart of WWQI calculation is presented in Figure 2.
The WWQI used in this study was adopted from [52] and is based on the sum of the water quality sub-indices of each parameter measured:
W W Q I = i = 1 n S I i
where SI is the water quality sub-index of each parameter.
The SI is calculated according to the Equation (2):
S I = W i · q i
where qi is the quality rating and Wi is the relative weight.
The quality rating (qi) is calculated using Equation (3):
q i = C i S i · 100 ,
where Ci is the water quality parameter concentration in each sample and Si is the water quality standard set by the respective legislation.
In this study, for pH, the desired limit interval is considered:
S i = 100 100 ( e x c u r s i o n ) ( 8.5 6.5 )
If the measured value (Ci) is within the desirable limit (6.5 ≤ Ci ≤ 8.5), there is no excursion and Si is equal to 100. If Ci > 8.5, the excursion equals to Ci—8.5. If Ci < 6.5, the excursion equals to 6.5—Ci.
The relative weights (Wi) for each parameter are obtained from Equation (5):
W i = w i i = 1 n w i ,
where wi is the weight of each parameter measured and n is the number of parameters measured.
The WWQI is computed using the relative weights (Wi) assigned to each of the water quality parameters based on (i) equal weightage (WWQIN), (ii) expert judgement (WWQIExp) and (iii) PCA factor loadings for their overall importance for sustaining water quality (WWQIPCA) [37]. When the equal weightage is used, a weight of 1 was assigned to all the 10 studied parameters.
Ascribing weighting to the studied water quality parameters influences the final WWQI value [35]. Usually, expert panels are used to assign weightings based on the environmental significance of the parameter, guideline values and use of the water body [32]. In the current study, when the expert judgement approach is used, the highest weight of 5 was assigned to parameters which have major effects on water quality—the priority substances Cd, Ni and Pb. A weight of 4 was assigned to the specific substance (Cr) and the eutrophication-causing parameters (COD, TN and TP). TSS and EC were assigned a weight of 3 and a minimum of 2 was assigned pH, which is considered as the least harmful.
In PCA weighting approach, the weights of water quality parameters (wi) are assigned based on the eigenvalues and factor loadings of PCs with eigenvalues higher than 1:
w i = K = 1 n E K P i K k = 1 n E K ,
where E K is the eigenvalue of PCs, P i K is the factor loadings of parameters and n is the number of PCs with eigenvalues higher than 1.
The relative weights (Wi) for all three weighting approaches are calculated according to the Equation (5).
Finally, the WWQI is evaluated through a simple comparison to the categories shown in Table 3 according to the originally proposed WQI scheme and a modified one, reflecting Bulgarian legislation.
The Bulgarian legislation follows the adopted WFD, with the main difference being the proposed scaling—the “Fair”, “Poor” and “Very poor” water status is combined into a “Moderate” water status. The modified scale was used from this point on.

3. Results

Treated water was collected from 21 Bulgarian WWTPs receiving urban wastewater. The results obtained for six physicochemical indicators—pH, EC, COD, TSS, TN and TP, three priority substances (Cd, Ni and Pb) and one specific substance (Cr) were used for this study (Table 4). The highlighted values, shown in Table 2, mean that the concentrations of these parameters are greater than the maximum allowable concentrations.
As regards the different water quality parameters, excursions from the environmental water quality standards for the priority [9] and specific pollutants [10] were observed for Pb (14.45 mg/L at PDV), EC (1174 μS/cm at DMG, 441 μS/cm at PVN, 991 μS/cm at RDN) and pH (8.51 at TRO). For the water treatment quality parameters [8], excursions were observed for TP (2.15 mg/L at GAB, 1.61 mg/L at PAZ, 1.70 mg/L at PDV, 2.21 mg/L at PER, 2.82 mg/L POP) and TN (14.2 mg/L at PAZ). These results show that the treatment facilities generally meet the requirements posed by the legislation.
The PCA results show that the first five latent factors (PCs) with eigenvalues higher than 1 explain almost 80% of the total variance. The factor loadings of the selected PCs are presented in Table 5.
The factor loadings reveal the relationships between water quality parameters with significant contributions to the formation of latent factors. For example, there are strong correlations between TSS and Pb in PC1, between EC and TN in PC2 and between Cd and Cr in PC3. The factor loadings of PC4 reflect the strong negative correlation between COD and TP. Furthermore, the weights of parameters (wi) are calculated according to the Equation (6).
The calculated relative weights for water quality parameters according to the approaches described earlier are presented in Table 6.
It could be noticed that relative weights obtained by equal weightage and PCA-based approaches are closer than expert judgment ones.
The calculated WWQIs for the investigated WWTPs are presented in Figure 3.
The three approaches for the calculations give similar results, where the expert judgment gives higher WWQI (cleaner water), as opposed to the PCA-based and equal weightage, giving nearly equal results. The only exceptions are Pernik (PER) and Plovdiv (PDV), with the highest WWQIs calculated by an equal weightage approach.
The wastewater outlet status classifications of investigated WWTPs, based on applied WWQIs according to the modified WQI schemes, are presented in Table 7. There is full agreement between the three approaches used for the calculation of WWQI, excluding the classification of the WWTP located near Pernik (PER). Generally, the status of WWTP outlets is “good” to “very good” with the only exceptions being PDV and PAZ, for which a “moderate” status is given based on the WWQI.

4. Discussion

The intercept (b0 = 1.8947) indicates that, on average, WWQIExp results are almost two units higher than WWQIPCA ones (Figure 4).
This outcome contradicts the observations in [55] that the PCA method gives different results than the expert judgement (sometimes referred to as the Delphi method) for weight assignment and is considered more accurate in the results’ evaluation.
It is noteworthy to highlight that the calculated WWQIs using expert judgement and equal weights follow the same trend and are in good agreement (Figure 5), which partially contradicts the findings in [32], where the use of unequal parameter weighting is suggested. The only exception is PER where WWQIN is higher than WWQIExp by 11 units. This difference leads to the different status classifications of treated wastewater at WWTP located close to Pernik. This result is in line with [32] and confirms the robustness of WWQI model when unequal weights are used (i.e., expert judgement, PCA weighting) compared to the equal weights assignment.
To assess the effectiveness of the three approaches used to calculate WWQI, it would be beneficial to compare the water status of wastewater outlets and excursions from environmental water quality standards.
Out of 21 WWTP effluents, 11 are classified as having very good status (TRO, BLG, KNL, DPN, PBN, KZN, SZG, SMK, SOF and SEV). This group includes WWTPs of varying sizes and treatment facilities. The excellent/very good status aligns with the absence of excursions from environmental water quality standards. The only exception is the effluent from TRO, where the pH of 8.51 slightly exceeds the very good status range of 6.5–8.5.
The second group of WWTP effluents (seven out of 21) is classified as having good water status. Among these, the effluents of two WWTPs (LOV and MZD) show no deviations from environmental standards, while the other five are associated with excursions from these standards. The effluents from PVN, RDN and DMG exhibit EC values exceeding the environmental standard, while those from GAB and POP have TP values above the corresponding standard. It can be concluded that the WWQIs of WWTPs with excursions are predominantly influenced by water quality parameters that meet environmental standards rather than those that do not. The elevated TP levels exceeding the limit for GAB and POP suggest the need for implementing phosphorus treatment facilities at both WWTPs.
Two WWTPs, PDV and PZD, have two water quality parameters that do not meet standards. Both effluents are classified as having a moderate water status, aligning with a previous study [42] that identified issues at these facilities.
The only WWTP effluent classified into different classes by the three approaches used is PER. The expert judgment approach assigns a moderate status, while both the equal weighting and PCA-based methods underestimate the TP excursion, resulting in a classification of a good water status for the treated wastewater. WWQIN is 10 units higher than WWQIExp and WWQIPCA, likely due to lower heavy metal concentrations in the PER effluent and the underestimation of relatively elevated wastewater quality parameters such as COD and TN. The difference between WWQIExp and WWQIPCA is minimal, just 0.6 units (64.8 for WWQIExp and 65.4 for WWQIPCA), with both values hovering near the WWQI threshold of 65, which separates a moderate from a good water status.

5. Conclusions

The use of WWQI to access the operation of WWTPs is successfully applied to 21 treated water effluents. Generally, the status of WWTP outlets is “good” to “very good”, with the only exceptions being PDV and PAZ, for which a “moderate” status is determined, based on the WWQI.
The WWQI was computed for physical-chemical parameters, specific contaminants, a priority substance and common wastewater quality indices using the weighted approach, based on equal weighting, expert judgement and PCA estimated factor loadings. Contrary to the other published results, in the current study, the three approaches give similar results for the calculated WWQI. Based on the results obtained, it can be concluded that the expert judgment approach is more suitable for evaluating WWTP performance during a single monitoring campaign due to its simplicity compared to the PCA-based approach and its ability to prioritize specific water quality parameters over an equal weightage method. Additionally, the expert judgment approach offers greater flexibility, making it well-suited for targeted operational monitoring aimed at assessing specific types of pollution.

Author Contributions

Conceptualization, S.T., T.V. and I.B.; methodology, S.T. and T.V.; software, S.T. and I.B.; validation, S.T. and T.V.; formal analysis, S.T., T.V. and I.B.; investigation, I.B.; resources, S.T. and T.V.; data curation, T.V.; writing—original draft preparation, S.T., T.V. and I.B.; writing—review and editing, S.T., T.V. and I.B.; visualization, S.T. and I.B.; supervision, S.T. and T.V.; project administration, S.T.; funding acquisition, S.T. All authors have read and agreed to the published version of the manuscript.

Funding

This work has been carried out in the framework of the National Science Program “Environmental Protection and Reduction of Risks of Adverse Events and Natural Disasters”, approved by the Resolution of the Council of Ministers No. 577/17 August 2018 and supported by the Ministry of Education and Science (MES) of Bulgaria (Agreement No. Д01-271/09.12.2022).

Institutional Review Board Statement

Not applicable.

Informed Consent Statement

Not applicable.

Data Availability Statement

The data presented in this study are available on request from the corresponding author.

Acknowledgments

This research was funded by the National Science Program “Environmental Protection and Reduction of Risks of Adverse Events and Natural Disasters”, approved by the Resolution of the Council of Ministers No. 577/17 August 2018 and supported by the Ministry of Education and Science (MES) of Bulgaria (Agreement No. Д01-271/09.12.2022)” and the APC was partially funded by T.V. and S.T.

Conflicts of Interest

The authors declare no conflicts of interest. The funders had no role in the design of the study; in the collection, analyses, or interpretation of data; in the writing of the manuscript; or in the decision to publish the results.

References

  1. Burdon, F.; Munz, N.; Reyes, M.; Focks, A.; Joss, A.; Räsänen, K.; Altermatt, F.; Eggen, R.; Stamm, C. Agriculture versus wastewater pollution as drivers of macroinvertebrate community structure in streams. Sci. Tot. Environ. 2019, 659, 1256–1265. [Google Scholar] [CrossRef] [PubMed]
  2. Nadella, A.; Sen, D. Application of wastewater quality index (WWQI) as an evaluation tool: A case of stormwater flow channel (SWF) of Kolkata, India. Environ. Monit. Assess. 2022, 194, 80. [Google Scholar] [CrossRef] [PubMed]
  3. De Guzman, I.; Elosegi, A.; von Schiller, D.; González, J.; Paz, E.; Gauzens, B.; Brose, U.; Antón, A.; Olarte, N.; Montoya, J.; et al. Treated and highly diluted, but wastewater still impacts diversity and energy fluxes of freshwater food webs. J. Environ. Manag. 2023, 345, 118510. [Google Scholar] [CrossRef] [PubMed]
  4. Zhu, L.; Liu, J.; Xin, Y.; Yu, W.; Yu, D.; Wang, Y.; Xu, Y.; Wei, Y. Impact of the effluent of wastewater treatment plants on the water quality and ecology in receiving water bodies—A case study of Qing River. Huanjing Kexue Xuebao/Acta Sci. Circumstantiae 2023, 43, 89–99. [Google Scholar] [CrossRef]
  5. Lu, Q.; Zhao, R.; Li, Q.; Ma, Y.; Chen, J.; Yu, Q.; Zhao, D.; An, S. Elemental composition and microbial community differences between wastewater treatment plant effluent and local natural surface water: A Zhengzhou city study. J. Environ. Manag. Part A 2023, 325, 116398. [Google Scholar] [CrossRef]
  6. Khudair, B.; AL-Sulaimen, A.; Jbbar, R. Effluent Quality Assessment of Al-Diwaniyah Sewage Treatment Plant Based on Wastewater Quality Index. Int. J. Civil Eng. Technol. 2018, 9, 22–31. [Google Scholar]
  7. El Aatik, A.; Navarro, J.; Martínez, R.; Vela, N. Estimation of Global Water Quality in Four Municipal Wastewater Treatment Plants over Time Based on Statistical Methods. Water 2023, 15, 1520. [Google Scholar] [CrossRef]
  8. Council Directive 91/271/EEC of 21 May 1991 concerning urban waste-water treatment. OJ. L. 1991, 135, 40–52.
  9. Directive 2013/39/EU of the European Parliament and of the Council of 12 August 2013 amending Directives 2000/60/EC and 2008/105/EC as regards priority substances in the field of water policy. OJ. L. 2013, 226, 1–17.
  10. Ordinance N-4/2012 for Characterisation of Surface Waters. D. V. 2013, 22, 9–46. Available online: http://eea.government.bg/bg/legislation/water/Naredba13.pdf (accessed on 25 July 2024). (In Bulgarian).
  11. Raut, S.; Anaokar, G.; Dharnaik, A. Determination of Wastewater Quality Index of Municipal Wastewater Treatment Plant using Fuzzy Rule Base. Eur. J. Adv. Eng. Technol. 2017, 4, 733–738. [Google Scholar]
  12. Bharti, N.; Katyal, D. Water quality indices used for surface water vulnerability assessment. Int. J. Environ. Sci. 2011, 2, 154. [Google Scholar]
  13. Manu, D.; Thalla, A. Influence of various operating conditions on wastewater treatment in an AS-biofilm reactor and post-treatment using TiO2-based solar/UV photocatalysis. Environ. Technol. 2019, 40, 1271–1288. [Google Scholar] [CrossRef] [PubMed]
  14. Ayoub, M.; El-Morsy, A. Applying the Wastewater Quality Index for Assessing the Effluent Quality of Recently Upgraded Meet Abo El-koum Wastewater Treatment Plant. J. Ecol. Eng. 2021, 22, 128–133. [Google Scholar] [CrossRef] [PubMed]
  15. Arabzadeh, M.; Eslamidoost, Z.; Rajabi, S.; Hashemi, H.; Aboulfotoh, A.; Rosti, F.; Nazari, F.; Pouladi Borj, B.; Hajivand, M. Wastewater quality index (WWQI) as an indicator for the assessment of sanitary effluents from the oil and gas industries for reliable and sustainable water reuse. Groundw. Sustain. Dev. 2023, 23, 101015. [Google Scholar] [CrossRef]
  16. Rahmat, S.; Altowayti, W.A.H.; Othman, N.; Asharuddin, S.M.; Saeed, F.; Basurra, S.; Eisa, T.A.E.; Shahir, S. Prediction of Wastewater Treatment Plant Performance Using Multivariate Statistical Analysis: A Case Study of a Regional Sewage Treatment Plant in Melaka, Malaysia. Water 2022, 14, 3297. [Google Scholar] [CrossRef]
  17. Senila, L.; Hoaghia, A.; Moldovan, A.; Török, I.A.; Kovacs, D.; Simedru, D.; Tomoiag, C.H.; Senila, M. The Potential Application of Natural Clinoptilolite-Rich Zeolite as Support for Bacterial Community Formation for Wastewater Treatment. Materials 2022, 15, 3685. [Google Scholar] [CrossRef]
  18. Ramya, K.; Vasudevan, N. Performance evaluation of ETP from pesticide manufacturing industry by using WWQI and multivariate statistical analysis. Environ. Sci. Pollut. Res. 2019, 26, 20595–20609. [Google Scholar] [CrossRef]
  19. Ebrahimi, M.; Gerber, E.; Rockaway, T. Temporal performance assessment of wastewater treatment plants by using multivariate statistical analysis. J. Environ. Manag. 2017, 193, 234–246. [Google Scholar] [CrossRef]
  20. Aboulfotoh, A.; Heikal, G. Estimation of per Capita Loading and Treated Wastewater Quality Index in Sharkia Governorate, Egypt. J. Ecol. Eng. 2022, 23, 73–80. [Google Scholar] [CrossRef]
  21. Asgari, G.; Khazaei, M.; Seidmohammad, A.; Mansoorizadeh, M.; Talebi, S. Reclamation of treated municipal wastewater in cooling towers of thermal power plants: Determination of the wastewater quality index. Water Res. Ind. 2023, 29, 100207. [Google Scholar] [CrossRef]
  22. Jamshidzadeh, Z.; Barzi, M. Wastewater quality index (WWQI) as an assessment tool of treated wastewater quality for agriculture: A case of North Wastewater Treatment Plant effluent of Isfahan. Environ. Sci. Pollut. Res. 2020, 27, 7366–7378. [Google Scholar] [CrossRef] [PubMed]
  23. Sun, W.; Xia, C.; Xu, M.; Guo, J.; Sun, G. Application of modified water quality indices as indicators to assess the spatial and temporal trends of water quality in the Dongjiang River. Ecol. Indic. 2016, 66, 306–312. [Google Scholar] [CrossRef]
  24. Debels, P.; Figueroa, R.; Urrutia, R.; Barra, R.; Niell, X. Evaluation of water quality in the Chillian River (Central Chile) using physicochemical parameters and a modified Water Quality Index. Environ. Monit. Assess. 2005, 110, 301–322. [Google Scholar] [CrossRef]
  25. Kannel, P.R.; Lee, S.; Lee, Y.-S.; Kanel, S.R.; Khan, S.P. Application of Water Quality Indices and Dissolved Oxygen as Indicators for River Water Classification and Urban Impact Assessment. Environ. Monit. Assess. 2007, 132, 93–110. [Google Scholar] [CrossRef]
  26. Panagopoulos, Y.; Alexakis, D.E.; Skoulikidis, N.T.; Laschou, S.; Papadopoulos, A.; Dimitriou, E. Implementing the CCME Water Quality Index for the Evaluation of the Physicochemical Quality of Greek Rivers. Water 2022, 14, 2738. [Google Scholar] [CrossRef]
  27. Hu, L.; Chen, L.; Li, Q.; Zou, K.; Li, J.; Ye, H. Water quality analysis using the CCME-WQI method with time series analysis in a water supply reservoir. Water Sci. Technol. Water Suppl. 2022, 22, 6281–6295. [Google Scholar] [CrossRef]
  28. Dao, V.; Urban, W.; Hazra, S.B. Introducing the modification of Canadian water quality index. Groundw. Sustain. Dev. 2020, 11, 100457. [Google Scholar] [CrossRef]
  29. Bilgin, A. Evaluation of surface water quality by using Canadian Council of Ministers of the Environment Water Quality Index (CCME WQI) method and discriminant analysis method: A case study Coruh River Basin. Environ. Monit. Assess. 2018, 190, 554. [Google Scholar] [CrossRef]
  30. Chidiac, S.; El Najjar, P.; Ouaini, N.; El Rayess, Y.; El Azzi, D. A comprehensive review of water quality indices (WQIs): History, models, attempts and perspectives. Rev. Environ. Sci. Biotechnol. 2023, 22, 349–395. [Google Scholar] [CrossRef]
  31. Abbasi, T.; Abbasi, S. Water Quality Indices; Elsevier: London, UK, 2022. [Google Scholar]
  32. Singh, A.; Sathya, M.; Verma, S.; Jayakumar, S. Spatiotemporal variation of water quality index in Kanwar wetland, Begusarai, India. Sustain. Water Res. Manag. 2020, 6, 44. [Google Scholar] [CrossRef]
  33. Uddin, M.G.; Nash, S.; Olbert, A.I. A review of water quality index models and their use for assessing surface water quality. Ecol. Indic. 2021, 122, 107218. [Google Scholar] [CrossRef]
  34. Directive 2000/60/EC of the European Parliament and of the Council of 23 October 2000 establishing a framework for Community action in the field of water policy. OJ. L. 2000, 327, 1–73.
  35. Kachroud, M.; Trolard, F.; Kefi, M.; Jebari, S.; Bourrié, G. Water Quality Indices: Challenges and Application Limits in the Literature. Water 2019, 11, 361. [Google Scholar] [CrossRef]
  36. Oforia, S.; Agyemanb, P.; Adoteyc, E.; Růžičková, I.; Wanner, J. Assessing the influence of treated effluent on nutrient enrichment of surface waters using water quality indices and source apportionment. Water Pract. Technol. 2022, 17, 1523. [Google Scholar] [CrossRef]
  37. Abdelaziz, S.; Gad, M.; El Tahan, A. Groundwater quality index based on PCA: Wadi El-Natrun, Egypt. J. Afr. Earth Sci. 2020, 172, 103964. [Google Scholar] [CrossRef]
  38. Praus, P. Principal component weighted index for wastewater quality monitoring. Water 2019, 11, 2376. [Google Scholar] [CrossRef]
  39. Zotou, I.; Tsihrintzis, V.A.; Gikas, G.D. Performance of seven water quality indices (WQIs) in a Mediterranean River. Environ. Monit. Assess. 2019, 191, 505. [Google Scholar] [CrossRef]
  40. Mahanty, B.; Lhamo, P.; Sahoo, N.K. Inconsistency of PCA-based water quality index—Does it reflect the quality? Sci. Tot. Environ. 2023, 866, 161353. [Google Scholar] [CrossRef]
  41. Yotova, G.; Lazarova, S.; Kudłak, B.; Zlateva, B.; Mihaylova, V.; Wieczerzak, M.; Venelinov, T.; Tsakovski, S. Assessment of the Bulgarian Wastewater Treatment Plants’ Impact on the Receiving Water Bodies. Molecules 2019, 24, 2274. [Google Scholar] [CrossRef]
  42. Yotova, G.; Venelinov, T.; Tsakovski, S. Chemometric Assessment of Bulgarian Wastewater Treatment Plants’ Effluents. Molecules 2020, 25, 4408. [Google Scholar] [CrossRef] [PubMed]
  43. Yotova, G.; Lazarova, S.; Mihaylova, V.; Venelinov, T. Water quality assessment of surface waters and wastewaters by tradi-tional and ecotoxicological indicators in Ogosta River, Bulgaria. Int. J. Bioautomation 2021, 25, 25–40. [Google Scholar] [CrossRef]
  44. Venelinov, T.; Yotova, G.; Lazarova, S.; Mihaylova, V.; Tsakovski, S. Impact Assessment of the Wastewater Treatment Plants’ Discharges on Maritsa River. Int. J. Bioautomation 2021, 25, 169–182. [Google Scholar] [CrossRef]
  45. Mihaylova, V.; Yotova, G.; Kudlak, B.; Venelinov, T.; Tsakovski, S. Chemometric Evaluation of WWTPs’ Wastewaters and Re-ceiving Surface Waters in Bulgaria. Water 2022, 14, 521. [Google Scholar] [CrossRef]
  46. ISO 11923:1997; Water Quality—Determination of Suspended Solids by Filtration through Glass-Fibre Filters. ISO: Geneva, Switzerland, 1997.
  47. ISO/IEC 17025:2017; General Requirements for the Competence of Testing and Calibration Laboratories. ISO: Geneva, Switzerland, 2017.
  48. Platikanov, S.; Rodriguez-Mozaz, S.; Huerta, B.; Barceló, D.; Cros, J.; Batle, M.; Poch, G.; Tauler, R. Chemometrics quality assessment of wastewater treatment plant effluents using physicochemical parameters and UV absorption measurements. J. Environ. Manag. 2014, 140, 33–44. [Google Scholar] [CrossRef] [PubMed]
  49. Navarro, A.; Tauler, R.; Lacorte, S.; Barceló, D. Occurrence and transport of pesticides and alkylphenols in water samples along the Ebro River Basin. J. Hydrol. 2010, 383, 18–29. [Google Scholar] [CrossRef]
  50. Jolliffe, I.T. Principal Component Analysis, 2nd ed.; Springer: New York, NY, USA, 2002; pp. 1–6. [Google Scholar]
  51. Cios, K.J. Data Mining: A Knowledge Discovery Approach; Springer: New York, NY, USA, 2007. [Google Scholar]
  52. Ravikumar, P.; Aneesul Mehmood, M.; Somashekar, R. Water quality index to deter-mine the surface water quality of Sankey tank and Mallathahalli lake, Bangalore urban district, Karnataka, India. Appl. Water Sci. 2013, 3, 247–261. [Google Scholar] [CrossRef]
  53. Neary, B.; Cash, K.; H’ebert, S.; Khan, H.; Saffran, K.; Swain, L.; Williamson, D.; Wright, R. Canadian Water Quality Guidelines for the Protection of Aquatic Life; CCME Water Quality Index 1.0 Technical Report; Canadian Council of Ministers of the Environment: Winnipeg, MB, Canada, 2001. [Google Scholar]
  54. Yotova, G.; Varbanov, M.; Tcherkezova, E.; Tsakovski, S. Water quality assessment of a river catchment by the composite water quality index and self-organizing maps. Ecol. Indic. 2021, 120, 106872. [Google Scholar] [CrossRef]
  55. Liu, Z.; Zhu, H.; Cui, X.; Wang, W.; Luan, X.; Chen, L.; Cui, Z.; Zhang, L. Groundwater Quality Evaluation of the DawuWater Source Area Based on Water Quality Index (WQI): Comparison between Delphi Method and Multivariate Statistical Analysis Method. Water 2021, 13, 1127. [Google Scholar] [CrossRef]
Figure 1. Sampling map.
Applsci 14 08467 g001
Figure 2. Flow chart of WWQI calculation.
Applsci 14 08467 g002
Figure 3. Calculated WWQI values for the outlets of the investigated WWTPs (n = 21).
Applsci 14 08467 g003
Figure 4. Comparison of WWQIs calculated using expert judgement and PCA-based approaches (n = 21).
Applsci 14 08467 g004
Figure 5. Comparison of WWQIs calculated using equal weights and expert judgement approaches (n = 21).
Applsci 14 08467 g005
Table 1. Acronyms, locations, population equivalent (p.e.), discharged volumes (Q), sampling dates and the receiving surface water bodies the WWPTs discharge in.
WWTPSampling DateReceiving SWB
AcronymSampling LocationPopulation
Equivalent
Q
m3/2018
BLGBlagoevgrad87,5203,468,09813 August 2018Struma River
DMGDimitrovgrad70,3502,233,65117 August 2018Maritsa River
DPNDupnitsa55,2405,915,56613 August 2018Struma River
(through Djerman River)
GABGabrovo99,7808,458,61129 August 2018Yantra River
KNLKyustendil70,0001,587,88513 August 2018Struma River
(through Banshtnitsa River)
KZNKazanlak80,0009,988,65216 August 2018Tundhza River
LOVLovech85,6005,945,41210 August 2018Osam River
MONMontana98,6178,468,56017 August 2018Ogosta River
MZDMezdra15,984381,02817 August 2018Iskar River
PAZPazardzhik156,00031,17,42627 August 2018Maritsa River
PBNPavel Banya3000597,65616 August 2018Tundhza River
PDVPlovdiv596,00017,101,38517 August 2018Maritsa River
PERPernik82,0003,277,63214 August 2018Struma River
POPPopovo37,0001,583,87430 August 2018Cherni Lom River
PVNPleven188,00022,058,86310 August 2018Vit River
RDNRadnevo18,3461,814,12316 August 2018Maritsa River
(through Sazliyka River)
SEVSevlievo54,0003,269,42929 August 2018Yantra River
(through Rositsa River)
SMKSamokov125,0009,863,28523 August 2018Iskar River
SOFSofia2,037,000133,505,64323 August 2018Iskar River
SZGStara Zagora256,3007,671,64516 August 2018Maritsa River
(through Bedechka River)
TROTroyan80,0002,158,54110 August 2018Osam River
Table 2. Maximum allowable concentrations for the WWTPs’ effluents according to Directive 91/271/EEC (COD, TSS, TN and TP) [8], Directive 2013/39/EU (Cd, Ni and Pb) [9] and Ordinance N-4 (pH, EC and Cr) [10].
WWTPMaximum Allowable Concentrations
COD
mg/L O2
TSS
mg/L
TN
mg/L
TP
mg/L
pHEC
μS/cm
Cd
µg/L
Cr
µg/L
Ni
µg/L
Pb
µg/L
BLG125351526.5–8.57500.45323414
DMG125351526.5–8.57500.45323414
DPN125351526.5–8.57500.45323414
GAB125351526.5–8.57500.45323414
KNL125351526.5–8.57500.45323414
KZN125351526.5–8.57500.45323414
LOV125351526.5–8.57500.45323414
MON125351526.5–8.57500.45323414
MZD125351526.5–8.57500.45323414
PAZ125351016.5–8.57500.45323414
PBN125601526.5–8.57500.45323414
PDV125351016.5–8.57500.45323414
PER125351526.5–8.57500.45323414
POP125351526.5–8.57500.45323414
PVN125351016.5–8.57500.45323414
RDN125351526.5–8.57500.45323414
SEV125351526.5–8.57500.45323414
SMK125351016.5–8.57500.45323414
SOF125351016.5–8.57500.45323414
SZG125351016.5–8.57500.45323414
TRO125351526.5–8.57500.45323414
Table 3. Water quality categorization scheme.
WQIWater Status
Original Scale [53]
WQIWater Status
Modified Scale [54]
80–100Excellent80–100Very good
65–80Good65–80Good
50–65Fair0–65Moderate
25–50Poor
<25Very poor
Table 4. Physical-chemical parameters and potentially toxic elements concentration of the collected wastewater effluent samples.
WWTPpHEC
μS/cm
COD
mg/L O2
TSS
mg/L
TP
mg/L
TN
mg/L
Cr
µg/L
Cd
µg/L
Ni
µg/L
Pb
µg/L
BLG7.9138616.502.00.255.242.160.000083.360.36
DMG7.77117417.803.40.2513.402.760.000082.540.25
DPN7.8031212.703.31.391.851.450.000082.650.34
GAB8.2723210.802.42.155.4013.940.091773.520.33
KNL7.7839616.304.11.364.221.470.000081.890.72
KZN7.5745410.007.10.905.881.950.000082.870.22
LOV8.345899.612.21.634.192.090.000082.730.30
MON7.923287.222.10.865.411.170.085112.500.47
MZD8.407118.784.31.637.221.470.000081.820.24
PAZ8.233469.831.71.6114.201.770.000081.660.47
PBN8.4324823.406.21.066.112.230.000081.910.37
PDV8.2826112.009.41.708.302.900.036584.8414.45
PER8.4232312.901.22.216.201.610.000082.150.19
POP8.134859.624.02.8212.202.780.000082.420.14
PVN8.4384110.301.70.678.263.980.000081.770.57
RDN8.399918.694.51.2311.201.660.006492.150.11
SEV8.3926712.300.10.522.003.380.000089.720.17
SMK8.0187.35.693.50.714.500.510.000081.600.35
SOF7.8322219.002.10.256.602.740.000083.450.24
SZG7.9157011.101.80.256.491.660.000081.780.16
TRO8.5126210.201.40.509.581.150.091772.060.20
Table 5. Factor loadings for the first five latent factors.
PC1PC2PC3PC4PC5
pH −0.0320.0970.0210.2090.893
EC −0.1240.813−0.083−0.147−0.013
COD 0.1210.068−0.032−0.812−0.083
TSS 0.9060.116−0.0340.009−0.213
TP 0.3070.0970.2690.5890.316
TN 0.1380.845−0.0370.1070.133
Cr −0.0540.0100.933−0.0850.174
Cd 0.117−0.2230.8200.289−0.125
Ni 0.054−0.5200.179−0.4650.458
Pb 0.884−0.1280.073−0.0310.193
Eigenvalue 1.7671.7491.6631.3911.260
Explained variance % 17.6717.4916.6313.9112.60
Note: The maximum factor loadings in absolute value for each water quality parameter are given in bold.
Table 6. Relative weights assigned to the water quality parameters.
Water Quality Parameter Wi
WWQINWWQIExpWWQIPCA
pH0.10.0510.097
EC0.10.0770.102
TSS0.10.0770.092
COD0.10.1030.101
TN0.10.1030.097
TP0.10.1030.099
Cd0.10.1030.097
Cr0.10.1280.101
Ni0.10.1280.102
Pb0.10.1280.112
- w i = 1.0 w i = 1.0 w i = 1.0
Table 7. Water status classification of investigated WWTPs based on applied WWQIs and water quality parameters’ exceedings.
WWTPWWQIExpWWQIPCAWWQINExceedings
BLGApplsci 14 08467 i001Applsci 14 08467 i001Applsci 14 08467 i001
DMGApplsci 14 08467 i002Applsci 14 08467 i002Applsci 14 08467 i002EC
DPNApplsci 14 08467 i001Applsci 14 08467 i001Applsci 14 08467 i001
GABApplsci 14 08467 i002Applsci 14 08467 i002Applsci 14 08467 i002TP
KNLApplsci 14 08467 i001Applsci 14 08467 i001Applsci 14 08467 i001
KZNApplsci 14 08467 i001Applsci 14 08467 i001Applsci 14 08467 i001
LOVApplsci 14 08467 i002Applsci 14 08467 i002Applsci 14 08467 i002
MONApplsci 14 08467 i001Applsci 14 08467 i001Applsci 14 08467 i001
MZDApplsci 14 08467 i002Applsci 14 08467 i002Applsci 14 08467 i002
PAZApplsci 14 08467 i003Applsci 14 08467 i003Applsci 14 08467 i003TP, TN
PBNApplsci 14 08467 i001Applsci 14 08467 i001Applsci 14 08467 i001
PDVApplsci 14 08467 i003Applsci 14 08467 i003Applsci 14 08467 i003TP, Pb
PERApplsci 14 08467 i003Applsci 14 08467 i002Applsci 14 08467 i002TP
POPApplsci 14 08467 i002Applsci 14 08467 i002Applsci 14 08467 i002TP
PVNApplsci 14 08467 i002Applsci 14 08467 i002Applsci 14 08467 i002EC
RDNApplsci 14 08467 i002Applsci 14 08467 i002Applsci 14 08467 i002EC
SEVApplsci 14 08467 i001Applsci 14 08467 i001Applsci 14 08467 i001
SMKApplsci 14 08467 i001Applsci 14 08467 i001Applsci 14 08467 i001
SOFApplsci 14 08467 i001Applsci 14 08467 i001Applsci 14 08467 i001
SZGApplsci 14 08467 i001Applsci 14 08467 i001Applsci 14 08467 i001
TROApplsci 14 08467 i001Applsci 14 08467 i001Applsci 14 08467 i001pH
Note: Applsci 14 08467 i001—very good; Applsci 14 08467 i002—good; Applsci 14 08467 i003—moderate.
Disclaimer/Publisher’s Note: The statements, opinions and data contained in all publications are solely those of the individual author(s) and contributor(s) and not of MDPI and/or the editor(s). MDPI and/or the editor(s) disclaim responsibility for any injury to people or property resulting from any ideas, methods, instructions or products referred to in the content.

