Article

Ensuring the Quality of the Analytical Process in a Research Laboratory

1
Department of Analytical Chemistry, University of Chemical Technology and Metallurgy, 8 “St.Kl. Ohridski” Blvd, 1756 Sofia, Bulgaria
2
Department of Physics, University of Chemical Technology and Metallurgy, 8 “St.Kl. Ohridski” Blvd, 1756 Sofia, Bulgaria
*
Author to whom correspondence should be addressed.
Appl. Sci. 2024, 14(8), 3281; https://doi.org/10.3390/app14083281
Submission received: 7 March 2024 / Revised: 28 March 2024 / Accepted: 10 April 2024 / Published: 13 April 2024
(This article belongs to the Special Issue Validation and Measurement in Analytical Chemistry: Practical Aspects)

Abstract

:

Featured Application

The approaches for estimation of the analytical behavior of measuring methods could be applied in a research laboratory aiming at the characterization of new materials or a new method for analysis. The limitations of well-known approaches are described, and the alternatives are discussed.

Abstract

This paper discusses approaches for verification of methods of measurements of chemical and physical characteristics of specific samples. The limitations of well-known approaches are discussed. Some examples of alternatives are given to demonstrate specific issues encountered in the research laboratory analyzing new materials or characterizing new properties of materials. Application of sequential procedure using lower quantities of samples and reagents is presented. A standard addition to solid samples is discussed. The approach of control charts for estimation of method uncertainty for determination of plant available phosphorus is presented. The method comparison is applied as an approach to verification of alkaline reactivity by inductively coupled plasma–optical emission spectroscopy (ICP-OES) measurement, as well as density of newly synthesized chalcogenide glass materials. The presented examples demonstrated that alternative approaches are needed in order to verify the methods applied due to the great variety of activities and corresponding tasks in a research laboratory.

1. Introduction

Validation and verification of analytical methods is an important part of ensuring the quality of the obtained results and their adequate interpretation [1,2,3]. However, the recommended procedures for validation of analytical methods for testing new materials or new specific methods often pose a line of problems and require alternative approaches. The necessary analytical instrumentation, the available certified reference material (CRM), or standard procedures are among the encountered problems. Firstly, in the research laboratory, usually, the equipment is tailored to the quantity and size of the samples tested. Often, we need to scale down the procedure to lower weight or volume, which can alter the analytical behavior of the standard procedure used for CRM testing [4,5]. However, some procedures need to strictly follow the working conditions to obtain comparable results [6,7]. Secondly, the requirement to choose a CRM with characteristics as close as possible to the studied material [8,9] is often not feasible if an appropriate CRM is not commercially available. Some of the methods for characterization of mine tailings or coal combustion by-products are reported to be verified by analyzing CRM of soils or lake sediments [2,10,11]. However, soil material differs in matrix composition, state of the analytes, or their speciation and concentration ranges from the target material, and it limits the possibility of fully studying the method behavior [11]. A standard addition approach is recommended, but analyte equilibration with matrix is questionable, especially in solid samples [8,9]. Thirdly, when studying the behavior of newly developed procedures for the estimation of specific characteristics of the sample, the problems are even more pronounced. As an example, a study of alkaline reactivity of mine tailing or fly ashes as precursors for geopolymer obtaining could be mentioned [12,13]. Applying the procedure to available CRM of soils or mine tailing does not provide informative data, as the reference or consensus values are not available for this specific procedure. Fourthly, to ensure quality control, CRM and in-lab control samples could be used. However, differences in particle size in standard and testing samples highly influenced the obtained results, and sometimes they appeared non-informative to be applied for quality control [14]. In the research laboratory, typically, one analyzes a limited number of different samples in different conditions, applying modified procedures that limit the obtaining of a reasonable quantity of data for constriction of useful control charts. The mentioned problems require a more thorough estimation of method behavior and need the development of specific protocols for validation or verification.
There are many challenges in the choice of analytical methods in material science related to the study of chalcogenide glasses that find numerous specific applications in optoelectronic devices [15]. They possess promising properties such as transmission in middle and far infrared regions of spectra, lower values of phonon energies, and higher values of refractive indices compared to silicate glass. Determination of the density of chalcogenide materials from the GeTeIn system and the verification of analytical methods to ensure the quality and accuracy of the obtained results and their adequate interpretation is an important part of the characterizations of newly synthesized materials [16].
The aim of this paper is to discuss some issues and possible solutions during the process of method validation or verification in a research laboratory. The working approaches, experimental conditions, and sample availability differ from the conditions in an accredited laboratory. Nevertheless, the different aims of the research laboratory activities and the validation/verification of analytical methods are still an important part of the quality assurance of the results. The specificity of research tasks often limits the possibility of applying a complete procedure described in regulatory guides. Thus, a modification of standard operating procedures or alternative approaches is needed to keep the quality of the results under control in the research laboratory. Five cases encountered in our laboratory are presented, and approaches on how to address identified issues during quality control procedures are discussed.

2. Materials and Methods

2.1. Samples, Reagents, and Solutions

Soil, fly ash, and mine tailing samples were air-dried. Soil samples were ground to a size smaller than that of a 2 mm sieve. Fly ash and mine tailings were analyzed as received without additional grinding. All reagents used were of p.a. grade. Certified reference material clay soil was used for exchangeable P determination. Certified reference material BCR CRM 701 lake sediment (Join Research Center, European Commission, Geel, Belgium) was used for sequential extraction verification. A reference material containing 50 mg/L PO43− (Hach-Lange, Lot A0080, traceable to NIST; Hach Lange, Germany-Dusseldorf, NW)) was used for the preparation of calibration standards by appropriate dilution. A CRM 090-100G nutrients in clay soil (Lot LRAA3577, Sigma-Aldrich, St. Louis, MO, USA) were used for plant available phosphorus verification. A certified reference material (CRM) containing 1000 mg/L (TraceCert, Lot BCBV7454, Sigma-Aldrich) was used for the preparation of calibration standards for potassium determination.

2.2. Procedures

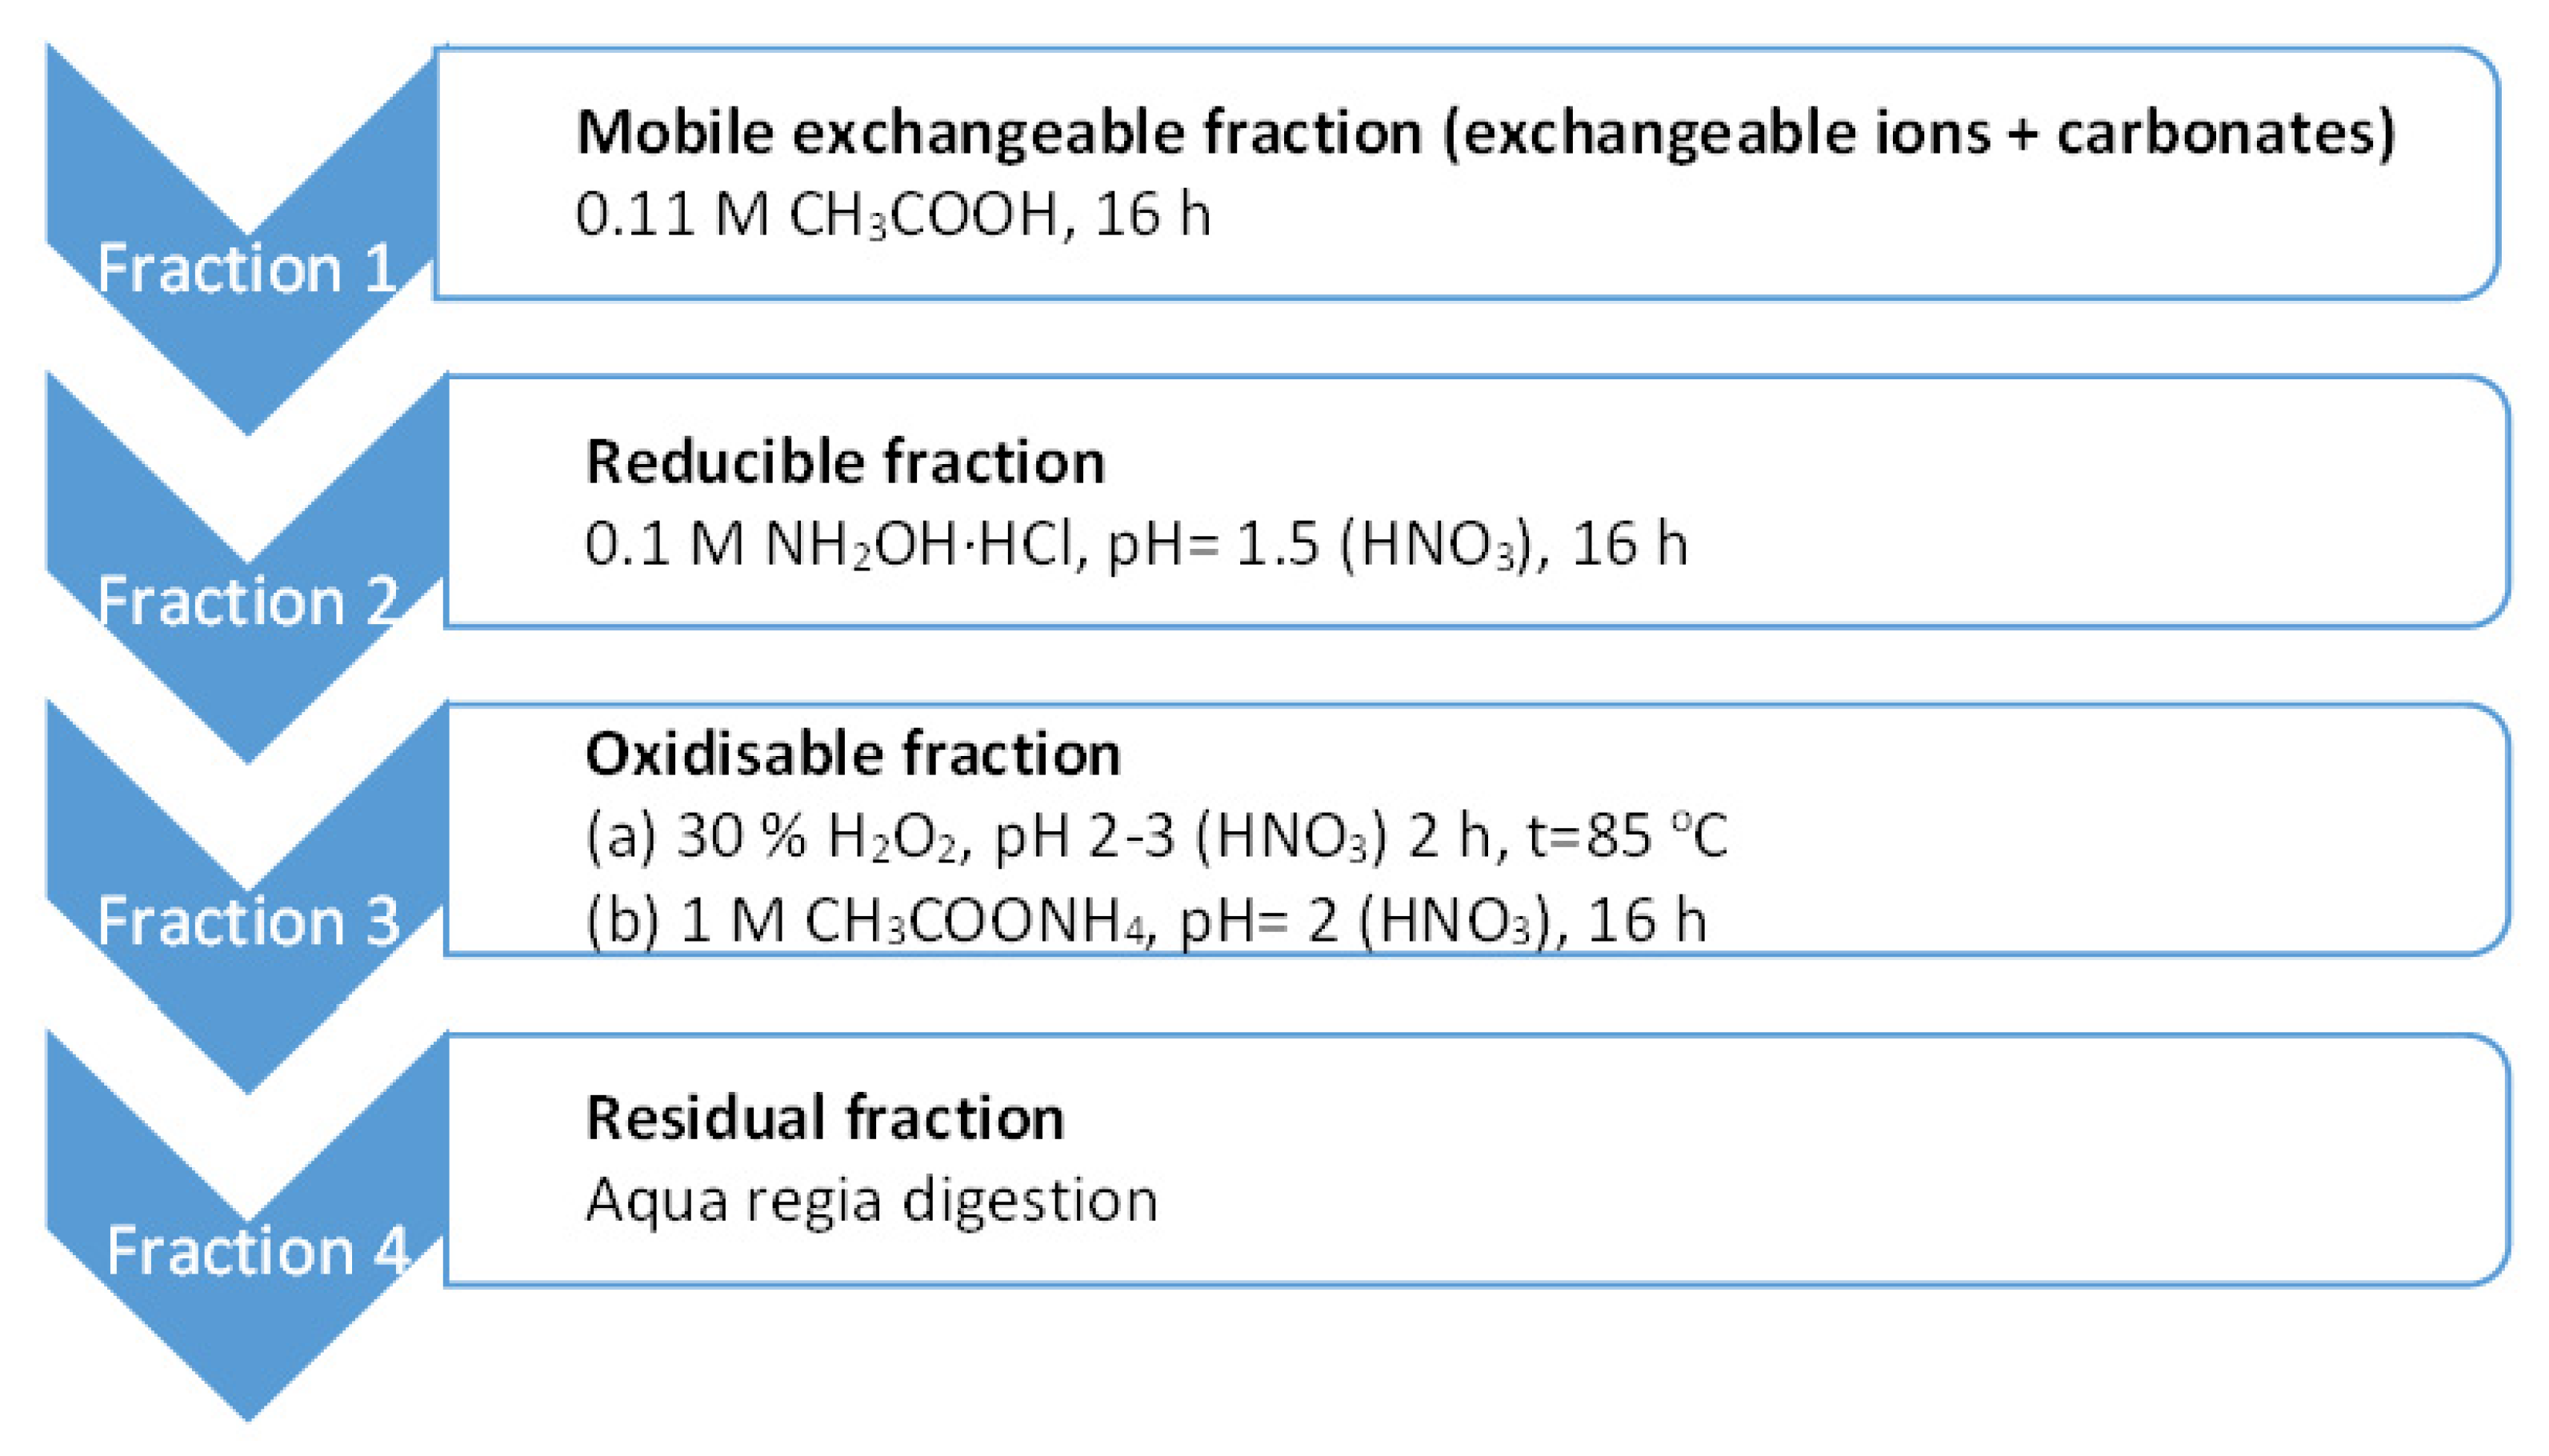
2.2.1. BCR Sequential Extraction

A four-step BCR procedure (Figure 1) was applied, and the following results of fractionalization of heavy metals were obtained: F1—exchangeable and weak acid soluble fraction, metals contained in pore solution; F2—reducible fraction contained heavy metals associated with Mn and Fe oxides and hydroxides; F3—oxidizable fraction contained heavy metals complexed in organic matter as well as bound in sulfides; F4—residual fraction contained heavy metals incorporated in silicate minerals [17]. A one-gram air-dried sample was accurately weighed and transferred to a centrifuge vessel with the appropriate volume. A volume of 40 mL of 0.11 M acetic acid was added, and the sample was agitated for 16 h on a reciprocal shaker (30 rpm) at 25 °C. The supernatant was separated by centrifugation at 3000 rpm for 20 min. The supernatant was transferred to a dry vessel and kept at 4 °C till analysis. The solid residue was washed with distilled water [18]. A volume of 40 mL of 0.5 M NH2OH·HCl (adjusted to pH = 1.5 with HNO3, daily prepared) was added to the solid residue, and the extraction continued as described above. A volume of 10 mL of 8.8 M H2O2 was added to the washed residue and digested for 1 h at 25 °C and then for 1 h at 85 °C in a water bath with a second volume of H2O2. The solution was evaporated to a few milliliters. Then, 50 mL of 1 M NH4OAc (adjusted to pH = 2.0 with HNO3) was added, and the mixture was shaken for 16 h at 25 °C. The supernatant was separated. The final residue was dried at 120 °C for two hours. A total of 0.5 g of the dry residue was subjected to open-vessel aqua regia digestion for 30 min without boiling. The solution was filtered and diluted to the final volume of 50 mL in a volumetric flask.
The obtained solutions were sent for ICP-OES determination of heavy metal content.

2.2.2. Determination of Extractable K and P in Arable Soil

The detailed procedure for the determination of plant-available K and P in arable soil using a double buffer extraction system was described in [14,19]. This method was based on calcium lactate/ammonium acetate buffer extraction modified to present sufficient buffer capacity to maintain the extraction conditions in a large variety of soil samples. The extraction was performed at a 1:25 solid-to-liquid ratio for 1 h at 20–25 °C. Potassium in the obtained extract was determined by the low-temperature flame atomic emission spectrometry. Phosphate ions in the extract were quantified spectrophotometrically following the molybdenum blue method. The external standard method was used for calibration in both cases. Each sample was analyzed in duplicates. The control soil sample was run in each batch of 14 real soil samples.

2.2.3. Determination of Alkaline Reactivity of Raw Materials Intended for Geopolymerisation

The detailed procedure for the determination of alkaline reactivity of fly ash and mine tailing was described in [20]. An accurately weighed sample of one gram was transferred into a plastic beaker, and 20 mL of 3.0, 6.5, or 10 M NaOH were added to each sample. The samples were agitated on a reciprocal shaker at 100 rpm for 10 min, 30 min, 60 min, 4 h, 24 h, 48 h, and 72 h. After the specified time, the samples were centrifuged for 5 min at 6000 rpm. A volume of 15.0 mL of the obtained supernatant was filtered and transferred into a 50.00 mL volumetric flask containing 10 mL of distilled water and 15 mL of conc. HNO3. The obtained solutions were diluted to volume by distilled water and sent to ICP-OES for measurement of the concentration of dissolved Al and Si.

2.3. Statistical Treatment of Experimental Data

Trueness of the analytical method was estimated as bias or recovery according to the equations below [21]:
R = X m e a n X c e r t i f i e d × 100
R = X 2 X 1 X s t . a d . × 100
where Xmean is an experimental mean result; Xcertified—certified content or concentration; X2—mean result after standard addition to the sample; X1—mean result before standard addition to the sample; Xst.ad.—concentration of the analyte in standard addition.
The uncertainty of the bias was determined by analyzing CRM or the standard addition approach. Each sample was analyzed in triplicate, and the standard deviation (SD) was calculated.

2.4. Chalcogenide Glasses

2.4.1. Samples

The masses of the substances of the prepared two compositions (GeTe4)95In5 and (GeTe4)90In10 were measured with an Ainsworth DE-310 balance (Ainsworth, Toronto, ON, Canada) with an accuracy of 0.001 g and placed in quartz ampoules. The ampoules were sealed and placed in a programmable oven Beta—electric Vector 1, Vecon 10. The synthesis process lasted 10 h at a speed of 3 °C/minute, reaching the final temperature of 1101 °C. Finally, the quartz ampoules were allowed to cool inside the oven.

2.4.2. Determination of Density

The density of chalcogenide glasses was determined following pycnometric and hydrostatic methods based on “Archimedes’ principle”. Both methods are widely used because they allow for the density to be measured directly without altering or damaging the sample, which preserves the integrity of sensitive or valuable substances when sample preservation is important. The procedure with a pycnometer is based on a relatively simple principle, making it accessible to a wide range of users. It can provide accurate and reliable results and also offer good repeatability and reproducibility of density measurements.
The measurement procedure consisted of weighing the sample by Ainsworth DE-310 balance. The sample’s density was calculated as follows [22]:
ρ = m m 0 × ρ 0
where m was the mass of the solid of the determined volume; m0—the mass of water having the same volume; ρ the density of the solid; ρo—the density of the water at the temperature of the experiment.
The hydrostatic balance method or Mohr balance was used to determine the density of glass in the solid state and in the molten state at high temperature. The chalcogenide glass sample was weighed successively on hydrostatic balance Mettler Toledo ME104 (Mettler Toledo Inc, Greifensee, Switzerland) in air and liquid. Then, the density was calculated as follows [22]:
ρ = m 1 m 1 m 2 ρ 1 ρ 2 + ρ 2
where m1—the mass of the studied sample in air, g; m2—the mass of the sample studied in the calibration liquid, g; ρ 1—the density of the liquid at the temperature of the experiment, kg/m3; ρ 2—air density at the experiment temperature, kg/m3.
Both methods used distilled water as the immersion fluid when determining the density of samples from the Ge-Te-In system.

3. Results

3.1. Scaling down the Standard Operating Procedure (SOP)—Sequential Extraction of Mine Tailing and Fly Ash

BCR sequential procedure allowed the mobility of heavy metals to be estimated. In the process of valorization of industrial waste and assessment of the environmental effect, the interest in sequential extraction constantly increased. However, two main problems could be encountered during the attempts to verify the procedure in the research laboratory: (1) the volume of the used equipment was too specific for the standard operation procedure of BCR sequential extraction and could substantially differ from the available instrumentation (80–100 mL centrifuge tubes and corresponding centrifuge were needed); and (2) the available CRM was lake sediment from a highly contaminated region, whose chemical, mineralogical, and particle-size compositions could differ greatly from the target materials’.
BCR sequential extraction procedure was applied to copper mine tailings from Bulgaria to study heavy metal distribution in geochemical fractions. The results are presented in Table 1. However, the BCR procedure was modified by lowering the quantity of the sample but preserving the solid-to-liquid ratio. This modification allowed for the available equipment to be used. The scaled-down procedure could be expected to influence the recovery of heavy metals in each step of the BCR procedure [4,5]. To verify the procedure, CRM BCR 701 was analyzed along with mine tailing samples. The results are presented in Figure 2 and Table 1 and Table 2. It can be seen from this figure that the total content of heavy metals corresponded to the CRM values with the uncertainty limits. The mean values in steps 1 and 2 coincided with the certified values. However, individual recoveries in some cases at steps 3 and 4 were unsatisfactory. It could be supposed that the discrepancy could be due to the modification of the BCR procedure or to the matrix effect during ICP-OES measurement [7]. The sequential extraction results were often reported as a comparison of the concentrations of heavy metals in different fractions. Thus, the heavy metal order obtained experimentally by analyzing CRM was compared with the order of the certified concentrations (Table 2). Nevertheless, judging by the discrepancy in a part of the individual recoveries, it could be seen that the abundance of heavy metal in BCR fractions based on experimental and certified concentrations followed the same trend. It could be pointed out that the BCR CRM 701 presented a lake sediment that differed in its chemical and mineralogical composition from the studied material—mine tailings. Thus, the verification of the BCR method by CRM 701 could only approximately estimate the method behavior of real samples. The results presented in Table 1 showed that iron was the most abundant metal in the studied sample, and Cd and Ni were below the method’s LOD. The metals in mine tailing were arranged according to the concentration of extractable species (Table 2); CRM results were also presented for comparison.

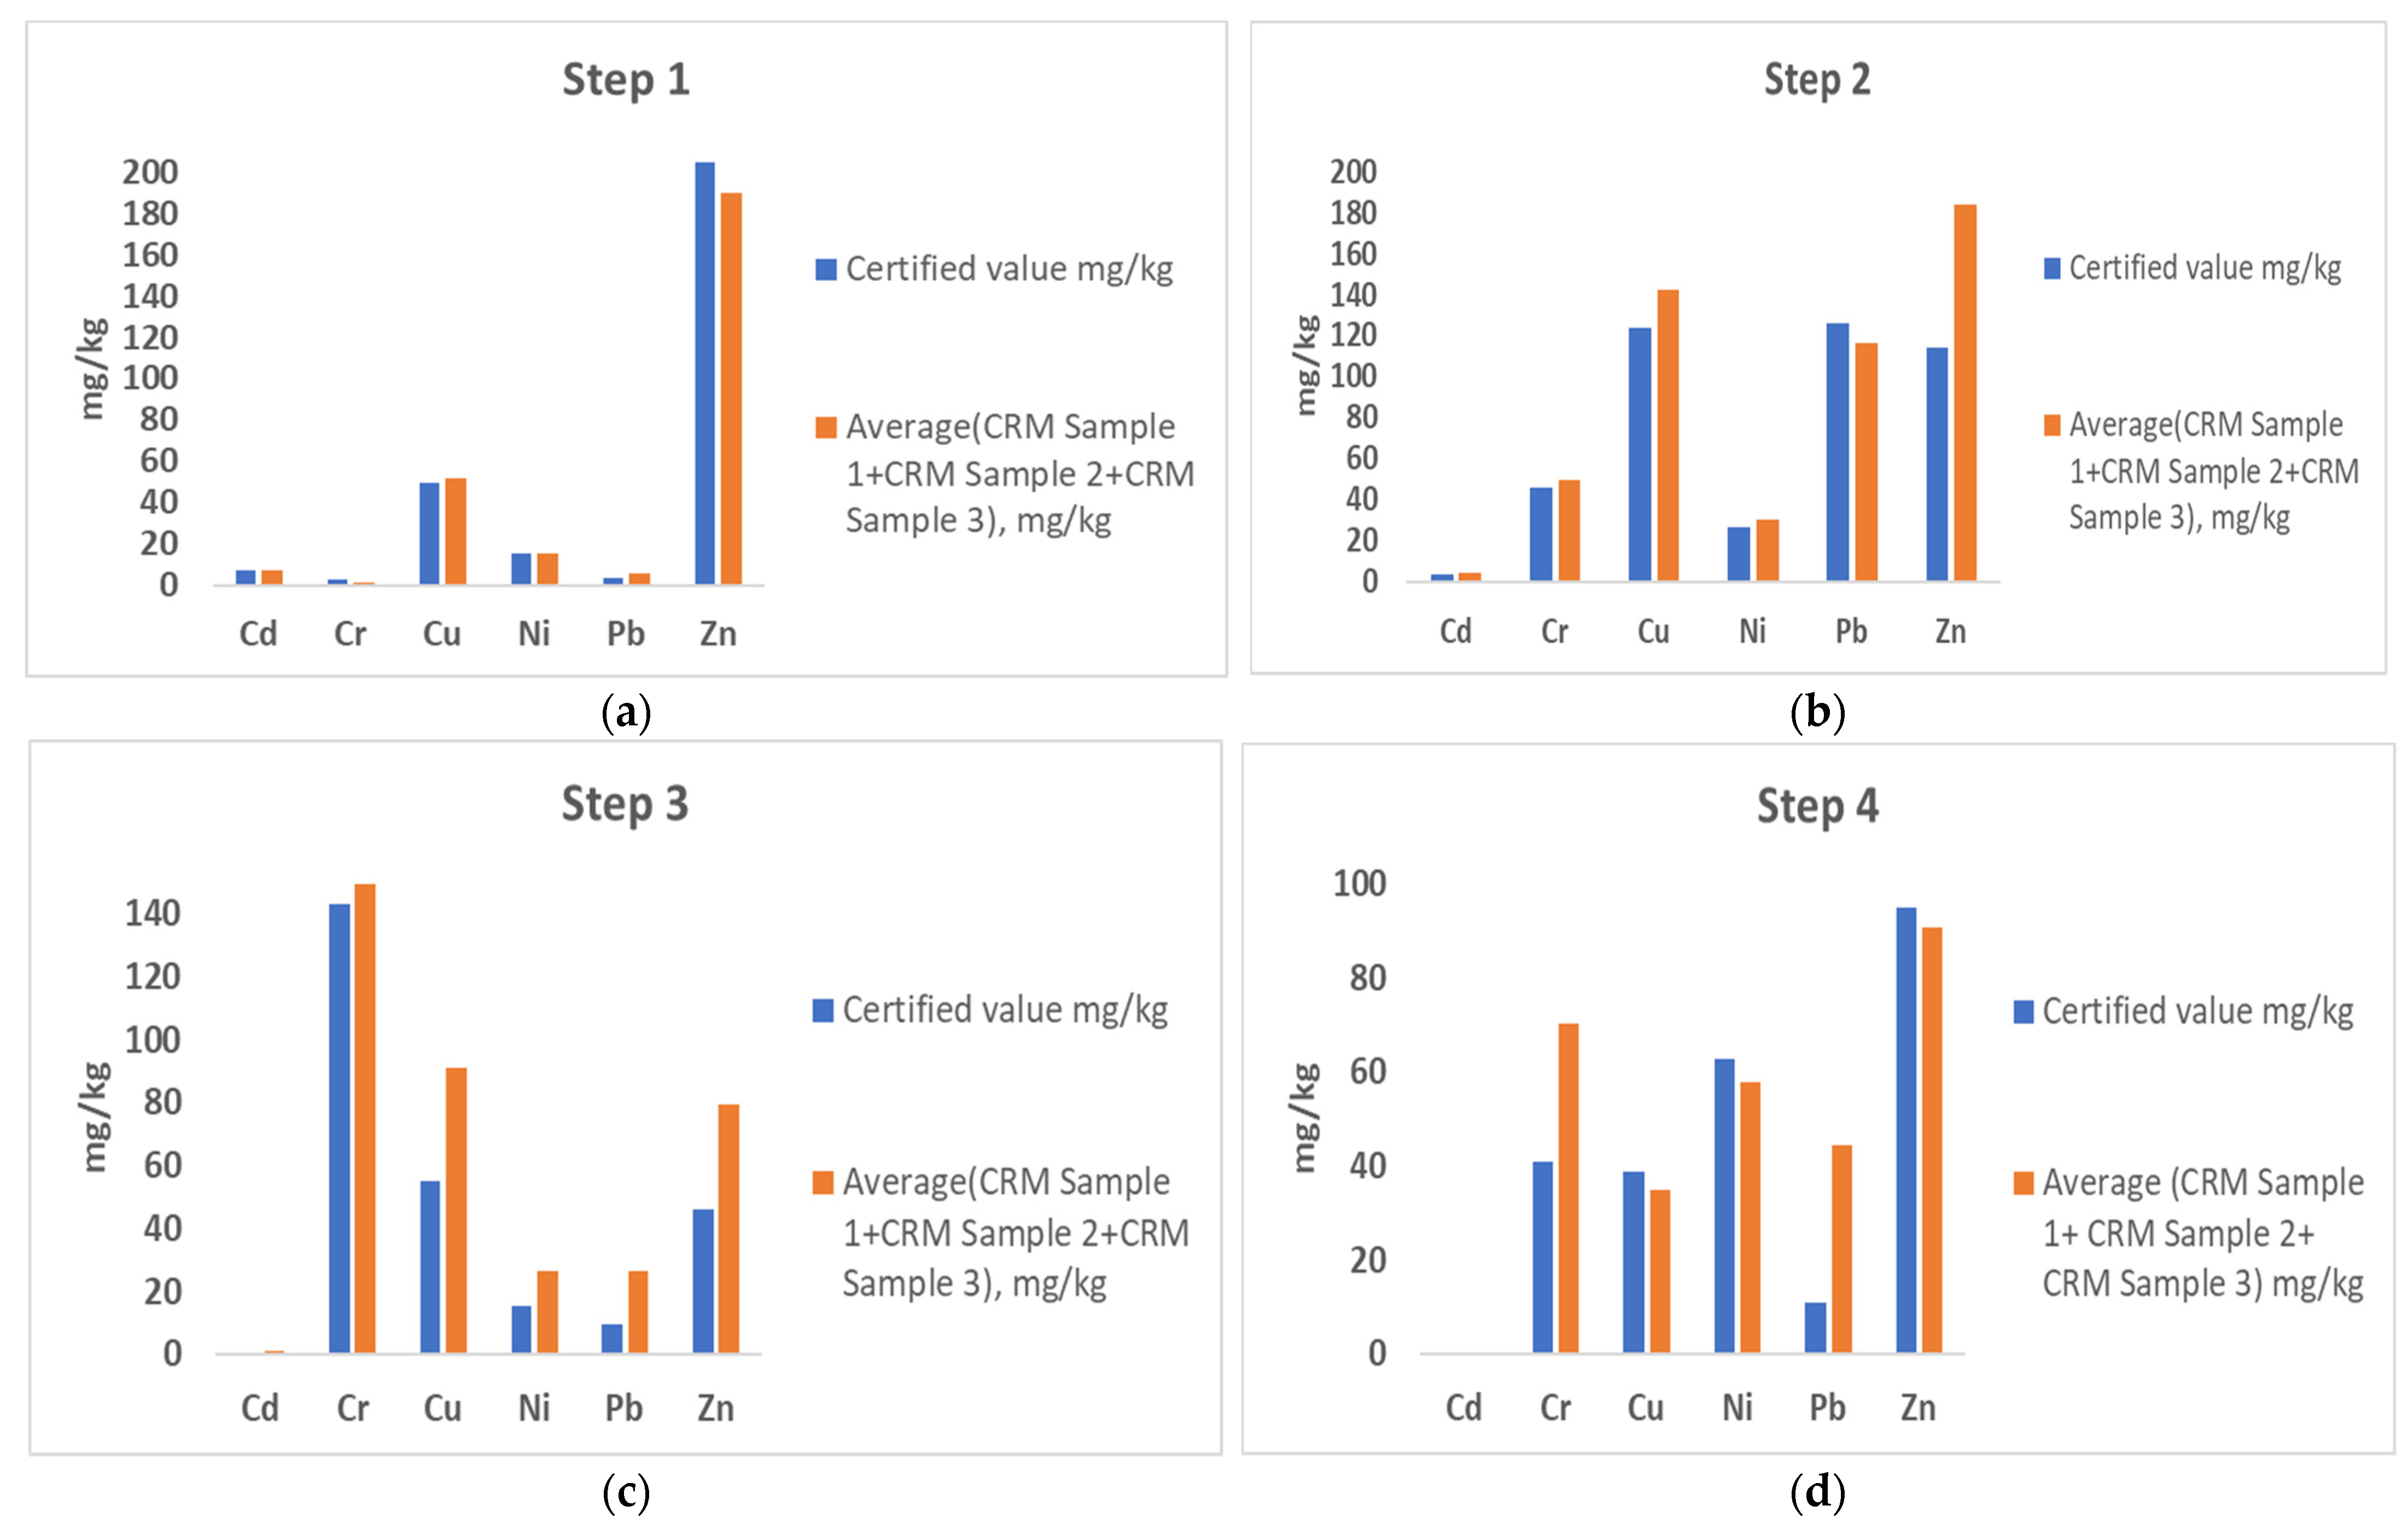
3.2. Standard Addition Approach as a Solution to Lack of Suitable CRM for Trueness Estimation

The second case presented a problem with available CRM and a standard addition as an approach to solve it. The aim was to estimate the trueness of a method for the determination of plant available K and P in arable soils. The method applied followed a specific procedure for extraction followed by well-established flame atomic emission spectrophotometry for K quantification and spectrophotometry for P determination in extracts. Due to the lack of soil CRM for extractable P and K by lactate/acetate reagent, the standard addition approach was applied to estimate the method bias. The results are presented in Table 3. The addition of an aliquot of a standard solution of K was performed on a dry, solid soil sample. The sample was homogenized and left to equilibrate for 6 days. Thus, prepared samples were analyzed following the lactate/acetate procedure. As can be seen from Table 3, the determination of extractable K in soil was performed with 87% recovery. Due to the questionable chemical equilibrium of K added to the solid dry sample, the obtained bias appeared to be an approximate estimate of the bias of the method for determination of the available potassium in soil samples. However, in the case of available P determination, it was found that standard addition before extraction could not be applied due to the very strong fixation of P in the soil matrix. The recovery obtained was 17%. Thus, the standard addition was made after extraction to the obtained solution, and the recovery was 96%. It allowed us to estimate the bias of the measurement step and, thus, only partially the method bias. The uncertainty of the bias of measurement was typically lower, and it could result in underestimation of the expanded method uncertainty calculated following the method validation and quality control approach [21]. The efficiency of extracting solution depended not only on its composition and procedure used but on the soil type and its physical and chemical properties.
According to [21,23], the CRM should be chosen with characteristics as close as possible to the studied material. However, often, an appropriate CRM is not commercially available. We encountered two problems: (1) analyzing CRM of soils with various characteristics was a well-spread procedure for estimating the analytical behavior of the applied method for testing mine tailings; however, the discrepancy of the matrix composition or analytes content, as well as their state and speciation of the sample, did not allow for the method behavior to be fully studied; (2) although a large variety of soil CRM was available, the extractable forms of plant nutrients depended on a specific procedure and often certified concentration following the same procedure were not available. A standard addition approach could help for at least an approximate estimation of the uncertainty of measurement. However, it could be noted that it was difficult to control the chemical equilibrium of the added analyte with the matrix. Thus, the state of the added analyte could differ from its state in the CRM sample or testing samples, especially in solid samples.
An advantage of the standard addition approach was that performing additions at different stages of the whole procedure allowed us to estimate the bias contribution of a specific step to the overall bias. Standard addition before the extraction allowed for the estimation of bias of the whole procedure. The efficiency of extracting solution depended not only on the composition of the reagents and procedure used but also on the soil type and its physical and chemical properties. Thus, the trueness could be evaluated in sample types usually encountered in the laboratory. A significant limitation of the standard addition approach was the fact that the spiked analyte could not completely reach equilibrium with the soil sample.

3.3. A New Specific Procedure—Alkaline Reactivity of Mine Tailings and Fly Ash

The third case was studying the behavior of newly developed procedures for the estimation of specific characteristics of the sample. A study of the alkaline reactivity of mine tailing or fly ashes as precursors for geopolymer obtaining is presented here. In this case, the problems with method validation or verification were even more pronounced. Applying the procedure to available CRM of soils or mine tailing did not provide informative data, as the reference or consensus values were not available for this specific procedure.
The main problems encountered during the determination of alkaline reactivity were related to the ICP-OES measurements, on the one hand, and quality control, on the other hand. High salt content, matrix effect, and high concentration of the target components appeared to be important problems during the ICP-OES measurement [7,24,25]. Appropriate dilution solved the problem with high salt content and working concentration range; however, an increased uncertainty could be expected. The matrix effect was found to be pronounced, especially at the higher concentration limit of the calibration curve (Table 4). The matrix-matched calibration was applied to correct the deviations due to the matrix effect.
The quality control was problematic as no standard procedure or CRM for alkaline reactivity were available. Two approaches were applied. First, a comparison was made with a partner laboratory to verify the data from ICP-OES measurements. Although the results differed in absolute concentration values due to different instrumentations, observation modes, and calibration methods, the concentration variations with time and alkali concentrations followed the same trend. This approach allowed at least the partial verification of the procedure performed in our laboratory. An alternative approach was to study the behavior of pure components and phases of the sample in the tested media. However, we found that we were scaling up the method, and the obtained data could only roughly present the behavior of the method in the tested materials.

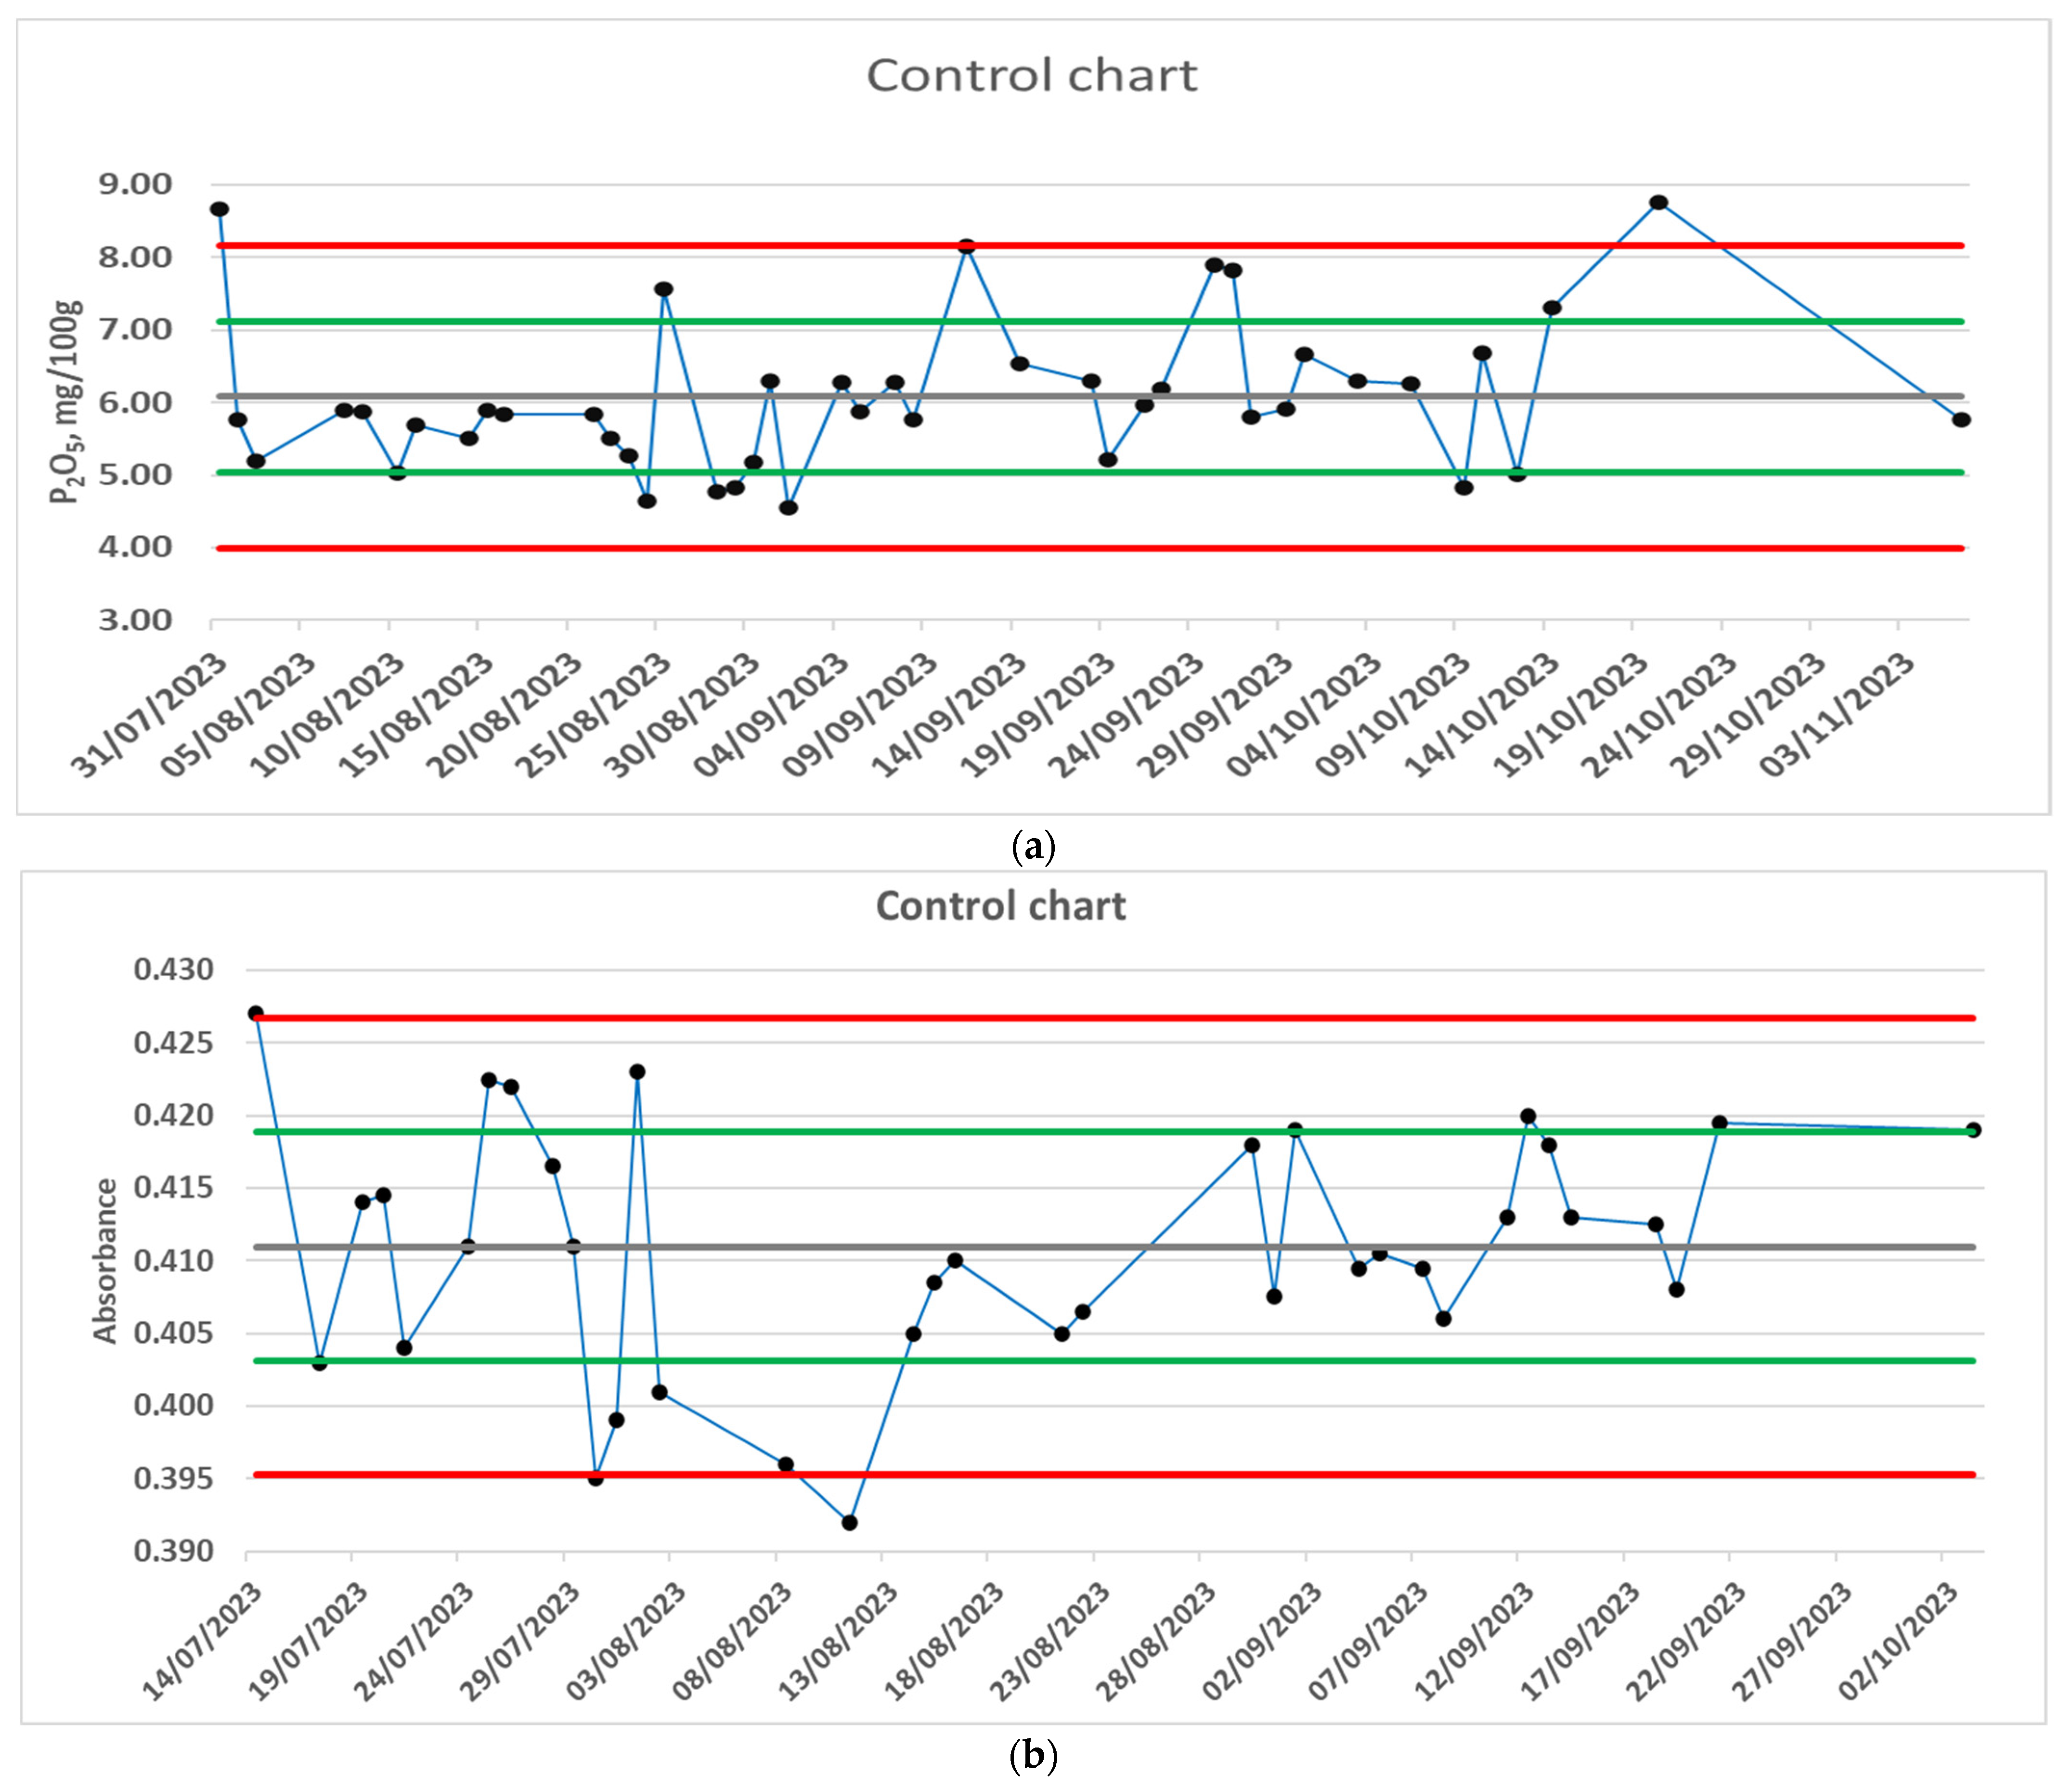
3.4. Quality Control—In-Lab Control Sample

To ensure quality control, CRM and in-lab control samples were used. However, we found that the differences in particle size in standard and testing samples highly influenced the obtained results, and sometimes, they appeared non-informative to be applied for quality control.
A reproducibility of a method for plant available determination of P in soil was studied on CRM clay soil (CRM 090 Nutrients in clay soil Lot LRAA3577, Sigma-Aldrich; particle size < 100 µm) and a regular soil sample (particle size < 2 mm). The results showed that the SD of the results obtained by analyzing CRM was three times lower than the SD of real samples. The increased precision of CRM results may be due to the high homogeneity of the sample and lower particle size. However, it differed from the application of the method to real samples and could lead to underestimation of the effect of random factors on the results. Thus, a pooled in-lab control sample was a preferable approach for a research laboratory where a limited number of various samples should be tested. The obtained control charts for available P in soil samples are presented in Figure 3.
In the research laboratory, typically, one analyzes a limited number of different samples in different conditions by applying modified procedures, which limit the obtaining of a reasonable quantity of data for constriction of useful control charts.

3.5. Density of Chalcogenide Glasses

The density of chalcogenide glasses (ChG) can vary depending on their specific composition and preparation methods [26]. However, in general, chalcogenide glasses tend to have higher densities compared to traditional oxide-based glasses. The higher density of chalcogenide glasses can be attributed to the heavier elements present in their composition due to their higher atomic masses compared to the primarily oxygen-based composition of oxide-based glasses. It is important to note that the density of a specific ChG can also be influenced by other factors.
There are many sources of error during measurements. Random errors are possible due to various factors such as instrumentation limitations, environmental fluctuations, or human error. Averaging multiple measurements helps reduce the impact of these random errors. The main parameters of influence and error sources in determining density are air pressure, temperature, volume difference in the plunging body, surface tension of liquid, air bubbles, immersion depth of the sample cup or immersion body, and bulk porosity. In data analysis, averaging refers to the process of determining the arithmetic mean of a set of numerical values [27]. The obtained results are presented in Table 5 and Supplementary Materials. When measuring the density by both methods, the absolute error was compared. A hydrostatic balance and analytical balance were with the same accuracy Δm = 0.0001 g.

4. Discussion

The present study summarized some problems and approaches to their solution in the process of ensuring the quality of results in our research laboratory. The motivation behind this study was the fact that the research laboratory performs a wide range of specific analyses, and the official guides [1,23] for analytical method validation often could not address the entire range of issues encountered. In the research laboratory, the equipment is usually tailored to the quantity and size of the samples tested. Often, an appropriate scale-down of the analytical procedure to lower weight or volume is needed. However, it was demonstrated that the modification could alter the analytical behavior of the standard procedure used for CRM testing, as, for example, BCR sequential extraction for heavy metals fractionalization study [4,6,27]. Additionally, during the development of new and innovative materials, a specific analytical procedure should be developed. Often, the new or modified procedure could be only partially verified due to the lack of an appropriate CRM or well-established procedure. The example discussed here presents a study of the alkaline reactivity of geopolymer precursors as coal-combustion by-products and mine tailings. Although intensively applied, no verification data were published. Moreover, the procedures broadly differ in experimental conditions as a solid-to-liquid ratio, concentration, time of test, and instrumental method applied, thus posing a limitation of the comparability of the results [12,13,28]. Additionally, samples in the research laboratory are often limited in quantity, size, or number. It limits the preparation of adequate quality control charts. The recommended approach is based on the pooled sample and has the advantage of covering the range of sample characteristics for a specific object of analysis more fully [21,23].
The cross-validation of measurement of the density of newly synthesized materials is demonstrated by a comparative study approach. In this study, two different methods were applied by the same operators in the same laboratory; however, different methods and instruments were used. The obtained results showed a difference in the obtained values for the density of samples with the same composition measured by pycnometer and hydrostatic balance methods. The difference in the obtained results was the highest for the samples with composition G e T e 4 90 I n 10 . Thus, applying alternative approaches to measure density could provide complementary benefits and improve confidence in measuring density. The increased discrepancy in the measured values imposed for cross-validation of the measurement of the density of newly synthesized materials. By comparing the results obtained by the two techniques, it was possible to identify any inconsistencies or errors in any of the methods. Moreover, more appropriate measurement techniques for specific samples could be revealed. Some samples may have unique characteristics that make one method more suitable than the other. By employing both techniques, it could be ensured that different aspects and potential limitations were considered during sample characterization. The comparative study could result in a better understanding of the density particularities of new materials. Additionally, the obtained results were reliable enough to replace one method with another. Hydrostatic balances are more expensive and not easily available. In contrast, every laboratory has an analytical balance, and the pycnometer is a very cheap device. The pycnometer gives a direct volume-based measurement, while the hydrostatic balance offers a weight-based approach. By combining the two results, a more complete and in-depth assessment of the density of the sample could be obtained. Thus, in the case of density characterization of newly synthesized materials, applying alternative approaches to verify the obtained results should be a recommended practice.
The results presented in this study demonstrated the application of alternative approaches for verifying measurements with their limitations and advantages. Thus, the discussed issues showed that the characterization of new materials imposed the need for specific procedures for method verification in the research laboratory.

Supplementary Materials

The following supporting information can be downloaded at: https://www.mdpi.com/article/10.3390/app14083281/s1. Table S1: Control card Figure 3 Data: (a) standard solution 0.6 mg/L P2O5; Table S2: In-lab control sample—arable soil (Figure 3 data); Table S3: Density of ( G e T e 4 ) 95 I n 5 ; Table S4: Density of (GeTe4)95In10; Table S5: Density determined by pycnometer.

Author Contributions

Data curation, V.I., O.S. and K.C.; investigation, L.A., D.I. and K.C.; methodology, A.S. and D.I.; resources, A.S., V.I. and K.C.; supervision, A.S.; validation, L.A. and D.I.; visualization, L.A., V.I., O.S. and K.C.; writing—original draft, A.S., L.A. and V.I.; writing—review and editing, A.S. and V.I. All authors have read and agreed to the published version of the manuscript.

Funding

This research was funded by the BULGARIAN NATIONAL RECOVERY AND RESILIENCE PLAN, grant number BG-RRP-2.004-0002-C01, project BiOrgaMCT, Procedure BG-RRP-2.004 “Establishing of a network of research higher education institutions in Bulgaria”.

Institutional Review Board Statement

Not applicable.

Informed Consent Statement

Not applicable.

Data Availability Statement

The data presented in this study are available in Supplementary Materials.

Conflicts of Interest

The authors declare no conflicts of interest. The funders had no role in the design of this study, in the collection, analyses, or interpretation of data, in the writing of the manuscript, or in the decision to publish the results.

References

  1. Konieczka, P.; Namiesnik, J. Quality Assurance and Quality Control in the Analytical Chemical Laboratory, 2nd ed.; CRC Press: Boca Raton, FL, USA; Taylor and Francis Group: Abingdon, UK, 2018. [Google Scholar] [CrossRef]
  2. Søndergaard, J.; Hansen, V.; Bach, L.; Jørgensen, C.J.; Jia, Y.; Asmund, G. Geochemical Test Work in Environmental Impact Assessments for Mining Projects in Greenland—Recommendations by DCE and GINR; Technical Report No. 132; Aarhus University, DCE—Danish Centre for Environment and Energy: Aarhus, Denmark, 2018; 46p, Available online: http://dce2.au.dk/pub/TR132.pdf (accessed on 12 December 2023).
  3. Matabane, D.; Codeto, T.; Mampa, R.; Ambushe, A. Sequential Extraction and Risk Assessment of Potentially Toxic Elements in River Sediments. Minerals 2021, 11, 874. [Google Scholar] [CrossRef]
  4. Sagagi, B.; Davidson, C.; Hursthouse, A. Adaptation of the BCR sequential extraction procedure for fractionation of potentially toxic elements in airborne particulate matter collected during routine air quality monitoring. Int. J. Environ. Anal. Chem. 2019, 101, 956–968. [Google Scholar] [CrossRef]
  5. Ciceri, E.; Giussani, B.; Pozzi, A.; Dossi, C.; Recchia, S. Problems in the application of the three-step BCR sequential extraction to low amounts of sediments: An alternative validate route. Talanta 2008, 76, 621–626. [Google Scholar] [CrossRef] [PubMed]
  6. Sutherland, R.A. BCR®-701: A review of 10-years of sequential extraction analyses. Anal. Chim. Acta 2010, 680, 10–20. [Google Scholar] [CrossRef] [PubMed]
  7. Heltai, G.; Fekete, I.; Halász, G.; Kovács, K.; Horváth, M.; Takács, A.; Boros, N.; Győri, Z. Multi-elemental inductively coupled plasma-optical emission spectroscopic calibration problems of the sequential extraction procedure for the fractionation of the heavy metal content from aquatic sediments. Hung. J. Ind. Chem. 2015, 43, 7–13. [Google Scholar] [CrossRef]
  8. Kruve, A.; Rebane, R.; Kipper, K.; Oldekop, M.-L.; Evard, H.; Herodes, K.; Ravio, P.; Leito, I. Tutorial review on validation of liquid chromatography–mass spectrometry methods: Part I. Anal. Chim. Acta 2015, 870, 29–44. [Google Scholar] [CrossRef]
  9. Kruve, A.; Rebane, R.; Kipper, K.; Oldekop, M.-L.; Evard, H.; Herodes, K.; Ravio, P.; Leito, I. Tutorial review on validation of liquid chromatography–mass spectrometry methods: Part II. Anal. Chim. Acta 2015, 870, 8–28. [Google Scholar] [CrossRef]
  10. Kumkrong, P.; Dy, E.; Tyo, D.D.; Jiang, C.; Pihilligawa, I.G.; Kingston, D.; Mercier, P.H.J. Investigation of metal mobility in gold and silver mine tailings by single-step and sequential extractions. Environ. Monit. Assess. 2022, 194, 423. [Google Scholar] [CrossRef] [PubMed]
  11. Cappuyns, V.; Swennen, R.; Niclaes, M. Application of the BCR sequential extraction scheme to dredged pond sediments contaminated by Pb–Zn mining: A combined geochemical and mineralogical approach. J. Geochem. Explor. 2007, 93, 78–90. [Google Scholar] [CrossRef]
  12. Obenaus-Emler, R.; Falah, M.; Illikainen, M. Assessment of mine tailings as precursors for alkali-activated materials for on-site applications. Constr. Build. Mater. 2020, 246, 118470. [Google Scholar] [CrossRef]
  13. Nikvar-Hassani, A.; Vashaghian, H.; Hodges, R.; Zhang, L. Production of green bricks from low-reactive copper mine tailings: Chemical and mechanical aspects. Constr. Build. Mater. 2022, 324, 126695. [Google Scholar] [CrossRef]
  14. Angelova, L.; Genova, N.; Pencheva, G.; Statkova, Y.; Yotova, V.; Surleva, A. Contribution to the Molybdenum Blue Reaction and its Application in Soil Analysis. Methods Objects Chem. Anal. 2022, 17, 59–69. [Google Scholar] [CrossRef]
  15. Singh, P.K.; Dwivedi, D.K. Chalcogenide glass: Fabrication techniques, properties and applications. Ferroelectrics 2017, 520, 256–273. [Google Scholar] [CrossRef]
  16. Kadono, K.; Kitamura, N. Recent progress in chalcogenide glasses applicable to infrared optical elements manufactured by molding technology. J. Ceram. Soc. Jpn. 2022, 130, 584–589. [Google Scholar] [CrossRef]
  17. Perez-Moreno, S.M.; Gazquez, M.J.; Perez-Lopez, R.; Bolivar, J.P. Validation of the BCR sequential extraction procedure for natural radionuclides. Chemosphere 2018, 198, 397–408. [Google Scholar] [CrossRef] [PubMed]
  18. Rauret, G.; López- Sánchez, J.F.; Lück, D.; Yli-Halla, M.; Muntau, H.; Quevauviller, P. The certification of the extractable contents (mass fractions) of Cd, Cr, Cu, Ni, Pb and Zn in freshwater sediment following a sequential extraction procedure BCR-701. In European Commission Directorate-General for Research 2001; European Commission: Brussels, Belgium, 2001. [Google Scholar]
  19. Angelova, L.; Genova, N.; Stoyanova, S.; Surleva, O.; Nekov, I.-H.; Ilieva, D.; Surleva, A. Comparative study of soil test methods for determination of plant available potassium in Bulgarian arable soils. Anal. Control. 2021, 25, 182–192. [Google Scholar] [CrossRef]
  20. Ilieva, D.; Angelova, L.; Radoykova, T.; Surleva, A.; Chernev, G.; Vizureanu, P.; Burduhos-Nergis, D.D.; Sandu, A.V. Characterization of Bulgarian Copper Mine Tailing as a Precursor for Obtaining Geopolymers. Materials 2024, 17, 542. [Google Scholar] [CrossRef] [PubMed]
  21. Magnusson, B.; Örnemark, U. (Eds.) EURACHEM Guide: The Fitness for Purpose of Analytical Methods—A Laboratory Guide to Method Validation and Related Topics, 2nd ed.; 2014; Available online: https://www.eurachem.org (accessed on 20 November 2023).
  22. Gupta, S.V. Practical Density Measurement and Hydrometry, 1st ed.; IoP: Bristol, UK; CRC Press: Boca Raton, FL, USA, 2002. [Google Scholar]
  23. Bettencourt Da Silva, R.; Bulska, E.; Godlewska-Zylkiewicz, B.; Hedrich, M.; Majcen, N.; Magnusson, B. Analytical Measurement: Measurement Uncertainty and Statistics; Joint Research Centre, Institute for Reference Materials and Measurements, European Commission: Brussels, Belgium, 2013; pp. 58–146. [Google Scholar] [CrossRef]
  24. Francisca, S.O.; Ramos, R.K.S.; Almeida, C.A.; Júnior, L.; Arruda, M.A.Z.; Pastore, H.O. A Straightforward Method for Determination of Al and Na in Aluminosilicates Using ICP OES. J. Braz. Chem. Soc. 2017, 28, 8. [Google Scholar] [CrossRef]
  25. Sivakumar, V.; Ernyei, L.; Obenauf, R.H. Matrix Effects in ICP-AES Analysis, The Application Notebook 2007; SPEX CertiPrep, Inc.: Metuchen, NJ, USA, 2007. [Google Scholar]
  26. Seddon, A.B. Chalcogenide glasses: A review of their preparation, properties. J. Non. Cryst. Solids 1995, 184, 44–50. [Google Scholar] [CrossRef]
  27. Bergin, T. An Introduction to Data Analysis: Quantitive, Qualitive and Mixed Methods, 1st ed.; SAGE Publications Ltd.: Melbourne, Australia, 2018. [Google Scholar]
  28. Wei, B.; Zhang, Y.; Bao, S. Preparation of geopolymers from vanadium tailings by mechanical activation. Constr. Build. Mater. 2017, 145, 236–242. [Google Scholar] [CrossRef]
Figure 1. BCR sequential extraction procedure and fractionalization of metals.
Applsci 14 03281 g001
Figure 2. Results from BCR sequential extraction procedure on CRM BCR 701: (a) fraction 1; (b) fraction 2, reducible; (c) fraction 3, oxidizable; (d) fraction 4, residual. The mean values from triplicate CRM samples are presented.
Applsci 14 03281 g002
Figure 3. Control charts of arable soil samples containing 6.08 mg P2O5/100 g dry soil (a) and standard 0.60 mg/L P2O5. (b) The precision was estimated within lab reproducibility conditions by standard deviation of concentration values obtained during one-year period by different analysts with different reagents but with the same instruments. The warning limits (green lines) were set at 1*s and the action limits (red lines) were set at 2*s; grey line presented the mean value.
Applsci 14 03281 g003
Table 1. Heavy metal distribution in geochemical fractions in copper mine tailing and fly ash from coal combustion.
FractionFeCuZnMnCdNiPb
mg/kg
Fraction 1 (exchangeable)4471075.520.5<0.25<0.53.8
Fraction 2 (reducible)74041.46.510.3<0.25<0.59.2
Fraction 3 (oxidizable)814218810.340.6<0.25<0.513.7
F1 + F2 + F3 (total mobile)932933722.271.4<0.25<0.526.7
Fraction 4 (residual)10,38010040.2102<0.25<0.517.5
Total197,11643762.4173<0.25<0.544.2
Table 2. Arrangement of heavy metals by extractable content in BCR fraction of mine tailing and lake sediment (CRM BCR 701 lake sediment).
FractionMine TailingCRM CertifiedCRM Experimental
F1Fe > Cu > Mn > Zn > PbZn > Cu > Ni > Cd > Pb > CrZn > Cu > Ni > Cd > Pb > Cr
F2Fe > Cu > Mn > Pb > ZnCu > Pb > Zn > Cr > Ni > CdZn > Cu > Pb > Cr > Ni > Cd
F3Fe > Cu > Mn > Pb > ZnCr > Cu > Zn > Ni > Pb > CdCr > Cu > Zn > Ni > Pb > Cd
F4Fe > Mn > Cu > Zn > PbZn > Cr > Ni > Cu > Pb > CdZn > Cr > Pb, Ni > Cu > Cd
Table 3. Results from standard addition approach for bias estimation of a method for determination of available P and K in soil (each sample was analyzed in six replicates).
SampleStandard AdditionRecovery, %ubias, mg/100 g
dry soilK870.03
dry soilP17n.a.
extracted solutionP960.01
Table 4. Results from calibration of ICP-OES analytical function for Si and Al determination after leaching in 6.5 M NaOH.
Standard SeriesCalibration Curve
Concentration Range
0–1 mg/L
Calibration Curve
Concentration Range
0–10 mg/L
external standardy = 1.106 × x + 10,644y = 1.106 × x − 107,298
matrix-matched calibrationy = 1.106 × x + 15,700y = 1.106 × x + 36,475
Table 5. Comparison of the results of the pycnometer and the hydrostatic balance.
SystemMethodsValue (kg/m3)
G e T e 4 95 I n 5 Pycnometer 5926 ± 3
Hydrostatic balance 5993 ± 1
G e T e 4 90 I n 10 Pycnometer 5533 ± 5
Hydrostatic balance 5707 ± 1
Disclaimer/Publisher’s Note: The statements, opinions and data contained in all publications are solely those of the individual author(s) and contributor(s) and not of MDPI and/or the editor(s). MDPI and/or the editor(s) disclaim responsibility for any injury to people or property resulting from any ideas, methods, instructions or products referred to in the content.

