Abstract
An overview of the 200 TW Frascati Laser for Acceleration and Multidisciplinary Experiments (FLAME) at the SPARC_LAB Test Facility at the National Laboratories of Frascati (LNF-INFN) is presented. The FLAME laser is employed to investigate different laser–matter interaction schemes, i.e., electron acceleration and secondary radiation sources through Laser Wakefield Acceleration (LWFA) or ion and proton generation through Target Normal Sheath Acceleration (TNSA), for a wide range of scientific areas including the biomedical applications. Finally, recently performed experimental campaigns within the EuAPS and EuPRAXIA frameworks are reported.
1. Introduction
Over the past few decades, since the advent of the Chirped Pulse Amplification (CPA) technique [1], the advancement of high-intensity, ultra-short laser systems (now commonly operating at sub-petawatt levels and beyond [2]) has ushered in new opportunities for a diverse range of experiments exploring the physics of high-intensity laser interaction with matter. These experiments are relevant in various fields, including high-energy density science [3], high-gradient particle acceleration [4,5,6,7], and laboratory astrophysics [8].
Among these endeavours, laser-based particle acceleration stands out due to its potential to significantly impact multiple scientific domains and its applications in secondary radiation sources [9]. This method relies on well-established processes such as the Target Normal Sheath Acceleration (TNSA) scheme, with potential implications for cancer therapy, able to deliver ion beams in the multi-MeV energy range and beyond [10], and the Laser Wakefield Acceleration (LWFA) scheme, capable of accelerating electrons to multi-GeV energies [11]. Compared to traditional RF-driven systems, these innovative accelerators offer compelling features such as extraordinarily high acceleration gradients (up to hundreds of GV/m) leading to compact designs, ultra-short pulse durations in the picosecond (ps) down to femtosecond (fs) range, and reduced construction and maintenance costs. These characteristics have sparked considerable interest in further developments to explore the physics and applications of high-intensity laser–matter interaction yields. Indeed, these systems are increasingly finding applications in various scientific fields, particularly in biomedicine for particle and high-energy secondary radiation for both diagnosis and therapy [12,13,14].
In this context, the Frascati Laser for Acceleration and Multidisciplinary Experiments (FLAME) has been designed and installed in the SPARC LAB Test Facility [15] to explore the processes underlying the laser–matter interaction at extreme intensities (up to 1020 W/cm2) and to become an operational facility delivering stable laser-driven beamlines of ions, electrons, and X-ray radiation, within the EuAPS [16] and EuPRAXIA [17] projects focused on creating a compact European end-user plasma accelerator by utilizing the latest laser technologies and pioneering advancements in plasma acceleration.
Additionally, the FLAME laser’s capabilities enable a broad spectrum of scientific inquiries, from fundamental physics to applied research, by adopting the generated high-energy electron beams and secondary radiation sources, opening new avenues for experimental investigations. Finally, this work is expected to significantly contribute to the understanding and development of future advanced compact high-energy particle accelerators and radiation sources.
This paper is organized as follows. The layout and features of the 200 TW FLAME laser, delivering 30 fs, 6 J laser pulses at 800 nm, are presented in Section 2. In Section 3, we describe the performed experimental campaigns both adopting the auxiliary, low-energy, ultra-short, high repetition rate beamline, and the main, high-energy, ultra-short, low repetition rate beamline at the FLAME test facility exploring different acceleration schemes as the LWFA and the TNSA.
Moreover, the implemented laser, particle, and plasma diagnostics with comprehensive descriptions of their main features are reported. Within Section 3.2.1, we present an in-house, non-destructive, single-shot, temporally resolved diagnostics based on Electro-Optical Sampling [18] (EOS), which can record ultra-short electromagnetic pulses (EMPs) and relativistic electrons with femtosecond resolution [19,20,21,22,23]. In laser–solid target interaction experimental campaigns, this diagnostic tool provides a more detailed picture of the ultra-fast dynamics of these phenomena on a sub-picosecond timescale.
2. Laser Layout and Features
The FLAME facility is designed to support various research programs focused on laser–plasma interactions and the applications of laser-driven radiation and particle sources within the EuAPS and EuPRAXIA frameworks. Consequently, the laser facility hosts a flexible system layout that accommodates different experimental configurations and integrates a wide range of standard and advanced diagnostics to control both laser pulse transport and interaction.
The FLAME laser is an Amplitude Technology’s (Pulsar [24] technology, Bordeaux, France) based system capable of delivering pulses with a maximum energy of 6 J, temporally compressed to 30 fs, achieving a peak power of 200 TW and a repetition rate of 10 Hz. This Titanium–Sapphire (Ti:Sapphs) laser is based on the well-known CPA technique [1], which intends to temporally stretch the low-energy, ultra-short pulse for safe amplification in solid-state materials. After amplification, the laser pulse is compressed back to the shortest possible duration supported by the amplified spectrum, resulting in a high-intensity, ultra-short pulse.
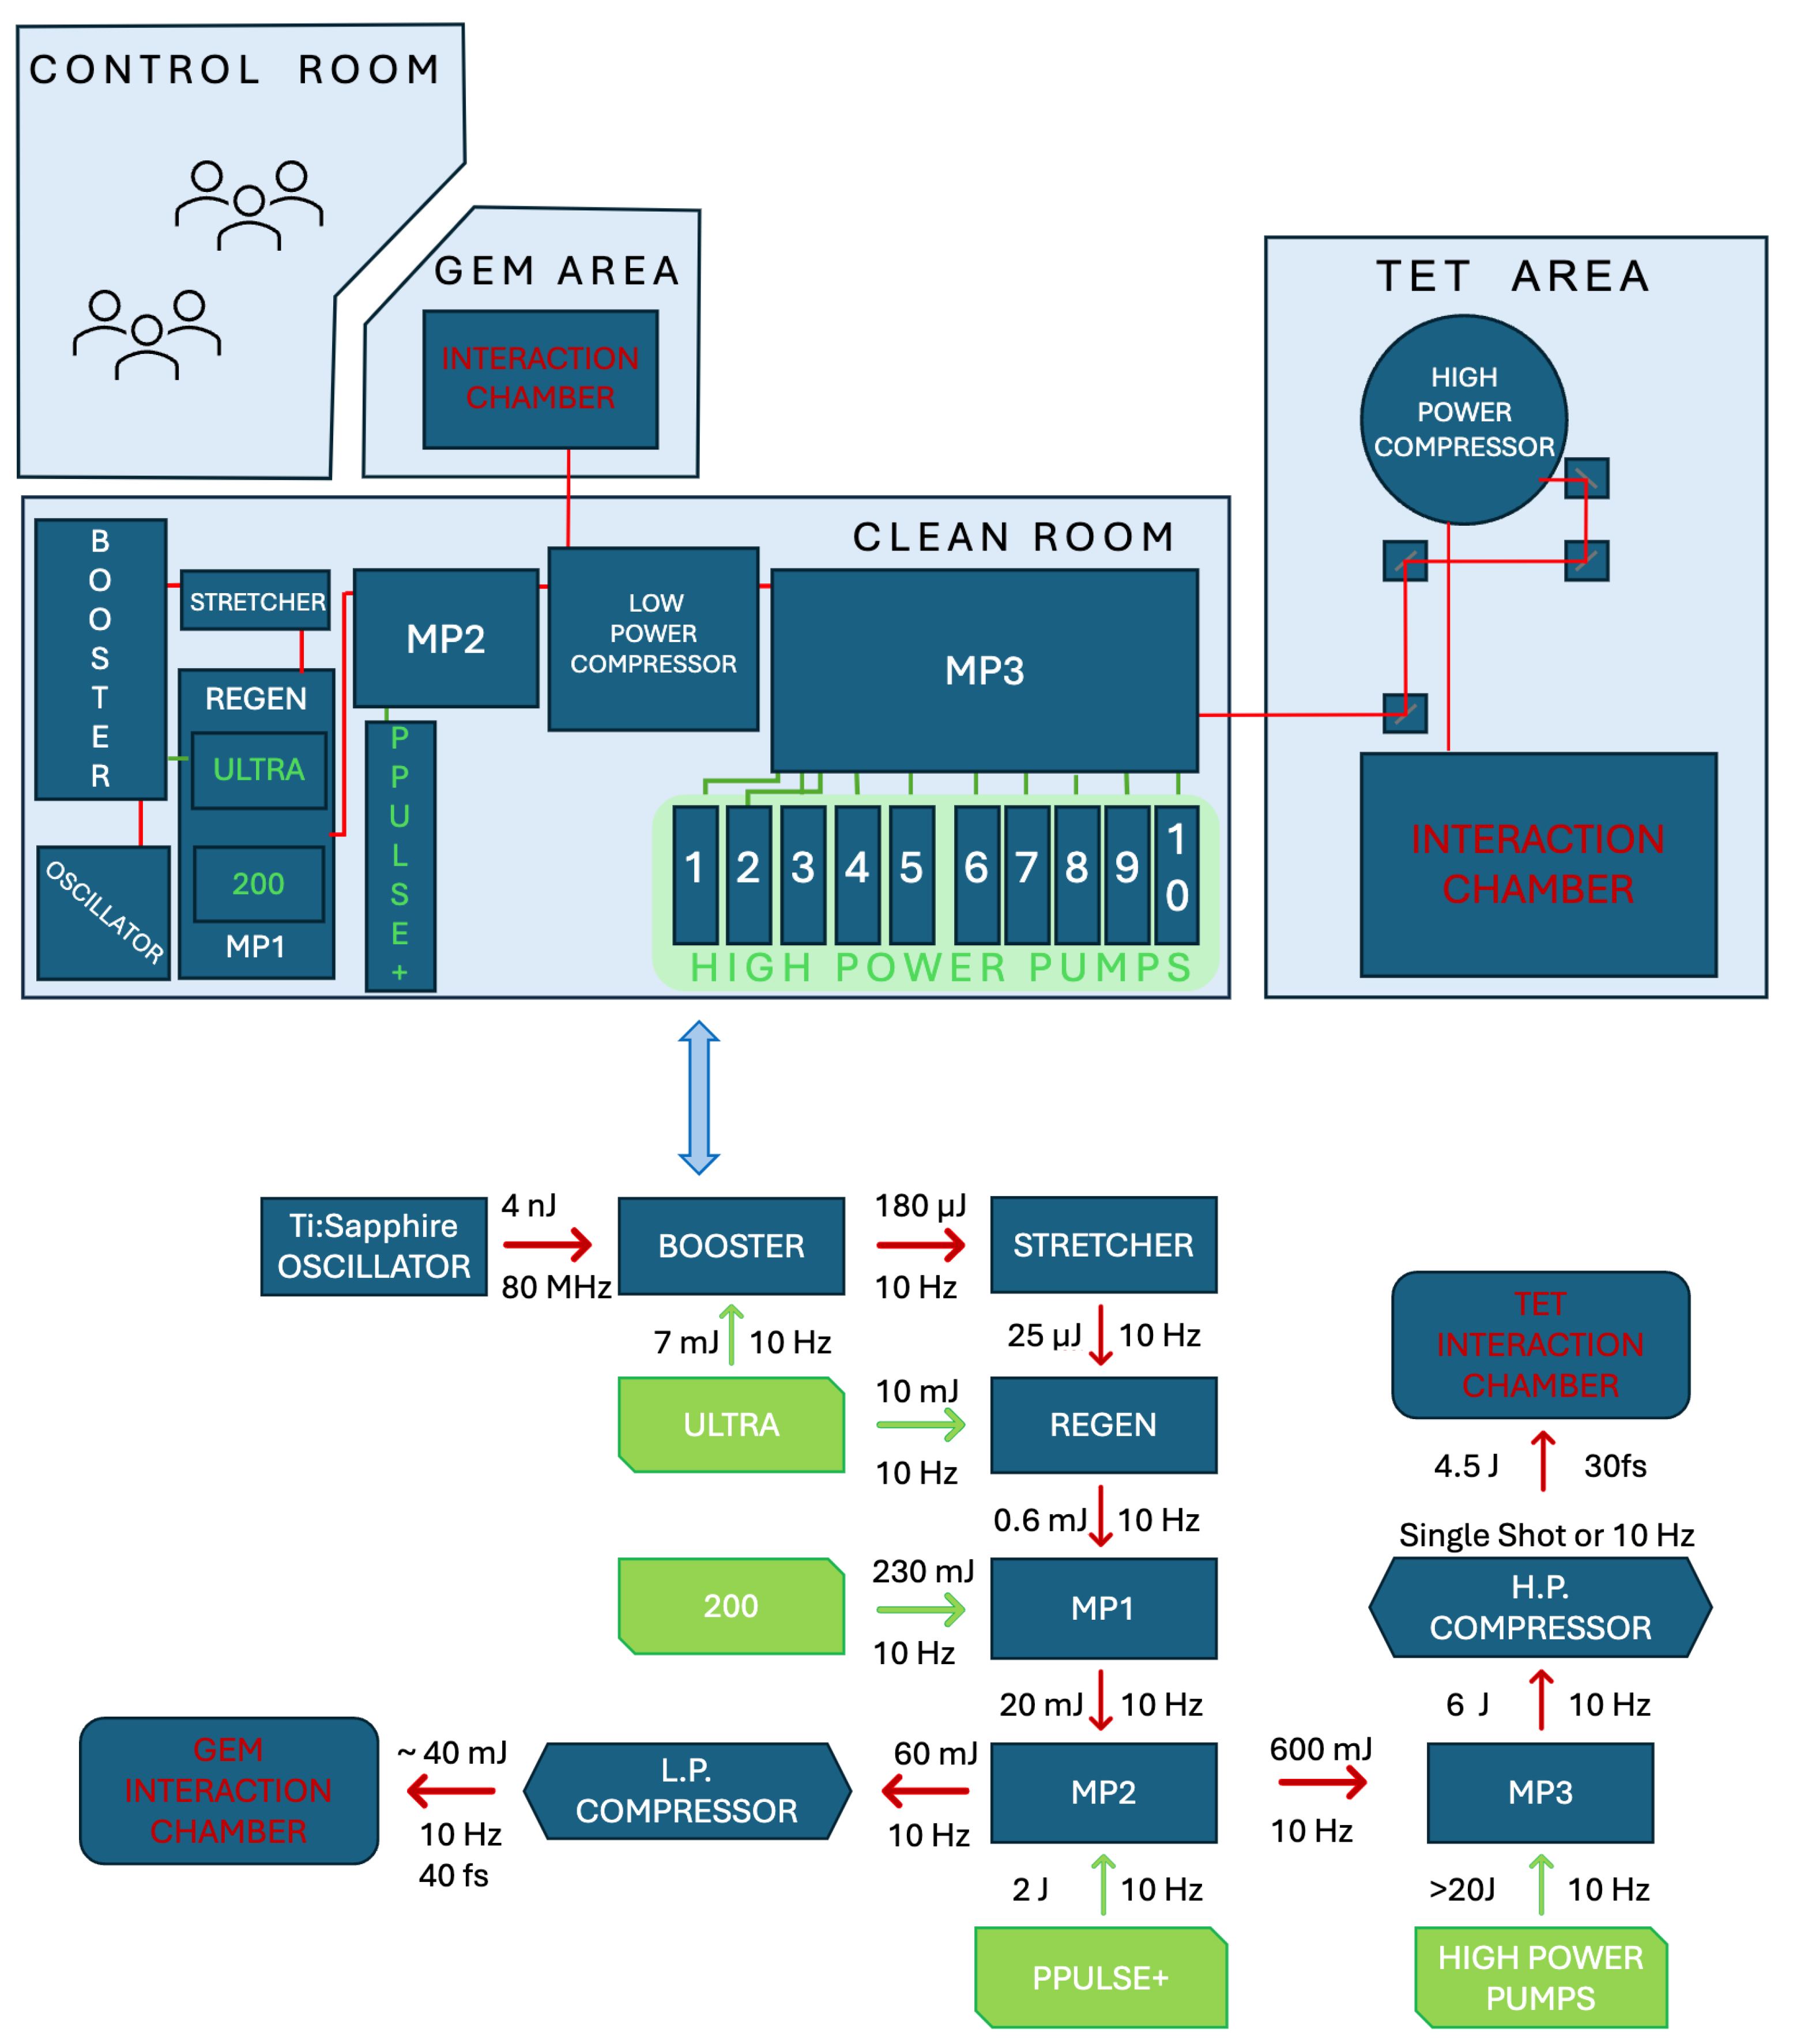
As shown in Figure 1, the FLAME facility is equipped with a clean room (hosting the front end, the high-power multi-pass amplifier, and a compact low-power laser compressor), and two experimental areas: the Guiding Experimental Measurement (GEM) area and TW Experimental Target (TET) area.
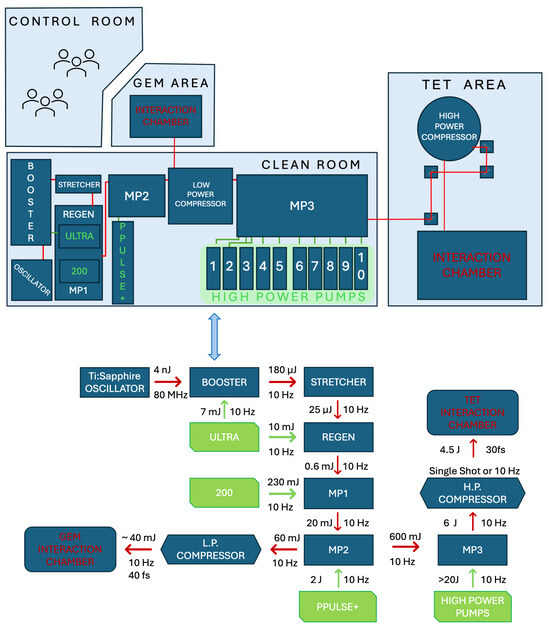
Figure 1.
(Top) FLAME facility sketch comprehensive of the clean room, where the entire laser system is set, and of the two different interaction areas. (Bottom) FLAME facility sketch comprehensive of the laser pulse properties at each stage. White: Laser stages; Green: Laser pumping system; Red: Interaction chambers; Red arrows: Laser pulse; Green arrows: Pumping systems pulses.
The laser pulses generated by the front end system are split into two beamlines at 10 Hz repetition rate. In one beamline, the pulse undergoes further amplification (main beamline) into the final multi-pass amplifier (∼6 J), and it is compressed in the high-power compressor (∼30 fs) outside the clean room above the TET area where it is finally delivered. In the other one, operating at low energy (∼40 mJ), the pulse is compressed in the clean room and delivered via two additional transport lines either to the GEM area (auxiliary beamline) or to the TET area (probe beamline).
2.1. Front End
The FLAME CPA chain begins with a femtosecond oscillator, specifically a commercial Femtosource Sinergy from Femtolasers (Spectra-Physics, Vienna, Austria, which delivers 10 fs, 4 nJ pulses at an 80 MHz repetition rate. A Pockels cell acts as a pulse picker, reducing the oscillator output repetition rate to 10 Hz.
To enhance the contrast ratio (<), the 10 fs pulse is amplified using a booster module. This module consists of a compact 14-pass amplifier able to increase the energy to tens of μJ and a saturable absorber to clean the pulse by removing the residual Amplified Spontaneous Emission (ASE) background from the amplifier. The booster amplifier is pumped with a 7 mJ, 532 nm pump pulse from a CFR Ultra Nd:YAG laser (Quantel Laser, Lannion, France), which also pumps the following amplification stage, namely the regenerative amplifier.
At this point, for safe amplification in solid-state materials, the booster pulses are temporally stretched using an optical stretcher based on an all-reflective triplet combination of Offner-type, comprising two spherical concentric mirrors: the first concave and the second convex. This symmetrical configuration eliminates aberrations such as on-axis coma and chromatic aberration but does not cancel out the symmetrical ones such as spherical aberration and astigmatism.
After the stretcher, with the pulse temporally stretched to about 600 ps, an acousto-optic programmable dispersive filter (Fastlite Dazzler, Orsay, France) is introduced. The Dazzler acts both as a phase and intensity modulator. The former operational mode is used to pre-compensate for phase distortions that occur during laser transport, while the latter is used to enhance the laser output spectrum, enabling the generation of shorter pulses.
The regenerative amplifier (REGEN) or second amplification stage delivers around 0.6 mJ pulses when pumped with 10 mJ, 532 nm pulses emitted by the CFR Ultra Nd:YAG pumping laser. This setup incorporates an intracavity acousto-optic programmable gain filter (Fastlite Mazzler, Orsay, France) to mitigate gain narrowing throughout the amplification stages.
The laser pulse then moves to the first multi-pass amplifier (MP1), a 5-pass amplifier, which is pumped by a 230 mJ, 532 nm pulse from a CFR 200 laser (Quantel Laser, Lannion, France), resulting in a final pulse energy of 20 mJ. The amplified pulse is subsequently expanded to a 10 mm diameter before entering the second multi-pass amplification stage (MP2), a 4-pass amplifier designed to deliver approximately 600 mJ of energy. This amplifier features a water-cooled Ti:Sapphs crystal, 15 mm in diameter and 20 mm in length, with anti-reflection coating on both faces, and it is pumped with 2 J, 532 nm pulses from a ProPulse+ Nd:YAG laser (Amplitude Technologies). The amplified 800 nm laser pulse is then expanded to approximately 36 mm in diameter before reaching the final cryo-cooled amplification stage.
At this point in the amplification chain, the laser beam is split into two: one beam continues along the main transport line, and the other follows the auxiliary/probe transport line.
2.2. Main Beamline
The stretched pulse from the front end, with an energy of approximately 600 mJ, undergoes further amplification in the third high-energy multi-pass amplifier (MP3) stage. This stage features a 4-pass amplifier pumped by ten synchronized Propulse+ Nd:YAG systems supplied by Amplitude Technologies, each delivering 2 J, 532 nm pulses at a 10 Hz repetition rate. The amplifier features a cryo-cooled 50 × 50 × 25 mm3 Ti:Sapphs crystal. The 800 nm output pulse reaches 6 J of energy before compression. Our system can operate at different repetition rates (up to 10 Hz), but it was finally set to deliver pulses from 1 Hz to single-shot at full-power operations due to the types of the performed experimental campaigns able to spoil the required system vacuum constraints. Before final compression, the amplified pulse is initially expanded to approximately 65 mm before passing through an attenuator system. This system includes a rotating half-wave plate and two high-performance broadband polarizers, enabling the output energy to be precisely adjusted down to 1% of the total in 1% steps. Prior to reaching the high-power compressor, the beam undergoes further expansion by a refractive telescope, achieving a final clear aperture diameter of around 100 mm.
The optical high-power compressor (shown in Figure 1), configured in a 4-pass folded layout utilizing a retro-reflector and housed in a vacuum chamber maintained at mbar, finally compresses the pulse length down to 30 fs without any residual spatial chirp or additional spatio-temporal couplings [25]. This system employs four gold-coated gratings (HORIBA Jobin Yvon, Kyoto, Japan) with 1480 grooves/mm, measuring 135 mm × 175 mm for the first and fourth gratings and 135 mm × 230 mm for the second and third gratings, achieving a throughput efficiency of approximately 70%.
After compression, pulse optimization and metrology are performed by inserting a one-inch mirror along the transport line to the TET interaction chamber, which allows for the selection of a specific section of the beam. The temporal measurement is performed by means of an APE SPIDER and its optimization can be performed using a closed loop between the temporal diagnostics and the Dazzler system. A couple of remotely controlled mirrors direct the beam from the high-power compressor to the TET area, where a dedicated experimental chamber is set up. The laser pulse is then focused using a gold-coated, 15-degree Off-Axis Parabolic (OAP) mirror with a focal length of 1 m, achieving a transverse diameter of 18 m, as shown in the Section Laser Diagnostics Section 3.2.1.
The TET area is dedicated to experiments on laser–matter (gas and solid targets) interaction, where particles are accelerated and secondary radiation sources are generated, as well as on high-power laser guiding for external injection scheme experiments and plasma–target characterization experiments. Here, experiments are also carried out to develop user-oriented applications, within the EuAPS and EuPRAXIA frameworks.
2.3. Auxiliary Beamline
A small portion of the main beam, approximately 10%, is redirected before the cryo-cooled amplifier. The auxiliary pulse can be fully compressed, or not, according to the needs of the experimental campaigns maintaining high-repetition-rate operation.
The pulse compression is achieved by a dedicated low-power compressor, shown in Figure 1, adopting two 1480 grooves/mm gratings with a gold coating and a retro-reflector mirror. Finally, the compression stage delivers ∼40 fs compressed pulses, with an efficiency about 70%, yielding a pulse peak power of ∼10 TW. These 10 Hz, 10 TW compressed laser pulses are delivered to the vacuum interaction chamber in the GEM area.
The laser pulse is focused with a flexible focusing optical setup, allowing it to perform a wide range of experiments. Here, experiments are conducted to explore applications that can benefit from the 10 Hz repetition rate as the laser-guiding experiments, few-MeV electron acceleration via LWFA, amongst others. This experimental area also offers a unique advantage by providing rapid access to high-intensity laser–matter interactions for developing diagnostics applicable to plasma and laser systems. Moreover, it serves as a testing ground for innovative concepts such as high-repetition rate gas cells, prior to their deployment in higher-intensity interaction processes.
For the gas jet and gas cell experimental campaigns, the setup is optimized to operate at a 1 Hz repetition rate due to the time required to restore the vacuum level to approximately mbar in the target chamber. This pressure is sufficiently low to avoid any disruption in laser propagation and to maintain the quality of the vacuum–gas interface.
2.4. Probe Beamline
The TET area can also accommodate an ancillary laser beamline, known as the probe beamline. A dedicated delay line synchronizes the main and probe beams, compensating for the longer optical path traveled by the main laser within the final high-energy amplification stage and the high-power compressor, shown in Figure 1. This beamline is typically used in pump-and-probe experiments, such as interferometry diagnostics to retrieve plasma density profiles in LWFA runs or EOS diagnostics to detect electron THz fields. For the latter, precise synchronization of the beams is achieved by detecting the second harmonic (SHG) pulse in an SHG crystal positioned in the TET interaction point.
3. Experimental Campaigns at FLAME
This section starts by providing an overview of the pulse parameters available to users in the two target areas: Long-pulse High Repetition Rate (LONG-HRR) Auxiliary beam, Short-pulse High Repetition Rate (SHORT-HRR) Auxiliary and Probe beams, and Short-pulse Low Repetition Rate (SHORT-LRR) Main beam. The fundamental pulse parameters are shown in Table 1.

Table 1.
Fundamental pulse parameters (energy, temporal duration, and repetition rate) of the three available beamlines at the FLAME facility.
3.1. Auxiliary Beamline Target Area at FLAME
The GEM area is a dedicated station located in the FLAME bunker in order to carry out laser–plasma interaction tests between low-intensity pulses and different types of plasma targets.
The delivered LONG- or SHORT-HRR pulse is focused by a lens on the target, which is located in the center of a small interaction chamber (about m3), in vacuum ( mbar). The focusing lens can be adjusted to achieve the desired spot size, and it is placed on a motorized stage for focal plane adjustment. A camera is installed inside the interaction chamber to check both the focal plane and the transverse distribution. The maximum achievable intensity on target is W/cm2. Finally, the target can be moved in the X-Y-Z axis using a hexapod with six degrees of freedom (PI H-811.I2 6-Axis Miniature Hexapod, Physik Instrumente (PI), Karlsruhe, Germany). Different gases can be adopted for the plasma target and they can be injected from a dedicated gas bottle or a hydrogen generator.
This experimental station allows us to carry out experimental campaigns mainly adopting a neutral gas or a pre-formed plasma. In the first case, the maximum achievable laser intensity makes it possible to carry out gas ionization tests inside the capillary through the laser pulse itself or to accelerate low-energy, low-charge electron beams. In the second case, if a pre-formed plasma is adopted (e.g., from a discharge in gas) it is possible to study the guiding of a laser pulse by means of plasma. This configuration is used to investigate the optimal matching conditions between the pulse and a plasma capillary discharge of a few centimeters in length and a few hundred microns in diameter.
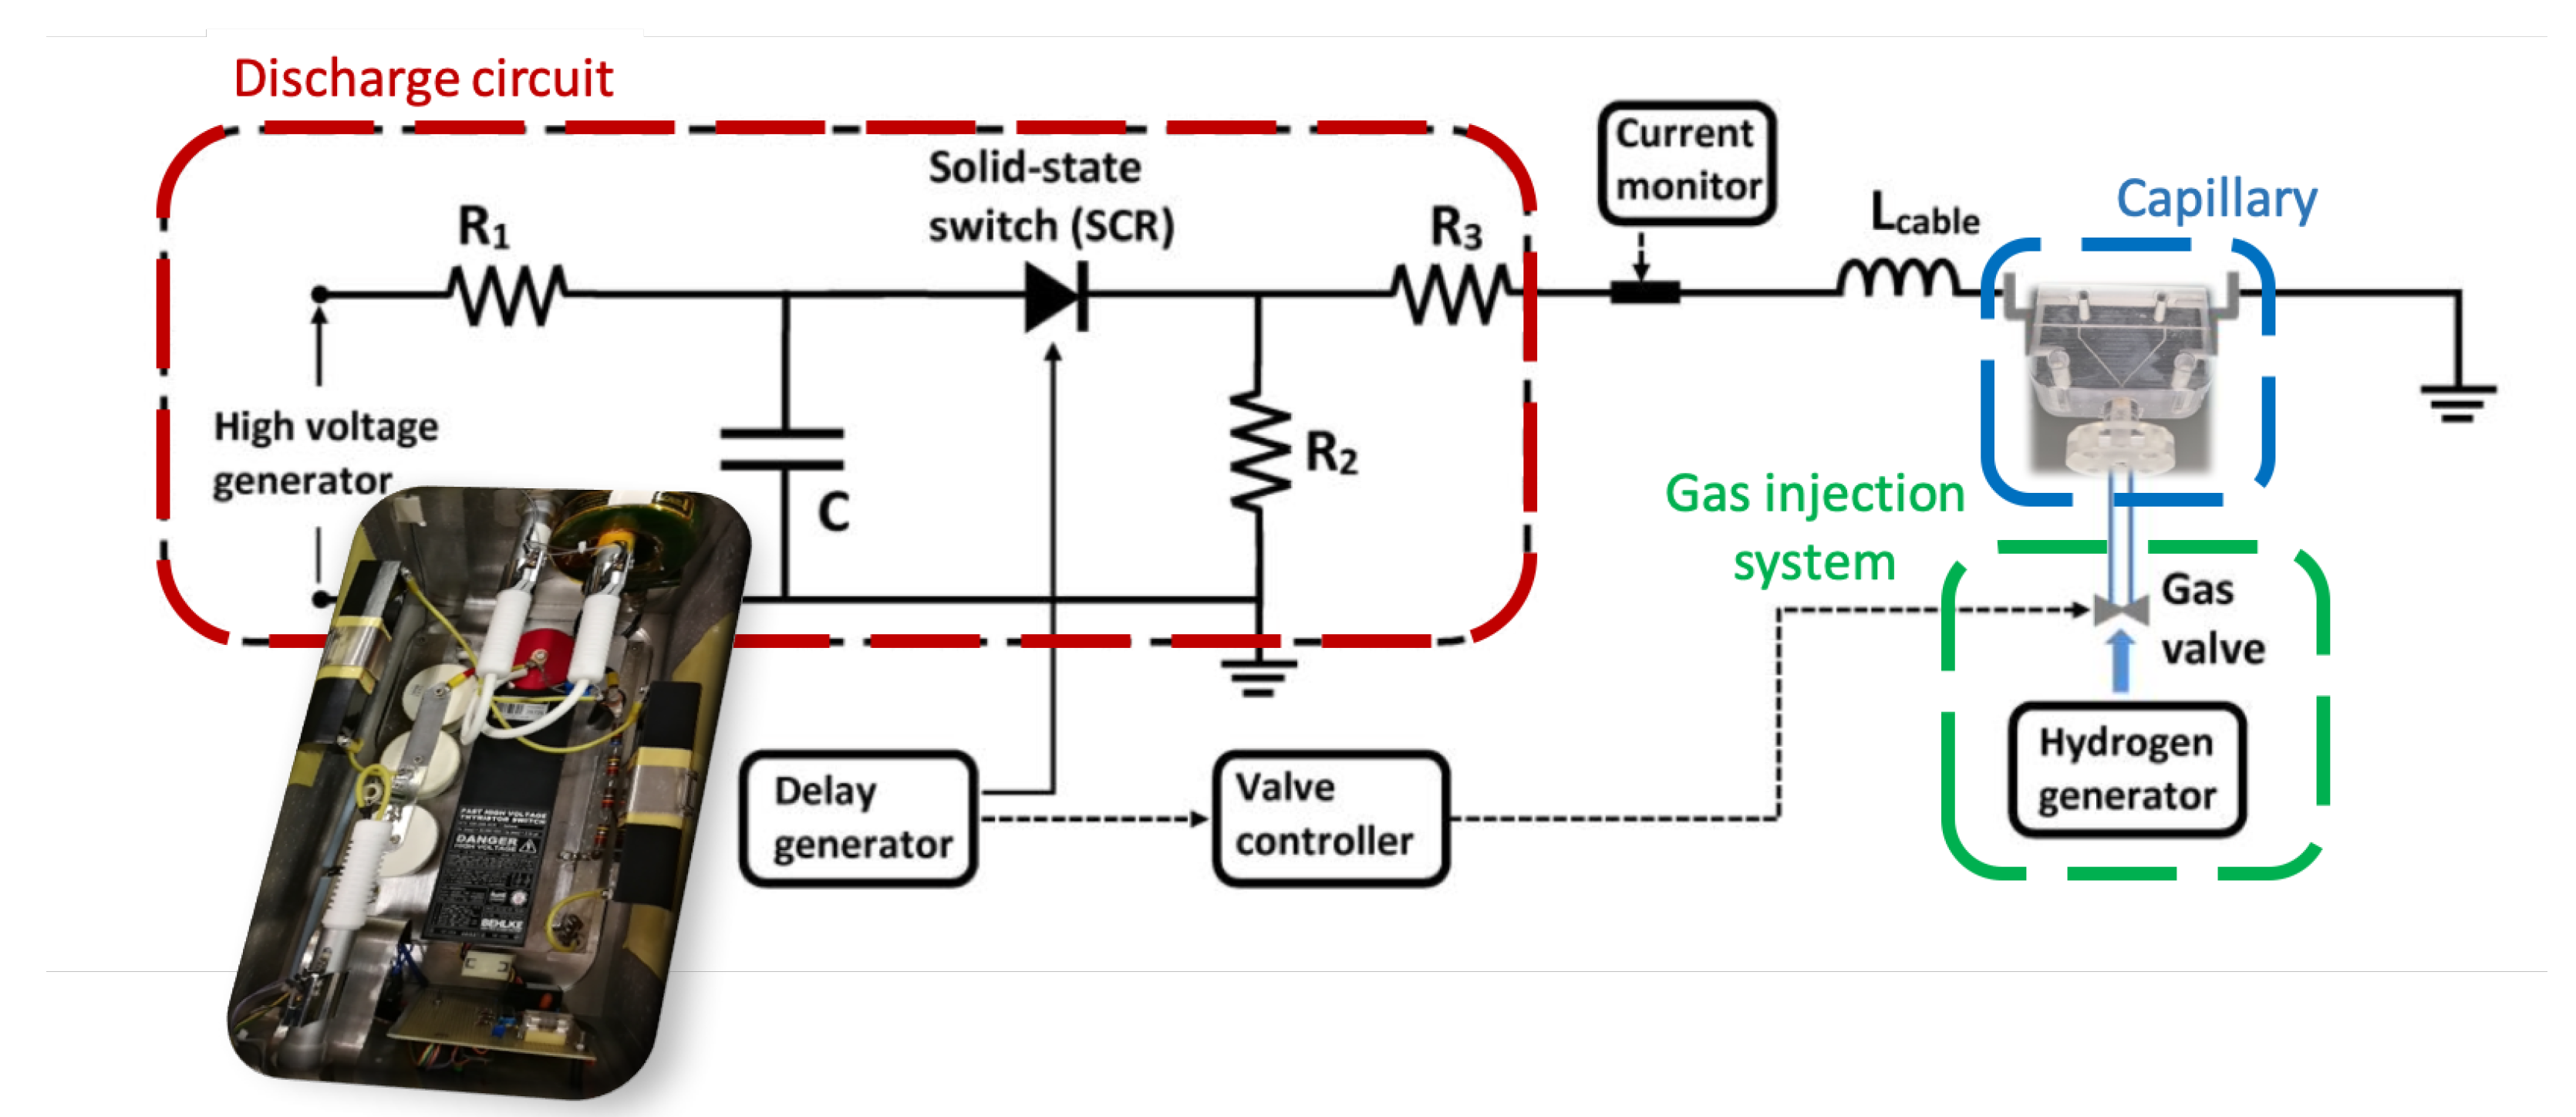
In this configuration, the setup, using capillaries with several dimensions (from 1 cm to 10 cm) into which gas can be injected at different pressures (from 1 bar to 10 s of bars), is equipped with a homemade designed discharge circuit [26] (Figure 2) able to supply a voltage from few kV up to 20 kV to generate a discharge to ionize the gas. This voltage is applied by means of a pair of electrodes placed at the ends of the channel. The achievable plasma density, as well as the ionization level of the gas, thus depends on the initial conditions of the gas channel and the applied voltage [27].

Figure 2.
Sketch of the experimental setup used to generate a discharge inside a gas-filled capillary, highlighting the electrical diagram of the discharge circuit. The circuit parameters are as follows: generator voltage 0–40 kV, R1 = 10 k, R2 = 100 k, R3 = 38 , C = 10.8 nF, RSCR = 17 , Lcable = 3 μH as reported in Ref. [28]. (Inset) Picture of the homemade discharge circuit.
3.1.1. Laser-Guiding Experimental Campaign
In particle acceleration experiments, the energy gained by an electron is directly proportional to both the strength of the accelerating field and the distance traveled. Therefore, in a Laser Wakefield Acceleration (LWFA) setup, achieving higher energies requires extending the laser beam’s propagation length. This is because the accelerating fields are intense over distances of tens of millimeters, so increasing the propagation length allows for a longer acceleration path.
A Gaussian laser beam, without guiding, diverges after a distance called the Rayleigh length , which depends on the spot size and the laser central wavelength . The natural diffraction of the laser pulse can be limited with optical guiding, i.e., using a pre-formed plasma channel. Considering a laser pulse of intensity
and a parabolic distribution of the plasma channel
with with the electron radius, the on-axis plasma density, and the difference between the central axis and wall density of the plasma structure, the parabolic distribution can be considered a guiding stage if the laser spot at the waist is equal to the matched spot . The guiding stage and process can be adjusted by tuning the plasma index of refraction, which depends on the plasma density. Therefore, the density measurements are fundamental for all laser pulse guiding experiments, and, consequently for laser–plasma acceleration [11,29,30,31] ones.
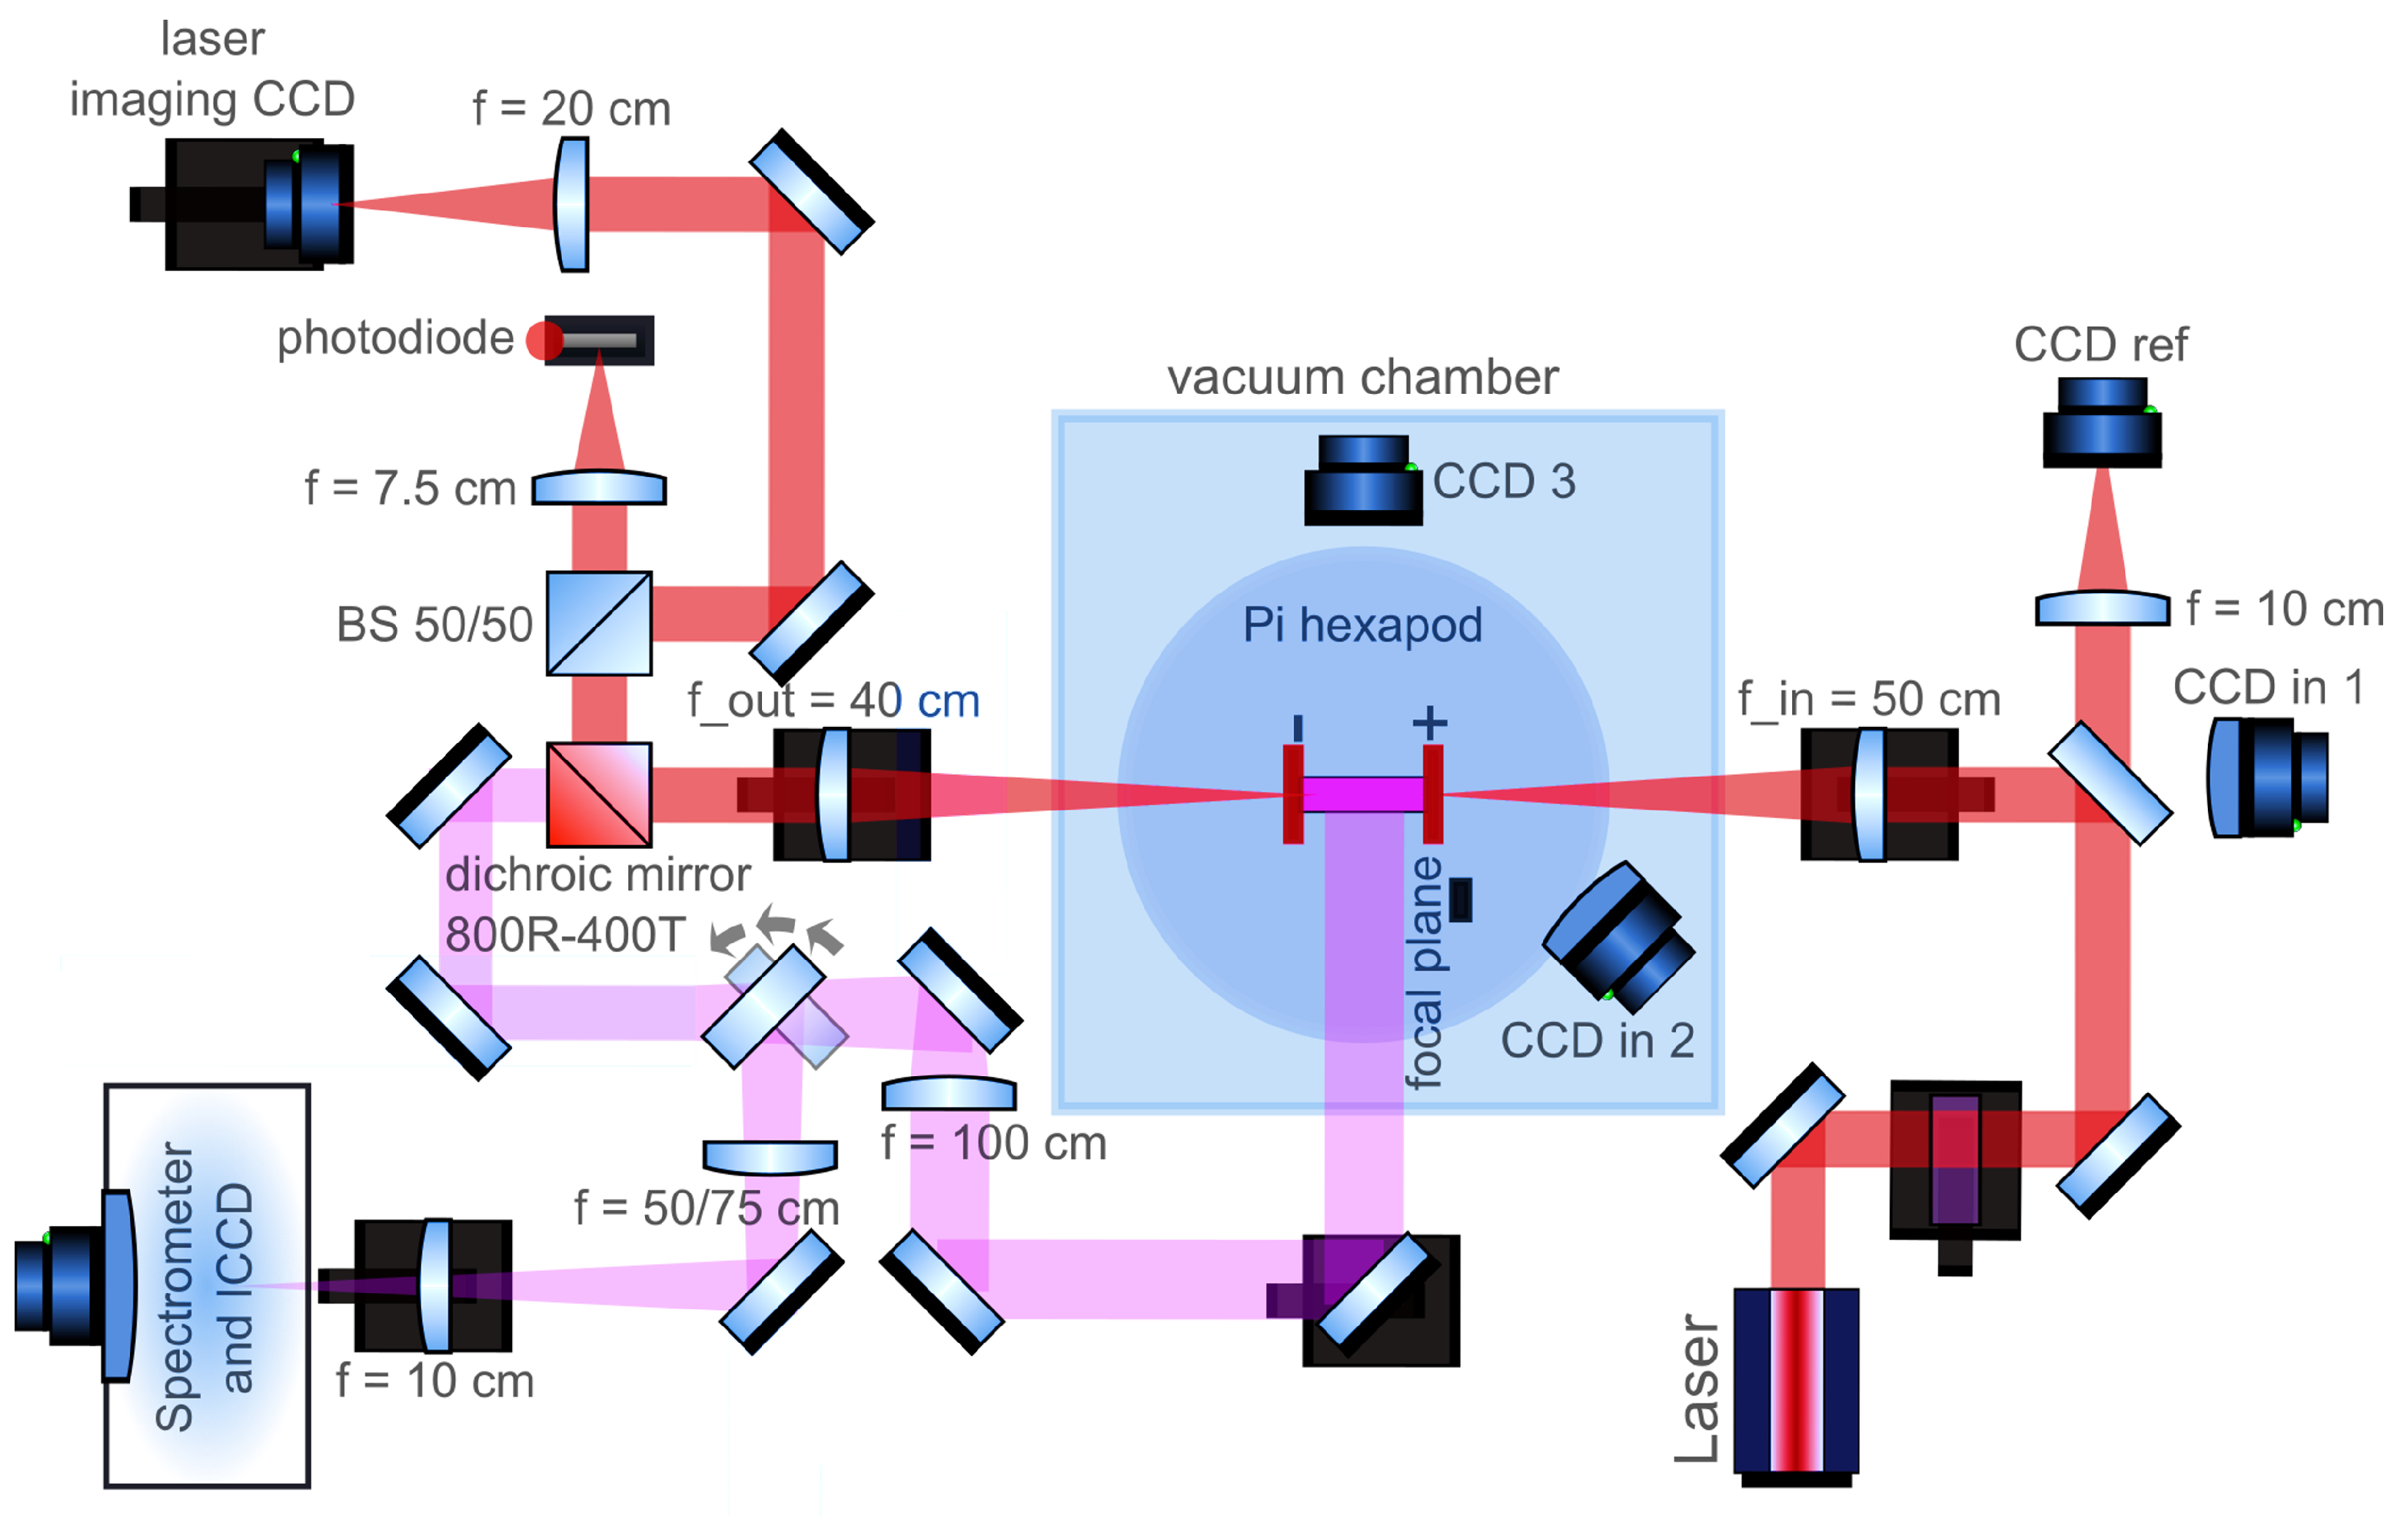
Laser guiding tests can be performed with the low-power laser pulses, varying the target dimensions and the pre-formed plasma characteristics [32]. A designed setup for guiding experiments is shown in Figure 3.
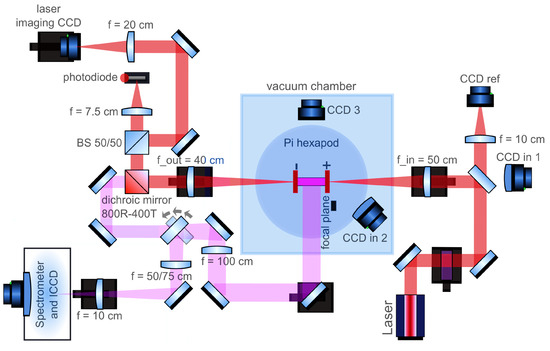
Figure 3.
Experimental setup sketch for guiding experiments in the GEM area, including laser transport and plasma diagnostics.
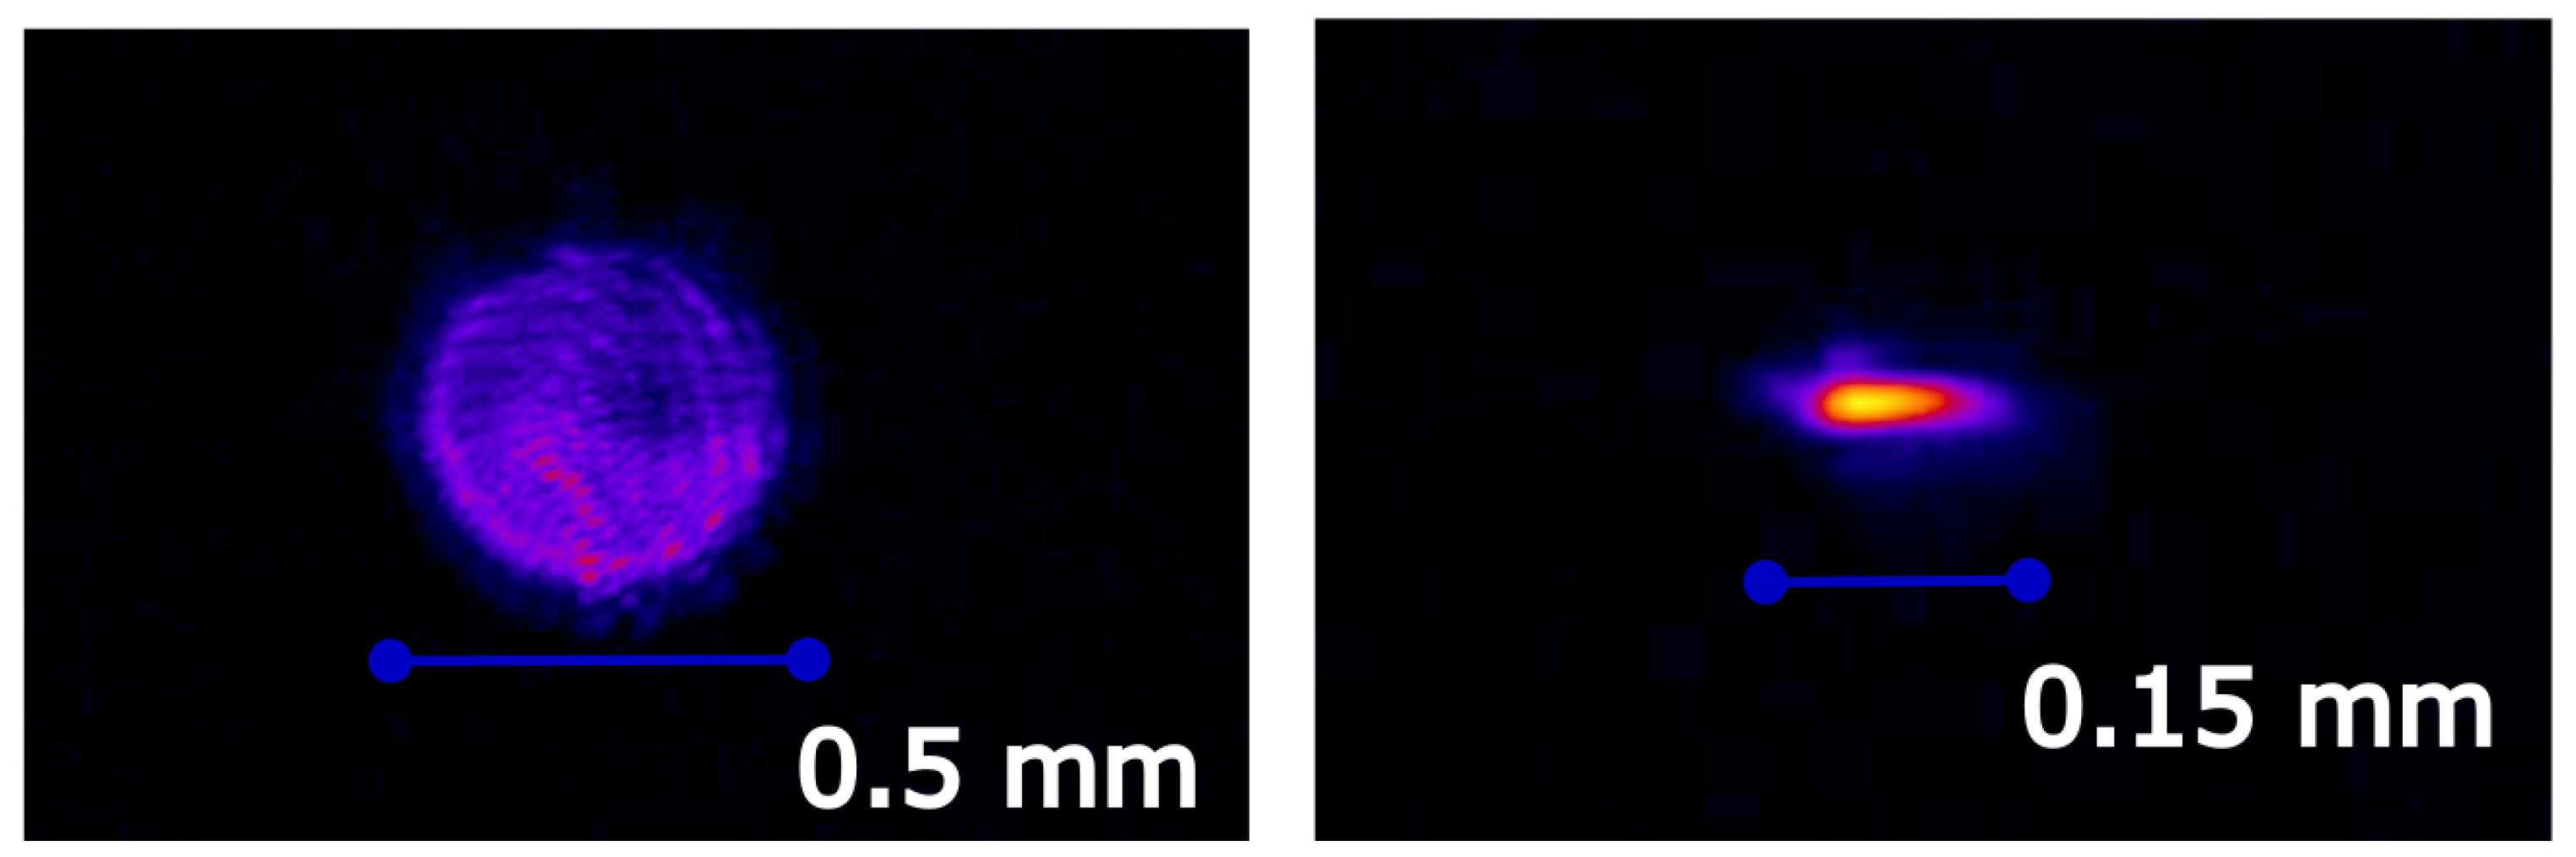
Guiding measurements are performed by comparing the laser spot characteristics at the focal plane, namely at the entrance of the plasma channel, with the spot at the plasma channel exit. This is achieved by a laser beam transverse imaging diagnostic setup. Figure 4 shows the transverse profile of the beam exiting the capillary without plasma (left-hand side image) and with plasma, synchronized with the laser beam, to achieve laser pulse guiding (right-hand side image). The arrival time of the laser is synchronized with the generation of the plasma via a dedicated delay generator, which distributes the clock signal to all the diagnostics, namely CCDs and the spectrometer to evaluate the plasma spectral content.

Figure 4.
Example of a laser spot exiting the capillary: on the (left), the transverse profile of the beam at the exit plane of the capillary without plasma; on the (right), the image of the same laser spot plane with plasma synchronized with the laser beam to achieve pulse guiding.
3.1.2. Target Production
An ancillary, but fundamental, activity is the testing of plasma targets from both the “laser–target interaction” and the target characteristics point of view. Regarding the characterization, achievable gas pressure given the geometry (and thus plasma density), alignment, and design techniques are under investigation.
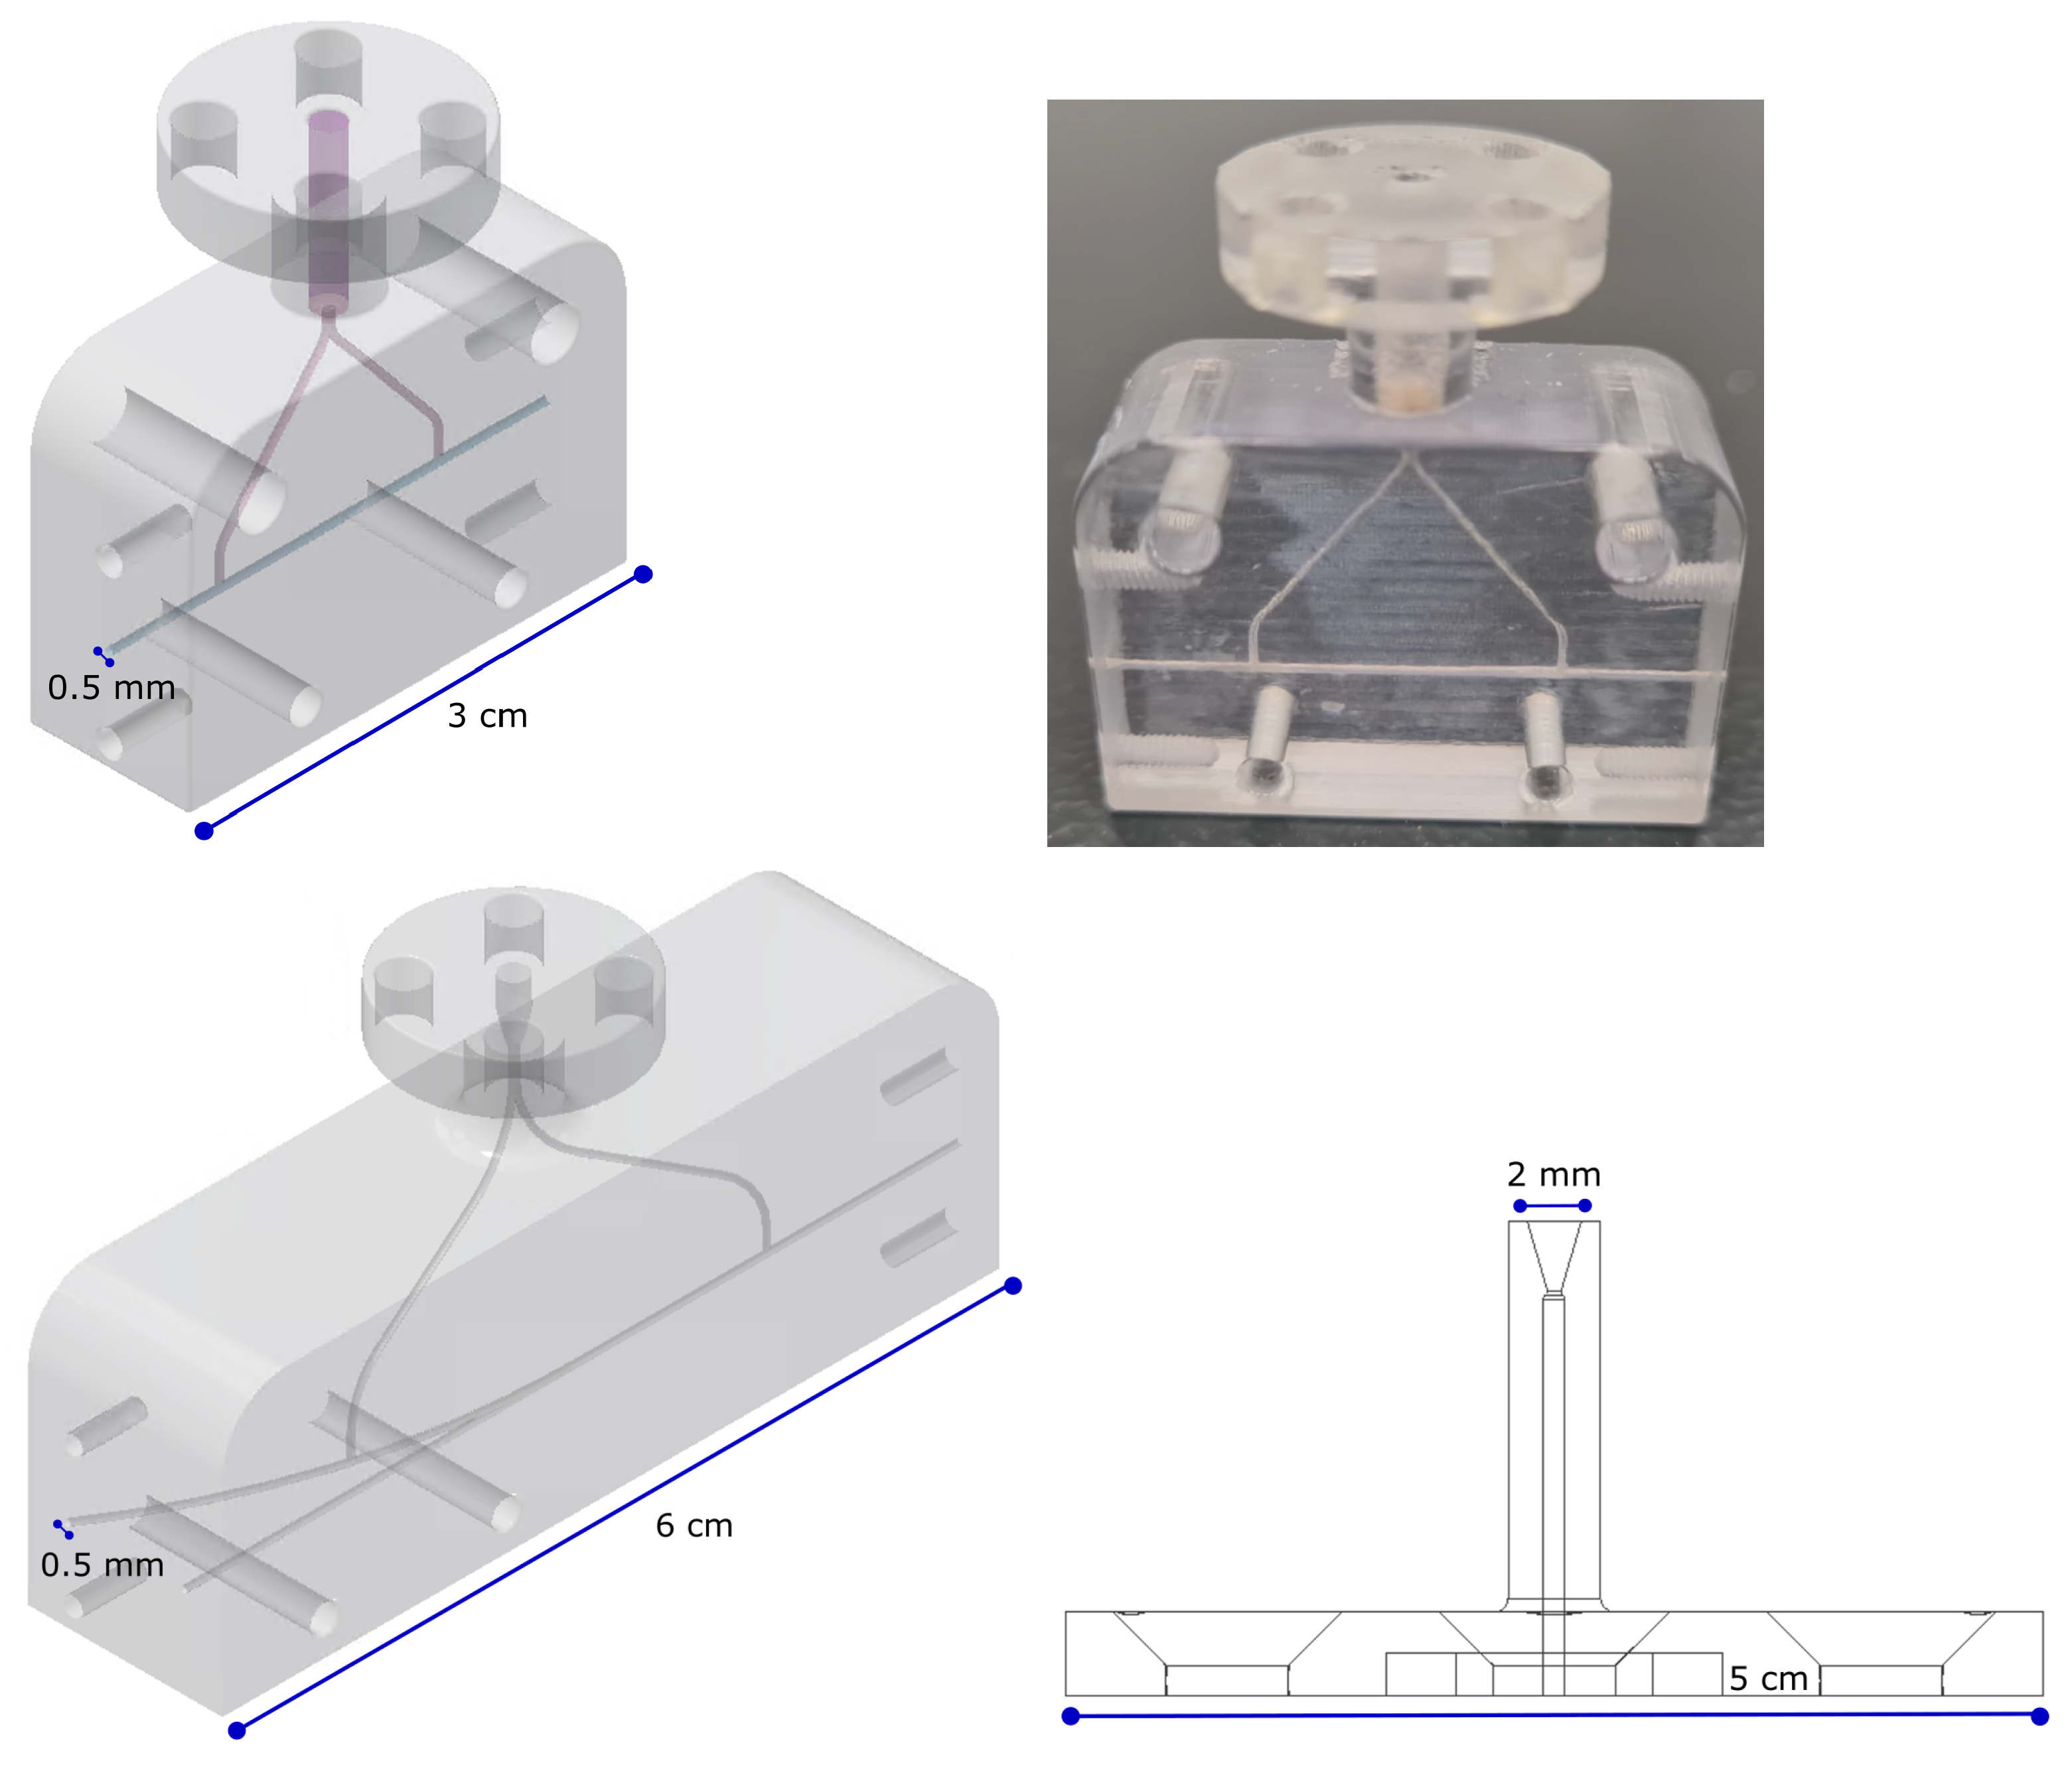
Most of the targets adopted in our laser–plasma experimental campaigns are developed in-house, from design to manufacture. These can be gas cells or capillaries with a wide variety of sizes and inlet configurations for gas injection, or nozzles for supersonic gas jets [33] with different geometries and apertures. They are fluid-dynamically simulated with the commercially available OpenFoam CFD v.5 software [34,35] and designed to achieve specific density trends. The production techniques involved are either precision machining or 3D printing. Examples of targets made and tested at FLAME are shown in Figure 5.
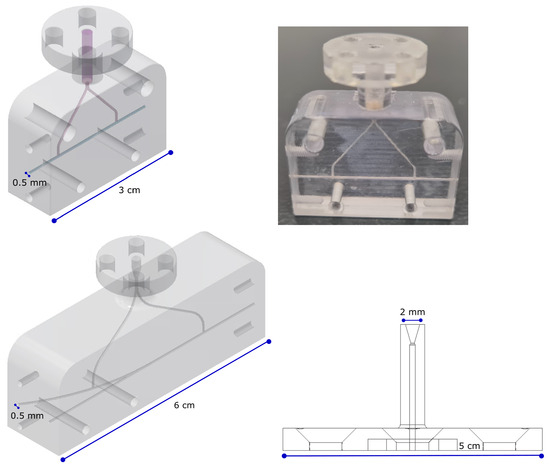
Figure 5.
Examples of targets designed and manufactured at the FLAME facility. In detail, the design and 3D printing realization of a 3 cm long capillary with a diameter of 500 m on the top row, the design of a 6 cm long curved capillary (bottom left), and a nozzle with a 2 mm aperture (bottom right) are shown.
3.1.3. Experimental GEM Area Diagnostics
In the GEM experimental area, both laser and plasma diagnostics are set to monitor the interaction processes.
Laser Diagnostics
The longitudinal profile of the pulse is measured after the low-power compression stage with a Spider (APE Compact LX Spider, APE Angewandte Physik & Elektronik GmbH, Berlin, Germany) tool. The energy is retrieved using an energy meter of appropriate size: the spot size before focusing is about 1 inch. On the focal plane, the transverse distribution of the laser beam is measured by transporting the filtered pulse directly into a calibrated CCD, placed on the hexapod, inside the interaction chamber.
After interacting with the target, different types of diagnostics are used to assess the effects induced on the pulse. A photodiode is placed on a mirror loss, after the target, to measure the laser arrival time. The latter allows the laser to be synchronized with the plasma generation process and to perform time-resolved measurements. A diagnostics segment to characterize the laser transverse profile is also set. It consists of an optical imaging system of the target exit plane with the required magnification.
STARK Broadening Plasma Density Measurements
Both transverse and longitudinal plasma density measurements are performed by exploiting the Stark effect. In addition, an optical imaging system of the entire plasma target able to collect the plasma fluorescence is set.
Diagnostics based on the Stark broadening exploit plasma recombination light, namely plasma fluorescence, which is emitted after the discharge during the recombination of the adopted gas (hydrogen, H2, in the case under study). A spectrometer (Fully Automated Imaging Spectrometer iHR320, HORIBA Ltd, Kyoto, Japan) with a resolution of a few angstroms is adopted for its capability of resolving the chosen emission line ( nm or nm) coupled with a camera equipped with an intensifier (IStar 720 Andor Intensified CCD camera, Andor Technology, Belfast, UK) to increase the signal-to-noise ratio.
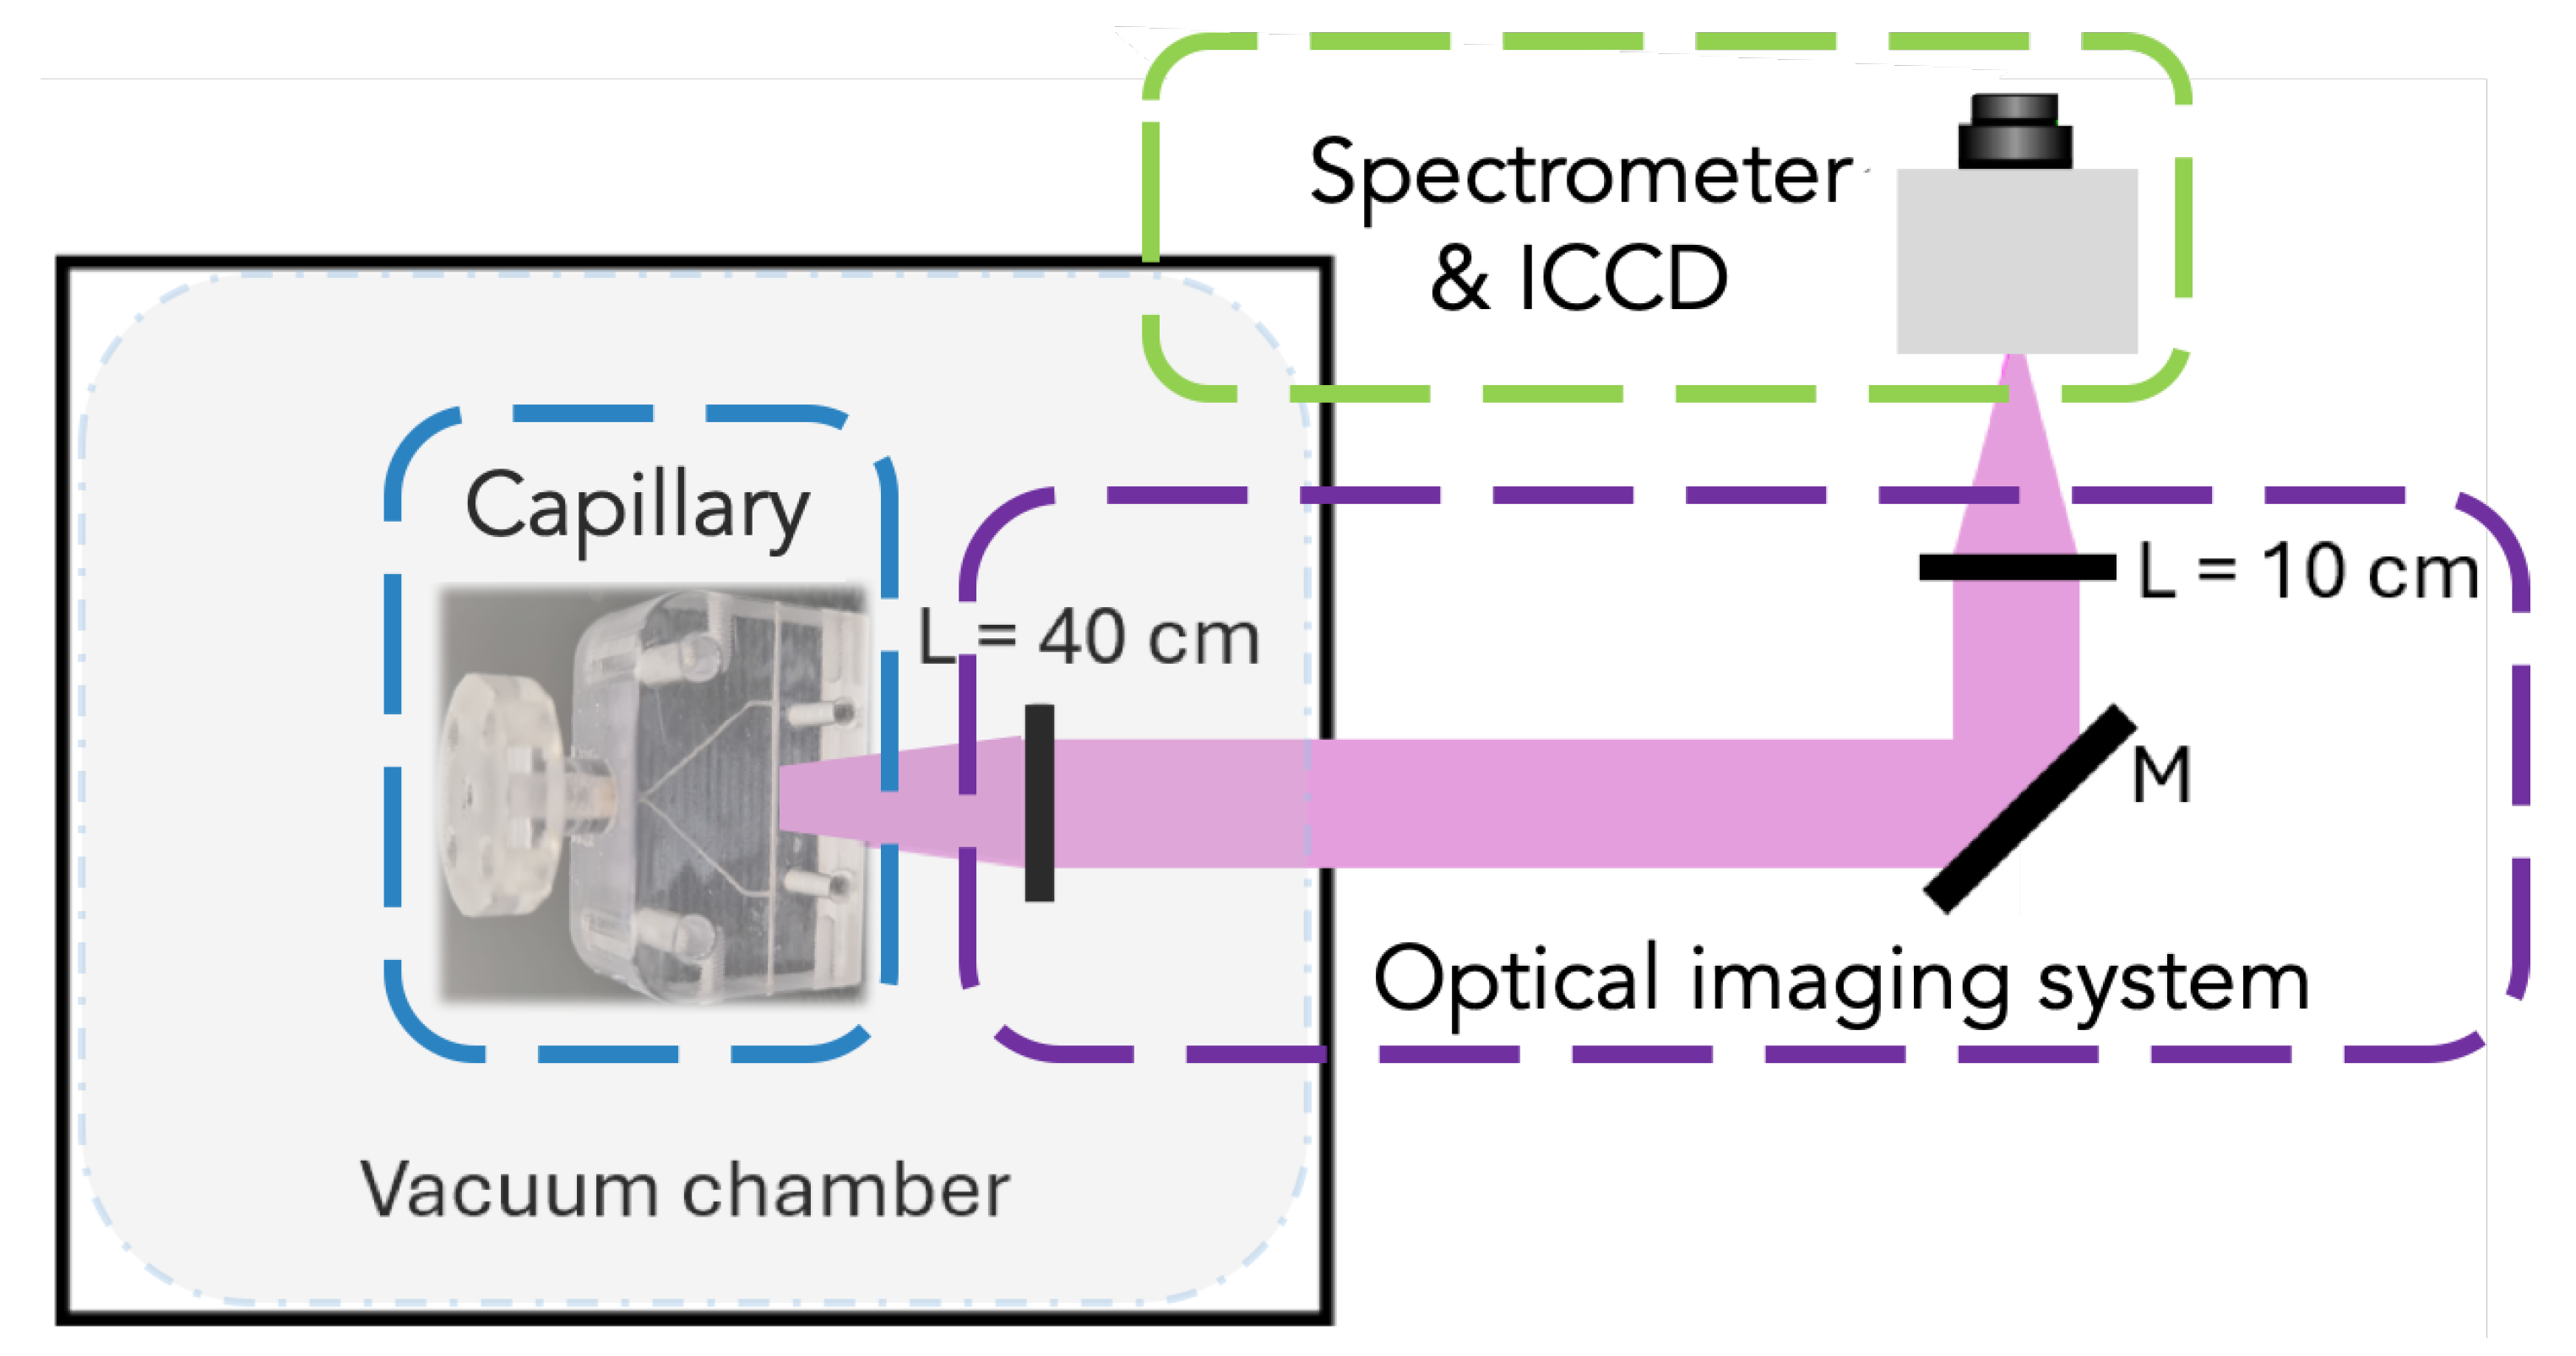
The optical setup, as shown in Figure 6, is set as follows: the two-lens system images the emitted light onto the spectrometer’s slit. The light dispersed by the gratings inside the spectrometer is collected onto a CCD camera, which requires an intensifier to increase the signal-to-noise ratio. By delaying the acquisition time, it is possible to perform a temporal scan of the longitudinal distribution of the plasma electron density profile.
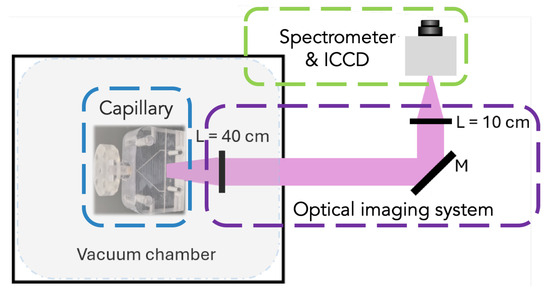
Figure 6.
Longitudinal plasma density measurement setup, consisting of an optical imaging system able to steer the plasma fluorescence in a spectrometer coupled with an intensified camera.
The duration of the plasma recombination process is about tens of ns, while the plasma discharge generally lasts for 1–2 μs, because electrons slowly exchange energy with the nuclei. Therefore, the recombination light of the emitted plasma is detectable. The ICCD gate width can be set down to 5 ns with an available scanning delay with respect to the laser pulse arrival time. In this configuration, each row of the ICCD detector image corresponds to a specific longitudinal slice of the capillary. The plasma density can be retrieved by fitting the spectral profiles with a Cauchy distribution. In turn, the plasma density [36] is determined by corresponding to the Full Width at Half Maximum (FWHM) of the fitted profiles:
where the coefficient is tabulated in Ref. [37] with values of 2.23 for the line and 9.77 for the line when assuming a 3.5 eV plasma temperature and 1018 . These adopted plasma properties are consistent with our system parameters of volume, pressure, and current [38,39].
3.2. Main Beamline Target Area at FLAME
The FLAME laser system, operating at full power, is adopted to study the physics of interactions between high-power ultra-intense laser pulses and matter. Specifically, two primary activities are carried out using the 200 TW laser:
- Electron acceleration through LWFA in a gaseous target, which can be configured as a gas jet or a gas cell/capillary.
- Generation of fast electron and light ion bunches from interactions with solid targets using the TNSA technique.
In addition to investigating the processes of particle acceleration and the radiation they emit, we tested new advanced single-shot diagnostics to thoroughly characterize the electrons emitted during interactions with both gas and solid targets.
3.2.1. Experimental TET Area Diagnostics
In the TET experimental area, both laser and plasma diagnostics are set to monitor the interaction processes. In addition, diagnostics to characterize accelerated particle beams and secondary radiation produced during the interaction in both the LWFA and TNSA configurations are adopted.
Laser Diagnostics
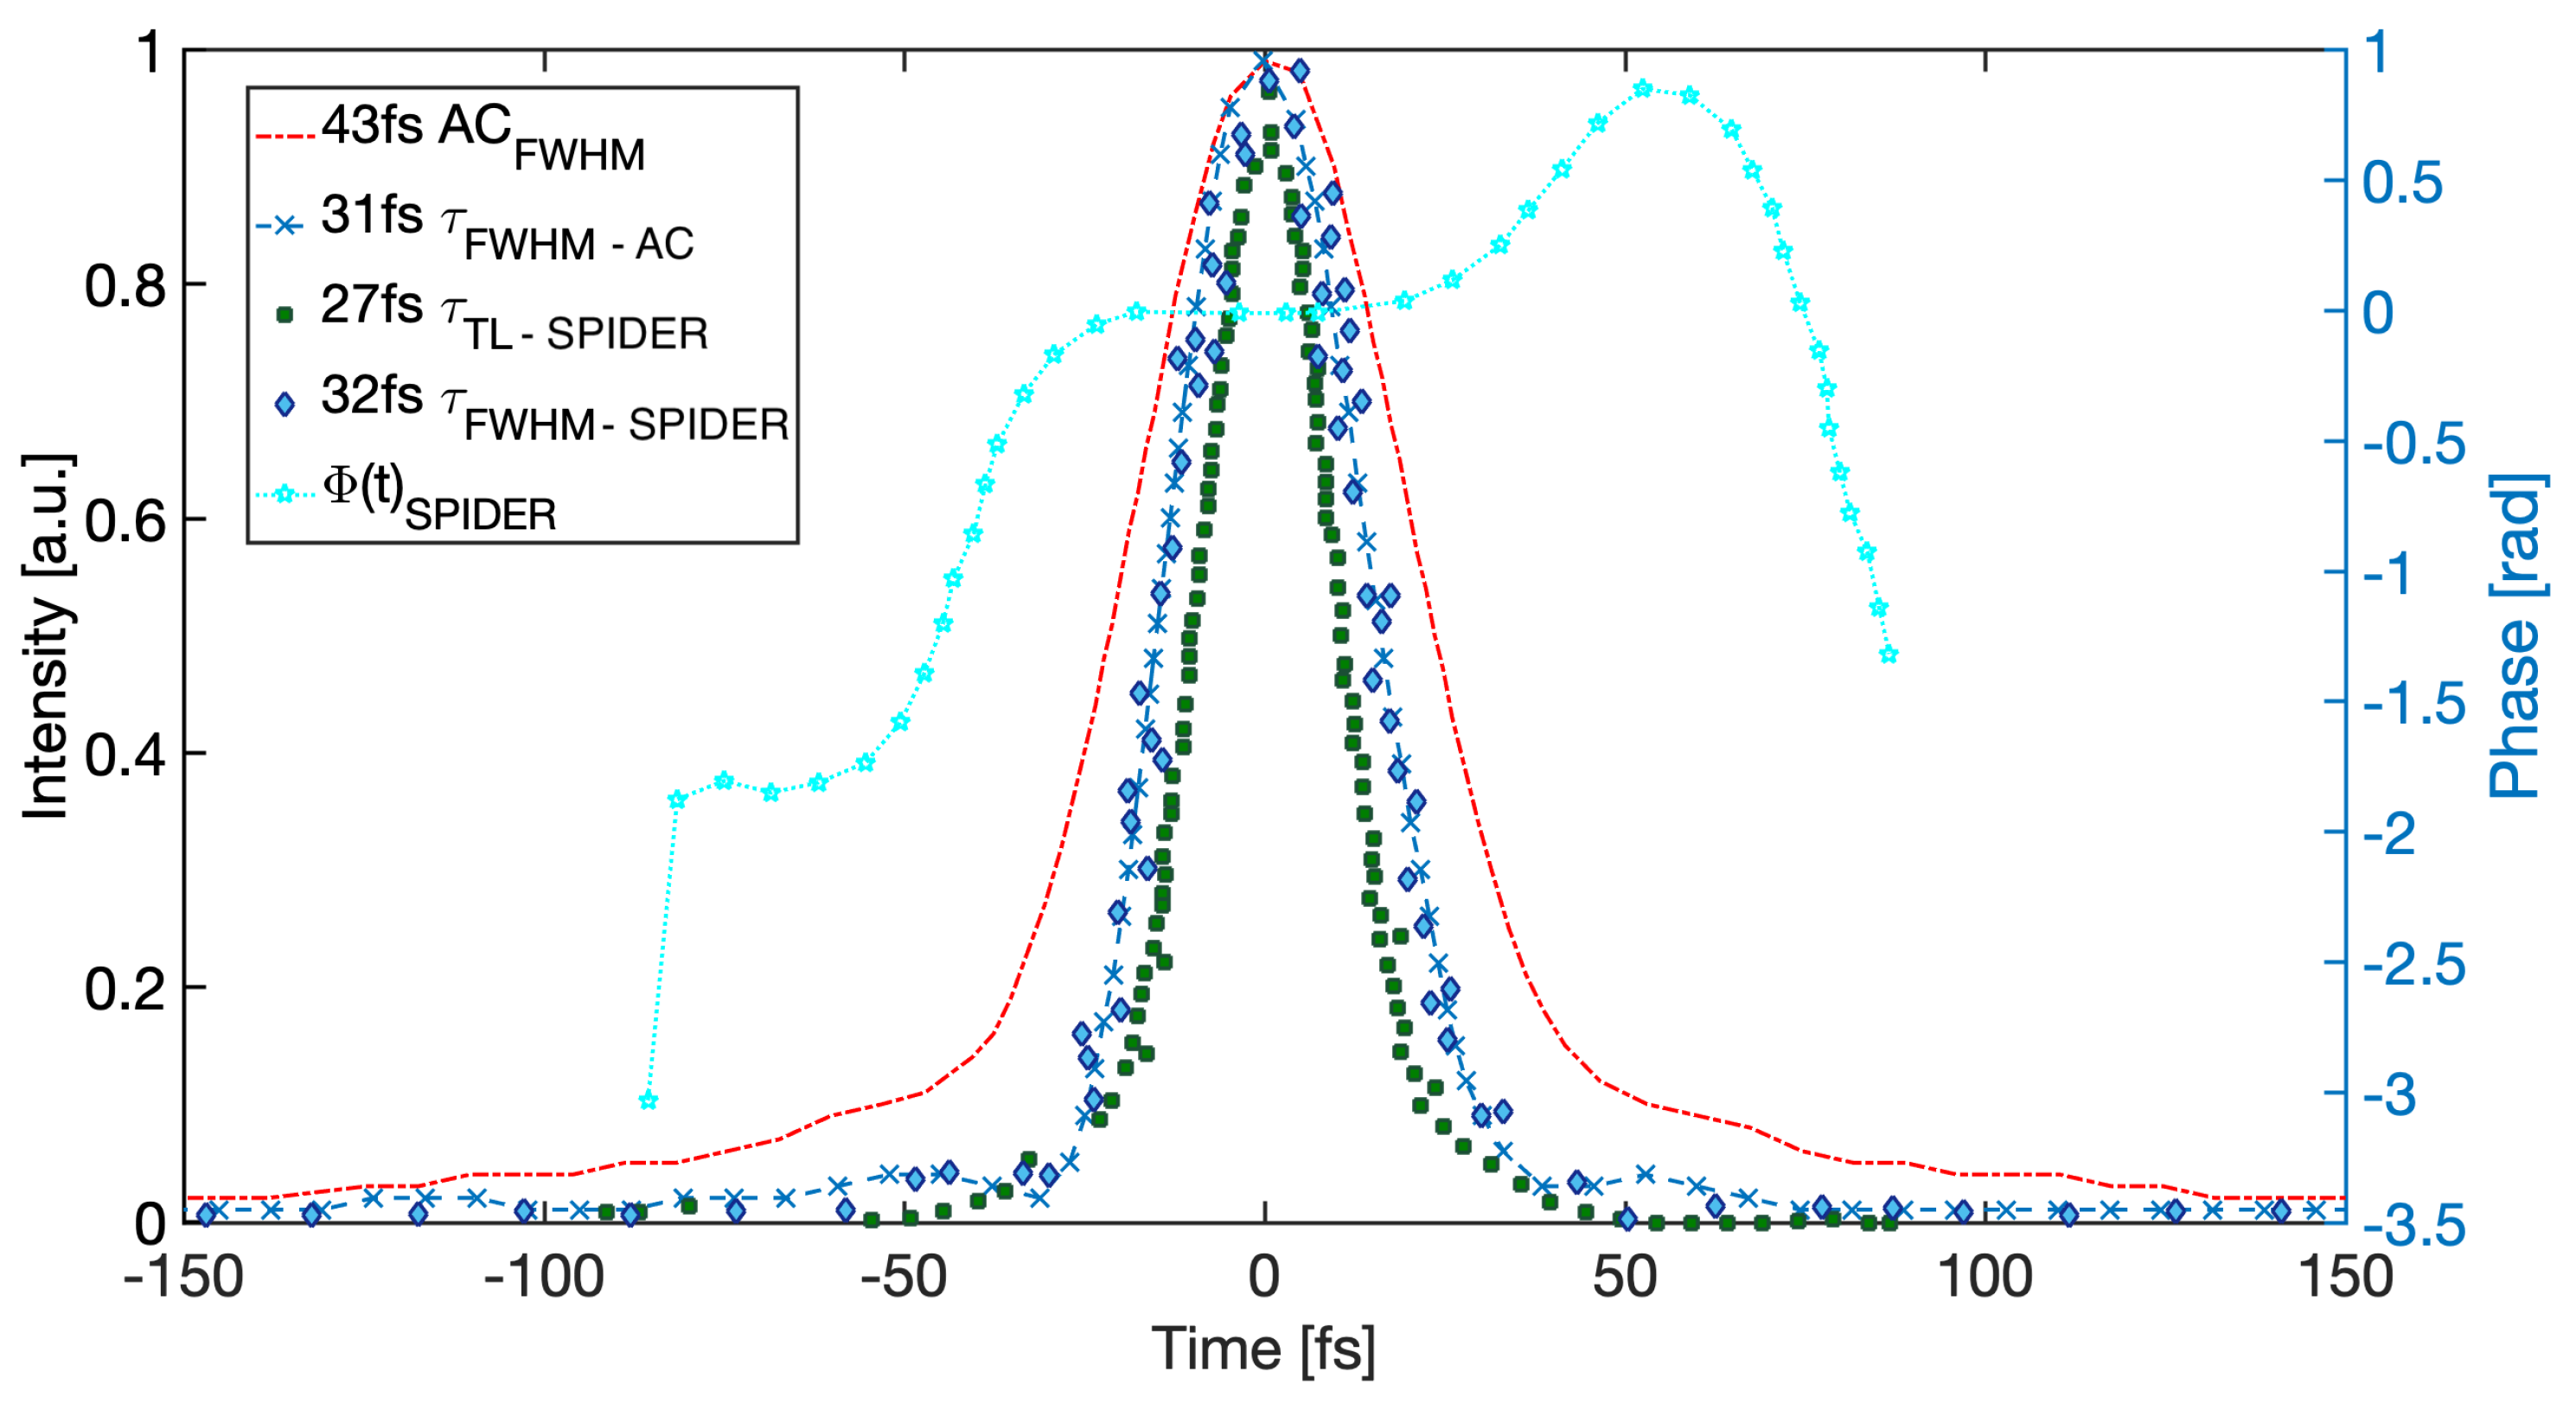
The laser pulse duration is measured by adopting an APE Spectral Phase Interferometry for Direct Electric-field Reconstruction (SPIDER), which is a spectral phase interferometer. It splits the beam into two copies: one goes through unmodified, while, the other is stretched, and finally they are recombined on a non-linear crystal by means of a spherical mirror. After the interferogram, the laser temporal duration is retrieved. The estimated laser longitudinal duration is about 30 fs FWHM. Figure 7 shows a typical temporal measurement retrieved with the APE SPIDER.
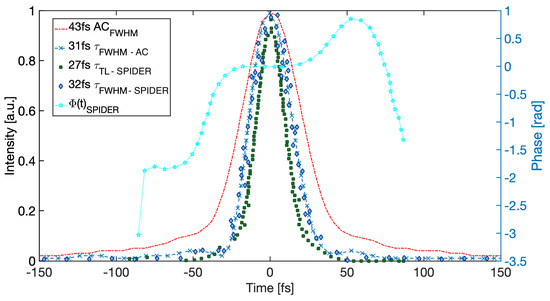
Figure 7.
Temporal measurement of the high-power beamline performed with a SPIDER diagnostics in the high-power compressor area. A simultaneous measurement has been carried out with an autocorrelation to benchmark the SPIDER measurements, and the two measurements are in excellent agreement.
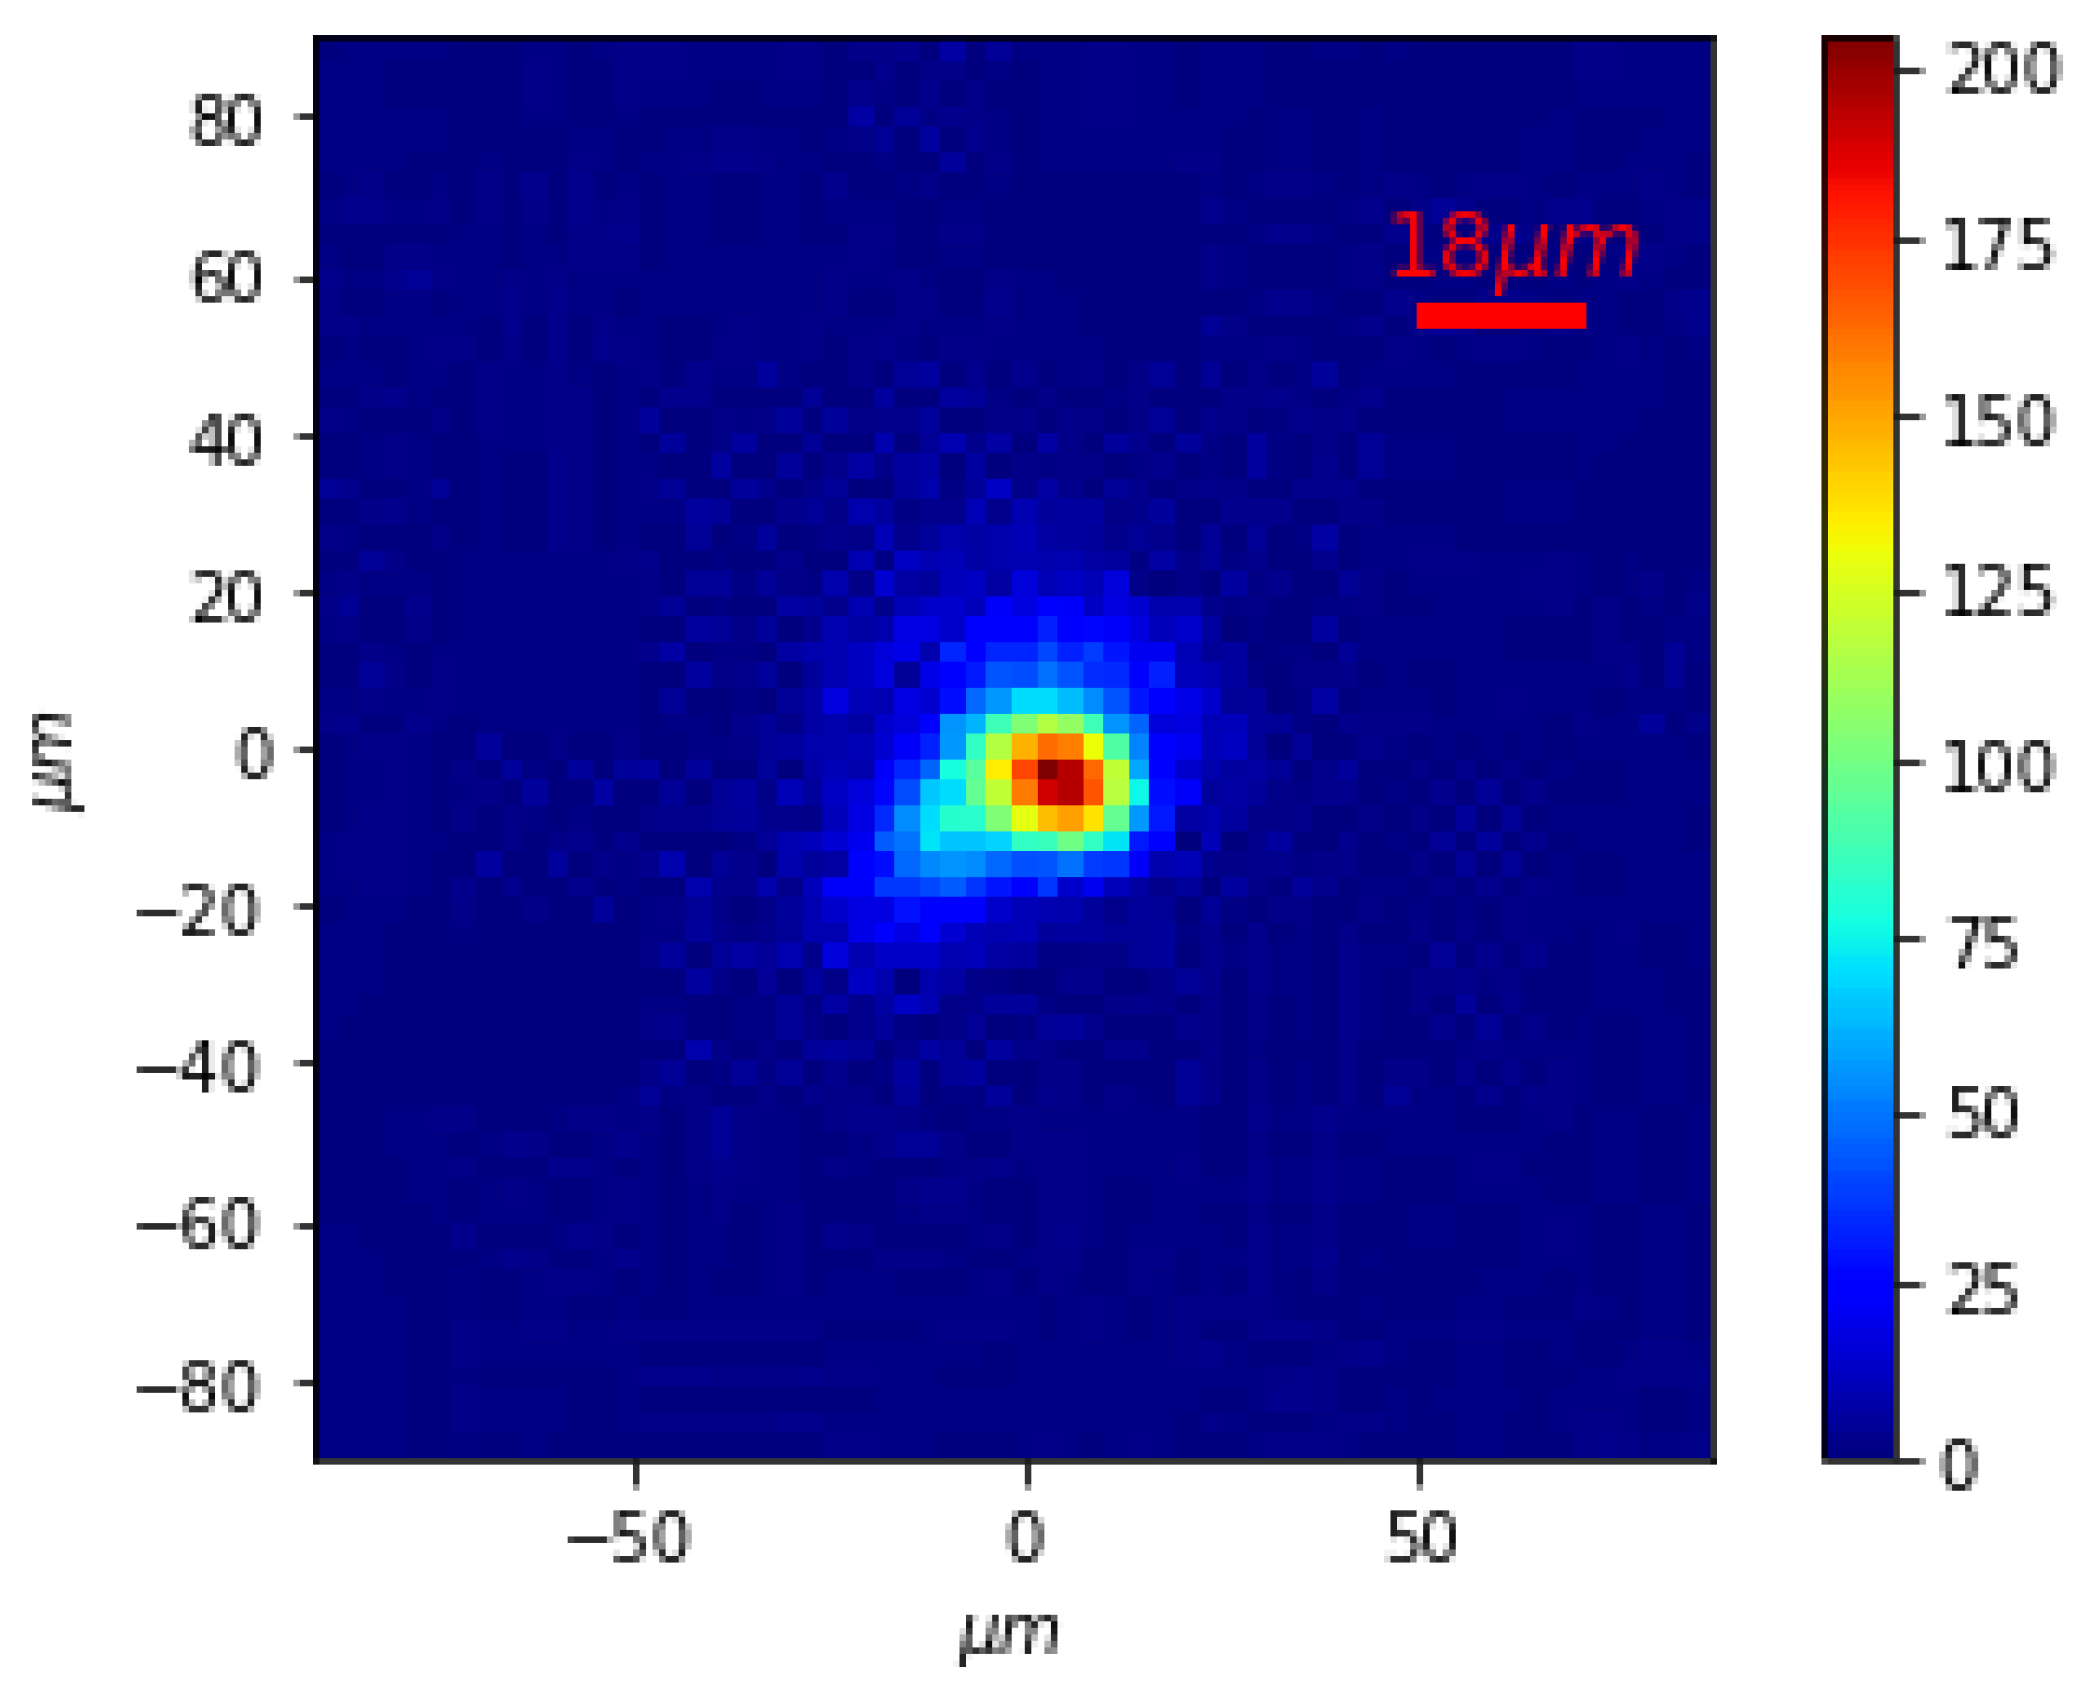
A Basler Scout scA640-70gm CCD camera (Basler, Ahrensburg, Germany) equipped with a 10× microscopic objective, with a calibration of 3 μm/pixel, is used to measure the laser focal spot at the target (gas jet) position. The beam is attenuated to avoid any detector damage. The diameter spot size at is 18 μm which is a typical transverse size measurement. Figure 8 shows the laser spot transverse distribution.

Figure 8.
Focal spot detected by a CCD camera placed in the laser focal plane in the interaction camber in the TET area.
Magnetic Spectrometer
The implemented diagnostic setup is composed of a magnetic dipole coupled with a lanex screen and a CCD camera. The magnet of the charged particle energy spectrometer is a C-shaped dipole with a gap 2.8 cm wide and 5 mm high, installed along the 0° direction (laser propagation axis). The dipole is composed of a couple of 10 cm long permanent magnets that generate a uniform magnetic field (B∼10 kG). The lanex screen is placed at 32° with respect to the propagation direction of the beam. A simulation of the spectrometer operations is shown in Figure 9.
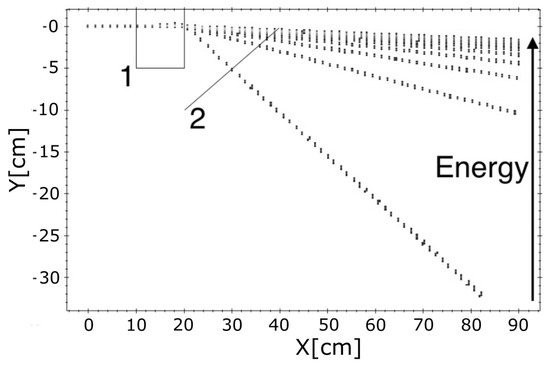
Figure 9.
General Particle Tracer (GPT) simulations were conducted for the design of the electron energy spectrometer. Lower-energy electrons exhibit a much greater degree of bending compared to higher-energy electrons. The plot shows two key components: (1) the 1T dipole, and (2) the lanex screen intercepting the bent electron trajectories.
This setup aims to obtain a better resolution for low-energy (lower than 300 MeV) electrons, with a resolution of 0.5 MeV. An example of the detected electron energy spectrum is reported below in the Section Scintillator Screen Diagnostics for the highest available laser energy.
The dipole spectrometer makes possible the measurement of charged particles energy spectrum within the 50–500 MeV range. However, there are some limitations: in the absence of a collimator, the divergence and transverse beam size may impact the accuracy of the measurements. Additionally, the presence of X-rays and -rays generates background noise on the scintillator used to detect the bent particles, potentially leading to systematic errors.
EOS Detector
The diagnostics based on EOS enable time-resolved measurements of relativistic electron charge, mean energy, and temporal length [40,41]. The EOS diagnostics are based on a 500 m thick ZnTe crystal. By adopting the spatial encoding technique [42] and the probe laser intersecting the crystal at incidence angle, the emitted electron’s temporal profile is mapped onto the probe laser transverse profile. The temporal resolution of our experimental setup is about 100 fs with a time window of about 10 ps.
The Coulombian electric field encoded in the EOS-probe signal is retrieved adopting a polarizing optics placed after the ZnTe crystal, as shown in Figure 10. The polarizer is oriented perpendicularly (90°) to the input laser polarization, resulting in no light transmission when there is no EO-induced phase retardation. This setup facilitates the conversion of probe polarization modulation into intensity modulations, with the diagnostic signal easily detectable using a CCD camera. Figure 11 shows the electric field encoding process. The CCD camera records the signal generated by the total overlap, namely temporal and spatial, of the probe laser and the locally induced birefringence by the interaction yield electric field.
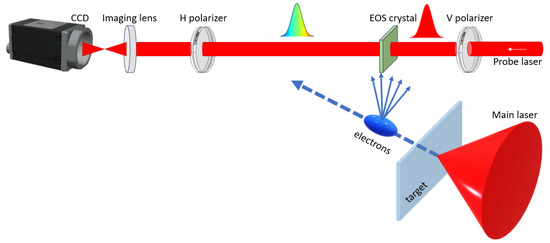
Figure 10.
The main beam of the FLAME laser is focused on a stainless steel target, producing a beam of relativistic electrons and electromagnetic pulses. These interaction outputs cause a local birefringence in a ZnTe crystal, enabling a linearly polarized laser passing through the crystal to probe this effect and, in turn, retrieve the yield properties. Adapted from Ref. [19].
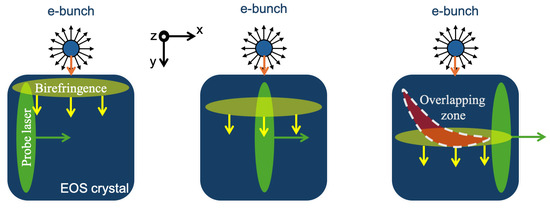
Figure 11.
Spatial encoding process description for the electron bunches propagating a few mm below the EOS crystal along the y-axis (orange arrow): (left) The Coulomb field locally induces birefringence in the crystal. (center) As the electron bunch propagates along the y-axis, in turn, its electric field moves accordingly through the crystal so the local birefringence shifts downward. (right) The synchronous probe laser traversing the crystal rotates its polarization in the overlapping zone, meaning the resulting signal is generated in this region where the birefringence and the probe laser are coinciding both temporally and spatially. Adapted from Ref. [20].
The bunch generates an electric field, which induces the electro-optic effect, proportional to its charge. The latter can be evaluated from the intensity of the signal, thus the EOS diagnostics act as a temporally resolved charge measurement with a resolution on the order of femtosecond. In addition, in the EOS signal width is encoded with the temporal length of the bunch as shown in Figure 11 and described in Ref. [20].
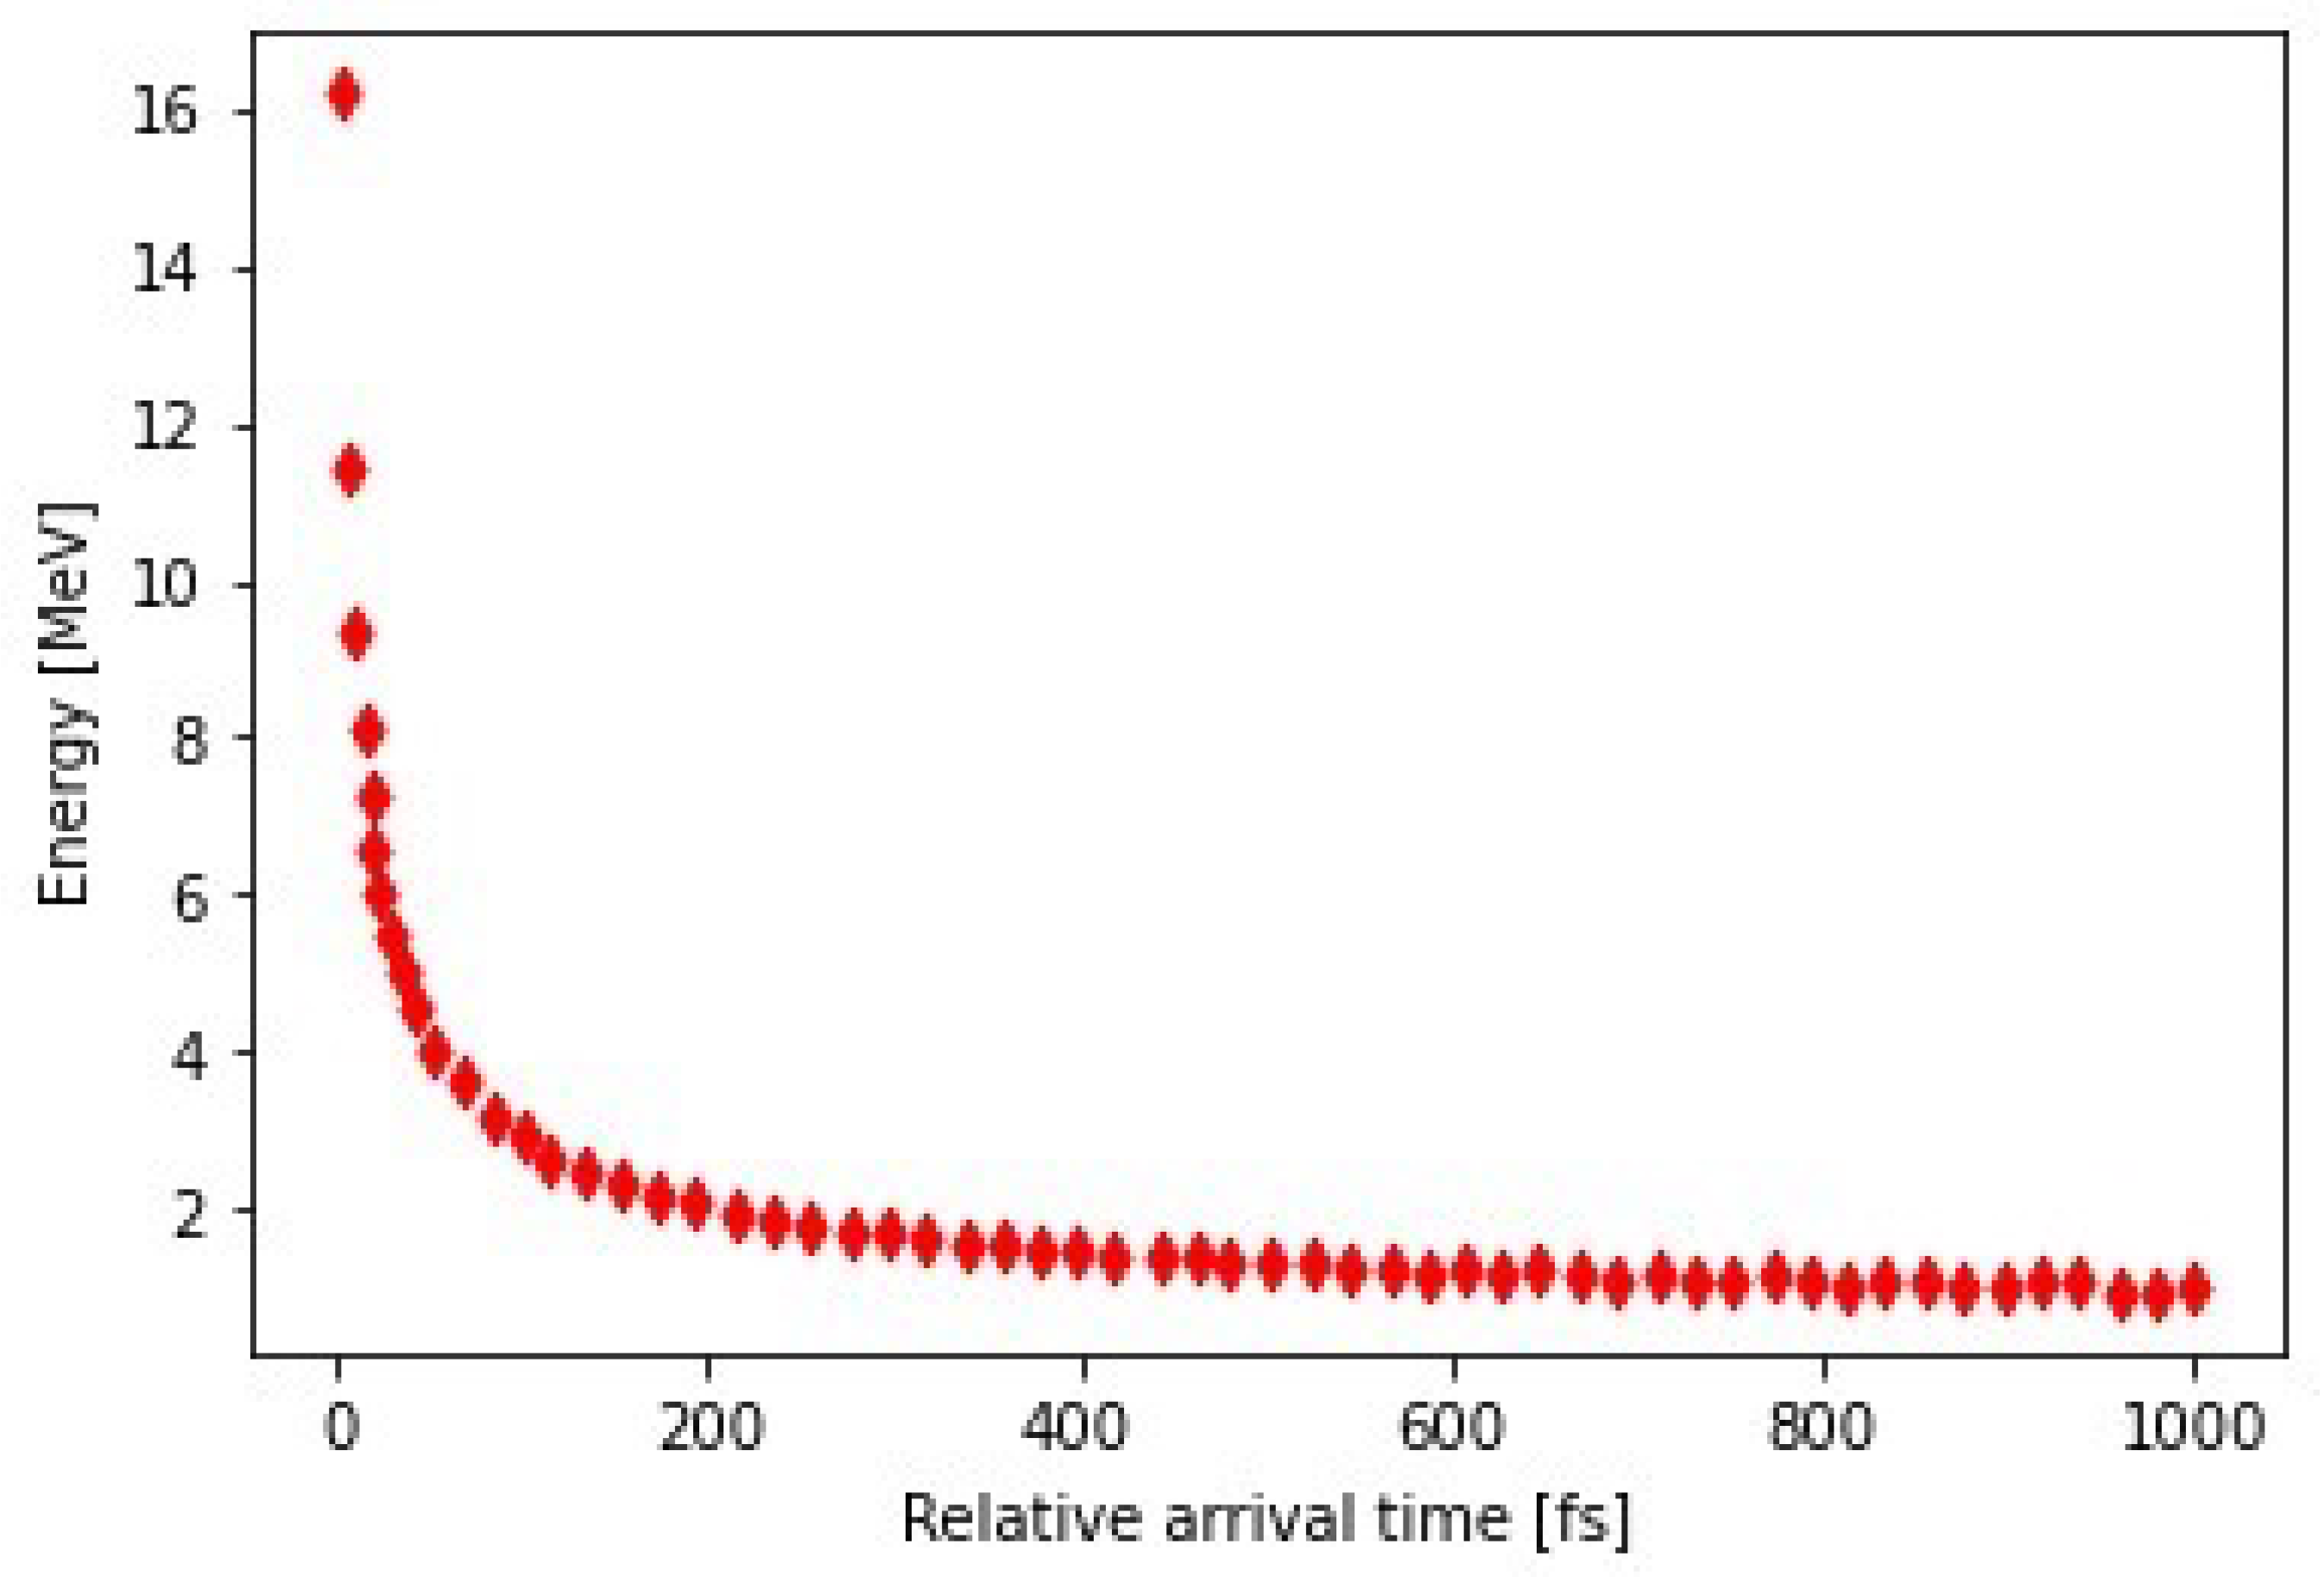
Furthermore, our EOS diagnostics can work as a time-of-flight monitor [42,43], providing energy measurements resolved in time (see Figure 12).

Figure 12.
Calibration of diagnostics in relation to time-of-flight (TOF) measurements. Each point represents a single step in the delay line (3 fs).
It should be highlighted that these diagnostics can be applied on electron bunches produced both in LWFA and PWFA experimental campaigns.
Interferometry
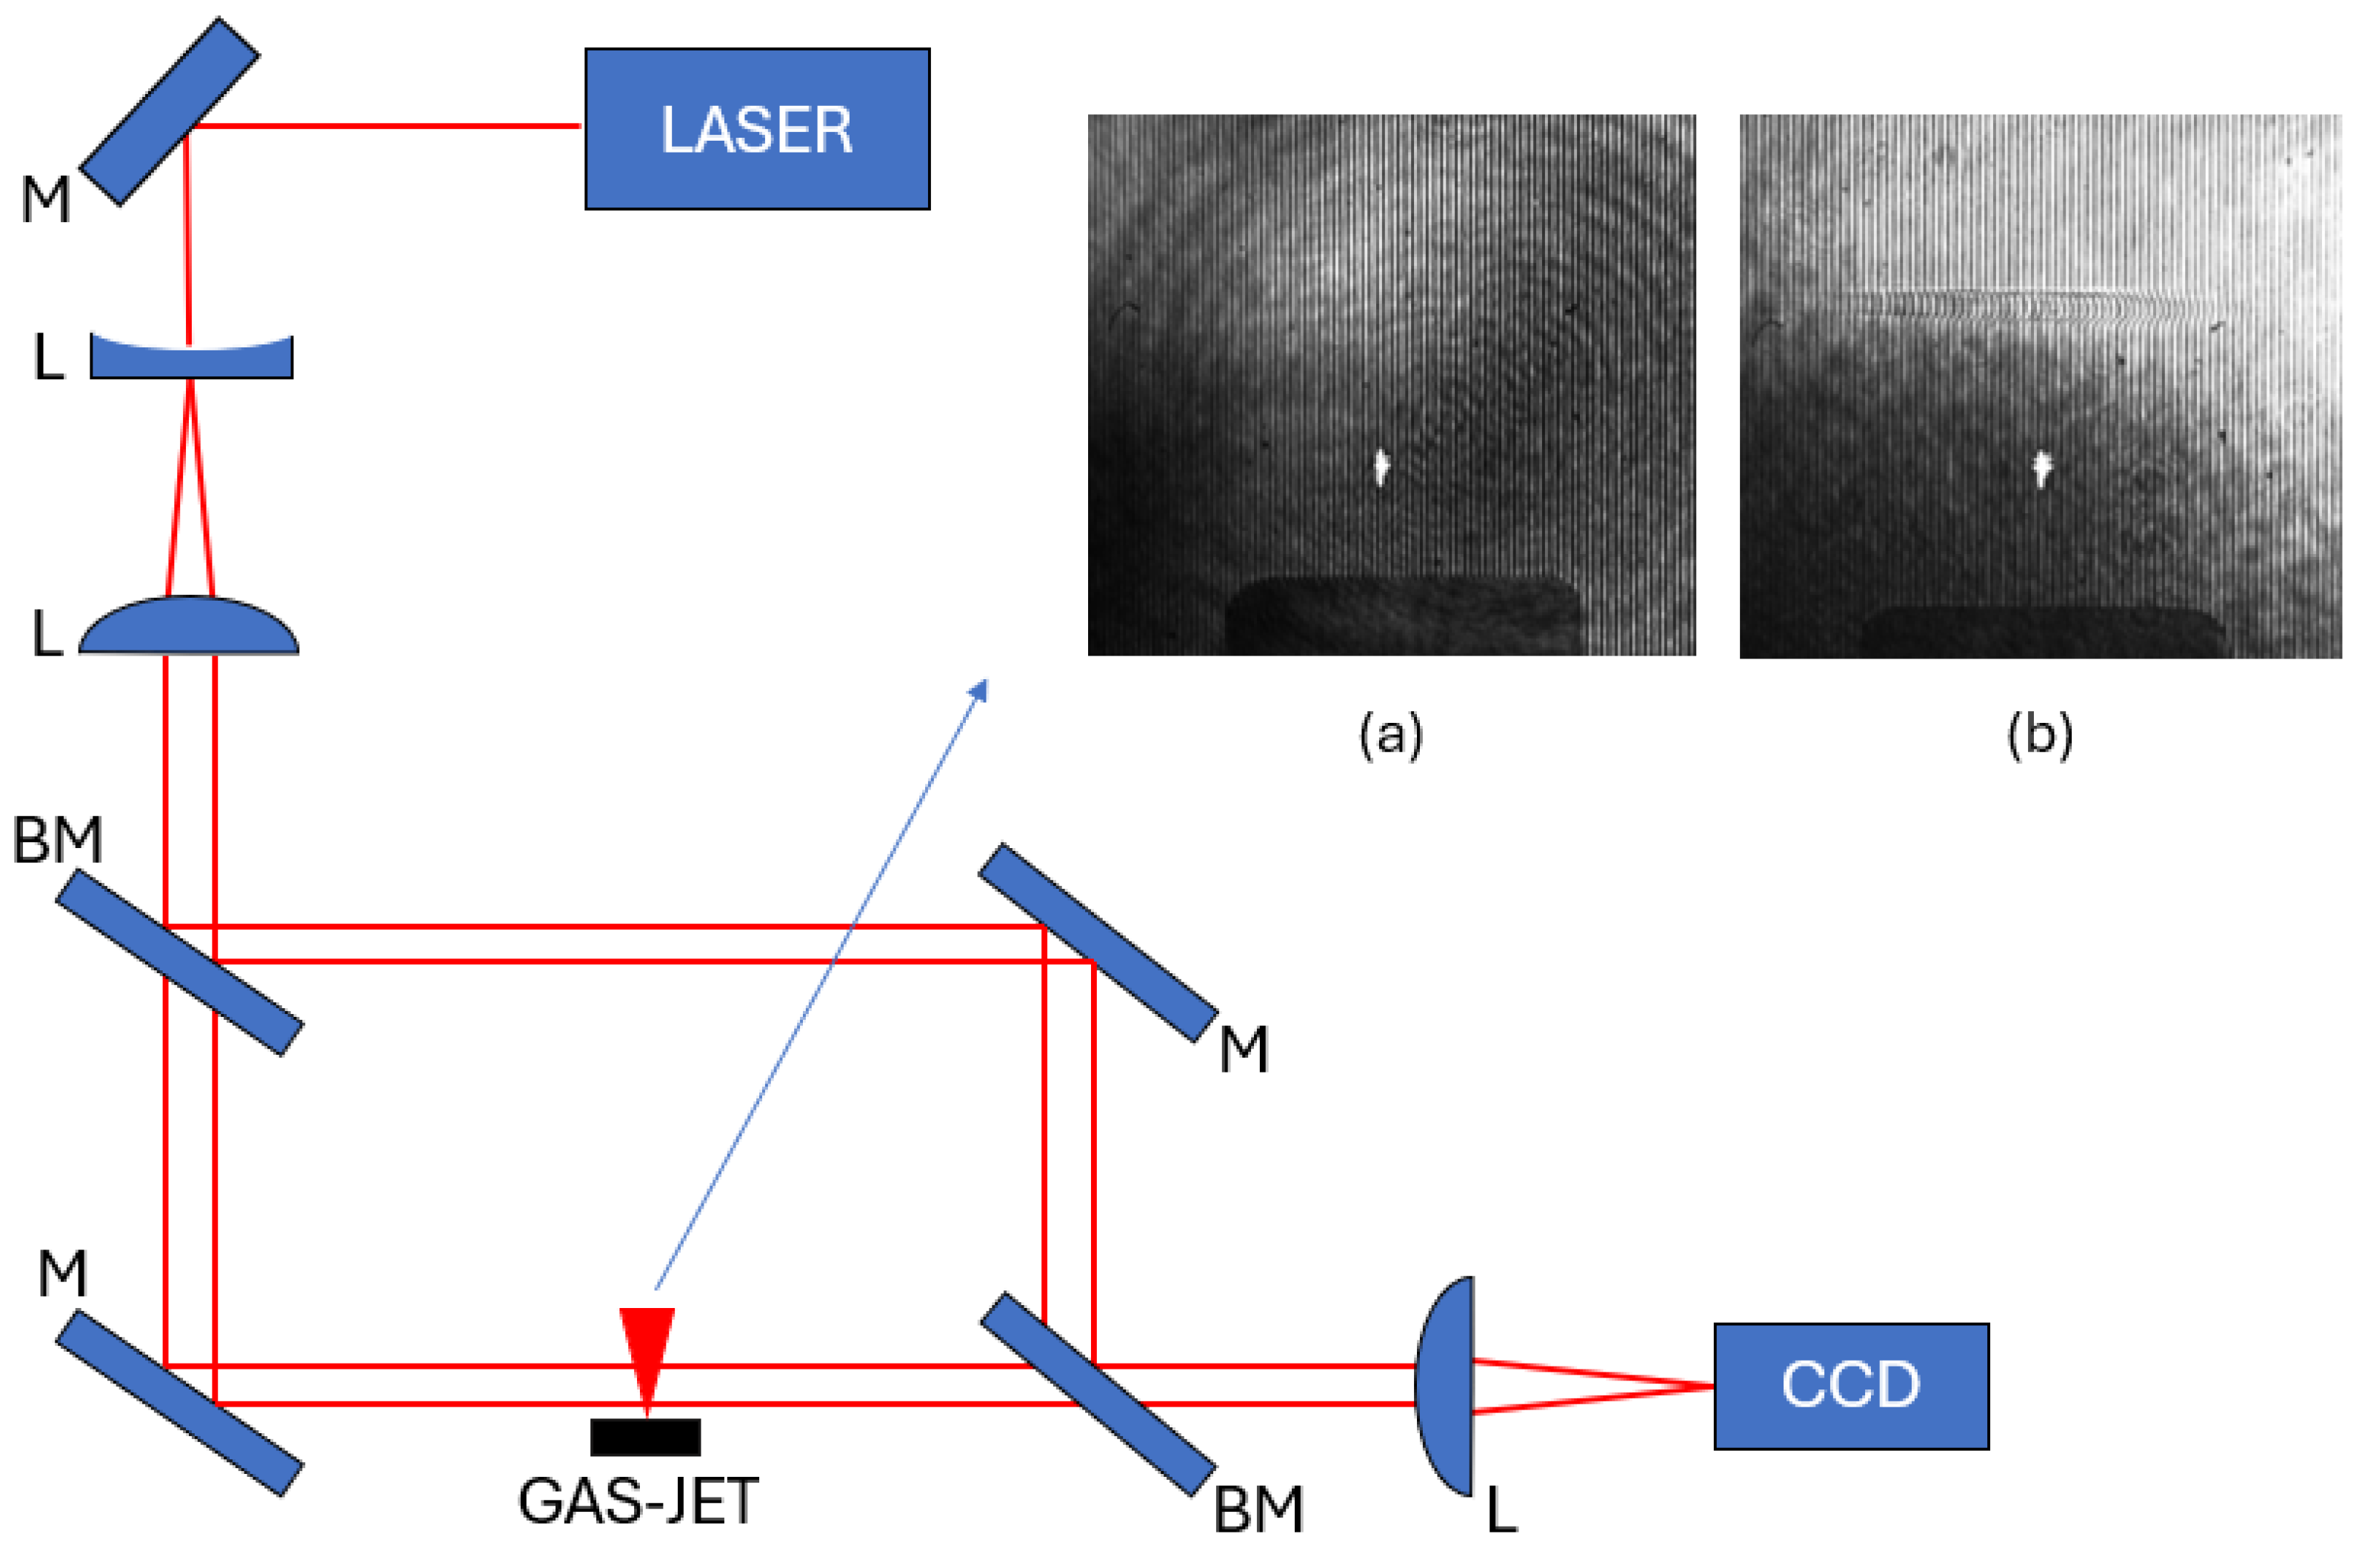
Interferometry plays a crucial role in investigating gas and plasma densities in plasma-based acceleration experiments. At the FLAME test facility, a Mach–Zehnder interferometer coupled with a probe beam is adopted for a plasma density diagnostics, as depicted in Figure 13. Within the interaction chamber, the probe beam is divided into two identical beams. One passes through the gas or plasma, while the other, acting as the reference, travels through a vacuum path of the same length. Finally, a second beam splitter merges the two beams, and the resulting interference fringes are captured by a CCD camera (Basler scA640-70gm, Basler AG, Ahrensburg, Germany). Additionally, a lens is included in the setup to allow for adjustments in image magnification.
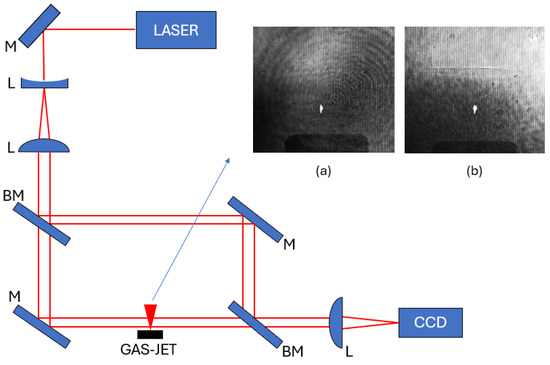
Figure 13.
Mach–Zehnder interferometer setup scheme for plasma density measurement. (a) Interferogram without plasma, (b) interferogram with plasma.
The retrieved interferogram allows us to determine the refractive index of the medium crossed by the first beam. The fringes will be uniform along the overlap of the two beams if they pass through the same medium (Figure 13a). If one of the branches passes through a different medium, it will be subject to a phase shift and the fringes will have a different shape (Figure 13b). It is possible to measure the phase difference between the two cases, which depends on the different refractive indices between the vacuum and the plasma. From this measurement, applying the Abel inversion technique [44], we are able to retrieve the actual plasma density.
BCM Diagnostics
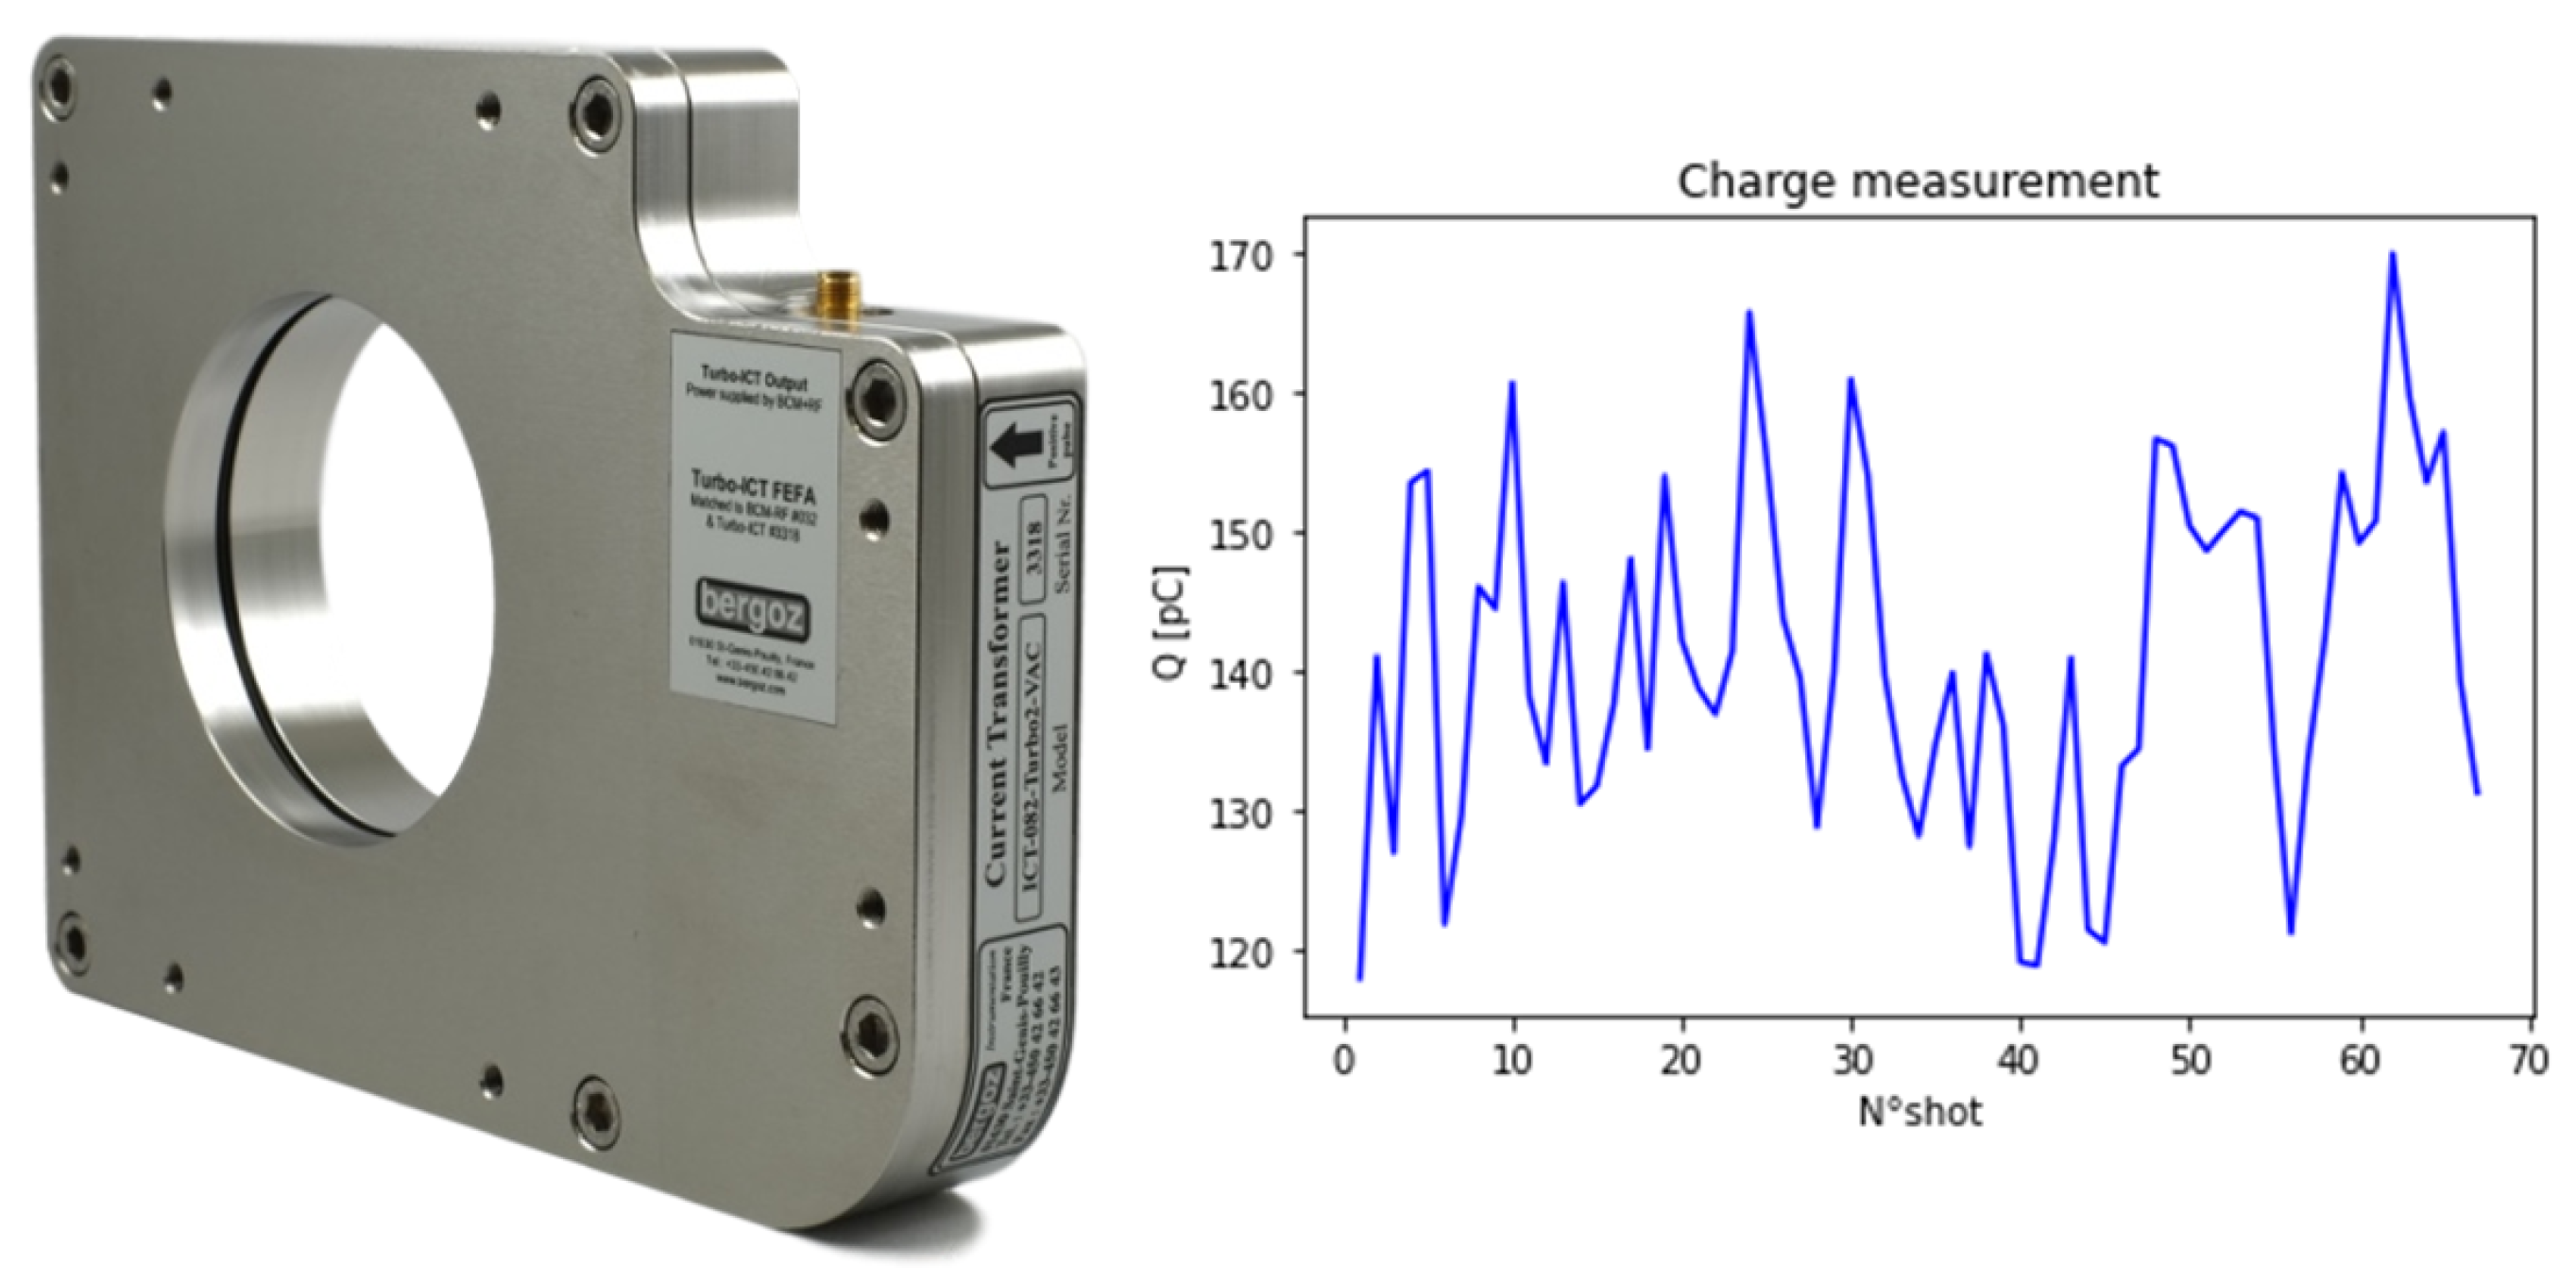
The accelerated bunch charge is measured using an Integrating Current Transformer (ICT) with a Beam Charge Monitor (BCM).
The ICT is a fast-readout transformer with capacitive bypassing, integrated into a common magnetic circuit. It is designed to measure charge in extremely short pulses with high precision and minimal noise. This detector is coupled with the Bergoz BCM (Bergoz, Saint Genis Pouilly, France), which processes the signal from the ICT. The latter has a bipolar voltage output that is directly proportional to the beam charge.
The charge detector is the ICT 082 Turbo2 VAC (Baden-Württemberg, Germany) (Figure 14) with an 82 mm aperture and 30 mm thick circular sensor. It is positioned at 1 m downstream of the interaction point on the laser propagation axis. The ICT is vacuum compatible down to mbar. This detector allows measurements of low charge bunches, with length ≤ 100 ps and a resolution of 10 fC/pulse or 1% of the charge. The maximum acquisition rate is ≤2 MHz.
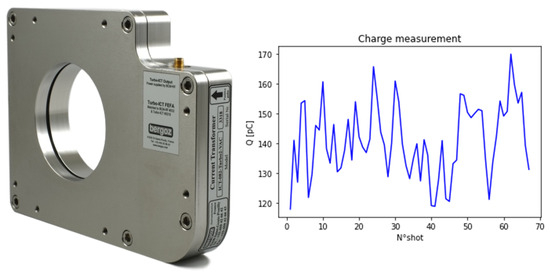
Figure 14.
ICT -082-Turbo2-VAC model for charge detection and a typical bunch charge measurement.
X-CCD Diagnostics
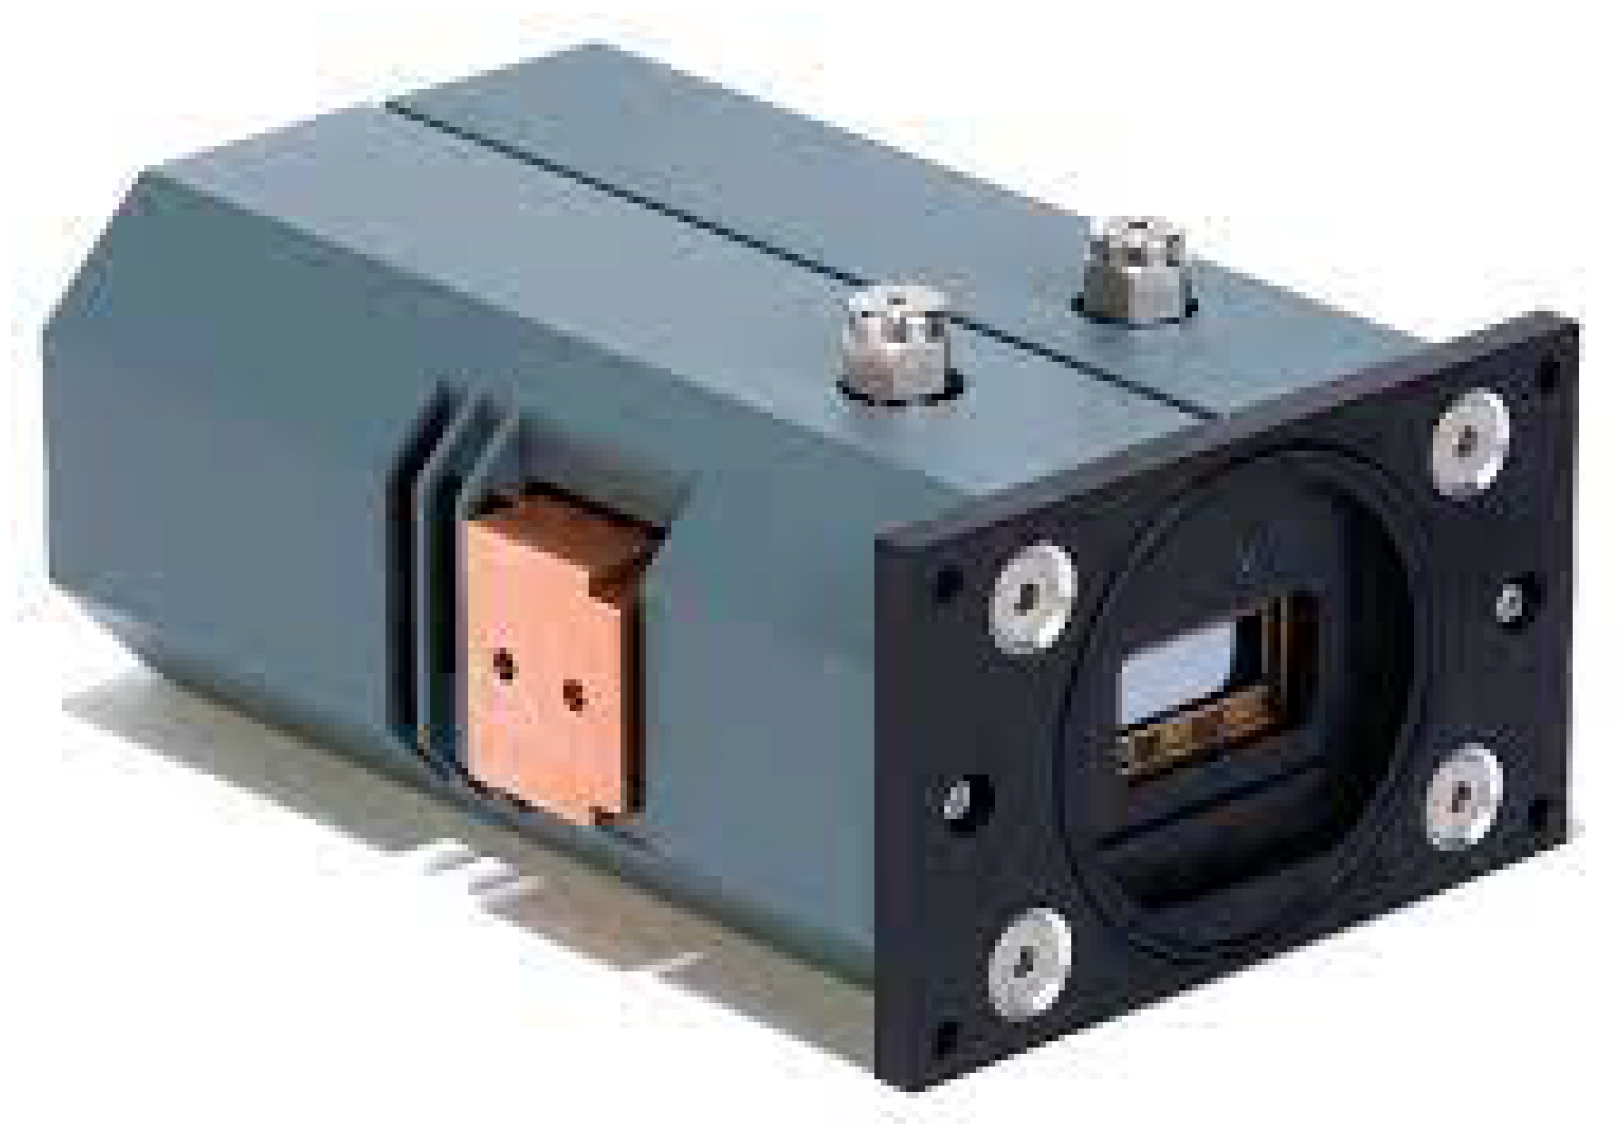
The X-ray radiation emitted during the laser–plasma interaction is detected by a CCD-X camera. The detector is an Andor DX 420 BR-DD (Andor Technology, Belfast, UK) in Figure 15, where BR-DD stands for Back-Illuminated CCD, Deep Depletion NIR AI coating. The chip consists of 1024 × 256 active pixels corresponding to a 26.6 × 6.7 mm2 size. It can work at (down to ) to reduce thermal noise and it is vacuum compatible down to mbar. The radiation diagnostics is at the end of the interaction chamber at about 60 cm from the interaction point along the laser propagation axis. The residual laser light is shielded by a 16 m thickness aluminum (Al) filter placed on the camera.

Figure 15.
Andor DX 420 BR-DD for X-ray detection.
The CCD-X, in addition, is used as a spectrometer in single-photon counting mode, i.e., with low X-ray fluxes.
Thomson Diagnostics
Thomson scattering is a phenomenon due to electron–photon collisions during the laser–plasma interaction. With the diagnostics based on this process, it is possible to check the propagation of the laser pulse and its interaction with the gas jet and to measure the plasma channel length to optimize the conditions for the acceleration process.
The experimental diagnostic setup consists of an objective with a focal length of 70 mm coupled with a CCD (Basler scA640-70gm) (Basler AG, Ahrensburg, Germany) and a band-pass filter centered at 800 nm. It collects the Thomson scattering light at 90° with respect to the laser propagation axis and obtains a magnified image of the interaction point.
Scintillator Screen Diagnostics
Lanex screens are used to measure the beam profile and the electron energy spectrum when they are coupled with a magnetic spectrometer.
A lanex foil is a Gd2O2S:Tb inorganic scintillator with a high conversion efficiency of both X-ray and electron beams, emitting in the blue–green spectral region. The light produced by the screen is collected by a CCD camera. These diagnostics provide information about the electron divergence when the lanex foil is placed after the interaction point, in the direction of laser propagation, and observed by a CCD (in this case, a Basler scA640-70gm) as shown in Figure 16.
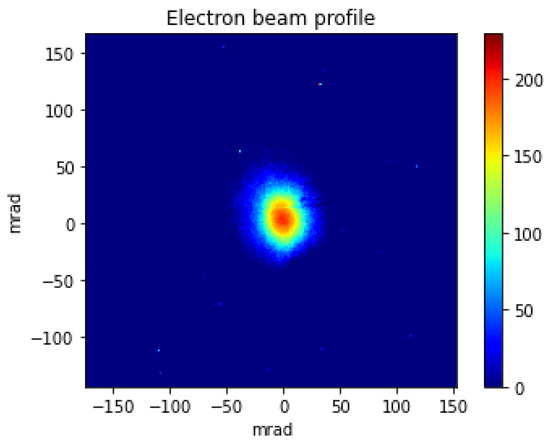
Figure 16.
Electron beam profile with 30 mrad FWHM divergence.
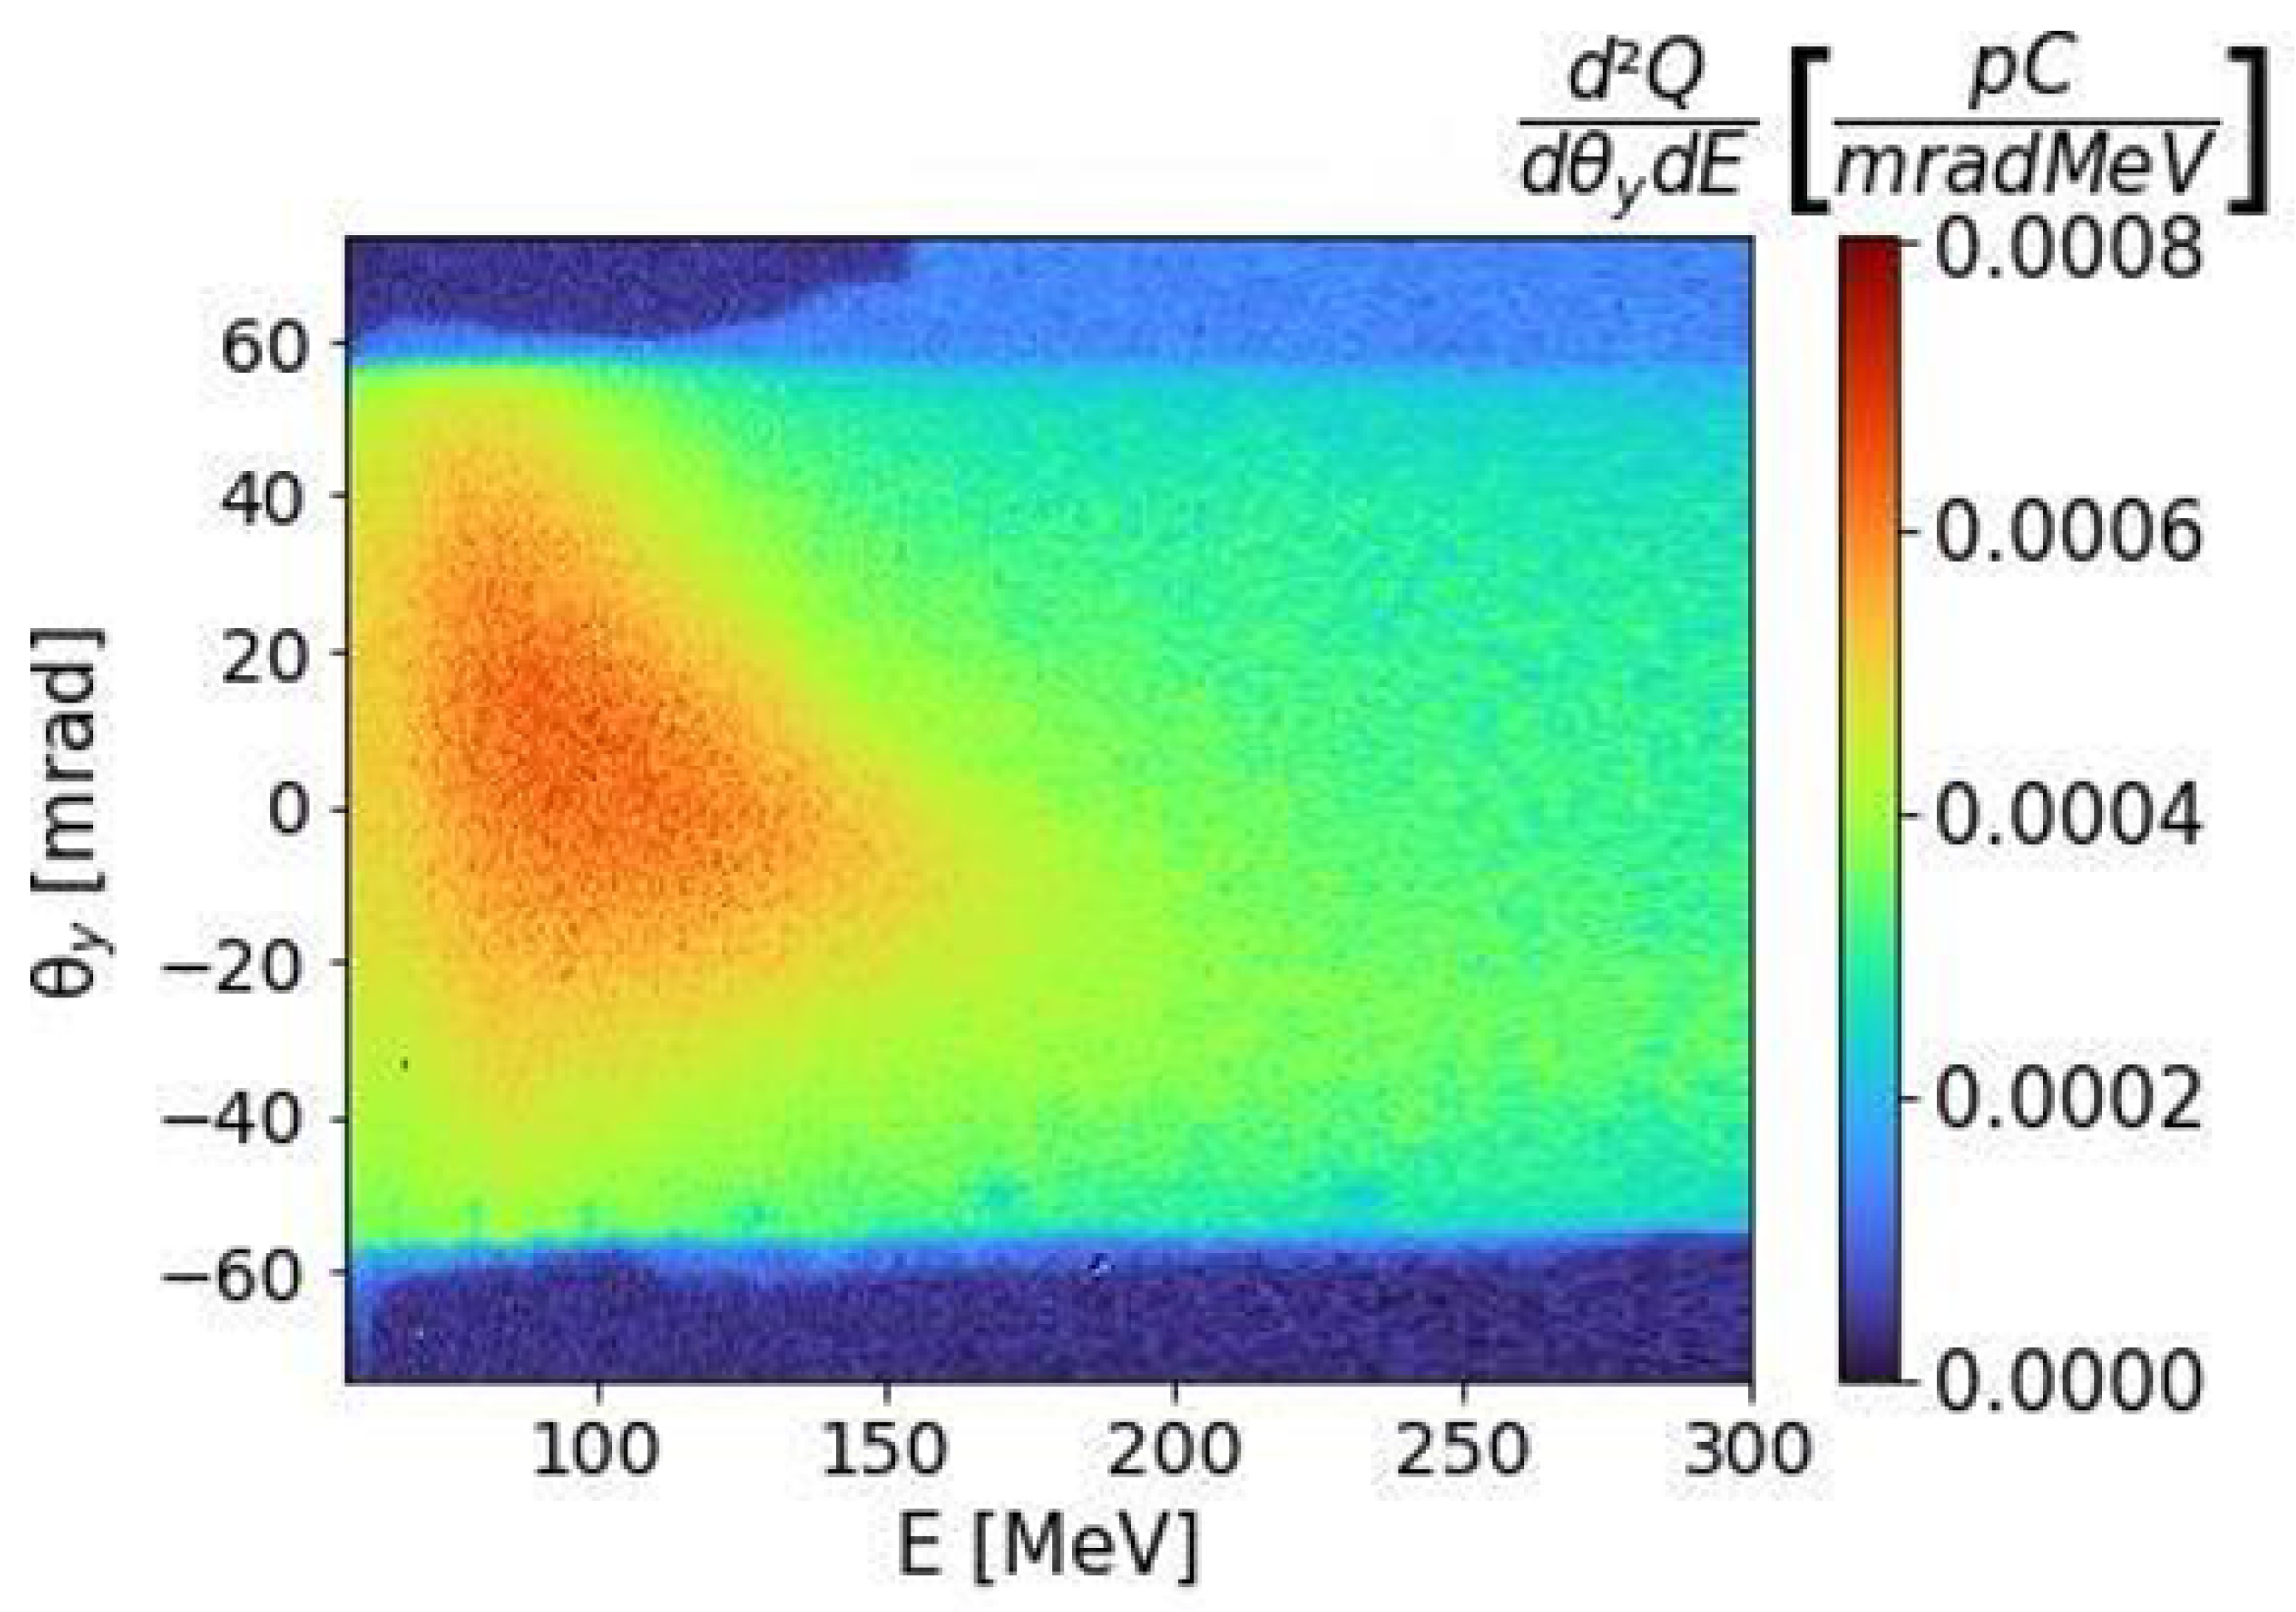
By coupling the lanex screen to a magnetic spectrometer, the energy spectrum of the electrons can be measured as shown in Figure 17, where the scintillator foil is placed at 32° with respect to the laser propagation axis, as mentioned above.
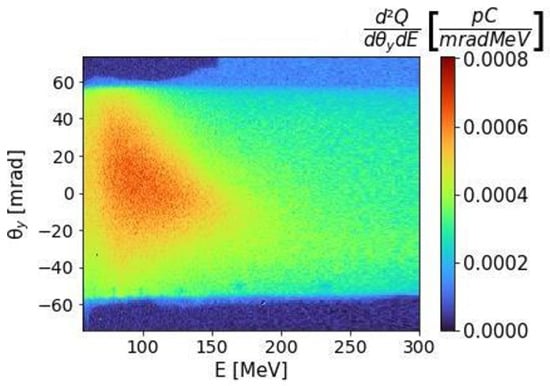
Figure 17.
Electron beam spectral content retrieved by coupling the lanex screen to a magnetic spectrometer.
3.2.2. Laser–Gas Jet Interaction Experimental Campaign
LWFA experiments have been performed with the FLAME laser at SPARC_LAB since 2016. Non-linear excitation of electron plasma waves in the wake of an ultra-intense laser pulse allows for the generation of extremely large local electric fields. These fields can be used for the acceleration of electron beams to ultra-relativistic energies. Electron beams at FLAME were accelerated in the laser-driven plasma wakefields via the self-injection scheme. In this scheme, the background plasma acts as the reservoir of the electrons that form the final accelerated beam. Plasma electrons can be injected from the rear-front of the plasma wave. In 2016, at FLAME we reached an acceleration of electrons to several hundred MeV in a few mm, corresponding to an acceleration gradient of the order of GV/cm. In Figure 18, a typical spectrum of electron kinetic energy is reported, showing a mean energy of 320 MeV and a relative energy spread of 20% for a bunch of electrons carrying ∼100 pC charge.
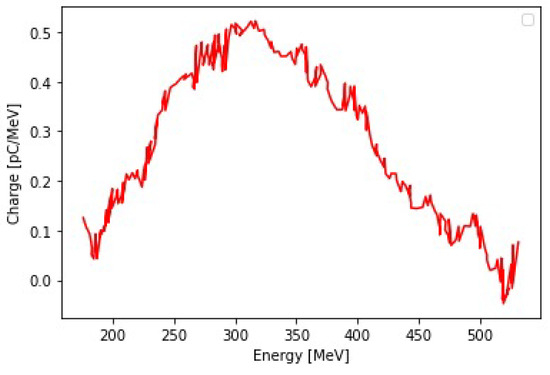
Figure 18.
Energy spectrum of LWFA electron beams generated by the FLAME laser. Mean electron kinetic energy ∼320 MeV, relative spread 20%, bunch charge ∼100 pC.
Acceleration to 320 MeV was obtained by the interaction between the laser pulse and the helium gas ejected by a supersonic gas nozzle, over an acceleration length of ∼1 mm and 1019 cm−3. The length of the plasma channel has been measured by means of Thomson scattered light. The electron plasma density was characterized through of a Mach–Zehnder interferometer.
Electron acceleration in laser–plasma wakefields is accompanied by the emission of so-called betatron radiation. Acceleration is due to an electric field polarized along the propagation direction of the laser driver pulse. However, plasma wakefields also provide transverse focusing fields putting the injected electrons into oscillation. Such oscillations are called betatron oscillations. Focusing fields provide transverse oscillations, with the consequence of an efficient emission of radiation. Betatron radiation is synchrotron-like, where the radiation spectra can extend from soft X-rays to -rays [45,46,47,48,49].
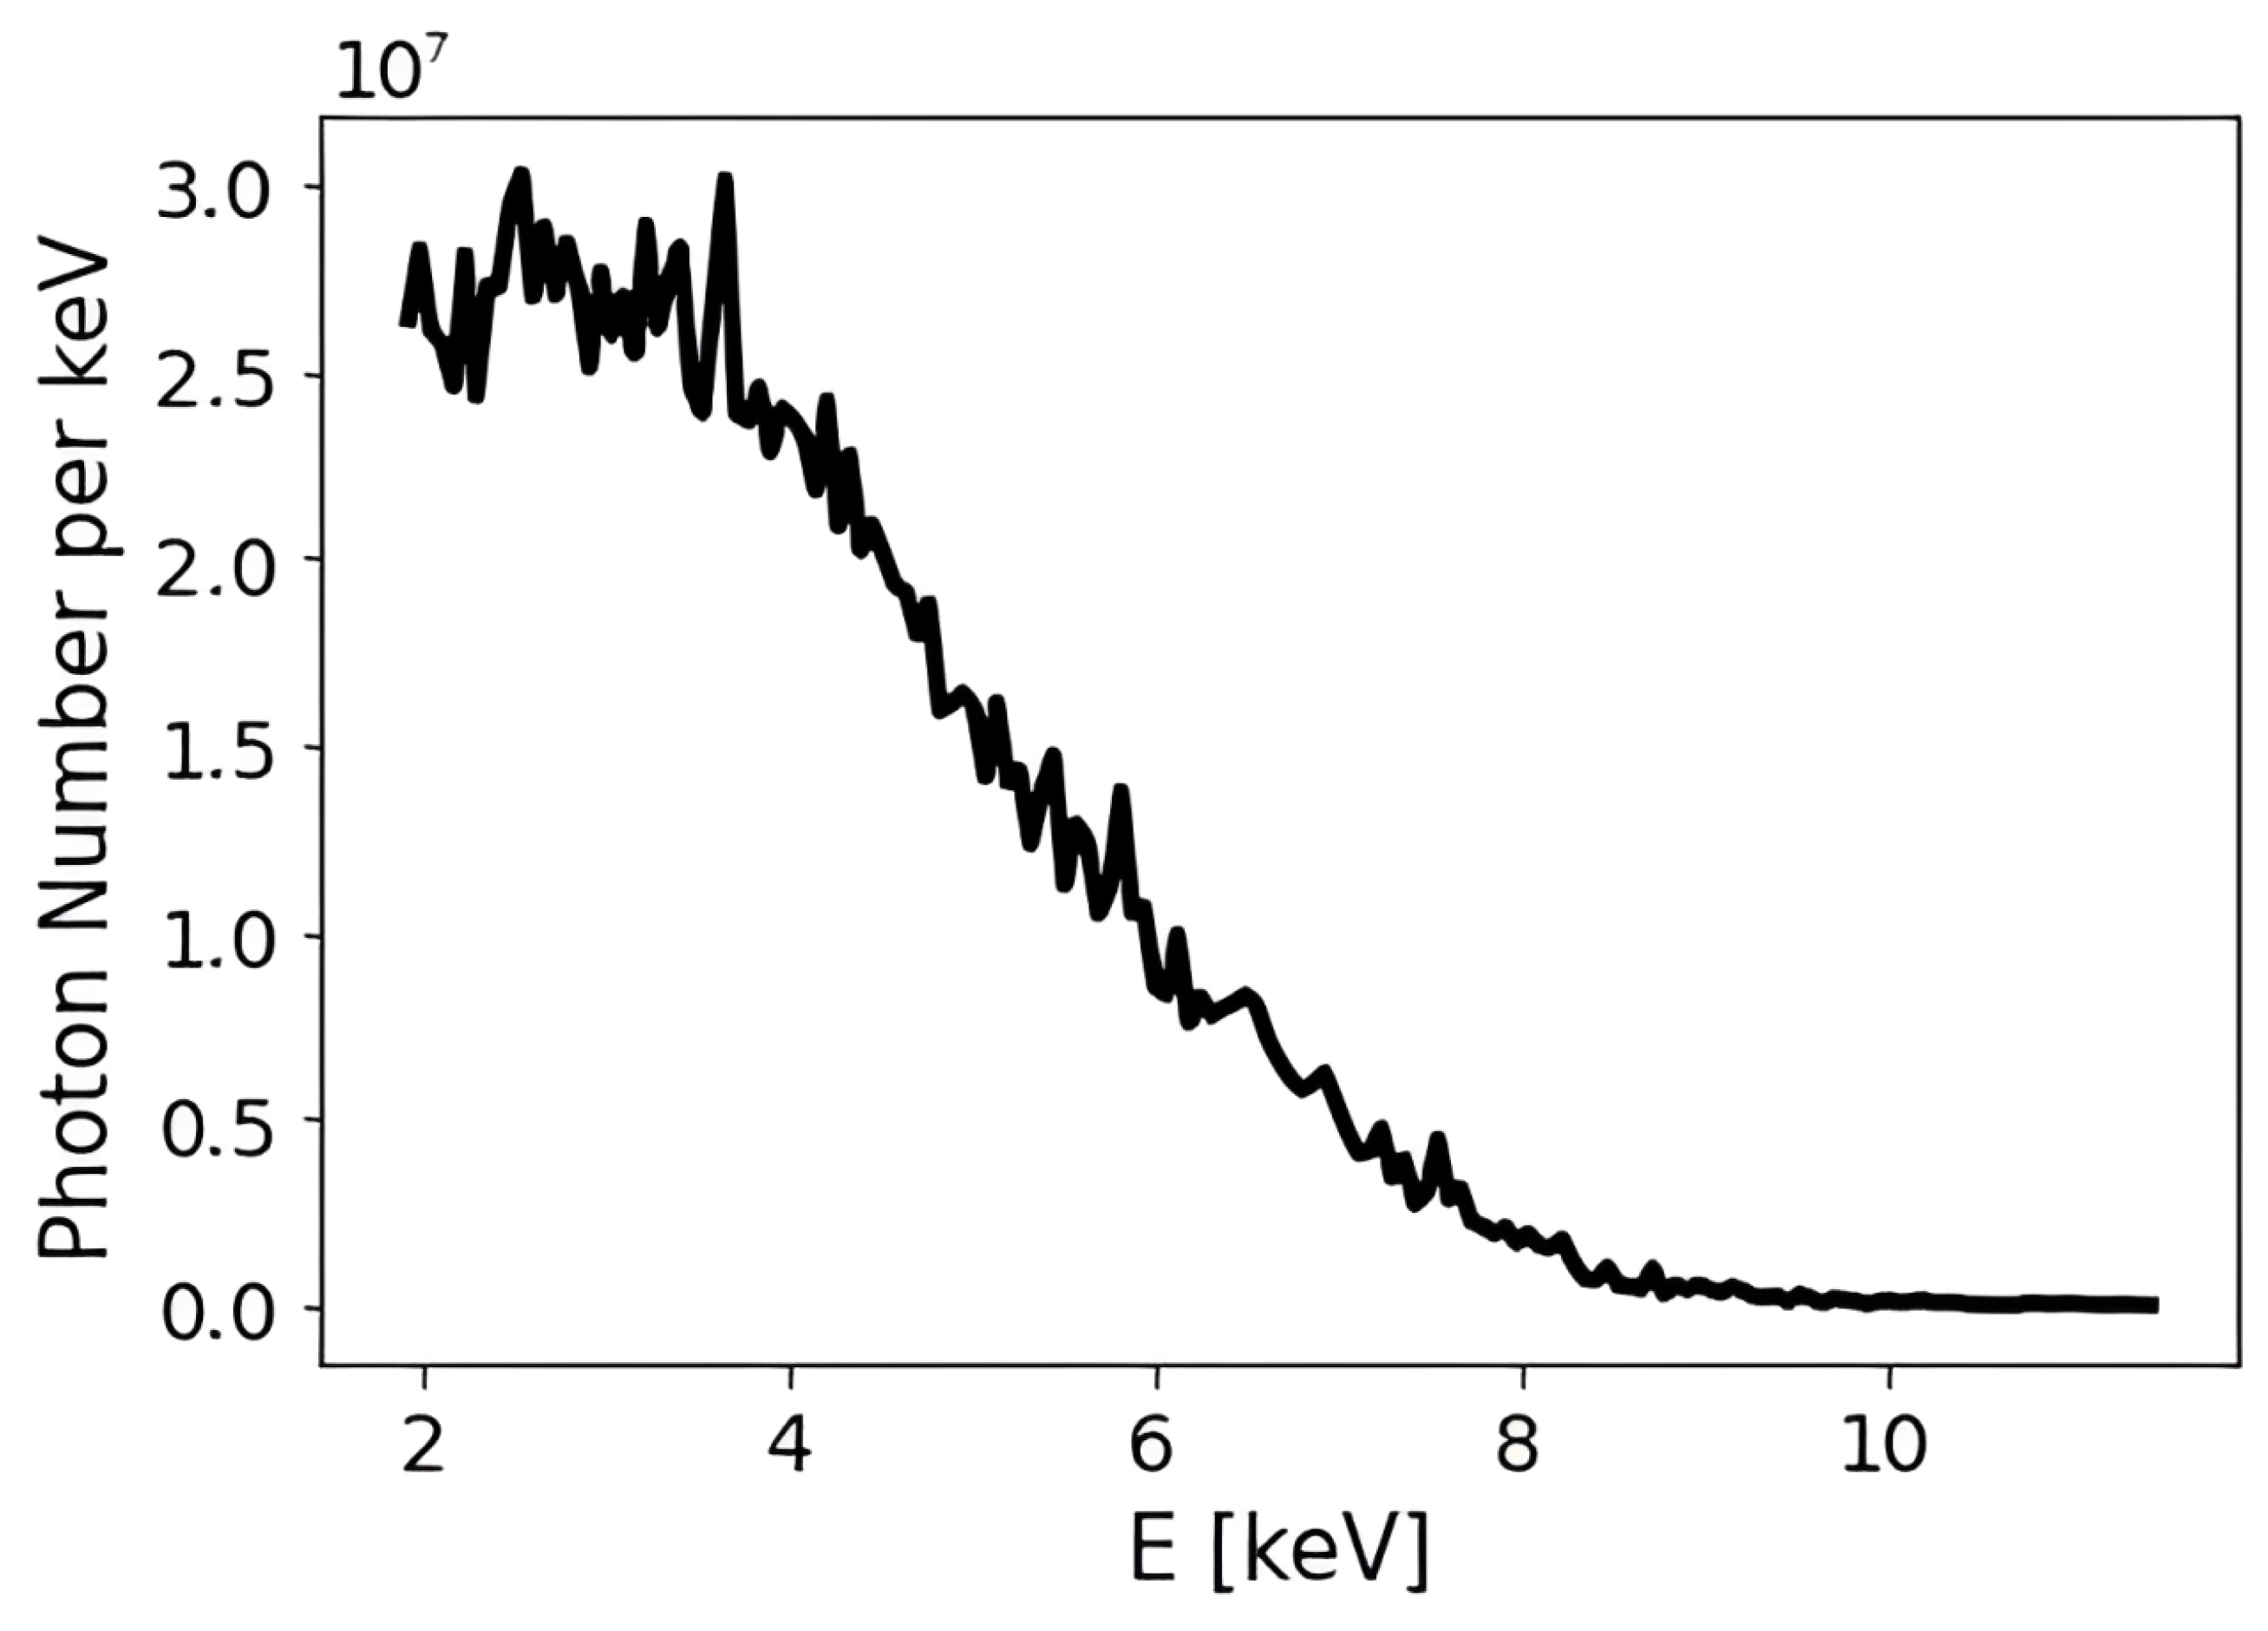
Figure 19 shows the betatron radiation spectrum emitted by the electron beam with the energy spectral content reported in Figure 18. In analogy with synchrotron radiation, the critical energy of the spectral distribution lays around 4 keV. The emitted photon number is about per pulse, corresponding to a electron-to-photon conversion efficiency of 10%.
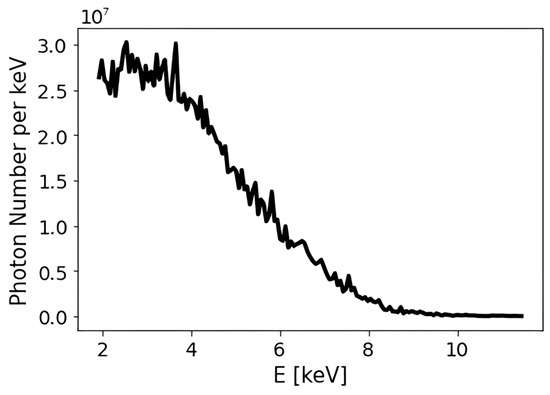
Figure 19.
Betatron radiation spectrum from LWFA electron beams generated by the FLAME laser. Critical energy ≲4 keV, emitted photon number ∼108 in a single shot.
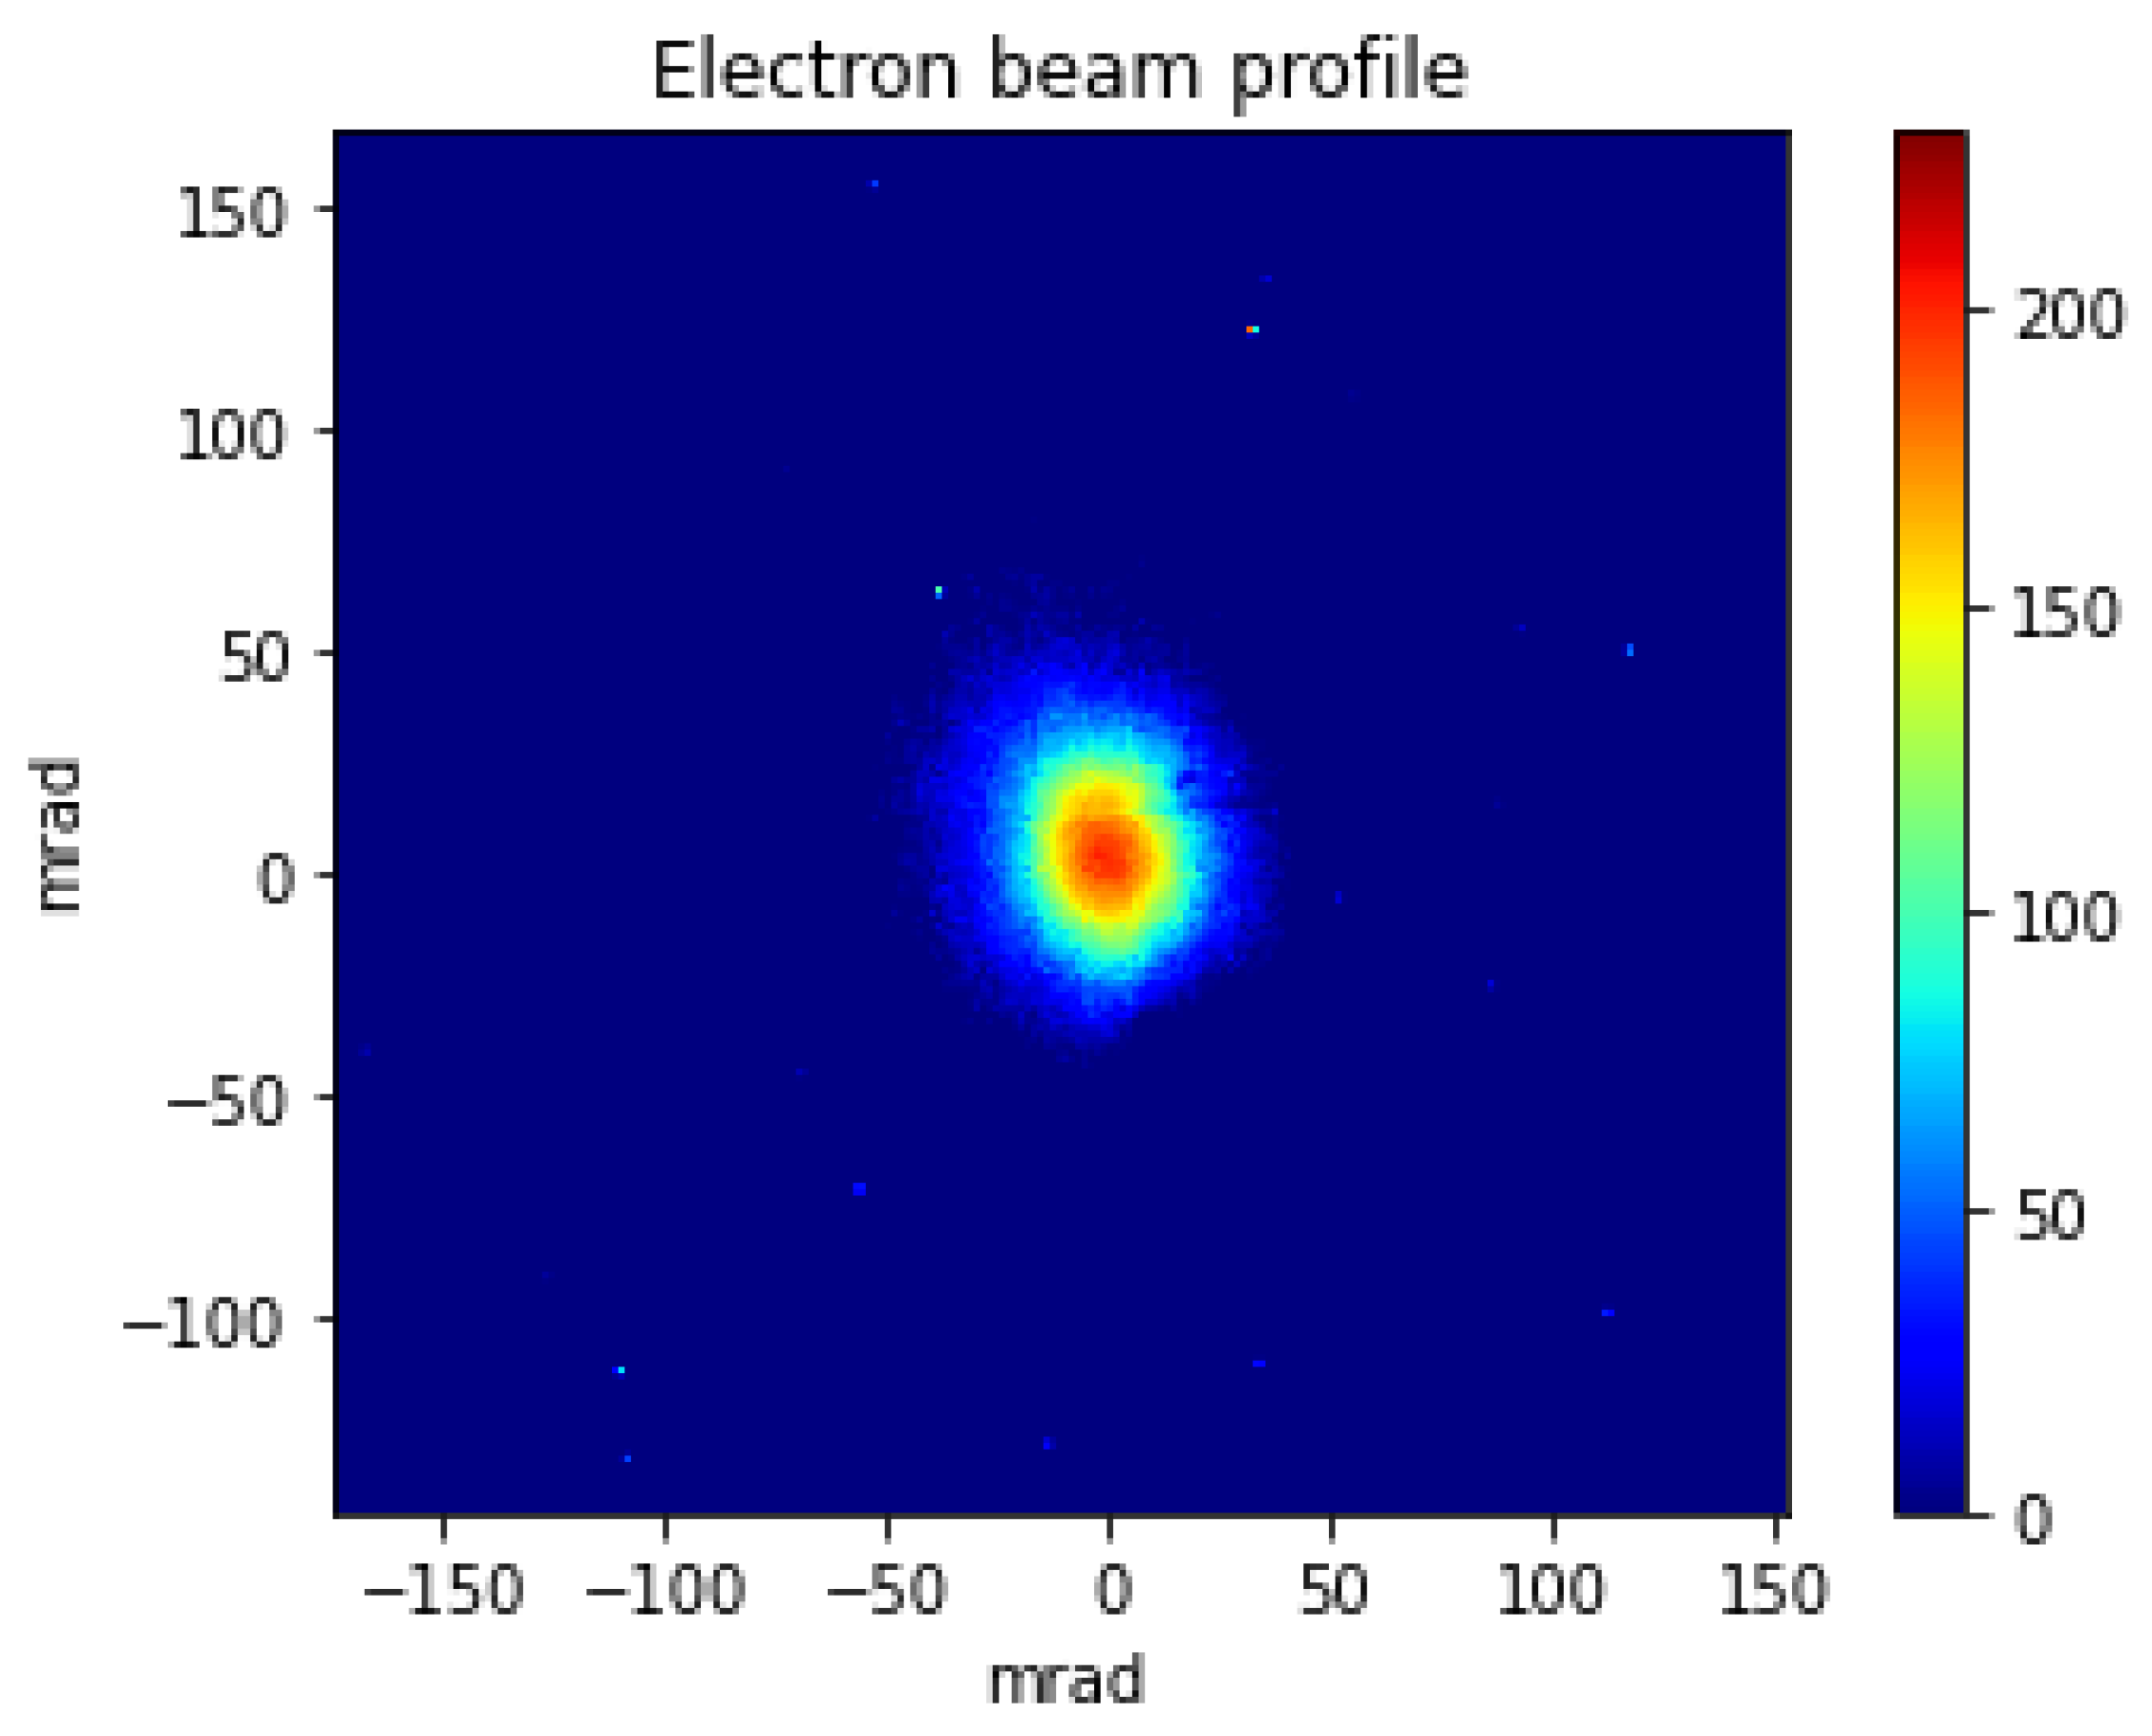
The critical energy is connected with the electron beam emittance, offering the possibility of diagnosing the latter [39,50,51]. Furthermore, betatron X-rays show interesting features of directionality. Figure 20 shows the betatron radiation angular distribution corresponding to the spectrum depicted in Figure 19.
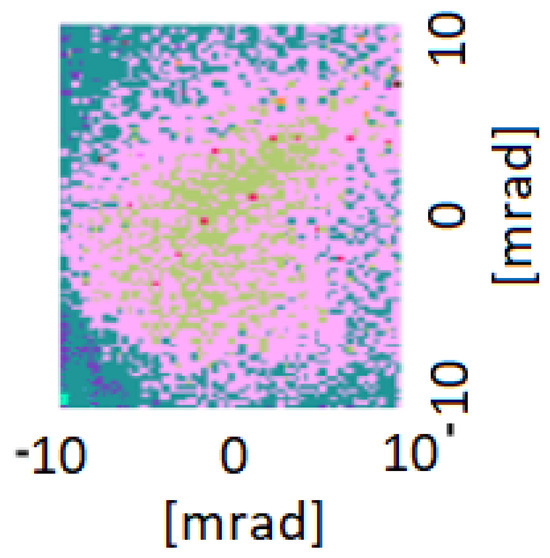
Figure 20.
Betatron radiation angular distribution measured with a X-ray scintillator. Divergence: ∼7 mrad.
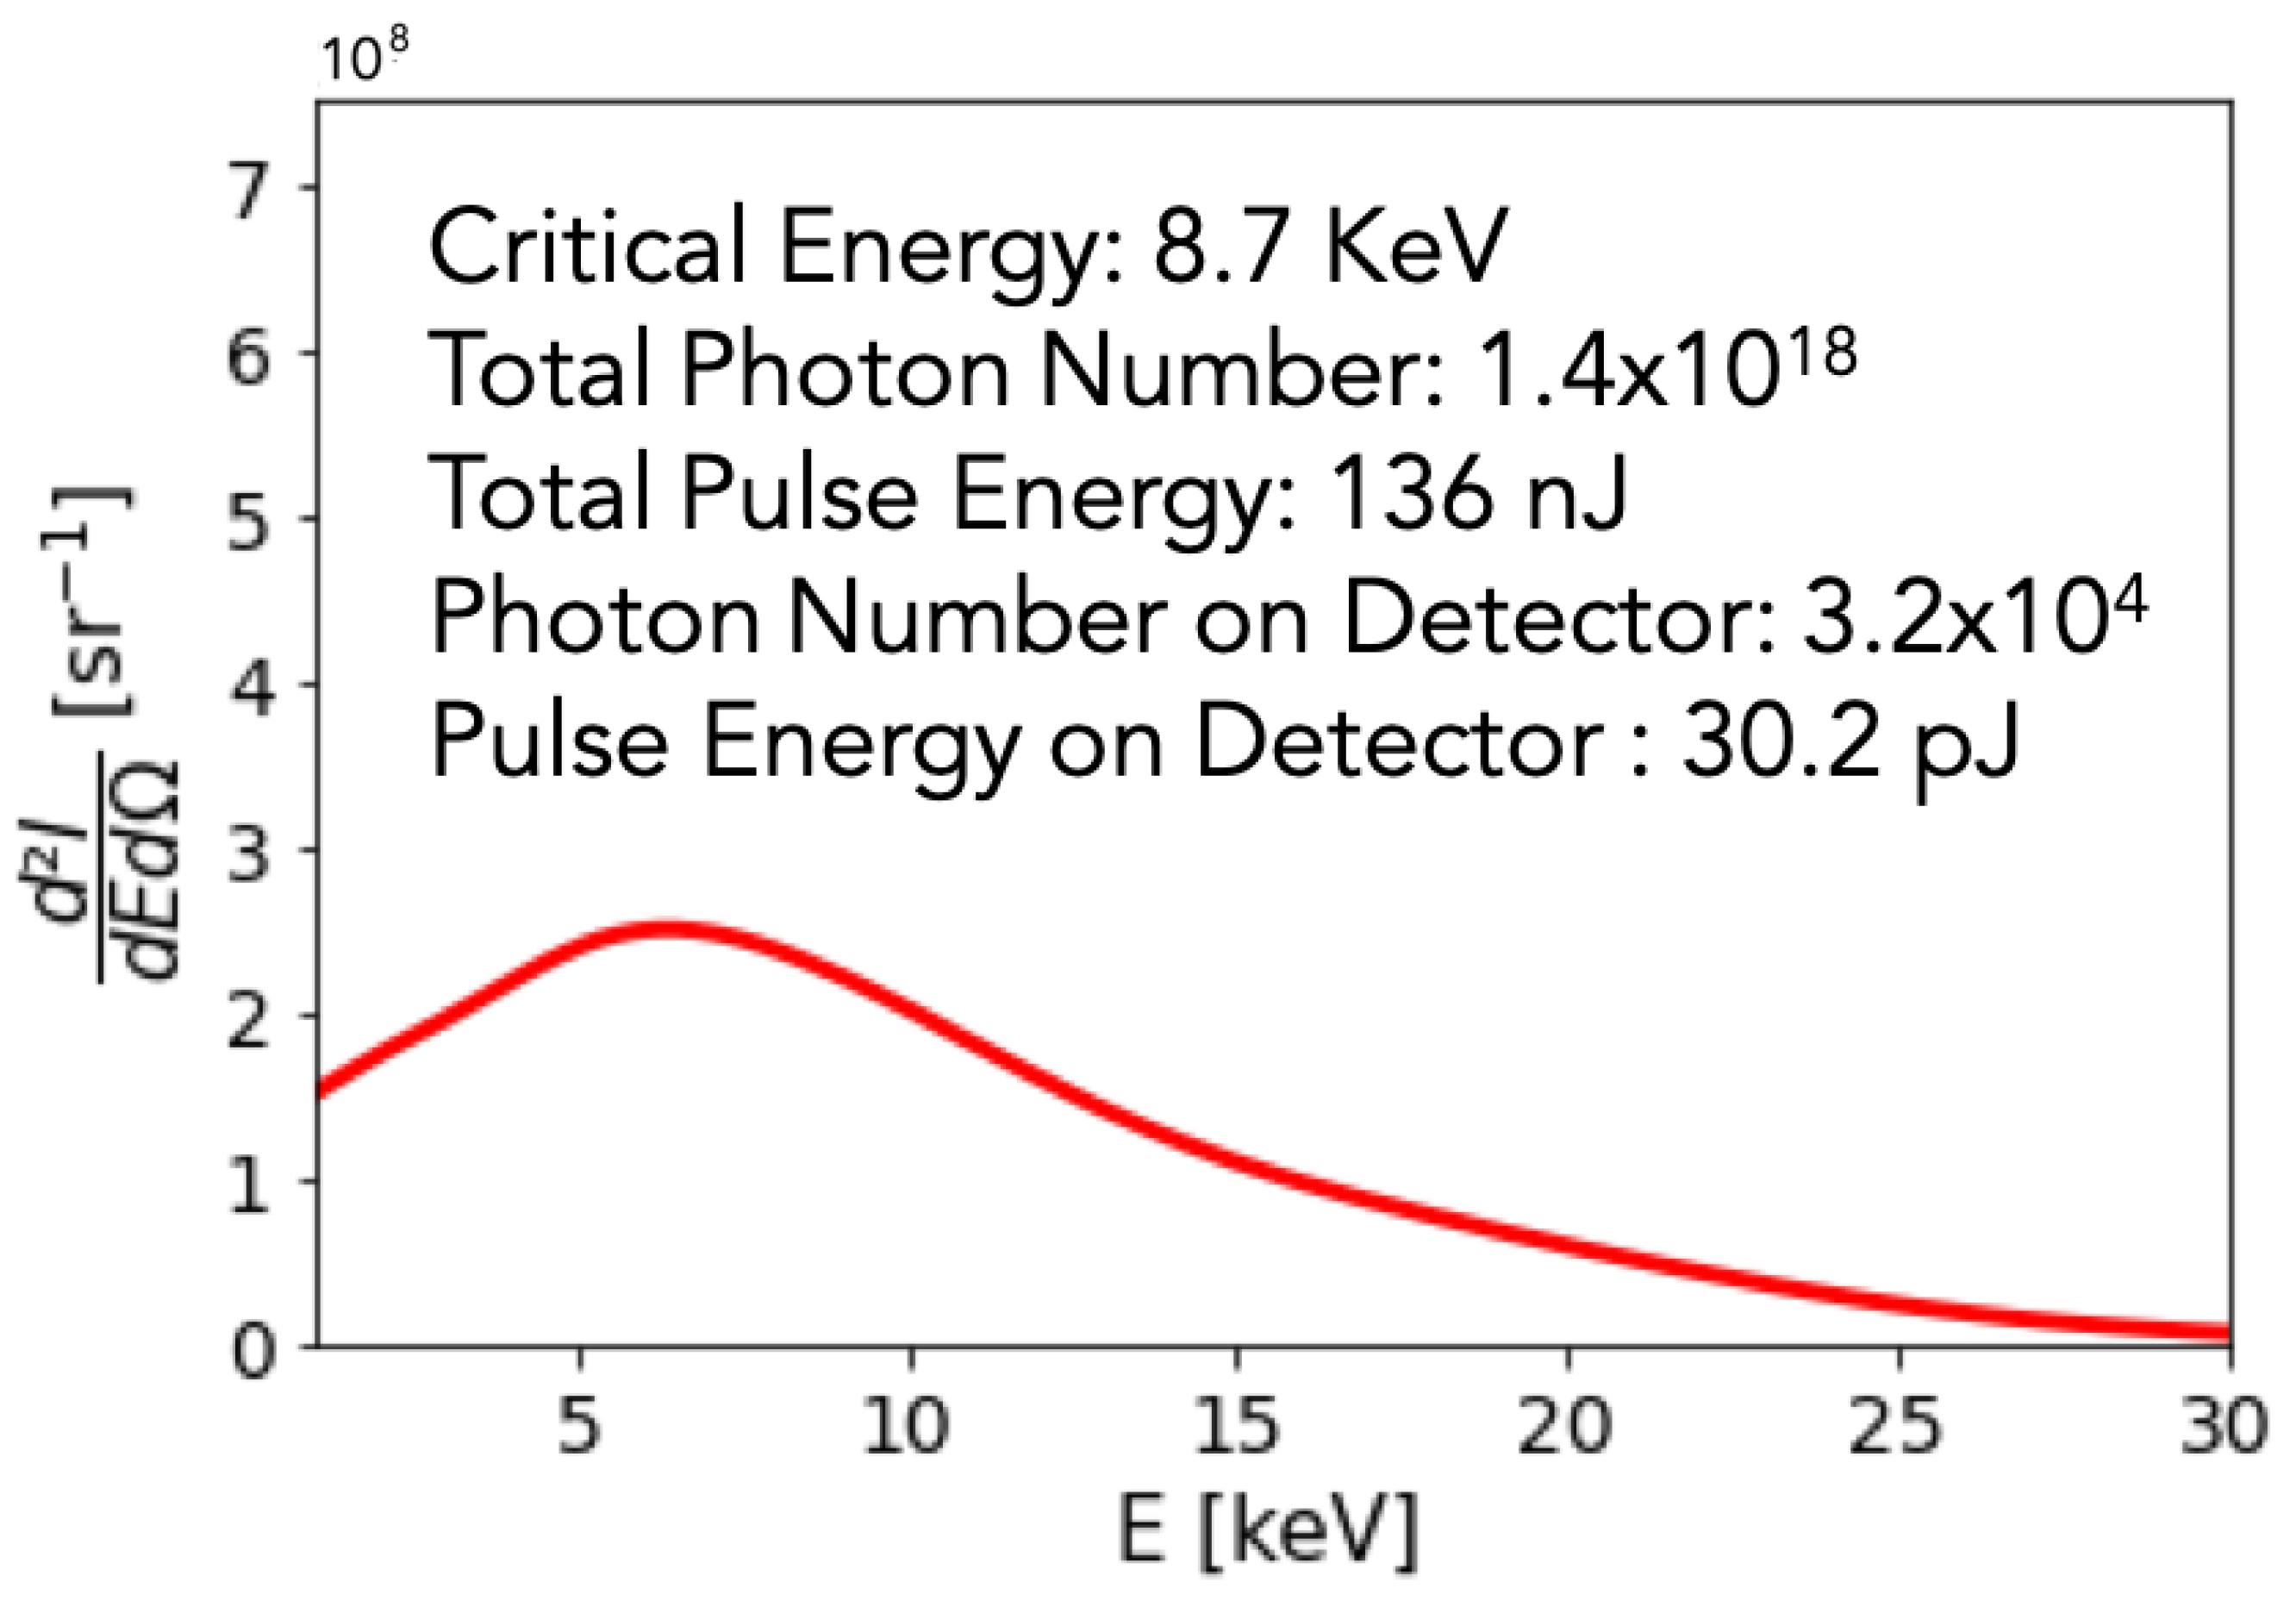
The X-ray beam divergence is smaller than 10 mrad, which is useful for intense irradiation of small samples [52]. The divergence of betatron radiation is approximately equal to the divergence of the electron beam accelerated in the plasma wakefields. In 2023, within the EuAPS framework, we restarted the experimental activity on LWFA and the production of betatron radiation, with the aim of realizing an X-ray source for users. The FLAME laser was enhanced in performance, allowing the increment of critical energy of the betatron spectrum (working at lower electron plasma density to increase the acceleration length but also the betatron oscillation amplitude). A typical spectrum from the most recent results is reported in Figure 21.
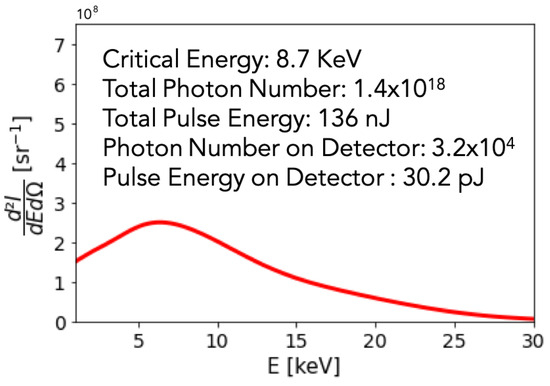
Figure 21.
Betatron radiation spectrum with the optimized FLAME laser system.
It corresponds to a critical energy of 8.7 keV and a photon number of ≃ per pulse. The Ross filter technique was adopted to retrieve such a betatron spectrum. The current electron parameters are as follows: beam energy of about 300 MeV (relative energy spread ≳30%), beam charge ≃200 pC, and beam divergence between 20 and mrad, obtained by means of a 5 mm long nozzle corresponding to an electron plasma density of about ≃cm−3. The gas target was a mixture of 90% helium and 10% nitrogen. Finally, the radiation has been used to make some shadowgraph tests for X-ray applications. The idea is to demonstrate imaging applications, from shadowgraph to phase-contrast imaging. In Figure 22, we report a shadowgraph of an iron slab (left) close to a tilted Allen key (right).
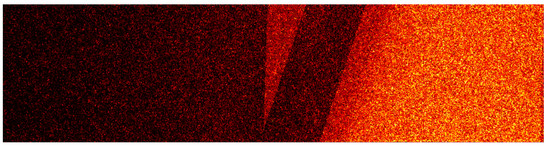
Figure 22.
Shadowgraph of an iron slab (left) close to a tilted Allen key (right).
The studies will continue on a dedicated beamline under construction, where, thanks to larger footprints, phase-contrast applications will be possible.
3.2.3. Laser–Solid Target Interaction Experimental Campaign
Ion acceleration from high-intensity laser–target interaction can generate large amounts of particles with MeV energies [53,54,55]. According to models [56,57,58], the process begins with electrons being accelerated by the laser at the front of the target where a plasma is generated and, in turn, directed towards the target (normally a thin foil). Some of these electrons, the fastest, more energetic component, can reach the rear of the target [59]. When escaping the target, they induce a huge electrostatic field close to the surface due to the unbalanced positive charge [60] left on it and the runaway electron locked nearby. The generated electric field can accelerate rear surface ions in a process called Target Normal Sheath Acceleration (TNSA) [57].
At FLAME [15,23], we have performed temporally resolved measurements of the fast electrons component escaping the target and of the electromagnetic pulses produced during the laser–target interaction. We exploited Electro-Optical Sampling (see Figure 10) [18] diagnostics, which are widely adopted in conventional accelerators [19,61,62], presenting sub-picosecond resolution. Moreover, we investigated the contribution of the target properties, such as shape [19] and material [60], in the fast electron emission. Several extensive experimental campaigns [19,20,22] have been carried out with the FLAME laser system adopting the setup in Figure 10.
In the following, we provide information on three experiments performed at SPARC_LAB: one devoted to fast electron characterization, one to EMPs detection, and the last one regarding electron–proton beam correlation.
Fast Electron Beams Detection
Adopting the designed setup shown in Figure 10, we successfully detected the fast electron beams [63,64], which were accelerated during the interaction process between the FLAME main laser beamline and a solid target.
In our experimental setup, since the distance between the EOS crystal and the target is significantly greater than the Debye length of approximately m, only the highly energetic electrons overcoming the potential barrier can reach our diagnostics. The high-resolution EOS diagnostic method enables us to work within the same temporal scale as the process, which is defined by the duration of the main laser pulse [60,65].
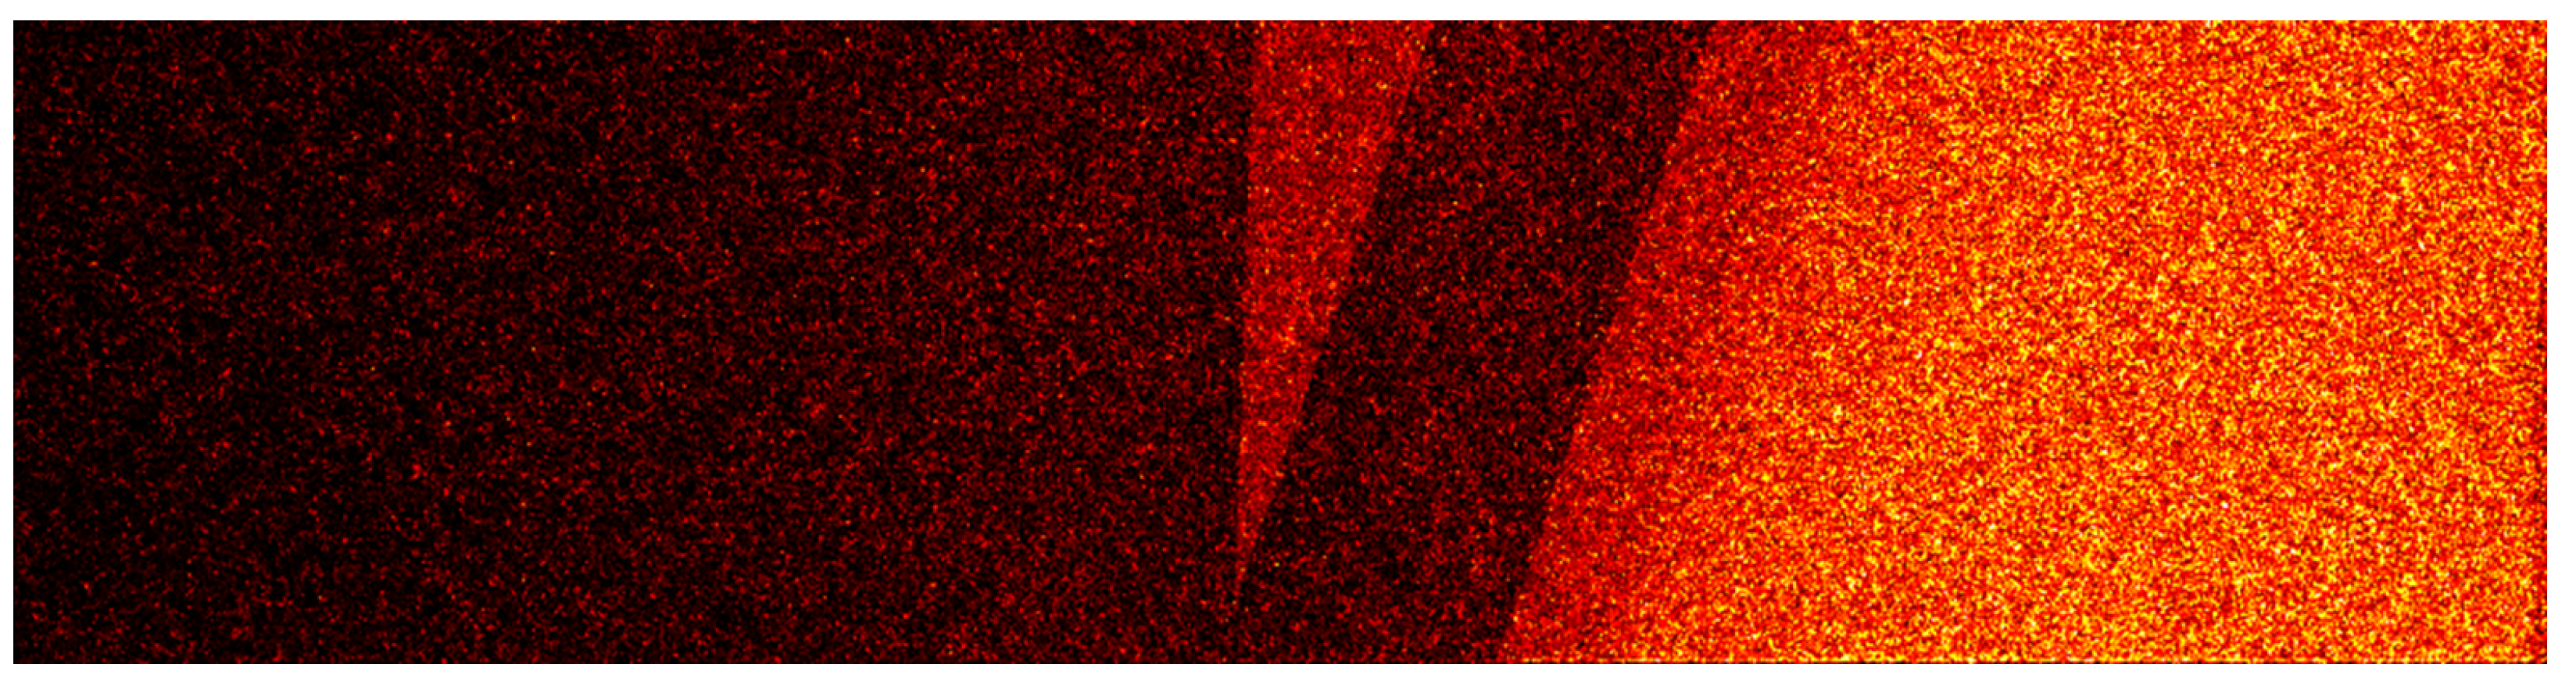
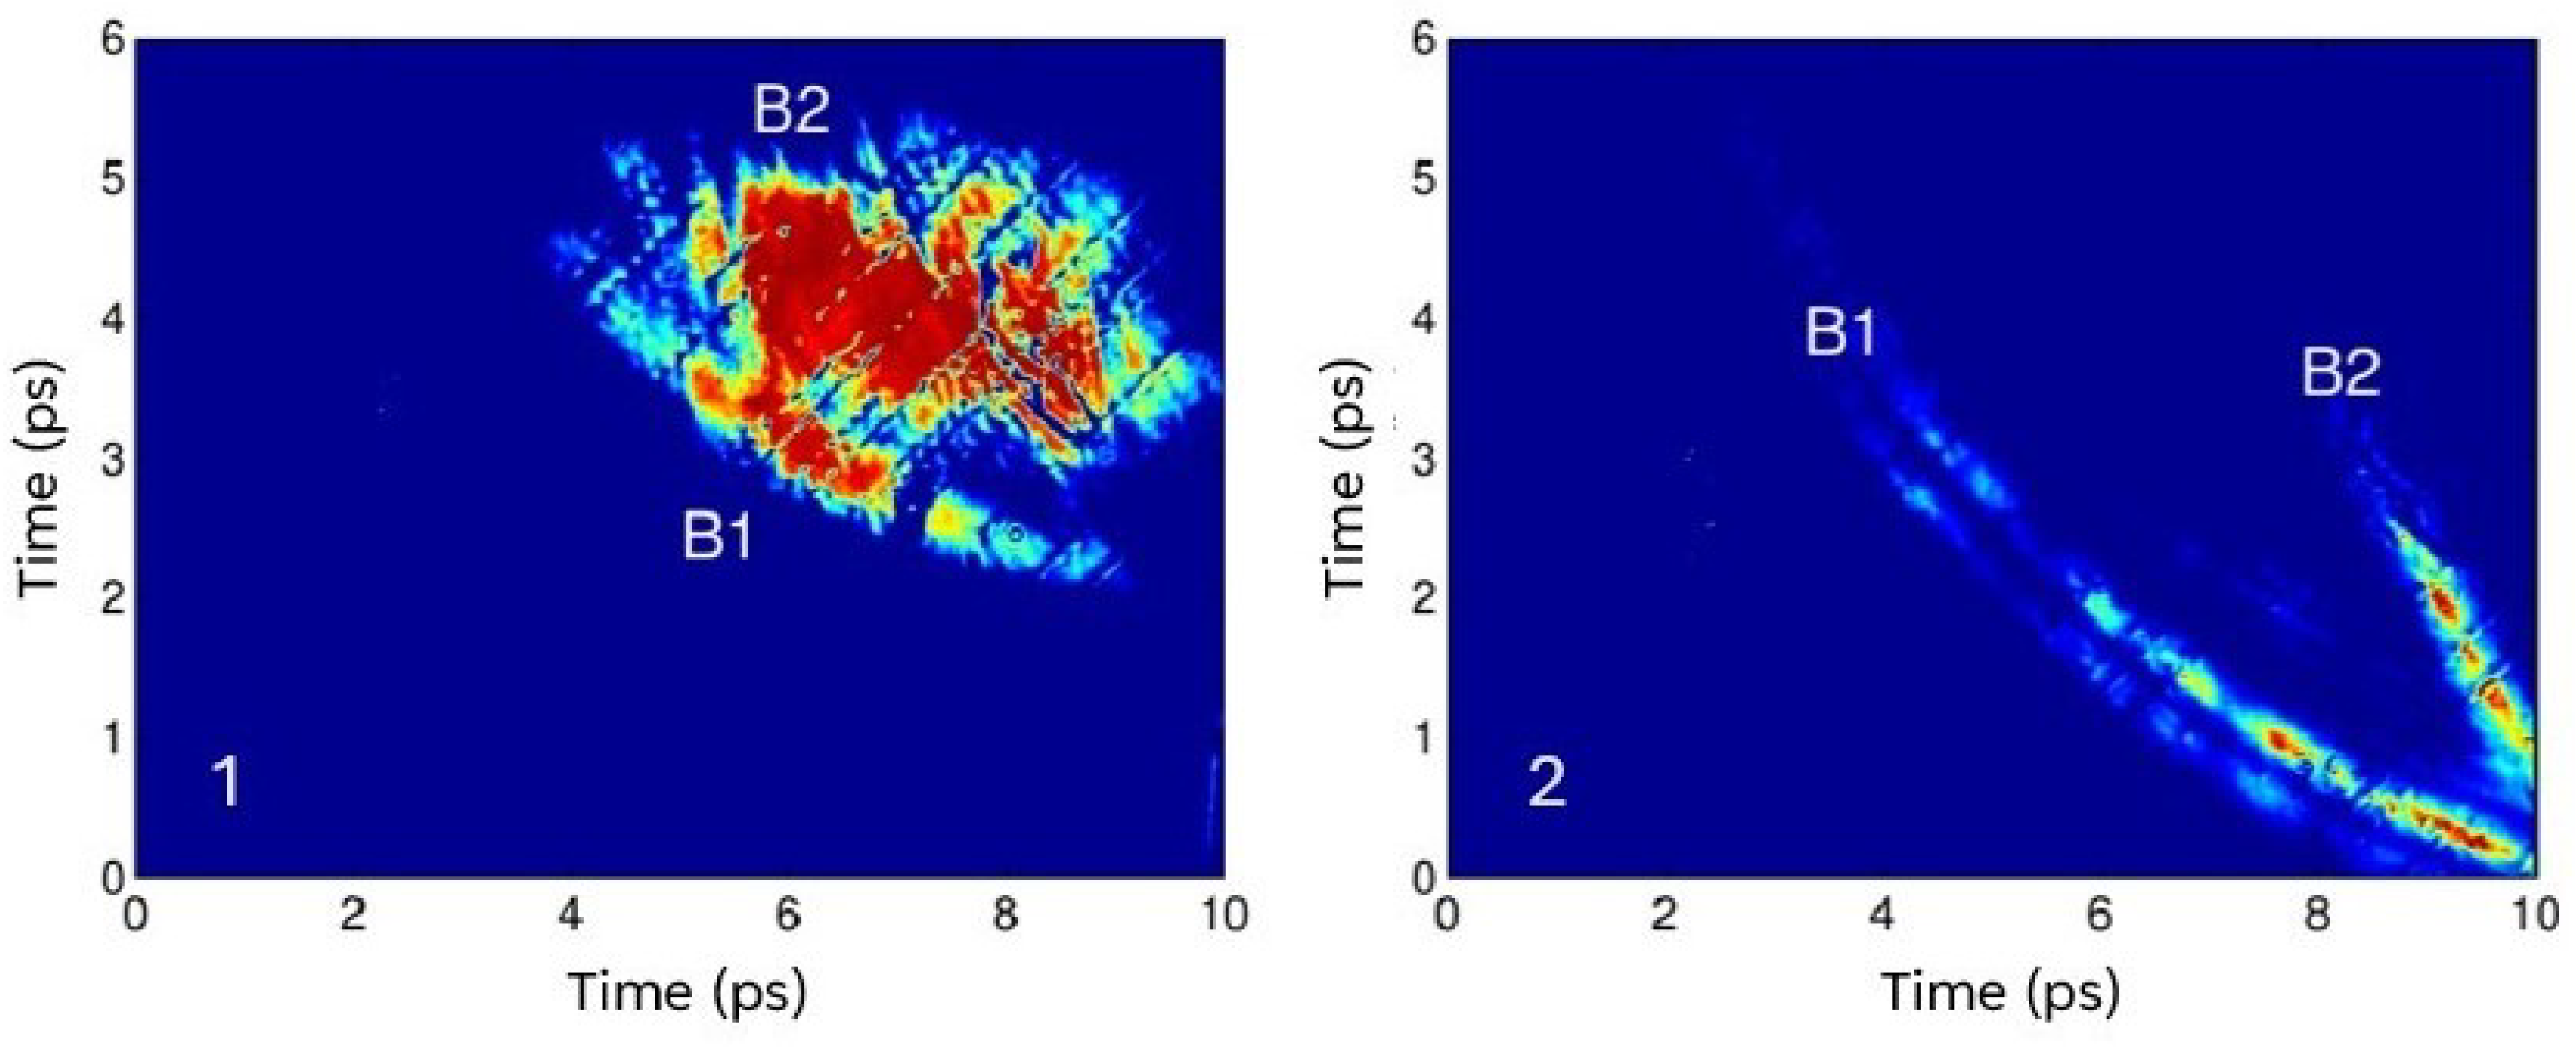
Earlier research on laser-driven ion acceleration has indicated a notable rise in the energy of accelerated ions when structured targets [66,67,68] were utilized, in contrast to the traditional thin aluminum foils used in the TNSA scheme. To achieve this goal, we experimented with various target geometries: a 10 m thick aluminum foil and the tip of a needle. By measuring the charge amount and energy of the escaping electrons using the EOS detector, as previously described, we obtained the necessary evidence for the field-enhancement hypothesis, as summarized in Figure 23.
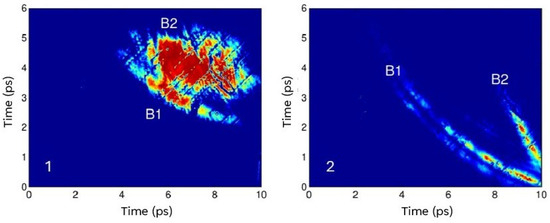
Figure 23.
Fast electrons bunches for different target shapes (1) planar and (2) tip targets. The emitted charges are, respectively, (1) 1.2 nC (Bunch 1—B1) and 3 nC (Bunch 2—B2) and (2) 7 nC (Bunch 1—B1) and 3 nC (Bunch 2—B2). Adapted from Ref. [19].
A clear indication of increased charge and energy with sharp tips can be inferred by the presence of a second ultra-short electron bunch in the nC range.
Electromagnetic Pulses Detection
The interaction of an ultra-intense laser with a solid target generates a significant amount of EMPs. In addition to the capability of detecting fast electrons, our EOS diagnostics have enabled us to uncover these EMPs.
Figure 24 displays the temporal evolution of the EMPs emitted during the interaction process. The retrieved trace was recorded by incrementally delaying the probe laser arrival time with respect to the main pulse by 2.5 ps steps, meaning increasing the probe path by 750 m steps. As the probe laser is delayed relative to the main laser pulse, the EMPs signal shifts to the left and its amplitude diminishes as reported in Ref. [22].
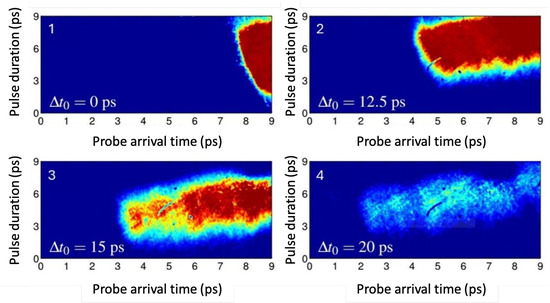
Figure 24.
Evolution of the EMPs emitted by the target. The horizontal axis represents the relative arrival time of the probe () linked to each pixel corresponding to different temporal slices of the EOS time window. The indicates the delay between the main and probe laser pulses (1— = 0 ps, 2— = 12.5 ps, 3— = 15 ps, 4— = 20 ps). Adapted from Ref. [22].
From these results, the dynamics of the target charging process can be reconstructed [22]. From the horizontal size of the detected signals, the velocity spread of the charges can be retrieved. We calculated the velocity spread as (0.94 ± 0.03) c, in agreement with the previous literature [69,70,71], where c is light speed in vacuum. Additionally, the thickness of the traces is proportional to the average duration of the radiation pulses, which, for the signals shown in Figure 24, is (6 ± 1) ps. The retrieved peak electric field on the EOS crystal position was found to be 0.8 MV/m, which corresponds to approximately 0.6 TV/m at the target one, as confirmed by PIC simulations reported in Ref. [22]. Furthermore, such a finding allows us to confirm that only electrons with kinetic energies greater than 3 MeV can escape, which is consistent with our previous observations [22].
Electron–Proton Beams Detection and Correlation
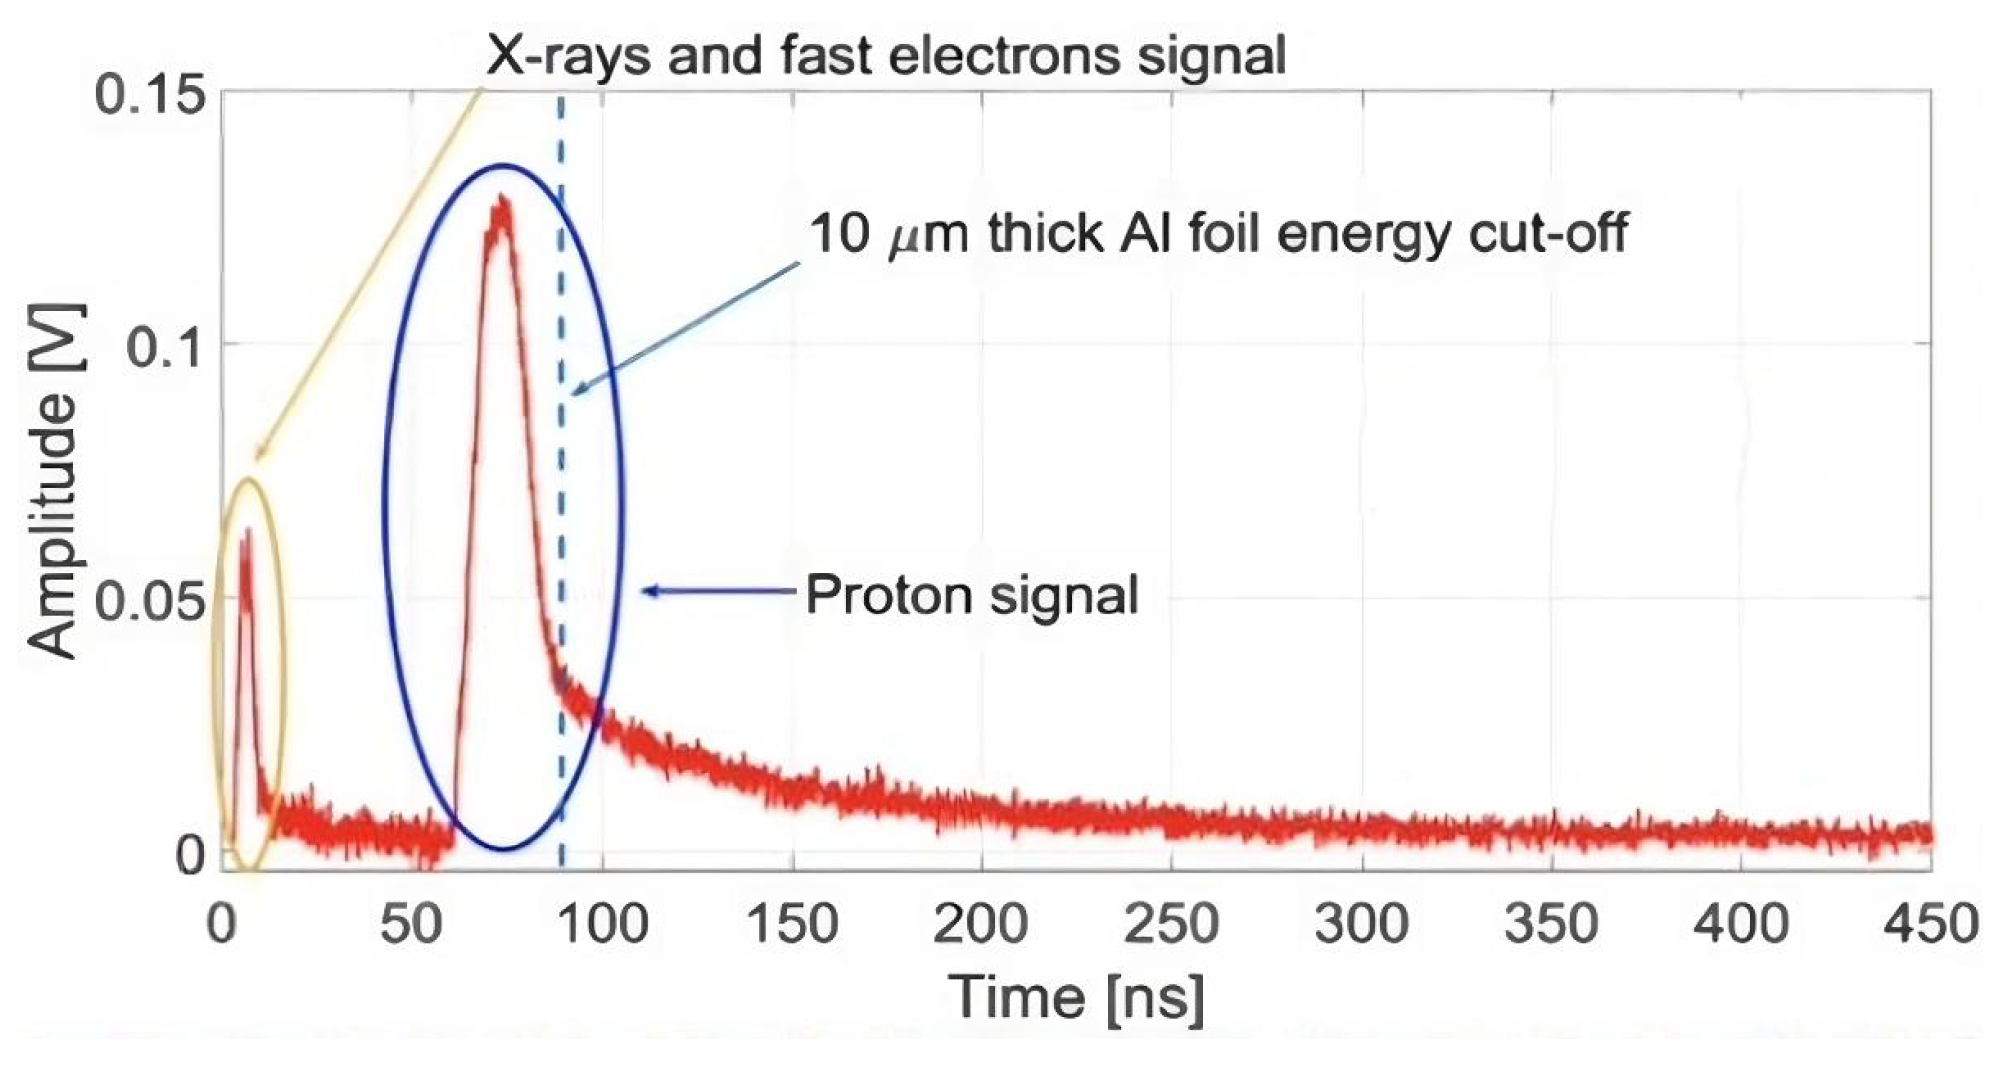
TOF measurements are largely used in laser–target interactions [72,73,74,75,76], allowing the characterization of the ion beam parameters, namely kinetic energy, total charge, and shot-to-shot reproducibility [73]. A typical TOF measurement is shown in Figure 25. It usually consists of a long ion peak signal (tens of ns at a detection distance of ∼1 m) following a short peak representing fast electrons and X-rays.

Figure 25.
TOF measurement by means of a diamond detector showing the proton temporal distribution. Adapted from Ref. [77].
In this context, semiconductor detectors are good candidates, as their response is proportional to the energy of the incident particles. Thus, the initial peak, due to fast electrons and photons, is lower than that of ions [73]. Moreover, diamond detectors are sensitive to particles with energies above the band gap threshold and insensitive to visible light, which constitutes a large background in laser–plasma experiments. EMPs are also present in laser–plasma interactions, as reported in the previous paragraph, which can spoil TOF measurements. However, specific designs must be realized to eliminate EMP coupling with the desired signal [74]. The maximum detectable energy is affected by the thickness of the detector: a thicker diamond allows for a higher maximum detectable energy.
In the experimental campaign performed, for each collected EOS signal the proton energy was also measured using a TOF diamond detector [77,78] as shown in Figure 26. The peak proton energy behaves as a function of the laser energy, in agreement with the previous literature [65,79,80]. As the number of photons striking the solid target increases, protons leave it being accelerated to a higher energy [81]. Experimentally, a correlation between fast electrons and protons has been demonstrated. The proton energy increases with the increase in the number of extracted fast electrons following a power law model with an exponent of 0.6. This results directly from a stronger potential developed on the rear surface of the target, which accelerates protons to higher energies [82]. The experimental evidence showing a correlation between proton energy and the charge of the fast electron supports the hypothesis reported in Ref. [19]. According to this hypothesis, shorter and more highly charged fast electron bunches are expected to induce the production of higher energy protons.
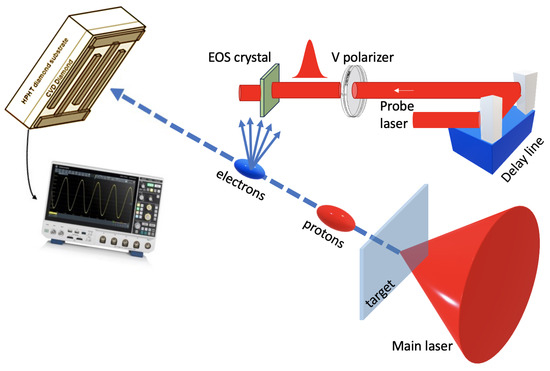
Figure 26.
The experimental setup detects charged particles through two single time-resolved measurements: the EOS diagnostic, described in the EOS detector paragraph, which measures the electric field of relativistic electrons, and a TOF diamond detector coupled with an oscilloscope, extensively described in Ref. [74], which captures the time distribution and energy spectra of incoming protons, as shown in Figure 25. Adapted from Ref. [77].
Finally, thanks to the adopted time-resolved diagnostics, we were also able to extrapolate the relationship between the proton peak energy and the duration of the fast electron bunch [82]:
It is important to note that this relationship applies within our laser energy range, which produces picosecond-long electron bunches. Additional experimental studies at higher laser energies are necessary to fully understand the scaling laws of the process under investigation.
4. Conclusions
In summary, this paper reviewed recent experiments and developments at the FLAME facility at SPARC_LAB, focusing on electron and proton acceleration, as well as related radiation sources. These efforts are part of the EuAPS [16] and EuPRAXIA [17] European projects.
The FLAME high-power laser, delivering 30 fs pulses with a tight focusing, is a powerful tool for studying high-intensity matter interactions (up to 1020 W/cm2). Research on LWFA has been conducted using gas jets of varying sizes (from 2 mm to 5 mm) filled with nitrogen or helium, resulting in the creation of compact electron and X-ray sources. These sources have been used to test new single-shot diagnostics, which are crucial for better understanding and controlling plasma-based accelerators.
Additionally, FLAME is utilized to explore interactions with solid-state matter through the TNSA technique. Specifically, an EOS-based diagnostic was designed to probe fast electron emission and EMPs. In fact, this innovative diagnostic can distinguish between signals from fast electrons and waves generated by currents in the target. These studies pave the way for new time-resolved experiments that aim to provide deeper insights into laser–matter interaction phenomena.
Looking ahead, the potential to accelerate an electron beam from the SPARC LAB high-brightness photoinjector using a laser wakefield accelerator is envisioned. The FLAME laser pulse could be guided through a gas-filled capillary, where it could stimulate linear wakefields to accelerate the external electron bunch while maintaining its initial quality, such as low emittance and energy spread, which are essential for applications like Free Electron Lasers (FELs), as outlined in the EuPRAXIA [17] European project.
Author Contributions
Conceptualization, M.G., A.C. (Alessandro Curcio), R.P., A.C. (Alessandro Cianchi) and A.Z.; formal analysis, M.G., G.C., A.C. (Alessandro Curcio) and R.P.; investigation, M.G., F.S., G.C., A.C. (Alessandro Curcio), M.D.G., R.P., M.P.A. and A.Z.; writing—original draft preparation, M.G., F.S., G.C., A.C. (Alessandro Cianchi), M.D.G. and L.V.; writing—review and editing, All the authors; supervision, A.C. (Alessandro Curcio), M.P.A., A.G. and M.F.; funding acquisition, M.F. All authors have read and agreed to the published version of the manuscript.
Funding
The work of Valentina Dompe’ and Livio Verra has been supported by the European Union-Next Generation EU within the PNRR-EuAPS project.
Institutional Review Board Statement
Not applicable.
Informed Consent Statement
Not applicable.
Data Availability Statement
No new data were created for the presented review paper.
Acknowledgments
We thank Angelo Biagioni and Donato Pellegrini for the development of the HV discharge pulser.
Conflicts of Interest
The authors declare no conflicts of interest.
References
- Strickland, D.; Mourou, G. Compression of amplified chirped optical pulses. Opt. Commun. 1985, 55, 447–449. [Google Scholar] [CrossRef]
- Danson, C.; Haefner, C.; Bromage, J.; Butcher, T.; Chanteloup, J.; Chowdhury, E.; Galvanauskas, A.; Gizzi, L.; Hein, J.; Hillier, D.; et al. Petawatt and exawatt class lasers worldwide. High Power Laser Sci. Eng. 2019, 7, e54. [Google Scholar] [CrossRef]
- Roth, M.; Cowan, T.; Key, M.; Hatchett, S.; Brown, C.; Fountain, W.; Johnson, J.; Pennington, D.; Snavely, R.; Wilks, S.; et al. Fast ignition by intense laser-accelerated proton beams. Phys. Rev. Lett. 2001, 86, 436. [Google Scholar] [CrossRef] [PubMed]
- Bartal, T.; Foord, M.; Bellei, C.; Key, M.; Flippo, K.; Gaillard, S.; Offermann, D.; Patel, P.; Jarrott, L.; Higginson, D.; et al. Focusing of short-pulse high-intensity laser-accelerated proton beams. Nat. Phys. 2012, 8, 139–142. [Google Scholar] [CrossRef]
- Ledingham, K.; Galster, W. Laser-driven particle and photon beams and some applications. New J. Phys. 2010, 12, 045005. [Google Scholar] [CrossRef]
- Macchi, A.; Borghesi, M.; Passoni, M. Ion acceleration by superintense laser-plasma interaction. Rev. Mod. Phys. 2013, 85, 751–793. [Google Scholar] [CrossRef]
- Esarey, E.; Schroeder, C.B.; Leemans, W.P. Physics of laser-driven plasma-based electron accelerators. Rev. Mod. Phys. 2009, 81, 1229–1285. [Google Scholar] [CrossRef]
- Remington, B.; Arnett, D.; Paul, R.; Drake; Takabe, H. Modeling astrophysical phenomena in the laboratory with intense lasers. Science 1999, 284, 1488–1493. [Google Scholar] [CrossRef]
- Gizzi, L. Laser-Driven Sources of High Energy Particles and Radiation; Springer: Berlin/Heidelberg, Germany, 2019; pp. 1–24. [Google Scholar] [CrossRef]
- Higginson, A.; Gray, R.; King, M.; Dance, R.; Williamson, S.; Butler, N.; Wilson, R.; Capdessus, R.; Armstrong, C.; Green, J.; et al. Near-100 MeV protons via a laser-driven transparency-enhanced hybrid acceleration scheme. Nat. Commun. 2018, 9, 724. [Google Scholar] [CrossRef]
- Gonsalves, A.; Nakamura, K.; Daniels, J.; Benedetti, C.; Pieronek, C.; De Raadt, T.; Steinke, S.; Bin, J.; Bulanov, S.; Van Tilborg, J.; et al. Petawatt laser guiding and electron beam acceleration to 8 GeV in a laser-heated capillary discharge waveguide. Phys. Rev. Lett. 2019, 122, 084801. [Google Scholar] [CrossRef]
- Giulietti, A. Laser-driven particle acceleration for radiobiology and radiotherapy: Where we are and where we are going. In Proceedings of the Medical Applications of Laser-Generated Beams of Particles IV: Review of Progress and Strategies for the Future, Prague, Czech Republic, 24–25 April 2017; SPIE: Bellingham, WA, USA, 2017; Volume 10239, p. 1023904. [Google Scholar]
- Labate, L.; Palla, D.; Panetta, D.; Avella, F.; Baffigi, F.; Brandi, F.; Di Martino, F.; Fulgentini, L.; Giulietti, A.; Köster, P.; et al. Toward an effective use of laser-driven very high energy electrons for radiotherapy: Feasibility assessment of multi-field and intensity modulation irradiation schemes. Sci. Rep. 2020, 10, 17307. [Google Scholar] [CrossRef] [PubMed]
- Andreassi, M.G.; Borghini, A.; Pulignani, S.; Baffigi, F.; Fulgentini, L.; Koester, P.; Cresci, M.; Vecoli, C.; Lamia, D.; Russo, G.; et al. Radiobiological effectiveness of ultrashort laser-driven electron bunches: Micronucleus frequency, telomere shortening and cell viability. Radiat. Res. 2016, 186, 245–253. [Google Scholar] [CrossRef]
- Ferrario, M.; Alesini, D.; Anania, M.; Bacci, A.; Bellaveglia, M.; Bogdanov, O.; Boni, R.; Castellano, M.; Chiadroni, E.; Cianchi, A.; et al. SPARC_LAB present and future. Nucl. Instrum. Methods Phys. Res. B 2013, 309, 183–188. [Google Scholar] [CrossRef]
- Ferrario, M.; Assmann, R.W.; Avaldi, L.; Bolognesi, P.; Catalano, R.; Cianchi, A.; Cirrone, P.; Falone, A.; Ferro, T.; Gizzi, L. EuPRAXIA Advanced Photon Sources PNRR_EuAPS Project; Technical Report; INFN: Frascati, Italy, 2023. [Google Scholar]
- Assmann, R.; Weikum, M.; Akhter, T.; Alesini, D.; Alexandrova, A.; Anania, M.; Andreev, N.; Andriyash, I.; Artioli, M.; Aschikhin, A.; et al. EuPRAXIA Conceptual Design Report. Eur. Phys. J. Spec. Top. 2020, 229, 3675–4284. [Google Scholar]
- Wilke, I.; MacLeod, A.; Gillespie, W.; Berden, G.; Knippels, G.; Van Der Meer, A. Single-shot electron-beam bunch length measurements. Phys. Rev. Lett. 2002, 88, 124801. [Google Scholar] [CrossRef] [PubMed]
- Pompili, R.; Anania, M.; Bisesto, F.; Botton, M.; Castellano, M.; Chiadroni, E.; Cianchi, A.; Curcio, A.; Ferrario, M.; Galletti, M.; et al. Femtosecond dynamics of energetic electrons in high intensity laser-matter interactions. Sci. Rep. 2016, 6, 35000. [Google Scholar] [CrossRef]
- Pompili, R.; Anania, M.; Bisesto, F.; Botton, M.; Castellano, M.; Chiadroni, E.; Cianchi, A.; Curcio, A.; Ferrario, M.; Galletti, M.; et al. Sub-picosecond snapshots of fast electrons from high intensity laser-matter interactions. Opt. Express 2016, 24, 29512–29520. [Google Scholar] [CrossRef]
- Bisesto, F.; Anania, M.; Botton, M.; Chiadroni, E.; Cianchi, A.; Curcio, A.; Ferrario, M.; Galletti, M.; Pompili, R.; Schleifer, E.; et al. Novel single-shot diagnostics for electrons from laser-plasma interaction at SPARC_LAB. Quantum Beam Sci. 2017, 1, 13. [Google Scholar] [CrossRef]
- Pompili, R.; Anania, M.; Bisesto, F.; Botton, M.; Chiadroni, E.; Cianchi, A.; Curcio, A.; Ferrario, M.; Galletti, M.; Henis, Z.; et al. Ultrafast evolution of electric fields from high-intensity laser-matter interactions. Sci. Rep. 2018, 8, 3243. [Google Scholar] [CrossRef]
- Bisesto, F.; Anania, M.; Bellaveglia, M.; Chiadroni, E.; Cianchi, A.; Costa, G.; Curcio, A.; Di Giovenale, D.; Di Pirro, G.; Ferrario, M.; et al. The FLAME laser at SPARC_LAB. Nucl. Instrum. Methods Phys. Res. A 2018, 909, 452–455. [Google Scholar] [CrossRef]
- Amplitude Laser. 2024. Available online: https://amplitude-laser.com/products/femtosecond-lasers/lasers-for-science/pulsar-pw/ (accessed on 1st March 2024).
- Galimberti, M.; Bisesto, F.G.; Galletti, M. Innovative single-shot 2D pulse front tilt diagnostic. High Power Laser Sci. Eng. 2021, 9, e16. [Google Scholar] [CrossRef]
- Biagioni, A.; Anania, M.; Arjmand, S.; Behar, E.; Costa, G.; Del Dotto, A.; Ferrario, M.; Galletti, M.; Lollo, V.; Pellegrini, D.; et al. Gas-filled capillary-discharge stabilization for plasma-based accelerators by means of a laser pulse. Plasma Phys. Control. Fusion 2021, 63, 115013. [Google Scholar] [CrossRef]
- Curcio, A.; Bisesto, F.; Costa, G.; Biagioni, A.; Anania, M.; Pompili, R.; Ferrario, M.; Petrarca, M. Modeling and diagnostics for plasma discharge capillaries. Phys. Rev. E 2019, 100, 053202. [Google Scholar] [CrossRef]
- Biagioni, A.; Alesini, D.; Anania, M.; Arjmand, S.; Bini, S.; Chiadroni, E.; Cianchi, A.; Coiro, O.; Di Giovenale, D.; Di Pirro, G.; et al. High-Voltage Pulser to Produce Plasmas Inside Gas-Filled Discharge Capillaries; Technical Report SPARC-PL-19/001; INFN: Frascati, Italy, 2019. [Google Scholar]
- Malka, V.; Faure, J.; Gauduel, Y.; Lefebvre, E.; Rousse, A.; Phuoc, K. Principles and applications of compact laser–plasma accelerators. Nat. Phys. 2008, 4, 447–453. [Google Scholar] [CrossRef]
- Bobrova, N.; Bulanov, S.; Farina, D.; Pozzoli, R.; Razinkova, T.; Sakai, J.; Sasorov, P.; Sokolov, I. MHD simulations of plasma dynamics in pinch discharges in capillary plasmas. Laser Part. Beams 2000, 18, 623–638. [Google Scholar] [CrossRef]
- Geddes, C.; Toth, C.; Van Tilborg, J.; Esarey, E.; Schroeder, C.; Bruhwiler, D.; Nieter, C.; Cary, J.; Leemans, W. High-quality electron beams from a laser wakefield accelerator using plasma-channel guiding. Nature 2004, 431, 538–541. [Google Scholar] [CrossRef] [PubMed]
- Costa, G.; Anania, M.; Biagioni, A.; Bisesto, F.; Brentegani, E.; Ferrario, M.; Pompili, R.; Romeo, S.; Rossi, A.; Zigler, A.; et al. Plasma density profile measurements for ultra-short high power laser beam guiding experiments at SPARC _LAB. J. Phys. Conf. Ser. 2020, 1596, 012044. [Google Scholar] [CrossRef]
- Costa, G.; Anania, M.; Biagioni, A.; Bisesto, F.; Del Franco, M.; Galletti, M.; Ferrario, M.; Pompili, R.; Romeo, S.; Rossi, A.; et al. Characterisation of supersonic gas jets for different nozzle geometries for laser-plasma acceleration experiments at SPARC_LAB. J. Instrum. 2022, 17, C01049. [Google Scholar] [CrossRef]
- Weller, H.G.; Tabor, G.; Jasak, H.; Fureby, C. A tensorial approach to computational continuum mechanics using object-oriented techniques. Comput. Phys. 1998, 12, 620–631. [Google Scholar] [CrossRef]
- OpenFOAM. 2024. Available online: https://www.openfoam.com/ (accessed on 1st March 2024).
- Oh, S.; Uhm, H.; Kang, H.; Lee, I.W.; Suk, H. Temporal evolution of electron density and temperature in capillary discharge plasmas. J. Appl. Phys. 2010, 107, 103309. [Google Scholar] [CrossRef]
- Griem, H. Spectral Line Broadening by Plasmas; Elsevier: Amsterdam, The Netherlands, 2012. [Google Scholar]
- Biagioni, A.; Alesini, D.; Anania, M.; Bellaveglia, M.; Bini, S.; Bisesto, F.; Brentegani, E.; Chiadroni, E.; Cianchi, A.; Coiro, O.; et al. Temperature analysis in the shock waves regime for gas-filled plasma capillaries in plasma-based accelerators. J. Instrum. 2019, 14, C03002. [Google Scholar] [CrossRef]
- Curcio, A.; Anania, M.; Bisesto, F.; Chiadroni, E.; Cianchi, A.; Ferrario, M.; Filippi, F.; Giulietti, D.; Marocchino, A.; Mira, F.; et al. Towards the detection of nanometric emittances in plasma accelerators. J. Instrum. 2019, 14, C02004. [Google Scholar] [CrossRef]
- Galletti, M.; Cianchi, A.; Curcio, A.; Dipace, F.; Ferrario, M.; Pompili, R. Direct visualization of relativistic Coulomb field in the near and far field ranges. New J. Phys. 2023, 25, 063014. [Google Scholar] [CrossRef]
- Curcio, A.; Anania, M.; Bisesto, F.; Botton, M.; Castellano, M.; Chiadroni, E.; Cianchi, A.; Ferrario, M.; Galletti, M.; Giulietti, D.; et al. Electro-optical detection of coherent radiation induced by relativistic electron bunches in the near and far fields. Phys. Rev. Appl. 2018, 9, 024004. [Google Scholar] [CrossRef]
- Cavalieri, A.; Fritz, D.; Lee, S.; Bucksbaum, P.; Reis, D.; Rudati, J.; Mills, D.; Fuoss, P.; Stephenson, G.; Kao, C.; et al. Clocking femtosecond X-rays. Phys. Rev. Lett. 2005, 94, 114801. [Google Scholar] [CrossRef]
- Pompili, R.; Anania, M.; Bellaveglia, M.; Biagioni, A.; Castorina, G.; Chiadroni, E.; Cianchi, A.; Croia, M.; Giovenale, D.D.; Ferrario, M.; et al. Femtosecond timing-jitter between photo-cathode laser and ultra-short electron bunches by means of hybrid compression. New J. Phys. 2016, 18, 083033. [Google Scholar] [CrossRef]
- Galletti, M.; Künzel, S.; Alves, J.; Hariton, V.; Pires, H.; João, C.; Figueira, G.; Dias, J. Direct refractive index retrieval from interferometry measurements. Rev. Sci. Instrum. 2020, 91, 045111. [Google Scholar] [CrossRef]
- Curcio, A.; Anania, M.; Bisesto, F.; Chiadroni, E.; Cianchi, A.; Ferrario, M.; Filippi, F.; Giulietti, D.; Marocchino, A.; Mira, F.; et al. First measurements of betatron radiation at FLAME laser facility. Nucl. Instrum. Methods Phys. Res. B 2017, 402, 388–392. [Google Scholar] [CrossRef]
- Curcio, A.; Giulietti, D.; Dattoli, G.; Ferrario, M. Resonant interaction between laser and electrons undergoing betatron oscillations in the bubble regime. J. Plasma Phys. 2015, 81, 495810513. [Google Scholar] [CrossRef]
- Curcio, A.; Giulietti, D.; Petrarca, M. Tuning of betatron radiation in laser-plasma accelerators via multimodal laser propagation through capillary waveguides. Phys. Plasmas 2017, 24, 023104. [Google Scholar] [CrossRef]
- Curcio, A.; Giulietti, D. Innovative X–γ ray sources based on laser-produced plasmas. Nucl. Instrum. Methods Phys. Res. B 2015, 355, 214–216. [Google Scholar] [CrossRef]
- Curcio, A.; Gatti, G. Time-domain study of the synchrotron radiation emitted from electron beams in plasma focusing channels. Phys. Rev. E 2022, 105, 025201. [Google Scholar] [CrossRef] [PubMed]
- Curcio, A.; Anania, M.; Bisesto, F.; Chiadroni, E.; Cianchi, A.; Ferrario, M.; Filippi, F.; Giulietti, D.; Marocchino, A.; Petrarca, M.; et al. Trace-space reconstruction of low-emittance electron beams through betatron radiation in laser-plasma accelerators. Phys. Rev. Accel. Beams 2017, 20, 012801. [Google Scholar] [CrossRef]
- Curcio, A.; Anania, M.; Bisesto, F.; Chiadroni, E.; Cianchi, A.; Ferrario, M.; Filippi, F.; Giulietti, D.; Marocchino, A.; Mira, F.; et al. Single-shot non-intercepting profile monitor of plasma-accelerated electron beams with nanometric resolution. Appl. Phys. Lett. 2017, 111, 133105. [Google Scholar] [CrossRef]
- Curcio, A.; Cianchi, A.; Costa, G.; Demurtas, F.; Ehret, M.; Ferrario, M.; Galletti, M.; Giulietti, D.; Perez-Hernandez, J.A.; Gatti, G. Performance Study on a Soft X-ray Betatron Radiation Source Realized in the Self-Injection Regime of Laser-Plasma Wakefield Acceleration. Appl. Sci. 2022, 12, 12471. [Google Scholar] [CrossRef]
- Clark, E.; Krushelnick, K.; Zepf, M.; Beg, F.; Tatarakis, M.; Machacek, A.; Santala, M.; Watts, I.; Norreys, P.; Dangor, A. Energetic heavy-ion and proton generation from ultraintense laser-plasma interactions with solids. Phys. Rev. Lett. 2000, 85, 1654. [Google Scholar] [CrossRef]
- Snavely, R.; Key, M.; Hatchett, S.; Cowan, T.; Roth, M.; Phillips, T.; Stoyer, M.; Henry, E.; Sangster, T.; Singh, M.; et al. Intense high-energy proton beams from petawatt-laser irradiation of solids. Phys. Rev. Lett. 2000, 85, 2945. [Google Scholar] [CrossRef]
- Mackinnon, A.; Sentoku, Y.; Patel, P.; Price, D.; Hatchett, S.; Key, M.; Andersen, C.; Snavely, R.; Freeman, R. Enhancement of proton acceleration by hot-electron recirculation in thin foils irradiated by ultraintense laser pulses. Phys. Rev. Lett. 2002, 88, 215006. [Google Scholar] [CrossRef]
- Dubois, J.; Lubrano-Lavaderci, F.; Raffestin, D.; Ribolzi, J.; Gazave, J.; La Fontaine, A.C.; d’Humières, E.; Hulin, S.; Nicolaï, P.; Poyé, A.; et al. Target charging in short-pulse-laser–plasma experiments. Phys. Rev. E 2014, 89, 013102. [Google Scholar] [CrossRef]
- Wilks, S.; Langdon, A.; Cowan, T.; Roth, M.; Singh, M.; Hatchett, S.; Key, M.; Pennington, D.; MacKinnon, A.; Snavely, R. Energetic proton generation in ultra-intense laser–solid interactions. Phys. Plasmas 2001, 8, 542–549. [Google Scholar] [CrossRef]
- Mora, P. Plasma expansion into a vacuum. Phys. Rev. Lett. 2003, 90, 185002. [Google Scholar] [CrossRef] [PubMed]
- Singh, P.; Cui, Y.; Chatterjee, G.; Adak, A.; Wang, W.; Ahmed, S.; Lad, A.; Sheng, Z.; Kumar, G. Direct observation of ultrafast surface transport of laser-driven fast electrons in a solid target. Phys. Plasmas 2013, 20, 110701. [Google Scholar] [CrossRef]
- Poyé, A.; Hulin, S.; Bailly-Grandvaux, M.; Dubois, J.L.; Ribolzi, J.; Raffestin, D.; Bardon, M.; Lubrano-Lavaderci, F.; D’Humières, E.; Santos, J.; et al. Physics of giant electromagnetic pulse generation in short-pulse laser experiments. Phys. Rev. E 2015, 91, 043106. [Google Scholar] [CrossRef]
- Steffen, B.; Arsov, V.; Berden, G.; Gillespie, W.; Jamison, S.; MacLeod, A.; Van Der Meer, A.; Phillips, P.; Schlarb, H.; Schmidt, B.; et al. Electro-optic time profile monitors for femtosecond electron bunches at the soft X-ray free-electron laser FLASH. Phys. Rev. Spec. Top.-Accel. Beams 2009, 12, 032802. [Google Scholar] [CrossRef]
- Pompili, R.; Anania, M.; Bellaveglia, M.; Bisesto, F.; Chiadroni, E.; Cianchi, A.; Curcio, A.; Di Giovenale, D.; Di Pirro, G.; Ferrario, M.; et al. Electro-optical methods for multipurpose diagnostics. In Proceedings of the 5th International Beam Instrumentation Conference (IBIC 16), Barcelona, Spain, 15–19 September 2016; pp. 291–294. [Google Scholar]
- Galletti, M.; Bisesto, F.; Anania, M.; Ferrario, M.; Pompili, R.; Poyé, A.; Zigler, A. Time-resolved characterization of ultrafast electrons in intense laser and metallic-dielectric target interaction. Opt. Lett. 2020, 45, 4420–4423. [Google Scholar] [CrossRef]
- Galletti, M.; Bisesto, F.; Anania, M.; Ferrario, M.; Pompili, R.; Poyé, A.; Tikhonchuk, V.; Zigler, A. Direct observation of ultrafast electrons generated by high-intensity laser-matter interaction. Appl. Phys. Lett. 2020, 116, 064102. [Google Scholar] [CrossRef]
- Fuchs, J.; Antici, P.; d’Humières, E.; Lefebvre, E.; Borghesi, M.; Brambrink, E.; Cecchetti, C.; Kaluza, M.; Malka, V.; Manclossi, M.; et al. Laser-driven proton scaling laws and new paths towards energy increase. Nat. Phys. 2006, 2, 48–54. [Google Scholar] [CrossRef]
- Zigler, A.; Eisenman, S.; Botton, M.; Nahum, E.; Schleifer, E.; Baspaly, A.; Pomerantz, I.; Abicht, F.; Branzel, J.; Priebe, G.; et al. Enhanced proton acceleration by an ultrashort laser interaction with structured dynamic plasma targets. Phys. Rev. Lett. 2013, 110, 215004. [Google Scholar] [CrossRef]
- Zigler, A.; Palchan, T.; Bruner, N.; Schleifer, E.; Eisenmann, S.; Botton, M.; Henis, Z.; Pikuz, S.; Faenov, A., Jr.; Gordon, D.; et al. 5.5–7.5 MeV proton generation by a moderate-intensity ultrashort-pulse laser interaction with H2O nanowire targets. Phys. Rev. Lett. 2011, 106, 134801. [Google Scholar] [CrossRef]
- Margarone, D.; Klimo, O.; Kim, I.; Prokupek, J.; Limpouch, J.; Jeong, T.; Mocek, T.; Psikal, J.; Kim, H.; Proska, J.; et al. Laser-driven proton acceleration enhancement by nanostructured foils. Phys. Rev. Lett. 2012, 109, 234801. [Google Scholar] [CrossRef]
- Romagnani, L.; Fuchs, J.; Borghesi, M.; Antici, P.; Audebert, P.; Ceccherini, F.; Cowan, T.; Grismayer, T.; Kar, S.; Macchi, A.; et al. Dynamics of electric fields driving the laser acceleration of multi-MeV protons. Phys. Rev. Lett. 2005, 95, 195001. [Google Scholar] [CrossRef] [PubMed]
- Quinn, K.; Wilson, P.; Cecchetti, C.; Ramakrishna, B.; Romagnani, L.; Sarri, G.; Lancia, L.; Fuchs, J.; Pipahl, A.; Toncian, T.; et al. Laser-driven ultrafast field propagation on solid surfaces. Phys. Rev. Lett. 2009, 102, 194801. [Google Scholar] [CrossRef] [PubMed]
- Kar, S.; Ahmed, H.; Prasad, R.; Cerchez, M.; Brauckmann, S.; Aurand, B.; Cantono, G.; Hadjisolomou, P.; Lewis, C.; Macchi, A.; et al. Guided post-acceleration of laser-driven ions by a miniature modular structure. Nat. Commun. 2016, 7, 10792. [Google Scholar] [CrossRef]
- Consoli, F.; De Angelis, R.; Duvillaret, L.; Andreoli, P.; Cipriani, M.; Cristofari, G.; Di Giorgio, G.; Ingenito, F.; Verona, C. Time-resolved absolute measurements by electro-optic effect of giant electromagnetic pulses due to laser-plasma interaction in nanosecond regime. Sci. Rep. 2016, 6, 27889. [Google Scholar] [CrossRef]
- Margarone, D.; Krasa, J.; Giuffrida, L.; Picciotto, A.; Torrisi, L.; Nowak, T.; Musumeci, P.; Velyhan, A.; Prokuupek, J.; Laska, L.; et al. Full characterization of laser-accelerated ion beams using Faraday cup, silicon carbide, and single-crystal diamond detectors. J. Appl. Phys. 2011, 109, 103302. [Google Scholar] [CrossRef]
- De Angelis, R.; Consoli, F.; Verona, C.; Di Giorgio, G.; Andreoli, P.; Cristofari, G.; Cipriani, M.; Ingenito, F.; Marinelli, M.; Verona-Rinati, G. High performance diagnostics for Time-Of-Flight and X-ray measurements in laser produced plasmas, based on fast diamond detectors. J. Instrum. 2016, 11, C12048. [Google Scholar] [CrossRef]
- Busold, S.; Schumacher, D.; Deppert, O.; Brabetz, C.; Frydrych, S.; Kroll, F.; Joost, M.; Al-Omari, H.; Blažević, A.; Zielbauer, B.; et al. Focusing and transport of high-intensity multi-MeV proton bunches from a compact laser-driven source. Phys. Rev. Spec. Top.-Accel. Beams 2013, 16, 101302. [Google Scholar] [CrossRef]
- Gizzi, L.; Giove, D.; Altana, C.; Brandi, F.; Cirrone, P.; Cristoforetti, G.; Fazzi, A.; Ferrara, P.; Fulgentini, L.; Koester, P.; et al. A new line for laser-driven light ions acceleration and related tnsa studies. Appl. Sci. 2017, 7, 984. [Google Scholar] [CrossRef]
- Bisesto, F.; Galletti, M.; Anania, M.P.; Costa, G.; Ferrario, M.; Pompili, R.; Zigler, A.; Consoli, F.; Cipriani, M.; Salvadori, M.; et al. Simultaneous observation of ultrafast electron and proton beams in TNSA. High Power Laser Sci. Eng. 2020, 8, e23. [Google Scholar] [CrossRef]
- Bisesto, F.; Galletti, M.; Anania, M.P.; Ferrario, M.; Pompili, R.; Botton, M.; Zigler, A.; Consoli, F.; Salvadori, M.; Andreoli, P.; et al. Single-shot electrons and protons time-resolved detection from high-intensity laser–solid matter interactions at SPARC_LAB. High Power Laser Sci. Eng. 2019, 7, e53. [Google Scholar] [CrossRef]
- Zeil, K.; Kraft, S.; Bock, S.; Bussmann, M.; Cowan, T.; Kluge, T.; Metzkes, J.; Richter, T.; Sauerbrey, R.; Schramm, U. The scaling of proton energies in ultrashort pulse laser plasma acceleration. New J. Phys. 2010, 12, 045015. [Google Scholar] [CrossRef]
- Oishi, Y.; Nayuki, T.; Fujii, T.; Takizawa, Y.; Wang, X.; Yamazaki, T.; Nemoto, K.; Kayoiji, T.; Sekiya, T.; Horioka, K.; et al. Dependence on laser intensity and pulse duration in proton acceleration by irradiation of ultrashort laser pulses on a Cu foil target. Phys. Plasmas 2005, 12, 073102. [Google Scholar] [CrossRef]
- Bisesto, F.; Anania, M.; Bacci, A.; Bellaveglia, M.; Chiadroni, E.; Cianchi, A.; Curcio, A.; Di Giovenale, D.; Di Pirro, G.; Ferrario, M.; et al. Laser-capillary interaction for the EXIN project. Nucl. Instrum. Methods Phys. Res. A 2016, 829, 309–313. [Google Scholar] [CrossRef]
- Bisesto, F.G.; Galletti, M.; Anania, M.P.; Costa, G.; Ferrario, M.; Pompili, R.; Poyé, A.; Consoli, F.; Salvadori, M.; Cipriani, M.; et al. Ultrafast electron and proton bunches correlation in laser-solid matter experiments. Opt. Lett. 2020, 45, 5575–5578. [Google Scholar] [CrossRef] [PubMed]


Disclaimer/Publisher’s Note: The statements, opinions and data contained in all publications are solely those of the individual author(s) and contributor(s) and not of MDPI and/or the editor(s). MDPI and/or the editor(s) disclaim responsibility for any injury to people or property resulting from any ideas, methods, instructions or products referred to in the content. |
© 2024 by the authors. Licensee MDPI, Basel, Switzerland. This article is an open access article distributed under the terms and conditions of the Creative Commons Attribution (CC BY) license (https://creativecommons.org/licenses/by/4.0/).