Review

Phytoplankton as CO2 Sinks: Redirecting the Carbon Cycle

by
Basilio Zafrilla
*,
Laura Matarredona
,
María-José Bonete
,
Guillermo Zafrilla
and
Julia Esclapez
Department of Biochemistry and Molecular Biology and Soil Science and Agricultural Chemistry, Faculty of Science, University of Alicante, Carretera de San Vicente del Raspeig s/n, 03690 Alicante, Spain
*
Author to whom correspondence should be addressed.
Appl. Sci. 2024, 14(19), 8657; https://doi.org/10.3390/app14198657
Submission received: 16 August 2024 / Revised: 16 September 2024 / Accepted: 23 September 2024 / Published: 25 September 2024

Abstract

:
Since the Industrial Revolution, nearly 700 Gt of carbon (GtC) have been emitted into the atmosphere as CO2 derived from human activities, of which 292 GtC remain uncontrolled. By the end of this century, the atmospheric CO2 concentration is predicted to surpass 700 ppm. The effects of this sudden carbon release on the worldwide biogeochemical cycles and balances are not yet fully understood, but global warming and climate change are undeniable, with this gas playing a starring role. Governmental policies and international agreements on emission reduction are not producing results quickly enough, and the deadline to act is running out. Biological CO2 capture is a fast-acting carbon cycle component capable of sequestering over 115 GtC annually through photosynthesis. This study analyses a hypothetical scenario in which this biological CO2 capture is artificially enhanced through the large-scale cultivation of phytoplankton in partially natural photobioreactors (PBRs). To develop this approach, the current figures of the carbon cycle have been updated, and the key aspects of phytoplankton cultivation technology have been analysed. Our results show that a global increase of 6.5% in biological capture, along with the subsequent stabilization of the produced biomass, could counteract the current CO2 emission rate and maintain atmospheric levels of this gas at their current levels. Based on a review of the available literature, an average production rate of 17 g/m2·day has been proposed for phytoplankton cultivation in horizontal PBRs. Using this value as a key reference, it is estimated that implementing a large-scale production system would require approximately 2.1 × 10⁶ km2 of the Earth’s surface. From this, a production system model is proposed, and the key technological and political challenges associated with establishing these extensive cultivation areas are discussed.

1. Introduction

We are undoubtedly witnessing the beginning of a change in our planet’s climate [1]. Since large-scale climate changes have occurred periodically on the Earth, it remains unclear to what extent this fluctuation is triggered by human activities developed in the last 300 years or if it is a process that would have occurred anyway. What seems evident is that human activity, primarily the exponential burning of fossil fuels, is greatly accelerating the process [2]. Since there are no precedents for a similar event, our civilization is not yet aware of the many direct effects that this acceleration of global warming may have on our daily lives. Although the scientific community is constantly recording increasingly representative figures about the significant relationship between the increase in CO2 in the atmosphere and the increasingly frequent climate anomalies, the measures being implemented at the international level are lax and insufficient and involve a sudden change in our energy system that no country is willing to assume responsibility.
Since human activities have imbalanced the carbon cycle toward its gaseous form, it seems logical that humans take the necessary measures to counteract this imbalance by boosting the natural inverse mechanisms. Photosynthesis is the planet’s natural tool to decarbonise the atmosphere in the short term. Thus, it is logical to think that controlling and stimulating this process could be the quickest way to curb the accumulation of this greenhouse gas. However, without human intervention, this mechanism cannot counter this explosive release of carbon. Phytoplankton cultivation technology emerges as one of the most mature, efficient, and versatile technologies for achieving this goal, compared to other CO2 capture methods such as chemical and physical processes or land reforestation with higher plants [3]. This work provides an overview of the numbers in stimulating photosynthesis on a global scale through the extensive and controlled culture of phytoplankton, as well as a documented discussion of the significant technological and geopolitical challenges governments would face to implement this biological capture of CO2 worldwide.

2. Photosynthesis and Global Balances of Matter and Energy

2.1. Energy Inputs in Perspective

Life on Earth is sustained by a constant flow of energy circulating among all living organisms and powering their metabolisms [4]. This energy is transferred through the different trophic chains that allow the succession of consecutive generations under the selective pressure of the different biotopes. Finally, this energy is gradually lost as heat. Hence, an essential prerequisite for life is the constant entrance of an unlimited amount of transferable energy [5]. In terms of quantity, virtually all energy that sustains life comes from sunlight. Only some chemoautotrophic archaea and bacteria groups can oxidise simple organic and inorganic compounds as an energy source [6]. Every hour, 1.7 × 10⁵ TWh of solar energy impact the Earth’s surface. To put this data in perspective, the annual energy consumption of our civilization is 1.65 × 10⁵ TWh. This means that the annual energy needed to maintain our civilization is provided by only 1 h of solar radiation [7].

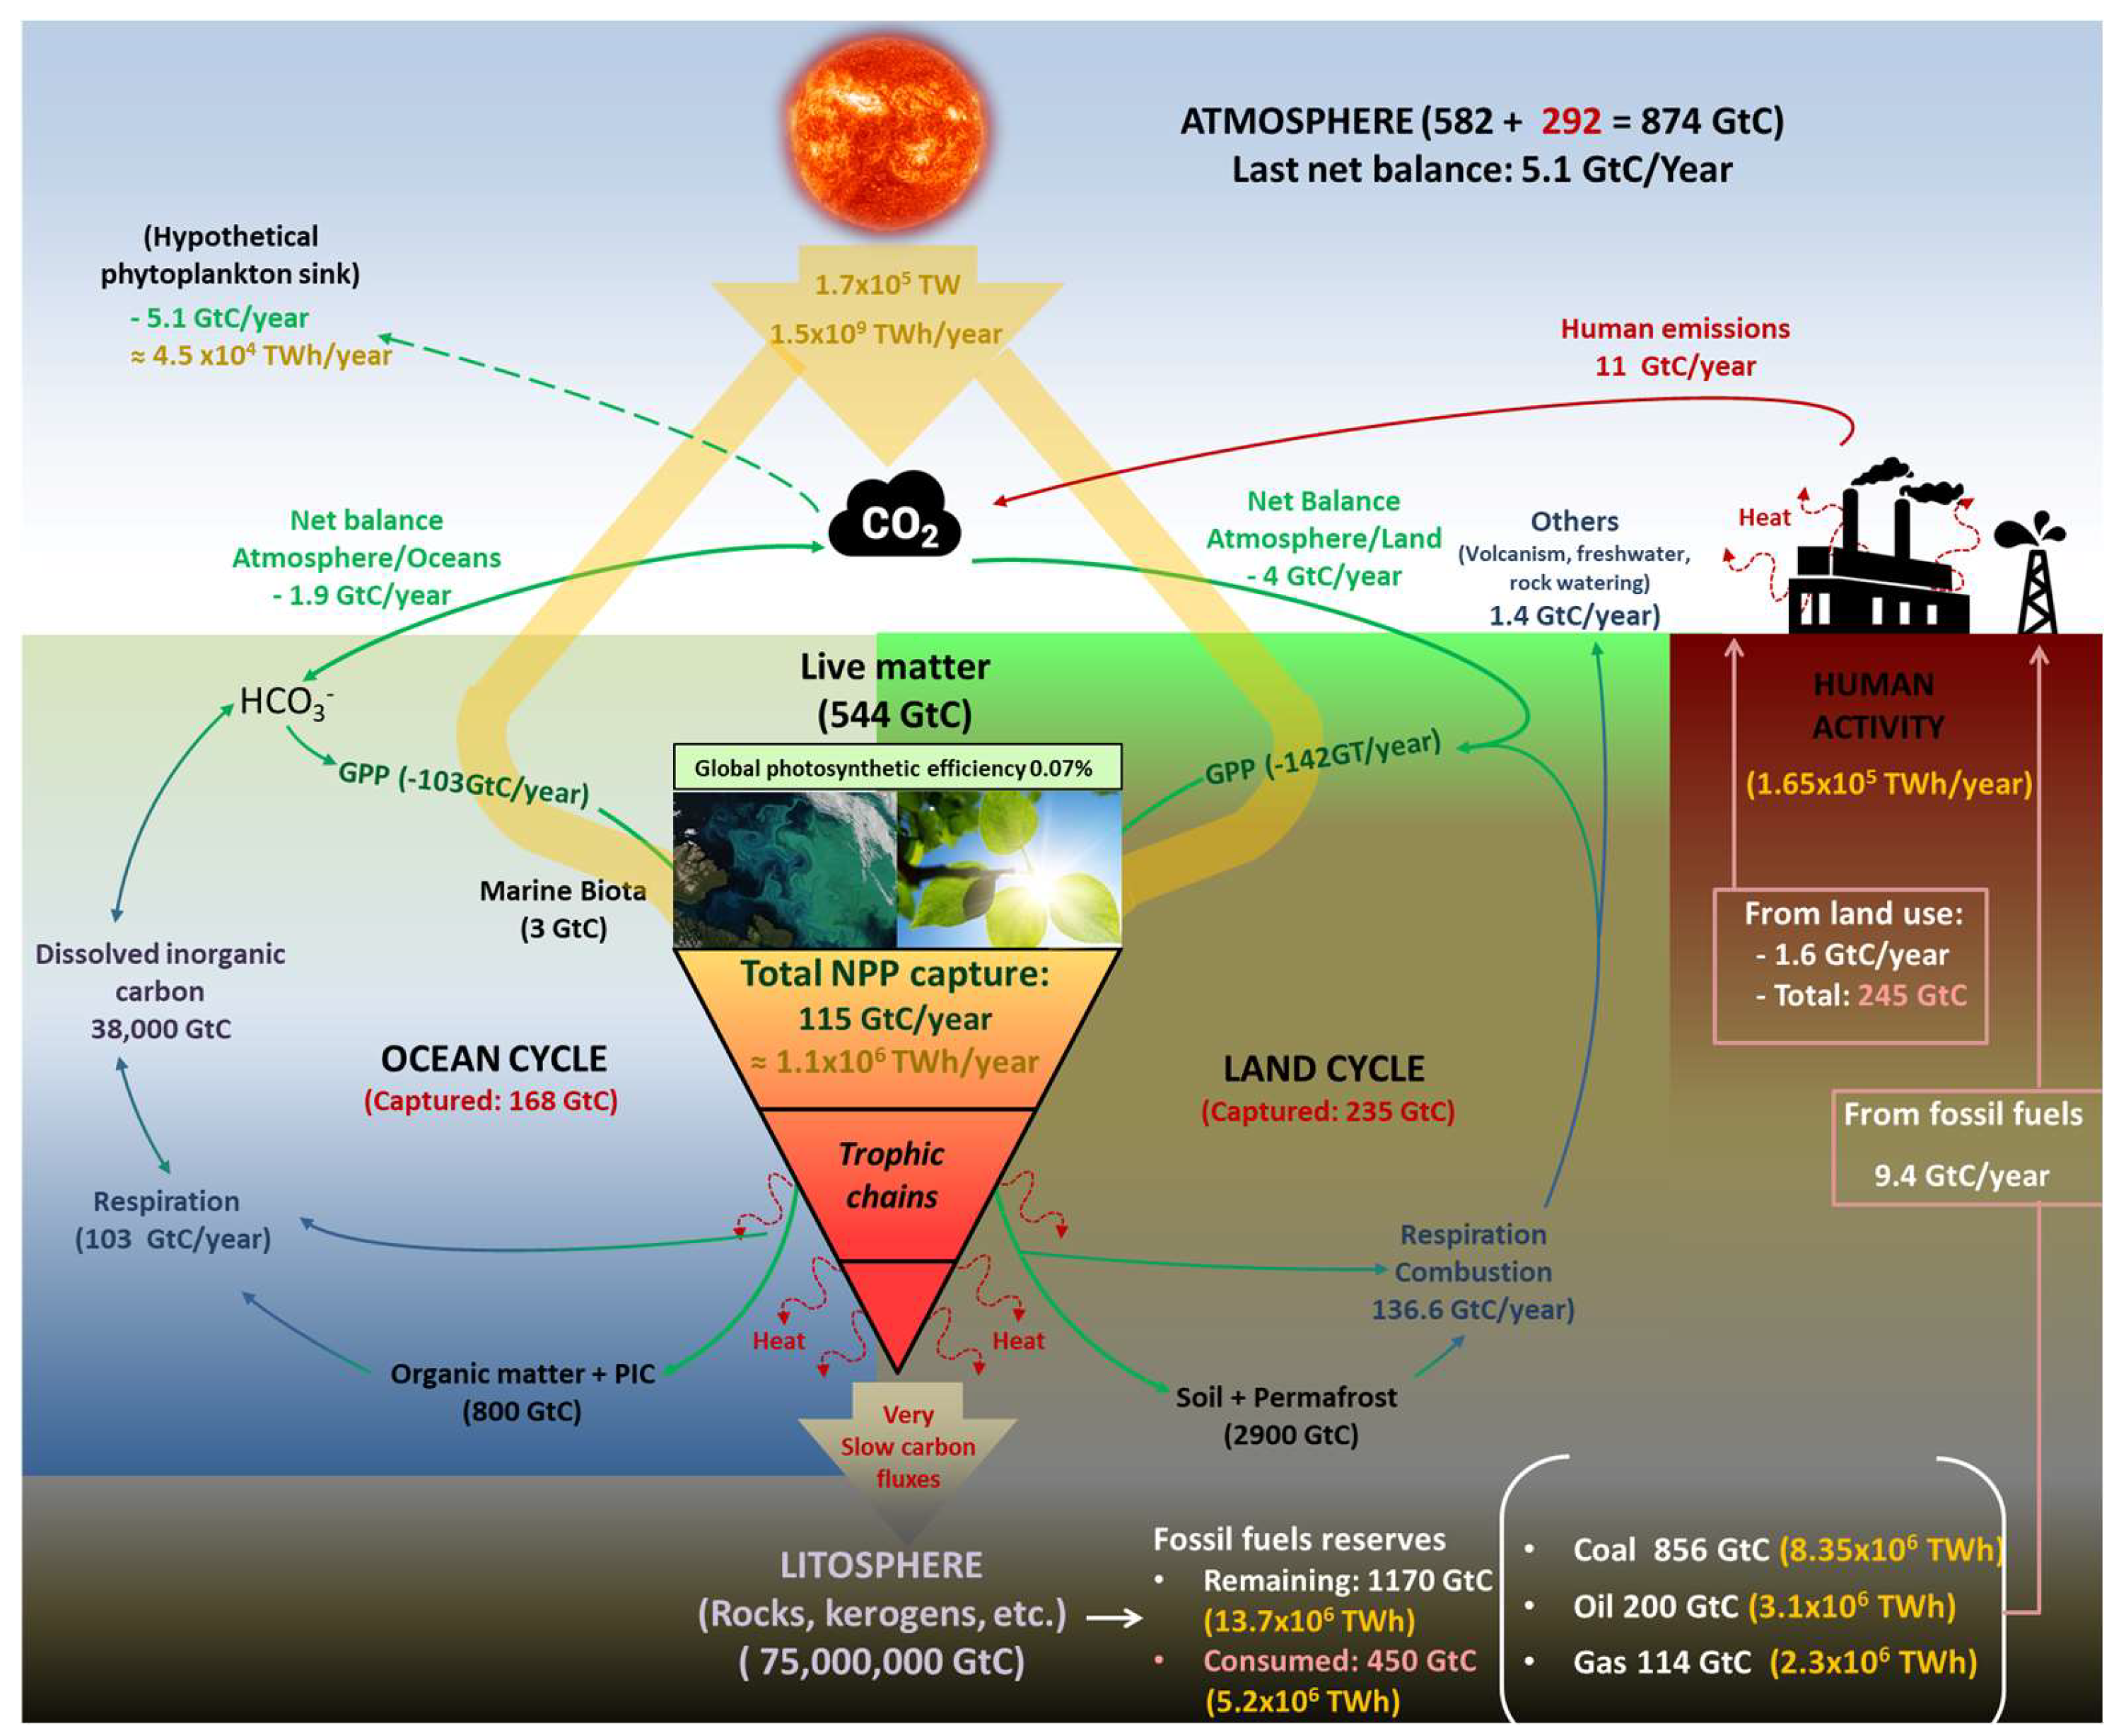
2.2. Carbon Cycle and Civilization

Before the industrial revolution, the biological carbon cycle maintained its flows almost in equilibrium, and the CO2 concentration in the atmosphere stayed stable between 260 and 285 ppm for almost 12,000 years [8]. In this cycle, approximately 1.1 × 10⁶ TWh of sunlight is annually trapped, together with 115 Gt of carbon (GtC) in the form of atmospheric CO2, as Net Primary Production (NPP) to synthesise approximately 210 Gt of organic matter [9,10,11], of which land biomes capture approximately 67 GtC (58%), and oceans sink 48 GtC (42%). Despite this enormous flow of matter and energy, 95% of this biomass is finally decomposed across the different trophic chains, releasing the stored energy, powering the life (macro and microscopic), and finally returning to the atmosphere as CO2 [12]. These numbers imply that the planet’s surface, which is covered by primary producers, captures approximately 0.07% of incident radiation as organic carbon, agreeing with the numbers proposed by Barber [13]. Since the industrial revolution, mainly since 1960, an additional and artificial source of CO2 has rapidly overloaded the atmosphere with this gas, unbalancing the above cycle (Figure 1).
In absolute terms, the total CO2 emitted to the atmosphere since 1960 is estimated at 2570 Gt (695 GtC), of which 65% comes from the growing fossil fuel use and the remaining 35% comes from land use (agricultural, residential, industrial, etc.). In this way, the atmosphere has gone from an almost stable load of 2154 Gt of CO2 before industrialization to 3280 Gt (+52%), which means 304 GtC of additional carbon. Note the sharp difference between the total carbon emitted (695 GtC) and the carbon accumulated (304 GtC). Different natural and artificial sink mechanisms could explain this mismatch. The increase in atmospheric CO2 results in a proportional increase in its partial pressure over ocean surfaces. This causes a shift in the chemical equilibrium toward a higher solubility rate of CO2 in water. This general trend can be intermittently altered by many other climatic phenomena, such as El Niño [15]. However, a growing rate of CO2 uptake by the oceans has been quantified from almost zero in 1750 to 1 GtC in 1960 until the current 2 GtC/year [10,16]. As absolute figures, since 1750, oceans have captured 168 GtC as dissolved inorganic carbon (DIC), becoming part of their CO2/HCO3 equilibrium.
Consequently, marine waters are acidifying progressively and are expected to double in acidity before 2100 [17]. In this way, the effects of CO2 gas accumulation become evident not only through excessive greenhouse effect and, consequently, a rise in global temperature but also through a decrease in the pH of water bodies. The uncontrolled and explosive variation of both parameters could result in catastrophic consequences for any ecosystem, such as coral reefs. Otherwise, the net land uptake of CO2 has gradually increased from almost zero in the 1980s to the current 4 GtC/year. This fact can be explained by an increase in Gross Primary Photosynthesis (GPP) caused by the eutrophication of soils and atmosphere and the expansion of agricultural land. It is estimated that since 1750, almost 870 Gt of CO2 (235 GtC) derived from human emissions has been locked as land carbon (vegetation and soils). In summary, the total emitted carbon by human activities since the beginning of the Industrial Revolution (695 GtC) is distributed among land (34%), oceans (24%), and the atmosphere (42%), meaning that global mechanisms of the planet have managed to lock 58% of these emissions [10,18].

2.3. Photosynthetic Efficiency

Despite a large amount of energy continuously reaching the Earth’s surface, only a small percentage of this is finally stored as reduced carbon by photosynthesis. Initially, only 53% of the incident radiation belongs to the PAR (Photosynthetic active radiation) region, which is suitable for its photochemical transformation. Thirty percent of this effective light is lost by hitting non-photosynthetic cell structures of most primary producers, ending up in available 37%. Ignoring photoinhibition scenarios, 24% of entered photons in PSI and PSII are lost in the adjustment to reach the optimal conversion wavelengths, yielding 28% concerning initial radiation. During the chemical conversion of this remaining light, 68% is lost along the different electronic chains and enzymatic reactions, and only 9–11% of the initial energy is stored as proper monosaccharides for the metabolism (GPP). Finally, 40% of these compounds are employed in mitochondria or involved in photorespiration processes [19], meaning a 5% theoretical PE (Photosynthetic Efficiency). Photorespiration is partially avoided and improved in C4 and CAM plants, shifting the final theoretical efficiency to 6–7%. Alternatively, C3 plants show passive control against photorespiration/carboxylation balance, reaching 4.7% of theoretical PE [20,21]. However, these values become even lower in natural environments and rarely exceed 2.4% and 3.4% for C3 and C4 crops, respectively, in what is usually called NPP [22].
Microalgae and cyanobacteria present some differences in this general diagram. Their complexity and the lack of specialised structures allow the reduction of photon impact on non-photosynthetic structures. Furthermore, in these organisms, RuBisCo works in a CO2-rich environment provided by the carboxysomes (cyanobacteria) or the pyrenoid (microalgae), which largely avoid the photorespiratory activity of RuBisCo [23,24]. Therefore, the PE of some microalgae species has been established at approximately 20% under highly controlled scenarios [25]. Nevertheless, the annual averages of outdoor biomass production systems rarely offer a PE value above 2.5% due to the broad ranges of temperatures and fluctuations in photoperiods and light intensities, among other handicaps [26].

3. Phytoplankton Culture

3.1. A Brief History

There are few references to the human use of microalgae or cyanobacteria before the 20th century. There have only been a few references about using Nostoc sp. as a survival food in famine seasons or as a medicinal herb by local alchemists approximately 200–300 AD [27]. Additionally, there are some manuscripts on the culinary and medicinal use made by the Aztecs of Arthrospira platensis (Spirulina), which they called “Tecuilatl”. The first Spanish conquerors collected these texts at the end of the fifteenth century [28]. There is also evidence of the traditional consumption of Spirulina by the Kanembu people near Lake Chad [29]. However, it was not until the mid-20th century that the first attempts to produce some microalgae species as human food (Chlorella vulgaris, Arthrospira platensis, etc.) were carried out and documented industrially [30]. From this point on, the development of a whole technology focused on producing different species (Dunaliella salina, Haematococcus pluvialis, Scenedesmus sp., Nannochloropsis gaditana, etc.) began. In parallel, other biotechnological applications were scientifically verified for these and other species and derived compounds, not only as human food but in different fields such as health, cosmetics, or as an energy source [31]. This development culminated with the appearance of the term photobioreactor as a production unit and the development of many designs and culture strategies where the economic viability of the process began to be considered [32].

3.2. Photobioreactors (PBRs)

Historically, PBRs have been classified into two main groups based on their culture-atmosphere interface (Figure 2). These groups are artificial lakes/open ponds and closed PBRs [33].

3.2.1. Open Ponds/Artificial Lakes

Open ponds can be considered an optimization of natural lakes where microalgae and cyanobacteria thrive spontaneously. Therefore, open ponds involve large volumes of culture with a horizontal layout and depths between 20 and 100 cm, which are usually mixed using paddle wheels or by bubbling with air or CO2-enriched air. The control over critical parameters that affect growth rates (pH, temperature, etc.) is usually minimal. As a result, the productivity of these ponds is typically low [34]. Due to the large contact surface with the atmosphere, these systems present a high probability of contamination. Furthermore, the large liquid–air interface leads to an effective rate of evaporation and water loss, which must be replaced artificially or naturally. As the main advantage, open ponds are low-cost systems considering their implementation, running, and scaling. Some representative models of open ponds include raceway ponds [35] or circular oxidation ponds used for water purification [36].

3.2.2. Closed PBRs

In contrast to open ponds, closed PBRs minimise contact between the culture and the atmosphere, thereby reducing the likelihood of contamination and evaporation rates. Consequently, closed PBRs allow for several geometries and designs [33]. A typical example of closed PBRs is a flat panel, where the culture stays vertically arranged between two transparent surfaces spaced several centimetres apart [37]. Other functional geometries include tubular PBRs, where the culture flows through transparent tubes (glass, polymethyl methacrylate, polycarbonate, etc.) of variable diameter arranged vertically, horizontally, or in a helical configuration [38,39]. A particular variant of tubular PBRs is the annular system, where the culture grows in the cavity between two concentric tubes of different diameters that are vertically disposed [40]. Closed PBRs typically include a robust control system that continuously monitors and, if necessary, adjusts key culture parameters. Therefore, the volumetric productivity is usually higher or much higher than in open ponds. In contrast, closed PBRs are also much more expensive to implement, operate and maintain due to the complex geometry and materials required and the implementation of control systems.

3.2.3. Indoor/Outdoor PBRs

Another classification for PBRs is their setup inside or outside a protection structure [41]. In the outdoor model, the culture grows outside using sunlight as an energy source. However, it is continuously exposed to large daily and seasonal variations in temperature, illumination, and other atmospheric variables. In contrast, indoor PBRs stay secluded from meteorological conditions and sunlight, needing an artificial light source with the consequent economic spending. Alternatively, indoor models offer greater control over crucial growth factors such as light intensity, photoperiod, and temperature, resulting in increased productivity. Using greenhouses or similar structures as an intermediate strategy allows sunlight to be used as an energy source while providing partial protection over weather variations. Regarding this classification, open ponds are typically located in outdoor environments, whereas closed PBRs can improve economic viability in greenhouses.

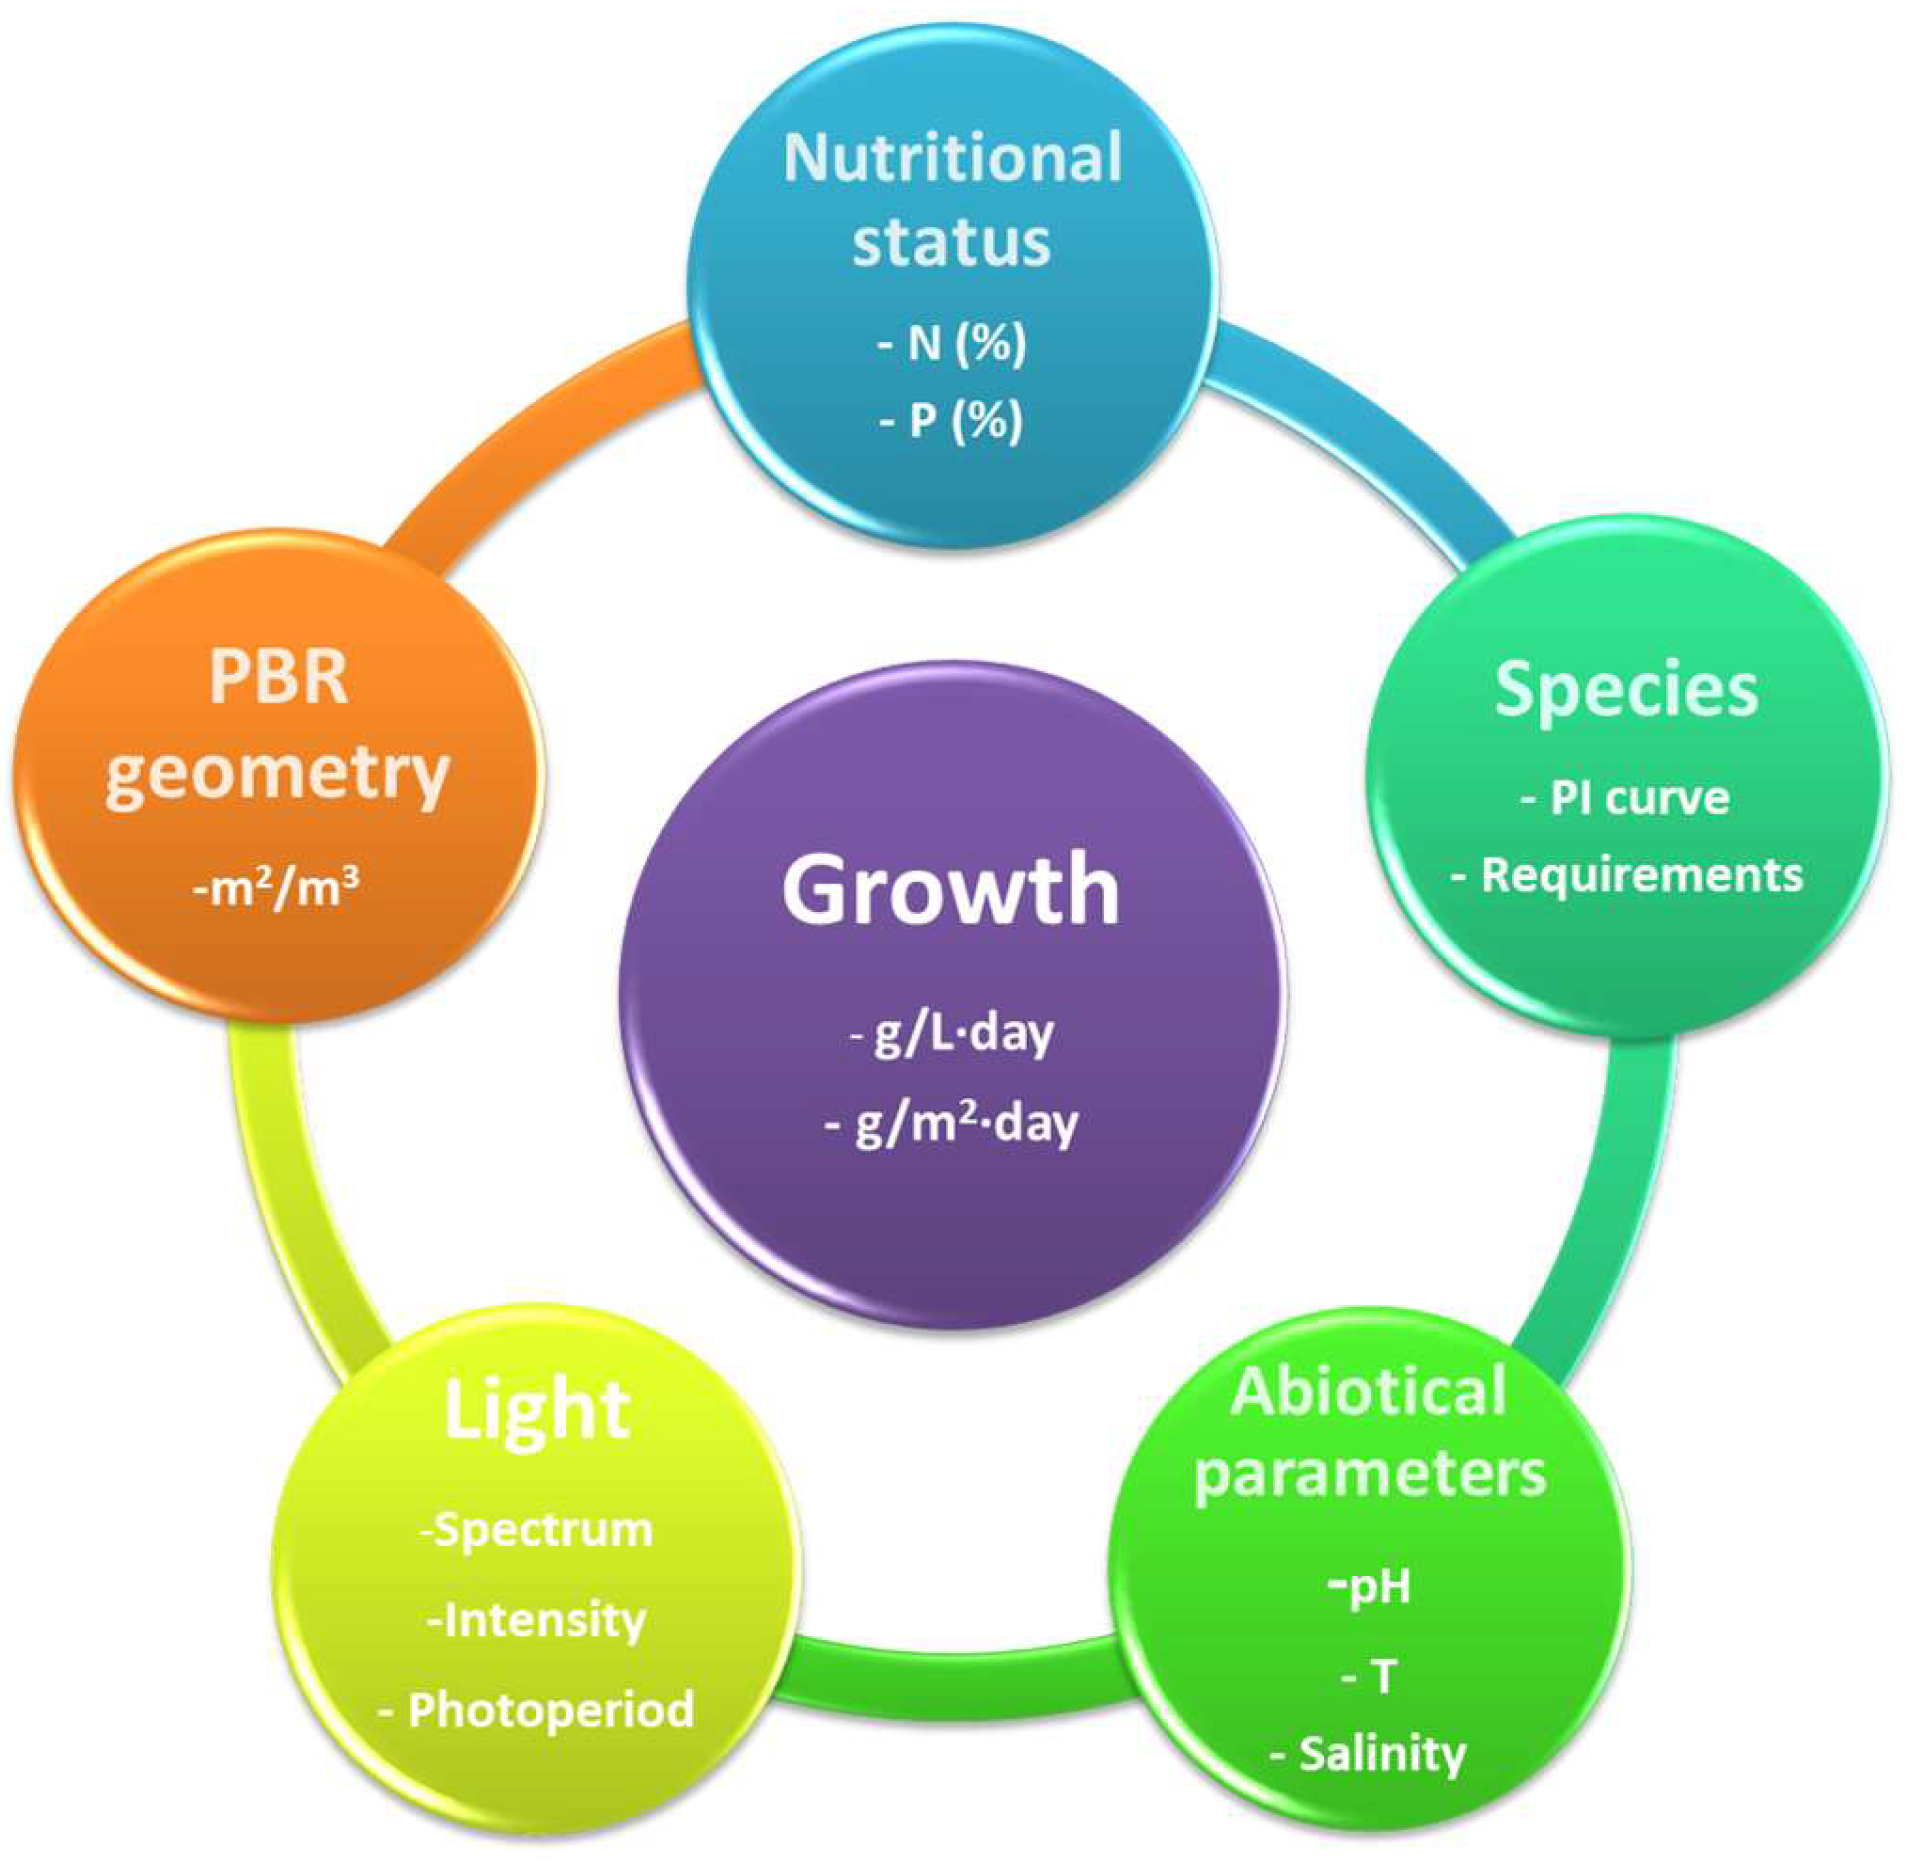
3.3. Key Parameters for the Growth
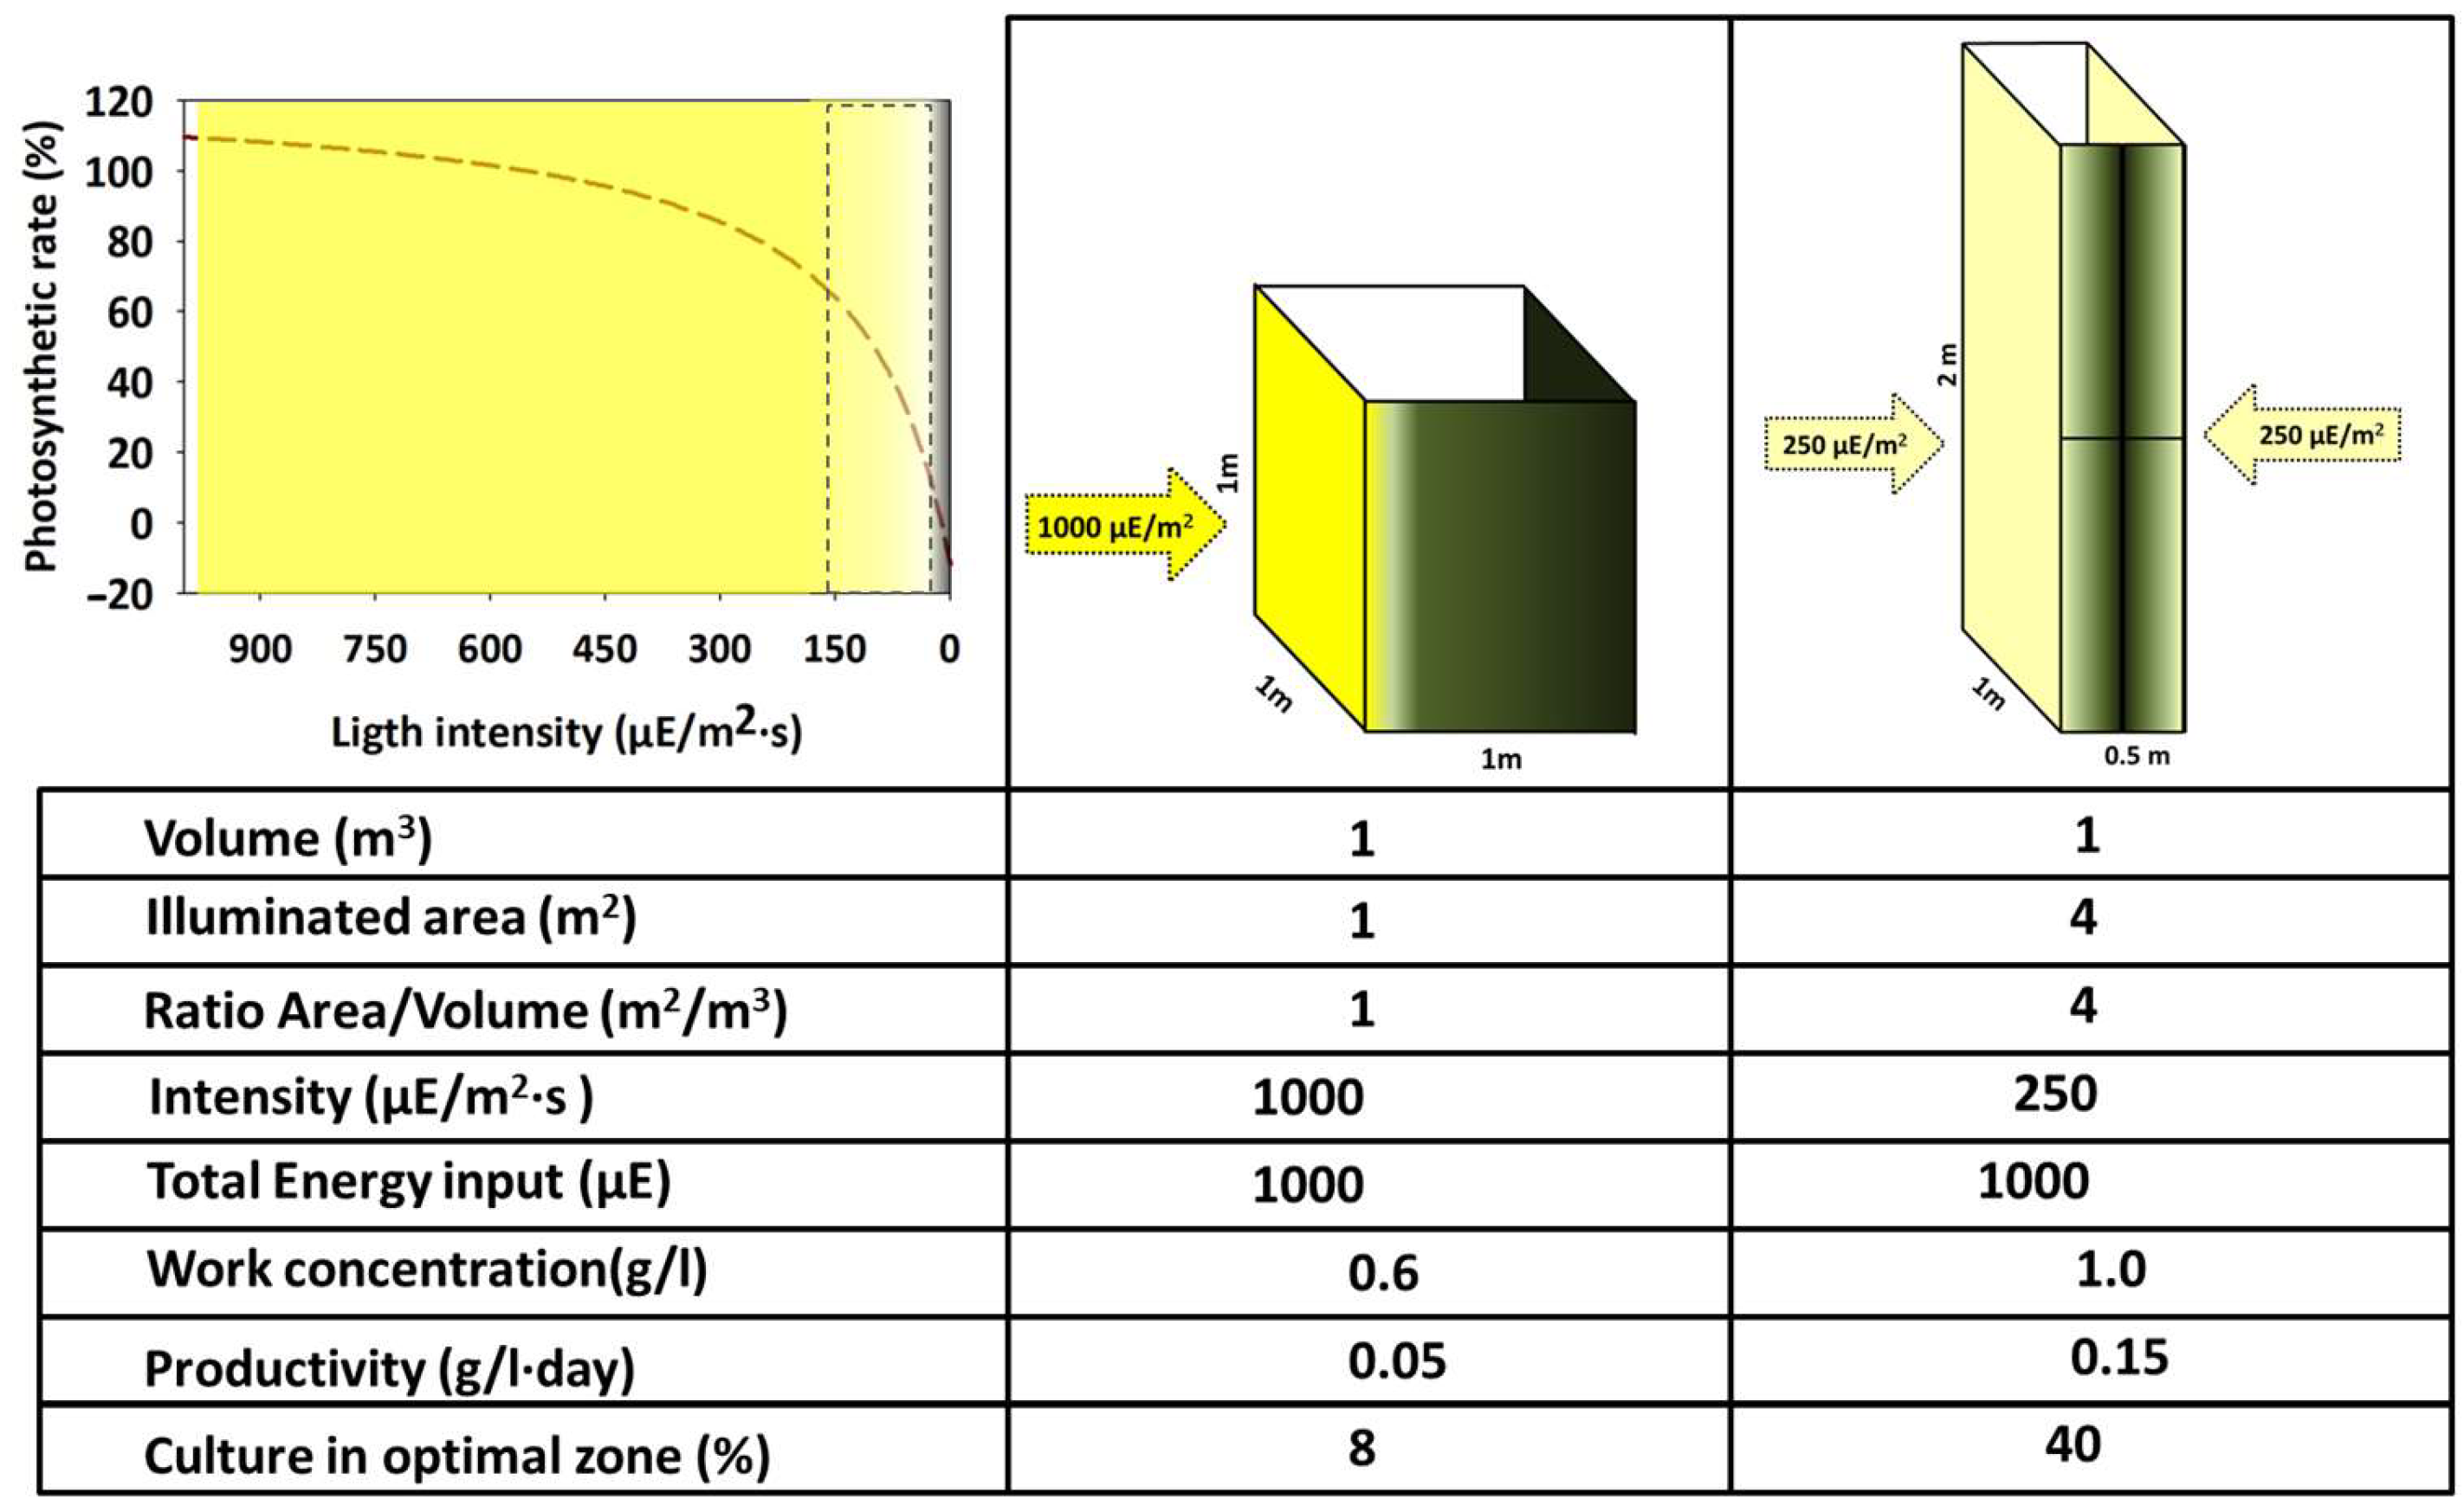
The efficiency of transforming light into biomass has a solid multifactorial character. It depends not only on the amount of light received but also on the metabolic status of the culture [42]. The following sections discuss the main factors defining photosynthetic microorganisms’ growth rate (Figure 3).

3.3.1. Light

The available light for each cell at a specific moment is the main factor that defines the potential growth rate of a specific system. Regarding utilization, light can be considered from two complementary points of view. On the one hand, regarding the values of power or energy (W/m2, µE/m2·s, Wh/m2·day, etc.), and on the other hand, considering the quality (referring to the wavelengths spectrum of the light source). Combining both features defines a specific organism’s suitability [43,44]. It is commonly believed that the light intensity reaching the surface of a PBR is proportional to the expected growth. However, two main factors complicate this relation, as shown in Figure 4.
(i) The light that impacts the surface of a PBR does not display isotropic transmission across the culture volume. Instead, it exhibits a negative, directional gradient from the surface to the interior of the volume. This decrease follows a logarithmic relationship described by the Beer–Lambert law (I = I0· e ( c ε L ) ), which states that the light intensity at any point within the optical path is determined by the concentration of the culture at the time of measurement, the optical path itself (from the lighted surface to the point of measurement), and the extinction coefficient specific to each microorganism. This feature contrasts with the heterotrophic cultures where the energy source (generally one/several soluble organic molecules) is homogeneously distributed across the entire culture volume and, therefore, available for every cell with the same probability. Thus, light is not available equally to every cell of the culture. However, it depends on the short position within the PBR and the probability of reaching the lit volume in the future. Moreover, the lighted volume of the PBR decreases simultaneously as the concentration of the culture increases. Consequently, the PBR permanently contains cells that are over-illuminated, correctly illuminated, and possibly in complete darkness. The sum of the light regimes within the PBR defines its rapid growth rate.
(ii) The kinetics of photochemical transformation follows a saturation pattern concerning the light intensity, analogous to that described by Michaelis and Menten [45] for the enzyme–substrate interaction. This relationship is termed the PI (photosynthesis-irradiance) curve. Therefore, the chloroplasts can linearly increase their oxygen production rate within a limited range of increasing light intensities. However, as the light intensity continues to increase, the photosystem eventually reaches saturation and attains a maximum value of photochemical conversion rate. At this point, the photosystems cannot process all the energy received per unit of time, and they waste it in the form of fluorescence and heat. If the light intensity increases even further, a state of photoinhibition is reached where the O2 production values drop below the maximum and the photosynthetic apparatus is partially damaged [46]. In light’s absence, O2 production is not zero but has negative values due to phytoplankton consuming this molecule as the final electron acceptor. Additionally, it is worth mentioning that the PI curve is highly adaptable and continuously adjusts through photoacclimation by changes in chloroplast pigment concentrations and ratios. This modulation is triggered by factors such as light intensity, temperature changes, or the nutritional status of the culture, and it is specific to each photosynthetic organism [47].

3.3.2. Other Abiotic Parameters

Different phytoplankton species have specific ranges for various abiotic factors, such as salinity, pH, temperature, etc. Implementing the proper tools to monitor and maintain these values within the PBR [48]. However, the control systems mechanisms are usually expensive devices with high energy consumption. Finding this equilibrium between control and expenditure is critical for the project’s viability.
(a)
Temperature
PBRs are designed to maximise the captured light; however, light and heat are two sides of the same coin. Approximately 5% and 45% of solar radiation comprise UV light (250–400 nm) and infrared radiation (700–2500 nm). As a result, outdoor closed PBRs with a high biomass concentration and surface-to-volume ratio become very efficient heat collectors whose temperature control is economically infeasible [49]. For photosynthetic microorganisms, the standard temperature range is established between 5 °C and 35 °C. Low temperatures (until 2–3 °C) have a lesser impact, causing only a decrease in cellular metabolism and a slowdown in growth. However, a slight increase in temperature above the optimal range, if sustained for a prolonged period, can dramatically reduce cell viability. Large natural bodies of water typically have a low surface-to-volume ratio, facilitating efficient heat dilution and dissipation through evaporation. This leads to high thermal inertia, resulting in less drastic temperature fluctuations and providing aquatic organisms more time to adjust their metabolism. From here, two different strategies are proposed to manage the temperature of a culture system (Figure 5).
The first preventive strategy involves adjusting the type and geometry of the PBR and the surrounding infrastructure (orientation, spacing, shading, etc.) to a specific latitude with a well-known climate. The second strategy involves corrective measures such as using cooling/heat exchangers, water sprays to counteract and mitigate harmful thermal fluctuations, and manual or automatic shading to avoid long exposures to direct radiation [50]. In any case, these corrective methods often involve significant operating costs that significantly decrease the economic viability of the culture system, especially if insufficient attention is paid to the preventative aspect.
(b)
Medium pH
The chemical composition of marine and freshwater bodies of water usually includes varying concentrations of dissolved CO2, bicarbonate, and carbonate. Carbonate strongly tends to precipitate due to its reaction with dissolved cations, particularly divalent calcium, so it is not typically present in high concentrations. For this reason, the pH value in aquatic environments is primarily regulated by the relative concentration between CO2, carbonic acid (H2CO3) and bicarbonate ion (HCO3), providing a broad pH range between 6.5 and 8.5. During photosynthesis, the carbonic anhydrases (CAH) of photosynthetic organisms use HCO3 ions and H+ to provide an adequate concentration of CO2 to RuBisCO, thus sustaining the Calvin–Benson cycle (Figure 6). This proton depletion increases the pH during the light phase of the photoperiod [51]. The magnitude of this increase is directly related to the amount of incident light and the cellular concentration of the PBR. This chemical system can result in three different scenarios when applied to microalgae culture systems.
-
In the absence of any gas exchange, protons are gradually consumed as they are incorporated into new organic compounds through the Calvin cycle, increasing pH. This increase can also cause the precipitation of carbonates, negatively impacting photosynthesis since e pH values are outside the optimal range and a lack of precursors accumulates.
-
When the culture medium is aerated with air (0.04% CO2), the pH value will reach an equilibrium that mainly depends on the water alkalinity. The maximum pH value under these conditions is usually approximately 8.3, beyond which carbonate starts to precipitate. When the photosynthetic demand for CO2 is less than the atmospheric CO2 solubilisation rate, the pH stays stable and functions as a buffer system. However, if the CO2 demand exceeds the atmospheric delivery rate due to the increment in cellular concentration and/or light intensity, the initial scenario of proton depletion will be gradually reached.
-
In some culture systems, the medium is aerated with CO2-enriched air. The final pH value, after reaching equilibrium, decreases linearly concerning the concentration of this gas in the air. At a CO2 concentration between 0.5% and 2.0%, the pH remains strongly buffered between 7.0 and 8.5 (depending on the alkalinity of the medium), which is suitable for the growth of most species. At the photosynthetic level, this strategy ensures an ample supply of CO2, even in high cell concentrations or light intensities. Hence, CO2 is never depleted, so the pH remains constantly buffered, and the photosynthesis rate is never limited.
In conclusion, the pH of photosynthetic cultures can be buffered by simply bubbling with air. In this condition, the pH value read at the equilibrium finally depends on the medium alkalinity and is usually suitable for most photosynthetic species. However, when PBR develops high photosynthetic rates, the CO2 partial pressure in the air may not be sufficient to buffer the system and sustain the Calvin cycle. The artificial rise of CO2 concentration in the air amends this depletion, protecting the buffering system and avoiding the depletion of precursors for the carboxylation reactions.
(c)
Major ions and trace metals:
The mineral composition of the medium plays a critical role in the proper development of microalgae metabolism, being a determinant in structural, physiological (osmoregulation), catalytic, and regulatory functions [52]. From this point, many suitable growth media have been developed trying to replicate and optimise the chemical features of natural environments [53].
On the one hand, freshwater media shows a low ionic strength, only with the necessary ions to maintain the osmotic equilibrium and to provide the essential cofactors and elements for metabolism (Mg2+, Ca2+, HCO3, etc.). Alternatively, media based on seawater (natural or artificial) are suitable for most marine microorganisms. Each recipe’s metals and vitamins essentially contain the same significant elements, but their concentrations are adapted to a particular group of microorganisms. In addition to these two main clusters, specialised media are available for species with unique environmental origins (halophiles, alkaliphiles, etc.) or specific nutritional requirements (cyanobacteria, diatoms, etc.).

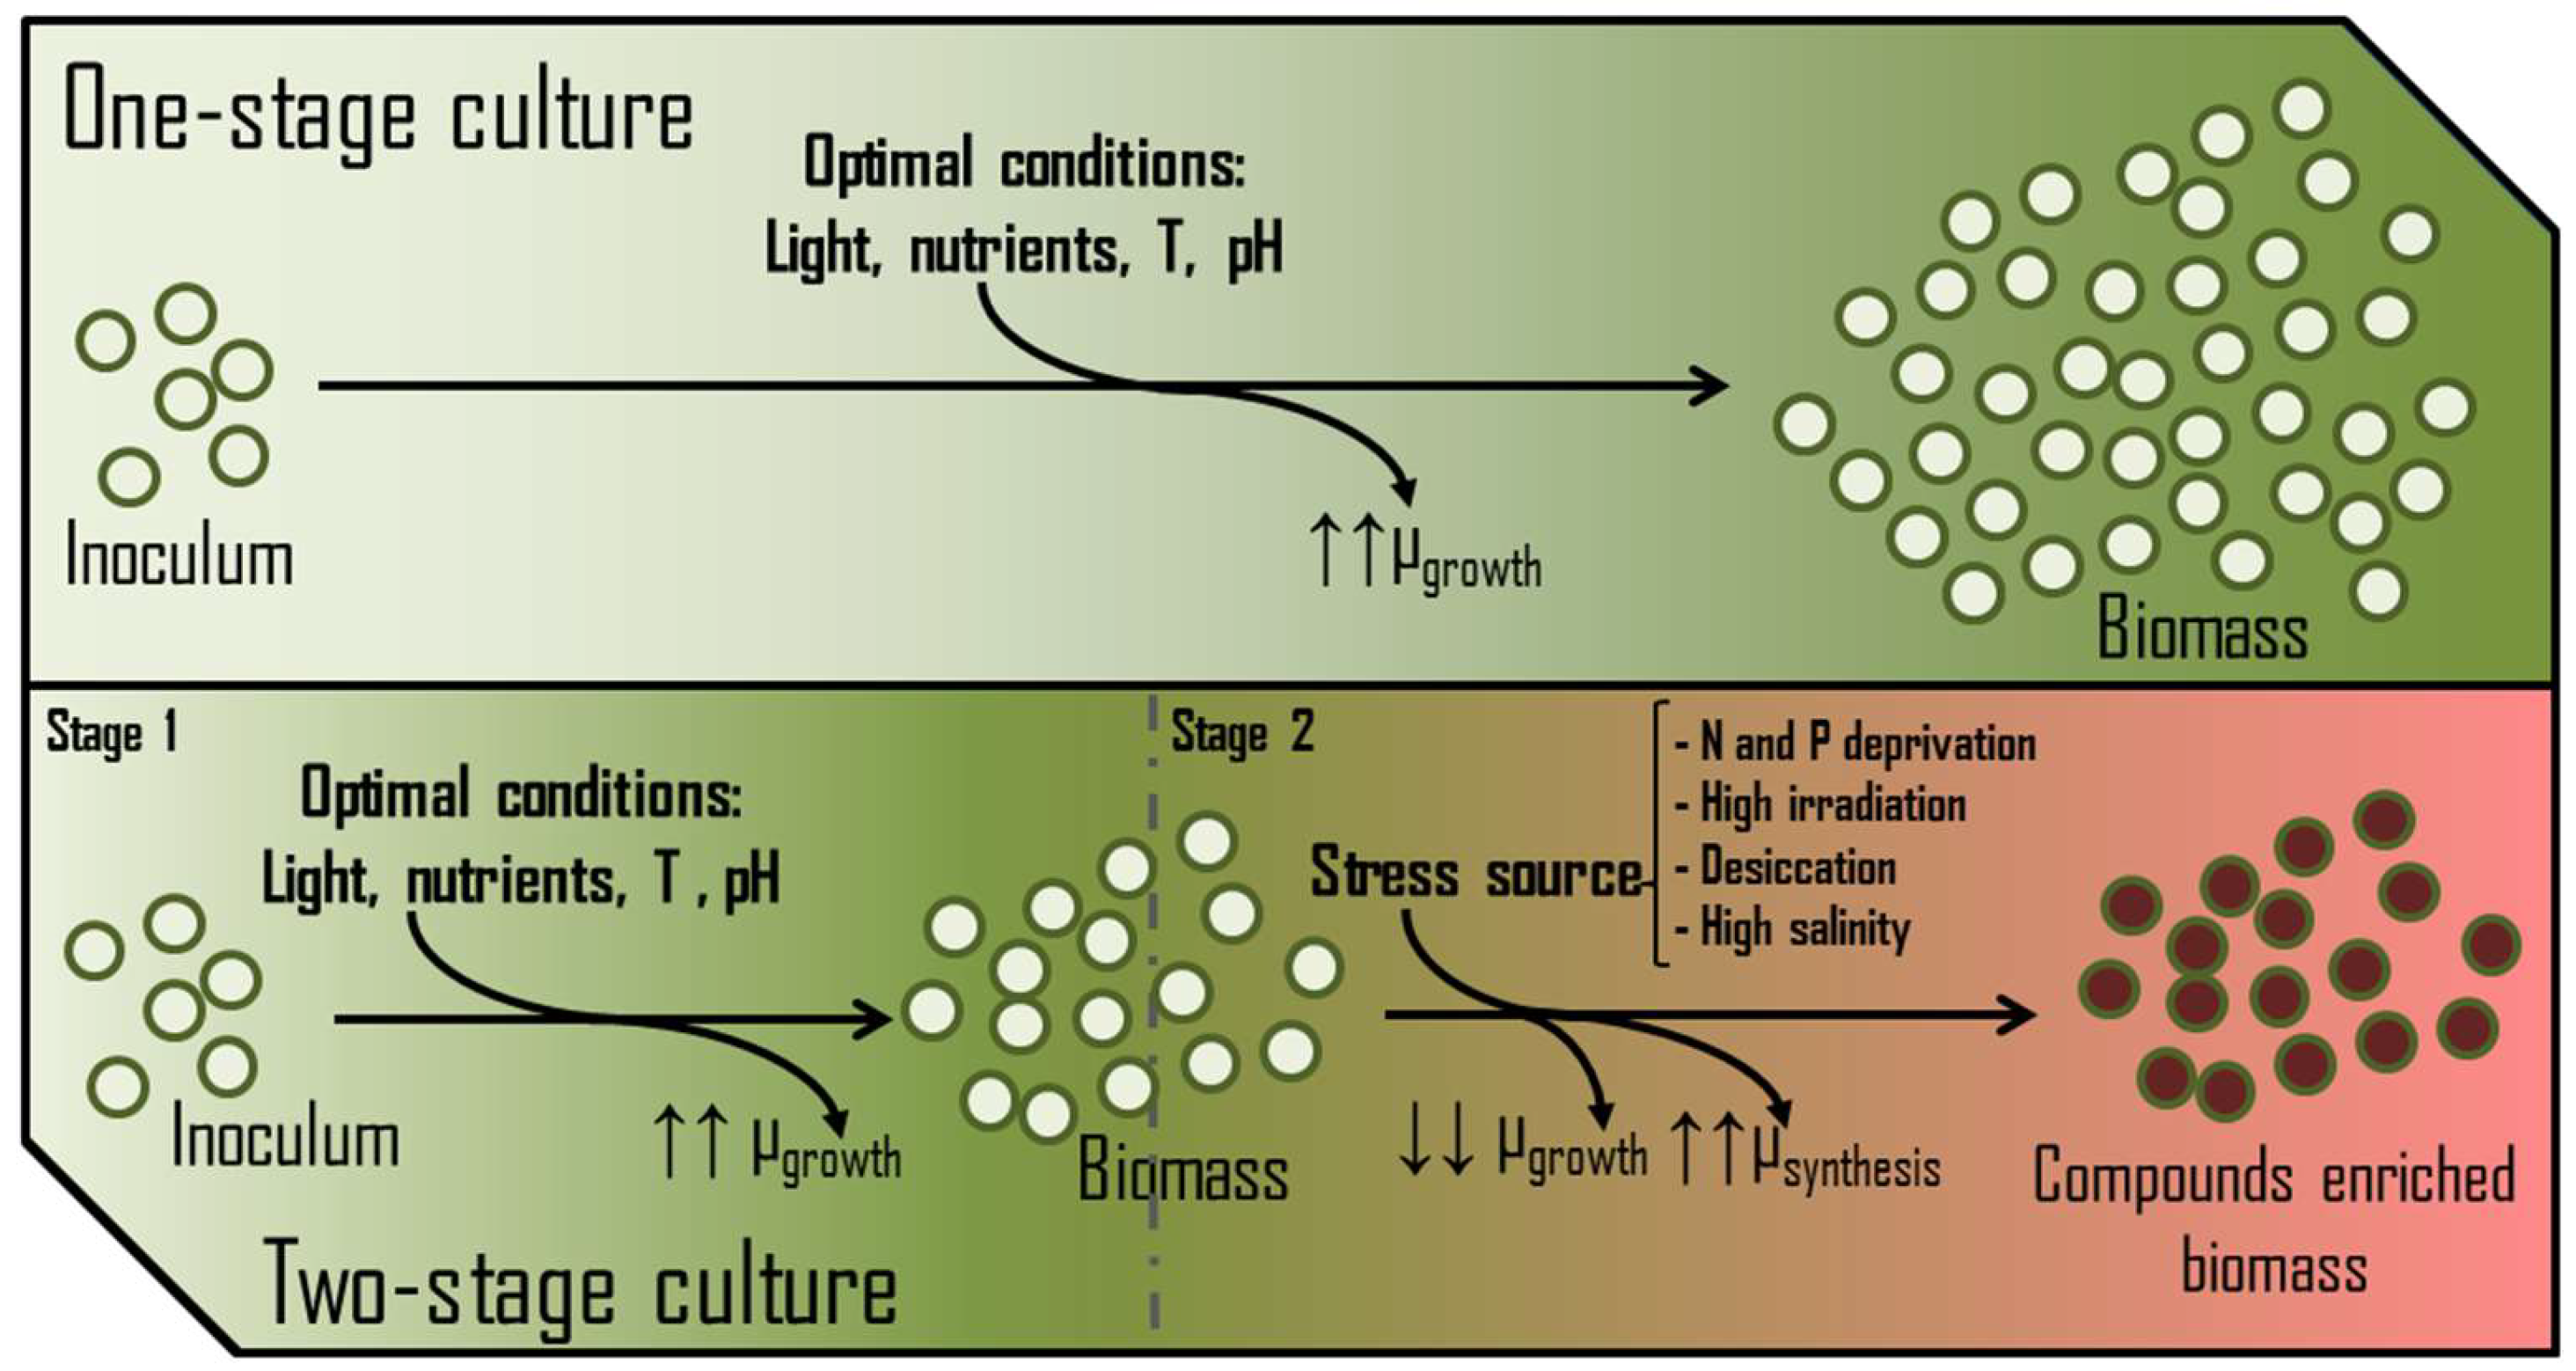
3.3.3. Nutritional Status

Decision-making by any cell at the metabolic level depends entirely on the temporary availability of nutrients and energy. The accessibility to energy and carbon has mainly been argued in previous paragraphs, showing specific features. Therefore, nitrogen and phosphorus can be considered the primary key macronutrients whose concentrations (absolute and relative to other elements) determine the nutritional state of the cell [54]. In the presence of non-limiting concentrations of assailable nitrogen (NO3, NO2, NH4+, urea, etc.) or phosphorus (PO43−), besides the proper availability of CO2 and light, photosynthetic microorganisms focus their metabolism on the growth and colonization of the medium. In these terms, biomasses are usually enriched in polar membrane lipids, protein and chlorophylls and deprived of storage polymers (triglycerides, starch, polyhydroxyalkanoates, β-glucans, etc.). Thus, nitrogen and phosphorus availability in a PBR is critical for achieving maximum biomass production and avoiding the stationary phase. However, some production processes induce metabolic stress rather than maximise growth. In these cases, the availability of nitrogen and/or phosphorus is restricted to trigger the synthesis of several valuable metabolites. Examples of these compounds are β-carotene produced by Dunaliella sp. [55], astaxanthin by Haematococcus pluvialis [56], and sulphated exopolysaccharides by Porphyridium sp. [57], among others. High salinity, temperature, high irradiance, and desiccation are other factors usually tuned to stress the culture. These cultures typically develop in two growth phases (Figure 7), leading to better process performance [58].

3.3.4. Culture Mixing

Although some species of phytoplankton can actively move using flagella [59] or gas vesicles [60], most of them need an external source of movement to stay in the water column. Natural water bodies are usually large enough to generate an upper well-mixed layer using different forces such as surface contact with the wind (waves), convective currents, or even the tide cycles [61]. Nevertheless, PBRs are usually small and insulated water blocks without an artificial source of turbulence, resulting in fast water column stratification. This stratification impedes the system from reaching its maximum efficiency and finally ends with the collapse of the culture [62,63]. Briefly, the absence of turbulence produces a progressive mass gradient where the culture and the insoluble material are progressively secluded in a small volume (bottom, surfaces, etc.) within PBR. The negative consequences of maintaining this status for a long time can be multiple. If the culture sediments toward an aphotic area, the cells will not receive enough light and gradually lose their energy reserves.
Conversely, if the culture sediments are on an over-lit surface, they may suffer photoinhibition and photodamage. Alternatively, the confinement of the culture entails overpopulation and competence by the progressively reduced access to the main nutrients. If this status is prolonged, an anoxic and nutrient-deprived zone is developed in the PBR, ending with gradual cell death. Meanwhile, most of the volume remained idle. Finally, the lack of movement can create a thermocline, causing severe overheating in some zones of PBR that stay overexposed to direct radiation or near the temperature control systems. Therefore, a proper mixing system is essential to disrupt the PBR stratification and to improve heat and mass transfer. In this sense, turbulence in PBRs is usually implemented in three main ways:
(a)
Through mechanical devices such as paddle wheels [64,65] or hydraulic pumps [66], the origin currents and flows raise the biomass;
(b)
Through pneumatic devices that allow bubbling with air or CO2-enriched air, generating a current toward the atmosphere and airlift circulation [67];
(c)
Through mixed systems that use both strategies [32].
Note that the mixing forces must be finely adjusted for each species, considering its morphology and resistance. Excess turbulence can severely damage the cells with shear forces, friction, and mechanical shocks [68]. Moreover, mixing systems significantly impact the production model’s expenditures [69] since, in one way or another, they represent electrical consumption (air compressors, air blowers, centrifugal pumps, etc.).

3.4. Estimations of Growth

Various direct or indirect descriptors can determine the biomass content in a photosynthetic culture [70]. The most informative direct measurement is determining the dry weight contents of the culture given in g/L. Other useful measurements include cell count per ml using a flow cytometer or microscope. Finally, optical density is a simple and inexpensive way to assess the status of the culture. Alternatively, indirect measurements can be reliably extrapolated from the dry weight using a proper calibration curve. Rapid measures must be taken over a period to calculate the growth rate. At a laboratory scale or in low-volume experiments, the growth rate (μ) and the doubling time (Td) are the most commonly used magnitudes, while at an industrial scale with large volumes and surfaces of culture, the volumetric productivity (g/L·day) and areal productivity (g/m2·day) are used to express the amount of synthesised organic material. Over the long term, the most useful unit becomes Tn/ha·year.

3.5. Potential Numbers of Production

The reporting of growth values of photosynthetic microorganisms is plagued by a lack of standardization, making comparisons between different studies difficult. This is due to diverse PRB geometries, variability in light intensity, and insufficient reporting of key data such as surface-to-volume ratios and lighted surface percentage. Outdoor facilities and daily radiation averages further limit the accuracy of growth value assessments. The absence of a proper bibliography exacerbates these difficulties. A thorough study [71] investigated the effect of surface-to-volume ratio on the productivity of Chlorella vulgaris in a modified horizontal PBR with a V-shaped design. The illumination of the system consisted of 7.2 kWh/m2·day, simulating the complete AM 1.5G solar spectrum and distributed over a 12-h photoperiod. At the same time, the height of the water column was adjusted to modify the reactor volume but not alter the geometry. The results showed that changes in the surface-to-volume ratio had no significant impact on areal productivity, which was almost identical (52 g/m2·day) for all tested volumes. However, volumetric productivity was highly influenced by changes in the optical path, ranging from 0.19 to 1.05 g/L. The areal productivity of a flat horizontal pond used as a control, with a depth of 17 cm, was lower (21 g/m2·day). These results indicate that, in horizontal growth systems, the total incident light is the primary factor determining areal productivity, provided that other parameters remain constant.
Assuming a caloric value of 4300 Kcal/kg for Chlorella vulgaris biomass [72], the PE values recorded are 3.6% for the V-shape design and 1.5% for the horizontal pond. Likewise, these results allow for the extrapolation of growth data, avoiding taking the PBR volume into account and focusing only on incident energy. For instance, daily sunlight radiation in Alicante (as an annual average) is approximately 5.6 kWh/m2·day, which would correspond to areal productivity of approximately 17 g/m2·day for a horizontal PBR implemented at this location. Although this approach obviates the effect of several key factors, such as daily and seasonal oscillations of light and temperature, the final value is similar to other areal productivity values obtained in outdoor open ponds for several species [73,74]. Additionally, the calculated PEs are in the expected range, so taking this number as a growth rate reference for outdoor cultures is acceptable; bear in mind that this is only an approximation to the order of magnitude for this value.

4. Mitigating Fossil Energy Dependence by Enhancing Photosynthesis

In 2021, global energy consumption amounted to 1.65 × 10⁵ TWh, which is 40-fold higher than 1960 and continues to rise. Consequently, one of humanity’s most important and complex technological challenges in the following years is how to supply this exponential energy demand of our civilization. Of this energy, 82% is still obtained from burning fossil fuels, and only 18% is obtained from burning-free technologies such as nuclear energy, hydroelectric power or renewable energies (wind, photovoltaic, etc.). Furthermore, only 20% of generated electricity comes from clean sources such as hydroelectric, solar, or wind [14,75].

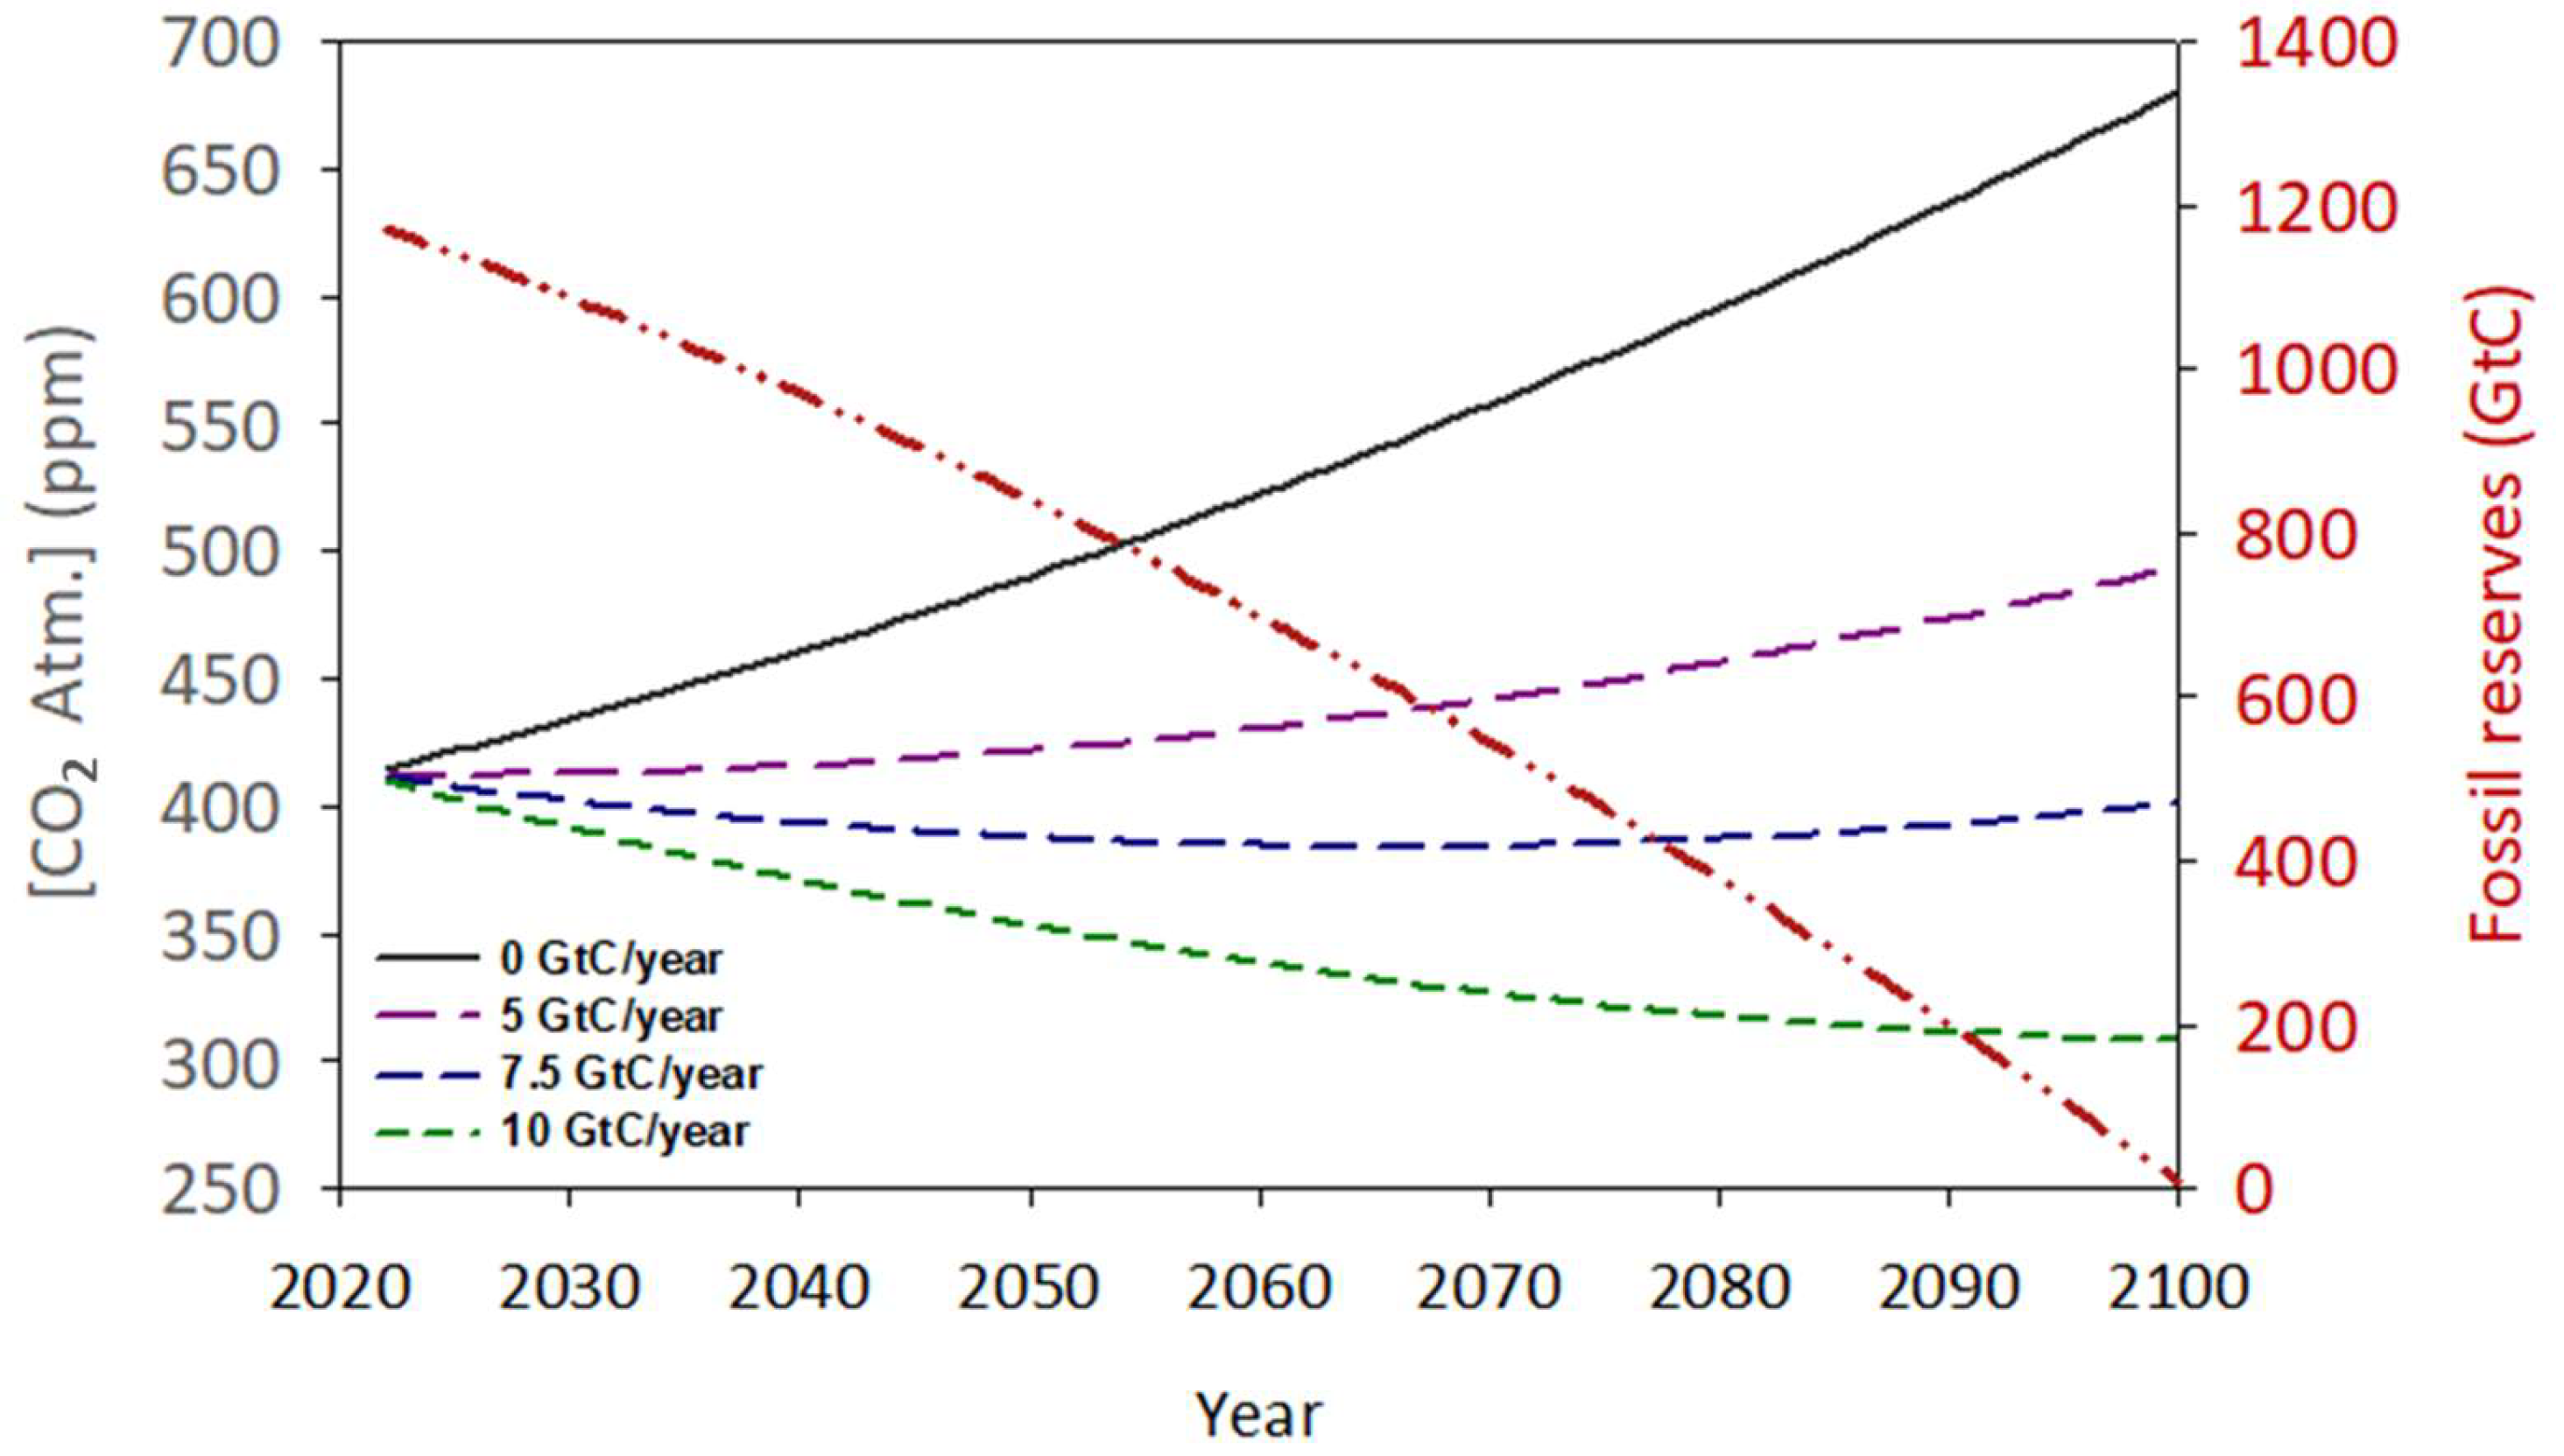
4.1. Fossil Fuel Reserves and Potential Evolution

Coal reserves at the end of 2020 (sum of anthracite, bituminous, sub-bituminous and lignite) are estimated at 1170 Gt, equivalent to an average of 8.35 × 10⁶ TWh of primary energy (28 MJ/kg). Gas reserves are estimated at 144 Gt, equivalent to 2.3 × 10⁶ TWh of energy (55 MJ/kg). Finally, oil reserves are estimated at 245 Gt, equivalent to 3 × 10⁶ TWh of energy (45 MJ/kg). From these figures, the total fossil fuel reserves can be estimated at 13.7 × 10⁶ TWh [76]. Taking into account the current consumption of energy from fossil fuels (1.36 × 10⁵ TWh) and applying an annual increase of 1 × 10³ TWh [76], these reserves (as a single block) will be exhausted in approximately 75 years (Figure 8).
During this time-lapse, 4330 Gt of CO2 will be emitted into the atmosphere, of which 58% will be theoretically absorbed by natural mechanisms (Figure 1). Therefore, in 2100, approximately 1820 Gt of CO2 will remain in the atmosphere, increasing the concentration of this gas to over 650 ppm. The effects of this rapid increase in CO2 concentration at the global level are still uncertain. However, it seems evident that an increase in global temperature will be one of the most direct consequences of this anthropogenic perturbation. Based on the current trend, it is predicted that at the time of fossil fuel depletion, the planet’s average temperature will be above 4.0 °C compared to that observed in 1800 [77]. Other potential consequences could include recurring and intense heat waves, extreme weather, changes in precipitation patterns, rising sea levels, changes in crop productivity, loss of biodiversity, and impacts on human health and the economy. So far, most of the international measures being implemented to front this challenge are focused almost exclusively on reducing CO2 emissions, both from the burning of fossil fuels as well as the anthropic use of the land, and the implementation and promotion of clean energy sources such as solar, wind, tides, and even nuclear fusion. However, these measures have not been developed fast enough to stop this process [78].

4.2. Biological Capture of CO2

The natural process of biological capture of CO2 occurs through photosynthesis by primary producers, which captures yearly 115 GtC (425 Gt of CO2). However, nowadays, this mechanism cannot compensate for the large anthropic CO2 emissions. To correct this imbalance, it seems logical to boost the biological capture of CO2 through strategies such as reforestation, afforestation, agroforestry, and the mass culture of photosynthetic microorganisms. Microalgae and cyanobacteria are the most efficient organisms at the photosynthesis level around the biosphere [25]. Its simplicity allows, under suitable conditions, not to have seasonal production cycles but to be continuously divided. Otherwise, the technology for cultivating these microorganisms already has a consolidated trajectory and a considerable degree of development, so it is reasonable to consider their use to capture excess CO2 in our atmosphere [79,80].

4.3. A Matter about Figures and Politics

This study attempts to show a numerical and conceptual evaluation of the feasibility of using biological capture, specifically by cultivating large quantities of phytoplankton, as a solution for excess CO2. From Figure 1, a net flux of approximately 5.1 GtC/year is proposed, which is equivalent to 18.75 Gt CO2. Assuming that 1 g of produced microalgae biomass (55% carbon) can neutralise 2 g of CO2 [81], it would be necessary to produce 9.25 Gt/year of biomass to offset the excess CO2. Figure 8 shows the hypothetical evolution of atmospheric CO2 in a pessimistic scenario where the emission of this gas continues uncontrolled as nowadays, reaching over 700 ppm in a few decades. In comparison, other scenarios are simulated, including the restorative effect of different multiples of the initial phytoplankton production for zero net emissions. Hence, a hypothetical biomass production of approximately 13 Gt/year (7.5 GtC) would be able to block the current rise in atmospheric CO2 concentration even if any restriction is applied to the current rate of emissions. To approach the impact of this production, and despite the significant risk of bias due to the multifactorial nature of the parameter, it is necessary to establish a biomass production figure per unit area of cultivation. In this sense, we can use the figure of 17 g/m2·day proposed in Section 3.5 as the average production value for horizontal outdoor cultures. This is equivalent to saying that each square metre of cultivated surface can capture 34 g of CO2 per day. From here, it can be estimated that it will take a culture area of approximately 2.1 × 10⁶ km2 to reach this target. To put this value in context, this surface is comparable to Greenland (2.16 × 10⁶ km2) and represents 0.41% of the planet’s total surface and 1.41% of the land surface. Note that the current land area expended in agriculture is approximately 38% of the planet’s emerged land [82], which is 30 times higher than the proposed percentage for phytoplankton cultivation surface. Table 1 shows a hypothetical distribution of the proposed cultivation surface based on the emission rates of the main CO2-producing countries. Additionally, the percentage that this cultivation area would represent with respect to the total area of each country is reflected.
Although implementing these phytoplankton sinks is justified on their own merit, the obtained biomass is not a waste. Instead, it can be used as feedstock in different sectors (feed, energy, nutraceuticals, etc.). For example, 13 Gt/year of biomass equals approximately 6.5 × 10⁴ TWh/year, about 40% of the current energetic global demand. The proper harvesting and chemical transformation (gasification, anaerobic digestion, hydrothermal liquefaction, etc.) of this biomass could become an additional energy source either to defray the energetic demand of the own technology or to supply energy to other services [84]. From these gross numbers, the biological capture of CO2 using phytoplankton sinks is proposed as a clever and potentially feasible strategy to redirect the current and dangerous climatic trend. The available scientific data and the correlation between anthropic activities and natural consequences become more and more evident. Only deals and joint policies led by G20 will allow for the proper strategies, infrastructure, and scientific teams to be developed to complete this and other palliative strategies against accelerated global warming. From a global perspective, the benefits are much higher than the costs. However, it is necessary to make a real cooperative effort between the different states and world factions.

4.4. Technical Challenges

Despite nearly a century of development in phytoplankton culture technology, there have been no attempts to implement it globally. Given the large surface area required, the participation of the main world government and other technology-based enterprises is necessary to develop and implement this production system at this scale. Phytoplankton culture at this level may have significant adverse effects that must be appropriately managed, such as impacts on biodiversity and aquatic ecosystems, large water requirements, potential eutrophication of these volumes of water, and the release of greenhouse gases if the culture or synthesised biomass is not managed correctly. Based on these premises, the following technical challenges are analysed.

4.4.1. PBR Features

Given the large scale of the project, it seems necessary to adopt a simple growth system where most of the control systems, such as pH and temperature, are provided by natural mechanisms, and only a few precise anthropic actions need to be taken to trigger an increase in the growth rate of phytoplankton. Therefore, it is mandatory to move away from laboratory- or medium-sized culture systems since they are usually too complex to scale to this level because the high cost of the necessary materials (plastics or glass) makes the project unfeasible and the carbon footprint too high. Although it would be simpler, fertilizing natural systems such as lakes, lagoons, flooded coastal areas, or even the ocean should not be used. These natural water bodies are not delimited. The uncontrolled growth of phytoplankton can result in several possible adverse effects, such as the destruction of biodiversity and ecological balance in these environments. In this sense, the most suitable strategy could be the construction of wide and simple open ponds with a total depth of approximately 1 or 2 m, properly isolated from possible infiltration into the soil and located far enough from other water sources to prevent interactions.

4.4.2. Water Use

One of the biggest challenges in implementing these phytoplankton sinks will be performing water use without competing with or competing against other activities. Assuming a 0.5 m depth, the proposed culture surface would require a total volume of 1000 km3. Fresh water is a precious and scarce resource, and it is not a sustainable strategy to use it for large-scale carbon capture. Hence, using seawater seems mandatory to minimise interference with other water uses. At the energetic level, the pumping expenses for these large volumes can easily jeopardise the project’s viability if not properly managed. For instance, if the PBR (serving as a turbidostat) reaches a steady concentration of 300 g/m2 [71], the daily water flow for pumping, harvesting, and recycling would be 55 km3/day, which is twice higher than the flow of the Amazon River. This presents a significant challenge, as the electricity consumption needed to move this volume, even with the proper equipment, would be approximately 100 TWh/year. To put this into perspective, global electricity production from renewable sources (such as solar, wind, and hydroelectric) reached 1800 TWh in 2020. In addition to the energy consumption for the daily flows, it would be wise to use gravity for the initial filling and subsequent water feeding of the ponds (Figure 9). Consequently, locations for these sinks should be at the lowest possible altitude to construct artificial channels to feed the pond with minimal power consumption.

4.4.3. Species and Growth Medium

Since CO2 capture is a generic process for all photosynthetic microorganisms, it is not worth investing technical and economic efforts in maintaining monospecific cultures. Perhaps the most appropriate strategy would be to select a pool of suitable species, considering the resources and climate of the sink location. Additionally, the sink management must include conducting regular inoculations of these species produced from more controlled PBRs with much smaller volumes. From this point, the evolution of this environment should generate an ecological balance and even a seasonal succession in the different photosynthetic populations. At the same time, the pressure exerted by recurrent inoculations should encourage the prominence of the selected species in the ponds.
Regarding water use, implementing harvesting devices such as centrifuges or tangential filtration systems that present significant energy demand seems unworkable [85]. However, some filamentous cyanobacteria have the peculiarity of being harvested inexpensively because they usually grow in macrostructures that are easily retained using large pieces of mesh. At the same time, the clarified medium drains by itself toward the PBR.
Additionally, the growth of such organisms allows the use of dredging ships, which avoids the need for water transport to a processing plant. This method is currently carried out in Klamath Lake (Oregon) for harvesting Aphanizomenon flos-aquae [86]. Moreover, several genera of marine and filamentous cyanobacteria have been characterised by their ability to gain their own organic nitrogen from the reduction in atmospheric nitrogen [87,88,89]. This may be a beneficial strategy to maintain the predominance of the desired species in the ponds against competitors that should consider nitrogen as soluble ionic species [90].

4.4.4. Mixing System

Although natural mixing mechanisms such as wind, waves, and the mobility of microorganisms will be present, they may not be sufficient to prevent pond stratification and ensure equal access to light and nutrients for all cells. Thus, it will be necessary to implement an artificial mixing system to break down stratification and promote gas exchange. Computing gross numbers about the flow and electrical consumption of some industrial low-pressure blowers (<8000 Pa), the electric energy needed to aerate the entire culture at 25 L/min·m3 would reach 5 TWh/year with the proper infrastructure. Like water pumping, the energy used to operate these devices should come from renewable sources such as photovoltaics, wind power, or energy generated from biomass produced to minimise the system’s carbon footprint.

4.4.5. Temperature Control

Direct radiation is the main source of energy input into large bodies of water and can quickly raise the temperature well above the ambient on a sunny day. For example, direct radiation of 900 W/m2 falling on 500 L contained in 1 m2 increases in temperature by approximately 1.5 °C per hour. Implementing an active temperature control system for these large growth areas seems completely unfeasible in terms of critical infrastructure and energy consumption. This would result in producing more CO2 than is being absorbed. However, it is crucial to maintain the temperature within a general range of 5 to 35 °C throughout the year. Using natural control systems could be the most innovative temperature management strategy. The primary natural mechanism for temperature control of water blocks is evaporation [91], where the enthalpy of water vaporization, influenced by other weather factors such as wind, temperature, or humidity, allows for a variable rate of energy loss and water loss. This evaporated water should be replenished through rainfall or from the filling channel to maintain the salinity of the medium [92]. Another natural mechanism to buffer the daily and seasonal temperature changes and the absorption of direct radiation is the strong thermal inertia that occurs in large bodies of water [93]. In this case, the depth of the pond plays a critical role in ensuring optimal temperature regulation and maintaining a suitable range of salinities. The depth in the proposed PBR model only affects their water volume while the area remains constant. The deeper the pond, the more water it holds, and the better it can regulate temperature and salt levels by distributing captured heat and reducing the evaporation rate relative to the total volume of water. Nevertheless, an excessive depth implies low volumetric productivity and, therefore, large energy expenditures in the daily management of the system. Furthermore, note that the size of these culture surfaces is sufficiently large to support the development of their natural water cycles, including processes such as evaporation and replenishment through precipitation. Note that even the proposed control mechanism is inapplicable in regions experiencing temperatures below 0 °C or above 40 °C for extended durations, except in the case of the culture of extremophile species. Furthermore, areas with persistent cloud cover and limited photoperiods are also not conducive to implementing these systems. Therefore, optimal sites for phytoplankton CO2 sinks at the thermal level would be characterised by temperate and humid climates, including equatorial, monsoonal, Savannah, subtropical wet, or Mediterranean regions.

4.4.6. Sources of Nutrients

The adequate supply of nutrients is another key factor distinguishing phytoplankton growth in the natural environment from that in PBRs. Thus, intentional and controlled eutrophication of these artificial waters is necessary. Though variable, the average nitrogen content for the dry biomass of phytoplankton is estimated to be approximately 6% when there are no limitations on the nutrient supply. The production of 13 Gt of biomass annually would therefore require the addition of 780 Mt of nitrogen per year. However, the annual consumption of nitrogen as a fertiliser is approximately 200 Mt annually [94]. Using this type of fertilization for the ponds would cause a market collapse and a severe conflict with agriculture. The same situation occurs with phosphorus, with an estimated 80 Mt/year required for phytoplankton synthesis, while the current phosphorus consumption in agriculture is 30 Mt/year. As a result, it appears unfeasible to constantly supply new nutrients, presenting another potential obstacle to the successful implementation of this technology. To address this technological challenge, three lines of progress could be pursued. The first approach involves recycling the nutrient content in the synthesised biomass by regularly processing it. This means that the produced biomass should be continuously harvested at a rate of 17 g/m2·day and subjected to a continuous degradation process such as composting, hydrothermal liquefaction, or anaerobic digestion [95]. This would generate nutrient-rich leachates that can be returned to the culture ponds. Moreover, this process would also increase the carbon content of the biomass, making it a more attractive energy source. If a steady concentration of 300 g/m2 is assumed for the whole proposed surface, the locked amount of biomass at any given time would be 630 Mt, equivalent to 38 Mt of nitrogen and 3.8 Mt of phosphorus. Consequently, only an initial and gradual dosage of nutrients is necessary, which should be maintained and corrected. The second approach uses nitrogen-fixing species that thrive in marine waters, specifically cyanobacteria from the Nostocales order. These organisms have specialised cells called heterocysts that can reduce atmospheric nitrogen to ammonia, providing a constant source of nitrogen enrichment in the ponds [96]. Finally, a third strategy involves developing a robust infrastructure for recovering nitrogen and phosphorus from urban, agricultural, and livestock waste. Approximately 380 km3 of wastewater is produced each year globally, containing approximately 16.6 Mt of nitrogen and 3 Mt of phosphorus [97]. Additionally, 2.2 Gt of solid waste is produced annually worldwide, equivalent to 22 Mt of nitrogen and 11 Mt of phosphorus [98]. From the potential development of these three strategies, it appears more optimistic that, after an initial addition, the nutrient concentration in the ponds can be maintained to avoid limiting the growth rate at any time. Alternatively, managing other micronutrients, such as iron and other trace metals, should not pose a high technological challenge as they are needed in lower concentrations. Even atmospheric exposure (wind, dust, rain, etc.) may replenish some of them.

4.4.7. Biomass Management

Many applications have been proposed for different phytoplankton biomasses to develop their potential markets [99,100]. It should be noted that without stabilization methodologies (drying, hydrolysing, etc.), biomass in paste form is rapidly degraded; hence, fresh biomass should be promptly processed. The following are the main uses and associated technologies for this biomass:
(a)
Carbon lock: This option involves closing the biomass by burying it or sealing it in airtight bunkers to prevent its spontaneous decomposition from releasing CO2 and CH4 into the atmosphere [101]. This way, the captured carbon is permanently removed from the carbon cycle and detoxifies the atmosphere. However, the economic viability of this option is limited as it does not generate added value to the final product of the technology and becomes waste instead.
(b)
Energy source: As discussed, 13 Gt of biomass per year can store approximately 6.2 × 10⁴ TWh, which can be economically reused through processes such as hydrothermal liquefaction [102,103] or anaerobic digestion [104] to obtain high-density energy carbon (hydrocarbons and methane, respectively) and a liquor or effluent rich in macronutrients. This effluent can be incorporated into PBRs [95,105], allowing for a closed cycle to reuse these elements in growth. It is necessary to highlight that this use would return part of the fixed CO2 to the atmosphere.
(c)
Animal Feed: Over 6 Gt/year of forage and grain are consumed to sustain livestock worldwide, producing 340 Mt of meat and 800 Mt of milk, among other products [106]. To achieve these numbers, about 40% of the world’s cultivated land is used [107] and is not available for cultivating human food. Phytoplankton is a suitable food source for complementing and sometimes substituting livestock feed for ruminants and monogastric [108]. Microalgae and cyanobacteria are rich in vegetable proteins and high in omega-3 fatty acids, antioxidants, and other compounds, making them not only a source of macronutrients but also a source of compounds that improve the health and vitality of farmed animals [109,110,111].
(d)
Human Feed: Similarly, the obtained biomass could be an alternative source of nutrients and healthy compounds for human consumption. Phytoplankton is rich in essential amino acids and has a high content of polyunsaturated fatty acids and other beneficial compounds for human health [112]. Currently, 230 Mt of dry protein is consumed annually in our society [113]. To reach this amount, heavy dependence on animal protein is necessary, with environmental and animal welfare consequences. Using phytoplankton as a source of protein could reduce the dependence on animal protein and contribute to a more sustainable and healthy food system.
In addition to the proposed options, there are combined strategies [114,115] where animal feeding, agriculture, and energy production are intercalated, enhancing the product value and increasing the system’s economic viability.

5. Discussion

This is the first study that evaluates the multiple challenges associated with implementing phytoplankton CO2 sinks globally from a gross number perspective. Other studies have extensively explored relevant aspects of microalgae cultivation, including their capacity to sequester CO2 and produce value-added compounds [116,117]. However, none of them provides a comprehensive and quantitative view of the order of magnitude of surface area, volume, biomass production, and the technological challenges that need to be overcome for this climate change mitigation strategy to become a reality.
In this work, a wide review of the state-of-the-art microalgae culture is conducted, and the results indicate that it is technologically and logistically feasible to combat excess atmospheric CO2 through biological sequestration. A production model for developing this capture system has also been proposed. However, this model must be reviewed, adapted, and adjusted for each location where its implementation would be planned. The computations indicate that the annual biological synthesis of 13 Gt of biomass could break CO2 accumulation in the atmosphere. It assumes an average productivity of 17 g/m2·day for phytoplankton and a growth area of 2.1 × 10⁶ km2 with a water column of 0.5 m in height. This depth would enhance the natural thermal control of the water mass by reducing the thermal inertia. With these dimensions, a volume of approximately 1000 km3 would be required to synthesise this amount of biomass. This area could be divided into different production regions worldwide, which should be levelled and terraformed to be wholly isolated from the ground, with a depth of 1 to 2 m, and flooded in a controlled manner with seawater. Indeed, this would represent a further step in the current scale of phytoplankton production, where some companies already manage cultivation areas larger than 44 hectares [118]. In these systems, biomass production rates per unit area have been achieved that are quite similar, or even higher, to the used in the development of the present study (17 g/m2·day), indicating a good consistency in the proposed approach. Among them, the 35 g/m2·day proposed in [118], the 20.24 g/m2·day for a cultivation area of 605 m2 proposed in [119], and the 20 g/m2·day suggested in [120] are reliable examples. From here, the main technical and energy feasibility challenges are enumerated.
First, it is necessary to select regions and latitudes with a proper climate to ensure the viability of the selected species, with low energy cost access to water and compatibility with human activities and natural ecosystems. Also, it is mandatory to optimise and reassess the pumping and aeration technologies because they are the only active mechanisms to promote growth. Finally, it is necessary to develop a technology for processing and/or locking the captured carbon in to regulate its flow and enable the recovery and recycling of macronutrients so as not to interfere with other human activities. The proposed global project cannot be carried out without commitment from and close collaboration among significant world powers. To encourage the project’s success, these nations should establish a clear political framework and implement measures to drive its implementation forward. These policies should promote and facilitate the creation of socioeconomic infrastructure around this new industry, which can generate wealth and ensure its sustainability at the state or private level. For instance:
(a)
A specialised scientific–technical sector should be implemented to design and propose suitable regions for establishing these CO2 sinks would be necessary. This sector should standardise the protocol for defining a region as suitable within a specific legal framework;
(b)
Measures that establish a profitable sector from the culture and harvest of phytoplankton and lead to the production of an attractive and valuable product for the market should be promoted;
(c)
Measures to develop a profitable industry for processing the large amount of biomass produced should be promoted, which can generate added value and demand for the product in such a way that transcends to other sectors, such as energy, human or animal food, or stored as fixed carbon;
(d)
International organizations and laws should be created to manage the use of fixed carbon and prevent its new release into the atmosphere.
Finally, it is essential to consider that beyond the potential impact on atmospheric CO2 levels and climate change, there may be other unknown consequences of implementing these CO2 sinks globally. The 5% increase in global NNP and the large-scale production areas required for these sinks could alter the existing ecosystems and impact the biosphere. Creating these pseudo-natural lakes could resemble a marsh or coastal lagoon ecosystem, with its natural nutrient cycles and biodiversity. The artificial flooding of these regions may also alter local climates by changing precipitation patterns and temperatures. Therefore, implementing these sinks should be gradual, and efforts to reduce the dependence on fossil fuels and transition to clean energy should continue simultaneously. The implementation process should be set out in a roadmap that outlines a gradual increase in the capture surface over time while simultaneously developing the necessary culture technology and infrastructure, establishing a market and business model for the biomass generated, and evaluating the potential collateral effects of implementation. It is worth noting that implementing this restructuring of the carbon cycle on a global scale will prepare our civilization for the terraformation of other planets, a crucial milestone in enabling future colonization beyond Earth [121].

6. Conclusions

  • Since the Industrial Revolution, 292 GtC have accumulated in the atmosphere, equivalent to 1072 Gt of CO2, and this number continues to increase annually at a growing rate of 5.1 GtC per year (18.75 Gt of CO2). This phenomenon is altering several of the planet’s physicochemical parameters and cycles, such as temperature and the pH of large bodies of water, whose balance is vital for the stability of the vast majority of global ecosystems.
  • The measures proposed by our civilization through various policies and international treaties have been slow and ineffective, focusing only on reducing emissions without implementing technologies to neutralize the excess CO2. The window for intervention with a guarantee of success is closing.
  • The mass cultivation of phytoplankton is presumed to be a mature technology capable of utilising and accelerating the natural cycles of CO2 capture. Based on the literature reviewed in this work, an average CO2 capture value of 34 g/m2·day, equivalent to a biomass production rate of 17 g/m2·day, is proposed for cultivated areas.
  • From this value, it can be theorised that to neutralise the 18.75 Gt/year of CO2 that accumulates in the atmosphere, an area of 2.1 × 10⁶ km2 would need to be cultivated, equivalent to 0.41% of the planet’s total surface or 1.41% of the land surface. These figures would imply a 6.5% increase in the global NPP value.
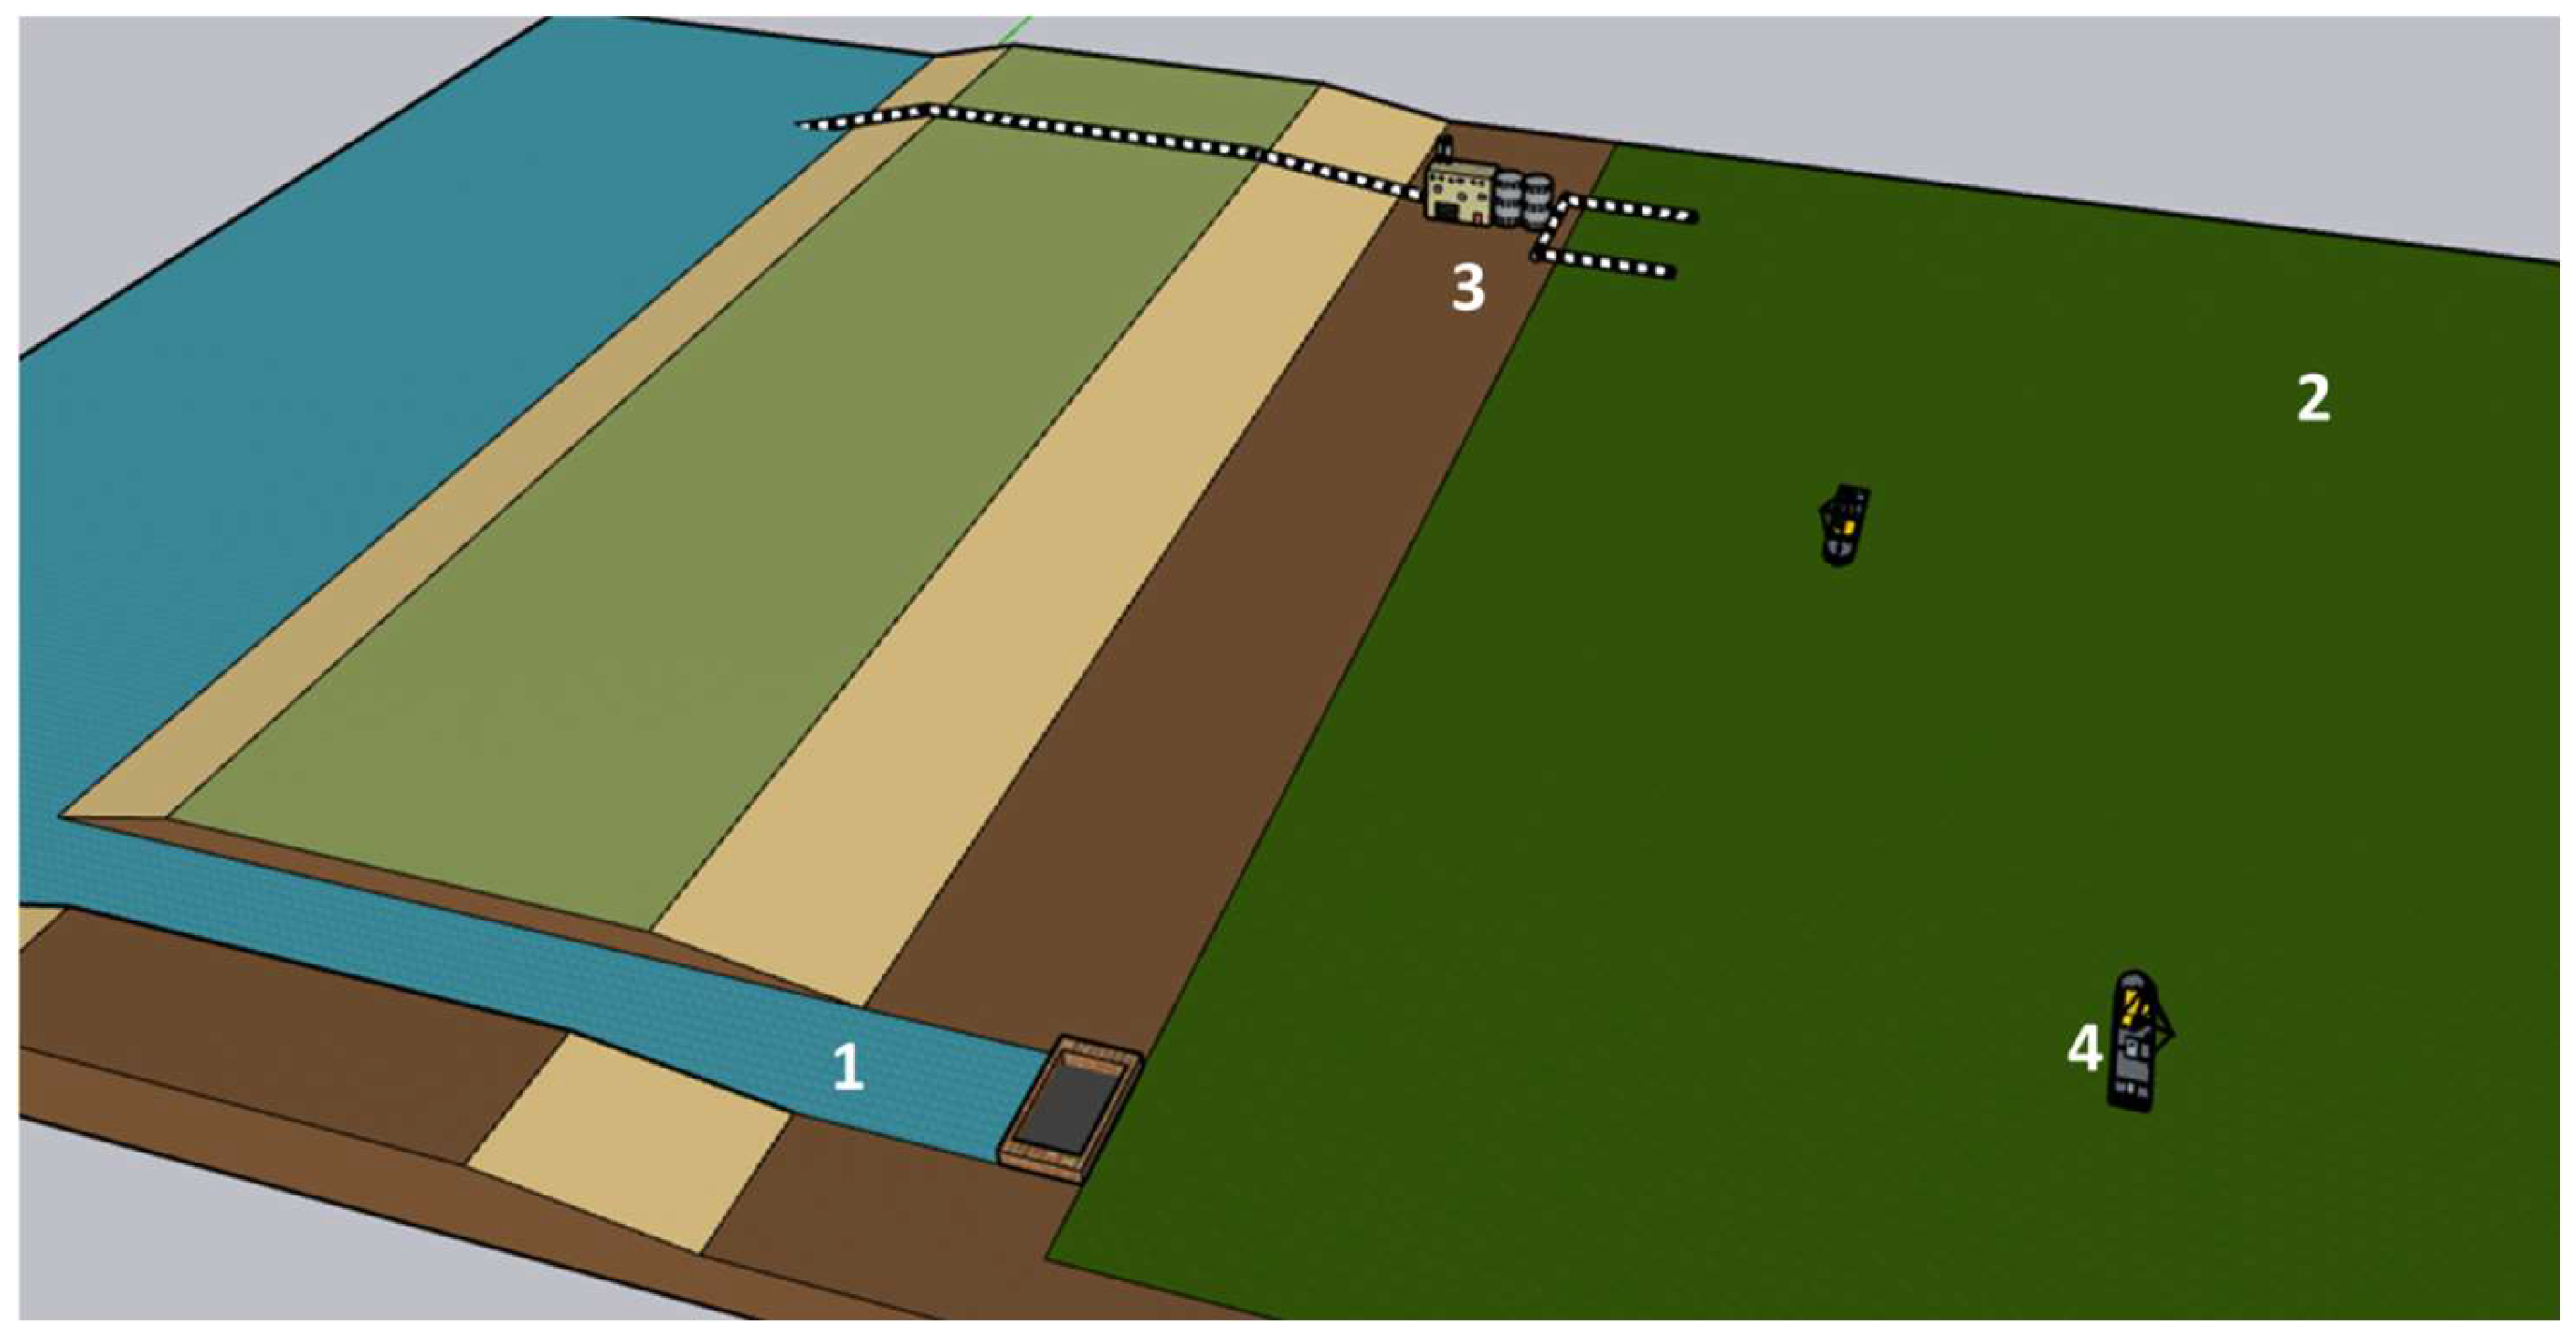
  • This work also analyses the challenges that civilization would face in implementing phytoplankton cultivation technology on a global scale. It suggests a horizontal PBR model with a water depth of 0.5 m placed in coastal areas, completely isolated from other natural environments and ecosystems. A low level of control is suggested for these partially natural areas, involving only recurrent inoculations with nitrogen-fixing species, aeration, and control of key nutrients (N, P, and Fe). Proper management of the generated biomass, whether through blocking or re-oxidation, would be crucial for maintaining the carbon cycle in a balanced state suitable for the stability of the biosphere.

Author Contributions

Conceptualization: B.Z. and G.Z. Visualization: B.Z. Formal analysis: B.Z. Writing—original draft: B.Z. Writing—review & editing: B.Z., L.M., M.-J.B. and J.E. All authors have read and agreed to the published version of the manuscript.

Funding

This research received no external funding.

Acknowledgments

We would like to thank Global BioTech S.L. (Spain) for their support and assistance in the preparation of this literature review.

Conflicts of Interest

The authors declare no conflicts of interest.

References

  1. Intergovernmental Panel on Climate Change (IPCC). Summary for Policymakers. In Climate Change 2021—The Physical Science Basis: Working Group I Contribution to the Sixth Assessment Report of the Intergovernmental Panel on Climate Change; Front Matter; Cambridge University Press: Cambridge, UK, 2023; pp. 3–32. [Google Scholar] [CrossRef]
  2. Head, M.J.; Steffen, W.; Fagerlind, D.; Waters, C.N.; Poirier, C.; Syvitski, J.; Zalasiewicz, J.A.; Barnosky, A.D.; Cearreta, A.; Jeandel, C.; et al. The Great Acceleration is real and provides a quantitative basis for the proposed Anthropocene Series/Epoch. Episodes 2022, 45, 359–376. [Google Scholar] [CrossRef]
  3. Nag, B.; Makaranga, A.; Kareya, M.S.; Nesamma, A.A.; Jutur, P.P. Photosynthetic Cell Factories, a New Paradigm for Carbon Dioxide (CO2) Valorization. In Green Sustainable Process for Chemical and Environmental Engineering and Science; Inamuddin, A.M.A., Isloor, A.M., Eds.; Elsevier: Amsterdam, The Netherlands, 2023; pp. 463–480. [Google Scholar] [CrossRef]
  4. Rapf, R.; Vaida, V. Sunlight as an Energetic Driver in the Synthesis of Molecules Necessary for Life. Phys. Chem. Chem. Phys. 2016, 18, 20067–20084. [Google Scholar] [CrossRef] [PubMed]
  5. Ruban, A. Evolution under the sun: Optimizing light harvesting in photosynthesis. J. Exp. Bot. 2015, 66, 7–23. [Google Scholar] [CrossRef] [PubMed]
  6. Kelly, D.P.; Wood, A.P. The Chemolithotrophic Prokaryotes. In The Prokaryotes; Rosenberg, E., DeLong, E.F., Lory, S., Stackebrandt, E., Thompson, F., Eds.; Springer: Berlin/Heidelberg, Germany, 2013; pp. 753–793. [Google Scholar] [CrossRef]
  7. Hammarström, L. Overview: Capturing the sun for energy production. Ambio 2012, 41, 103–1007. [Google Scholar] [CrossRef]
  8. Stocker, B.D.; Yu, Z.; Massa, C.; Joos, F. Holocene peatland and ice-core data constraints on the timing and magnitude of CO2 emissions from past land use. Proc. Natl. Acad. Sci. USA 2017, 114, 1492–1497. [Google Scholar] [CrossRef]
  9. Moriarty, P.; Honnery, D. Global bioenergy: Problems and prospects. Int. J. Glob. Energy Issues 2007, 27, 231–249. [Google Scholar] [CrossRef]
  10. Intergovernmental Panel on Climate Change (IPCC). Global Carbon and Other Biogeochemical Cycles and Feedbacks. In Climate Change 2021—The Physical Science Basis: Working Group I Contribution to the Sixth Assessment Report of the Intergovernmental Panel on Climate Change; Cambridge University Press: Cambridge, UK, 2023; pp. 673–816. [Google Scholar] [CrossRef]
  11. Friedlingstein, P. Global carbon budget 2022. Earth Syst. Sci. Data 2022, 14, 4811–4900. [Google Scholar] [CrossRef]
  12. Quetin, G.R.; Famiglietti, C.A.; Dadap, N.C.; Bloom, A.A.; Bowman, K.W.; Diffenbaugh, N.S.; Liu, J.; Trugman, A.T.; Konings, A.G. Attributing Past Carbon Fluxes to CO2 and Climate Change: Respiration Response to CO2 Fertilization Shifts Regional Distribution of the Carbon Sink. Glob. Biogeochem. Cycles 2023, 37, e2022GB007478. [Google Scholar] [CrossRef]
  13. Barber, J. Photosynthetic energy conversion: Natural and artificial. Chem. Soc. Rev. 2009, 38, 185–196. [Google Scholar] [CrossRef]
  14. BP. Statistical Review of World Energy 2022. 71th Ed. Available online: https://www.bp.com/content/dam/bp/business-sites/en/global/corporate/pdfs/energy-economics/statistical-review/bp-stats-review-2022-full-report.pdf (accessed on 13 January 2023).
  15. Chatterjee, A.; Gierach, M.; Sutton, A.; Feely, R.; Crisp, D.; Eldering, A.; Gunson, M.; O’Dell, C.; Stephens, B.; Schimel, D. Influence of El Niño on atmospheric CO2 over the tropical Pacific Ocean: Findings from NASA’s OCO-2 mission. Science 2017, 358, eaam5776. [Google Scholar] [CrossRef]
  16. Khatiwala, S.; Primeau, F.; Hall, T. Reconstruction of the history of anthropogenic CO2 concentrations in the ocean. Nature 2009, 462, 346–349. [Google Scholar] [CrossRef] [PubMed]
  17. Dupont, S.; Pörtner, H.O. A snapshot of ocean acidification research. Mar. Biol. 2013, 160, 1765–1771. [Google Scholar] [CrossRef]
  18. Ballantyne, A.P.; Liu, Z.; Anderegg, W.R.; Yu, Z.; Stoy, P.; Poulter, B.; Vanderwall, J.; Watts, J.; Kelsey, K.; Neff, J. Reconciling carbon-cycle processes from ecosystem to global scales. Front. Ecol. Environ. 2021, 19, 57–65. [Google Scholar] [CrossRef]
  19. Hall, D.O.; Rao, K.K. Photosynthesis, 6th ed.; Cambridge University Press: Cambridge, UK, 1999; 214p. [Google Scholar]
  20. Davis, S.; Lebauer, D.; Long, S. Light to liquid fuel: Theoretical and realized energy conversion efficiency of plants using Crassulacean Acid Metabolism (CAM) in arid conditions. J. Exp. Bot. 2014, 65, eru163. [Google Scholar] [CrossRef] [PubMed]
  21. Edwards, E.J. Evolutionary trajectories, accessibility, and other metaphors: The case of C4 and CAM photosynthesis. New Phytol. 2019, 223, 1742–1755. [Google Scholar] [CrossRef]
  22. Zhu, X.G.; Long, S.P.; Ort, D.R. What is the maximum efficiency with which photosynthesis can convert solar energy into biomass? Curr. Opin. Biotechnol. 2008, 19, 153–159. [Google Scholar] [CrossRef] [PubMed]
  23. Vecchi, V.; Barera, S.; Bassi, R.; Dall’Osto, L. Potential and Challenges of Improving Photosynthesis in Algae. Plants 2020, 9, 67. [Google Scholar] [CrossRef] [PubMed]
  24. Treves, H.; Lucius, S.; Feil, R.; Stitt, M.; Hagemann, M.; Arrivault, S. Operation of Carbon-Concentrating Mechanisms in Cyanobacteria and Algae requires altered poising of the Calvin-Benson cycle. bioRxiv 2022. bioRxiv:2022.08.23.504937. [Google Scholar] [CrossRef]
  25. Singh, U.B.; Ahluwalia, A. Microalgae: A promising tool for carbon sequestration. Mitig. Adapt. Strateg. Glob. Change 2013, 18, 73–95. [Google Scholar] [CrossRef]
  26. Paul, S.; Bera, S.; Dasgupta, R.; Mondal, S.; Roy, S. Review on the Recent Structural Advances in Open and Closed Systems for Carbon Capture through Algae. Energy Nexus 2021, 4, 100032. [Google Scholar] [CrossRef]
  27. Borowitzka, M.A. Biology of microalgae. In Microalgae in Health and Disease Prevention; Elsevier: Amsterdam, The Netherlands, 2018; pp. 23–72. [Google Scholar] [CrossRef]
  28. Ciferri, O. Spirulina, the edible microorganism. Microbiol. Rev. 1983, 47, 551–578. [Google Scholar] [CrossRef] [PubMed]
  29. Dangeard, P. Sur une algue bleue alimentaire pour l’homme: Arthrospira platensis (Nordstedt) Gomont. Actes Soc. Linn. Boreaux Extr. Procés-Verbaux 1940, 91, 39–41. [Google Scholar]
  30. Geohegan, M. Unicellular Algae as a source of food. Nature 1951, 168, 426–427. [Google Scholar] [CrossRef] [PubMed]
  31. Borowitzka, M.A. High-value products from microalgae—Their development and commercialisation. J. Appl. Phycol. 2013, 25, 743–756. [Google Scholar] [CrossRef]
  32. Huang, Q.; Jiang, F.; Wang, L.; Yang, C. Design of Photobioreactors for Mass Cultivation of Photosynthetic Organisms. Engineering 2017, 3, 318–329. [Google Scholar] [CrossRef]
  33. Wang, B.; Lan, C.Q.; Horsman, M. Closed photobioreactors for production of microalgal biomasses. Biotechnol. Adv. 2012, 30, 904–912. [Google Scholar] [CrossRef]
  34. Tredici, M.R.; Chini Zittelli, G.; Rodolfi, L. Photobioreactors. In Encyclopedia of Industrial Biotechnology. Bioprocess, Bioseparation, and Cell Technology; Flickinger, M.C., Ed.; Wiley: Hoboken, NJ, USA, 2009; pp. 1–15. [Google Scholar] [CrossRef]
  35. Oswald, W.J.; Golueke, C.G. Biological transformation of solar energy. Adv. Appl. Microbiol. 1969, 2, 223–262. [Google Scholar] [CrossRef]
  36. Brenner, A.; Abeliovich, A. Water purification: Algae in wastewater oxidation ponds. In Handbook of Microalgal Culture, 2nd ed.; Richmond, A., Hu, Q., Eds.; Wiley: Hoboken, NJ, USA, 2013; pp. 595–601. [Google Scholar] [CrossRef]
  37. Slegers, P.M.; Wijffels, R.H.; van Straten, G.; van Boxtel, A.J.B. Design Scenarios for Flat Panel Photobioreactors. Appl. Energy 2011, 88, 3342–3353. [Google Scholar] [CrossRef]
  38. Fernández, I.; Acién, F.G.; Berenguel, M.; Guzmán, J.L. First principles model of a tubular photobioreactor for microalgal production. Ind. Eng. Chem. Res. 2014, 53, 11121–11136. [Google Scholar] [CrossRef]
  39. Torzillo, G.; Chini Zittelli, G. Tubular Photobioreactors. In Algal Biorefineries; Prokop, A., Bajpai, R., Zappi, M., Eds.; Springer: Cham, Switzerland, 2015; pp. 105–116. [Google Scholar] [CrossRef]
  40. Nogueira, N.; Nascimento, F.; Cunha, C.; Cordeiro, N. Nannochloropsis gaditana grown outdoors in annular photobioreactors: Operation strategies. Algal Res. 2020, 48, 101913. [Google Scholar] [CrossRef]
  41. Ugwu, U.; Aoyagi, H.; Uchiyama, H. Photobioreactors for Mass Cultivation of Algae. Bioresour. Technol. 2008, 99, 4021–4028. [Google Scholar] [CrossRef] [PubMed]
  42. Masojídek, J.; Ranglová, K.; Lakatos, G.E.; Silva Benavides, A.M.; Torzillo, G. Variables Governing Photosynthesis and Growth in Microalgae Mass Cultures. Processes 2021, 9, 820. [Google Scholar] [CrossRef]
  43. Carvalho, A.P.; Silva, S.O.; Baptista, J.M.; Malcata, F.X. Light requirements in microalgal photobioreactors: An overview of biophotonic aspects. Appl. Microbiol. Biotechnol. 2011, 89, 1275–1288. [Google Scholar] [CrossRef] [PubMed]
  44. Parlevliet, D.; Moheimani, N. Efficient conversion of solar energy to biomass and electricity. Aquat. Biosyst. 2014, 10, 4. [Google Scholar] [CrossRef]
  45. Michaelis, L.; Menten, M.L.; Johnson, K.A.; Goody, R.S. The original Michaelis constant: Translation of the 1913 Michaelis-Menten paper. Biochemistry 2011, 50, 8264–8269. [Google Scholar] [CrossRef]
  46. Straka, L.; Rittmann, B.E. (Growth kinetics and mathematical modeling of Synechocystis sp. PCC 6803 under flashing light. Biotechnol. Bioeng. 2019, 116, 469–474. [Google Scholar] [CrossRef]
  47. Mairet, F.; Bayen, T. The promise of dawn: Microalgae photoacclimation as an optimal control problem of resource allocation. J. Theor. Biol. 2021, 515, 110597. [Google Scholar] [CrossRef]
  48. Ananthi, V.; Kathirvel, B.; Pugazhendhi, A.; Arun, A. Impact of abiotic factors on biodiesel production by microalgae. Fuel 2021, 284, 118962. [Google Scholar] [CrossRef]
  49. Barten, R.; Djohan, Y.; Evers, W.; Wijffels, R.; Barbosa, M. Towards industrial production of microalgae without temperature control: The effect of diel temperature fluctuations on microalgal physiology. J. Biotechnol. 2021, 336, 56–63. [Google Scholar] [CrossRef]
  50. Uyar, B.; Kapucu, N. Passive temperature control of an outdoor photobioreactor by phase change materials. J. Chem. Technol. Biotechnol. 2015, 90, 915–920. [Google Scholar] [CrossRef]
  51. Gao, K. Approaches and involved principles to control pH/pCO2 stability in algal cultures. J. Appl. Phycol. 2021, 33, 3497–3505. [Google Scholar] [CrossRef]
  52. Fox, J.M.; Zimba, P.V. Minerals and trace elements in microalgae. In Microalgae in Health and Disease Prevention; Levine, I.A., Fleurence, J., Eds.; Academic Press: Cambridge, MA, USA, 2018; pp. 177–193. [Google Scholar] [CrossRef]
  53. Carvalho, J.C.; Bittencourt Sydney, E.; Assú Tessari, L.F.; Soccol, C.R. Chapter 2—Culture media for mass production of microalgae. In Biofuels from Algae, 2nd ed.; Ashok Pandey, J.-S., Chang, C.R., Lee, D.-J., Chisti, Y., Eds.; Elsevier: Amsterdam, The Netherlands, 2019; pp. 33–50. [Google Scholar] [CrossRef]
  54. Yaakob, M.A.; Mohamed, R.M.S.R.; Al-Gheethi, A.; Aswathnarayana Gokare, R.; Ambati, R.R. Influence of Nitrogen and Phosphorus on Microalgal Growth, Biomass, Lipid, and Fatty Acid Production: An Overview. Cells 2021, 10, 393. [Google Scholar] [CrossRef]
  55. Ben-Amotz, A.; Avron, M. On the factors, which determine massive beta-carotene accumulation in the halotolerant alga Dunaliella bardawil. Plant Physiol. 1983, 72, 593–597. [Google Scholar] [CrossRef] [PubMed]
  56. Boussiba, S.; Vonshak, A. Astaxanthin accumulation in the green alga Haematococcus pluvialis. Plant Cell Physiol. 1991, 32, 1077–1082. [Google Scholar] [CrossRef]
  57. Drira, M.; Elleuch, J.; Ben Hlima, H.; Hentati, F.; Gardarin, C.; Rihouey, C.; Le Cerf, D.; Michaud, P.; Abdelkafi, S.; Fendri, I. Optimization of Exopolysaccharides Production by Porphyridium sordidum and Their Potential to Induce Defense Responses in Arabidopsis thaliana against Fusarium oxysporum. Biomolecules 2021, 11, 282. [Google Scholar] [CrossRef] [PubMed]
  58. Liyanaarachchi, V.; Premaratne, M.; Ariyadasa, T.; Nimarshana, V.; Malik, A. Two-stage cultivation of microalgae for production of high-value compounds and biofuels: A review. Algal Res. 2021, 57, 102353. [Google Scholar] [CrossRef]
  59. Hegemann, P. Vision in microalgae. Planta 1997, 203, 265–274. [Google Scholar] [CrossRef]
  60. Walsby, A.E. Gas vesicles. Microbiol. Rev. 1994, 58, 94–144. [Google Scholar] [CrossRef]
  61. St. Laurent, L.; Garrett, C. The Role of Internal Tides in Mixing the Deep Ocean. J. Phys. Oceanogr. 2022, 32, 2882–2899. [Google Scholar] [CrossRef]
  62. Chanquia, S.N.; Vernet, G.; Kara, S. Photobioreactors for cultivation and synthesis: Specifications, challenges, and perspectives. Eng. Life Sci. 2022, 22, 712–724. [Google Scholar] [CrossRef]
  63. Souza Kirnev, P.C.; Vandenberghe, L.P.d.S.; Soccol, C.R.; de Carvalho, J.C. Mixing and Agitation in Photobioreactors. In Innovations in Fermentation and Phytopharmaceutical Technologies; Thatoi, H., Mohapatra, S., Das, S.K., Eds.; Elsevier: Amsterdam, The Netherlands, 2022; pp. 13–35. [Google Scholar] [CrossRef]
  64. Rogers, J.; Rosenberg, J.; Guzman, B.; Oh, V.; Mimbela, L.-E.; Ghassemi, A.; Betenbaugh, M.; Oyler, G. A critical analysis of paddlewheel-driven raceway ponds for algal biofuel production at commercial scales. Algal Res. 2013, 4, 76–88. [Google Scholar] [CrossRef]
  65. Hreiz, R.; Sialve, B.; Morchain, J.; Escudié, R.; Steyer, J.-P.; Guiraud, P. Experimental and numerical investigation of hydrodynamics in raceway reactors used for algaculture. Chem. Eng. J. 2014, 250, 230–239. [Google Scholar] [CrossRef]
  66. Fan, F.; Fei, Z.; Wan, M.; Huang, J.; Wang, W.; Bai, W.; He, M.; Li, Y. The optimization of centrifugal pump driving horizontal tubular photobioreactor for enhancing astaxanthin production using heterotrophic Haematococcus pluvialis. J. Biotechnol. 2021, 341, 168–174. [Google Scholar] [CrossRef] [PubMed]
  67. Sánchez Mirón, A.; García Camacho, F.; Contreras Gómez, A.; Grima, E.M.; Chisti, Y. Bubble-column and airlift photobioreactors for algal culture. AIChE J. 2000, 46, 1872–1887. [Google Scholar] [CrossRef]
  68. Wang, C.; Lan, C.Q. Effects of shear stress on microalgae—A review. Biotechnol. Adv. 2018, 36, 986–1002. [Google Scholar] [CrossRef]
  69. Hoffman, J.; Pate, R.; Drennen, T.; Quinn, J. Techno-economic assessment of open microalgae production systems. Algal Res. 2017, 23, 51–57. [Google Scholar] [CrossRef]
  70. Schagerl, M.; Siedler, R.; Konopáčová, E.; Ali, S.S. Estimating Biomass and Vitality of Microalgae for Monitoring Cultures: A Roadmap for Reliable Measurements. Cells 2022, 11, 2455. [Google Scholar] [CrossRef]
  71. Cho, C.; Nam, K.; Seo, Y.H.; Kim, J.Y.; Lee, S.; Lee, Y.G.; Yang, J.W. Study of Optical Configurations for Multiple Enhancement of Microalgal Biomass Production. Sci. Rep. 2019, 9, 1723. [Google Scholar] [CrossRef]
  72. Illman, A.M.; Scragg, A.H.; Shales, S.W. Increase in Chlorella strains calorific values when grown in low nitrogen medium. Enzym. Microb. Technol. 2000, 27, 631–635. [Google Scholar] [CrossRef]
  73. Borowitzka, A.M.; Moheimani, R.N. Algae for Biofuels and Energy. In Developments in Applied Phycology; Preface; Springer: Dordrecht, The Netherlands; Heidelberg, Germany; New York, NY, USA; London, UK, 2013; Volume 5. [Google Scholar] [CrossRef]
  74. De Vree, J.H.; Bosma, R.; Janssen, M.; Barbosa, M.J.; Wijffels, R.H.; Lamers, P.P. Comparison of four outdoor pilot-scale photobioreactors. Biotechnol. Biofuels 2015, 8, 215. [Google Scholar] [CrossRef]
  75. BP. Statistical Review of World Energy 2021. 70th Ed. Available online: https://www.bp.com/content/dam/bp/business-sites/en/global/corporate/pdfs/energy-economics/statistical-review/bp-stats-review-2021-full-report.pdf (accessed on 13 January 2023).
  76. Ritchie, H.; Roser, M.; Rosado, P. Energy. Our World in Data 2022. Available online: https://ourworldindata.org/energy (accessed on 13 January 2023).
  77. Princiotta, F.T. The Climate Mitigation Challenge-Where Do We Stand? J. Air Waste Manag. Assoc. 2021, 71, 1234–1250. [Google Scholar] [CrossRef] [PubMed]
  78. Clémençon, R. The Two Sides of the Paris Climate Agreement: Dismal Failure or Historic Breakthrough? J. Environ. Dev. 2016, 25, 3–24. [Google Scholar] [CrossRef]
  79. Sayre, R. Microalgae: The Potential for Carbon Capture. BioScience 2010, 60, 722–727. [Google Scholar] [CrossRef]
  80. Prasad, R.; Gupta, S.K.; Shabnam, N.; Oliveira, C.Y.B.; Nema, A.K.; Ansari, F.A.; Bux, F. Role of Microalgae in Global CO2 Sequestration: Physiological Mechanism, Recent Development, Challenges, and Future Prospective. Sustainability 2021, 13, 13061. [Google Scholar] [CrossRef]
  81. Derakhshandeh, M.; Atici, T.; Tezcan Un, U. Evaluation of Wild-Type Microalgae Species Biomass as Carbon Dioxide Sink and Renewable Energy Resource. Waste Biomass Valorization 2021, 12, 105–121. [Google Scholar] [CrossRef]
  82. Food and Agriculture Organization of the United Nations (FAO). Land Use in Agriculture by the Numbers 2020. 2020. Available online: https://www.fao.org/sustainability/news/detail/en/c/1274219/ (accessed on 22 March 2023).
  83. Ritchie, H.; Roser, M.; Rosado, P. China: CO2 country profile. Our World in Data 2020. Available online: https://ourworldindata.org/co2/country/china?country=~CHN (accessed on 22 March 2023).
  84. Ebhodaghe, S.O.; Imanah, O.E.; Ndibe, H. Biofuels from microalgae biomass: A review of conversion processes and procedures. Arab. J. Chem. 2022, 15, 103591. [Google Scholar] [CrossRef]
  85. Singh, G.; Patidar, S.K. Microalgae harvesting techniques: A review. J. Environ. Manag. 2018, 217, 499–508. [Google Scholar] [CrossRef]
  86. Carmichael, W.; Drapeau, C.; Anderson, D. Harvesting of Aphanizomenon flos-aquae Ralfs ex Born. & Flah. Var. flos-aquae (Cyanobacteria) from Klamath Lake for human dietary use. J. Appl. Phycol. 2000, 12, 585–595. [Google Scholar] [CrossRef]
  87. Huisman, J.; Codd, G.A.; Paerl, H.W.; Ibelings, B.; Verspagen, J.; Visser, P. Cyanobacterial blooms. Nat. Rev. Microbiol. 2018, 16, 471–483. [Google Scholar] [CrossRef]
  88. Olofsson, M.; Suikkanen, S.; Kobos, J.; Wasmund, N.; Karlson, B. Basin-specific changes in filamentous cyanobacteria community composition across four decades in the Baltic Sea. Harmful Algae 2020, 91, 101685. [Google Scholar] [CrossRef]
  89. Olofsson, M.; Klawonn, I.; Karlson, B. Nitrogen fixation estimates for the Baltic Sea indicate high rates for the previously overlooked Bothnian Sea. Ambio 2021, 50, 203–214. [Google Scholar] [CrossRef] [PubMed]
  90. Falcón, L.I.; Cipriano, F.; Chistoserdov, A.Y.; Carpenter, E.J. Diversity of diazotrophic unicellular cyanobacteria in the tropical North Atlantic Ocean. Appl. Environ. Microbiol. 2002, 68, 5760–5764. [Google Scholar] [CrossRef] [PubMed]
  91. Pruvost, J.; Goetz, V.; Artu, A.; Das, P.; Aljabri, H. Thermal modeling and optimization of microalgal biomass production in the harsh desert conditions of State of Qatar. Algal Res. 2019, 38, 101381. [Google Scholar] [CrossRef]
  92. Schmitt, R. Salinity and the Global Water Cycle. Oceanography 2008, 21, 12–19. [Google Scholar] [CrossRef]
  93. De Luca, R.; Bezzo, F.; Béchet, Q.; Bernard, O. Meteorological Data-Based Optimal Control Strategy for Microalgae Cultivation in Open Pond Systems. Complexity 2019, 2019, 4363895. [Google Scholar] [CrossRef]
  94. Tian, H.; Bian, Z.; Shi, H.; Qin, X.; Pan, N.; Lu, C.; Pan, S.; Tubiello, F.N.; Chang, J.; Conchedda, G.; et al. History of anthropogenic Nitrogen inputs (HaNi) to the terrestrial biosphere: A 5 arcmin resolution annual dataset from 1860 to 2019. Earth Syst. Sci. Data 2022, 14, 4551. [Google Scholar] [CrossRef]
  95. Mahata, C.; Mishra, S.; Dhar, S.; Ray, S.; Mohanty, K.; Das, D. Utilization of dark fermentation effluent for algal cultivation in a modified airlift photobioreactor for biomass and biocrude production. J. Environ. Manag. 2022, 330, 11712. [Google Scholar] [CrossRef]
  96. Kumar, K.; Mella-Herrera, R.A.; Golden, J.W. Cyanobacterial heterocysts. Cold Spring Harb. Perspect. Biol. 2010, 2, a000315. [Google Scholar] [CrossRef]
  97. Qadir, M.; Drechsel, P.; Jiménez Cisneros, B.; Kim, Y.; Pramanik, A.; Mehta, P.; Olaniyan, O. Global and regional potential of wastewater as a water, nutrient and energy source. Nat. Resour. Forum 2020, 44, 40–51. [Google Scholar] [CrossRef]
  98. Wang, L.; Qin, T.; Zhao, J.; Zhang, Y.; Wu, Z.; Cui, X.; Zhou, G.; Li, C.; Guo, L.; Jiang, G. Exploring the nitrogen reservoir of biodegradable household garbage and its potential in replacing synthetic nitrogen fertilizers in China. PeerJ 2022, 10, e12621. [Google Scholar] [CrossRef]
  99. Udayan, A.; Sirohi, R.; Sreekumar, N.; Sang, B.-I.; Sim, S.J. Mass Cultivation and Harvesting of Microalgal Biomass: Current Trends and Future Perspectives. Bioresour. Technol. 2022, 344, 126406. [Google Scholar] [CrossRef] [PubMed]
  100. Hachicha, R.; Elleuch, F.; Ben Hlima, H.; Dubessay, P.; de Baynast, H.; Delattre, C.; Pierre, G.; Hachicha, R.; Abdelkafi, S.; Michaud, P.; et al. Biomolecules from Microalgae and Cyanobacteria: Applications and Market Survey. Appl. Sci. 2022, 12, 1924. [Google Scholar] [CrossRef]
  101. Onyeaka, H.; Miri, T.; Kechrist, O.; Hart, A.; Anumudu, C.; Al-sharify, Z.T. Minimizing carbon footprint via microalgae as a biological capture. Carbon Capture Sci. Technol. 2021, 1, 100007. [Google Scholar] [CrossRef]
  102. Han, Y.; Hoekman, S.; Cui, Z.; Jena, U.; Das, P. Hydrothermal liquefaction of marine microalgae biomass using co-solvents. Algal Res. 2019, 38, 101421. [Google Scholar] [CrossRef]
  103. Aliyu, A.; Lee, J.; Harvey, A. Microalgae for biofuels: A review of thermochemical conversion processes and associated opportunities and challenges. Bioresour. Technol. Rep. 2021, 15, 103591. [Google Scholar] [CrossRef]
  104. Ganesh Saratale, R.; Kumar, G.; Banu, R.; Xia, A.; Periyasamy, S.; Saratale, G.D. A critical review on anaerobic digestion of microalgae and macroalgae and co-digestion of biomass for enhanced methane generation. Bioresour. Technol. 2018, 262, 319–332. [Google Scholar] [CrossRef] [PubMed]
  105. Ramírez-Romero, A.; Martin, M.; Boyer, A.; Bolzoni, R.; Matricon, L.; Sassi, J.F.; Steyer, J.P.; Delrue, F. Microalgae adaptation as a strategy to recycle the aqueous phase from hydrothermal liquefaction. Bioresour. Technol. 2023, 371, 128631. [Google Scholar] [CrossRef]
  106. Ritchie, H.; Rosado, P.; Roser, M. Meat and Dairy Production. Our World in Data 2017. Available online: https://ourworldindata.org/meat-production (accessed on 22 March 2023).
  107. Mottet, A.; De Haan, C.; Falcucci, A.; Tempio, G.; Opio, C.; Gerber, P.J. Livestock: On our plates or eating at our table? A new analysis of the feed/food debate. Glob. Food Secur. 2017, 14, 1–7. [Google Scholar] [CrossRef]
  108. Kusmayadi, A.; Leong, Y.K.; Yen, H.W.; Huang, C.Y.; Chang, J.S. Microalgae as sustainable food and feed sources for animals and humans—Biotechnological and environmental aspects. Chemosphere 2021, 271, 129800. [Google Scholar] [CrossRef]
  109. Madeira, M.; Cardoso, C.; Lopes, P.; Coelho, D.; Afonso, C.; Bandarra, N.; Prates, J. Microalgae as feed ingredients for livestock production and meat quality: A review. Livest. Sci. 2017, 205, 47–59. [Google Scholar] [CrossRef]
  110. Valente, L.M.P.; Cabrita, A.R.J.; Maia, M.R.G.; Valente, I.M.; Engrola, S.; Fonseca, A.J.M.; Ribeiro, D.M.; Lordelo, M.; Martins, C.F.; Cunha, L.F.; et al. Microalgae as feed ingredients for livestock production and aquaculture. In Microalgae; Academic Press: Cambridge, MA, USA, 2021; pp. 239–312. [Google Scholar] [CrossRef]
  111. Saadaoui, I.; Rasheed, R.; Aguilar, A.; Cherif, M.; Al Jabri, H.; Sayadi, S.; Manning, S.R. Microalgal-based feed: Promising alternative feedstocks for livestock and poultry production. J. Anim. Sci. Biotechnol. 2021, 12, 76. [Google Scholar] [CrossRef] [PubMed]
  112. Ahmad, A.; Hassan, S.W.; Banat, F. An overview of microalgae biomass as a sustainable aquaculture feed ingredient: Food security and circular economy. Bioengineered 2022, 13, 9521–9547. [Google Scholar] [CrossRef] [PubMed]
  113. Henchion, M.; Hayes, M.; Mullen, A.M.; Fenelon, M.; Tiwari, B. Future protein supply and demand: Strategies and factors influencing a sustainable equilibrium. Foods 2017, 6, 53. [Google Scholar] [CrossRef]
  114. Bele, V.; Rajagopal, R.; Goyette, B. Closed-loop bioeconomy opportunities through the integration of microalgae cultivation with anaerobic digestion: A critical review. Bioresour. Technol. Rep. 2023, 21, 101336. [Google Scholar] [CrossRef]
  115. Rajagopal, R.; Mousavi, S.E.; Goyette, B.; Adhikary, S. Coupling of Microalgae Cultivation with Anaerobic Digestion of Poultry Wastes: Toward Sustainable Value Added Bioproducts. Bioengineering 2021, 8, 57. [Google Scholar] [CrossRef] [PubMed]
  116. Zhou, W.; Wang, J.; Chen, P.; Ji, C.; Kang, Q.; Lu, B.; Li, K.; Liu, J.; Ruan, R. Bio-mitigation of carbon dioxide using microalgal systems: Advances and perspectives. Renewable and Sustainable. Energy Rev. 2017, 76, 1163–1175. [Google Scholar] [CrossRef]
  117. Ighalo, J.O.; Dulta, K.; Kurniawan, S.B.; Omoarukhe, F.O.; Ewuzie, U.; Eshiemogie, S.O.; Ojo, A.U.; Sheikh Abdullah, S.R. Progress in microalgae application for CO2 sequestration. Clean. Chem. Eng. 2022, 3, 100044. [Google Scholar] [CrossRef]
  118. Chisti, Y. Biodiesel from microalgae. Biotechnol. Adv. 2007, 25, 294–306. [Google Scholar] [CrossRef]
  119. Wang, X.; Jin, G.; Pan, K.; Wang, Y.; Li, Q.; Zhang, H. Effects of fluctuating temperature in open raceway ponds on the biomass accumulation and harvest efficiency of Spirulina in large-scale cultivation. Environ. Sci. Pollut. Res. 2021, 28, 20794–20802. [Google Scholar] [CrossRef]
  120. Acién Fernández, F.G.; González-López, C.V.; Fernández-Sevilla, J.M.; Molina-Grima, E. Conversion of CO2 into biomass by microalgae: How realistic a contribution may it be to significant CO2 removal? Appl. Microbiol. Biotechnol. 2012, 96, 577–586. [Google Scholar] [CrossRef]
  121. Leena, M.C.; Hausrath, E.M.; Ming, D.W.; Adcock, C.T.; Raymond, J.; Remias, D.; Ruemmele, W.P. Investigating the Growth of Algae Under Low Atmospheric Pressures for Potential Food and Oxygen Production on Mars. Front. Microbiol. 2021, 12, 733244. [Google Scholar] [CrossRef]
Figure 1. Adapted scheme of the fast carbon cycle and related energy flows [10,14]. Primary production (green lines), respiration and combustion (blue lines), carbon and fluxes derived from human activities since 1750 (red lines), energy flows and amounts (yellow lines and text).
Applsci 14 08657 g001
Figure 2. Comparative diagram between closed and open photobioreactors and the main differences in their implementation and running parameters.
Applsci 14 08657 g002
Figure 3. Diagram of the main factors that delimit microalgae growth in a photobioreactor.
Applsci 14 08657 g003
Figure 4. Approach summary diagram visualising the relationships between light intensity reaching the photobioreactor, the photosynthesis/irradiance curve, and the system’s key parameters.
Applsci 14 08657 g004
Figure 5. Comparative scheme about the different strategies proposed for the control of temperature in photobioreactors.
Applsci 14 08657 g005
Figure 6. Relationships between photosynthesis and bicarbonate buffer in water systems. (a) Evolution of carbonic species concerning pH values and optimal rage to biological fixation (red). (b) Metabolic scheme of the different inputs of CO2 and energy into the Calvin cycle of microalgae and cyanobacteria.
Applsci 14 08657 g006
Figure 7. Main differences between one-stage and two-stage growth systems and their effect on the growth rates (µ) of the culture.
Applsci 14 08657 g007
Figure 8. Simulation of the possible evolution of fossil fuel reserves (red dashed line) and the atmospheric concentration of CO2 maintaining the annual consumption and emission rate increment (black line) throughout the next century. The pink, green, and blue dashed lines suggest the impact of several amounts of biological capture of atmospheric carbon on the CO2 accumulation.
Applsci 14 08657 g008
Figure 9. A simplified design of a biological CO2 sink is depicted. (1) Controlled access to seawater. (2) Phytoplankton sink. (3) Facilities for biomass processing. Pipes to take and return culture and clean medium, respectively. (4) Dredging ships harvesting within the pond.
Applsci 14 08657 g009
Table 1. Culture surface needed by major world powers to reach 7.5 Gt of carbon (GtC)/year of biomass production since their emission rate (Adapted table [83]).
CountryEmissions (Mt CO2/Year)Total Surface (×106 km2)Proportional Culture Surface (×103 km2)% Total Surface
China10,0659.60494.95.2
USA54169.83266.32.7
India26543.29130.54.0
Russia171117.1084.10.5
Japan11620.3857.115.1
Germany7590.3637.310.4
Iran7201.6535.42.1
South Korea6590.1032.432.4
Saudi Arabia6212.1530.51.4
Indonesia6151.9030.21.6
Canada5689.9827.90.3
Mexico4771.9723.51.2
South Africa4681.2223.01.9
Brazil4578.5222.50.3
Turkey4280.7821.02.7
Disclaimer/Publisher’s Note: The statements, opinions and data contained in all publications are solely those of the individual author(s) and contributor(s) and not of MDPI and/or the editor(s). MDPI and/or the editor(s) disclaim responsibility for any injury to people or property resulting from any ideas, methods, instructions or products referred to in the content.

