Abstract
Gas-wave refrigerators are widely used devices that utilize gas pressure to produce wave motion inside an oscillating tube for high-power refrigeration. This paper manufactures the core component of gas-wave refrigerators—the oscillating tubes—using hub and blade brazing. The tensile strength and fatigue life of the brazed joints were obtained through experiments. A finite element simulation based on the cohesive zone model determined that the critical damage stress of the brazed-joint brazing seam was 525 MPa. Under cyclic displacements of U = [0.4 mm, 0.5 mm, 0.6 mm], the errors between the simulated and experimental values of fatigue life are 9.09%, 4.38%, and 4.44%, respectively, which verifies the accuracy of the VUMAT subroutine of the cyclic CZM. The fatigue life relationship formula for the butt-brazed joints was fitted as . Through the simulation analysis of the impact of the butt-joint angles on the fatigue life of brazed joints, it was found that as the butt-joint angle increased, the fatigue damage decreased, and the fatigue life increased. A finite element model of an oscillating tube with a DN (Nominal Diameter) of 285 × 450 mm was established to analyze the fatigue life of the butt-brazed structure of the rotor blade. The fatigue life of the brazed structure with a butt-joint angle of α = 45° increased by over 102.92% than that of α = 0°.
1. Introduction
Gas-wave machines provide refrigeration through the movement of gas flow waves. These are widely used in industrial fields, such as natural gas dehydration, aviation engines, and food freezing and preservation [1,2,3]. The oscillating tube is the core component of the gas-wave machine. When an oscillating tube is manufactured using the hub and blade brazing method, the brazed joint is subjected to complex and alternating loads during operation, making it prone to fatigue failure [4]. In this paper, brazed joints with various angles were designed for the brazed parts of an oscillating tube. Based on the cohesive zone model (CZM) [5,6,7,8], fatigue strength research on the brazed joints of gas-wave machine oscillating tubes has been conducted.
Barenblatt [9] and Dugdale [10] first proposed the application of a CZM to study the fracture behavior of brittle materials. Mi [11] proposed a bilinear CZM suitable for crack propagation of brittle and metal alloy materials. Ghovanlou [12] used the CZM to simulate fatigue crack propagation in low-carbon steel brazed joints and conducted strain-controlled fatigue tests on brazed samples. The results showed that the larger the strain amplitude, the faster the crack propagated along the brazed layer. Jiang [13] employed an irreversible CZM to simulate the fatigue crack growth in CTS (Compact–Tension–Shear) samples under different loading modes. The findings revealed that the crack growth rate during overload was approximately 7 × 10⁻³ mm/cycle, significantly higher than that under baseline loading conditions. Nojavan [14] developed a two-dimensional CZM subroutine to simulate the fatigue crack propagation of composite materials under normal, tangential, and mixed loading. This revealed the mechanisms of crack-tip opening, sliding, and mixed-mode propagation. Kim [15] employed a bilinear cyclic CZM to investigate the high-cycle fatigue of 7050-T7451 aluminum alloy. By comparing the simulated and experimental S-N curve, it was found that the maximum error in the fatigue life at the 100,000th cycle was 20%, indicating that the CZM was suitable for simulating the fretting fatigue of aluminum alloys and predicting their life cycle.
Gonabadi [16] investigated the influence of environmental fatigue on the mechanical properties of composite materials through nanoindentation tests, incorporating a finite element model to facilitate the analysis.
Wu [4] studied the fatigue crack growth process in the interface layer of 304 stainless steel/T2 copper T-type brazed joints using a bilinear CZM. The results indicate that as the cyclic displacement increased, the crack initiation decreased, and the crack growth rate increased. In addition, the interface damage, crack length, and fatigue load increased with the thickness of the base material.
At present, there is a significant amount of research on the interfacial strength of composites and metal alloys, but relatively little research has been conducted on the interfacial strength of butt-brazed joints at different angles. In this article, the oscillating tube of a gas-wave machine was manufactured using the hub and blade brazing methods. For the brazed parts of the oscillating tube, brazed joints with different butt angles were designed and prepared for tensile fatigue tests. Based on the bilinear CZM, a cyclic CZM VUMAT subroutine was developed. Using the ABAQUS finite element software (abaqus 6.14.4), the fatigue crack initiation and propagation of the butt-brazed joints were simulated. On this basis, the fatigue life of the DN285 × 450 mm oscillating tube finite element model was verified, providing theoretical guidance for the design and manufacture of the brazed structure of the gas-wave machine oscillating tube.
1.1. Brazing Process
A butt-brazed joint was prepared using SUS304 stainless steel (DY WIRE, Qingshan, Wuhan, China) as the base metal and T2 copper brazing filler. Before brazing, the base material was pretreated by grinding and polishing to achieve a surface roughness of 1.6 um and flatness of 0.03 mm. The surface was cleaned with anhydrous ethanol to remove any impurities. Table 1 and Table 2 list the chemical compositions of the SUS304 stainless steel and T2 copper, respectively.

Table 1.
Chemical composition of SUS304 (wt. %).
Table 2.
Chemical composition of T2 copper (wt/%).
During the brazing process, the vacuum level inside the brazing furnace was maintained at 10−4~10−3 Pa. The furnace temperature was gradually increased to approximately 1100 °C at a heating rate of 5 °C/min and held for 30 min to allow for sufficient diffusion of the brazing filler. After the holding period, nitrogen was introduced into the furnace for rapid cooling, and parts were removed when the furnace temperature dropped to 100 °C.
1.2. Test Process
Based on the GB/T 11363-2008 “Test Method for Strength of Brazed Joints” [17], the butt-brazed joint specimens were designed. Figure 1 illustrates the structural dimensions of the butt-brazed joint, with butt-joint angles α = [0°, 15°, 30°, 45°]. The specimen thickness t was 2 mm, and width b was 10 mm. The remaining dimensions are shown in Figure 1.
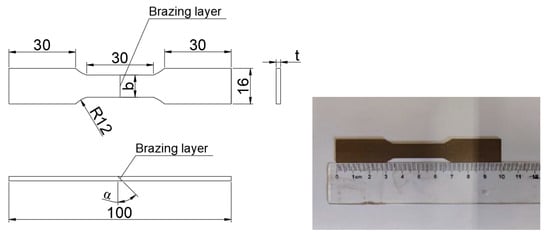
Figure 1.
Structural dimensions of butt brazing joints.
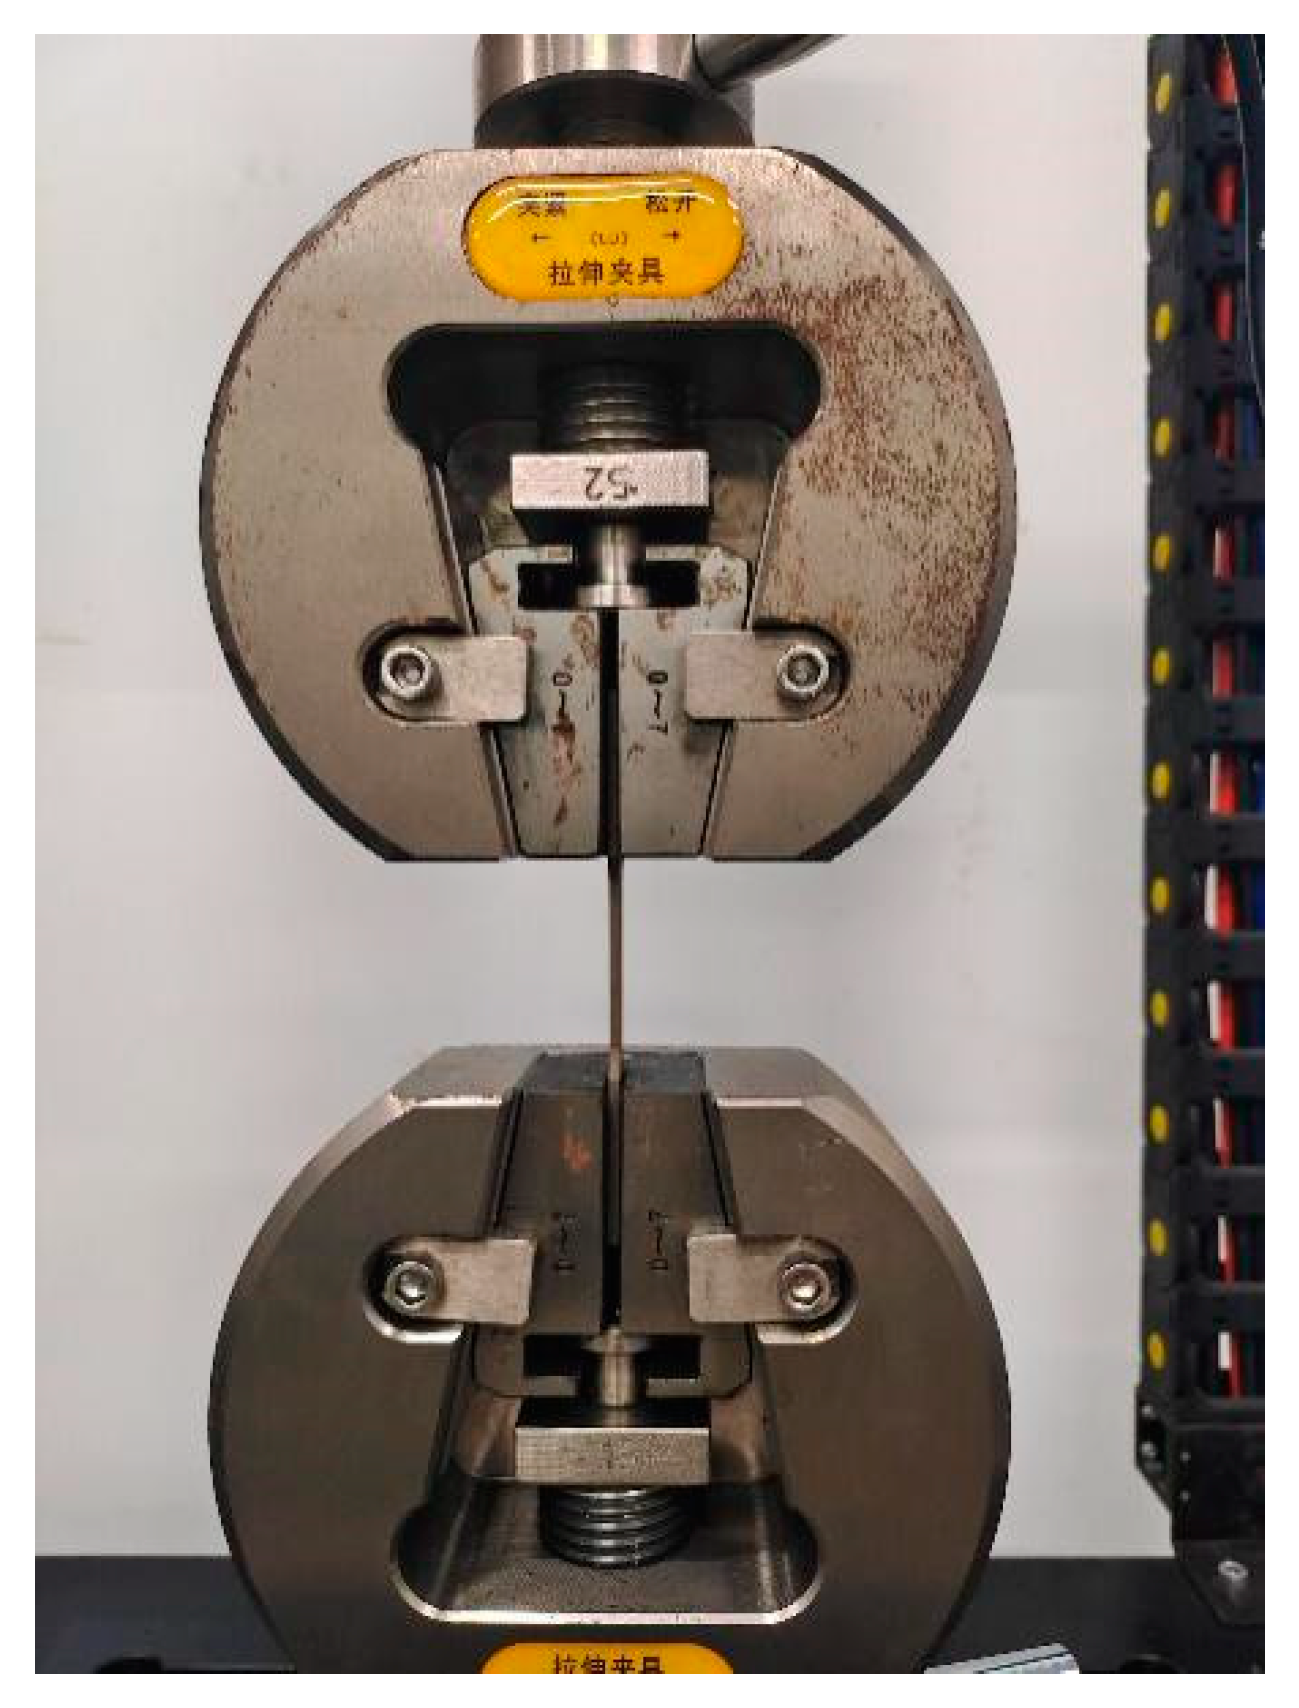
A PX-10 electronic tensile fatigue testing machine was used to conduct tensile fatigue tests on the butt-brazed joint specimens. Figure 2 shows the specimen loading diagram.
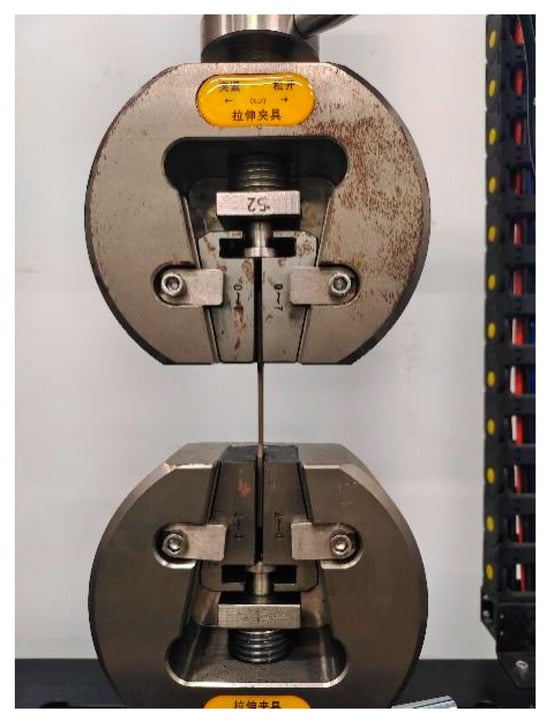
Figure 2.
Specimen loading diagram.
For the tensile test on the butt-brazed joint specimen with α = 0°, a loading displacement speed of 2 mm/min was adopted to obtain the tensile strength.
Two sets of fatigue tests were performed using a cyclic ratio R = 0, frequency f = 10 Hz, and a triangular waveform. The first set of selected specimens had a butt-joint angle of α = 0°. Brazed joint fatigue tests were performed with cyclic displacements X = [0.4 mm, 0.5 mm, 0.6 mm]. The second set of selected specimens had butt-joint angles α = [0°, 15°, 30°, 45°]. Brazed-joint fatigue tests were performed with a cyclic displacement of X = 0.5 mm.
1.3. Test Results
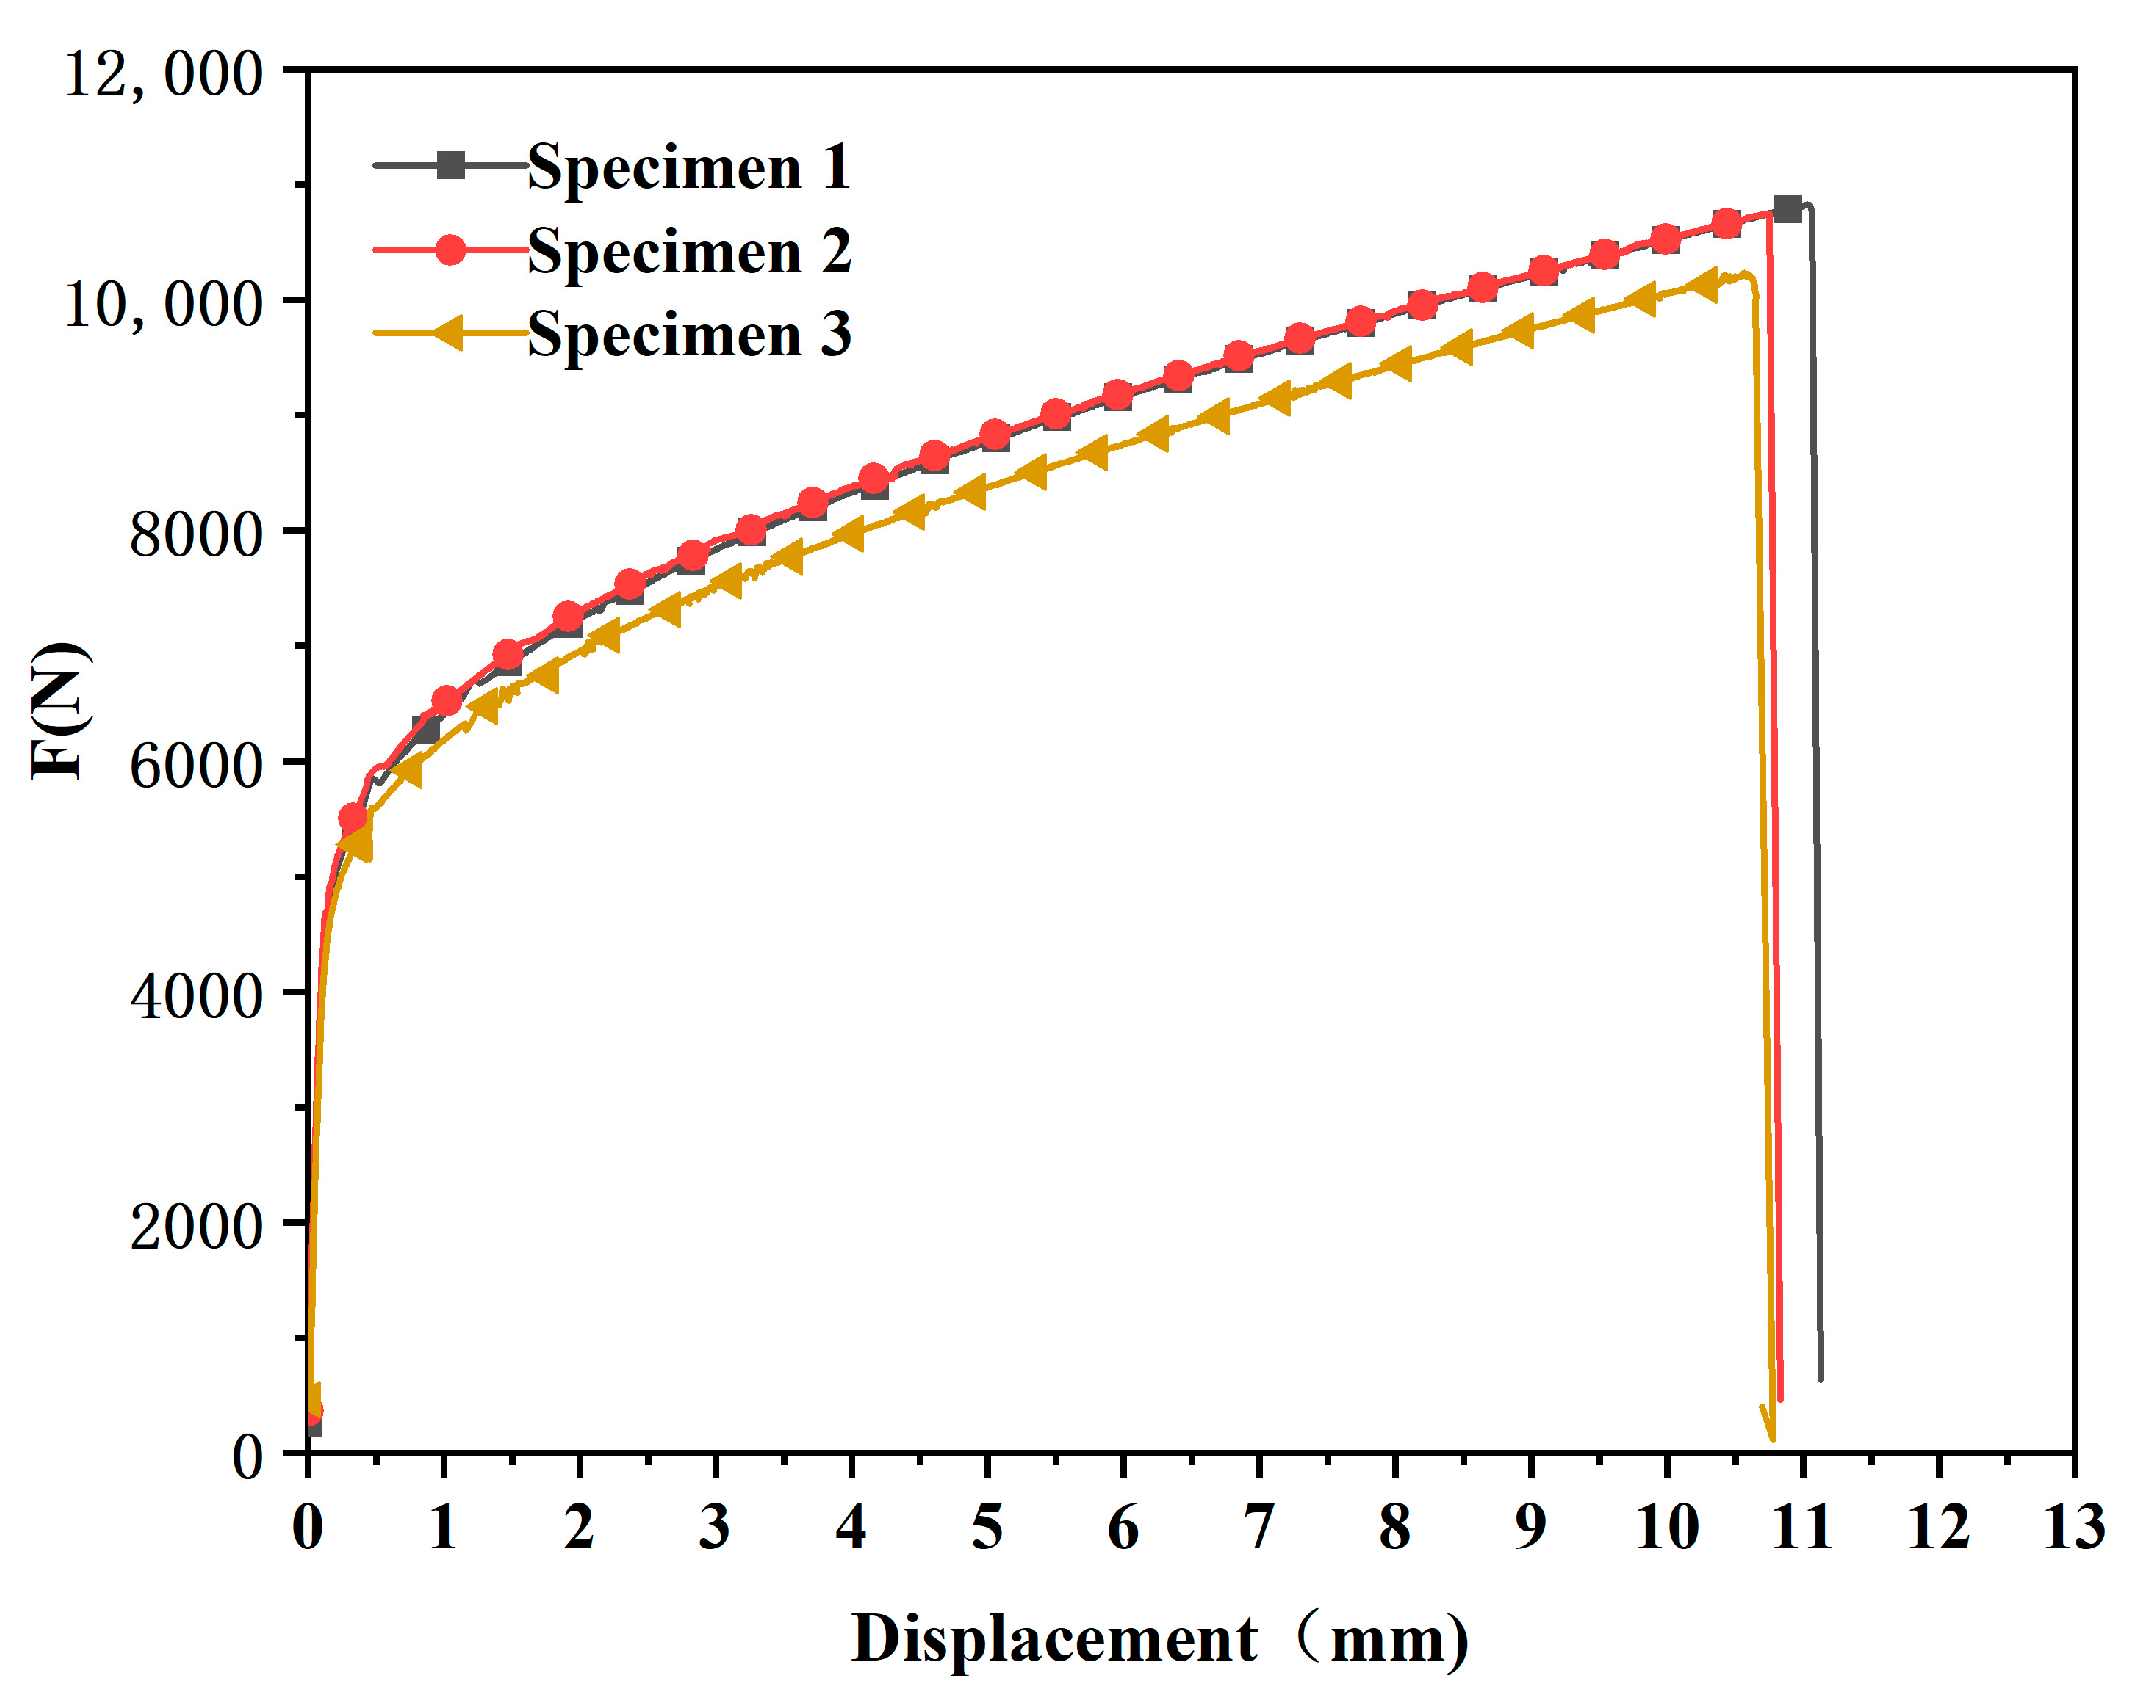
Figure 3 represents the tensile load-displacement curve of the brazed-joint specimen with butt-joint angle α = 0°. Three sets of repeated tests were performed on the specimens, and the load-displacement curves showed good agreement. The results indicated that as the tensile load increased, plastic deformation occurred in the base material. When the load reached its maximum value, the specimen instantaneously fractured in the weld seam of the brazed joint.
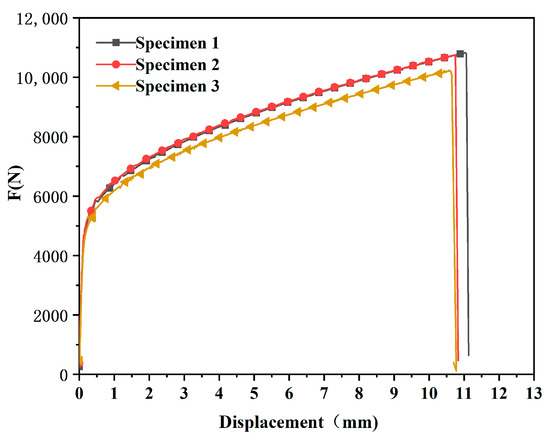
Figure 3.
Tensile load-displacement curve of the specimen.
Figure 4 shows the load-life curves of the butt-brazed joint specimens with α = 0° under cyclic displacements X = [0.4 mm, 0.5 mm, 0.6 mm]. The maximum fatigue loads of the specimens were 3842 N, 4340 N, and 4745 N, and their fatigue lives were 158,955, 55,219, and 45,886 cycles, respectively.
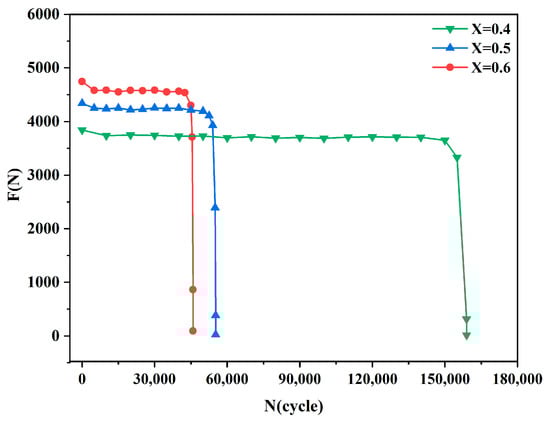
Figure 4.
Load-life curves of brazed joints under different cyclic displacements.
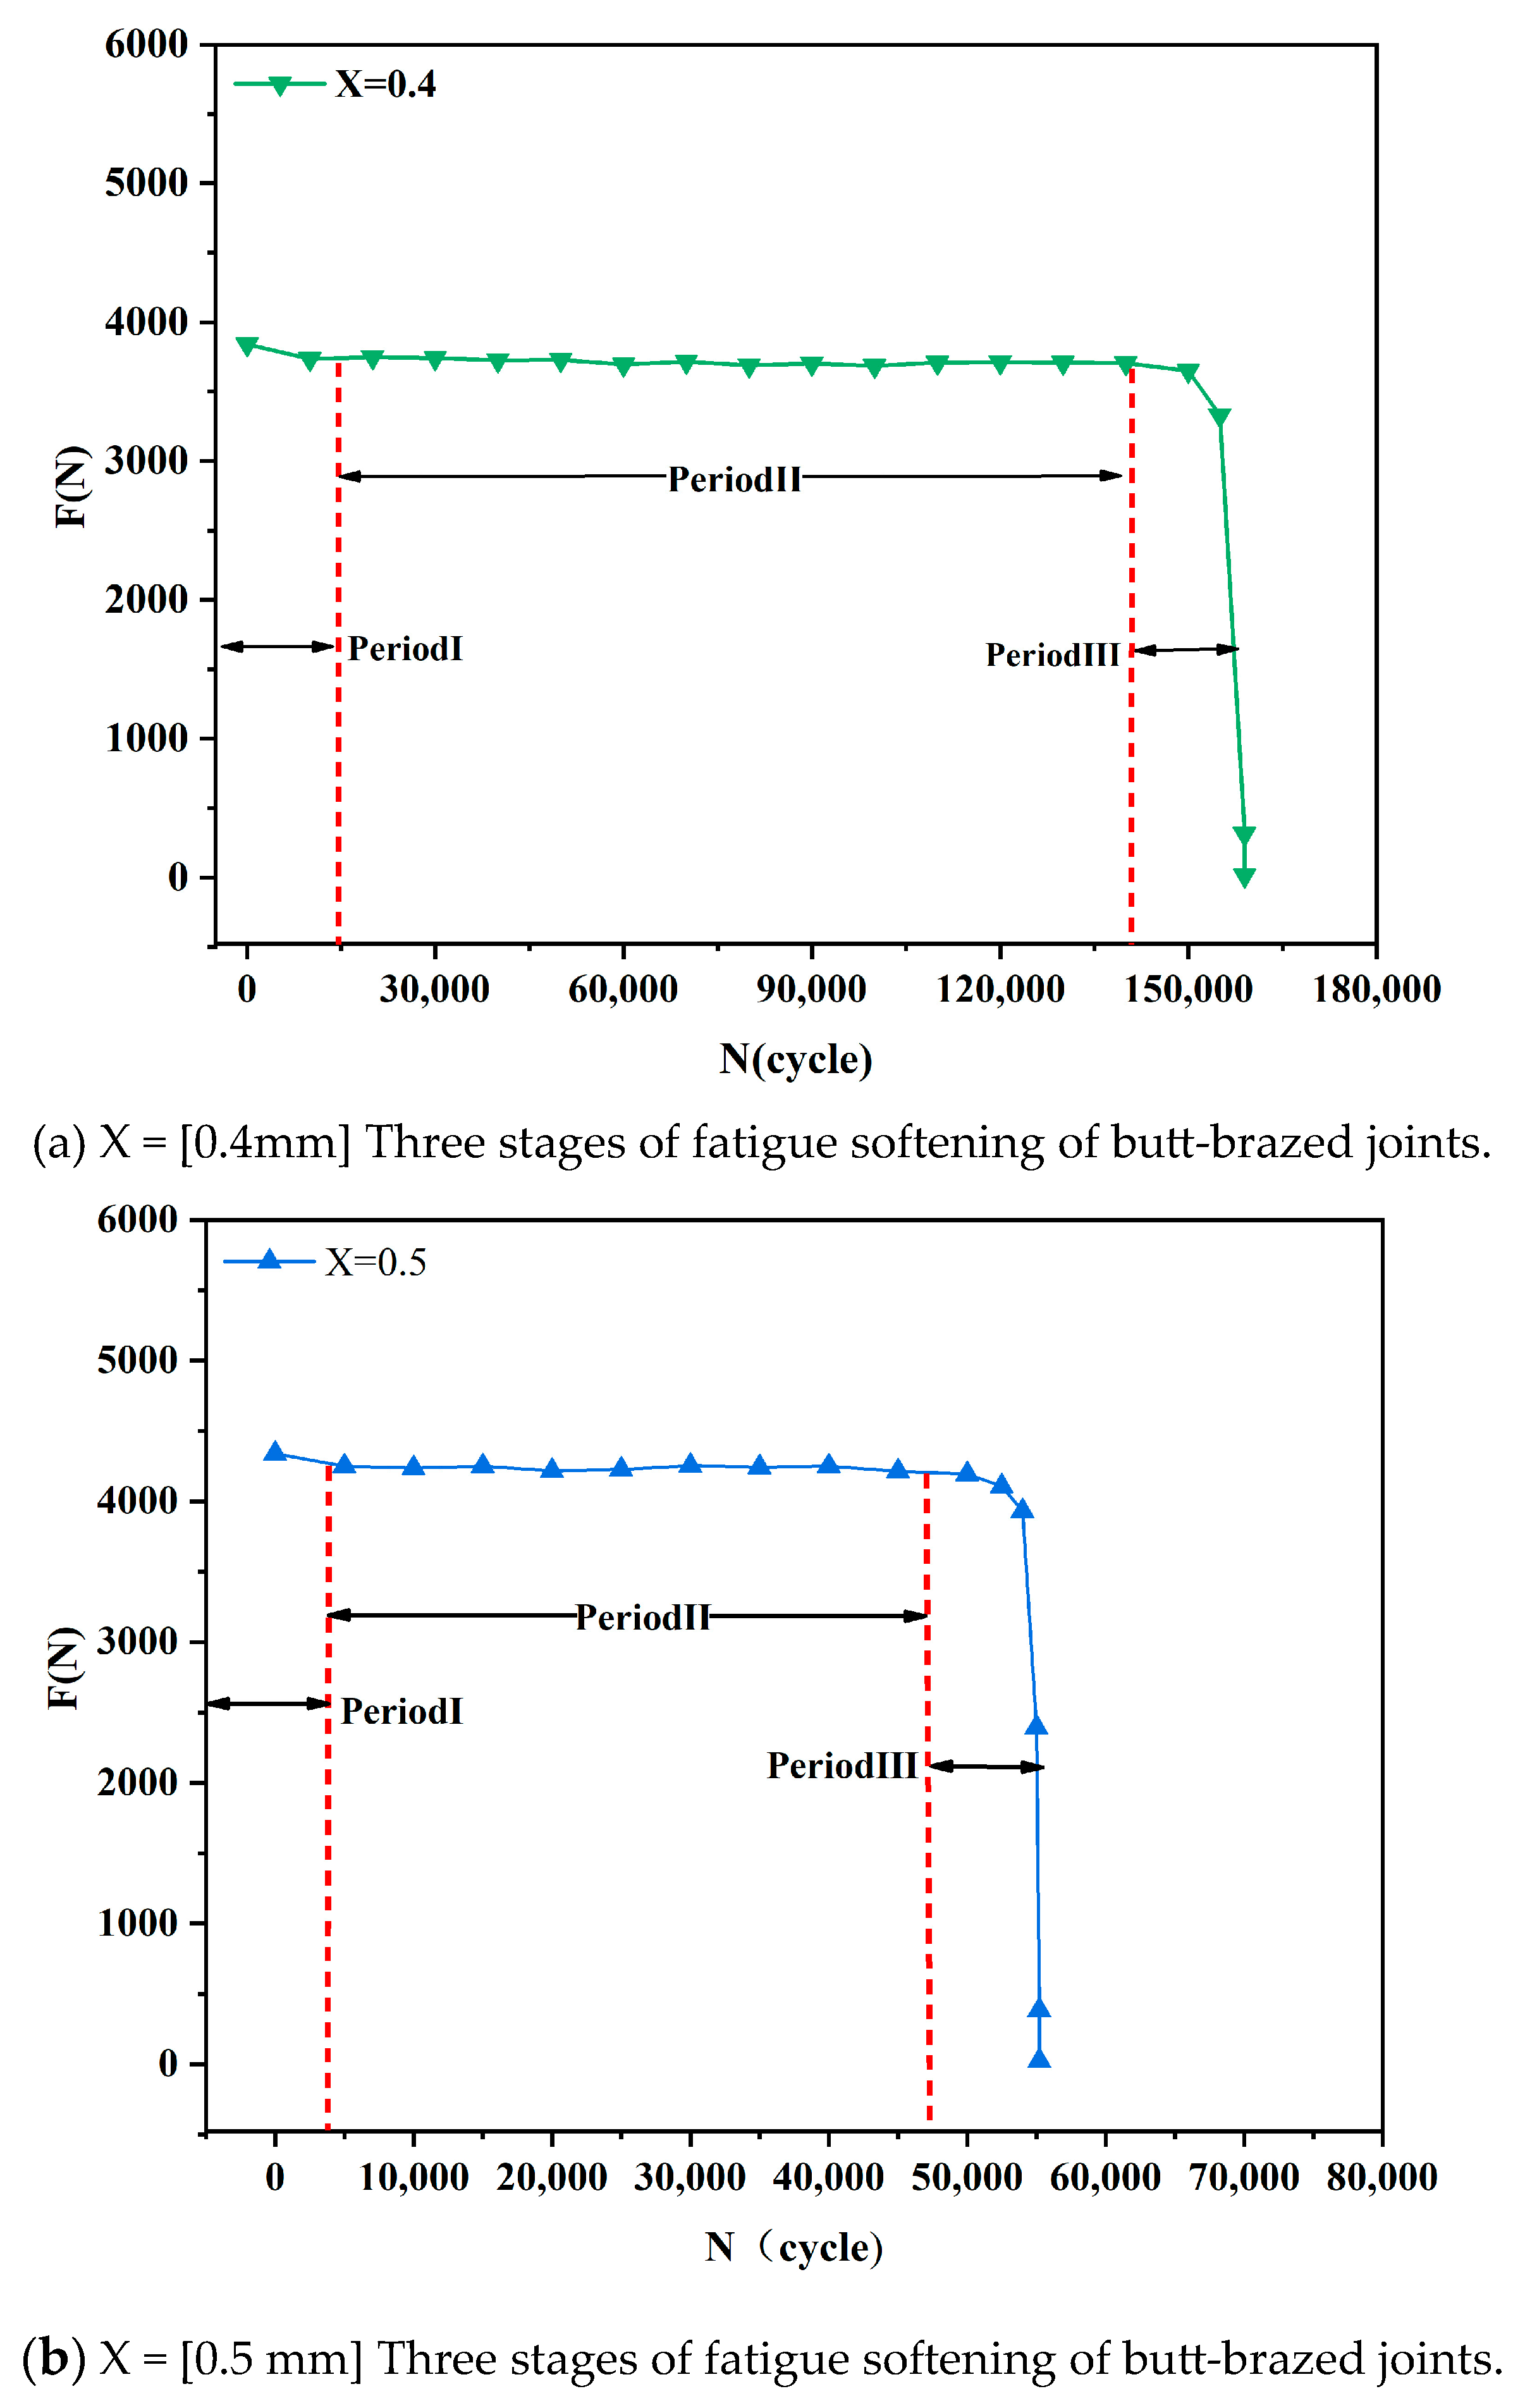
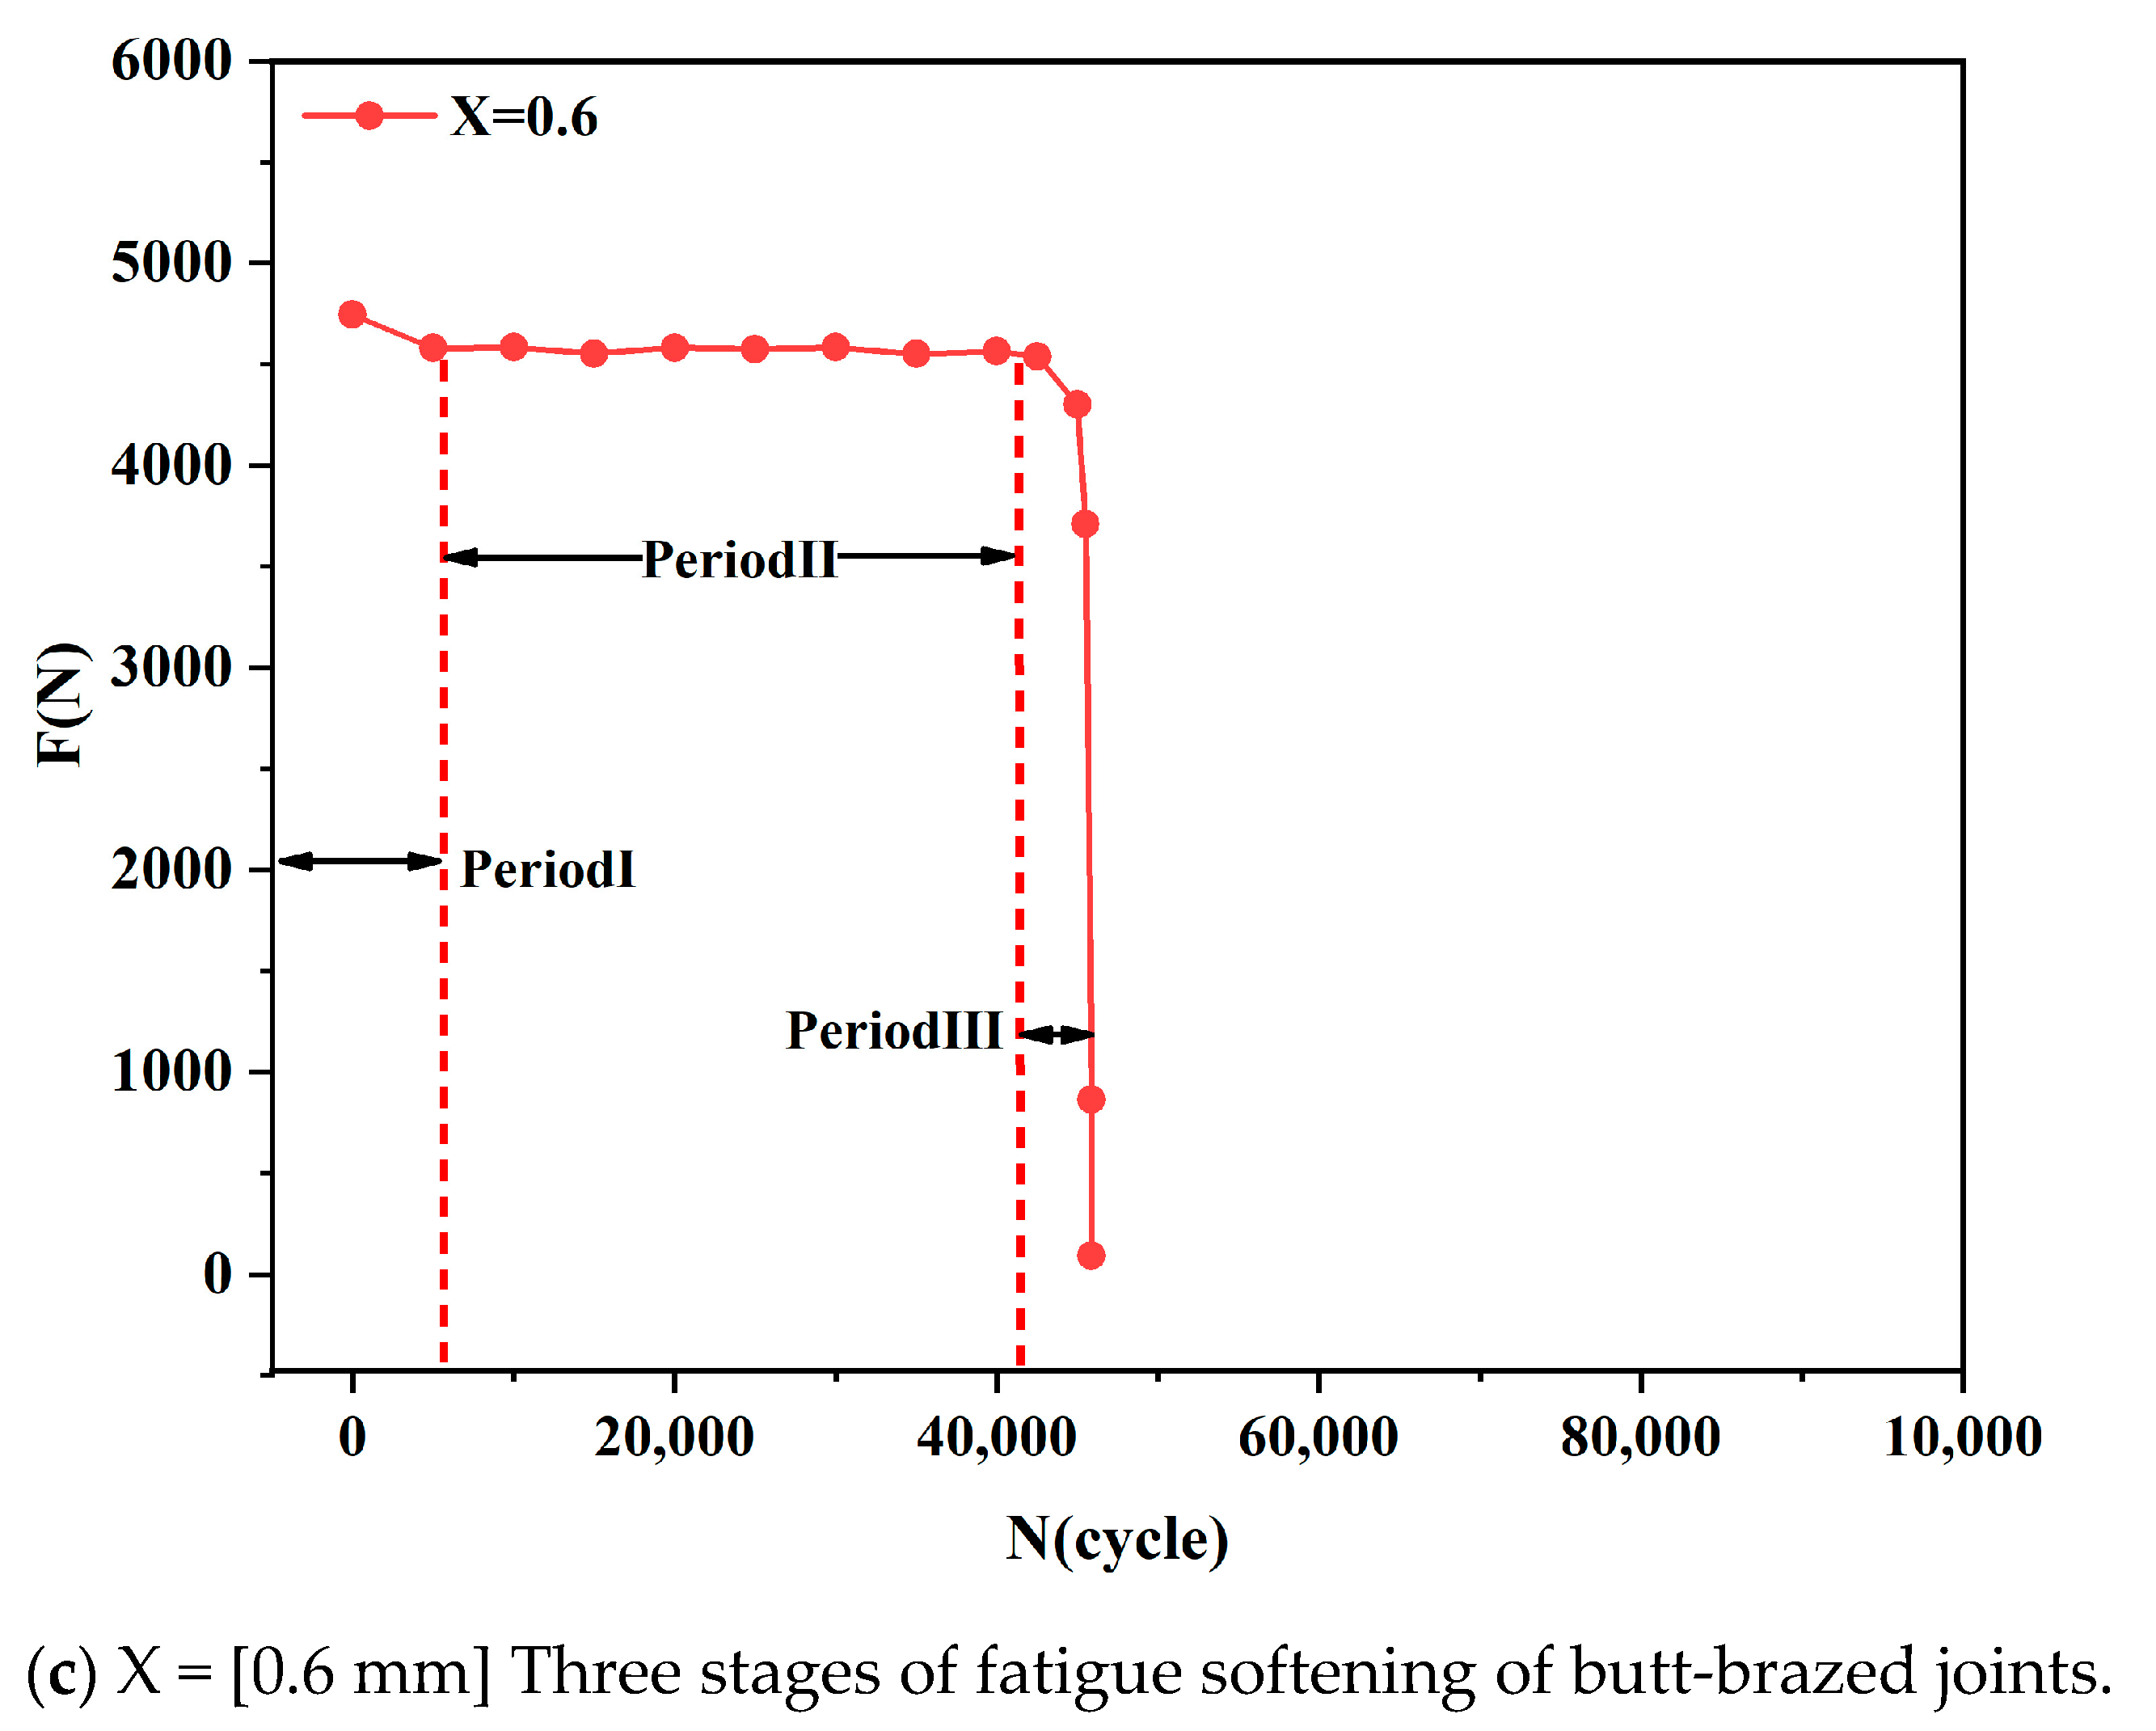
Figure 5 shows the three stages of fatigue softening of the butt-brazed joints under cyclic displacements of X = [0.4 mm, 0.5 mm, 0.6 mm]. In Stage I, the fatigue load decreased slightly, and the brazed weld of the butt-brazed joint showed initial softening characteristics. In Stage II, the fatigue load remained stable for a long time. In Stage III, the fatigue load decreased rapidly, and the brazed weld of the butt-brazed joint exhibited severe softening characteristics; fatigue cracks initiated and propagated at the brazed weld, leading to the fracture of the specimen.
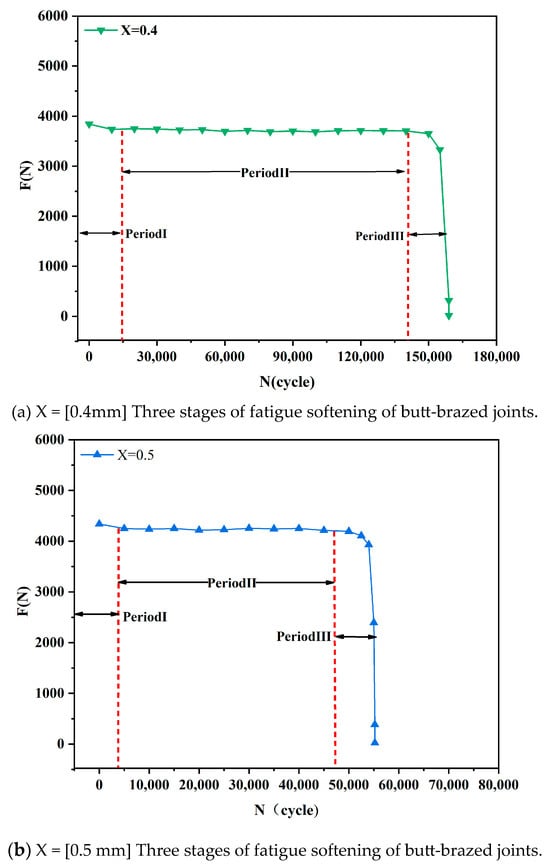
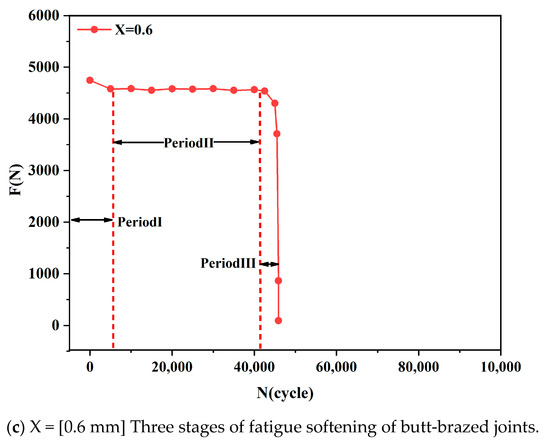
Figure 5.
X = [0.4 mm, 0.5 mm, 0.6 mm] Three stages of fatigue softening of butt-brazed joints.
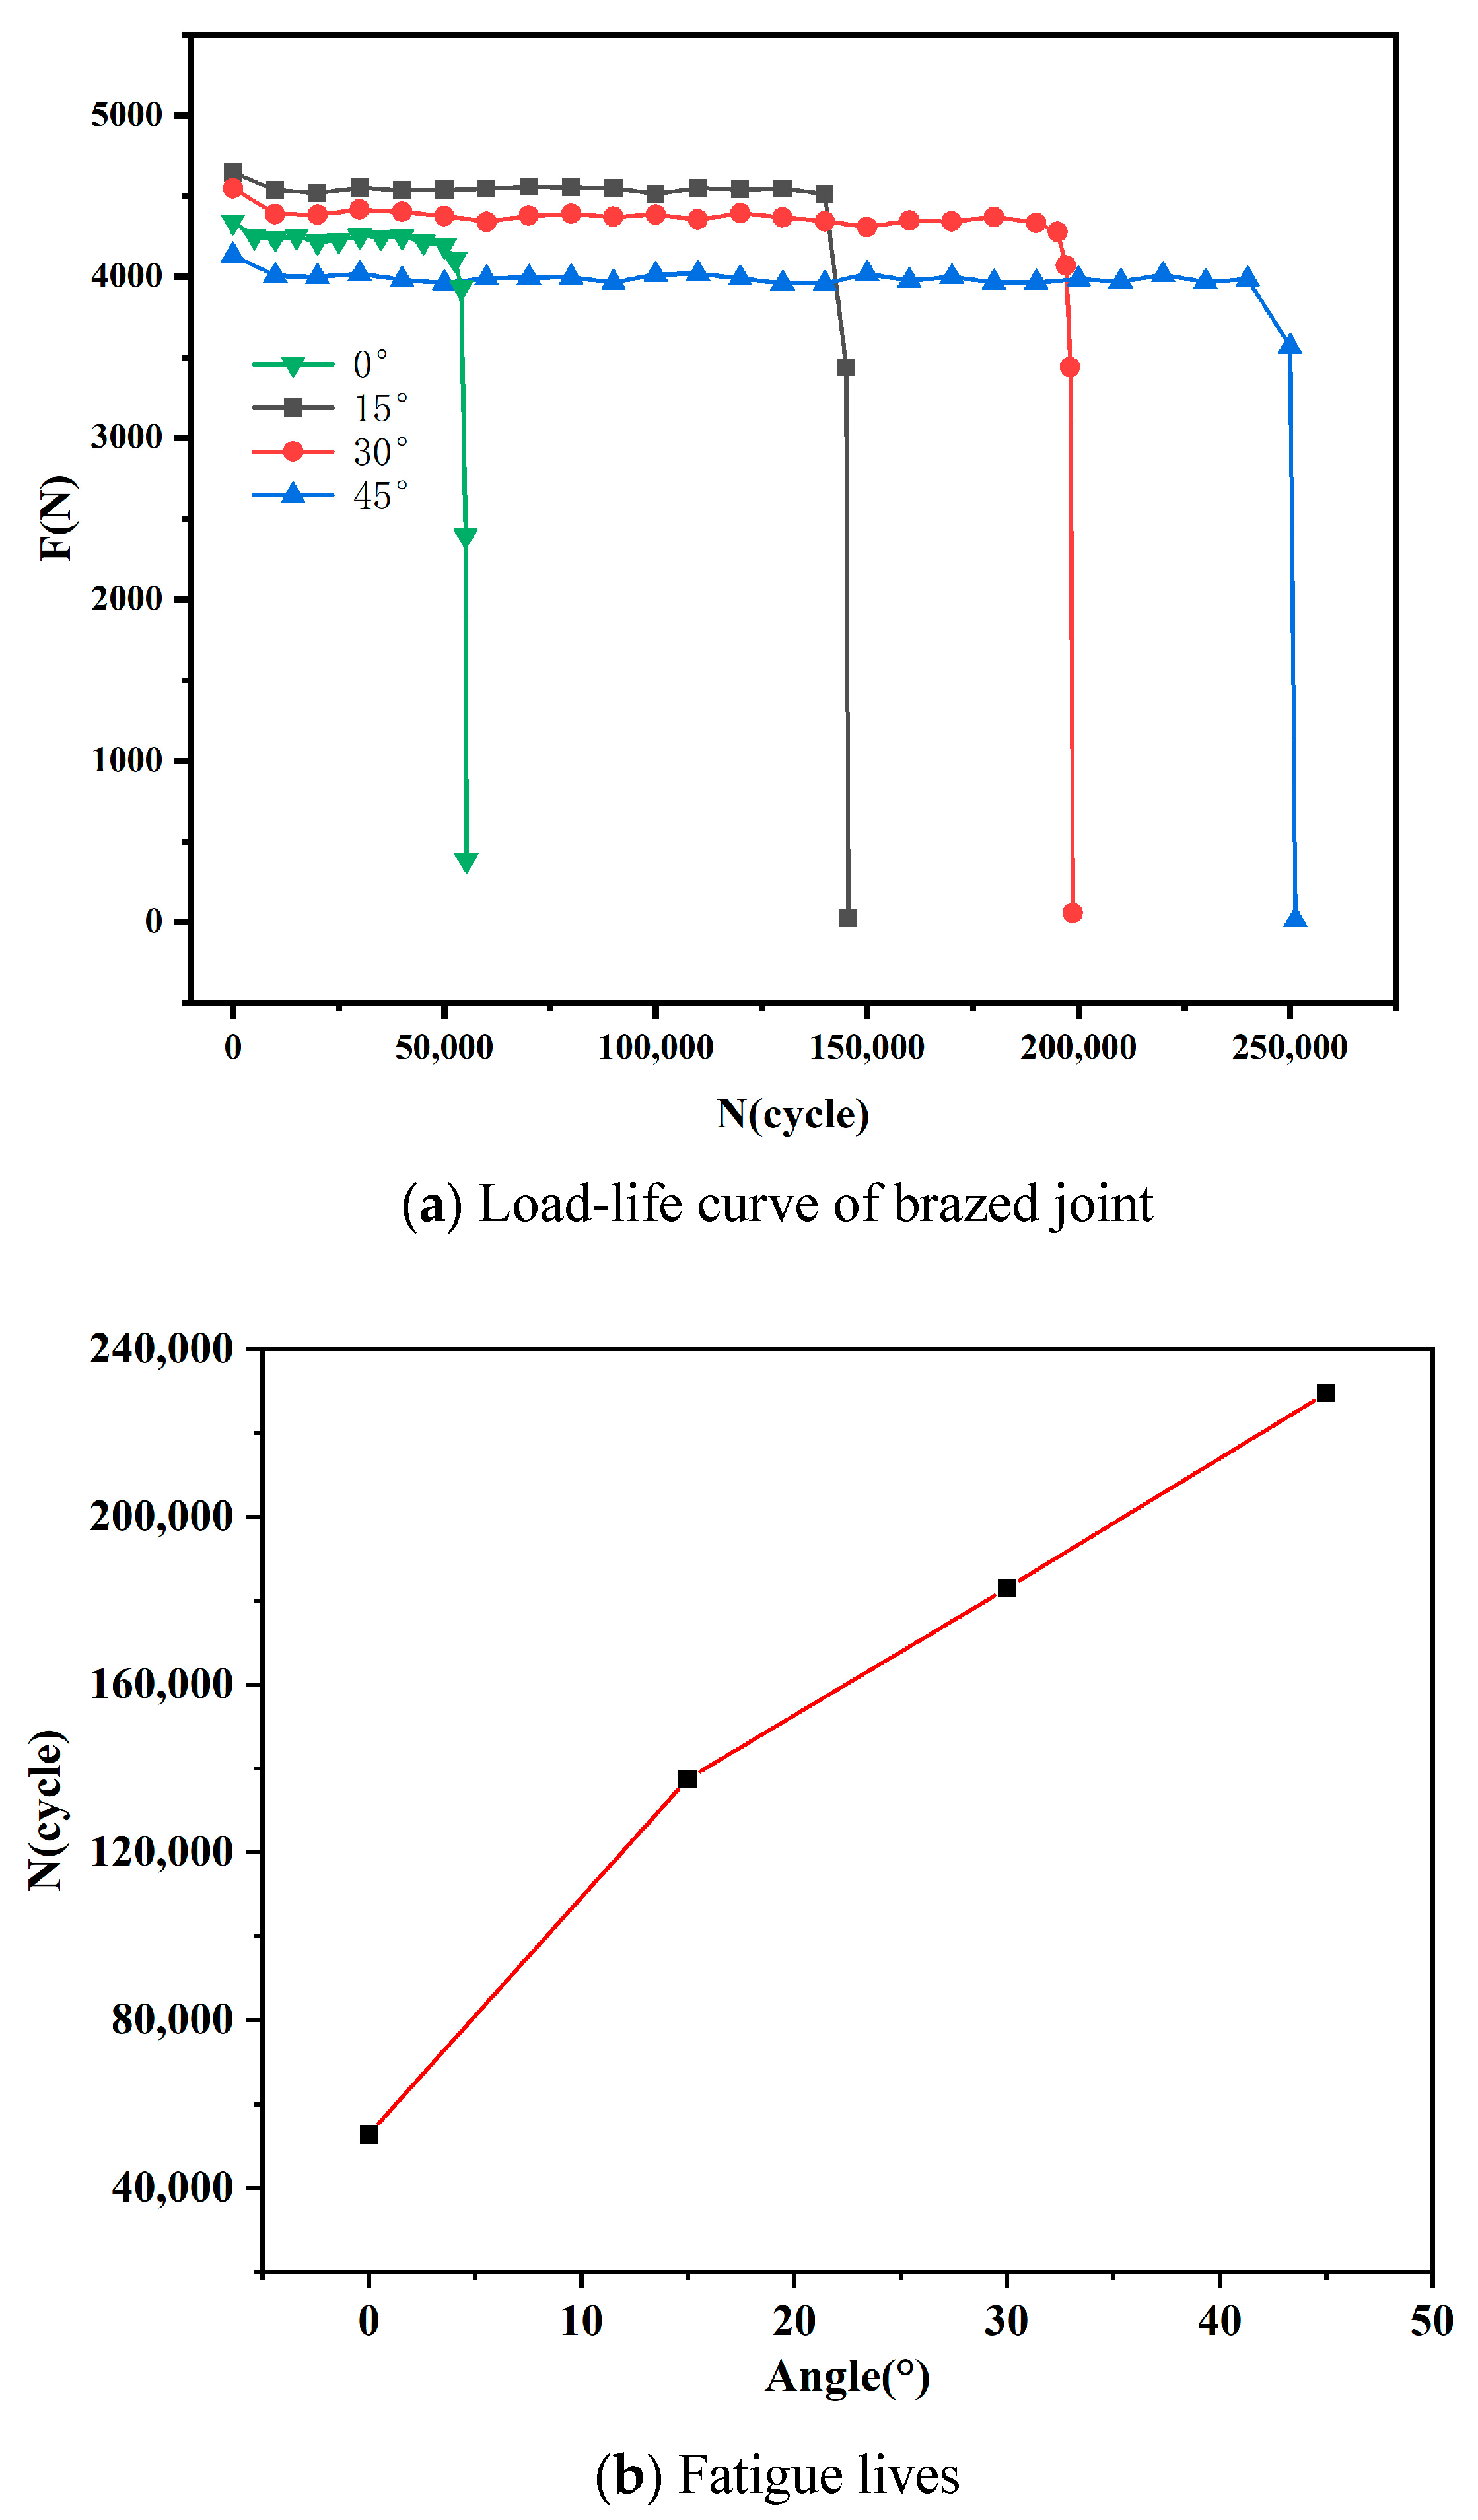
Figure 6 shows the fatigue life curves of butt-brazed joints under different butt angles α = [0°, 15°, 30°, 45°]. The fatigue lives of the specimens at the time of fatigue fracture were 55,219, 145,510, 198,628, and 251,282 cycles, respectively. Under the same cyclic displacement, the fatigue life of the butt-brazed joint increased with the butt angle.
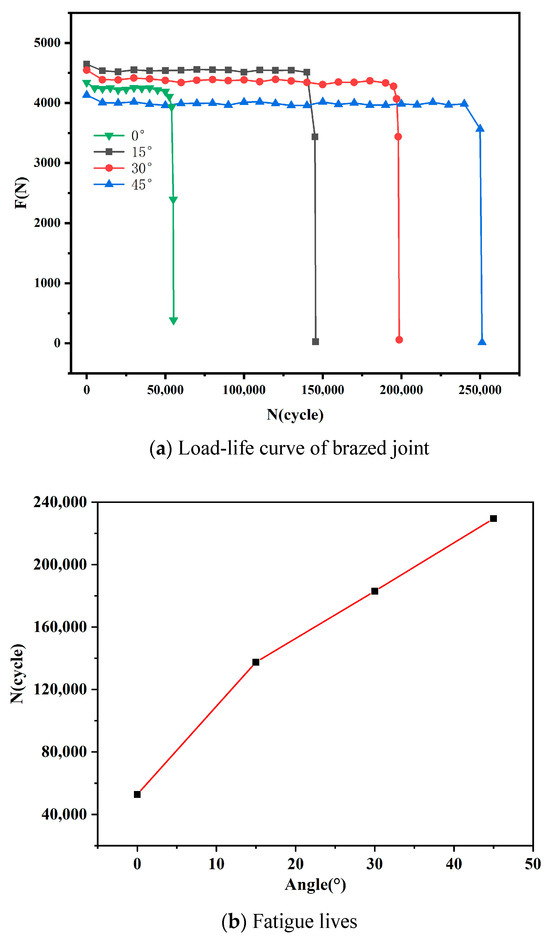
Figure 6.
α = [0°, 15°, 30°, 45°] fatigue life curve of butt-brazed joint.
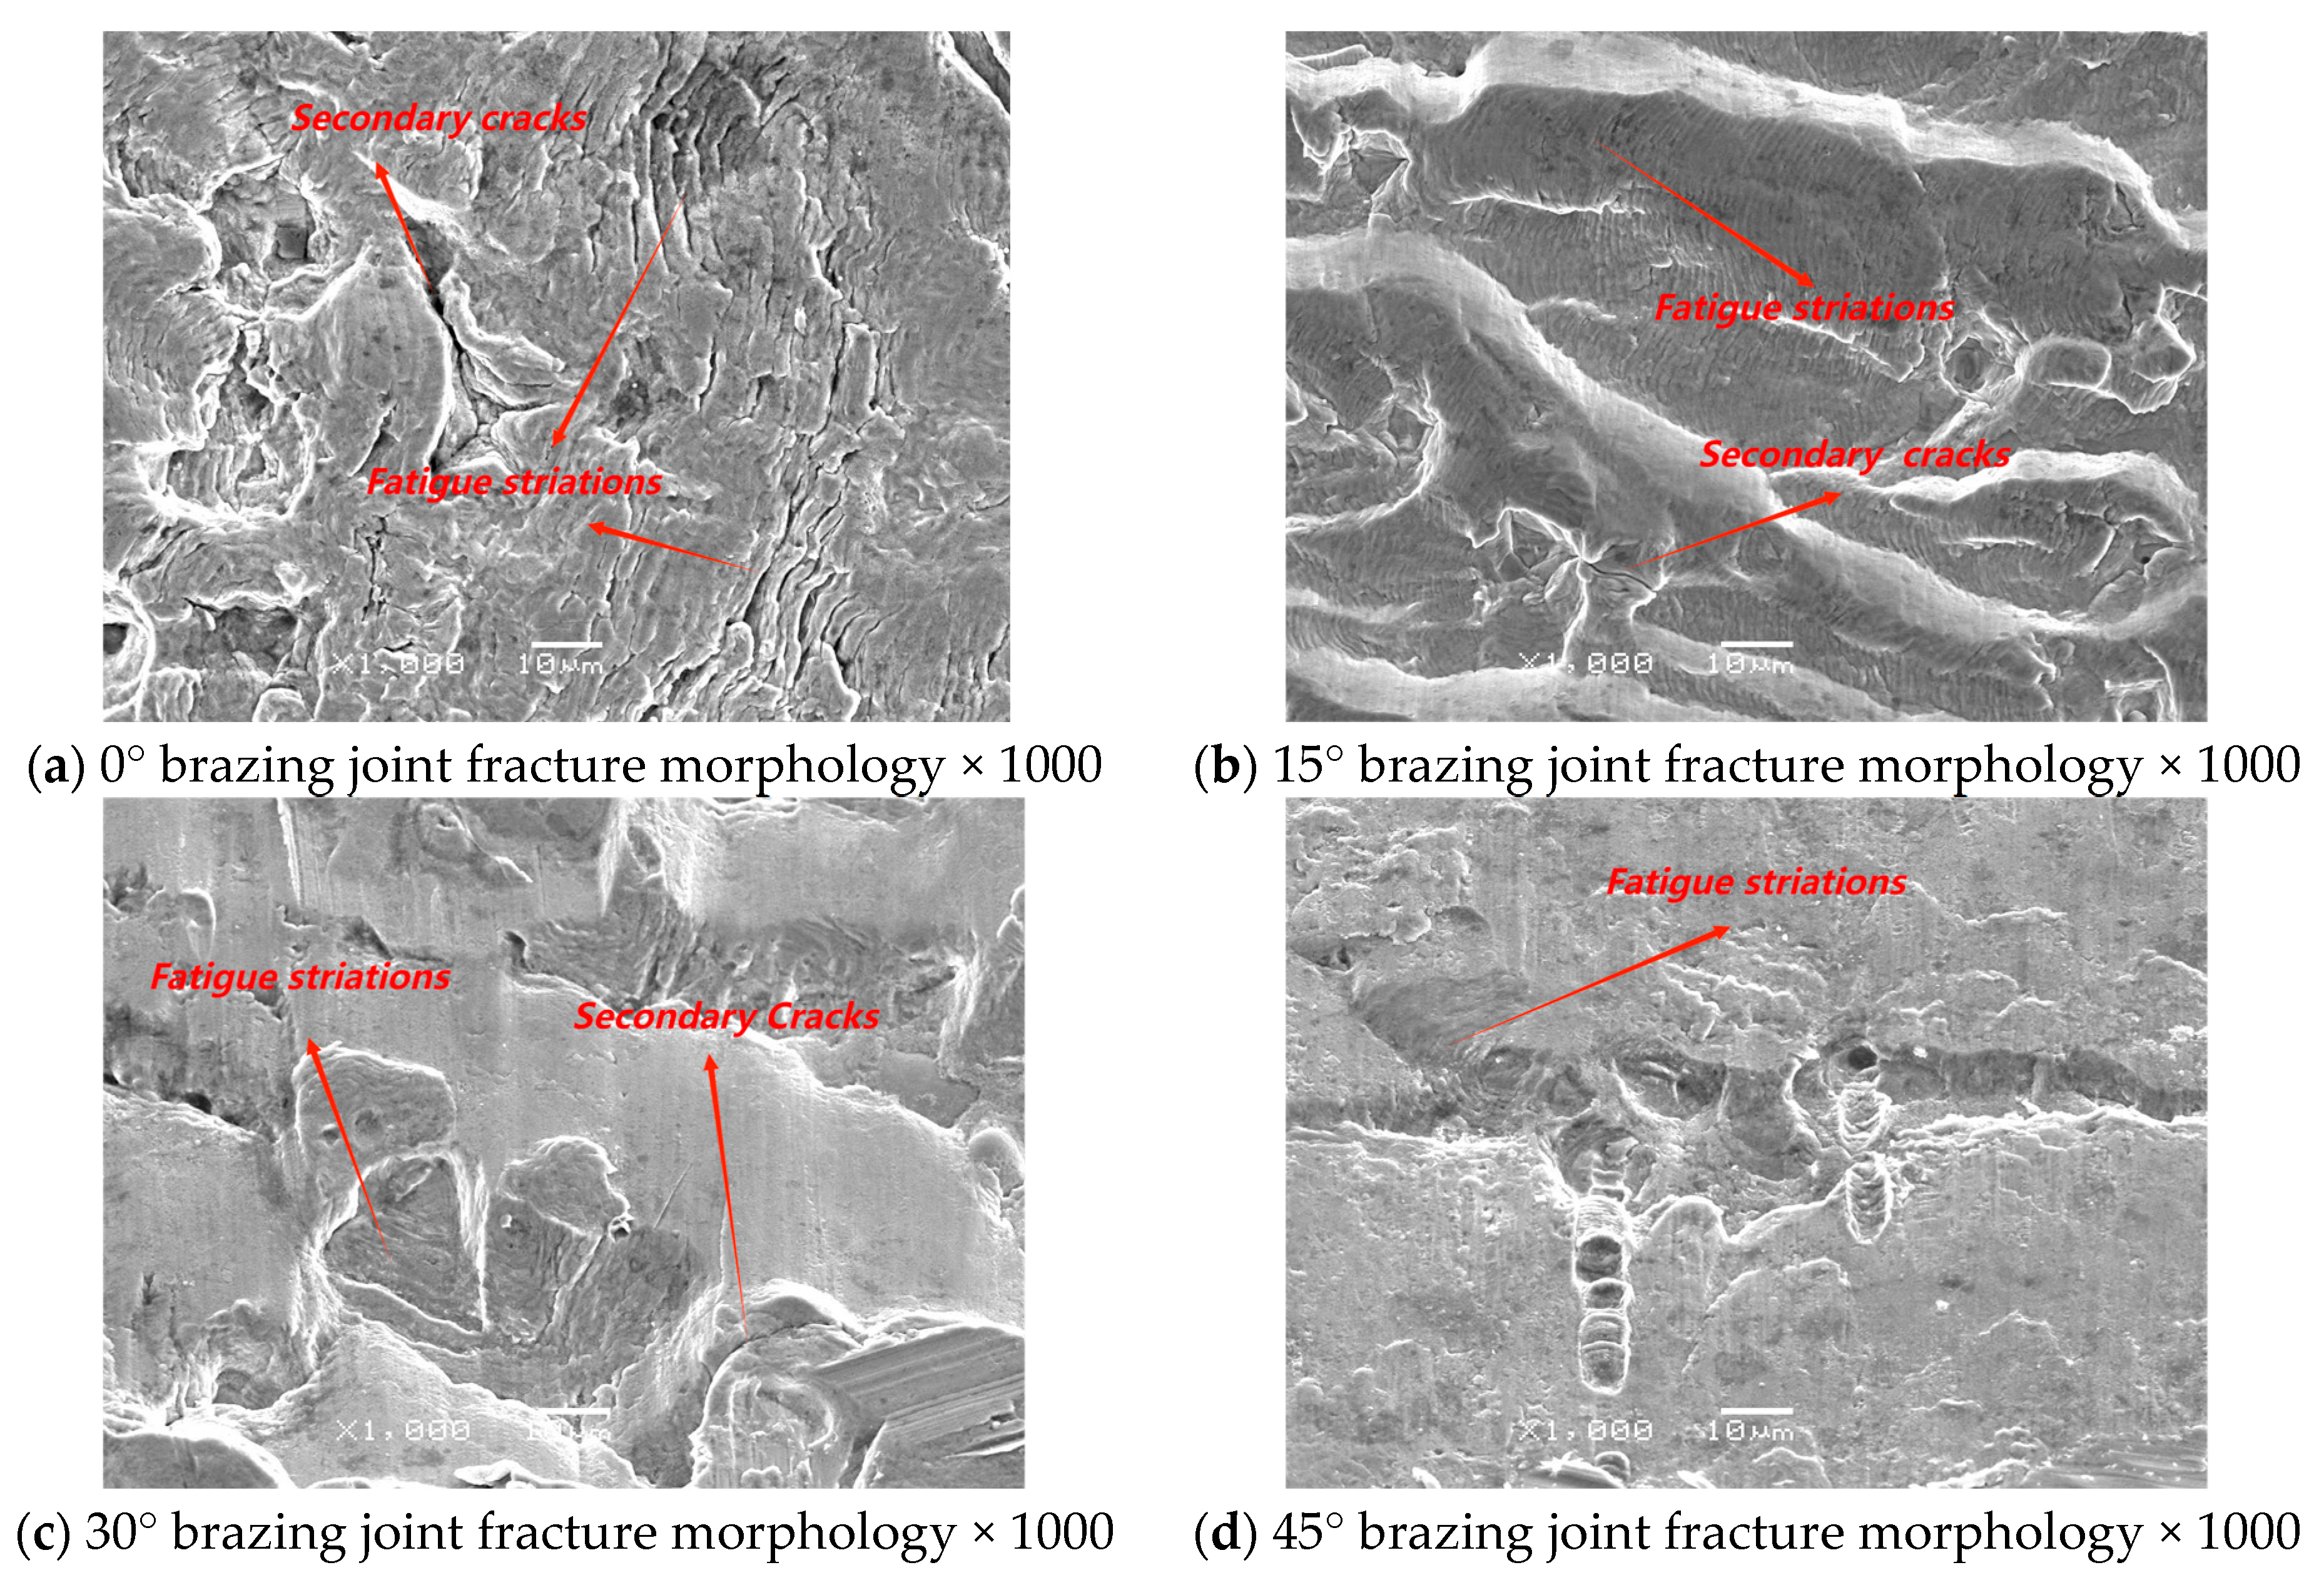
During the testing process, it was observed that the fracture occurred at the weld seam, and the interface failure of the brazing layer exhibited instantaneous and rapid propagation characteristics. Figure 7 illustrates the fatigue crack propagation fracture morphology of brazed joints at different angles. Microscopic analysis of the brazed joint fracture revealed that due to plastic fracture during fatigue loading, multiple micro-voids appeared at the fracture surface, accompanied by a large number of fatigue striations, which were evenly distributed. As can be seen in the figure, with the increase in butt angle, the area of the brazed joint scarf face increases, resulting in enhanced connection strength, while the width of secondary cracks and the number of fatigue striations gradually decrease.
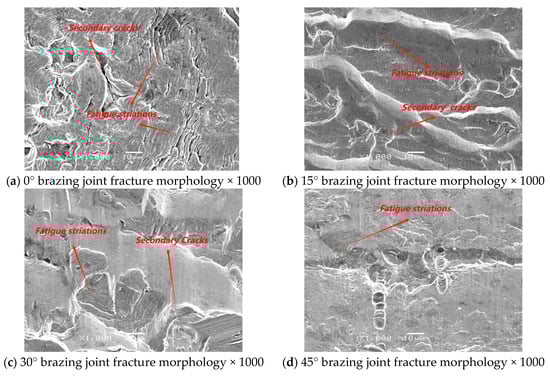
Figure 7.
Fracture morphology of butt brazing joints at different angles.
2. Theoretical Model
2.1. Bilinear CZM
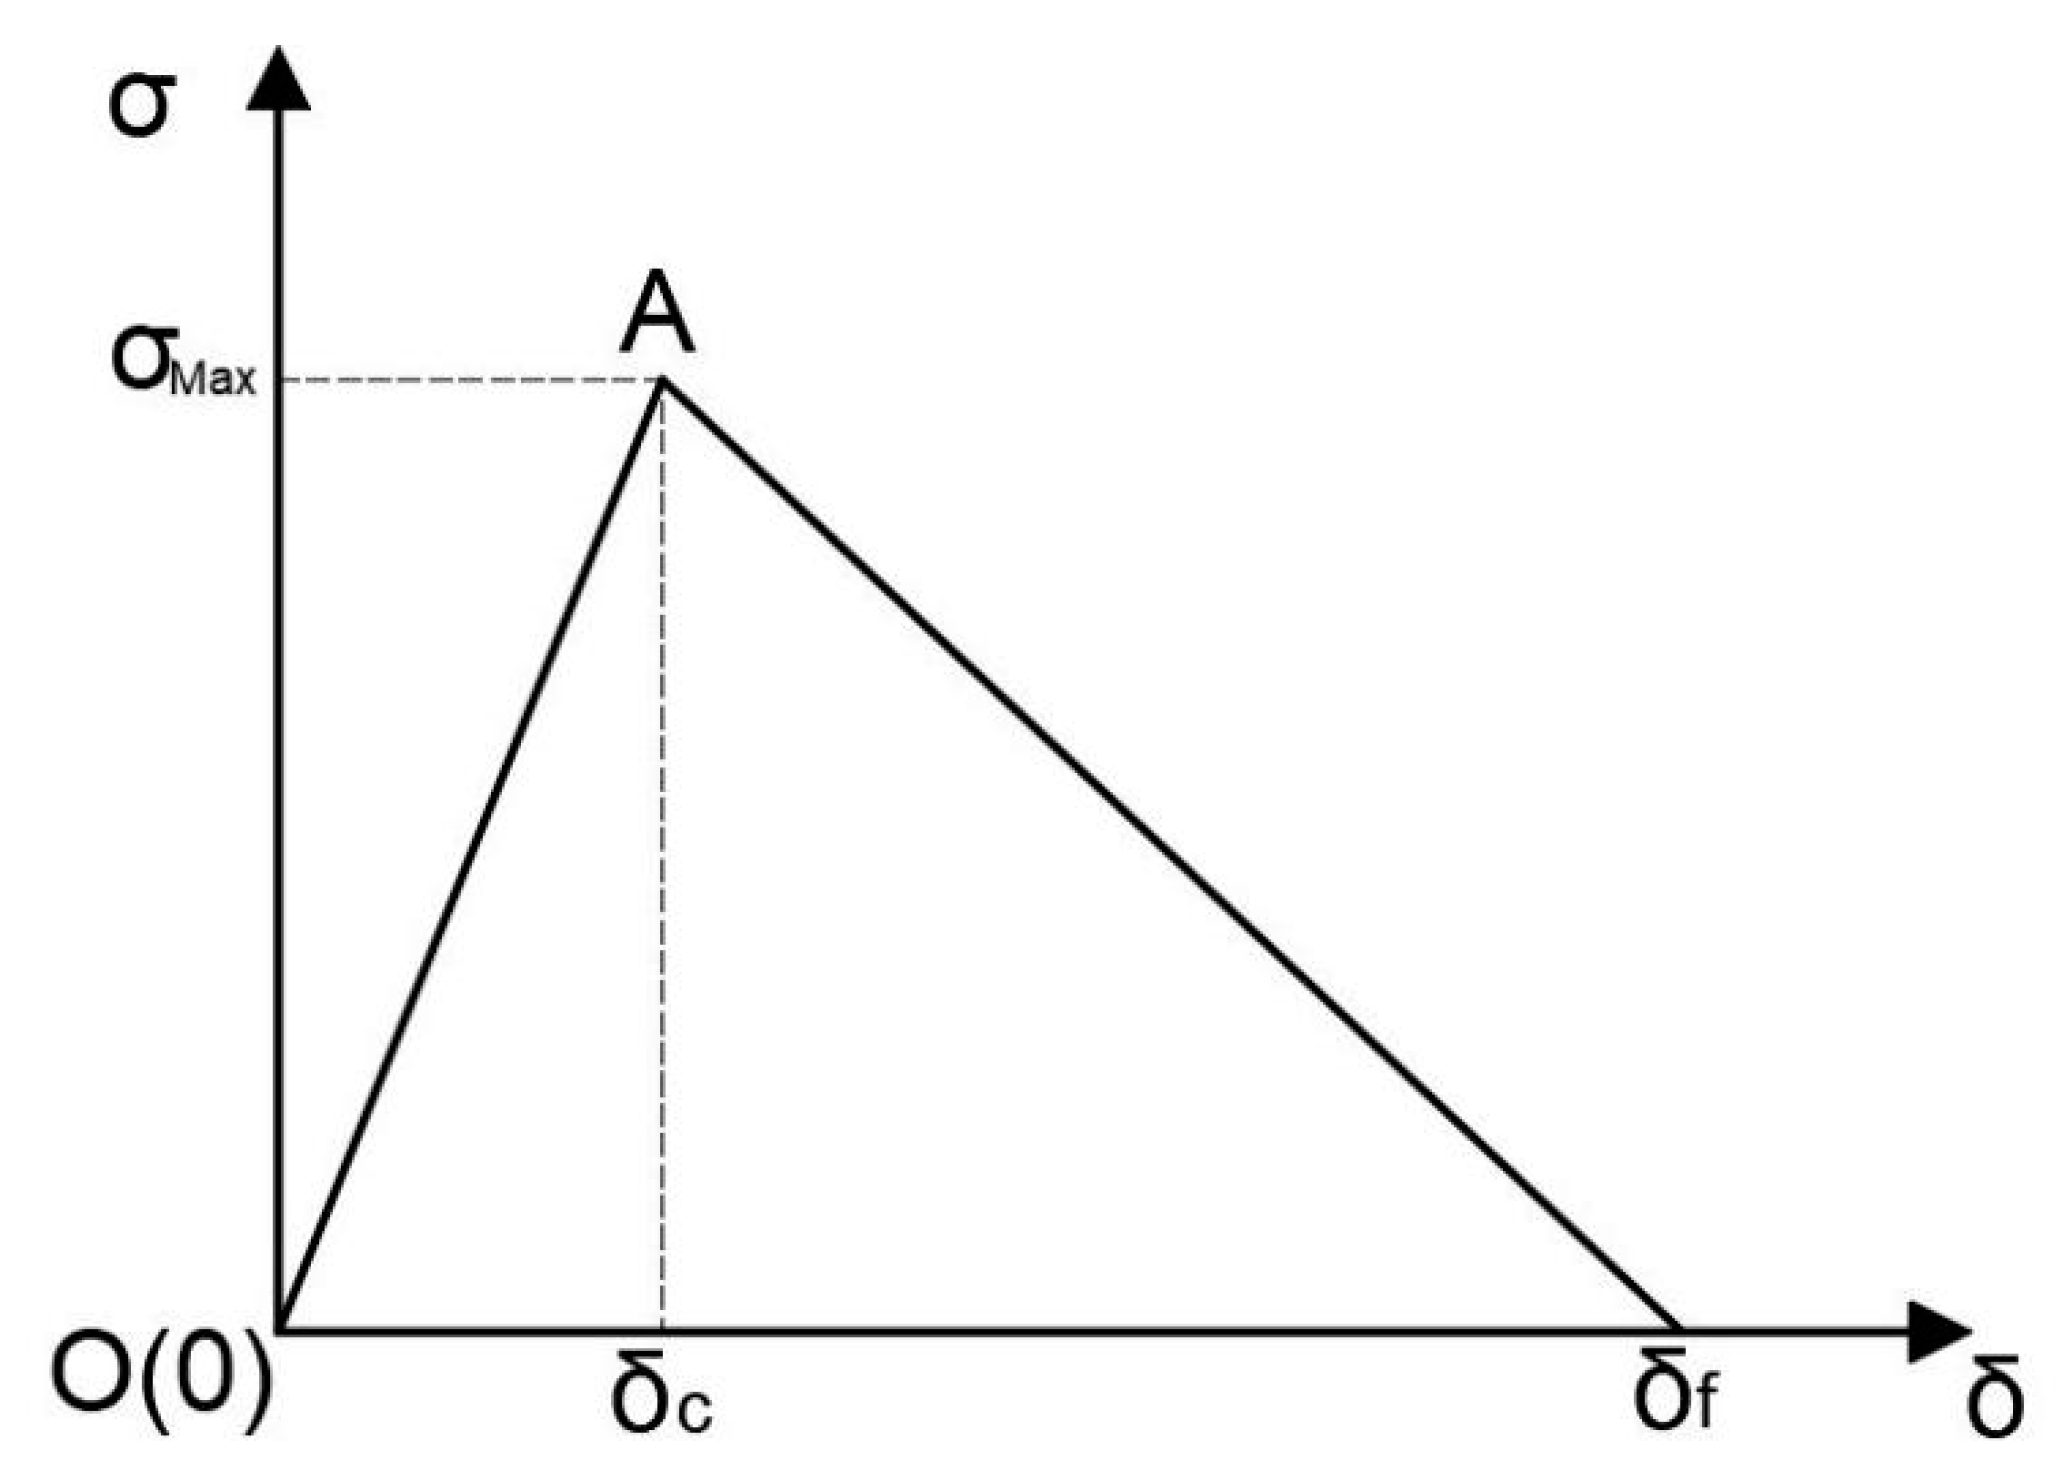
Based on the bilinear CZM, this study established a cyclic loading CZM. The bilinear CZM is shown in Figure 8.

Figure 8.
Bilinear CZM.
When the CZM reached the critical stress under loading, damage began to occur in the material layer. The crack propagation in the brazed joint manifests as a mixed-mode cracking pattern. The square stress criterion was adopted with the following formula [18]:
where , and represent the stresses in the normal direction and two tangential directions, respectively. , and indicate the stress intensity in the normal direction and two tangential directions. <> is the Macaulay symbol, representing any .
After the damage to the materials, the displacement-based damage evolution criterion [19] and energy-based Benzeggagh–Kenane (B-K) criterion were used [20].
Displacement-based damage evolution criterion can be calculated as follows:
where represents the separation displacement (mm); represents the critical displacement, and represents the failure displacement.
- (1)
- Energy-based B-K criterion:where and represent the fracture energy in the normal and tangential directions, respectively; , and represent the critical fracture energy in the normal and two tangential directions, respectively, and represents the material parameter.
2.2. Cyclic Loading of CZM
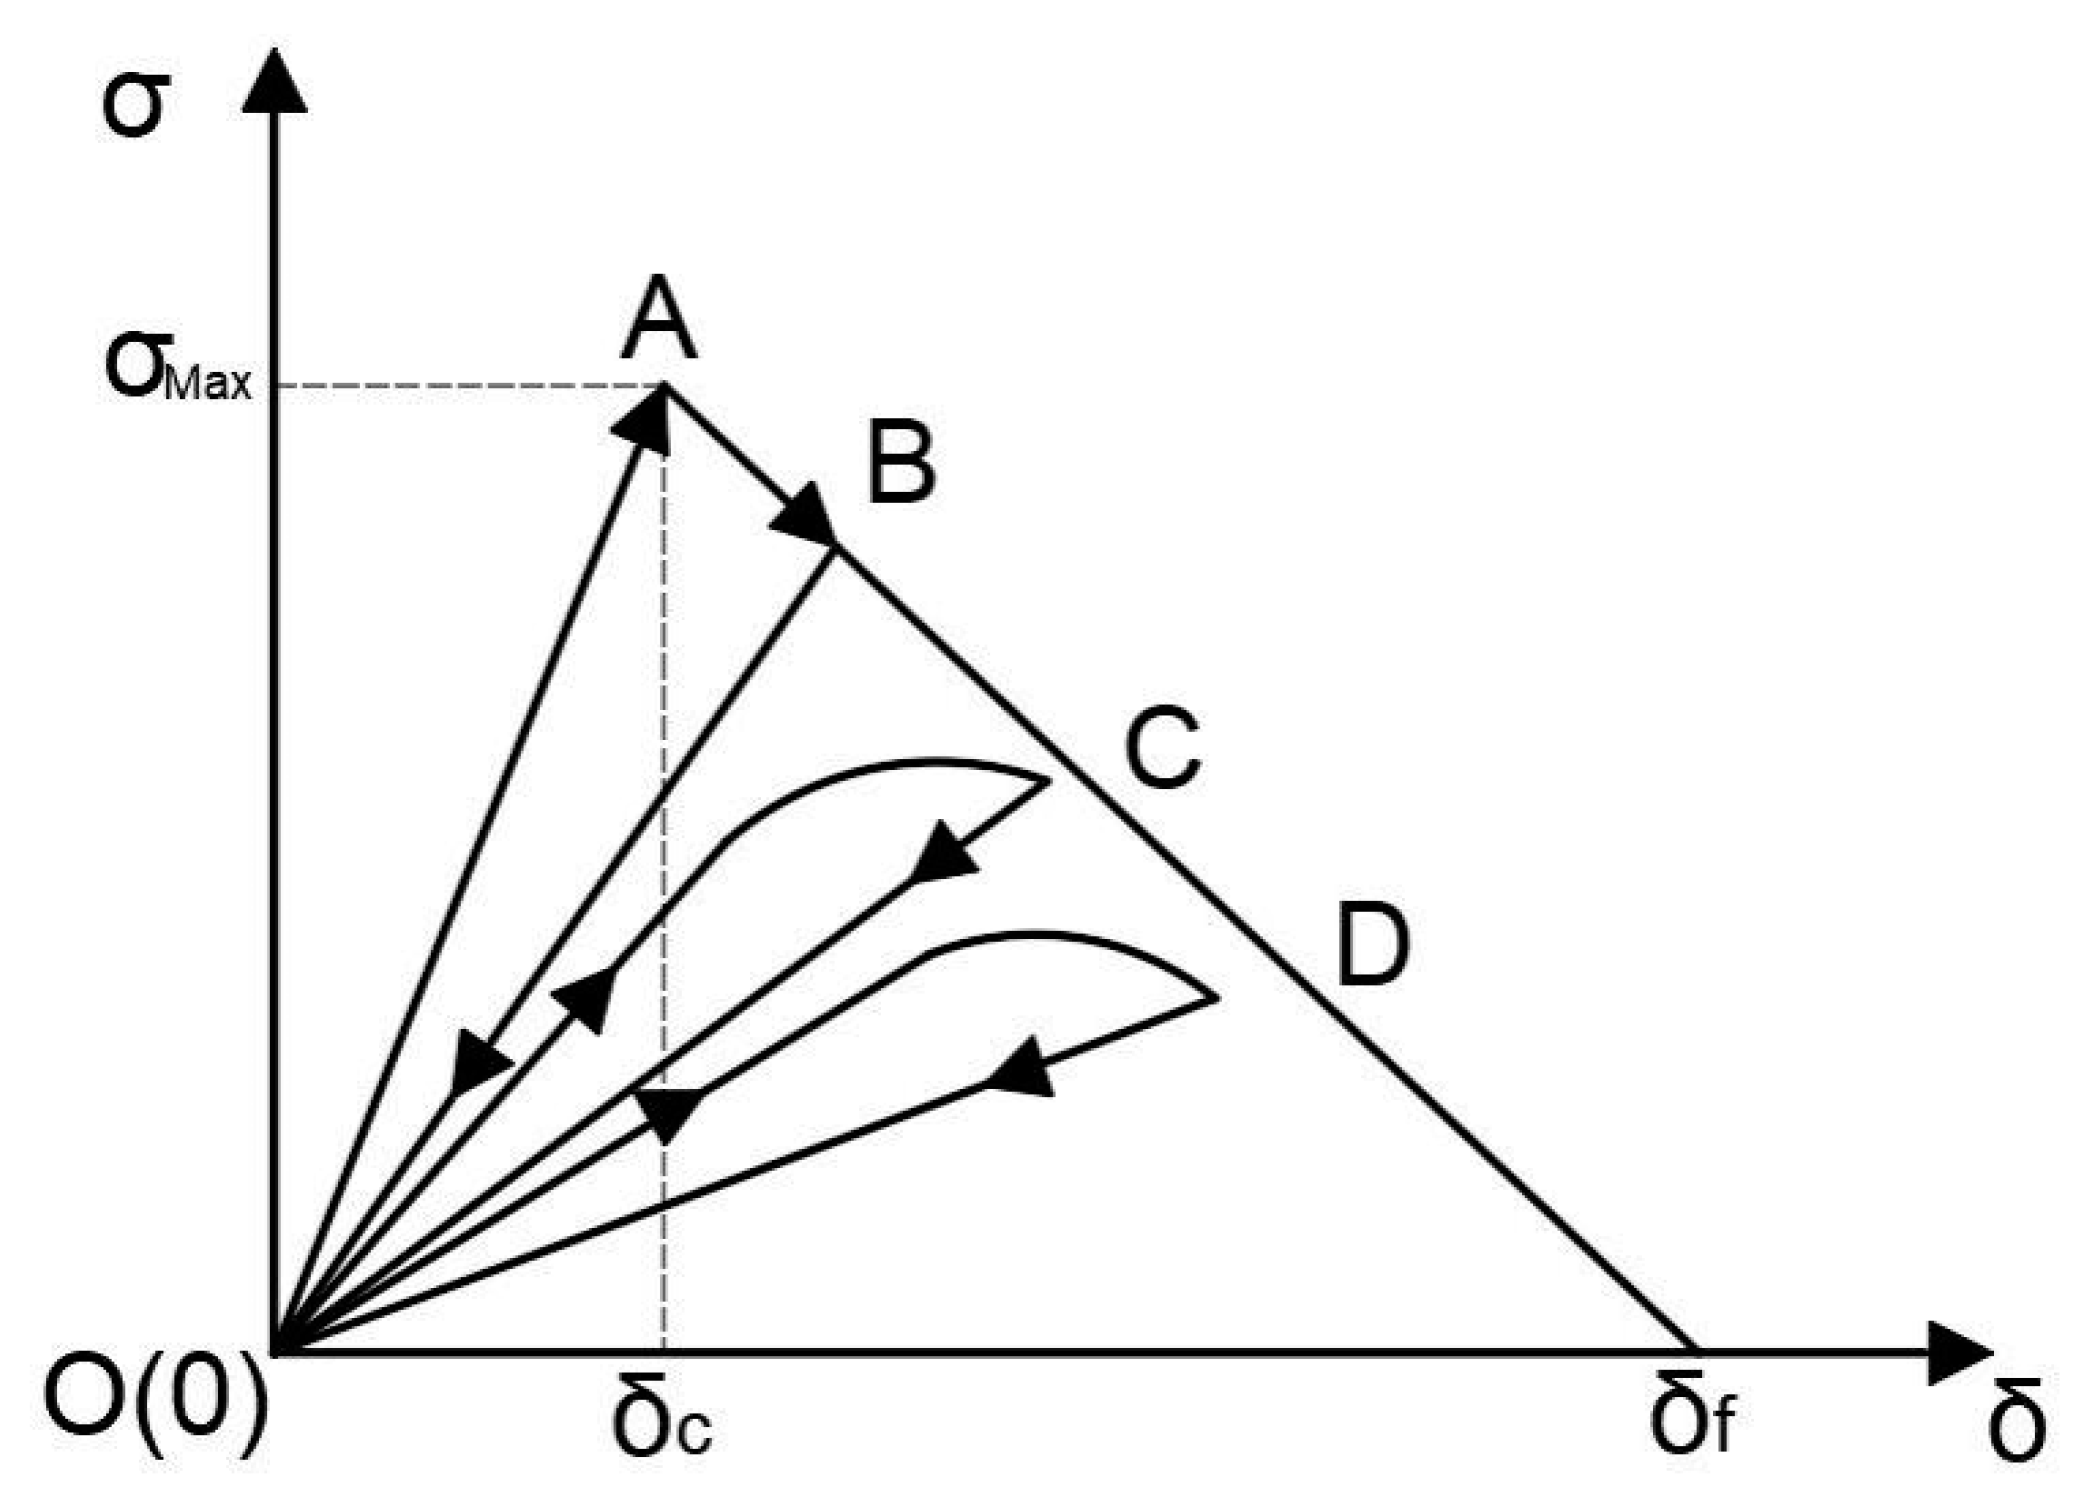
Figure 9 shows the damage evolution curve of the CZM under cyclic loading, which is divided into two stages: static and fatigue damage. When the loading displacement is within the range from 0 to the material undergoes elastic deformation during both loading and unloading, and the material stiffness remains constant. When the loading displacement is within the range of –, the loading curve is a broken line segment from O to A to B, and the unloading curve is a straight line segment from B to O. The material stiffness decreases, and the O→A→B→O stage represents the static damage stage. During cyclic loading, the loading and unloading curves are O→C→O, O→D→O,…, and the slope of the curves continuously decreases, representing the fatigue damage stage. As the number of cycles increased, the load was continuously loaded and unloaded; the cohesive stiffness value decreased to zero; the damage accumulation reached 1, and the cohesive zone element failed, leading to crack initiation and propagation.

Figure 9.
Cyclic loading of CZM.
- (1)
- Static loading–unloading phase
The stiffness K in the elastic deformation stage remained unchanged. During the static damage stage, when the loading displacement exceeds the critical damage displacement, damage parameter D is introduced, and the traction force formula is expressed as follows:
where and represent the normal and tangential stresses, respectively (MPa); represents the normal displacement, and and represent the two tangential displacements (mm).
Based on Equations (2)–(3), the static damage under the mixed loading mode in the normal and tangential directions can be transformed into the following formula:
where represents the critical displacement of damage under mixed loading (mm), and 2 represents the failure displacement for damage under mixed loading (mm).
- (2)
- Cyclic loading–unloading phase
After the first static loading–unloading cycle, the fatigue equation must be determined based on the static damage. In this section, the fatigue damage equation proposed by Roe [21] is adopted. When considering mixed loading, the fatigue equation is transformed into
where represents the fatigue damage corresponding to the strain value during each loading; represents the strain increment; represents the current strain value; represents the critical displacement for damage; represents the current stress, and represents the current critical stress for damage. A, B, and represent fatigue damage parameters.
The total damage accumulation in the cyclic CZM is the sum of static and cyclic damages. The total damage under the mixed loading mode of normal and tangential directions is obtained as
Through the accumulation of damage in these two stages, when the cyclic damage of the material reached a maximum value of 1, the stiffness decreased to 0, indicating crack propagation and ultimate failure.
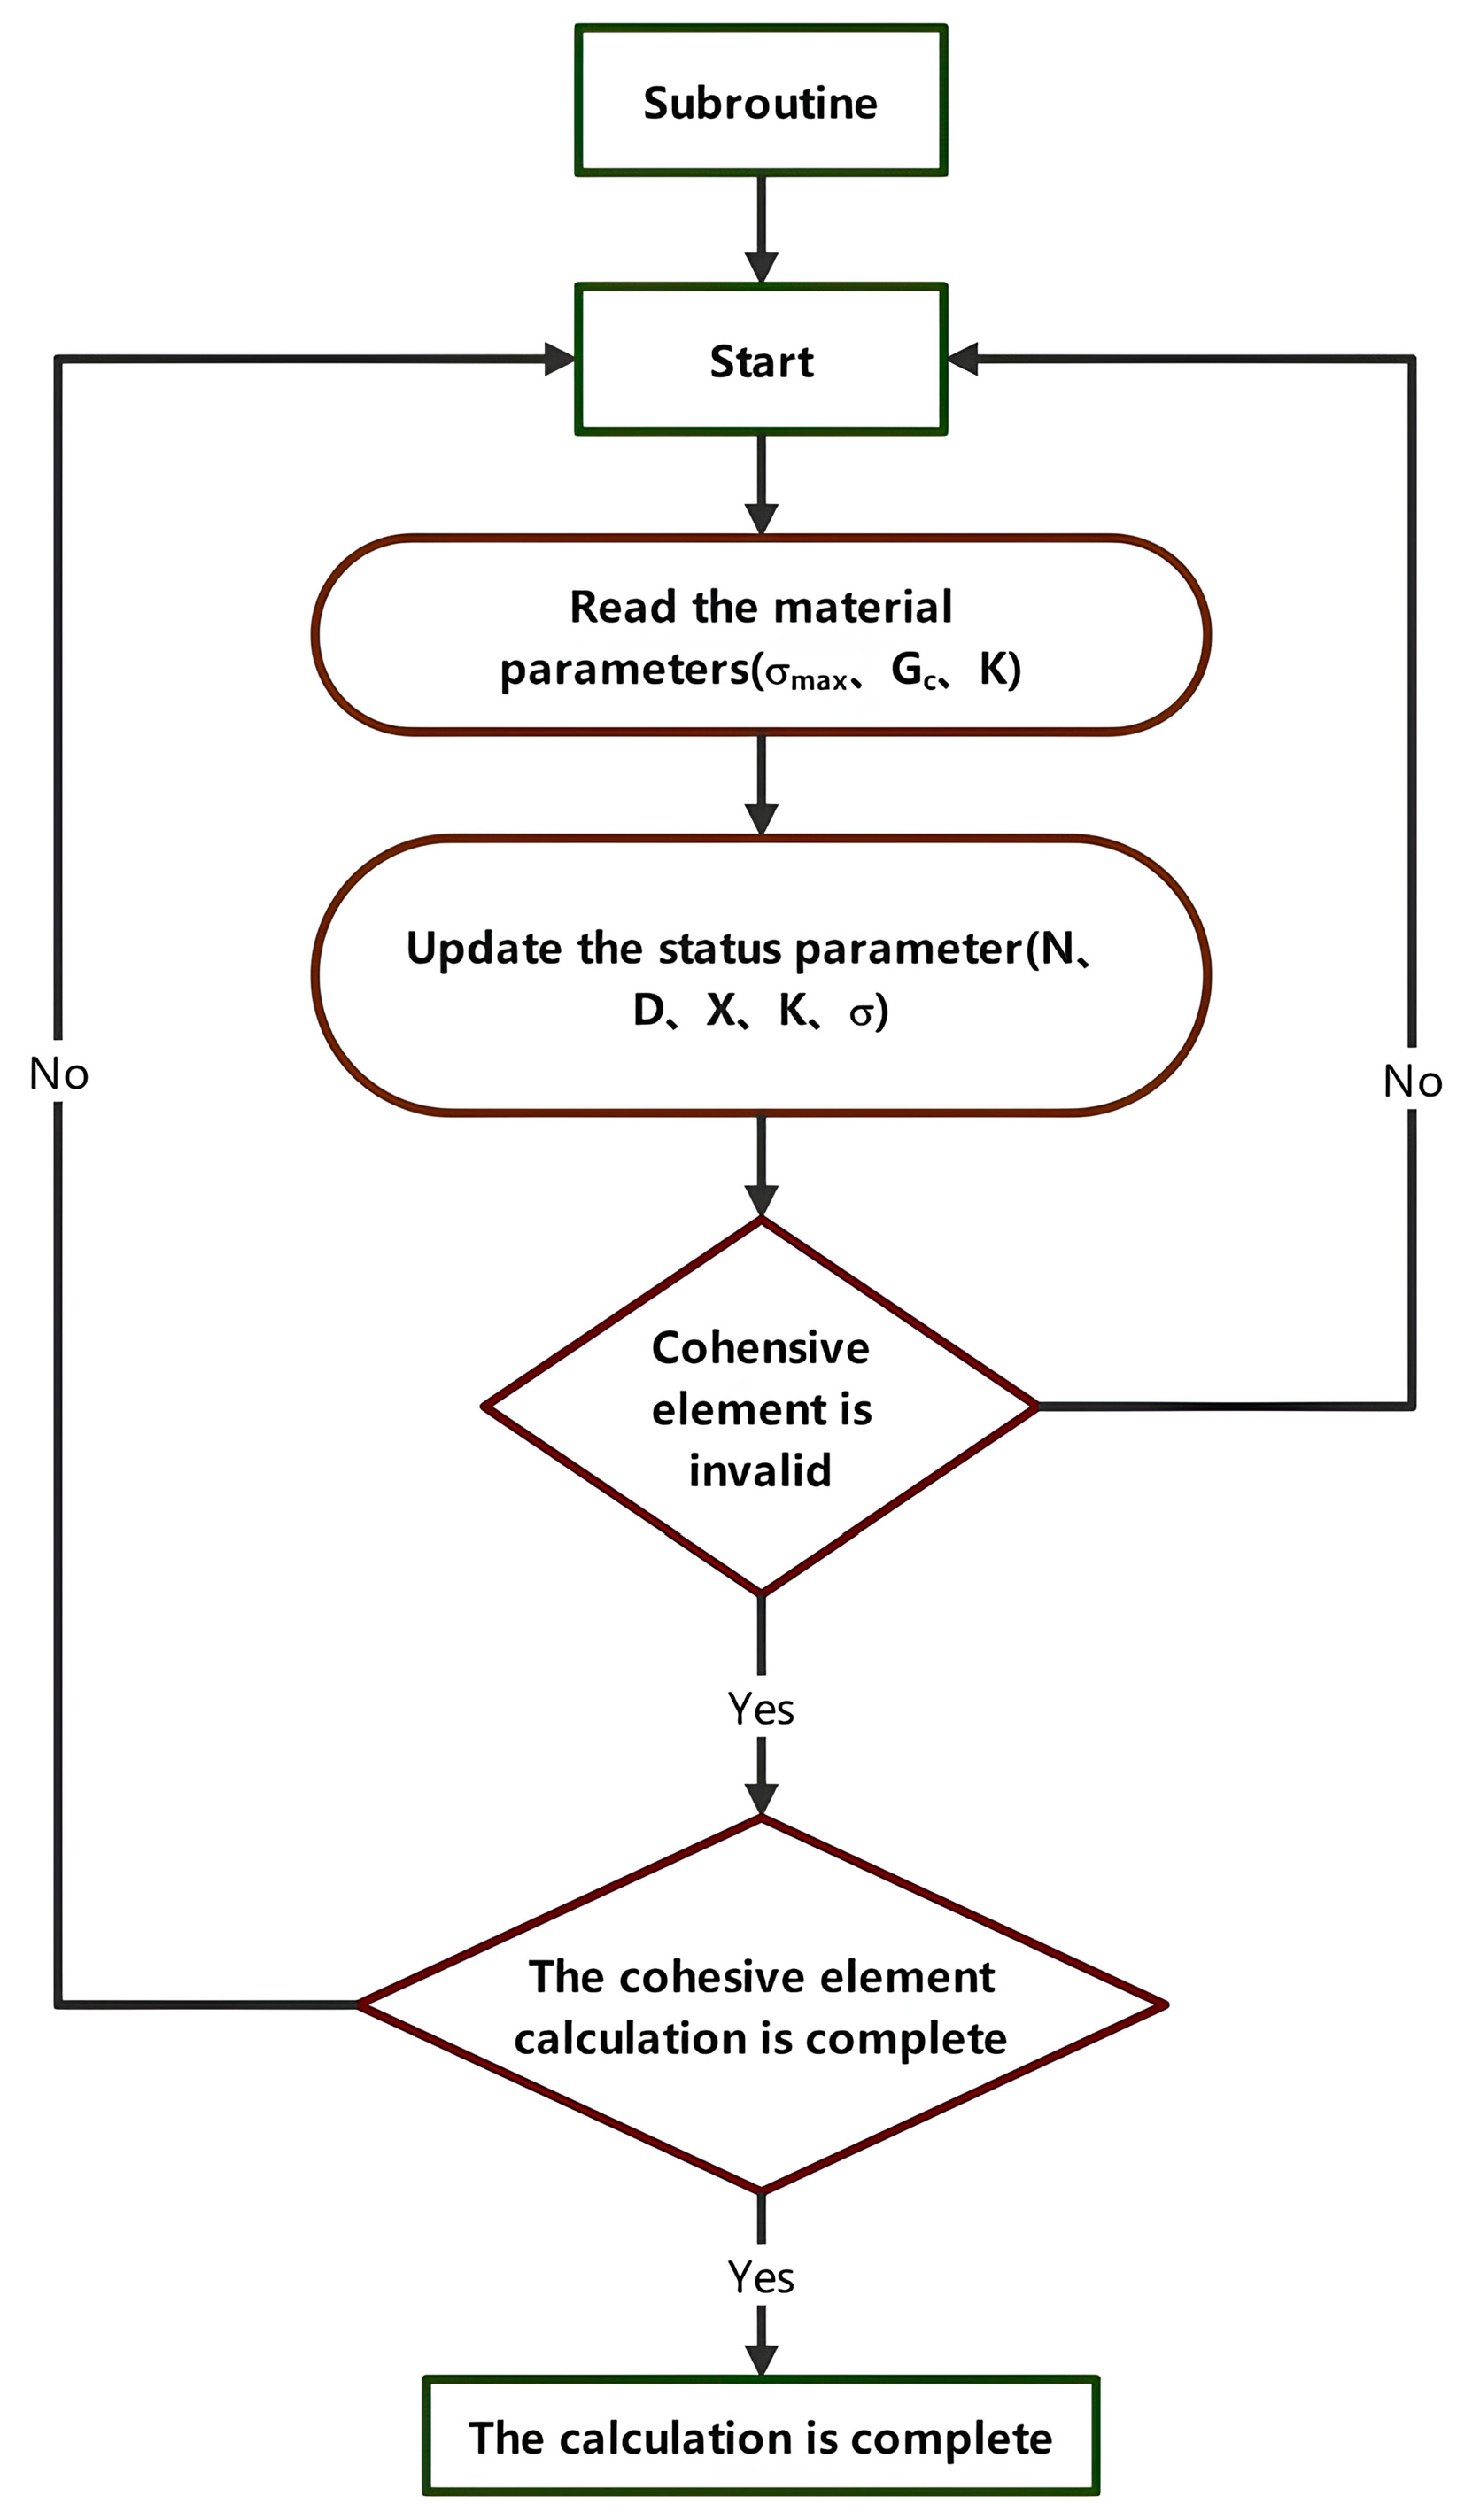
Based on the above theoretical model, the VUMAT subroutine is compiled to read the basic parameters of the cohesive zone model in the ABAQUS software. Combined with the subroutine, the failure calculation of cohesive elements is performed. The calculation steps are shown in Figure 10.
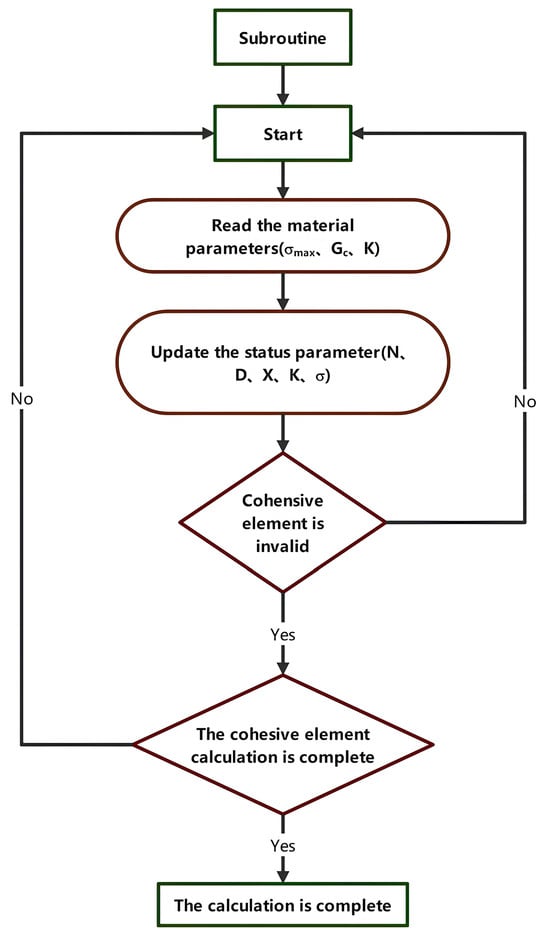
Figure 10.
VUMAT calculation flow chart.
3. Finite Element Simulation Analysis
3.1. Model Building
A finite element model of the butt-brazed joints was established using the structural dimensions of the specimen, as shown in Figure 1. The ABAQUS finite element software combined with the VUMAT subroutine was used to analyze the critical damage stress and fatigue life. The finite element model is shown in Figure 11. The base material element is C3D8R, while the three-dimensional cohesive element COH3D8 was selected for the brazed weld area. The cohesive and base material elements were connected using shared nodes. The mesh size of the cohesive element is 0.1 mm. The mesh size of the base material element is 0.8 mm, which satisfies the mesh independence test.
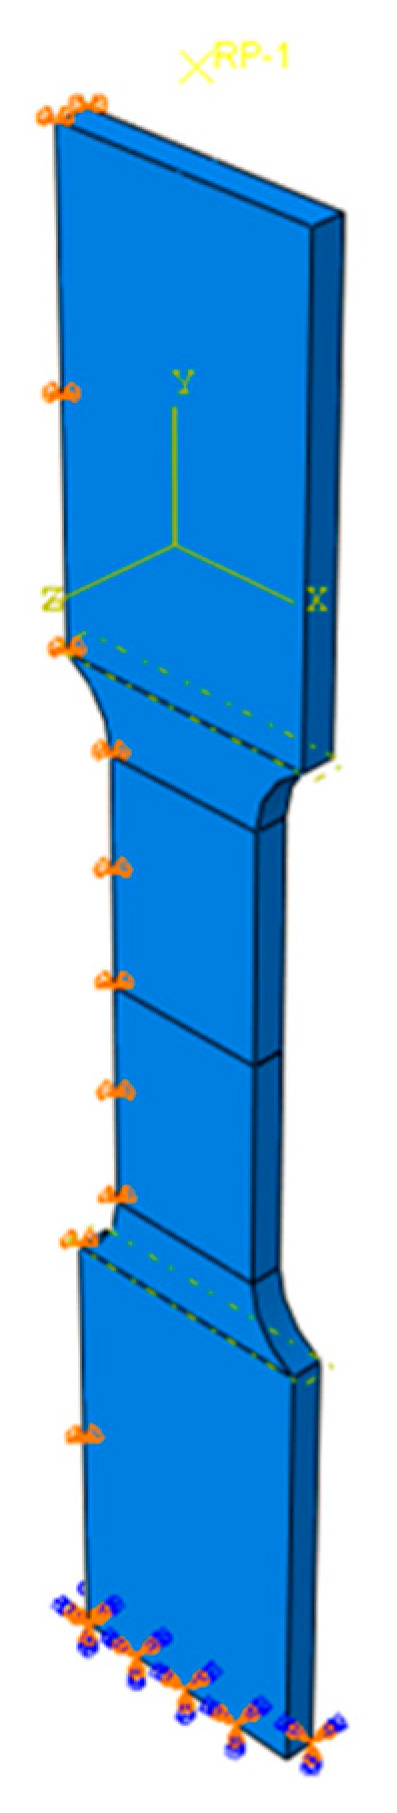
Figure 11.
Finite element models and local meshes.
The lower end of the model was fixed with constraints; the side of the model was subject to horizontal displacement and rotation angle constraints, while static and fatigue cyclic displacements were applied to the upper end of the model.
3.2. Analysis of Results
3.2.1. Analysis of the Results of the Stretch Simulation
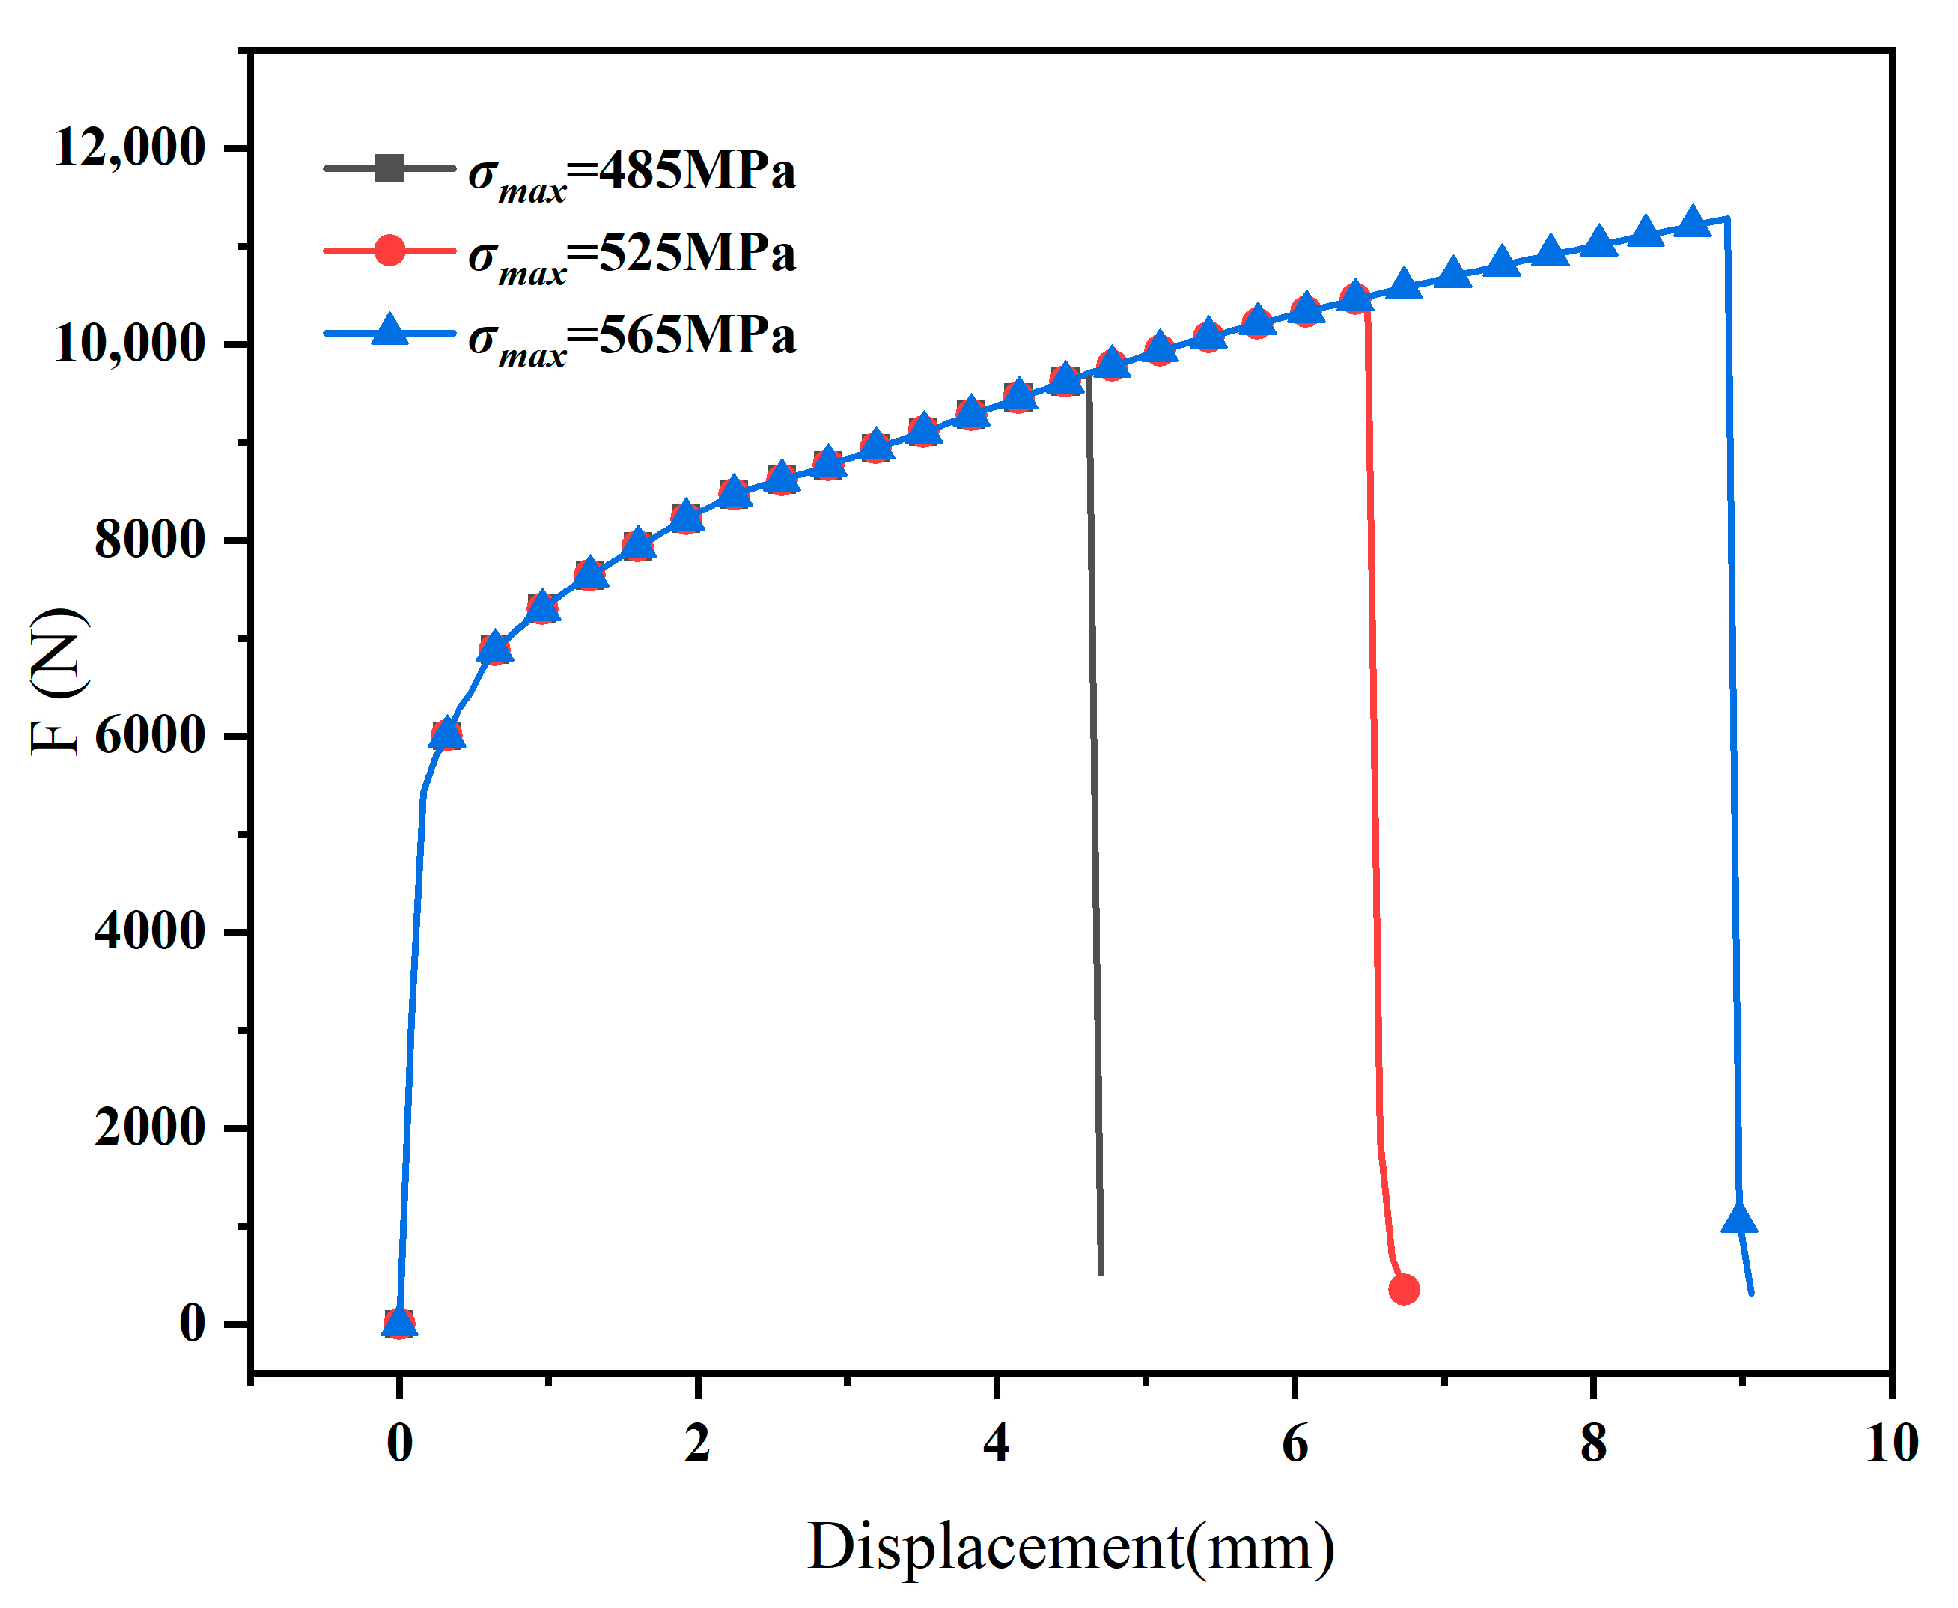
Figure 12 shows the load-displacement curves under different critical damage stresses = [485 MPa, 525 MPa, 565 MPa]. The load gradually increased with the tensile displacement, and the specimen fractured when it reached its maximum value. Table 3 lists the errors between the simulated and experimental values of the fracture load under different values. When the simulated value of was 525 MPa, the error between the fracture load and experimental value was 1.3%, which was the smallest error. Therefore, the critical damage stress of the CZM for the butt-brazed joint was determined to be 525 MPa.
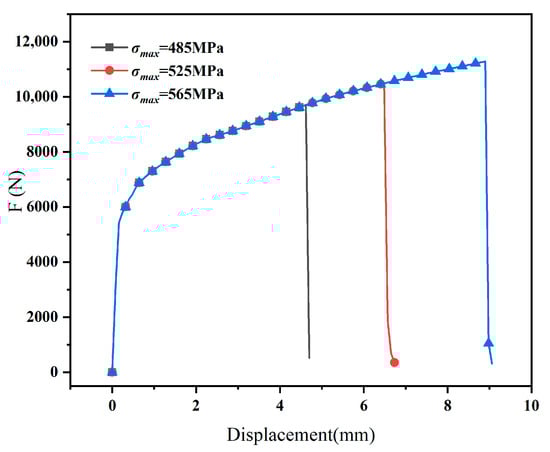
Figure 12.
Load displacement curves under different critical damage stresses .
Table 3.
The error between the simulated value of the fracture load and the test value.
3.2.2. Analysis of Fatigue Simulation Results
By introducing the damage extrapolation technique proposed by Ural [22], a scaling function f(n) = n was defined to reasonably extrapolate the damage and improve the computational efficiency. Based on the fatigue test results, under a cyclic displacement of X = 0.5 mm, the fatigue life of the butt-brazed joint was 55,219 cycles. By selecting scaling coefficients of f(n) = [600, 700, 800, 900, 1000], the impact of the scaling coefficient on the fatigue life of the brazed joint is analyzed. Table 4 lists the fatigue life corresponding to different scaling coefficients and the experimental errors. When f(n) = 800, the error between the simulated fatigue life and experimental value is the smallest. Therefore, a scaling coefficient of f(n) = 800 was used for all subsequent analyses.
Table 4.
Fatigue life and test error corresponding to different scaling factors.
3.2.3. Fatigue Life Test Value Compared with Simulated Value
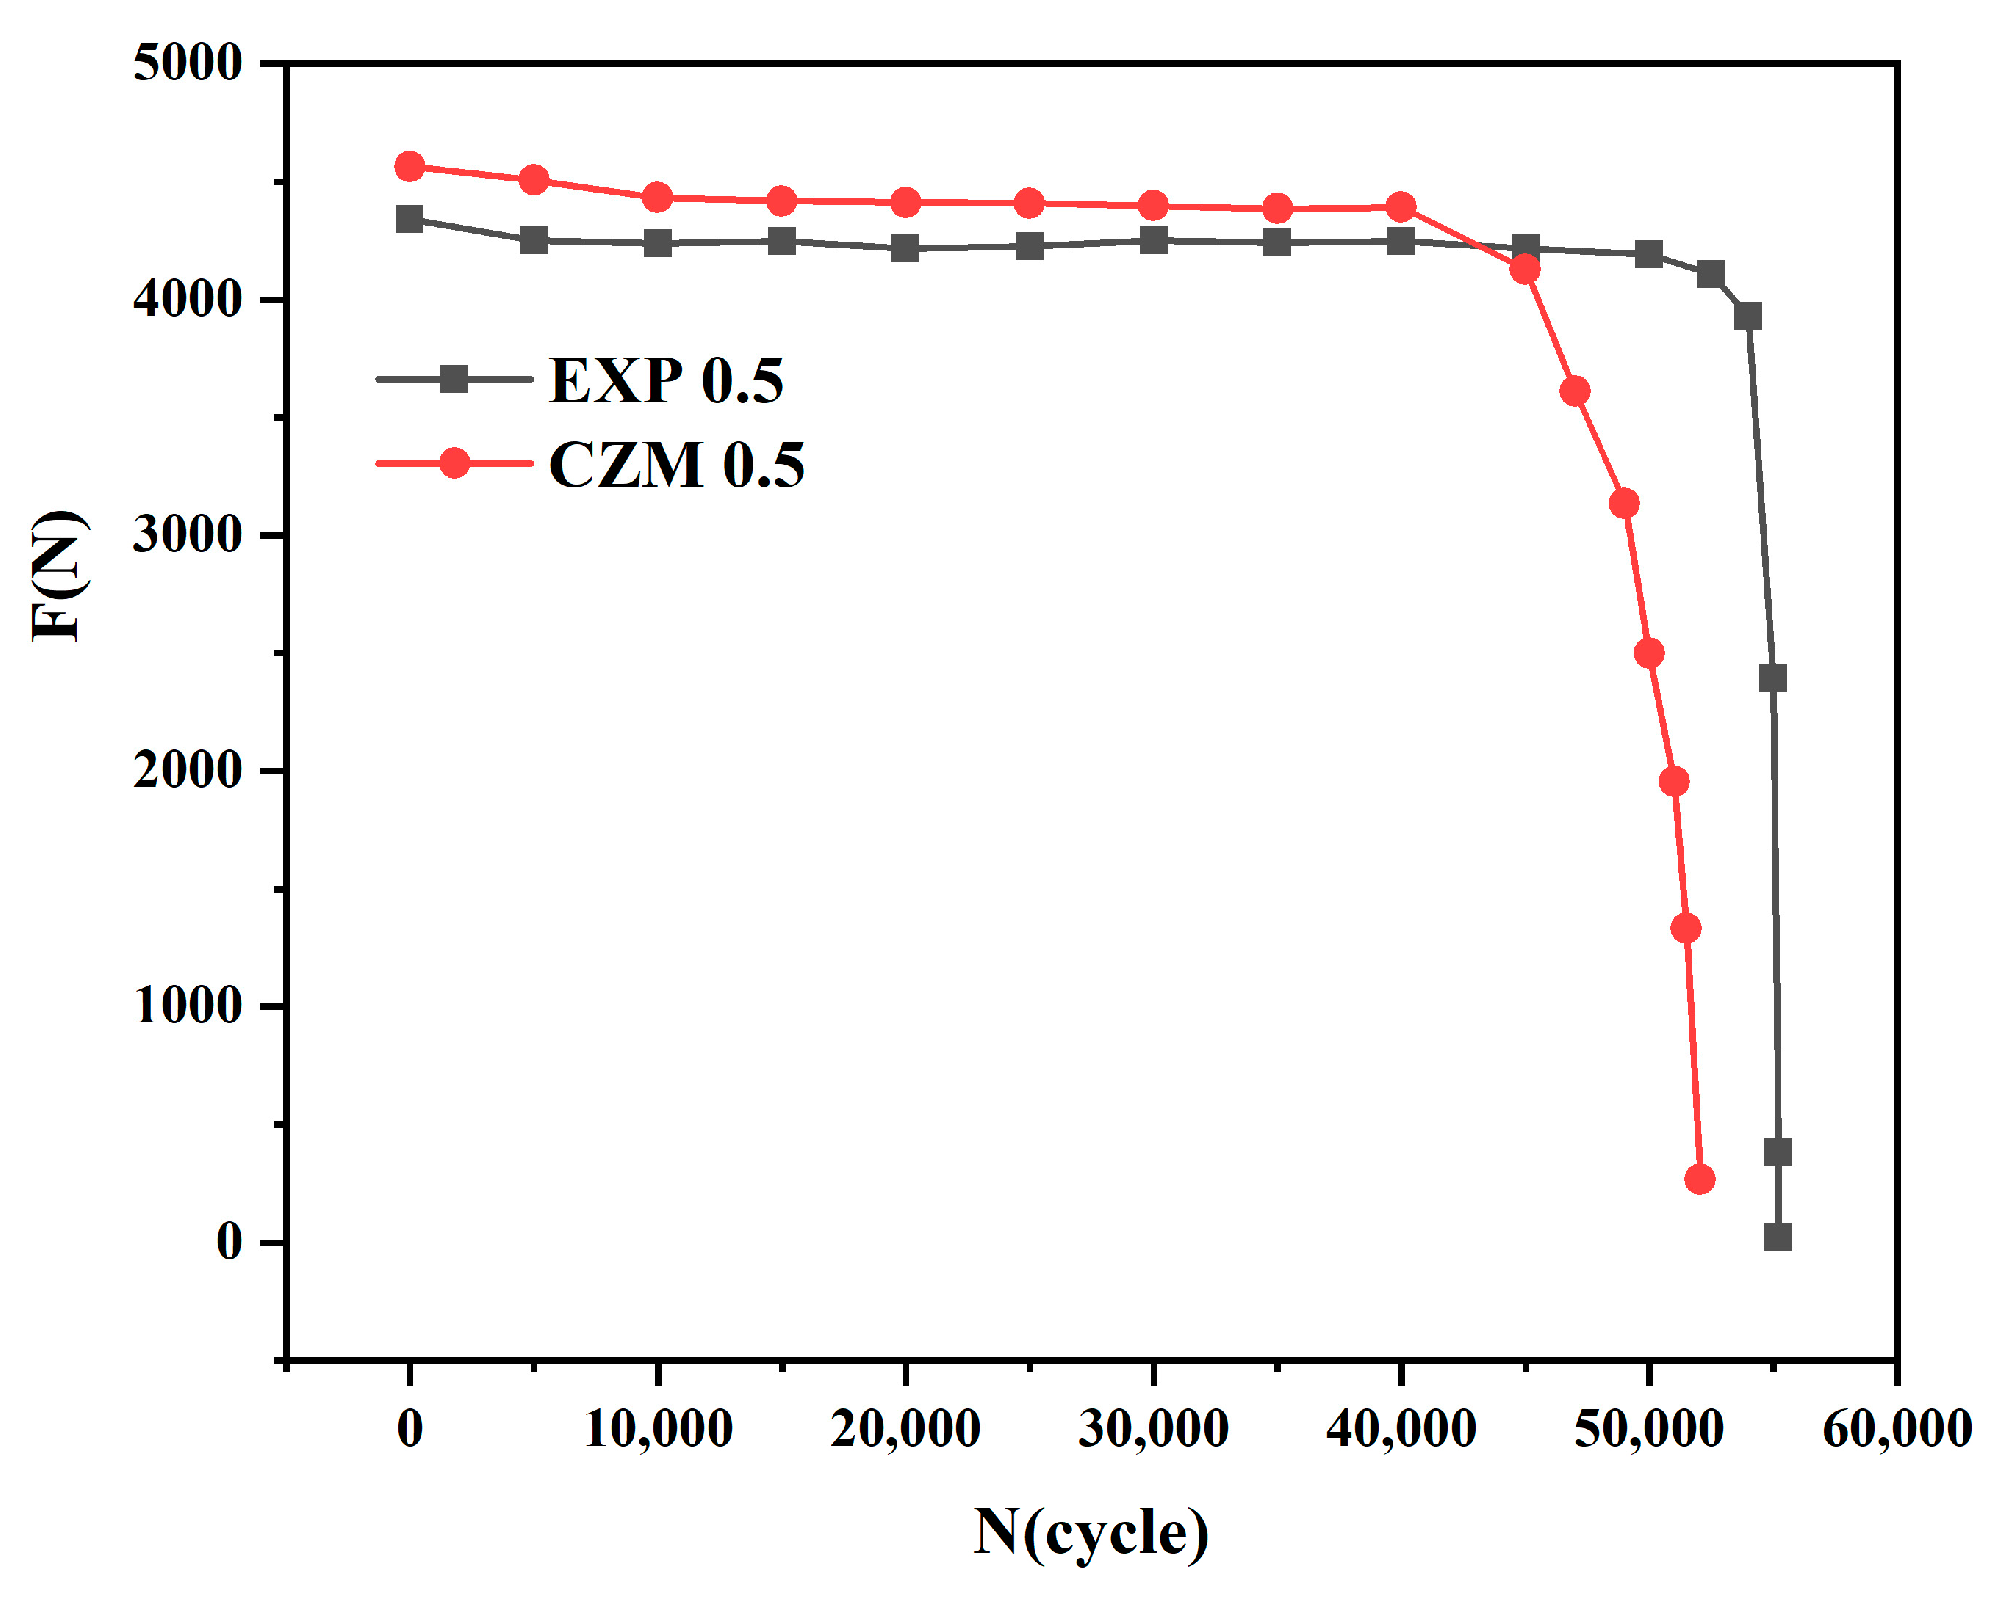
Figure 13 compares the experimental and simulated load-life curves of the butt-brazed joint under a cyclic displacement of X = 0.5 mm. Table 5 presents a comparison between the simulated and experimental cyclic life values under cyclic displacements of X = [0.4 mm, 0.5 mm, 0.6 mm], with error percentages of 9.09%, 4.38%, and 4.11%, respectively. These error values fall within a reasonable range, verifying the accuracy of the VUMAT subroutine for the cyclic CZM.
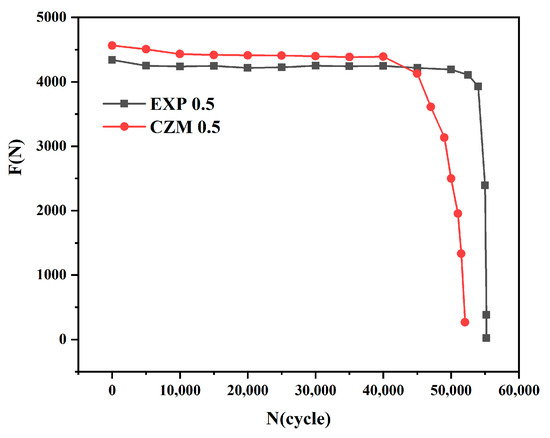
Figure 13.
Comparison of the test value of the load-life curve with the simulated value.
Table 5.
Fatigue life test and simulation error comparison.
3.2.4. Crack Propagation Analysis
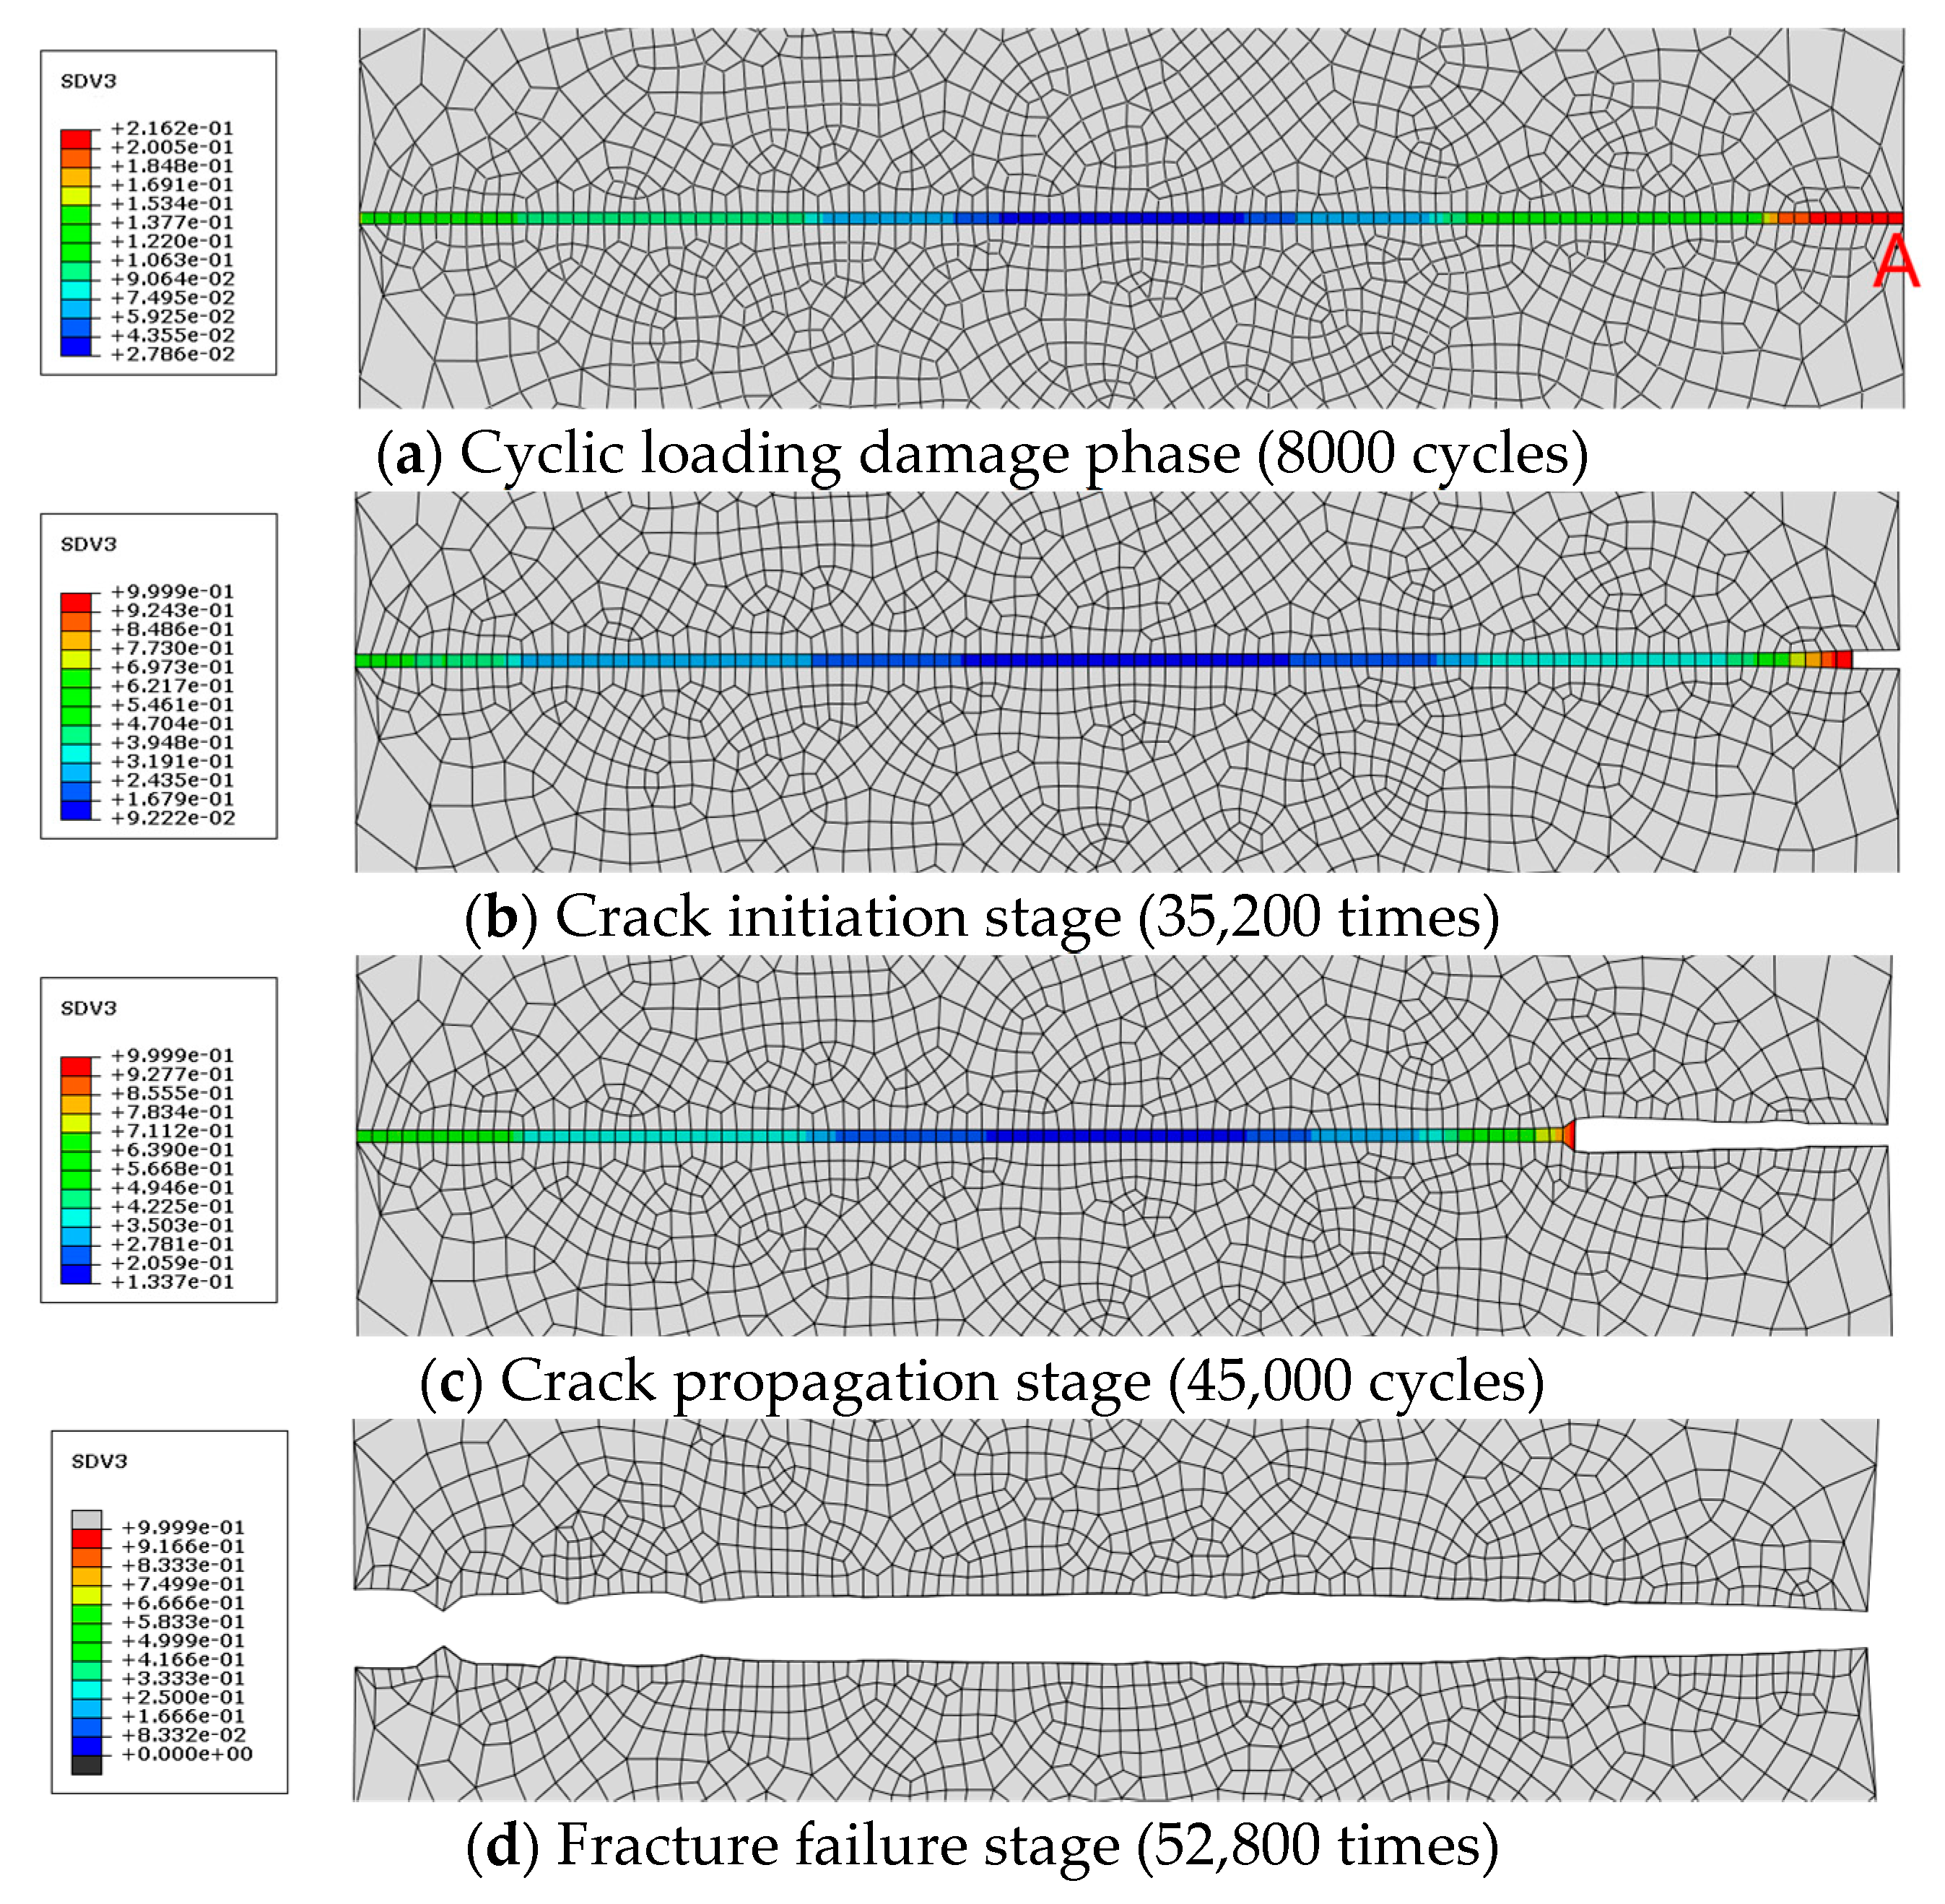
Figure 14 shows the distribution of the cohesive-zone element damage in the brazed weld during the fatigue cycles under a cyclic displacement of U = 0.5 mm. During the cyclic loading process of the butt-brazed joints, damage first appeared at the edge of the brazed interface layer as the number of cycles N increased. When the damage reached the maximum value of 0.9999, the cohesive element failed and was removed, and a crack initiated and propagated toward the center until the final fracture occurred.
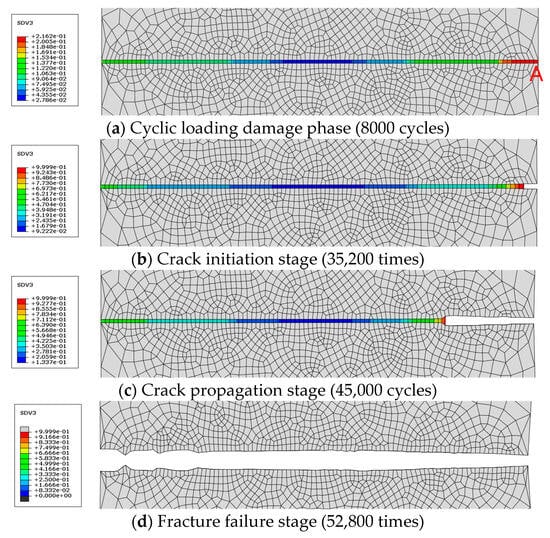
Figure 14.
Damage distribution of cohesive units at different cycles.
Figure 14a shows the initial stage of the cycle, where SDV3 (solution-dependent state variables 3) represents the total damage value D. When the number of cycles was 8000, the total damage was D = 0.0712, indicating that the cohesive zone element has not yet reached the critical damage value and no cracks formed in the brazed layer.
Figure 14b shows the crack initiation stage. After 35,200 cycles, the first cohesive zone element reached a total damage value of D = 0.9999, leading to its failure and deletion, resulting in crack initiation.
Figure 14c shows the crack propagation stage. As the number of fatigue cycles increased, damage accumulated continuously. When the number of cycles reached 45,000, the number of cohesive zone elements that failed and were deleted increased, and the crack length increased accordingly.
Figure 14d represents the fracture failure stage. When the number of cycles reached 52,800, all the cohesive zone elements failed and were removed, leading to fatigue failure and fracture of the butt-brazed joint.
To further illustrate the damage status of the cohesive elements, we selected the first cohesive element with fatigue failure, as shown in point A in Figure 14a, and analyzed the damage variation rate of the cohesive element under different numbers of cycles. When the number of cycles is 10,000, the slope k of the corresponding point on the curve is 1.310 × 10⁻⁵, indicating that the damage variation rate is 1.310 × 10⁻⁵. When the number of cycles increases to 20,000, the damage variation rate of the corresponding point is 2.275 × 10⁻⁵. As the number of cycles further increases to 30,000, the damage variation rate of the corresponding point becomes 4.684 × 10⁻⁴. The results indicate that during the initial stages of the cycles, the damage accumulated slowly at a lower rate (Figure 15). As the number of cycles increased, the damage accumulation rate also increased, leading to a rapid increase in damage and a decrease in material stiffness. When the damage reached 0.999, the cohesive element failed and was removed, which resulted in crack initiation.
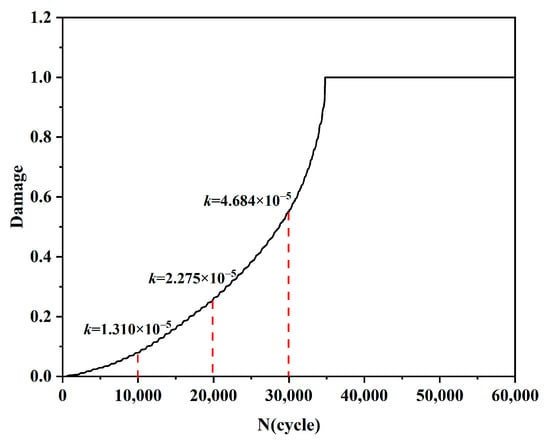
Figure 15.
Damage accumulation curve.
3.3. Analysis of Influencing Factors of Fatigue Life of Brazed Joints
3.3.1. Cyclic Displacement Effects
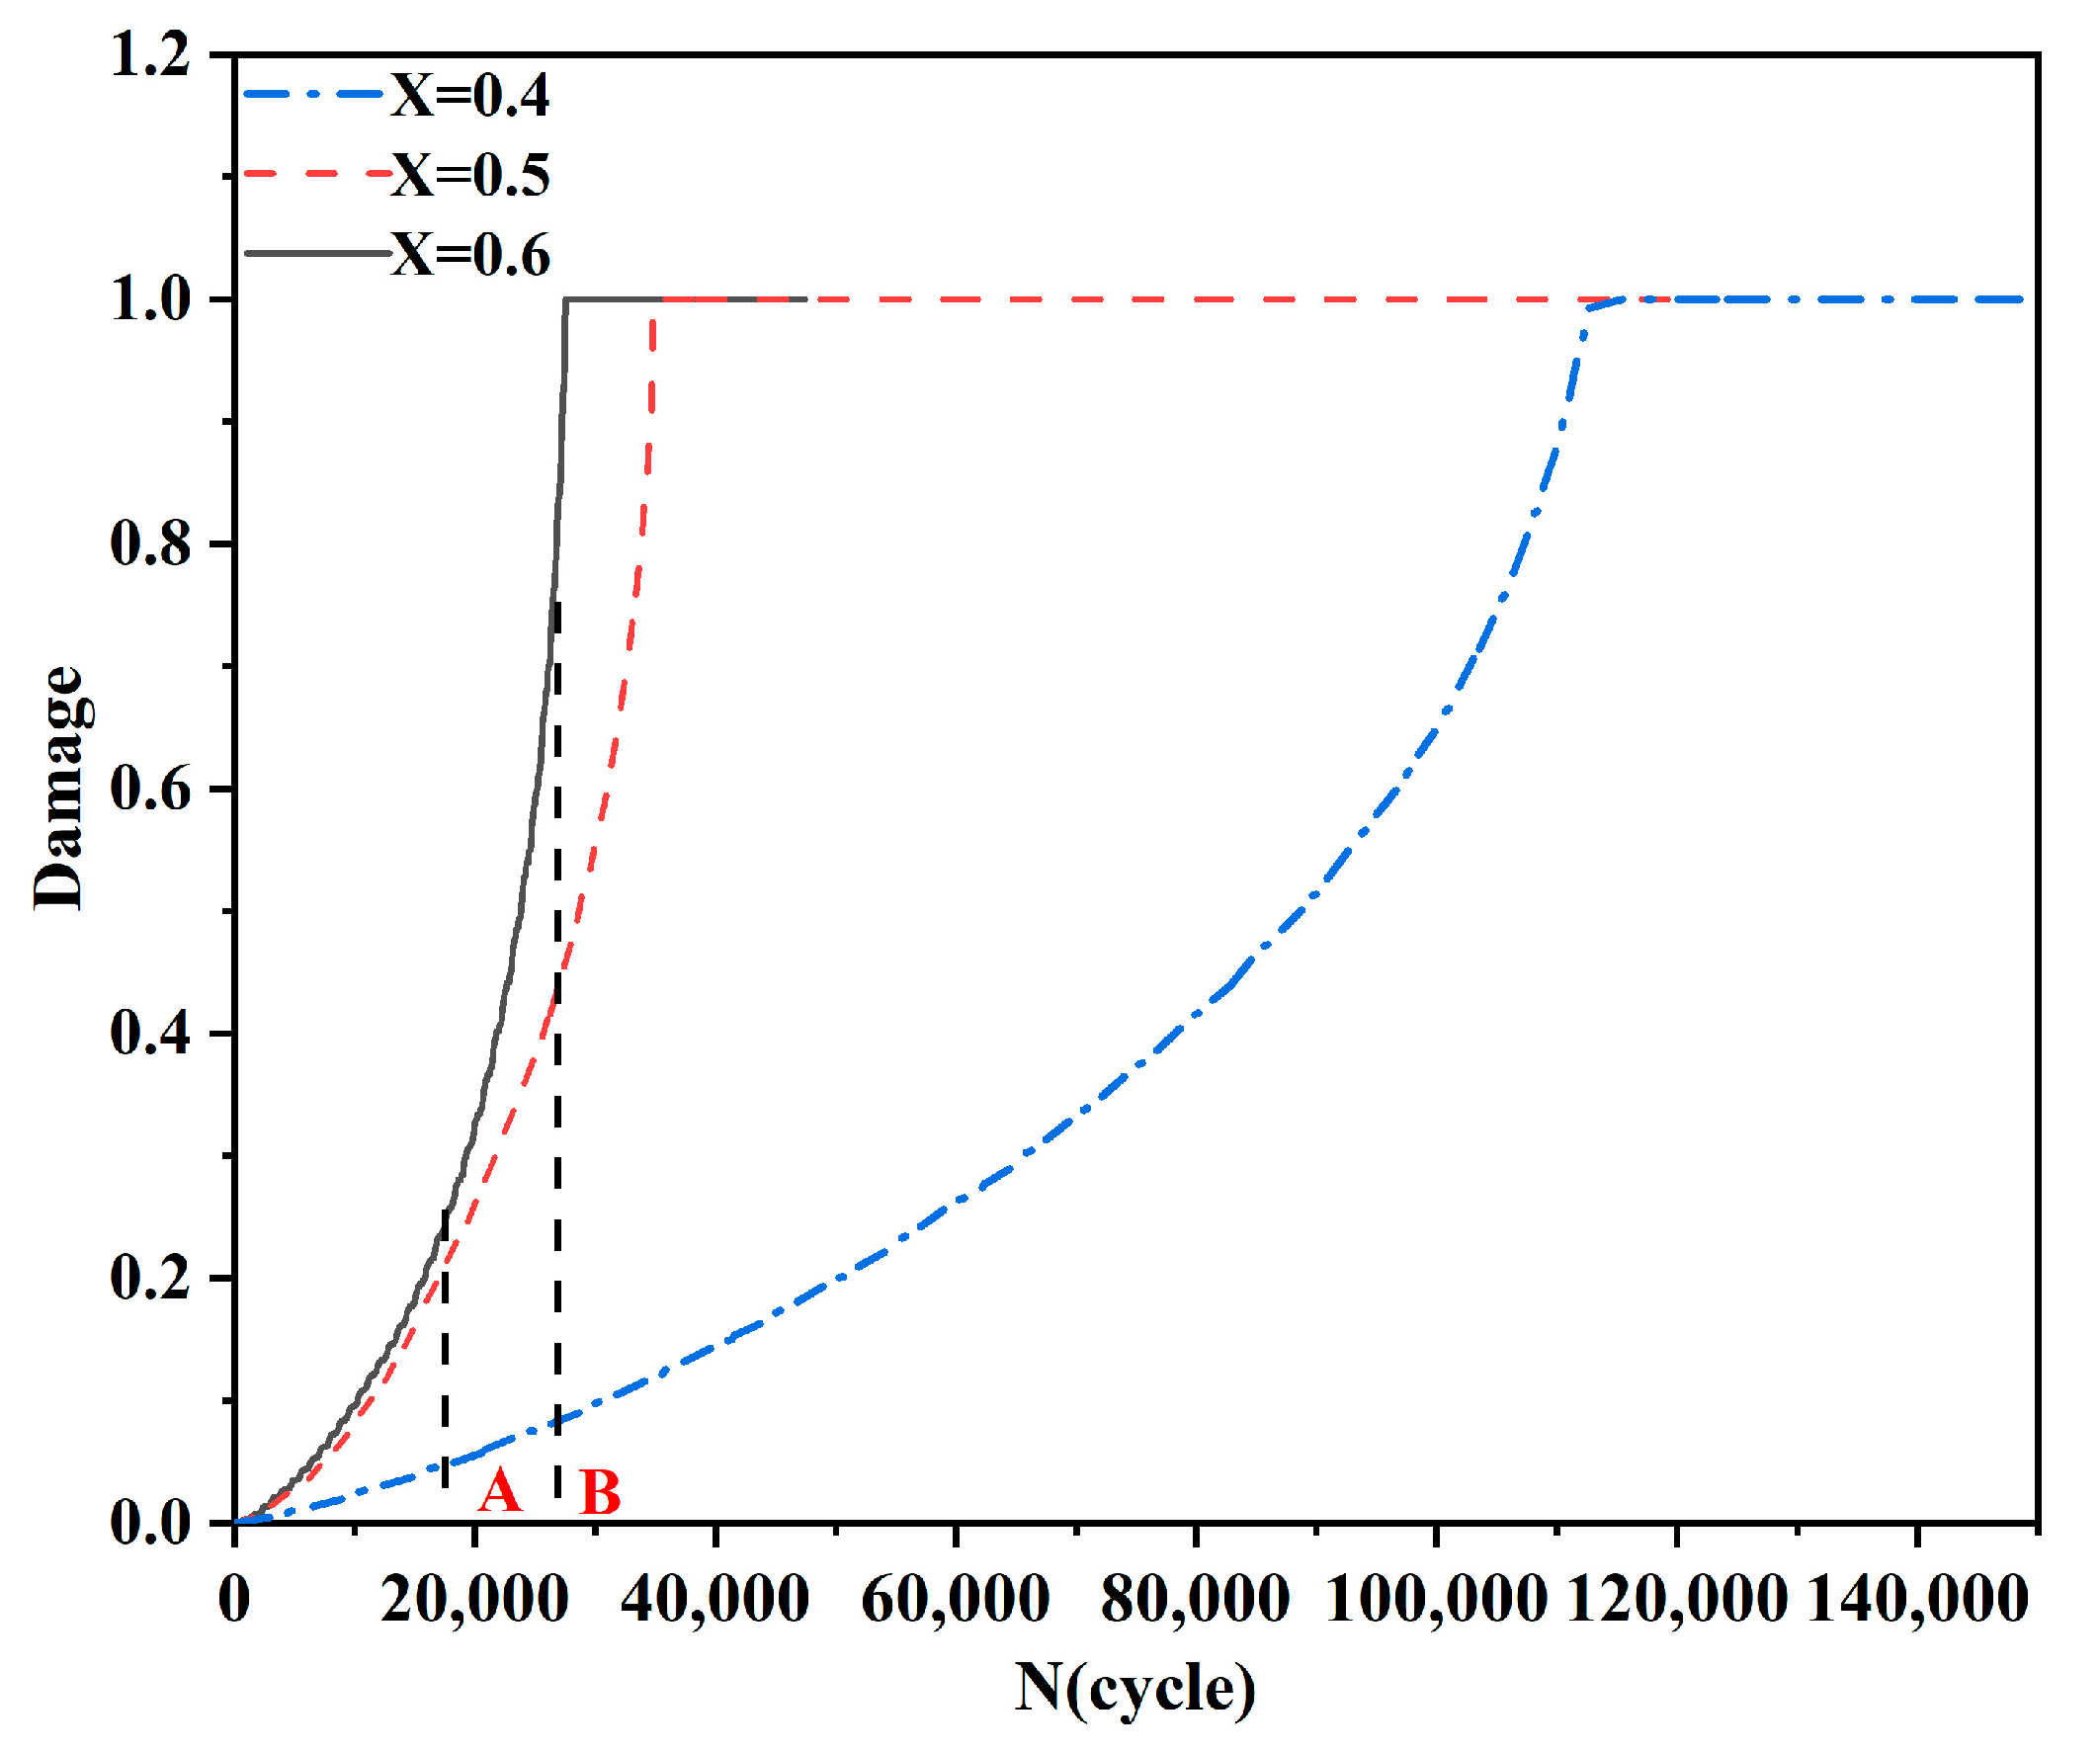
Figure 16 shows the change in the damage to the cohesive elements under cyclic displacements X = [0.4 mm, 0.5 mm, 0.6 mm]. When the number of cycles reached 17,466 (point A in Figure 16), the damage of cohesive elements corresponding to cyclic displacements X = [0.4 mm, 0.5 mm, 0.6 mm] were 0.049, 0.215, and 0.243, respectively. When the number of cycles reached 26,800 (point B in Figure 16), the damage of cohesive elements corresponding to cyclic displacements X = [0.4 mm, 0.5 mm, 0.6 mm] were 0.085, 0.433, and 0.817, respectively. This indicates that when the number of cycles is the same, the total damage D of the cohesive elements increases with the increase in cyclic displacement X, and the fatigue life decreases.
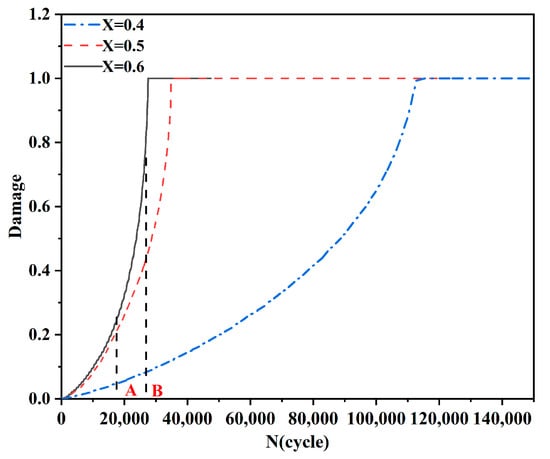
Figure 16.
Changes in cohesive unit damage under different cyclic displacements.
Table 6 lists the crack initiation and fatigue life under different cyclic displacements. When the loading cyclic displacements X = [0.4 mm, 0.5 mm, 0.6 mm], the corresponding fatigue life is 144,500, 52,800, and 44,000 cycles, respectively. This indicates that as the cyclic displacement increased, both the crack initiation life and fatigue life decreased.
Table 6.
Crack initiation life and fatigue life under different cyclic displacements.
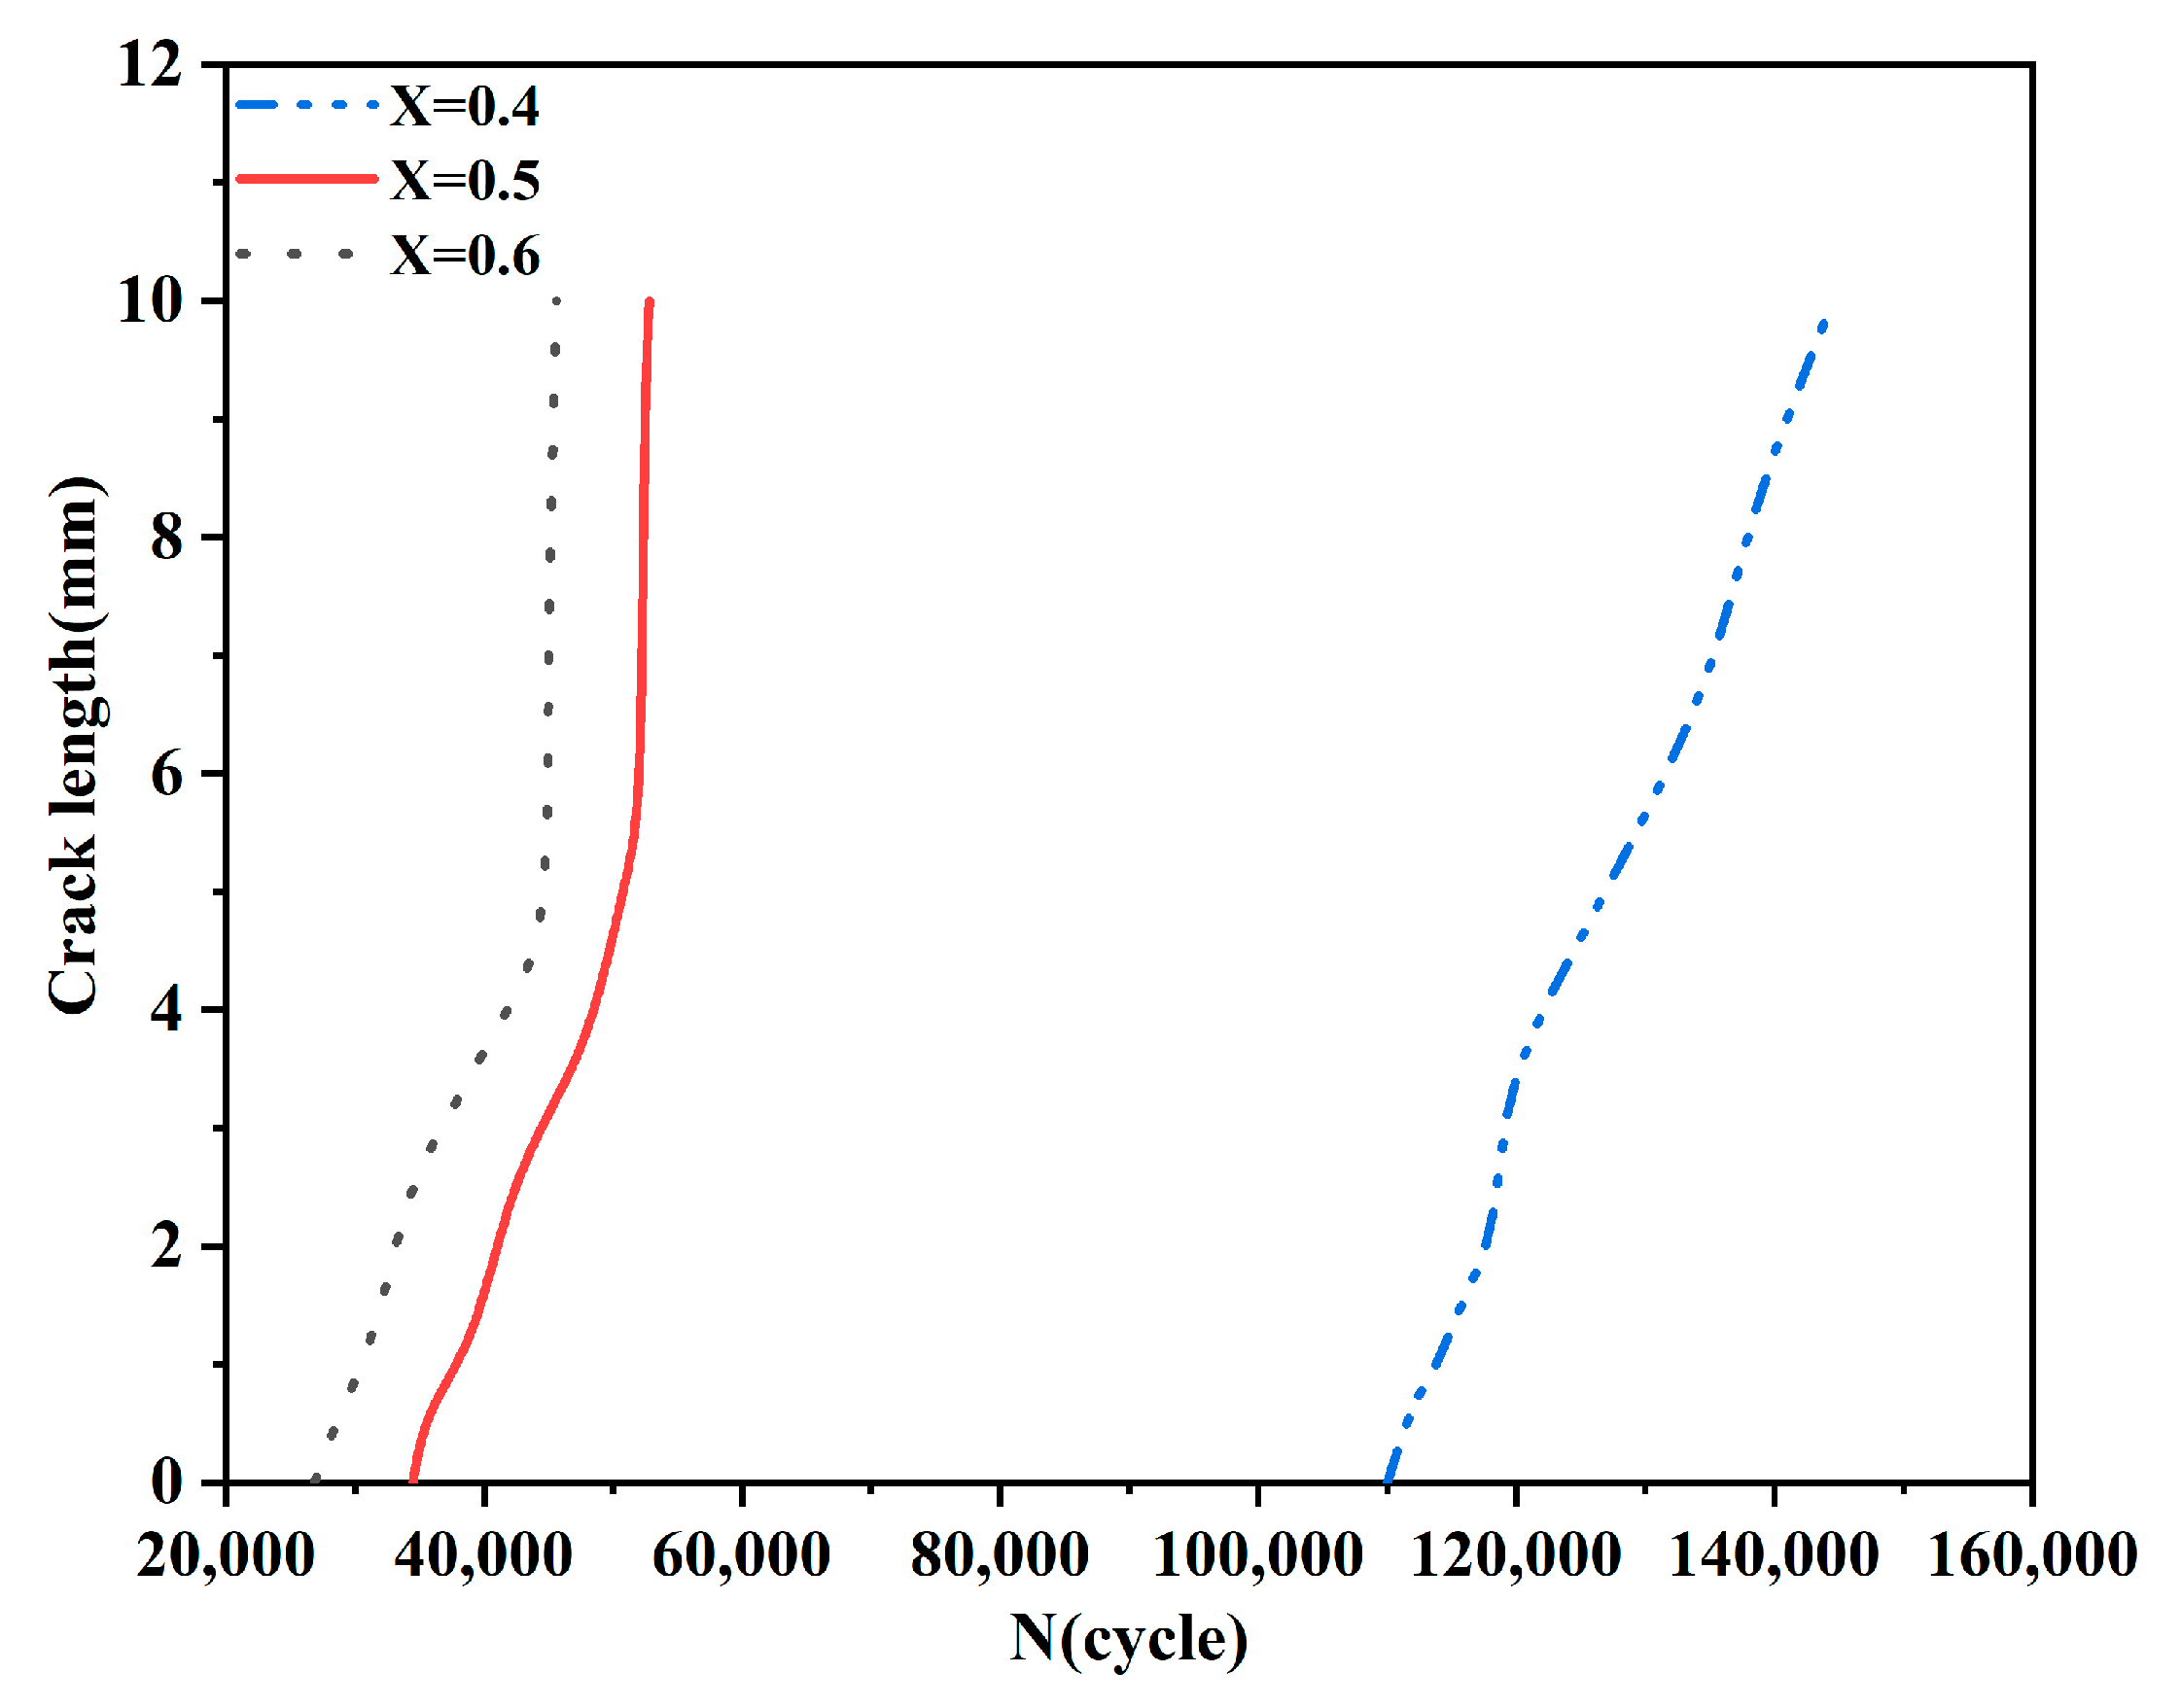
Figure 17 and Table 7 show the crack propagation length under different cyclic displacements. The smaller the cyclic displacement, the smaller the crack propagation rate, and the longer the fatigue life.
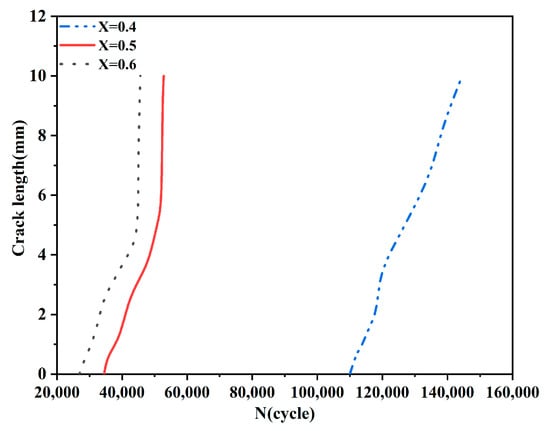
Figure 17.
Comparison of fatigue crack propagation under different cyclic displacements.
Table 7.
Comparison of fatigue crack growth rates.
The cyclic displacement X = [0.4 mm, 0.45 mm, 0.5 mm, 0.6 mm, 0.7 mm] was selected to simulate and analyze the crack propagation of butt-brazed joints under different cyclic displacements.
Figure 18 shows the fatigue-life fitting curves under different displacement loads, which were fitted using an exponential function as follows:
where represents the number of cycles, and represents the cyclic displacement (mm). The fatigue life of the butt-brazed joint has a nonlinear relationship with the cyclic displacement, with a goodness-of-fit of 0.97, indicating a good fit. The results show that the fitting equation can predict the fatigue life of butt-brazed joints under different cyclic displacements.
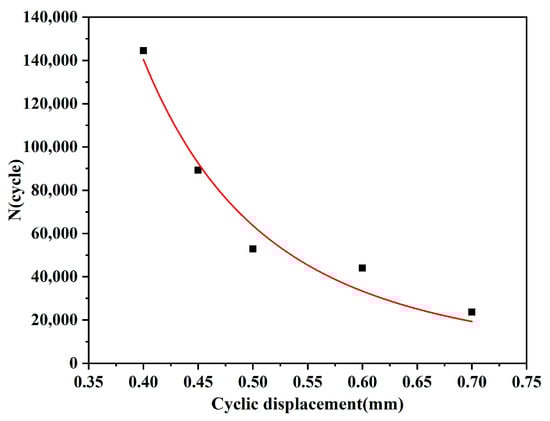
Figure 18.
Fitting curves of fatigue life under different displacements.
3.3.2. Docking Angle Effect
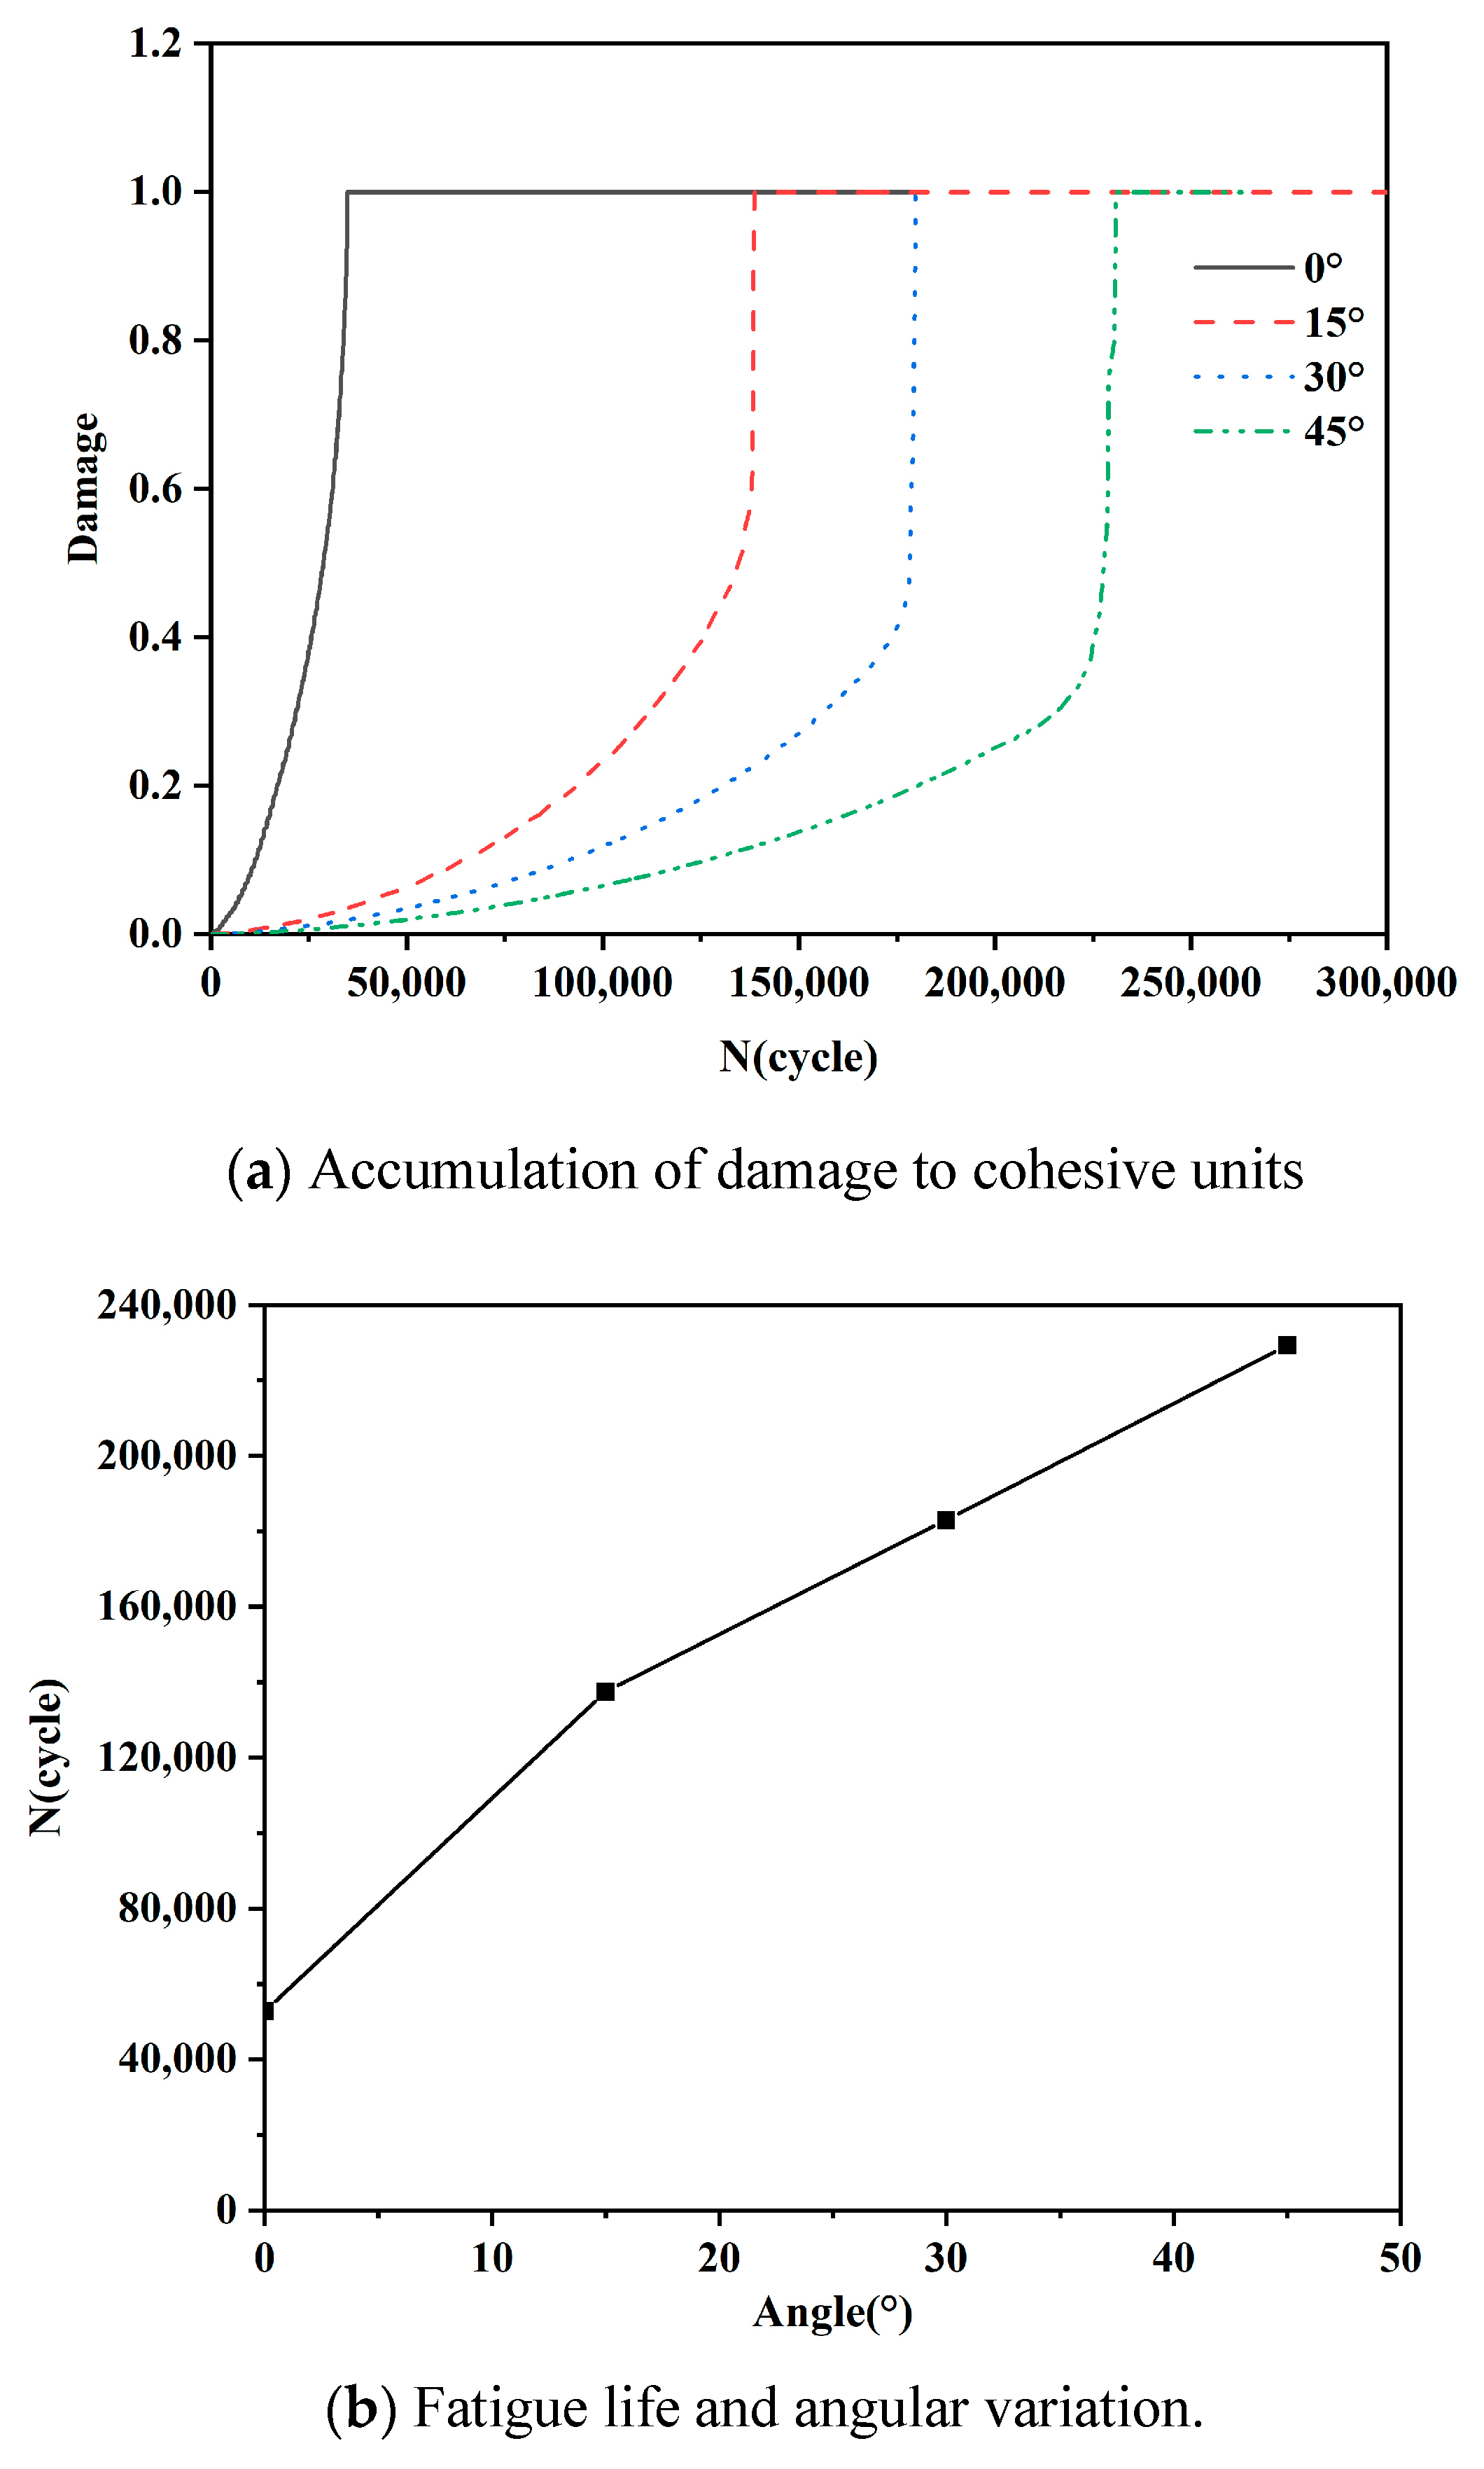
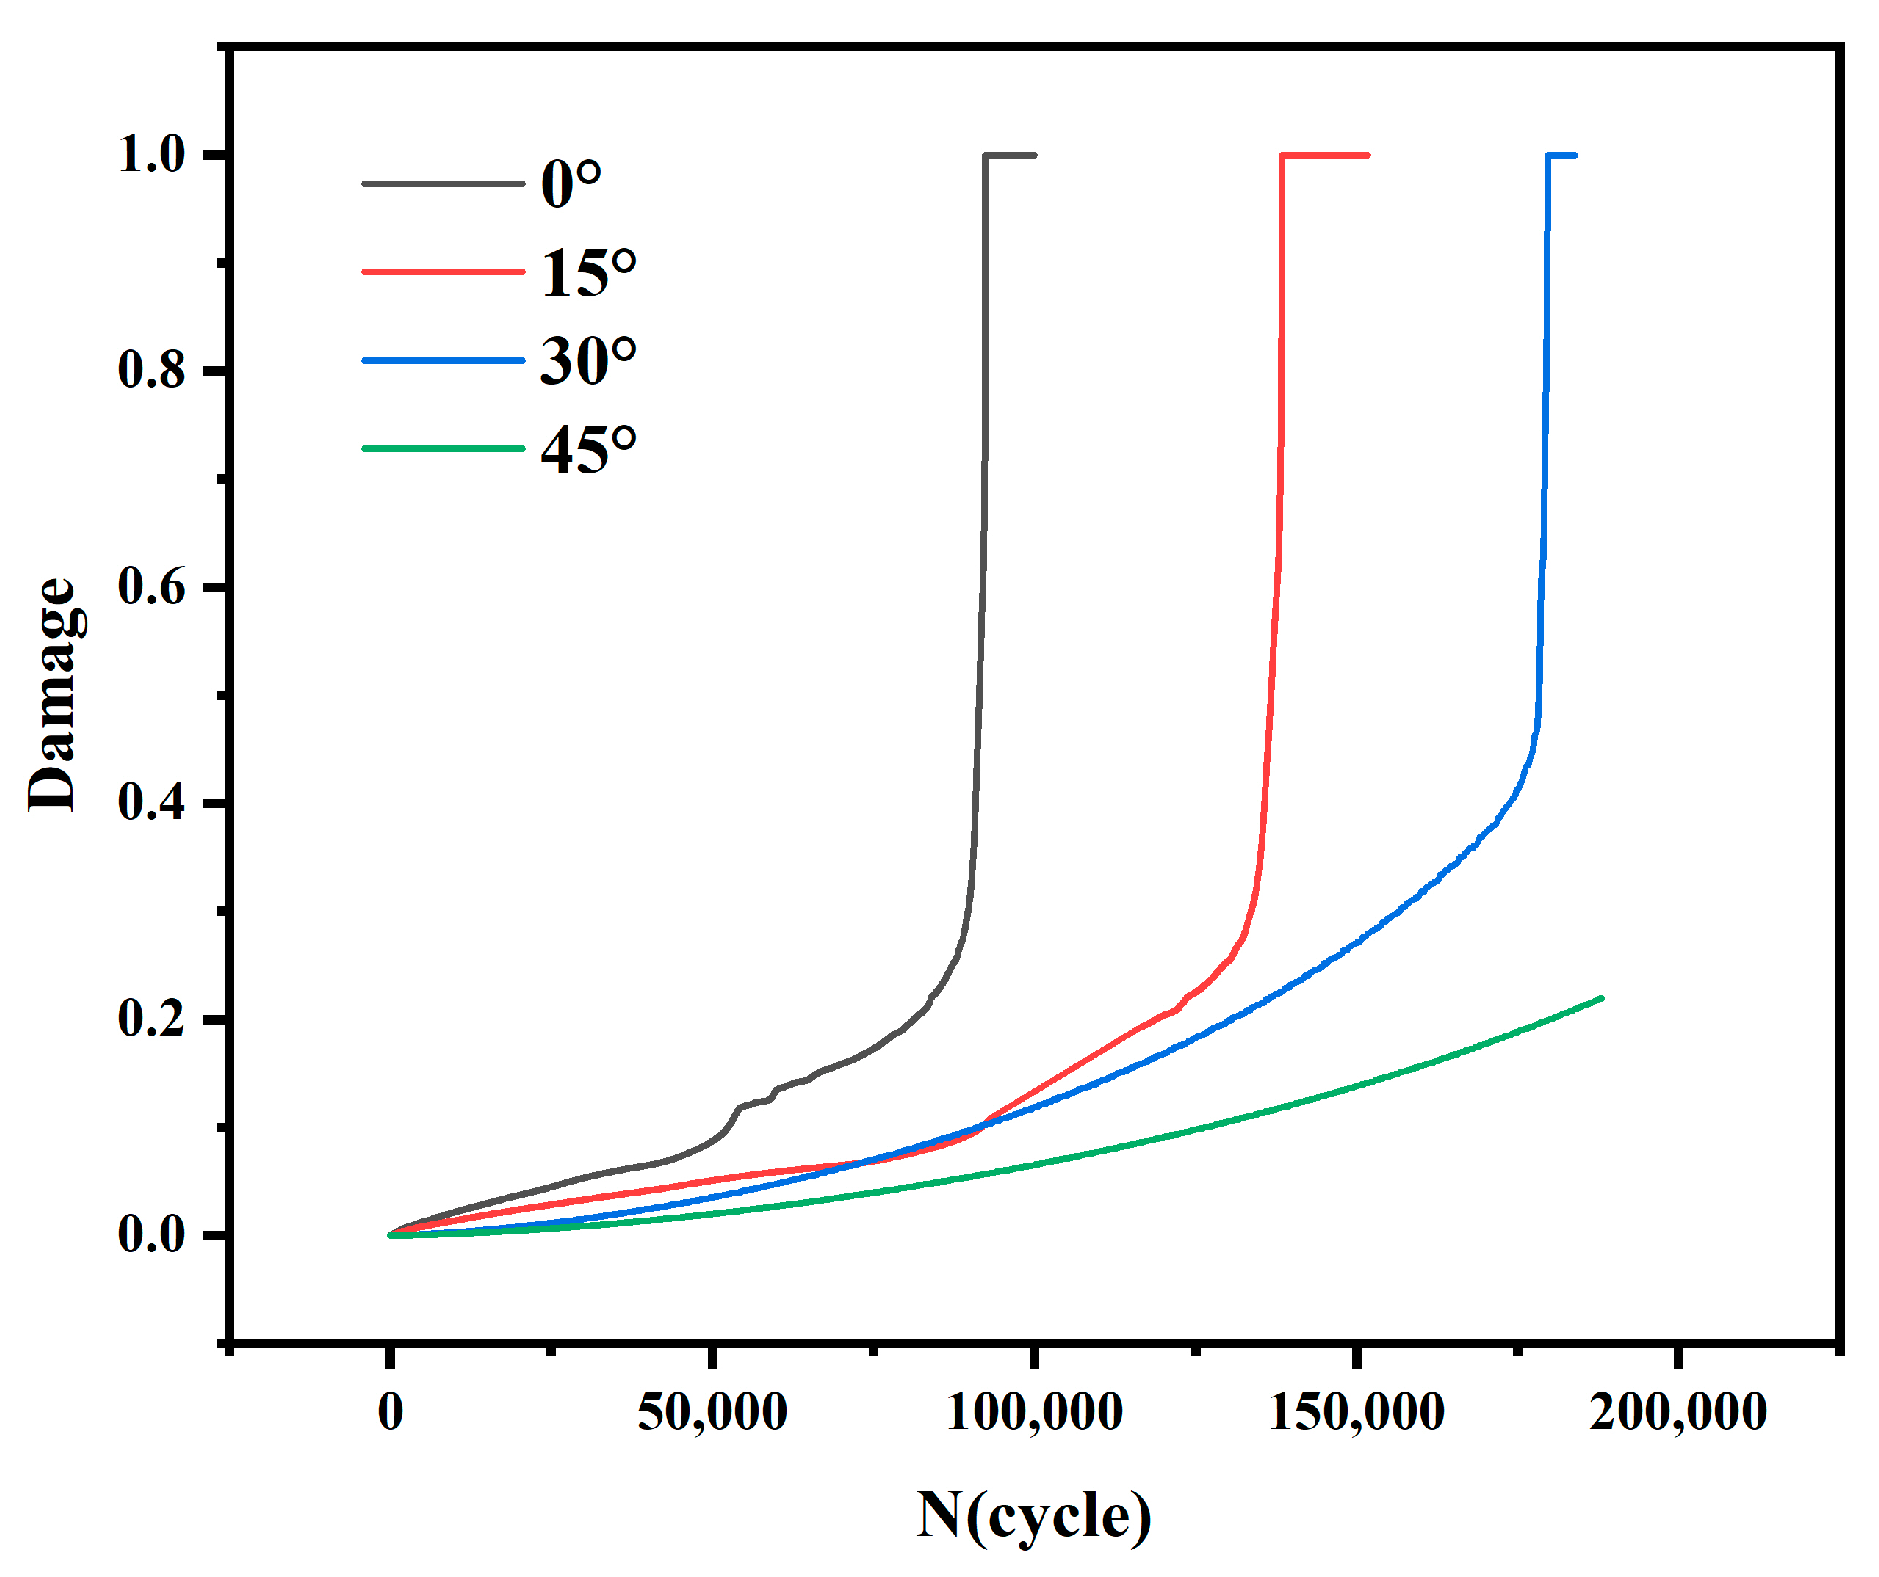
Figure 19 shows the fatigue life under different butt angles. As the butt angle α increased, the critical displacement of the cohesive elements at the brazing location also increased, resulting in a decrease in fatigue damage and an increase in fatigue life. Table 8 presents the crack initiation life and total fatigue life of brazed joints with different butt angles. The fatigue life of the butt-brazed joint with α = 0° is 52,800 cycles, while the fatigue life of the butt-brazed joint with α = 45° is 229,400 cycles, representing a 334.5% increase in fatigue life.
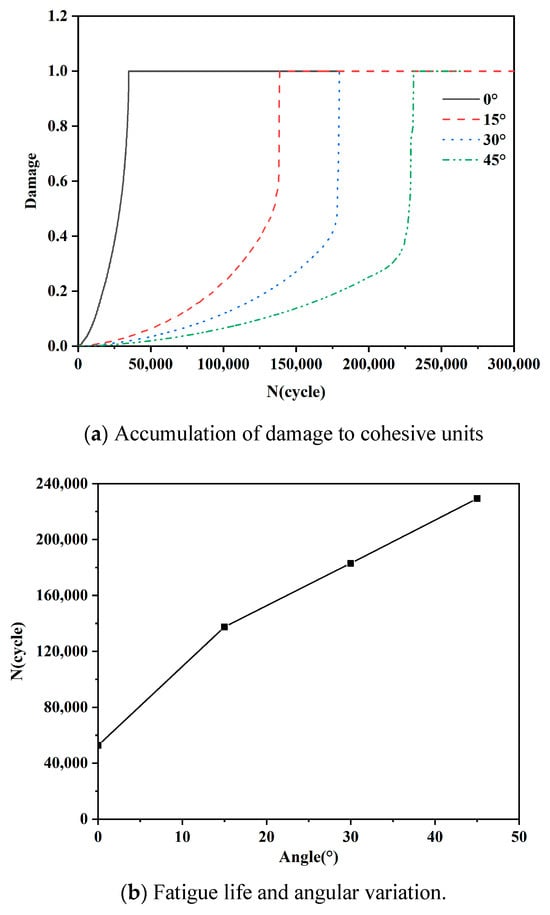
Figure 19.
Comparison of fatigue life at different docking angles.
Table 8.
Crack initiation life and fatigue life of brazed joints with different butt angles.
3.4. Fatigue Life Analysis of DN × 450 mm Oscillating Tube
3.4.1. Finite Element Model and Boundary Conditions
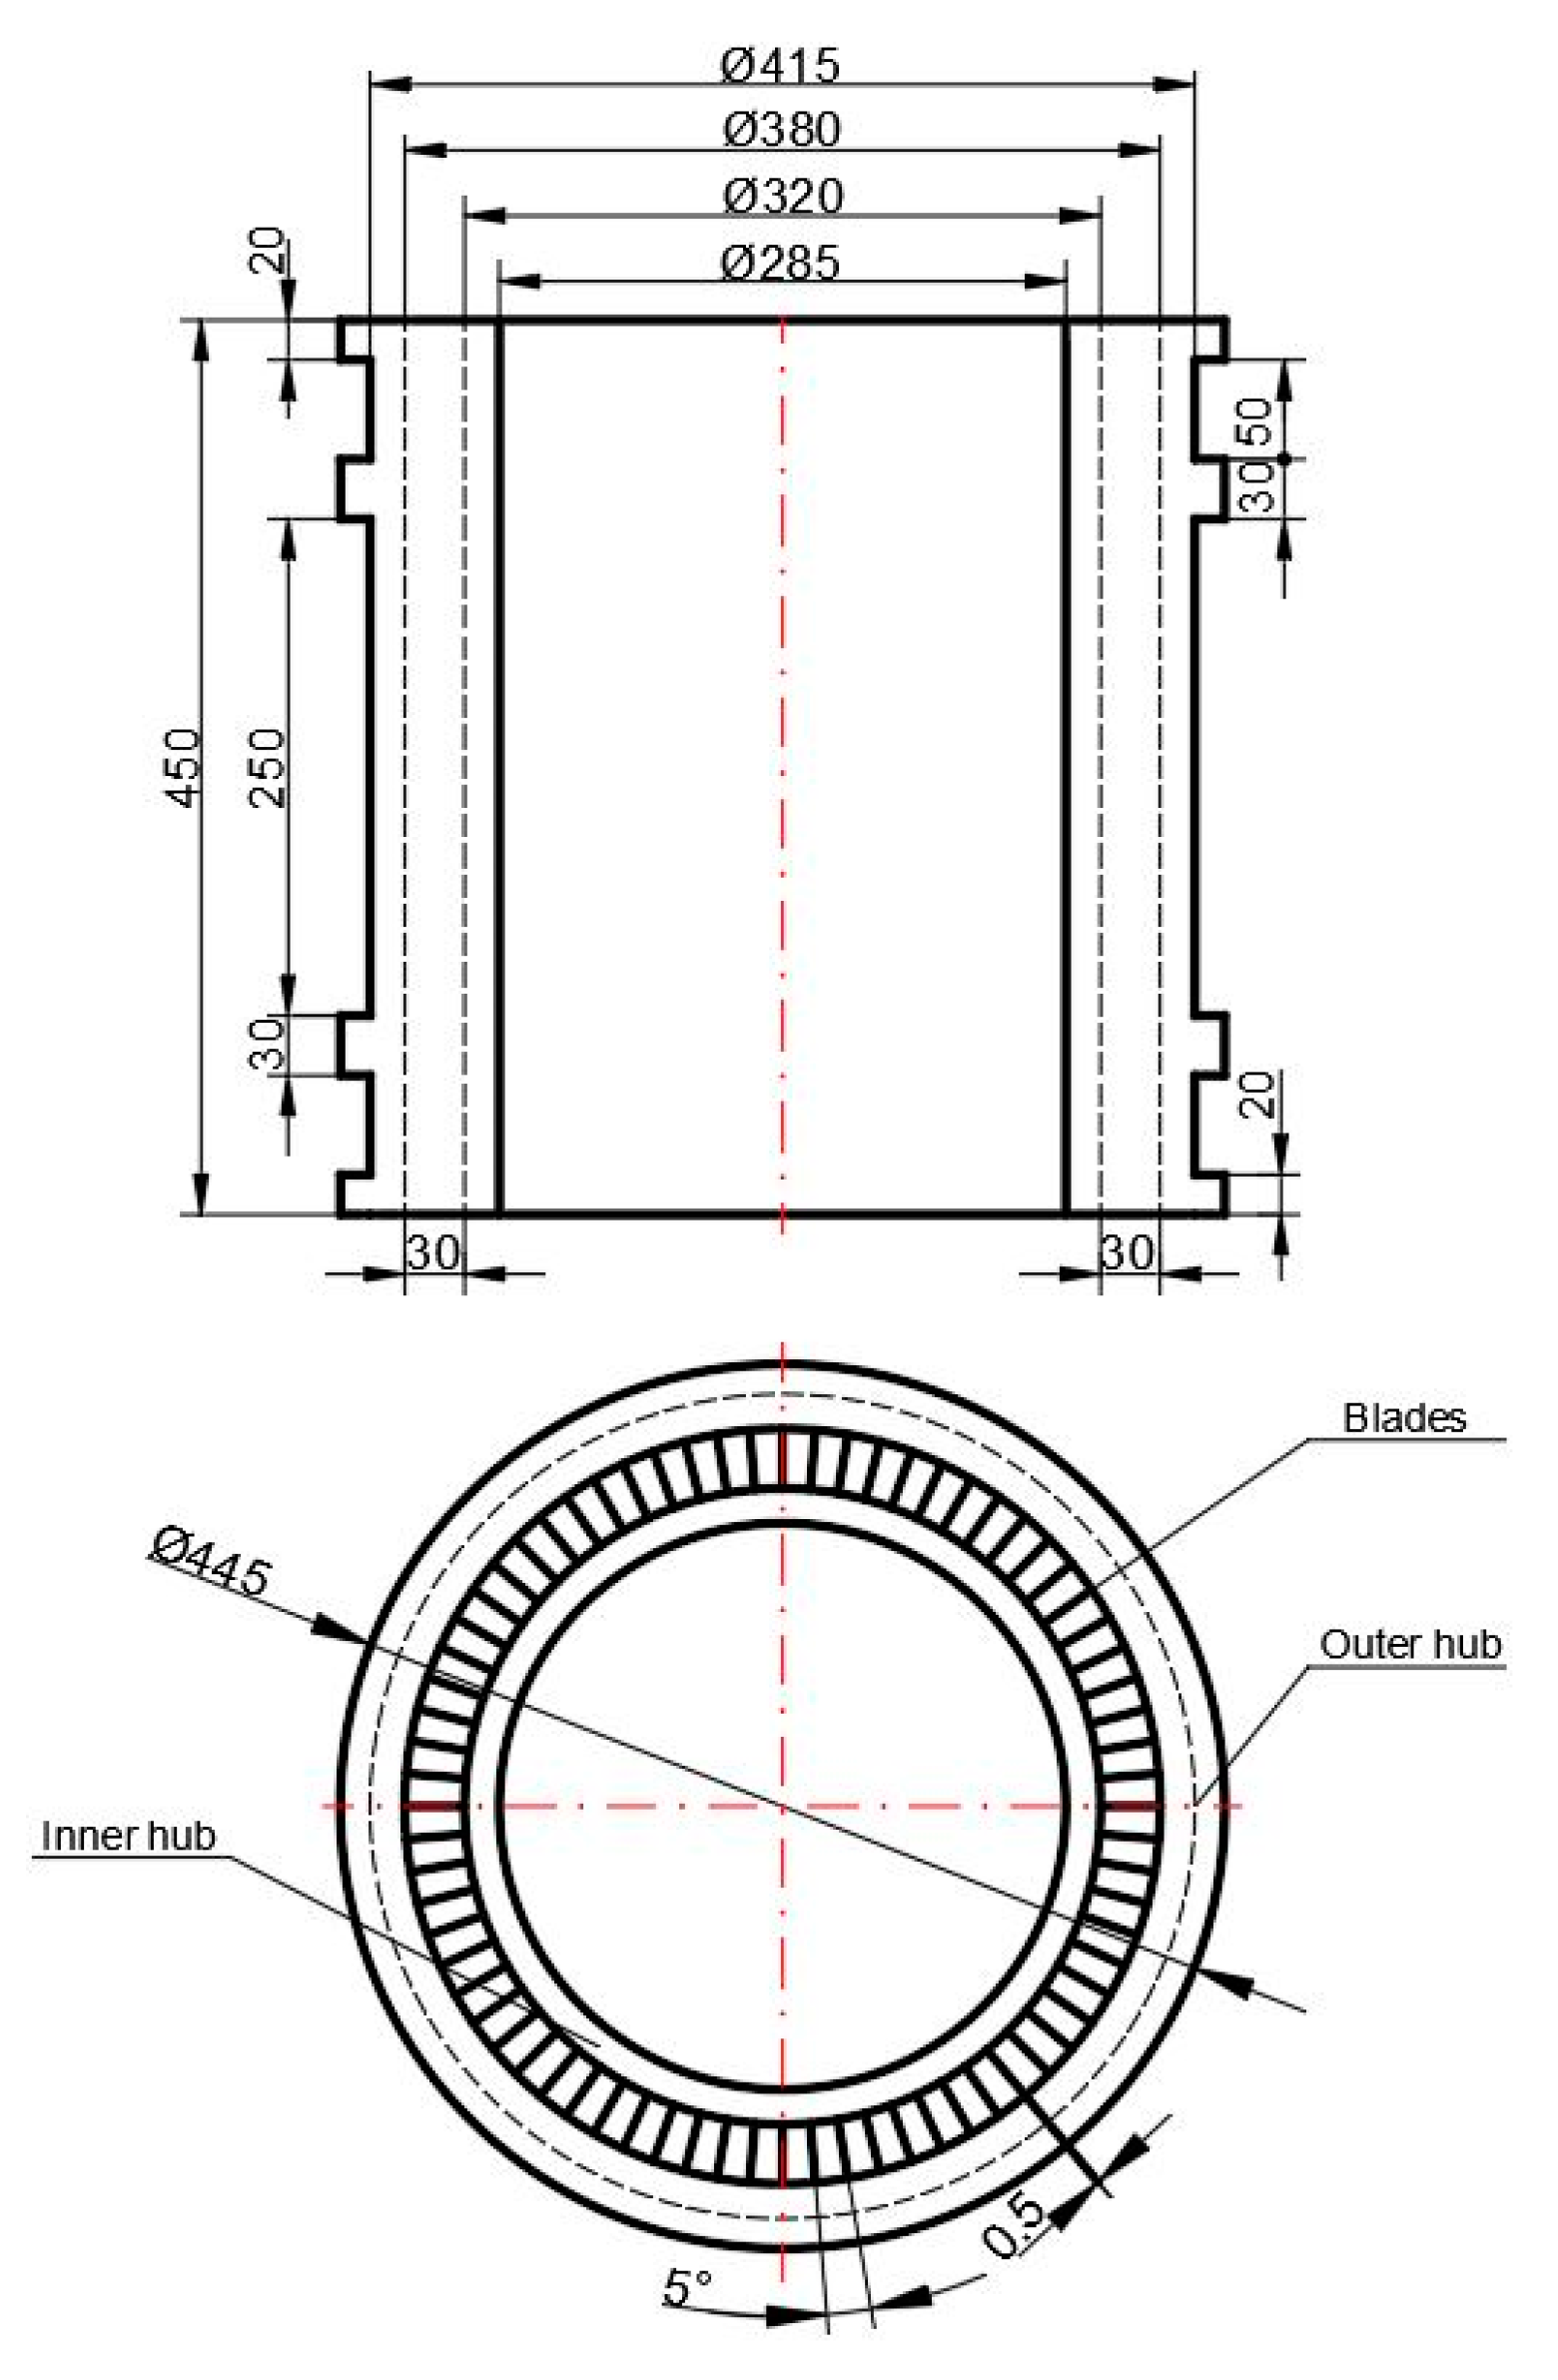
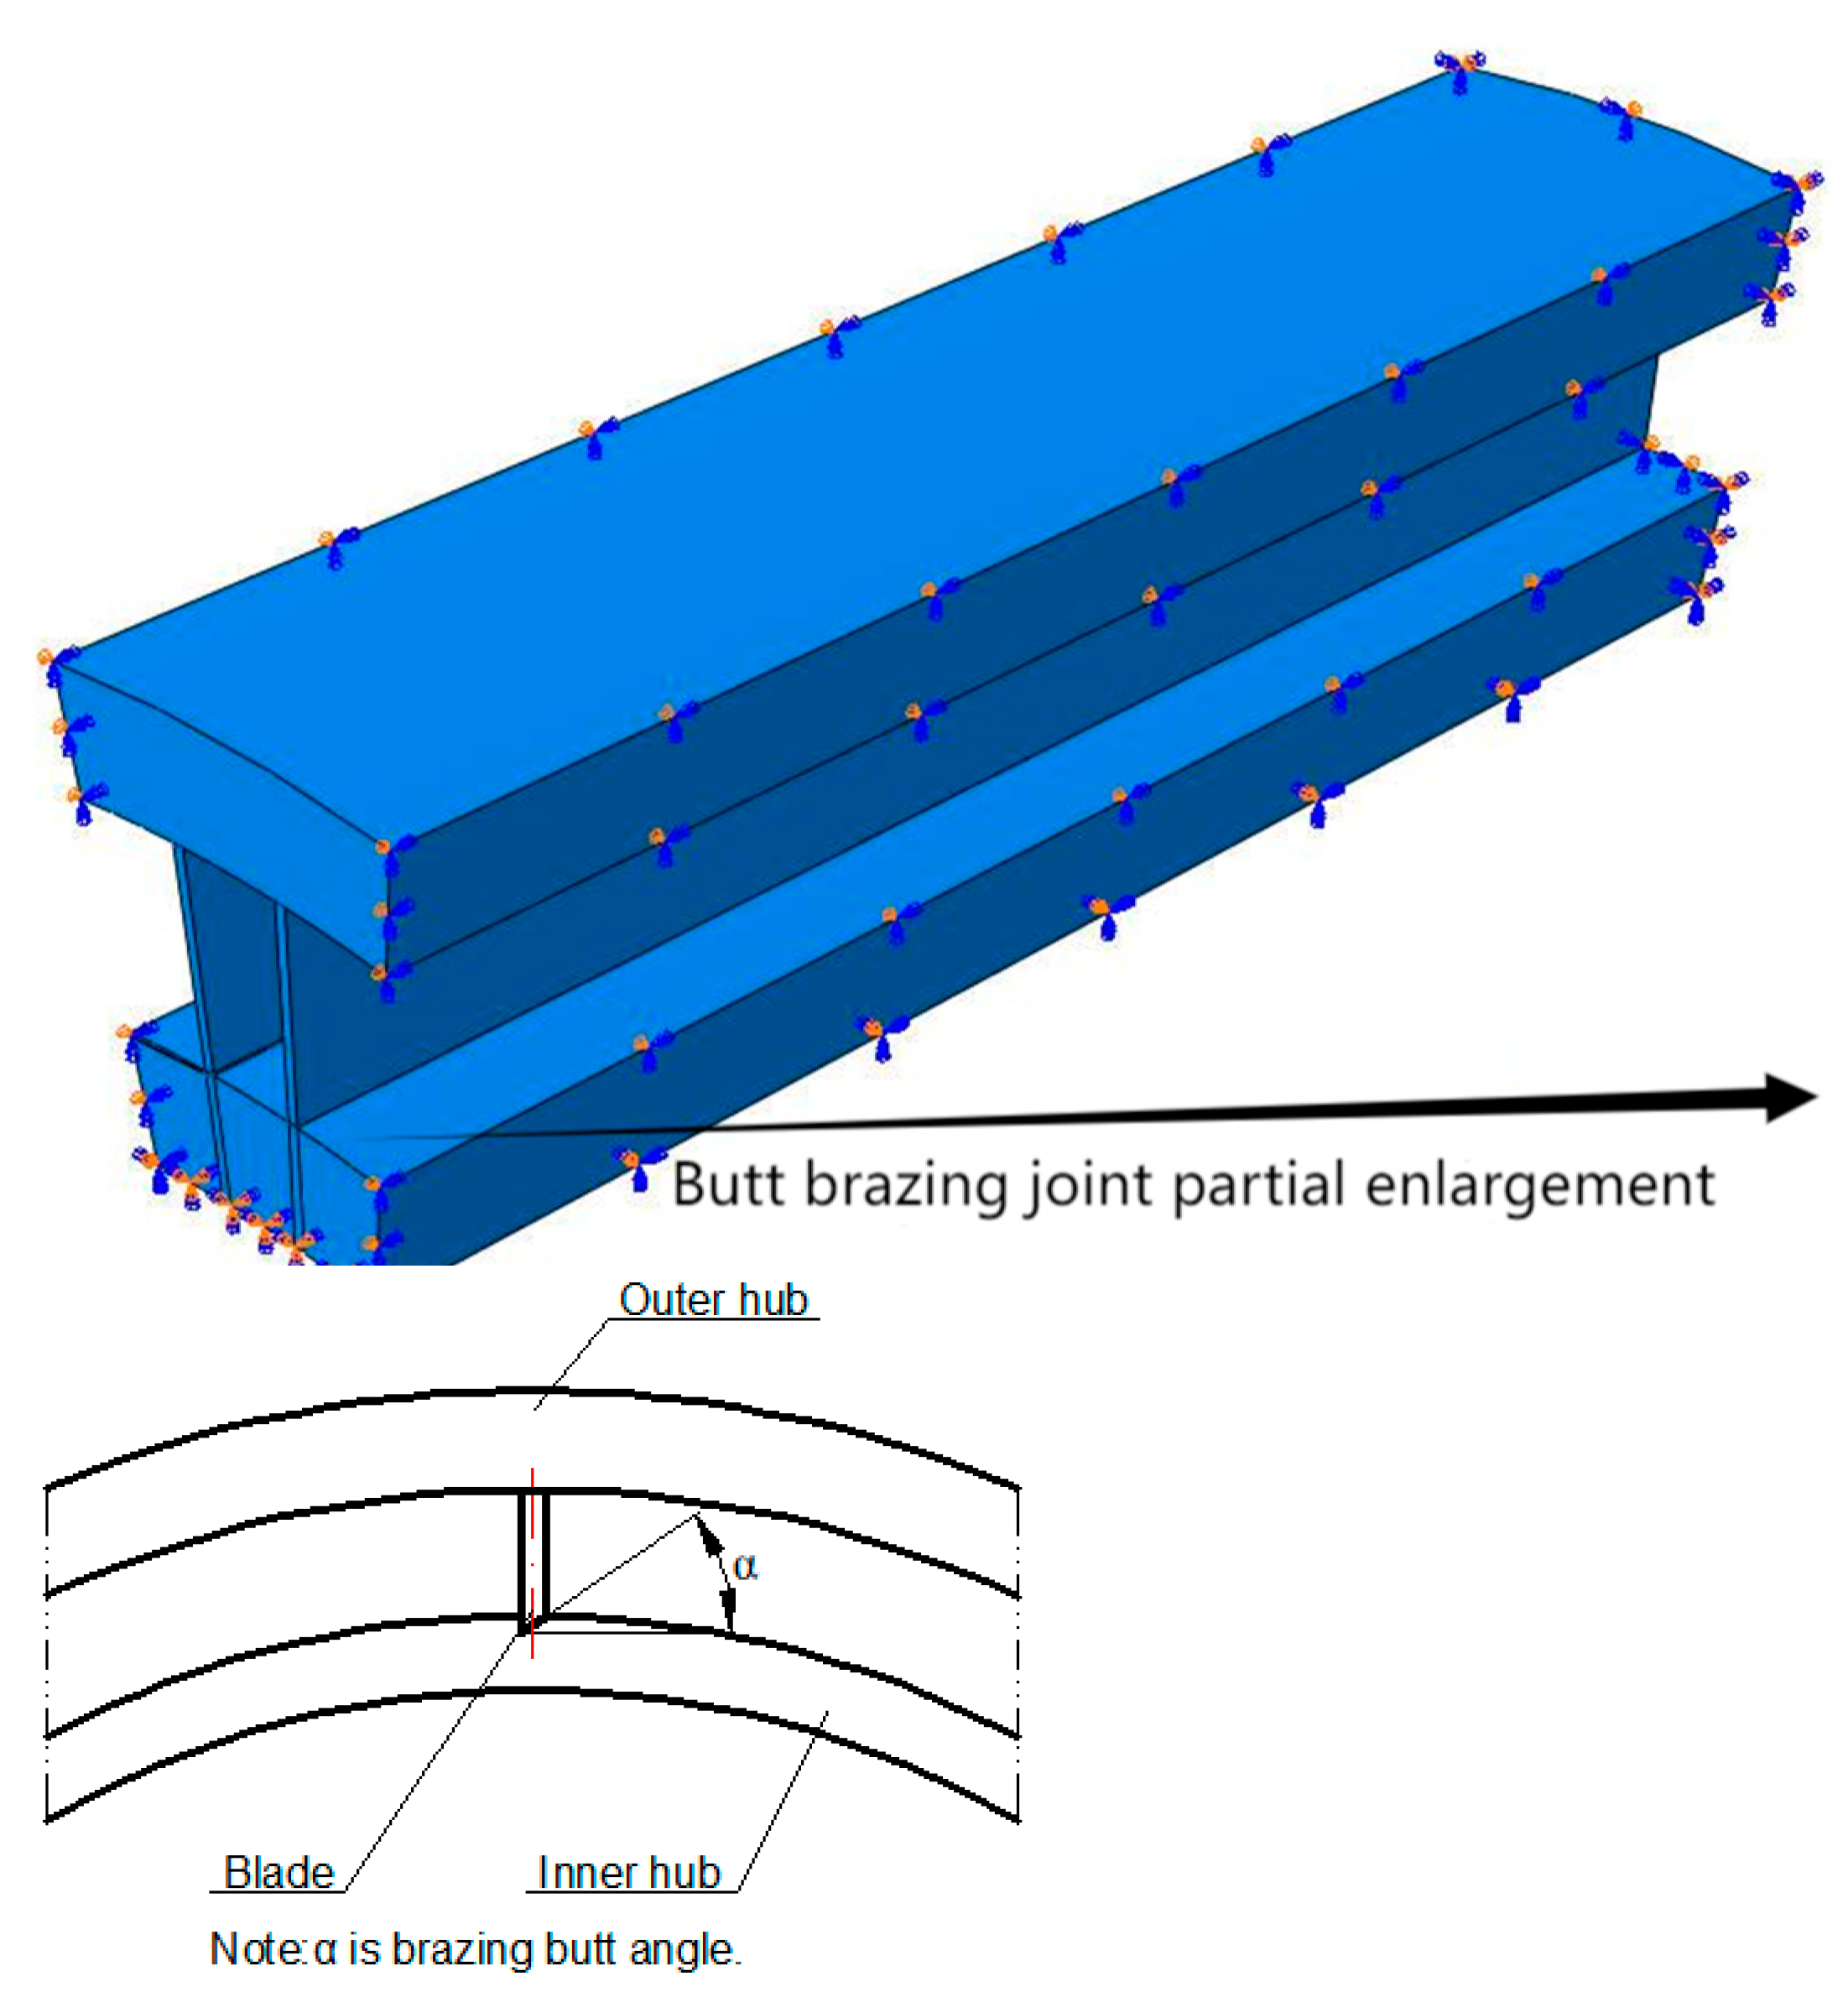
A finite element model of the oscillating tube with a specification of DN285 × 450 mm was established. The oscillating tube is manufactured by brazing the inner hub, outer hub, and blades. The material used is SUS304 stainless steel. The structures of the brazed joints between the blades and hubs with different butt angles were also considered. The structural dimensions of the oscillating tubes are shown in Figure 20.
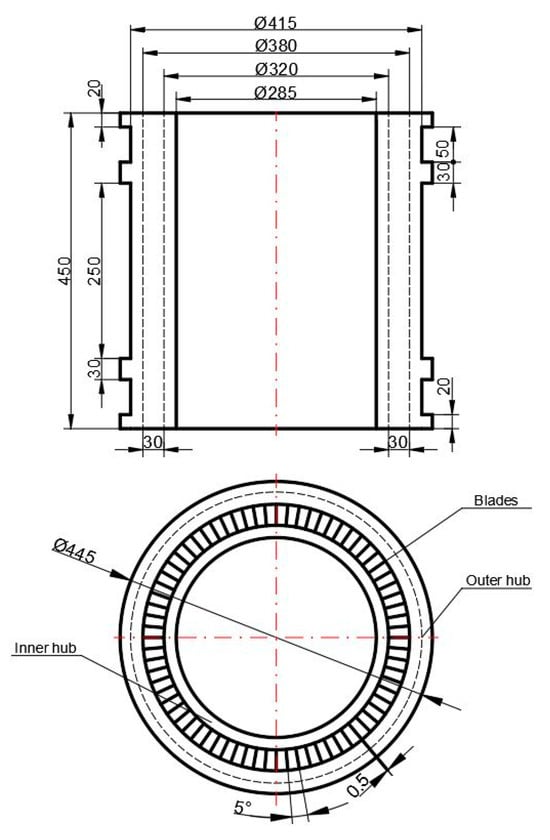
Figure 20.
Oscillating tube structure size.
Considering that the solid structure of the oscillating tube is a cylindrical revolution body, a 1/24 finite-element symmetric model of the oscillating tube was established. Brazed structures with different brazing butt angles α = [0°, 15°, 30°, 45°] between the hubs and blades were designed for simulation calculations. Symmetric constraints were applied circumferentially to the model; fixed constraints were applied to the lower end, and alternating loads ranging from 0 to 2.0 MPa were applied to the inner wall surface of the oscillating tube. The inner and outer hubs and blades were discretized using three-dimensional stress elements C3D8R, while the brazed welds were discretized using three-dimensional cohesive elements COH3D8. The critical stress value was set to 525 MPa, and the fatigue scaling factor was f(n) = 800. The finite element model and boundary conditions of the oscillating tube with different butt angles are shown in Figure 21.

Figure 21.
Finite element model and boundary conditions of oscillating tubes with different docking angles.
3.4.2. Finite Element Results Analysis
Figure 22 shows the crack initiation life of oscillating tubes with different butt-joint angles. It can be seen from the figure that the crack initiation life of the oscillating tube increased as the butt-joint angle increased. Table 9 lists the crack initiation life and life increase in oscillating tubes with different butt-joint angles. As the butt-joint angle increased, the fatigue crack initiation life also increased significantly.
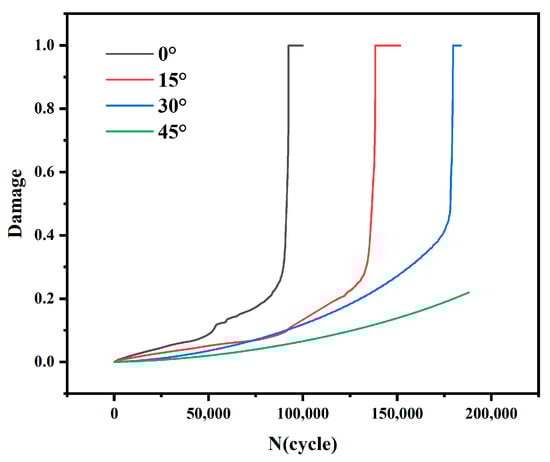
Figure 22.
Crack initiation life of oscillating tubes with different butt-joint angles.
Table 9.
Crack initiation life and life increase in oscillating tubes at different docking angles.
4. Conclusions
In this study, a combination of experiments and numerical simulations were conducted to investigate the fatigue strength of butt-brazed joints in oscillating tubes. The main conclusions are as follows:
1. Through tensile tests on the butt-brazed joints, the average value of the fracture load was 10,598 N. Based on the CZM, the simulated value of the tensile fracture load of the butt-brazed joint was 10,460 N, with an error of 1.3%. Therefore, the critical damage stress of the CZM was determined as 525 MPa, which verified the accuracy of the VUMAT subroutine of the cyclic CZM;
2. The fatigue crack propagation process of the butt-brazed joints was analyzed using a bilinear CZM. Through cyclic loading, it was observed that the damage at the edge of the brazed interface layer first reached its maximum value, which was the crack initiation point. As the number of cycles increased, cracks propagated along the weld seam from the edge layers on both sides to the middle of the weld seam until fracture. This discovery provides a reliable numerical simulation method for predicting the fatigue life of brazed structures in gas-wave machines;
3. The effects of cyclic displacement and butt-joint angle on the fatigue life of the brazed joints were simulated and analyzed. A fatigue life-fitting equation was obtained as . It was observed that as the butt joint angle increased, the area of the scarf surface of the brazed joint enlarged, and the secondary crack width and fatigue striations at the fracture surface gradually diminished, resulting in enhanced connection strength. It was found that the fatigue life of butt-brazed joints with α = 45° increased by 334.5% than α = 0°. A fatigue life analysis of the DN285 × 450 mm oscillating tube model was also conducted, revealing that the fatigue initiation life of butt-braised joints with α = 45° increased by over 102.92% than α = 0°. This indicates that during the design of the brazed structure of oscillating tube blades, brazed joints with a butt-joint angle of α = 45° are preferred. This conclusion provides a theoretical basis for the design and safe operation of the brazed structure of the oscillating tube blades in gas-wave machines.
Author Contributions
Conceptualization, Y.Z. and A.X.; Software, Y.Z.; Formal analysis, C.S.; Investigation, Q.L.; Resources, Q.L.; Data curation, A.X. and C.S.; Writing—original draft, Y.Z. All authors have read and agreed to the published version of the manuscript.
Funding
This study was funded by the National Key Research and Development Program of China with the grant number 2018YFA0704604.
Institutional Review Board Statement
Not applicable.
Informed Consent Statement
Not applicable.
Data Availability Statement
The raw data supporting the conclusions of this article will be made available by the authors on request.
Conflicts of Interest
The authors declare no conflict of interest.
References
- Jiang, Z.; Yu, H. Theories and technologies for duplicating hypersonic flight conditions for ground testing. Natl. Sci. Rev. 2017, 4, 290–296. [Google Scholar] [CrossRef]
- Jiang, Z.; Li, J.; Hu, Z.; Liu, Y.; Yu, H. On theory and methods for advanced detonation-driven hypervelocity shock tunnels. Natl. Sci. Rev. 2020, 7, 1198–1207. [Google Scholar] [CrossRef] [PubMed]
- Liu, P.; Feng, M.; Liu, X.; Wang, H.; Hu, D. Performance Analysis of Wave Rotor Based on Response Surface Optimization Method. J. Energy Resour. Technol. 2021, 144, 061302. [Google Scholar] [CrossRef]
- Wu, Y.; Xing, A.; Cheng, Q.; Li, Q. Interface strength investigations of 304 stainless steel/T2 red copper T-type brazed joint based on cohesive zone model. Mater. Res. Express 2023, 10, 016517. [Google Scholar] [CrossRef]
- Patel, A.; Sato, E.; Shichijo, N.; Hirata, I.; Takagi, T. A mixed XFEM and CZM approach for predicting progressive failure in advanced SiC/SiC CMC component. Compos. Part C Open Access 2022, 9, 100325. [Google Scholar] [CrossRef]
- Yang, D.; He, X.; Liu, X.; Deng, Y.; Huang, X. A peridynamics-based cohesive zone model (PD-CZM) for predicting cohesive crack propagation. Int. J. Mech. Sci. 2020, 184, 105830. [Google Scholar] [CrossRef]
- Kaushik, V.; Ghosh, A. Experimental and numerical characterization of Mode I fracture in unidirectional CFRP laminated composite using XIGA-CZM approach. Eng. Fract. Mech. 2019, 211, 221–243. [Google Scholar] [CrossRef]
- Alfano, G.; Crisfield, M.A. Finite element interface models for the delamination analysis of laminated composites: Mechanical and computational issues. Int. J. Numer. Methods Eng. 2001, 50, 1701–1736. [Google Scholar] [CrossRef]
- Barenblatt, G.I. The Mathematical Theory of Equilibrium Cracks in Brittle Fracture. In Advances in Applied Mechanics; Dryden, H.L., von Kármán, T., Kuerti, G., van den Dungen, F.H., Howarth, L., Eds.; Elsevier: Amsterdam, The Netherlands, 1962; Volume 7, pp. 55–129. [Google Scholar]
- Dugdale, D.S. Yielding of steel sheets containing slits. J. Mech. Phys. Solids 1960, 8, 100–104. [Google Scholar] [CrossRef]
- Mi, Y.; Crisfield, M.A.; Davies, G.A.O.; Hellweg, H.B. Progressive Delamination Using Interface Elements. J. Compos. Mater. 1998, 32, 1246–1272. [Google Scholar] [CrossRef]
- Ghovanlou, M.K.; Jahed, H.; Khajepour, A. Cohesive zone modeling of fatigue crack growth in brazed joints. Eng. Fract. Mech. 2014, 120, 43–59. [Google Scholar] [CrossRef]
- Jiang, H.; Gao, X.; Srivatsan, T.S. Predicting the influence of overload and loading mode on fatigue crack growth: A numerical approach using irreversible cohesive elements. Finite Elem. Anal. Des. 2009, 45, 675–685. [Google Scholar] [CrossRef]
- Nojavan, S.; Schesser, D.; Yang, Q.D. A two-dimensional in situ fatigue cohesive zone model for crack propagation in composites under cyclic loading. Int. J. Fatigue 2016, 82, 449–461. [Google Scholar] [CrossRef]
- Kim, K.; Yoon, M.-J. Fretting fatigue simulation for aluminium alloy using cohesive zone law approach. Int. J. Mech. Sci. 2014, 85, 30–37. [Google Scholar] [CrossRef]
- Gonabadi, H.; Oila, A.; Yadav, A.; Bull, S. Investigation of the Effects of Environmental Fatigue on the Mechanical Properties of GFRP Composite Constituents Using Nanoindentation. Exp. Mech. 2022, 62, 585–602. [Google Scholar] [CrossRef]
- GB/T 11363-2008; Test Method for Strength of Brazed Joints. Available online: https://www.chinesestandard.us/products/gbt11363-2008?srsltid=AfmBOooAtuSEz3e-alOZVhvXCRyRRZOAdmMI2CDpg3VLzQKejpq17cpy (accessed on 23 September 2024).
- Katnam, K.B.; Sargent, J.P.; Crocombe, A.D.; Khoramishad, H.; Ashcroft, I.A. Characterisation of moisture-dependent cohesive zone properties for adhesively bonded joints. Eng. Fract. Mech. 2010, 77, 3105–3119. [Google Scholar] [CrossRef]
- Camanho, P.P.; Davila, C.G. Mixed-Mode Decohesion Finite Elements for the Simulation of Delamination in Composite Materials; NASA: Washington, DC, USA, 2002. [Google Scholar]
- Benzeggagh, M.L.; Kenane, M. Measurement of mixed-mode delamination fracture toughness of unidirectional glass/epoxy composites with mixed-mode bending apparatus. Compos. Sci. Technol. 1996, 56, 439–449. [Google Scholar] [CrossRef]
- Roe, K.L.; Siegmund, T. An irreversible cohesive zone model for interface fatigue crack growth simulation. Eng. Fract. Mech. 2003, 70, 209–232. [Google Scholar] [CrossRef]
- Ural, A.; Krishnan, V.R.; Papoulia, K.D. A cohesive zone model for fatigue crack growth allowing for crack retardation. Int. J. Solids Struct. 2009, 46, 2453–2462. [Google Scholar] [CrossRef]


Disclaimer/Publisher’s Note: The statements, opinions and data contained in all publications are solely those of the individual author(s) and contributor(s) and not of MDPI and/or the editor(s). MDPI and/or the editor(s) disclaim responsibility for any injury to people or property resulting from any ideas, methods, instructions or products referred to in the content. |
© 2024 by the authors. Licensee MDPI, Basel, Switzerland. This article is an open access article distributed under the terms and conditions of the Creative Commons Attribution (CC BY) license (https://creativecommons.org/licenses/by/4.0/).