Featured Application
This work demonstrates to healthcare professionals who treat patients with diabetic foot disease that the recommended physical activity must be adjusted to the physiological response parameters in the foot of each patient.
Abstract
One of the most significant complications of diabetes mellitus is diabetic sensory neuropathy. A reduction in pain perception increases the risk of diabetic patients developing foot ulcers and requiring amputation, which in turn results in impaired mobility and a diminished quality of life. Despite recent advances in our understanding of the aetiology of diabetic foot ulcers (DFUs), there remains a significant gap in the clinical prevention and management of these ulcers. Given that inflammation represents the initial stage in the formation of skin wounds, the utilisation of infrared thermography for the early detection of inflammatory tissue, the analysis of plantar pressures and the monitoring of controlled physical activity (PA) may facilitate the close observation of plantar skin alterations that are susceptible to the development of DFUs, thereby enabling the implementation of timely interventions such as personalised PA for these patients. It is recommended that an integrated approach be adopted which encompasses the utilisation of all emerging technologies in order to enhance outcomes in the prevention and management of DFUs. The aim of this study is to examine the existing literature on the relationship between temperature, pressure and physical activity in the diabetic foot. To this end, a systematic review was conducted in accordance with the Preferred Reporting Items for Systematic Reviews and Meta-Analyses (PRISMA) format across the PubMed, Scopus and Web of Science databases, with no temporal restriction. A total of 14 studies were included in the review. The use of infrared thermography for the early detection of inflammatory tissue, plantar pressures and the monitoring of controlled PA can facilitate the close monitoring of changes that may pose a risk for the formation of UFDs and provide timely intervention, thereby personalising the PA of the diabetic patient.
1. Introduction
Diabetic Foot Syndrome (DFS) is defined by the World Health Organization as an ulceration of the foot (distally from the ankle and including the ankle) associated with neuropathy and different grades of ischaemia and infection []. The 10th edition of the Diabetes Atlas, published in July 2023 by the International Diabetes Federation, estimated that in 2021, 536.6 million individuals between the ages of 20 and 79 years were living with diabetes worldwide. The overall prevalence of diabetes worldwide among this demographic was 10.5%. It is notable that these data vary considerably from one region to another. For instance, the total number of people with diabetes was estimated at 61.4 million in Europe and 50.5 million in North America and the Caribbean, reaching 205.6 million in the Western Pacific region. The highest prevalence rate was calculated for the Middle East and North Africa, with a total of 16.2%. It is estimated that by 2045, the number of people living with diabetes will reach 783.2 million [].
In 2021, the total estimated global healthcare expenditure for individuals aged 20–79 years was 966 billion USD. The highest global expenditure was observed for men aged 60–69 years (132.5 billion USD), representing a 27.5% increase compared to the expenditure for women of the same age. The projected expenditure for adults in 2045 was estimated at USD 1054 billion, representing an increase of 9.1% compared to that in 2021 [].
DFS is associated with a number of conditions, including sensitive and motor neuropathy (which can result in foot deformities), peripheral artery disease (PAD), soft tissue infections and even osteomyelitis. It is estimated that approximately 50% of diabetic foot ulcers (DFUs) manifest on the plantar surface []. Neuropathy in diabetes is a heterogenous group of disorders that differ in terms of their clinical presentation and underlying pathophysiological mechanisms. Neurological alterations manifest at the sensory, motor and autonomic levels, resulting in dysfunction in the perception of thermoreceptors (cold or heat) and mechanoreceptors (pressure and vibration). Neuropathies can be classified as either “diffuse or symmetrical” (distal symmetrical polyneuropathy, acute autonomic and sensory neuropathy) or “focal or multifocal” (radicular plexus neuropathy, entrapment syndromes, cranial palsies and other mononeuropathies) []. The vascular alterations originate at the cellular level, manifesting as modified endothelial cell function and a subsequent reduction in vasodilator production, which in turn results in vasoconstriction. Furthermore, increased thromboxane A2 production results in hypercoagulation, thereby increasing the risk of ischaemia and ulceration [].
In accordance with the findings of Brand et al. [], the probability of actual breakdown and ulceration of the plantar soft tissue, in the event of a loss of painful sensation, is contingent upon three factors:
- The presence of diabetic neuropathy and its associated complications in the foot;
- The magnitude of the forces exerted upon the foot;
- The distance walked that results in the onset of tissue inflammation.
It is still considered that foot pressure represents a significant risk factor for the onset of foot complications. However, this is an inadequate method for predicting the onset of ulcers, as the predictive values cannot be determined [,]. The low specificity and sensitivity (46.3% and 63.5%, respectively) demonstrated by these studies for maximum pressures as pathological indicators suggest that pressure cannot be the sole factor associated with the development of plantar ulcers. In addition to plantar pressures, shear forces also have an important role to play in the development of diabetic foot lesions. Such forces can predict the location of higher shear pressure zones and increase plantar temperature, thereby accelerating tissue breakdown and leading to ulceration. It can therefore be concluded that there is a significant correlation between shear forces and temperature increase [,,]. Given that inflammation represents the initial stage in the formation of skin wounds, particularly in the absence of pain, the early identification of inflammatory areas can facilitate the prevention of diabetic foot ulcers. The utilisation of thermography as a diagnostic tool for the analysis of load patterns on the soles of the feet facilitates a more comprehensive understanding of the biomechanical factors associated with diabetic foot ulcers. This is achieved through the use of thermal cameras to identify areas of inflammation and critical points in the feet prior to the onset of any injury [,,].
A recent systematic review evaluated the predictive capacity of thermography in the diabetic foot. The authors posit that the utilisation of thermography as a predictive instrument has the potential to direct preventive measures with greater efficacy, thereby contributing to enhanced patient outcomes and an improved quality of life for those with DM [].
It is imperative that reliable evidence on the clinical effectiveness of preventive interventions be obtained in order to design effective care pathways that can reduce the risk of foot ulceration and its adverse consequences for people with diabetes, as well as to reduce associated healthcare costs. Physical activity is employed as a means of assisting glycemic control. It has been demonstrated that walking can positively impact glycemic control in individuals with diabetes []. Although there is moderate-certainty evidence that physical activity is associated with a decreased relative risk of total microvascular complications, particularly retinopathy, there is a paucity of research examining the relationship between physical activity and specific complications related to diabetes, such as ulcers in the foot and amputations []. Furthermore, there are insufficient data to support the hypothesis that physical exercise can delay the development of foot ulcers in people with diabetes [].
The optimal intensity of such activity remains unclear and is the subject of ongoing debate []. Despite the fact that walking is an activity that directly involves the feet, it is challenging to identify clear recommendations for the prevention of foot ulcers associated with walking. Conversely, there is a wealth of guidance available regarding footwear to avoid negative consequences for diabetic individuals when walking []. However, there is a paucity of evidence-based recommendations on the amount or intensity of walking to prevent physical activity from becoming a risk factor for developing an ulcer in the diabetic foot []. Hall et al. [] demonstrate that there are considerable increases in temperature following brief periods of walking at a relatively low distance. The authors indicate that a six-minute walking period results in a 5 °C increase in foot temperature. Burnfield et al. [] demonstrate that walking at faster speeds results in elevated plantar pressures. No studies have been conducted which examine both risk factors in the context of physical activity in diabetic patients. It is therefore essential to assess physical activity in diabetic patients, taking into account the temperature and pressure increases that may result from such activity [].
The application of machine learning in diverse fields of healthcare is already well established, and it holds considerable promise for the advancement of diabetes healthcare. With regard to the treatment of DFUs, the studies utilized to predict the progression of wound healing exhibit a notable degree of heterogeneity in their protocols, rendering a definitive recommendation for any single approach challenging [].
Given that walking is widely recommended as a means of controlling diabetes, and that there is a paucity of definitive objective data elucidating the specific types of walking that may prevent or promote the formation of ulcers in the diabetic foot, this study aims to ascertain whether the measurement of pressure and temperature in the foot can inform the recommendation of physical activity that does not lead to ulcer formation. The principal objective of this study is to examine the existing literature on the relationship between temperature, pressure and physical activity in the diabetic foot.
The secondary objectives of this study are as follows: 1. To identify studies that relate the plantar skin response after physical activity in diabetic patients to the development of ulcers. 2. To present the relationships that have been identified between exercise intensity, plantar pressure and plantar thermographic response.
2. Materials and Methods
2.1. Protocol and Identification of the Problem
This systematic review was conducted in accordance with the guidelines set by the Preferred Reporting Items for Systematic Reviews and Meta-Analyses (PRISMA) 2020 statement, an updated guideline for the publication of systematic reviews []. A systematic literature search was conducted to identify the scientific evidence on the relationship between plantar pressure and temperature as predictors and daily physical activity as a prognostic tool for plantar ulcers in diabetic subjects. The Population, Intervention, Comparison and Outcomes (PICO) strategies were defined for data research, as depicted in Table 1.

Table 1.
PICO research questions.
2.2. Research Question
What is the relationship between temperature, plantar pressure and physical activity in the diabetic foot?
2.3. Literature Search Strategy
The databases used were PubMed, Scopus and Web of Science (WOS). The Medical Subject Headings (MeSH) descriptors used were as follows: physical activity, exercise, diabetic foot, plantar pressure, plantar temperature and plantar thermography, combined using the Boolean operators “AND” and “OR”. The search strategy used was performed in databases during the third quarter of 2023. Three search strategies were used for all databases: 1. (Physical activity) AND (diabetic foot) AND (plantar pressure) AND (plantar temperature) OR (plantar thermography); 2. (exercise) AND (diabetic foot) AND (plantar pressure) AND (plantar temperature) OR (plantar thermography); and 3. ((physical activity) OR (exercise) OR (activ*) OR (exerc*)) AND (diabetic foot) AND ((plantar pressure) OR (press*)) AND ((plantar temperature) OR (plantar thermography) OR (temp*) OR (thermo*)).
2.4. Eligibility and Selection Criteria
The population to be studied consisted of diabetic and healthy adult patients, without distinction of sex and regardless of the type of diabetes, with or without diabetic neuropathy. Studies in Spanish or English language were accepted. All randomized and non-randomized clinical trials (RCTs), prospective and retrospective studies that referred to the use of plantar pressures and plantar temperature and/or plantar thermography as a tool for the early foot ulcer detection or injury were included, as well as those that referred to physical activity, regardless of the year of publication. Articles that analysed thermographic response of items like socks or foot insoles were excluded.
2.5. Data Collection
A Word document table was created to extract data from studies. The main data extracted were as follows: author name, year of publication, the purpose of study, number and type of included participants, methodology, intervention and outcomes.
2.6. Assessment of Study Methodology and Quality
In order to evaluate the methodological quality of the articles, two reviewers employed the PEDro scale, a validated instrument developed by consensus in Delhi by Verhagen et al. [], to conduct an independent assessment. The objective of this scale is to evaluate the methodological quality of a given study using 11 items, with a score ranging from 0 to 1. A score of 9–10 is indicative of an excellent methodology, 6–8 represents good methodological quality, 4–5 signifies fair quality, and a score below 4 points to poor methodological quality [,].
3. Results
A total of 894 references were identified through the application of search strategies. Following the screening process, a total of 14 studies were deemed suitable for inclusion in the review, as illustrated in Figure 1. Of the 14 selected articles, 12 (85.71%) are descriptive observational studies, while the remaining 2 (14.28%) are randomised clinical trials. Of the twelve descriptive observational studies, eight are cohort studies (66.66%), one is a cross-sectional study (8.33%), and three are case-control articles (25%).
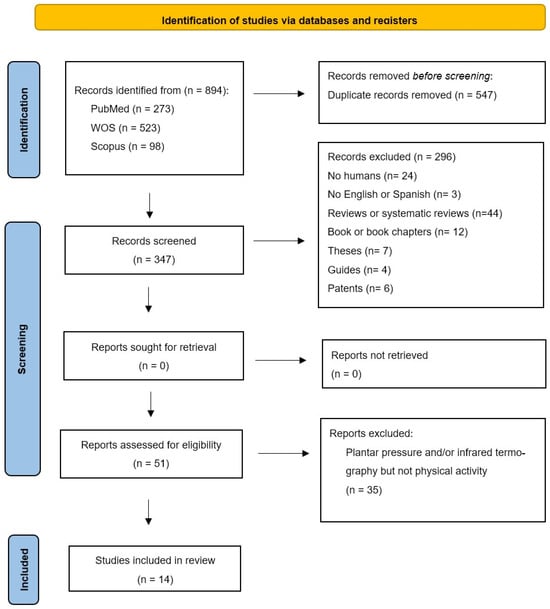
Figure 1.
PRISMA study selection flowchart.
With the exception of one article in Spanish, all of the articles have been published in English. The total number of patients included in the study was 2419, comprising two studies conducted in a military setting, with a total of 1000 patients. The male recruits were between the ages of 17 and 22, were in good health, and were members of the military [,]. The studies comprising smaller samples included between four and seven patients. The studies in question represent pilot studies on sports shoes or analytical models of wearable devices. The remaining studies have sample sizes ranging from 13 to 61 patients, with one study comprising a sample of 148 patients [].
The total sample size is 2207 men and 202 women aged 18 years and older. Of the total sample, 2190 individuals were identified as healthy patients, while 229 were diagnosed with diabetes. A total of four studies included diabetic patients, while two studies made reference to the specific type of diabetes. One study makes reference to subjects with type 1 and type 2 diabetes, while another refers to volunteers with type 2 diabetes.
The studies included were evaluated using the PEDro scale, and it was determined that the quality of the analysed studies is of a good standard, with an average rating of 6.28 points. Two articles were rated 9 points (14.28%), one article was rated 7 points (7.14%), eight articles were rated 6 points (57.14%), and the remaining articles were rated 5 points (21.42%). Despite the relative heterogeneity of the studies under analysis, a number of consistent quality criteria have emerged across the board.
Table 2 illustrates that the majority of studies employed a random sampling technique, with the exception of five studies that utilised convenience sampling. This approach may potentially limit the external validity of the results. However, all articles satisfied the criteria set out in items 10 and 11 of the statistical information, thereby addressing the potential for bias associated with convenience sampling and enhancing the external validity of the results, ensuring their applicability to the population of interest.
Table 2.
Articles’ methodology quality scores according to PEDro scale. “✓” meets requirement and “✗” does not meet requirement.
All studies complied with the stipulations set forth in item 9, which required the presentation of results for all subjects who received treatment or were assigned to the control group. In cases where this was not possible, data for at least one principal outcome were analysed in accordance with the “intention to treat” principle. This approach serves to reinforce the internal validity of the results, furnishing sufficient statistical information to inform clinical decision making.
Only two studies employed concealed allocation and masked subjects and assessors who measured at least one outcome. In all studies, none of the investigators who administered the therapy were blinded.
In view of the evolution of scientific production within the field under examination, as reflected in the data from the various databases, it is evident that over the 21-year period in question, a total of only seven articles have been published (between 1996 and 2017). However, an upward trend is observable in the period between 2019 and 2023, which encompasses the remaining seven articles included in this review. Furthermore, the subject matter demonstrates a notable increase between 2021 and 2022. This indicates that there has been a recent increase in interest in the use of thermography and plantar pressure distribution to detect plantar skin lesions in patients following physical activity.
Table 3 presents a summary of the characteristics of the fourteen studies included in this review. The studies were classified according to the following criteria: author, year of publication, aim of the study, methodology, participants, intervention and results.
Table 3.
Description of articles included in the systematic review.
4. Discussion
This review aimed to use foot ulcers as a prognostic tool to analyse the response of plantar tissue to daily physical activity while considering different plantar pressure and temperature variables in healthy and diabetic patients. The results of the various studies indicated that the quantity and type of activities examined to date were heterogeneous [,], resulting in significant inter-individual variations in accumulated load within plantar tissues. The research considered here [,] reached a consensus that plantar pressure and temperature increase during walking and other weight-bearing actions. This activity can be studied via thermography, which may facilitate the evaluation of skin degradation and the prevention of injuries in plantar tissues.
Maluf et al. [] observed a weak association between the maximum pressures recorded during walking and those recorded in the same participant during other daily activities. This finding indicates that foot pressure during walking may not accurately reflect the loads on plantar tissues during other activities of daily living. The authors argue that the magnitude and distribution of pressures in healthy individuals vary with different types of activity and walking speeds. This may explain why patients at risk of skin ulceration could not be identified based on a predetermined pressure threshold during ambulation and other physical activities.
Reddy et al. [] registered the foot temperature in two different age groups of participants (eighteen healthy volunteers: a group of eight subjects aged between 30 and 40 years old, and another group of ten subjects aged over 40 years old) while walking on a treadmill for 45 min. It was observed that there was a progressive increase in temperature as a result of walking cadence (5 °C over the first 23 min at a cadence of 80, 100 and 120 steps/minute). However, after 45 min of walking, the final temperature did not vary when compared with the baseline. This result was consistent with the findings of a subsequent study by Li et al. [], although the majority of the participants in the latter study were older (mean = 70 years) and the increase in temperature observed after walking for 30 min at 3 km/h was also lower (4 °C). Nevertheless, both studies indicate that there was a notable stabilisation or plateau effect on foot temperature during walking. The concept of a foot temperature plateau appears to be a reasonable assumption, given the physiological mechanisms that support heat generation, including muscle contractions, friction forces or viscoelastic heating, as well as factors that control heat loss, such as radiation, conduction and evaporation. However, further investigation would be required to confirm this hypothesis and explore its underlying mechanisms. Regardless, blood flow can either increase or dissipate temperature in different contexts.
In this line of research, Nemati et al. [] developed a model to describe the phenomenon of heat transfer in shod feet. This model was designed to predict the temperature of the sole of the foot, with a particular focus on the plantar arch and metatarsal area. Furthermore, the authors considered the impact of heat loss due to sweating during walking and running. They observed a maximum increase in foot temperature of 6 °C, 8 °C and 11.5 °C, respectively, after 30 min at speeds of 3, 6 and 9 km/h. The mean age of the participants in this latter study was 23.8 years. As observed in previous studies [,], the increase in temperature during walking and running was greater in younger participants. Nemati et al. [] demonstrated that the cooling of the plantar arch and metatarsal area as a thermoregulatory mechanism through sweating was minimal at a speed of 3 km/h. However, this mechanism became apparent in the plantar arch area after 15 min at 9 km/h and at 20 min at 6 km/h, although sweat in the metatarsal area was negligible at all of these speeds. Therefore, it can be concluded that sweating is a primary mechanism for regulating the plantar arch’s temperature, while its role in the metatarsal region is relatively minimal.
Niemann et al. [] reached the conclusion that there is a significant decrease in plantar temperature during prolonged periods of standing, which could potentially lead to plantar injuries, particularly in individuals engaged in work activities that require them to be in an upright position. The authors observed a pronounced decrease in temperature in the maximum pressure areas (fifth metatarsal head and big toe) after alternating six periods of prolonged standing (5, 10, 20, 5, 10, 19 and 20 min) with sitting periods (5 min each) in both healthy and diabetic participants. The pressure sensor recordings indicated that during longer periods of standing, intermittent pressure was observed in healthy individuals, but not in those with diabetes and polyneuropathy. In light of the crucial role played by the blood supply to tissues, it seems plausible to suggest that patients with diabetes may potentially experience critical tissue ischaemia when exposed to their own body weight for extended periods of time. This is due to the fact that they do not appear to experience foot discomfort in a manner that is comparable to that of healthy volunteers [].
In Carbonell et al.’s study [], thermographic images were taken in both diabetic patients and a healthy control group before and after walking 100 m barefoot on a treadmill at a self-selected speed. The temperature of the feet of the diabetic individuals decreased to a greater extent than that of the healthy individuals at all ROIs analysed (left and right big toe, forefoot, midfoot and rearfoot), with the greatest temperature differences between the groups observed in the rearfoot and forefoot (1.0 °C), although these differences were not statistically significant.
In DiBenedetto et al.’s [] study employing infrared imaging to examine the feet in a military training context, they posited that any abrupt increase in weight-bearing activities (such as walks or prolonged runs) resulted in a heightened emission of heat in the regions that received the greatest pressure during the gait cycle, as evidenced by thermographic imaging. The authors identified typical foot parameters by dividing the feet into four regions: the toes, heel, forefoot and rearfoot. They observed a temperature difference of 1.1 °C across the entire thermographic foot image. In contrast, the typical range for the greatest temperature differential between the hottest and coldest areas of the foot is 3 °C to 5 °C. Values exceeding 6 °C are indicative of underlying pathology. It is noteworthy that these findings align with those reported by Reddy et al. [], who observed a 5 °C increase in plantar temperature during walking. Additionally, DiBenedetto et al. [] proposed a temperature threshold of 6 °C, above which a foot injury would be identified. The authors demonstrated that the warmest areas were observed in injured feet and at the greatest pressure points, despite the absence of discomfort in these patients. It is noteworthy that in instances where stress fractures were suspected but radiological findings were negative, thermography remained a sensitive indicator of this pathology. Indeed, a positive correlation was observed between stress fractures, thermography and gammagraphy in 66% of cases. Therefore, it is evident that a qualitative and quantitative evaluation of thermograms is essential to establish a correlation between their results and clinical findings.
Vasomotor changes associated with foot injuries are not limited to hyperthermia; hypothermia may also be a contributing factor. This phenomenon was also investigated by Di Benedetto et al. [] in 1000 military recruits undergoing basic training, with the condition being referred to as reflex sympathetic dystrophy. The authors highlighted that qualitative thermogram interpretation demonstrated high sensitivity for anomaly recognition but low specificity in diagnostic terms. Furthermore, it is challenging to differentiate temperature alterations resulting from bone or soft tissue injuries and to ascertain the extent of these lesions []. This is due to the fact that regions exhibiting elevated temperatures indicate an enhanced vascular response to injury, although this is not always confined to the precise location of the lesion. In comparison to bone injuries, soft tissue injuries frequently manifest as even more elevated temperatures on thermograms. This may be attributed to the discrepancy in depth between bones and the more superficially located and more readily injured soft tissues. Therefore, thermography can be a valuable addition to the diagnostic process, particularly in understanding the pathophysiology of foot stress. However, it is essential to complement this with detailed clinical examinations and other complementary tests, as there are currently no consistent criteria to help establish a foot diagnosis based on thermograms alone.
It is of particular significance that Reddy et al. [] demonstrated a moderate correlation between increased plantar temperature and vertical foot pressure. The authors proposed a potential correlation between foot load, foot pressure and plantar temperature fluctuations in relation to shear forces.
Yavuz et al. [] employed the use of a thermal infrared camera and a bespoke shear force plate to investigate the potential correlation between plantar tensions and elevated foot sole temperature following exercise. Following a 10 min period of walking, pressure, stress and shear data were recorded, and thermograms were performed before and after the exercise. This resulted in the identification of a moderate linear relationship between shear forces and maximum post-exercise plantar temperature (r = 0.78, p = 0.0002). It is hypothesised that the elevation in plantar temperature resulting from physical exertion is more closely associated with shear forces than triaxle plantar stresses. However, it should be noted that thermal cameras are not a reliable method for predicting shear stress forces. However, the results from Priego Quesada et al. [] indicated an inverse relationship between foot eversion and thermal symmetry immediately after running, with the medial ROIs exhibiting higher temperatures than the lateral ROIs (p < 0.05), which differed from the findings of Yavuz et al. []. Similarly, Catalá-Vilaplana et al. [] examined the impact of footwear instability on foot sole temperature after walking for 10 min at 1.44 m/s with each shoe type (with two hours of rest between each test). The authors identified a significant difference in the results for the midfoot area (p = 0.004, ES = 1.2). One potential explanation for this result is that the portion of the foot experiencing reduced contact time during the stance phase may be subjected to increased friction with the footwear. This would result in a greater temperature increase [], which would also remain more constant in unstable shoes due to the alteration in plantar distribution that they create [].
The study by Cuaderes et al. [] examined diabetic patients who either engaged in weight-bearing activities at a moderate intensity (athletes) or did not perform such activities (non-athletes). Significant differences were identified in pressure, temperature and the plantar surface skin temperature gradient between the two cohorts. This was particularly evident among athletes, where the temperature gradient was higher in the first metatarsal head of these participants than in those who did not engage in exercise (athletes: mean value = 1.66 ± 1.31/non-athletes: mean value = 1.20 ± f 1.20/p-value = 0.02). The authors identified a single significant linear relationship between plantar pressure and weight-bearing activity in athletes, specifically in the second and third metatarsal heads of the right foot. The correlation coefficients were 0.237 and 0.264, respectively, with a p-value of 0.02 and 0.01, respectively. Similarly, Perren et al. [] conducted pressure tests on healthy and diabetic participants with and without complications (peripheral arterial disease or neuropathy) who walked for 15 min on a motorised treadmill. One minute after cessation of ambulation, thermograms of the hallux, medial, central and lateral aspects of the forefoot and heel were obtained. A positive correlation was observed between temperature and plantar pressure in ROIs of the hallux, second to fifth metatarsal heads and heel in diabetic patients with complications. In contrast, this relationship was only evident in the fifth metatarsal head in both the healthy and diabetic participants without complications (p < 0.05). There was also a positive correlation for all ROIs in the group with diabetes (both with and without complications) and only for the second to fifth metatarsal head in the group of healthy participants (p < 0.05). This work demonstrated that there was a positive correlation between pressure and temperature: as pressure increased, temperature also increased. There was a tendency for pressure areas to warm up in healthy individuals, including those with uncomplicated diabetes, and this correlation was stronger in diabetic patients with complications [].
Similarly, Cuaderes et al. [] observed higher plantar pressures in sportswomen, while Jimenez et al. [] observed higher plantar temperatures in women versus men for all ROIs, including the forefoot. The mean temperatures were 12.3 vs. 9.8 °C (p = 0.004) for the forefoot and 9.3 vs. 8.0 °C (p = 0.047) for the midfoot, and a statistically significant difference was observed between the two groups (10.7 vs. 8.7 °C, p = 0.003). It can therefore be concluded that the data indicate that there are higher plantar pressures and temperatures in female athletes than in their male counterparts. Subsequently, Jiménez et al. [] investigated the correlation between pressure and plantar foot temperature and/or shoe sole type in athletes. The participants engaged in 30 min of treadmill running at a 1% incline, following a 6 min warm-up period. The highest plantar pressure values were recorded for the forefoot (p < 0.001), although the authors did not distinguish specific ROIs as in previous studies. Nevertheless, no significant differences were observed between the forefoot and midfoot in terms of plantar temperature, although lower values were noted in the hindfoot (p < 0.001). Therefore, as also concluded by Reddy et al. [], there was no evidence to suggest that plantar temperature was related to plantar pressure.
Limitations and Future Research Lines
Since its initial identification, the diabetic foot has been acknowledged for its intrinsic complexity, which presents a considerable clinical challenge. One of the primary challenges is the clinical heterogeneity among patients, which hinders the ability to generalise clinical decisions. Furthermore, this issue is compounded in the domain of prevention []. In recent years, machine learning has emerged as a key tool in the field of personalised medicine [].
In the specific context of the diabetic foot, Guan et al. [] published a recent narrative review to explore the transformative impact of machine learning on managing diabetic foot complications. The authors evaluated the application of machine learning in the analysis of thermographic images, biomarkers and gait biomechanics. The review highlights that the application of infrared thermography could help detect an increase in plantar temperature before the onset of DFUs. The authors show that the distribution of plantar temperature can be heterogeneous, which complicates its quantification and use to predict results. The creation of a comprehensive thermographic image database could facilitate the development of thermographic standards and enhance the comparability of results.
It is also notable that there is a paucity of research examining the utilisation of machine learning in the analysis of gait biomechanics and its associated outcomes []. The integration of thermal imaging with physical activity data has the potential to enhance clinical recommendations and to provide a more extensive database for future telemedicine applications.
In this way, the identification of studies that relate thermography, pressure and physical activity not only provides useful information for current healthcare practice but also identifies the data sources that are necessary for inclusion in future computer applications.
It is essential to take into account the constraints of this review when analysing the results. One of the principal limitations is the methodological diversity observed in the design of the studies. A further challenge is the difficulty in identifying potential relevant unpublished research. In conclusion, the majority of the estimated results are based on observational studies, which may be subject to bias. To ascertain the optimal level of physical activity for the management of diabetes without the risk of developing diabetic foot ulcers, longitudinal studies are required. Nevertheless, a detailed analysis of these studies enabled the establishment of relationships with significant implications for clinical practice, which may provide guidance for future research.
To date, no studies have been identified that examine the relationship between physical activity and the inflammatory response of plantar tissues, as assessed by thermography and pressure distribution, in patients with diabetes. It is thus evident that further research is required in this area in order to predict plantar skin lesions and prevent the development of pressure ulcers (UPD). The current recommendations for the prevention of UPD are based on limiting or eliminating physical activity. It is therefore evident that further research is required in order to explore the potential for a more personalised approach to the prevention of UPD.
5. Conclusions
The findings of this systematic review demonstrate that the magnitude and distribution of pressures experienced by healthy and diabetic subjects differ between different types of activity. Furthermore, load patterns are modified by walking speed. Similarly, there is a 5 °C increase in foot temperature when walking, and a temperature threshold of 6 °C may prove useful in the detection or prediction of a foot injury. For all of these reasons, the use of thermographic evaluation of plantar temperature and pressure changes during exercise may prove an effective method of preventing plantar lesions in the diabetic foot.
Author Contributions
M.P.R.-D. participated in the conception and design of the study, completed the literature research, was involved in the analysis and interpretation of the results and drafted the article. I.J.-R. and M.I.-R. participated in the conception and the design of the study, were involved in the analysis and interpretation of the results and reviewed the article critically for important intellectual content. M.M. and M.A. reviewed the article critically for important intellectual content. All authors have read and agreed to the published version of the manuscript.
Funding
This research received no external funding.
Institutional Review Board Statement
Not applicable.
Informed Consent Statement
Not applicable.
Data Availability Statement
Data are contained within the article.
Conflicts of Interest
The authors declare no conflicts of interest.
References
- Monteiro-Soares, M.; Hamilton, E.J.; Russell, D.A.; Srisawasdi, G.; Boyko, E.J.; Mills, J.L.; Jeffcoate, W.; Game, F. Guidelines on the classification of foot ulcers in people with diabetes (IWGDF 2023 update). Diabetes Metab. Res. Rev. 2024, 40, e3648. [Google Scholar] [CrossRef] [PubMed]
- GBD 2021 Diabetes Collaborators. Global, regional, and national burden of diabetes from 1990 to 2021, with projections of prevalence to 2050: A systematic analysis for the Global Burden of Disease Study 2021. Lancet Lond. Engl. 2023, 402, 203–234. [Google Scholar] [CrossRef] [PubMed]
- Fitridge, R.; Chuter, V.; Mills, J.; Hinchliffe, R.; Azuma, N.; Behrendt, C.; Boyko, E.J.; Conte, M.S.; Humphries, M.; Kirksey, L.; et al. The intersocietal IWGDF, ESVS, SVS guidelines on peripheral artery disease in people with diabetes and a foot ulcer. Diabetes Metab. Res. Rev. 2024, 40, e3686. [Google Scholar] [CrossRef] [PubMed]
- Atmaca, A.; Ketenci, A.; Sahin, I.; Sengun, I.S.; Oner, R.I.; Tilki, H.E.; Adas, M.; Soyleli, H.; Demir, T. Expert opinion on screening, diagnosis and management of diabetic peripheral neuropathy: A multidisciplinary approach. Front. Endocrinol. 2024, 15, 1380929. [Google Scholar] [CrossRef] [PubMed]
- Gallagher, K.A.; Mills, J.L.; Armstrong, D.G.; Conte, M.S.; Kirsner, R.S.; Minc, S.D.; Plutzky, J.; Southerland, K.W.; Tomic-Canic, M.; on behalf of the American Heart Association Council on Peripheral Vascular Disease; et al. Current Status and Principles for the Treatment and Prevention of Diabetic Foot Ulcers in the Cardiovascular Patient Population: A Scientific Statement from the American Heart Association. Circulation 2024, 149, e232–e253. [Google Scholar] [CrossRef]
- Brand, P.W. Tenderizing the foot. Foot Ankle Int. 2003, 24, 457–461. [Google Scholar] [CrossRef]
- Lavery, L.A.; Armstrong, D.G.; Wunderlich, R.P.; Tredwell, J.; Boulton, A.J. Predictive value of foot pressure assessment as part of a population-based diabetes disease management program. Diabetes Care 2003, 26, 1069–1073. [Google Scholar] [CrossRef]
- Yavuz, M. American Society of Biomechanics Clinical Biomechanics Award 2012: Plantar shear stress distributions in diabetic patients with and without neuropathy. Clin. Biomech. 2014, 29, 223–229. [Google Scholar] [CrossRef]
- Yavuz, M.; Botek, G.; Davis, B.L. Plantar shear stress distributions: Comparing actual and predicted frictional forces at the foot–ground interface. J. Biomech. 2007, 40, 3045–3049. [Google Scholar] [CrossRef]
- Macdonald, A.; Petrova, N.; Ainarkar, S.; Allen, J.; Plassmann, P.; Whittam, A.; Bevans, J.; Ring, F.; Kluwe, B.; Simpson, R.; et al. Thermal symmetry of healthy feet: A precursor to a thermal study of diabetic feet prior to skin breakdown. Physiol. Meas. 2016, 38, 33–44. [Google Scholar] [CrossRef]
- Hernández-Contreras, D.; Peregrina-Barreto, H.; Rangel-Magdaleno, J.; González-Bernal, J.A.; Altamirano-Robles, L. A quantitative index for classification of plantar thermal changes in the diabetic foot. Infrared Phys. Technol. 2017, 81, 242–249. [Google Scholar] [CrossRef]
- Armstrong, D.G.; Holtz-Neiderer, K.; Wendel, C.; Mohler, M.J.; Kimbriel, H.R.; Lavery, L.A. Skin temperature monitoring reduces the risk for diabetic foot ulceration in high-risk patients. Am. J. Med. 2007, 120, 1042–1046. [Google Scholar] [CrossRef] [PubMed]
- Thakku Sivakumar, D.; Murray, B.; Moore, Z.; Patton, D.; O’Connor, T.; Avsar, P. Can thermography predict diabetic foot ulcer risk in patients with diabetes mellitus? A systematic review. J. Tissue Viability 2024. [CrossRef]
- Aune, D.; Norat, T.; Leitzmann, M.; Tonstad, S.; Vatten, L.J. Physical activity and the risk of type 2 diabetes: A systematic review and dose-response meta-analysis. Eur. J. Epidemiol. 2015, 30, 529–542. [Google Scholar] [CrossRef] [PubMed]
- Crawford, F.; Nicolson, D.J.; Amanna, A.E.; Smith, M. Reliability of the evidence to guide decision-making in foot ulcer prevention in diabetes: An overview of systematic reviews. BMC Med. Res. Methodol. 2022, 22, 274. [Google Scholar] [CrossRef] [PubMed]
- Rietz, M.; Lehr, A.; Mino, E.; Lang, A.; Szczerba, E.; Schiemann, T.; Herder, C.; Saatmann, N.; Geidl, W.; Barbaresko, J.; et al. Physical Activity and Risk of Major Diabetes-Related Complications in Individuals with Diabetes: A Systematic Review and Meta-Analysis of Observational Studies. Diabetes Care 2022, 45, 3101–3111. [Google Scholar] [CrossRef]
- Lung, C.W.; Wu, F.L.; Liao, F.; Pu, F.; Fan, Y.; Jan, Y.K. Emerging technologies for the prevention and management of diabetic foot ulcers. J. Tissue Viability 2020, 29, 61–68. [Google Scholar] [CrossRef]
- Bus, S.A.; Sacco, I.C.N.; Monteiro-Soares, M.; Raspovic, A.; Paton, J.; Rasmussen, A.; Lavery, L.A.; van Netten, J.J. Guidelines on the prevention of foot ulcers in persons with diabetes (IWGDF 2023 up-date). Diabetes Metab. Res. Rev. 2024, 40, e3651. [Google Scholar] [CrossRef]
- Jayedi, A.; Zargar, M.S.; Emadi, A.; Aune, D. Walking speed and the risk of type 2 diabetes: A systematic review and meta-analysis. Br. J. Sports Med. 2024, 58, 334–342. [Google Scholar] [CrossRef]
- Hall, M.; Shurr, D.G.; Zimmerman, M.B.; Saltzman, C.L. Plantar foot surface temperatures with use of insoles. Iowa Orthop. J. 2004, 24, 72–75. [Google Scholar]
- Burnfield, J.M.; Few, C.D.; Mohamed, O.S.; Perry, J. The influence of walking speed and footwear on plantar pressures in older adults. Clin. Biomech. 2004, 19, 78–84. [Google Scholar] [CrossRef] [PubMed]
- Weatherall, T.; Avsar, P.; Nugent, L.; Moore, Z.; McDermott, J.H.; Sreenan, S.; Wilson, H.; McEvoy, N.L.; Derwin, R.; Chadwick, P.; et al. The impact of machine learning on the prediction of diabetic foot ulcers—A systematic review. J. Tissue Viability 2024. [CrossRef] [PubMed]
- Page, M.J.; McKenzie, J.E.; Bossuyt, P.M.; Boutron, I.; Hoffmann, T.C.; Mulrow, C.D.; Moher, D.; Shamseer, L.; Tetzlaff, J.; Akl, E.A.; et al. PRISMA 2020 statement: An updated guide for the publication of systematic reviews. Span. J. Cardiol. 2021, 74, 790–799. [Google Scholar] [CrossRef]
- Verhagen, A.P.; De Vet, H.C.; De Bie, R.A.; Kessels, A.G.; Boers, M.; Bouter, L.M.; Knipschild, P.G. The Deplphilist: A criteria list for quality assessment of randomized clinical trials for conducting systematic reviews developed by Delphi consensus. J. Clin. Epidemiol. 1998, 51, 1235–1241. [Google Scholar] [CrossRef]
- Albanese, E.; Bütikofer, L.; Armijo-Olivo, S.; Ha, C.; Egger, M. Construct validity of the Physiotherapy Evidence Database (PEDro) quality scale for randomized trials: Item response theory and factor analyses. Res. Synth. Methods 2020, 11, 227–236. [Google Scholar] [CrossRef]
- Escala PEDro—PEDro. Available online: https://pedro.org.au/spanish/resources/pedro-scale/ (accessed on 12 April 2023).
- Di Benedetto, M.; Huston, C.W.; Sharp, M.W.; Jones, B. Regional hypothermia in response to minor injury. Am. J. Phys. Med. Rehabil. 1996, 75, 270–277. [Google Scholar] [CrossRef]
- Di Benedetto, M.; Yoshida, M.; Sharp, M.; Jones, B. Foot evaluation by infrared imaging. Mil. Med. 2002, 167, 384–392. [Google Scholar] [CrossRef]
- Cuaderes, E.; DeShea, L.; Lamb, W.L. Weight-Bearing Exercise and Foot Health in Native Americans. Care Manag. J. 2014, 15, 184–195. [Google Scholar] [CrossRef]
- Maluf, K.S.; Morley, R.E., Jr.; Richter, E.J.; Klaesner, J.W.; Mueller, M.J. Monitoring in-shoe plantar pressures, temperature, and humidity: Reliability and validity of measures from a portable device. Arch. Phys. Med. Rehabil. 2001, 82, 1119–1127. [Google Scholar] [CrossRef]
- Reddy, P.N.; Cooper, G.; Weightman, A.; Hodson-Tole, E.; Reeves, N.D. Walking cadence affects rate of plantar foot temperature change but not final temperature in younger and older adults. Gait Posture 2017, 52, 272–279. [Google Scholar] [CrossRef]
- Li, P.L.; Yick, K.L.; Yip, J.; Ng, S.P. Influence of Upper Footwear Material Properties on Foot Skin Temperature, Humidity and Perceived Comfort of Older Individuals. Int. J. Environ. Res. Public Health 2022, 19, 10861. [Google Scholar] [CrossRef] [PubMed]
- Nemati, H.; Naemi, R. An Analytical Model to Predict Foot Sole Temperature: Implications to Insole Design for Physical Activity in Sport and Exercise. Appl. Sci. 2022, 12, 6806. [Google Scholar] [CrossRef]
- Niemann, U.; Spiliopoulou, M.; Malanowski, J.; Kellersmann, J.; Szczepanski, T.; Klose, S.; Dedonaki, E.; Walter, I.; Ming, A.; Mertens, P.R. Plantar temperatures in stance position: Comparative study with healthy volunteers and diabetes patients diagnosed with sensoric neuropathy. EBioMedicine 2020, 54, 102712. [Google Scholar] [CrossRef] [PubMed]
- Carbonell, L.; Quesada, J.I.P.; Retorta, P.; Benimeli, M.; M, R.; De Anda, C.O.; Palmer, R.S.; Macián-Romero, C. Thermographic quantitative variables for diabetic foot assessment: Preliminary results. Comput. Methods Biomech. Biomed. Eng. Imaging Vis. 2018, 7, 660–666. [Google Scholar] [CrossRef]
- Yavuz, M.; Brem, R.W.; Davis, B.L.; Patel, J.; Osbourne, A.; Matassini, M.R.; Wood, D.A.; Nwokolo, I.O. Temperature as a predictive tool for planting triaxial loading. J. Biomech. 2014, 47, 3767–3770. [Google Scholar] [CrossRef]
- Priego Quesada, J.I.P.; Gil-Calvo, M.; Jimenez-Perez, I.; Lucas-Cuevas, Á.G.; Pérez-Soriano, P. Relationship between foot eversion and thermographic foot skin temperature after running. Appl. Opt. 2017, 56, 5559–5565. [Google Scholar] [CrossRef]
- Catalá-Vilaplana, I.; García-Domínguez, E.; Aparicio, I.; Ortega-Benavent, N.; Marzano Felisatti, J.M.; Sanchis-Sanchis, R. Effect of unstable sports footwear on acceleration impacts and plantar surface temperature during walking: A pilot study. Retos 2023, 49, 1004–1010. [Google Scholar] [CrossRef]
- Perren, S.; Formosa, C.; Camilleri, L.; Chockalingam, N.; Gatt, A. The Thermo-Pressure Concept: A New Model in Diabetic Foot Risk Stratification. Appl. Sci. 2021, 11, 7473. [Google Scholar] [CrossRef]
- Jimenez, I.; Gil, M.; Salvador, R.; de Anda, R.M.C.O.; Pérez, P.; Priego, J.I. Footwear outsole temperature may be more related to plantar pressure during a prolonged run than foot temperature. Physiol. Meas. 2021, 42, 074004. [Google Scholar] [CrossRef]
- Schaper, N.C.; van Netten, J.J.; Apelqvist, J.; Bus, S.A.; Fitridge, R.; Game, F.; Monteiro-Soares, M.; Senneville, E.; the IWGDF Editorial Board. Practical guidelines on the prevention and management of diabetes-related foot disease (IWGDF 2023 update). Diabetes Metab. Res. Rev. 2024, 40, e3657. [Google Scholar] [CrossRef]
- Haug, C.J.; Drazen, J.M. Artificial Intelligence and Machine Learning in Clinical Medicine, 2023. N. Engl. J. Med. 2023, 388, 1201–1208. [Google Scholar] [CrossRef] [PubMed]
- Guan, H.; Wang, Y.; Niu, P.; Zhang, Y.; Zhang, Y.; Miao, R.; Fang, X.; Yin, R.; Zhao, S.; Liu, J.; et al. The role of machine learning in advancing diabetic foot: A review. Front. Endocrinol. 2024, 15, 1325434. [Google Scholar] [CrossRef] [PubMed]
Disclaimer/Publisher’s Note: The statements, opinions and data contained in all publications are solely those of the individual author(s) and contributor(s) and not of MDPI and/or the editor(s). MDPI and/or the editor(s) disclaim responsibility for any injury to people or property resulting from any ideas, methods, instructions or products referred to in the content. |
© 2024 by the authors. Licensee MDPI, Basel, Switzerland. This article is an open access article distributed under the terms and conditions of the Creative Commons Attribution (CC BY) license (https://creativecommons.org/licenses/by/4.0/).