Article

Experimental Analysis of Thermal Performance and Evaluation of Vibration and Utility Function for the Readaptation of a Residential Building in an Experimental Housing Complex

by
Małgorzata Fedorczak-Cisak
1,*,
Alicja Kowalska-Koczwara
1,*,
Piotr Stecz
1,
Anna Shymanska
2 and
Davide Ottaviano Palmieri
3
1
Faculty of Civil Engineering, Cracow University of Technology, Warszawska 24, 31-155 Kraków, Poland
2
Faculty of Electrical and Computer Engineering, Cracow University of Technology, Warszawska 24, 31-155 Kraków, Poland
3
Department of Architecture, Construction and Design, Polytechnic University of Bari, Via Orabona 4, 70122 Bari, Italy
*
Authors to whom correspondence should be addressed.
Appl. Sci. 2024, 14(19), 8727; https://doi.org/10.3390/app14198727
Submission received: 27 August 2024 / Revised: 20 September 2024 / Accepted: 24 September 2024 / Published: 27 September 2024
(This article belongs to the Section Energy Science and Technology)

Abstract

:
The construction sector is a significant contributor to energy consumption and emissions. With the steady increase in the cost of energy carriers and the costs of energy production, the cost for consumers is also increasing. Therefore, the search for solutions capable of reducing energy consumption by increasing the energy efficiency of building structures, in particular the use of prefabricated timber-frame technology, is ongoing. Recent energy supply uncertainties and high costs necessitate the pursuit of green solutions. Timber construction, especially prefabricated timber-frame technology, holds promise due to its renewability and energy efficiency. However, housing estates built using this technology often lack service infrastructure, like shops, crèches, kindergartens, and offices, affecting resident comfort. This study proposes a methodology to select the optimal utility function for a residential building in such an estate, thus enhancing living conditions. The building’s potential new functions—a shop, nursery, or office—were evaluated based on economic criteria, thermal comfort, building airtightness, energy efficiency, and vibration comfort. The analysis indicates that converting the building into a shop requires the least capital investment, making it the most economically beneficial option.

1. Introduction

Construction remains one of the fastest-growing sectors of the economy. In 2021, compared to the previous year, there was an increase in the number and area of dwellings delivered. However, the area of non-residential buildings handed over for use decreased. In 2021, 234,900 dwellings were handed over for use, with a total floor area of 21.8 million m2 and a number of rooms equal to 917,800. Compared with the previous year, increases were recorded in the number of dwellings by 14,100 (6.4%), the floor area of dwellings by 2.2 million m2 (11.3%), and the number of rooms by 84,800 (10.2%) [https://stat.gov.pl/ (accessed on 26 August 2024)]. Single-family houses comprised 97.3% of all these new constructions. The Polish housing construction market is a very traditional market based on masonry construction. The concerns of timber building technology refer to aspects, such as structural safety, durability, etc. The approach of investors is slowly changing. Timber construction technology, in particular, addresses these concerns. Over the past five years, the number of timber-framed buildings in Poland has more than doubled, reaching 905 structures in 2020 [https://inzynierbudownictwa.pl/pojemnosc-cieplna-scian-o-konstrukcji-szkieletowej-drewnianej/ (accessed on 26 August 2024)]. Investors are increasingly prioritizing health, comfort, and environmental sustainability.Timber construction technology, in particular, addresses these concerns. Over the past five years, the number of timber-framed buildings has more than doubled, with 905 timber-framed structures built in Poland in 2020 [1]. Experts in Polish timber-framed houses highlight the growing trend of constructing timber-framed structures. The market potential is much greater than currently realized. According to experts, up to 15,000 timber-framed buildings can be constructed annually. Timber has advantages over traditional materials, like brick or concrete, due to its natural properties, renewability, and recyclability [1]. The most rapidly developing technology in timber construction is prefabrication. Prefabrication technology allows for the rapid construction of both individual buildings and entire housing estates. This rate of construction leads directly to lower costs and a reduced carbon footprint during the construction phase. Timber prefabrication technology offers many benefits for both the environment and users. Timber is a natural raw material that is renewable and biodegradable [2,3]. Timber prefabrication significantly reduces construction waste and energy consumption compared to traditional methods [4,5] even if the resulting buildings are sensitive to wind-induced vibrations [6] that they should be controlled. The production of prefabricated timber elements consumes much less energy than steel or concrete, leading to lower carbon emissions. This technology also offers the benefits of fast construction, high accuracy, and a reduced likelihood of errors. One of the key advantages of timber-frame construction is that the structure itself offers excellent thermal insulation. Timber is a natural insulator, and the wall cross-sections in this technology allow for insulation both between the structural elements (posts and beams) and on the exterior and interior surfaces. These benefits are especially important as the construction industry faces rapid changes in energy standards, driven by climate change, the depletion of non-renewable resources, and worsening environmental conditions. New technologies must comply with stringent energy efficiency requirements. Since 2021, new standards for nearly zero-energy buildings (nZEB) have been in effect in Europe. Table 1 illustrates the thermal insulation requirements for external walls in selected European countries, as well as for the external walls of passive buildings.
The high thermal insulation performance of a timber-frame building envelope results in low heat capacity. This is due to the use of lightweight thermal insulation materials, such as wool and polystyrene, which have a low density per square meter of the envelope, as well as low conductivity. While this provides excellent thermal insulation properties (a low heat transfer coefficient), it does not allow for the accumulation of large amounts of heat within the partition mass [9]. Low thermal stability can lead to increased energy consumption, as the building lacks sufficient mass to store and later use the accumulated heat. Additionally, low thermal capacity can result in unstable indoor temperature conditions. The use of large glazings without sunshades further negatively impacts indoor thermal comfort [10,11,12].
Another critical aspect of designing buildings with prefabricated timber technology, in addition to ensuring thermal comfort, is to provide optimal vibration comfort for users. This is particularly important for buildings located near busy streets, railway tracks, or in mining areas. The lightweight frame construction transmits vibrations from external sources very efficiently. Vibrations propagating through the ground into a building can be hazardous to the building structure or accelerate its damage, and they can also be a nuisance to people who perceive vibrations passively [13]. In extreme cases, it can lead to sleep disturbances, headaches, and neurotic conditions. Therefore, people inside buildings should be protected from harmful vibrations. Vibration comfort depends on several factors, such as the time of day (day or night), the position of the human body when receiving the stimulus (lying, sitting, or standing), the purpose of the room (office, residential, etc.), and the frequency of vibration. The most common method of assessing vibration comfort is the RMS (root mean square) method [14,15,16]. This evaluation method is often referred to as the primary method, while VDV (vibration dose value) and MTVV (maximum transient vibration value) are additional methods [17].
An experimental housing estate of prefabricated timber-frame buildings was selected for the analysis presented in this paper. The housing estate is located near a busy road not far from a city in southeastern Poland. Many similar estates are located on the outskirts of large cities in Poland. Many users appreciate living outside the city, citing peace, quiet, greenery, and clean air as benefits. However, suburban housing estates have “weak points” due to the lack of quick access to essential amenities, such as shops, crèches, kindergartens, and offices. The ideal solution would be to provide the necessary infrastructure to the residents of the housing estate community, but developers usually build quickly and cheaply, then sell the buildings as flats. This approach is contrary to the concept of 15-min cities, an urban planning idea that assumes residents should have easy access to all basic services and attractions within a maximum of 15 min on foot or by bicycle. The concept promotes creating more sustainable, resident-friendly cities, reducing the need for cars and lowering travel time and costs to access needed services. The idea of the 15-minute city is gaining interest among urban planners and decisionmakers as a way to improve the quality of life for residents, reduce the negative impacts of urbanization on the environment, and promote healthy living and social equality.
The authors described the 15-minute city concept as an approach to urban planning that aims to provide citizens with various daily services within a short distance [18]. According to the authors, there is a lack of research on applying this concept in smaller cities and areas. The methodology developed in the study presented by the authors allows us to evaluate whether the existing infrastructure in residential complexes can be intervened by changing the function and satisfy the needs of the population of the area (prioritizing thermal comfort, comfort due to vibrations, and economic aspects, among others). The need for datasets to assess mobility accessibility in urban areas was discussed [19]. A comparative analysis of urban accessibility was made for two university campuses and their surrounding urban areas. The authors presented the Urban Mobility Accessibility Assessment Tool (UrMoAC) to assess accessibility measures in each neighborhood using available data. UrMoAC calculates distances and average travel times from block groups to major destinations using different modes of transport, considering the area’s morphology. The results obtained by the authors can be used to develop public policies that address the specific accessibility needs of communities.
The concept of a 15-minute city, where the basic assumption is that critical urban services and amenities should be accessible within a maximum of 15 min by foot or bicycle from the place of residence, was reviewed in the light of emerging social, physical, and structural changes by 2030, with a focus on European cases [20]. The results provide important additions and recommendations to the urban planning principles of 15-minute cities in terms of proximity-based planning, land use and urban form, urban governance and citizen participation, and inclusive digitization. In this article, the authors have attempted to transfer the idea of 15-minute cities to the scale of a housing estate located outside the city or on its outskirts. This approach aims to eliminate the discomfort of residents caused by the location of essential services far from the settlement (e.g., in the city). Reaching these services is time-consuming and requires travel by car or other means, generating air pollution and harmful gas emissions. In the suburban housing estate under study, there is the possibility of using one building for non-residential purposes. The research problem to be solved is an optimization analysis based on and validated by the results of measurements conducted on a real object. The novelty of this work consists of the practical application of well-known methods of multicriterial analysis based on the analysis of available measurement results carried out by the authors on a real object, aimed at the early forecasting of the qualitative indicator of costs in implementing various utility functions, which is an important stage in preparing offers for potential investors. The research gap is the lack of studies in the literature for smaller 15-minute areas on the scale of isolated housing estates located on the urban fringe.
The construction industry both in Poland and globally is currently undergoing rapid changes. Energy-efficient, ecological, climate-neutral, and economical homes are now a priority in design. Prefabricated timber-frame construction meets all these criteria. In Poland, estates on the outskirts of cities built using this fast and ecological technology are very popular. However, developers typically do not include buildings with functions other than residential purposes within these estates.
The authors [21] highlighted in their review that research on 15-minute cities primarily focuses on large urban areas, with limited studies addressing settlements on the outskirts or near cities. Their innovative analysis demonstrated how the function of a residential building in such a settlement could be optimized to fulfill a necessary ‘social’ function for the residents. Given the economic criteria that guide developers, the authors assessed the cost prospects of implementing a new utility function to determine the most suitable social function for the building.
In previous papers [2,4,5], the authors explored the prospect of timber-framed buildings, highlighting their undeniable advantages as base residences. Additionally, selecting other useful functions for these buildings significantly expands their potential uses. The authors of paper [6] stressed the importance of arranging timber-framed buildings to meet energy efficiency requirements. Based on their measurement analyses, the authors provide recommendations for choosing a utility function relevant to the concept of 15-minute cities [20], which involves minimal costs to ensure that the building meets current energy efficiency standards [22,23,24,25].

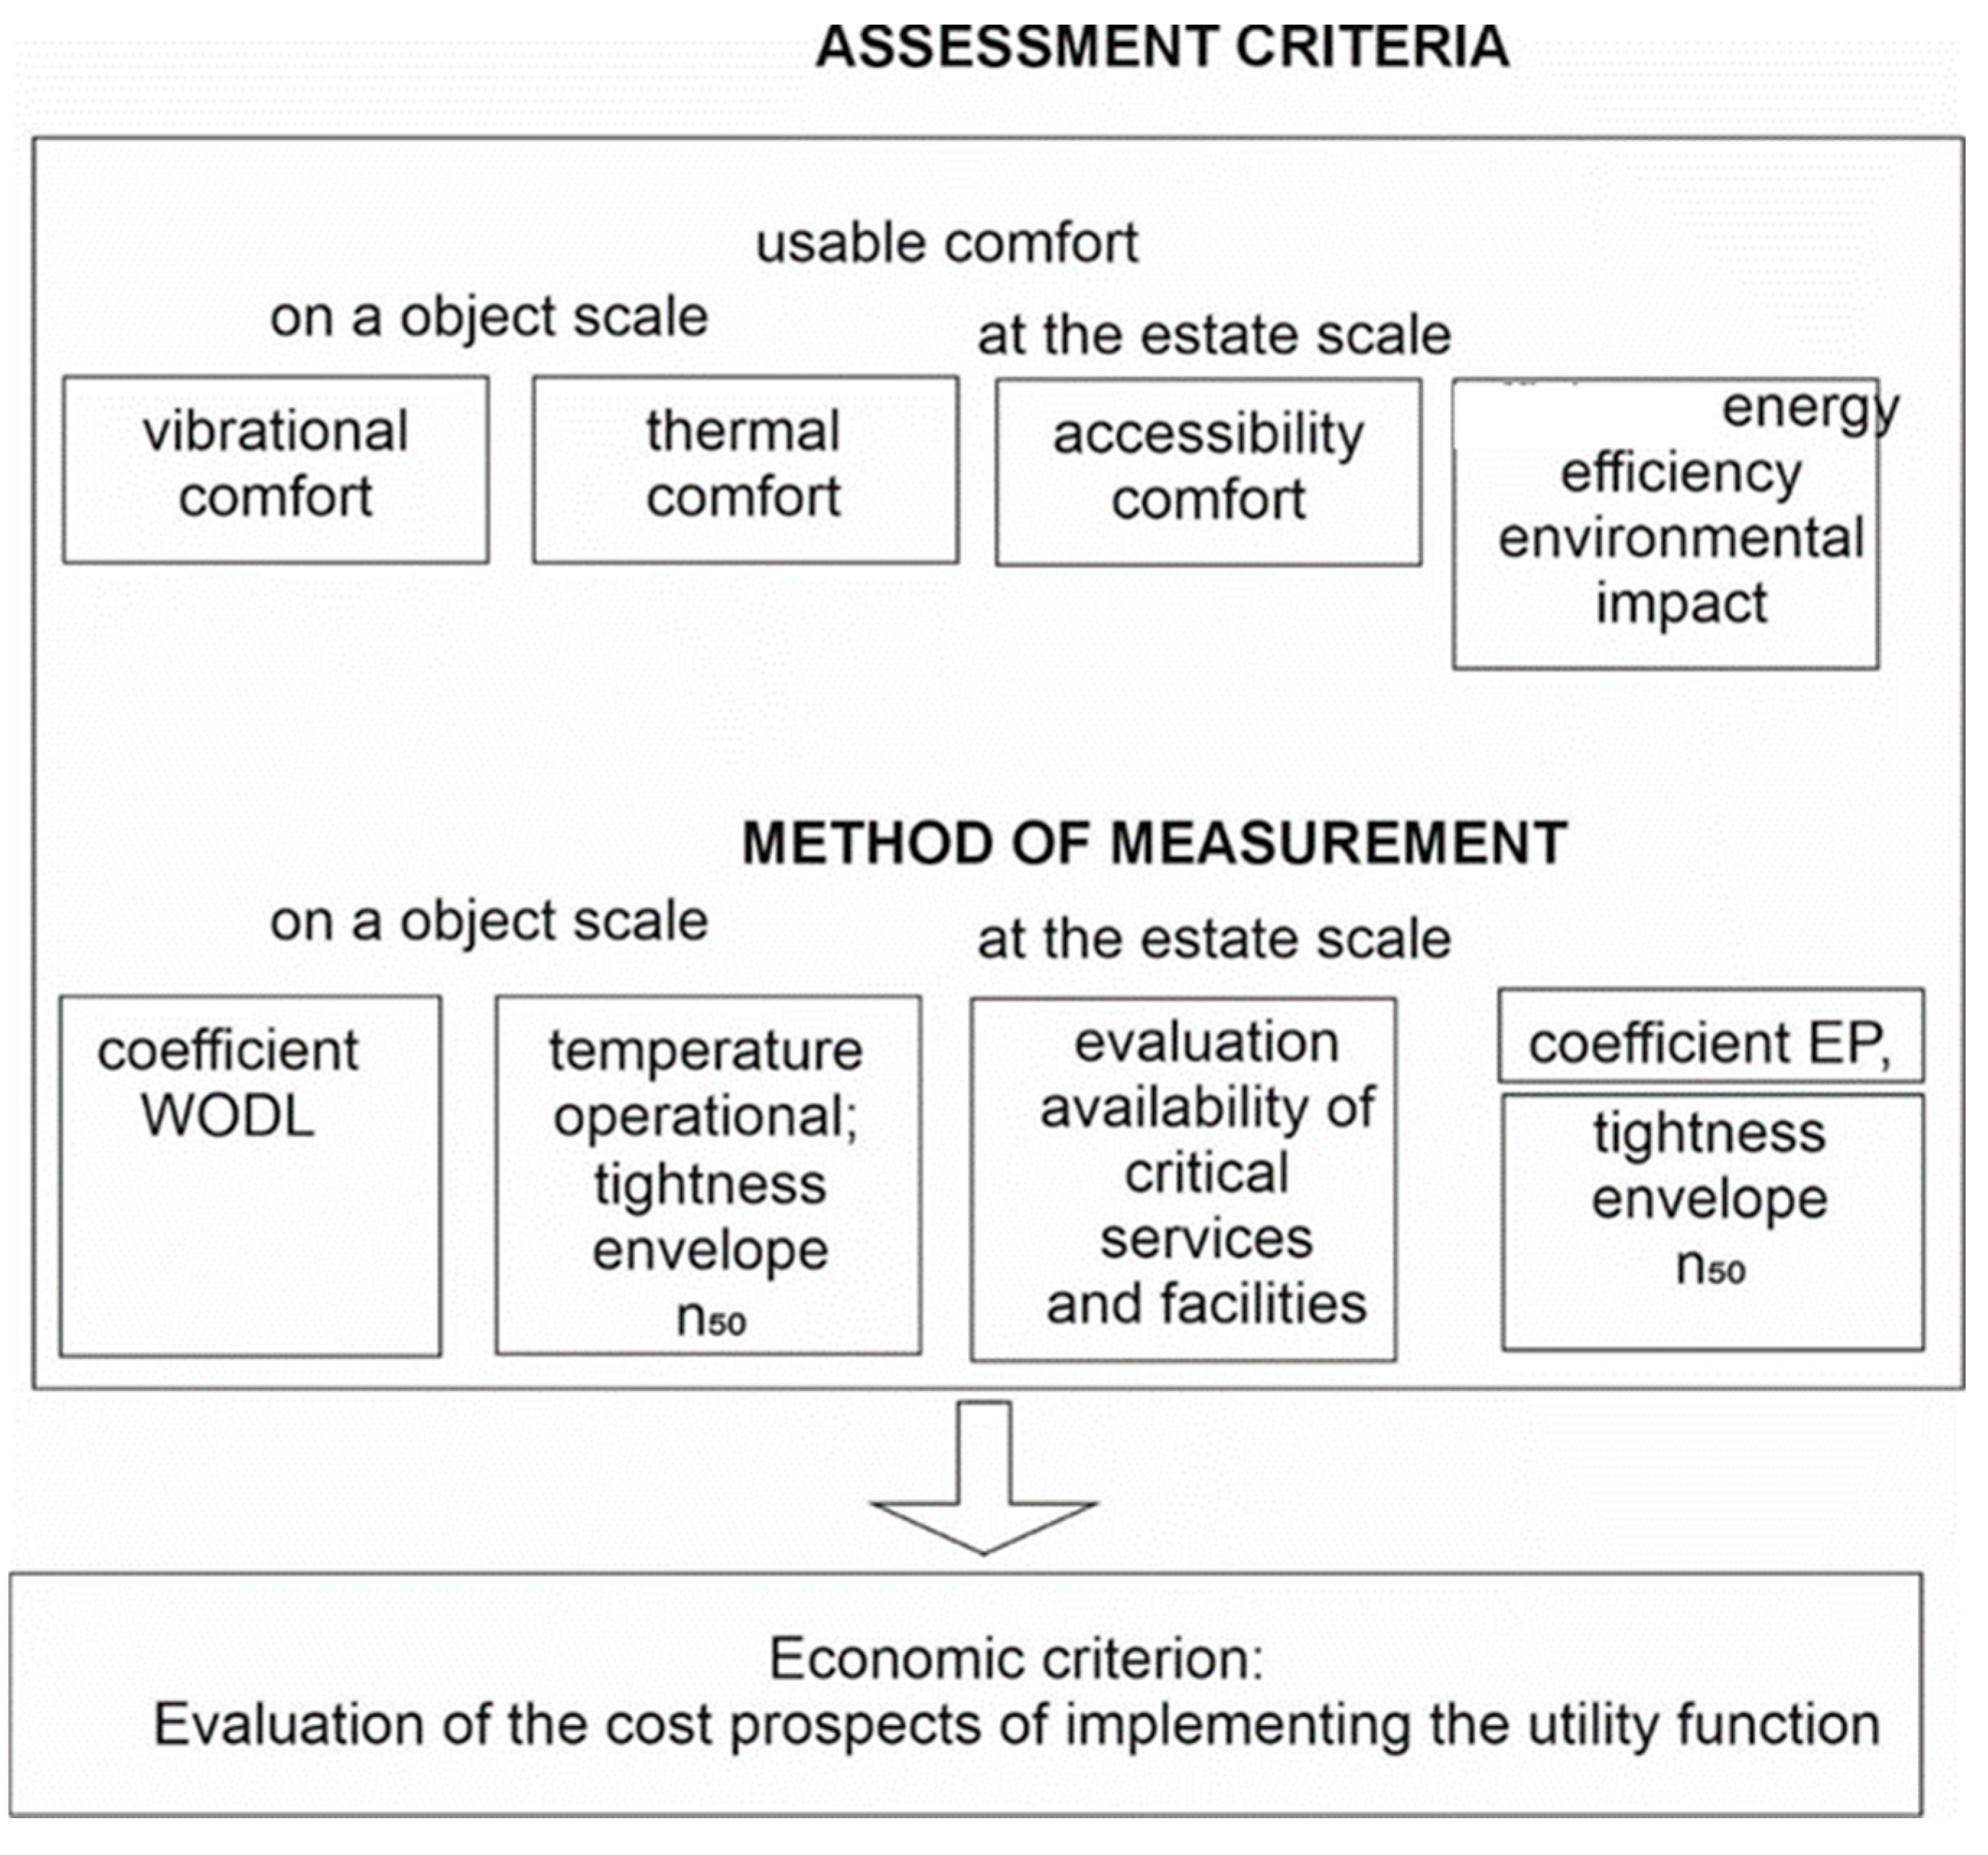
2. Materials and Methods

A method for selecting the optimal utility function for one of the buildings in a suburban single-family housing estate was implemented using multi-criteria optimization. An innovative aspect of this study is the analysis of real measurement results related to vibrational, thermal, accessibility, comfort, and energy efficiency impacts at the stage of forming offers for future investors. The goal is to determine the most economically attractive utility function option—specifically, the one that requires the least capital investment in repair work to meet established standards for vibrational, thermal, accessibility, comfort, and energy efficiency impacts, which vary depending on the potential utility functions. This method considered criteria for occupant comfort (thermal and vibration comfort), energy efficiency, and economic factors. The various stages of the developed methodology are illustrated in Figure 1.
In Stage 1, the assessment criteria for further analysis and measurement methods were identified (Figure 2). This was followed by a baseline analysis of the site for residential use, conducted through energy analyses and ‘in situ’ surveys based on the selected criteria (Stage 2). Stage 3 involved selecting critical and useful service and amenity functions, determined through a survey conducted among the residents of the housing estate. In Stage 4, the parameters of the individual criteria for the selected facility functions were established. The final stage, Stage 5, entailed a multicriteria analysis based on measurements and assessments of the current state and the assigned parameters of the individual utility functions. Based on this final analysis, the optimal utility solution was selected for the facility to enhance residents’ access to amenities, such as shops, crèches, kindergartens, and office space. The criteria adopted for the analysis and their assessment methods are shown in Figure 2.
The analysis of the literature sources [1,2,3,4,5] devoted to wooden timber-framed buildings showed that, along with their advantages, there are imperfections in the technology of their construction. Houses built using timber-frame technology are characterized by a low heat storage capacity due to their lightweight construction; such houses heat up quickly, but at the same time lose accumulated heat quickly. Houses built using masonry technology—ceramic, silicate, and concrete—are characterized by high heat accumulation, which means that they take longer to heat up, but at the same time lose accumulated heat more slowly [https://ecohomes.pl/help/akumulacyjnosc-cieplna-w-domu-szkieletowym (accessed on 26 August 2024)]. The study of heat capacity was not the aim of the multicriteria analysis carried out by the authors. These data have been verified many times, and the authors did not aim to verify them further. With regard to the study of thermal comfort, the authors deliberately assumed that the results of the operative temperature would be used for the analysis. This has the greatest influence on the feeling of thermal comfort. The low thermal capacity of the external envelope and the extensive glazing in the analyzed building led to thermal comfort being identified as a key assessment criterion. Additionally, due to the building’s proximity to a busy road and the ease with which vibrations are transmitted through structural joints, vibration comfort was selected as the second criterion. The evaluation of the importance of these individual comfort aspects was conducted using a questionnaire method among 30 residents of the estate, as illustrated in Figure 3.
For both of the selected comfort criteria (thermal comfort and vibration comfort), a study was carried out to diagnose the current state of the analyzed structure developed as a residential building. In [21], an innovative method for the design of energy self-sufficient residential communities was presented, emphasizing active user participation. The general concept of creating such communities is first described, followed by current research focusing on community electricity generation and storage. This research and analysis was conducted in the housing estate presented in this article. This article is an extension of the research from the experimental settlement.
Another study [26] proposed a method for optimizing single-family house complexes by considering various factors such as direct construction costs, site organization, urban layout, utility expenses, and usage costs in the context of sustainability. The authors analyzed 40 different NZEBs, comparing them to one another, and conducted a multicriteria analysis of the complex to identify optimal and sustainable solutions.
The results indicated that the layout consisting of semi-detached houses scored highest among the proposed layouts with the parameter weights set by the developer. This layout also achieved the highest score when the parameter weights were evenly distributed during the test simulation. It depends on the accessibility of the residents to critical services and facilities, such as the location within walking distance of a shop, crèche, kindergarten, or office space. The energy efficiency and environmental impact criterion was determined by the calculated non-renewable primary energy rate EP [kWh/(m2year)] and the building envelope air leakage test at n50 [1/h]. The analyses and ‘in situ’ studies were carried out on an experimental settlement in Libertow, located north of Krakow in south-eastern Poland.
Thirty-two single-family dwellings were built on a 3 ha site. Figure 4 shows a building where a series of ‘in situ’ tests were carried out to assess occupant comfort (thermal and vibration comfort) and energy efficiency.
The buildings are constructed using prefabricated timber-frame technology, incorporating an innovative use of flexible joints (polymer mixes) to connect the structural elements, as described in [21] In the analyzed housing estate, users reported a lack of facilities providing social functions. A survey involving 30 residents was conducted to assess the need for such facilities. The residents identified three necessary functionalities: a crèche and kindergarten, a shop, and an office. Ten of the residents voted for a nursery/preschool, fifteen of them voted for a shop, and five voted for an office.
To determine the most appropriate function for the building under consideration, an analysis based on economic criteria was conducted. This analysis assessed the financial requirements of changing the building’s functionality from its current use to the proposed options indicated by the occupants. The financial analysis incorporated comfort criteria (thermal and vibration) and energy efficiency criteria. For the purposes of this analysis, “in situ” tests were performed to evaluate occupant comfort (thermal and vibration) and energy efficiency.

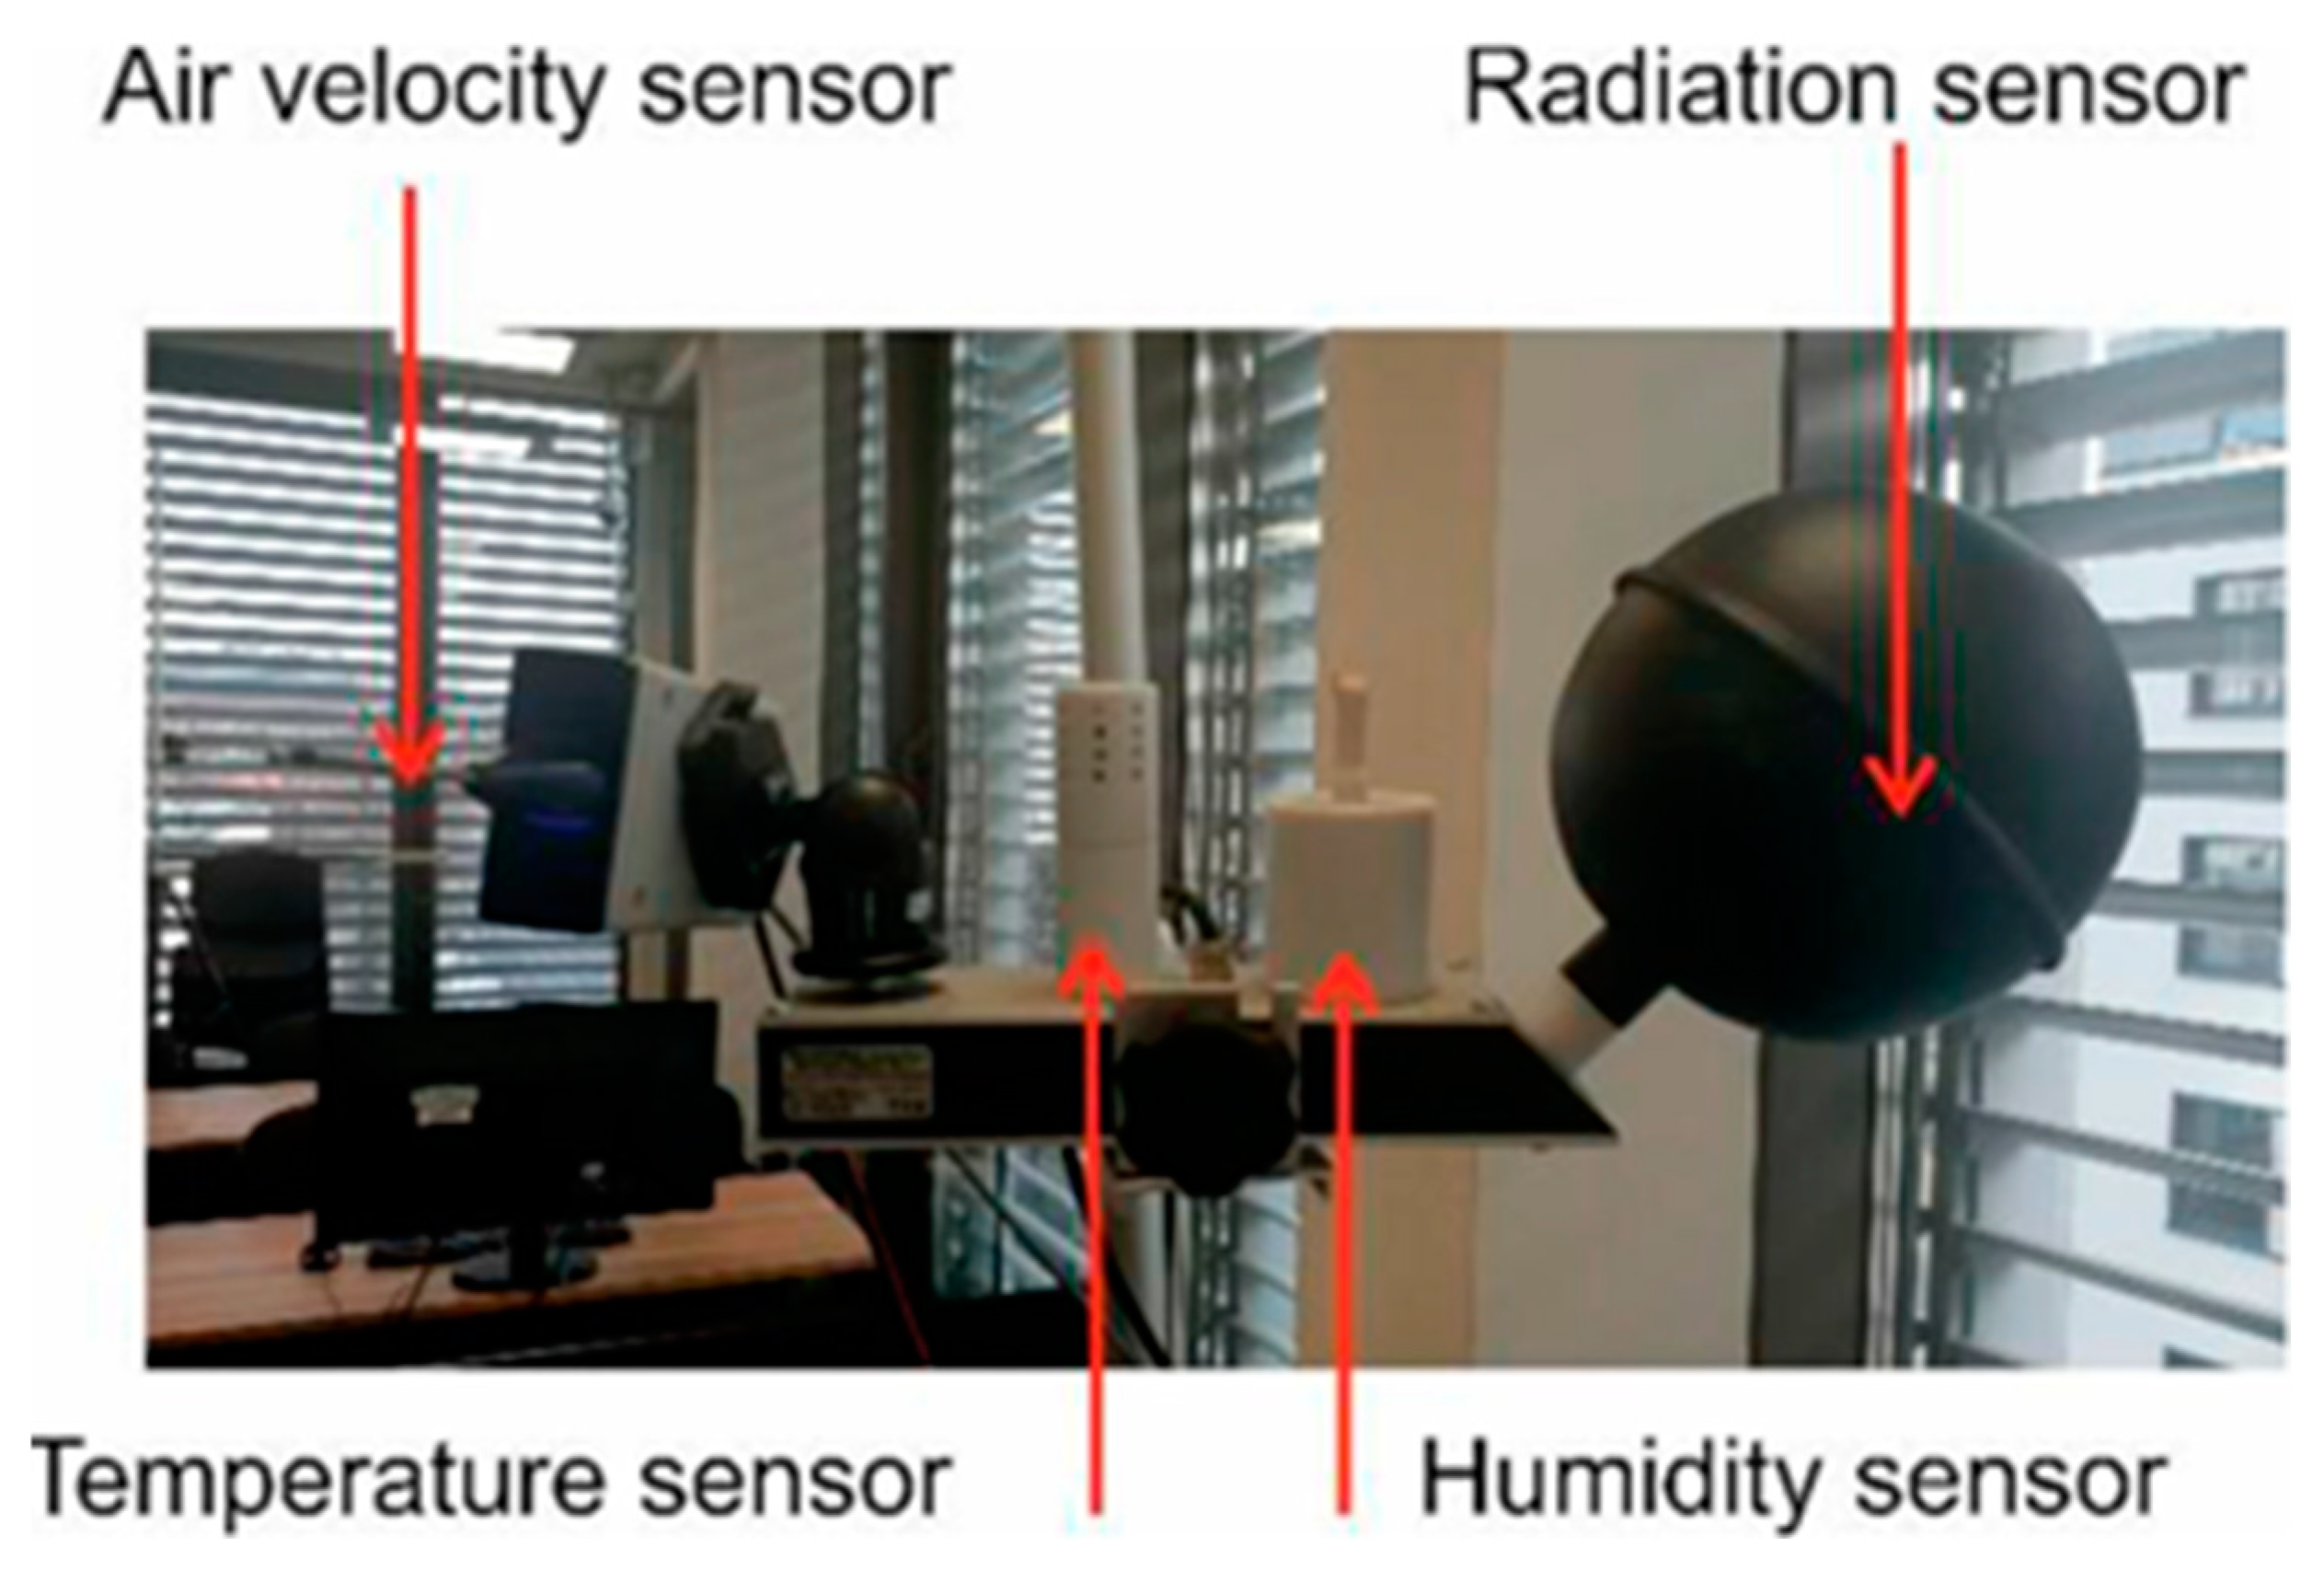
2.1. Methodology for Measuring Thermal Comfort

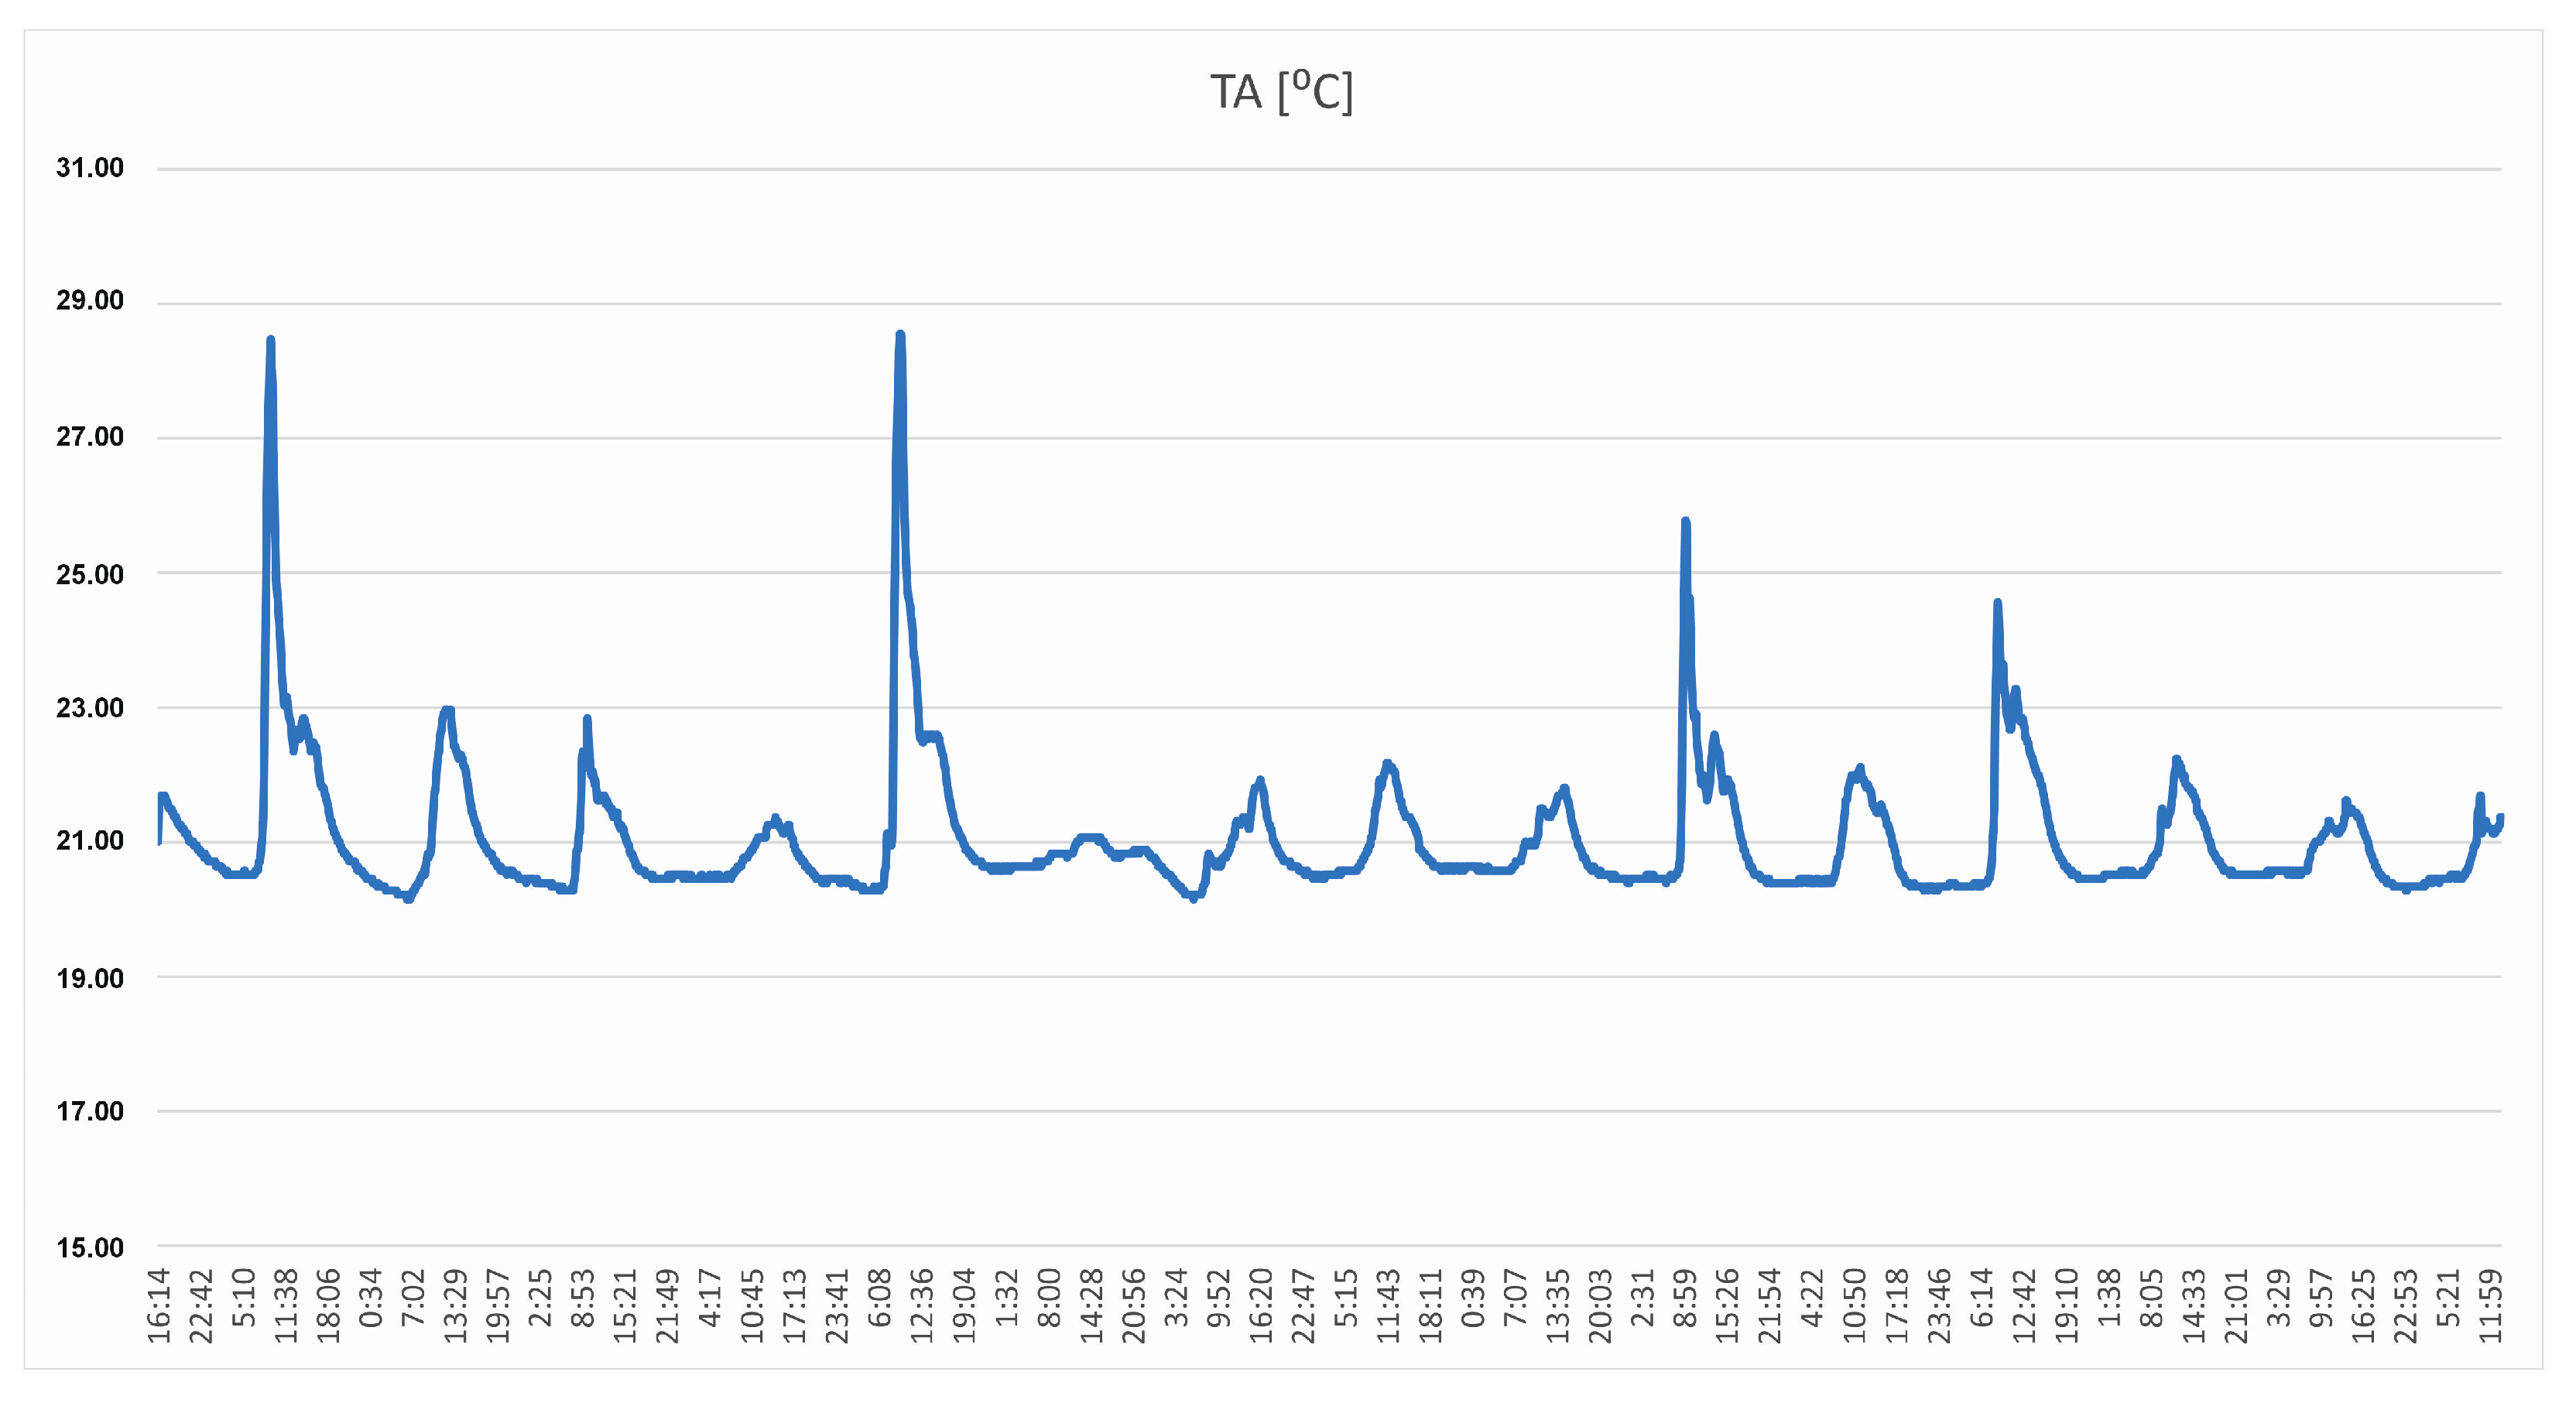
2.1.1. Operational Internal Temperature

The choice of ambient temperature as a thermal comfort parameter was deliberate and purposeful. Of course, thermal comfort is influenced by humidity, average ambient temperature, and air velocity. However, of these parameters, ambient temperature has the greatest influence and was the best fit for the multicriteria analysis carried out. The authors also investigated other comfort parameters, but temperature was the best fit for the methodology. The operational internal temperature was used as an indicator of thermal comfort. The analyzed building is equipped with a heating and cooling system. The operational internal temperature index, defined according to residential building quality with mechanical cooling systems, was used to determine comfort.
The operational temperature, defined by a single parameter, represents the conditions of a homogeneous environment that physically and mathematically express the actual environmental conditions. The calculation of the operational temperature is governed by PN-EN 16798-1 [23] and EN ISO 7726 [24]. The value of the operational temperature is calculated using the following formula:
t o = h c t a + h r t r h c + h r
where
  • hr—heat transfer coefficient by radiation;
  • hc—heat transfer coefficient by convection;
  • ta—ambient temperature, °C;
  • tr—average temperature of radiation from the partitions in the room, °C.
According to EN 16798-1 ‘Energy performance of buildings—Ventilation for buildings Part 1: Indoor environmental input parameters for design and assessment of energy performance of buildings with regard to indoor air quality, thermal environment, lighting, and acoustics’ [23], the minimum temperature for a building equipped with heating and cooling systems can be distinguished based on the building use category, as shown in Table 2.
The test was conducted using the temperature sensor in the sensor set shown in Figure 5. The microclimate (thermal comfort) testing device, depicted in Figure 6, records the following parameters: temperature, humidity, and air velocity (see Table 3). Based on the recorded parameters, the thermal comfort index PMV [-] and the percentage of people dissatisfied with the prevailing thermal conditions are determined. The equipment was chosen to ensure that it records the parameters relevant to the adopted research methodology, guaranteeing that the research results are consistent with the methodology.

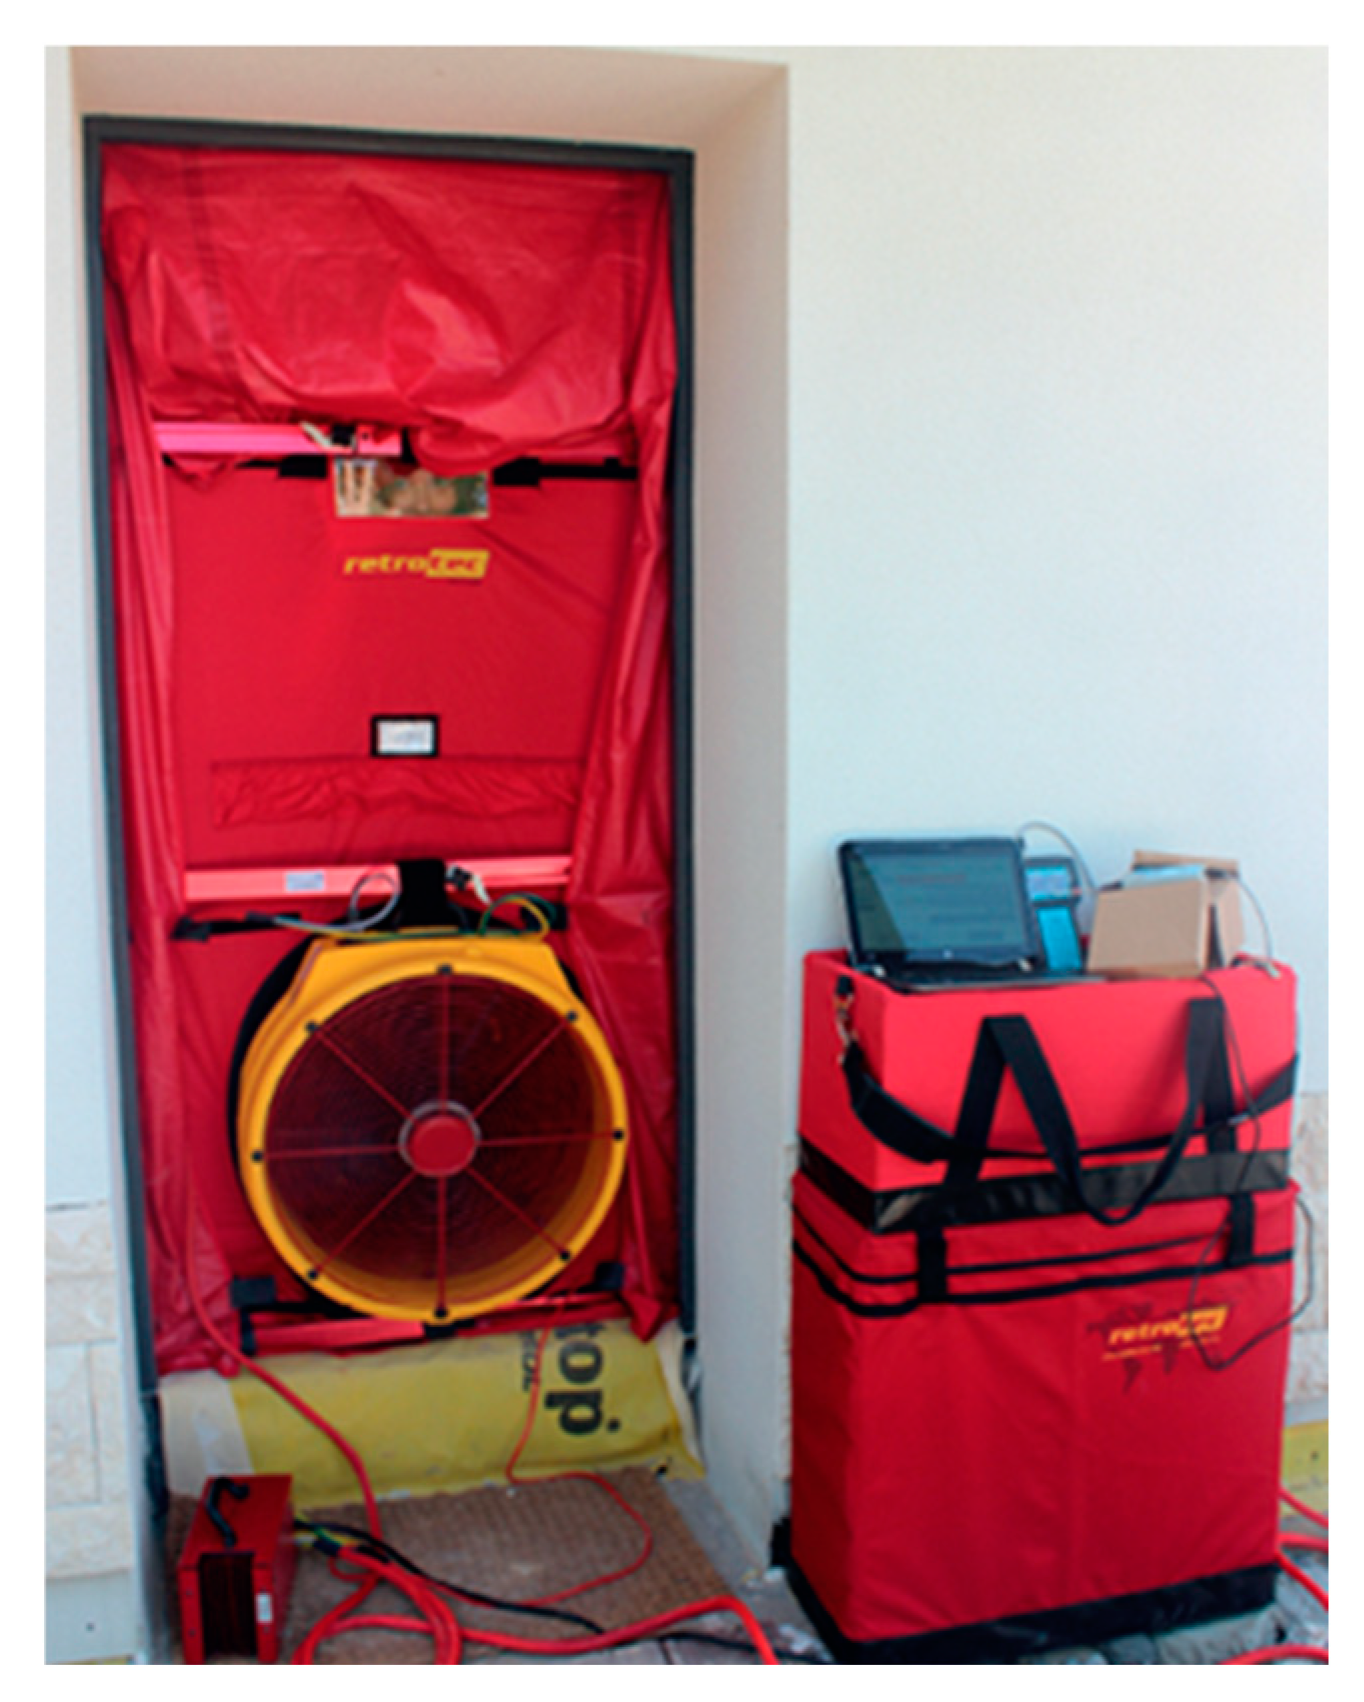
2.1.2. Air Tightness of the Building Envelope

When designing or renovating a building, it is crucial to ensure adequate indoor conditions regardless of the external climate. This applies to both residential and commercial buildings. Achieving the required thermal comfort involves ensuring that the building envelope is sufficiently airtight. Uncontrolled airflow through gaps and cracks in the building envelope significantly impacts both thermal comfort and actual energy demand. Defects and leaks in the building envelope can be effectively detected using non-invasive airtightness testing methods, including the ‘Blower Door Test’ system and the tracer gas method.
In Poland, airtightness testing of buildings is still relatively uncommon and often treated as an additional, but not compulsory, method of verifying building construction. The acceptable ranges of values recommended in Poland depend on the type of ventilation system used and should characterize the airtightness of a building as follows:
  • Buildings with gravity ventilation: n50 ≤ 3.0 [1/h].
  • Buildings with mechanical ventilation: n50 ≤ 1.5 [1/h].
The determination of the air change rate n50 is carried out in accordance with EN ISO 9972:2015-10 [25]. The concept of airtightness itself is defined as a characteristic of a material, building envelope, or part thereof. The airtightness test of the building envelope was conducted using the ‘Blower Door’ system. This device works on the principle of pressure generation and is designed to test airtightness at an airflow rate of 28,200 m3/h with a pressure difference of 50 Pa. The system for measuring the airtightness of the building envelope is shown in Figure 6. The building enclosure leakage test kit includes a pressure gauge, fan, speed controller, radio remote-controlled smoke generator, and necessary software for kit operation.

2.2. Calculation of the Non-Renewable Primary Energy Indicator EP[kWh/(m2year)]

The non-renewable primary energy indicator EP [kWh/(m2year)] was adopted as the criterion for determining the energy efficiency of the analyzed building. EP indicates the building’s annual demand for non-renewable primary energy, which is required for heating, cooling, ventilation, and domestic hot water preparation, as well as the energy needed for lighting and all other electrical appliances in the house. The legal basis for calculating the EP indicator is the Act of 29 August 2014 on the energy performance of buildings [27] and the Act of 7 October 2022 amending the Energy Performance Act [28].

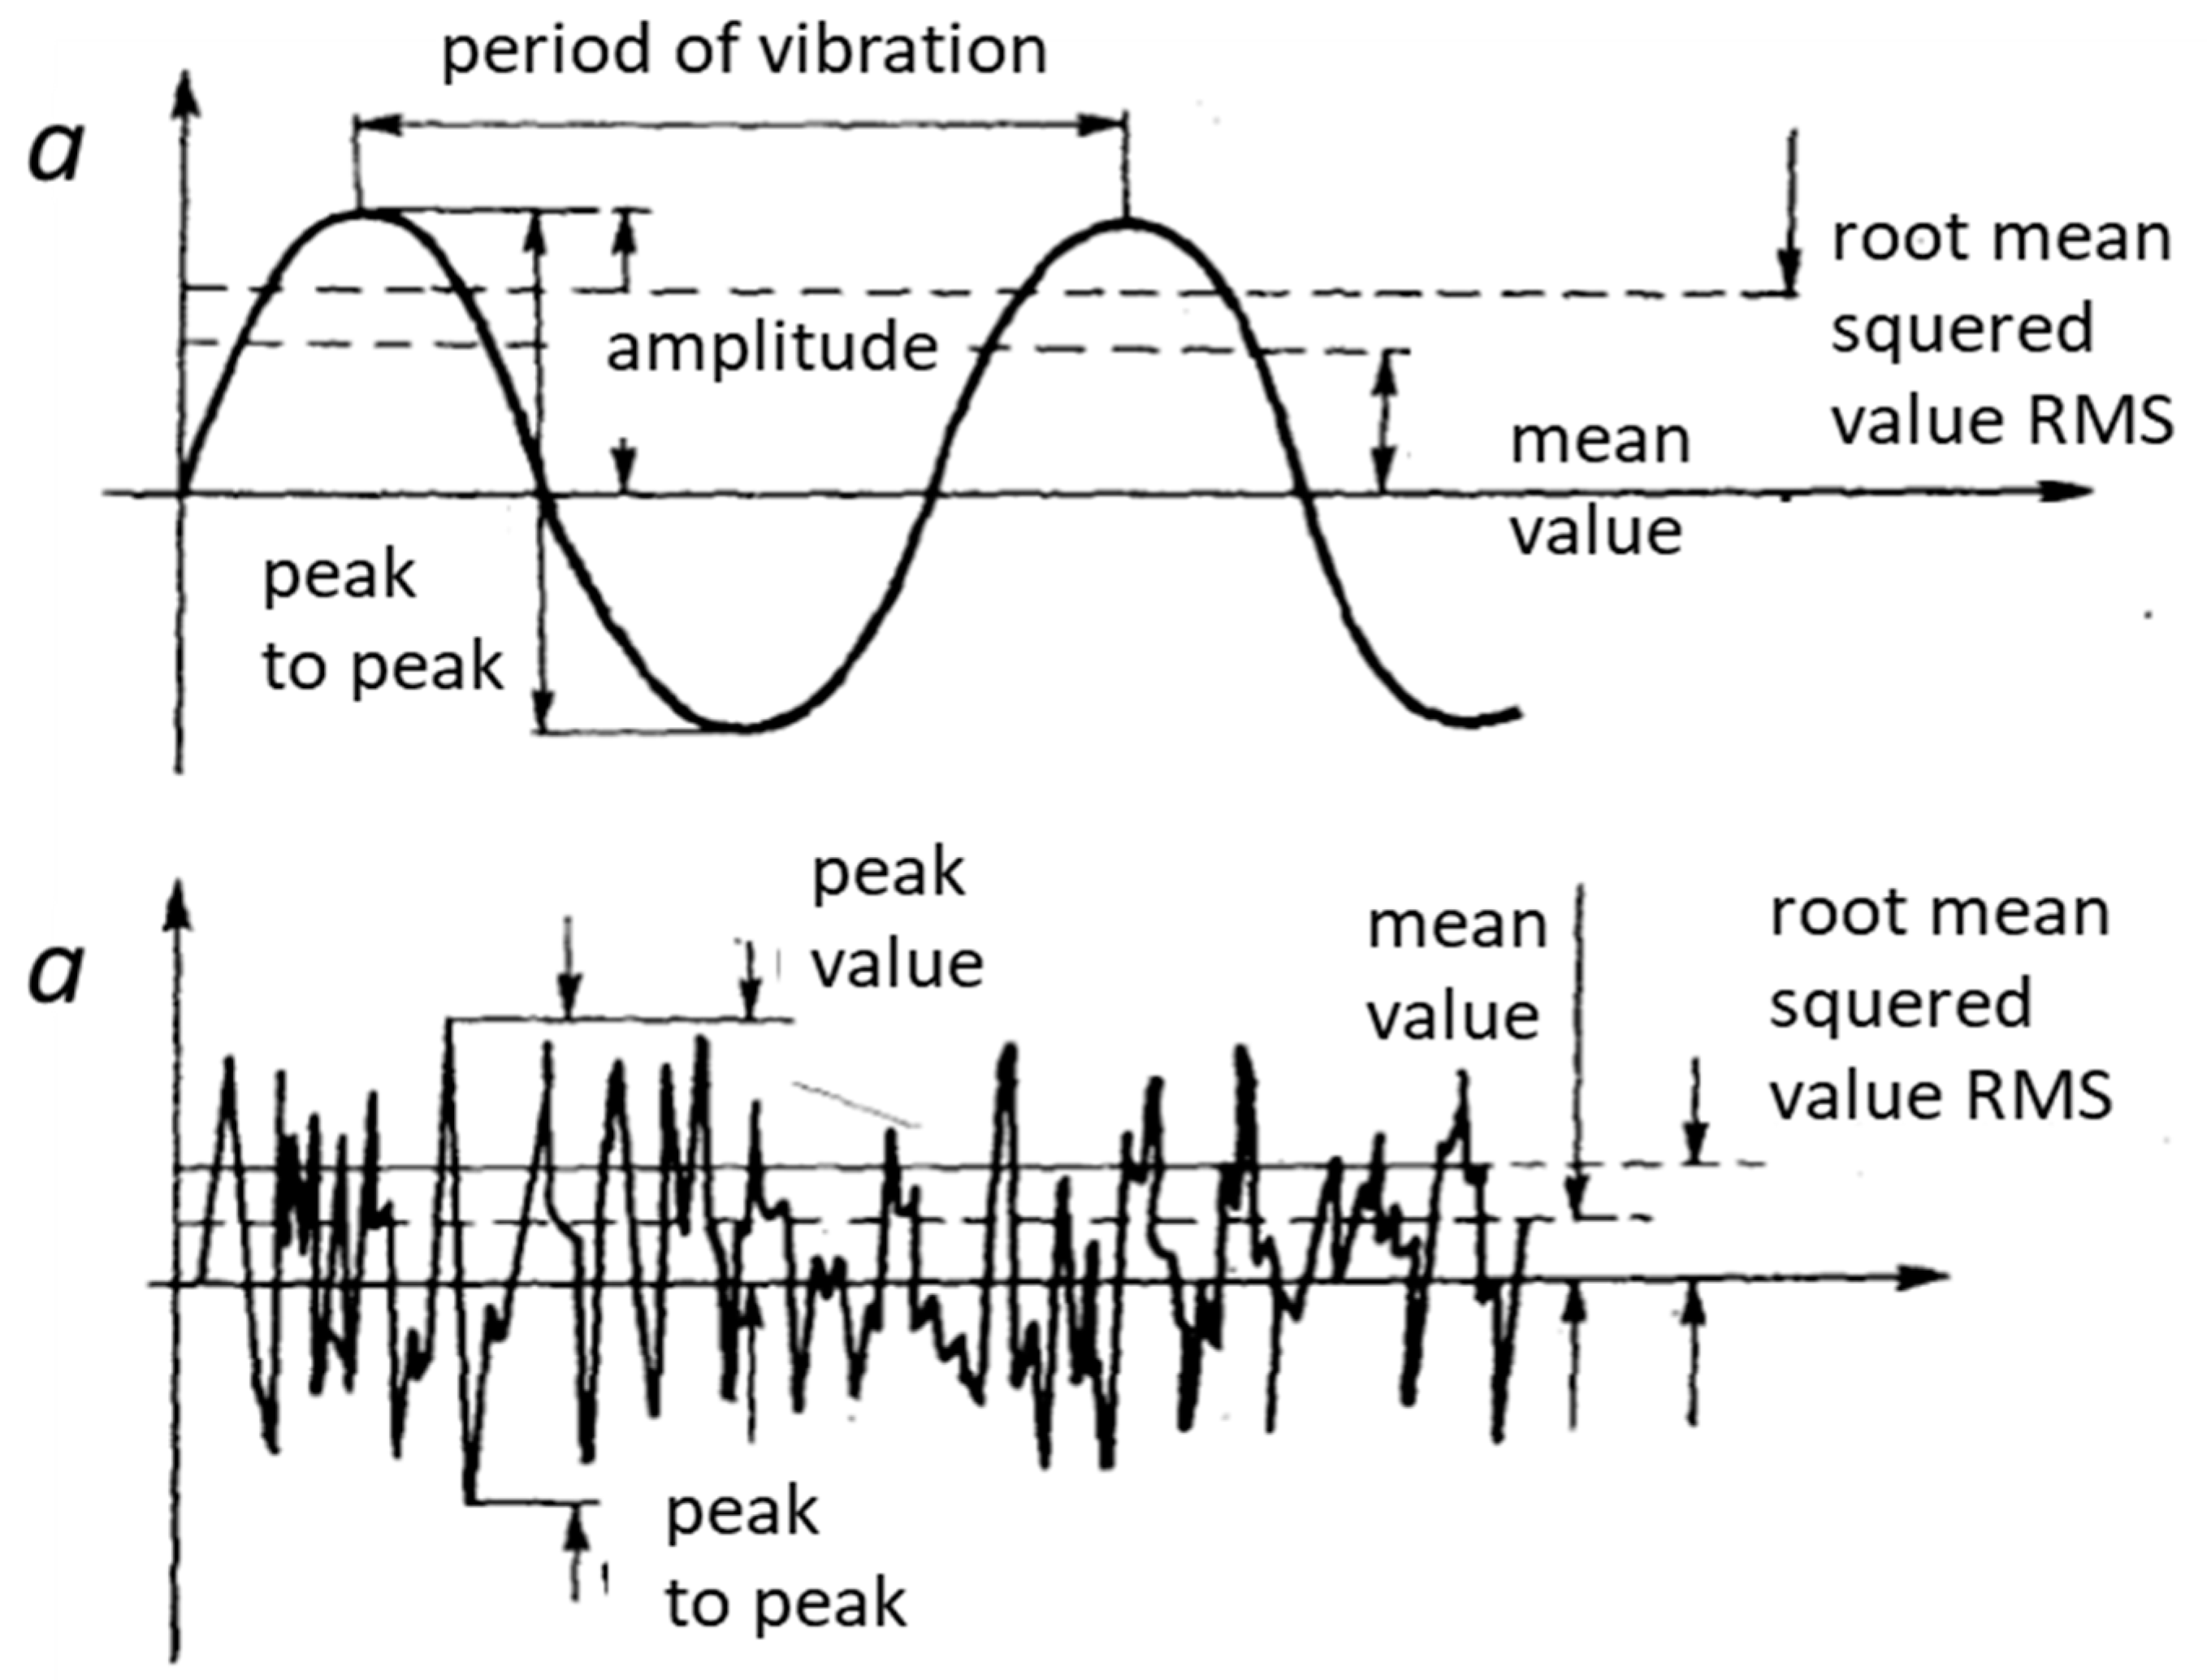
2.3. Vibrational Comfort Methodology

The RMS (root mean square) method is a physical interpretation as vibration energy. The mean square value describes vibrations effectively because it includes information about the RMS values of the vibration components across the entire range of considered frequencies. An illustration of the mean square value of harmonic and random vibrations is shown in Figure 7 [29].
The criteria used for evaluating human exposure to vibration in buildings depend on the evaluation method. There are four main methods, each considering different parameters, as follows:
  • Acceleration (velocity) of vibration corrected across the whole frequency range.
  • Spectrum (frequency structure) of the effective value (RMS) of acceleration (velocity) of vibration in 1/3 octave band.
  • Vibration dose value (VDV).
  • Maximum transient vibration value (MTVV).
In this paper, the most popular method, RMS, is used, but with a modification to the so-called HPVR (human perception of vibration factor). This factor was first introduced in the 2017 Polish standard [30]. It is a very useful ratio that indicates how many times the threshold of human perception of vibration is exceeded.
H P V R = a R M S a w
where
  • aRMS—acceleration RMS value obtained from the analysis;
  • aw—acceleration RMS value equivalent to the threshold for the perception of vibration in in the same 1/3 octave band as in aRMS.
The basic criteria for determining floor vibrations are measured and, after analysis, the obtained values are compared with the standard values described in [29], which pertain to the evaluation of the impact of vibrations on people in buildings, as outlined in the Polish Standard (2017, in Polish). It should be noted that this criterion is more sensitive than the one related to the impact of vibrations on the building structure [15], because the comfort thresholds for people inside the building are exceeded long before vibrations significantly affect the building’s structure. For comparison purposes, the Polish Standard [30] introduced the HPVR (Human Vibration Perceptivity Ratio), which measures human sensitivity to vibrations. It is the ratio of the maximum RMS value obtained from the analysis (RMS max) to the vibration sensibility threshold (regardless of the direction) in the same frequency band. The value of the HPVR ratio is provided, together with the information on the central frequency of the 1/3 octave band in which the HPVR is determined. WODL indicates directly how many times the threshold of perception of vibrations by people has been exceeded. Some studies in ISO [17] and other national standards show that there are no clear and detailed guidelines about how to make experimental tests in the case of the influence of vibrations on people inside buildings.
Thermal comfort is, as shown by surveys, one of the most important comfort sensations. The method for determining thermal comfort parameters is contained in ISO 7730 [31] (ergonomics of the thermal environment—Analytical determination and interpretation of thermal comfort using calculation of the PMV and PPD indices and local thermal comfort criteria). The international standard for the assessment of thermally moderate environments was prepared in parallel with standard 55 developed by ASHRE. Human thermal sensations are mainly related to the heat balance of the body as a whole. The methodology developed by the authors assumes that the main factor felt by humans is the ambient temperature. According to the methodology, the sensor for measuring temperature met the stringent requirements according to ISO 7726 (ergonomics of the thermal environment—instruments for measuring physical quantities) [24]. The test was carried out using the measurement system shown in Figure 5. This assumption allowed the test results to be compared with the indications contained in EN 16798-1 ‘Energy performance of buildings—Ventilation of buildings—Part 1: Input parameters of the indoor environment for design and assessment of energy performance of buildings with regard to indoor air quality, thermal environment, lighting and acoustics’ [23].
The methodology developed by the authors assumes that the second thermal comfort parameter to be tested is the air-tightness of the building envelope. As is well known, leaks in the building envelope reduce thermal comfort during use by causing local cooling of the internal temperature. This served as the foundation for incorporating this technique into the authors’ methodology. The airtightness test was conducted in accordance with the methodology outlined in EN ISO 9972:2015-10, as referenced in the literature list. The test was performed in triplicate, which was included in the methodology with the objective of achieving a leakage test result n50 of less than 1.0 [-]. This is better than the value recommended in the Technical Conditions applicable in Poland. However, the authors considered that buildings with almost zero energy demand should meet higher standards.
The impact on the energy efficiency of the environment was expressed by the non-renewable primary energy indicator EP [kWh/m2rok]. This is the best indicator for showing the environmental impact of a building.

3. Results

3.1. Thermal Comfort

3.1.1. Internal Operational Temperature

Operational temperature measurements were conducted during the interim period from 7 to 17 March 2020. The test apparatus for measuring thermal comfort is shown in Figure 8. The microclimate (thermal comfort) testing device, also depicted in Figure 8, records the following parameters: temperature, humidity, and air velocity. Based on the recorded parameters, the thermal comfort index PMV [-] and the percentage of people dissatisfied with the prevailing thermal conditions were determined.
Microclimate meters, namely EHA MM101 by EKOHIGIENA (Pleszew, Poland), were used for thermal comfort measurements. These devices meet the requirements of the EN ISO 7726 standard (ergonomics of the thermal environment—instruments for measuring physical quantities). The measured parameters were recorded every 10 min. The metrological properties of the sensors are presented in Table 4.
The results of the operating temperature measurements are shown in Figure 9.
Due to the lack of blinds, the measurements showed significant variations in temperature. The minimum temperature recorded was 20.15 °C, and the maximum temperature was 28.55 °C. The average internal temperature for the review period was 21.03 °C. The survey was conducted in the winter–spring month. Large temperature fluctuations were observed.

3.1.2. Air Tightness Test of the Building Envelope

An airtightness test of the building envelope was conducted to assess both thermal comfort and energy efficiency. The surveyed building was constructed using CLT timber-frame technology. The assessment was carried out in its reference, existing state. The net volume of the building, according to EN ISO 9972 [25], was 349.3 m3 (with an estimated measurement accuracy of ±3%). The test was conducted using method 2 (ventilation and drainage ducts were sealed). The pressure test was performed over a range of ±10.0 Pa to ±60.0 Pa. The facility underwent blower door testing on three occasions: 28 February 2020, 26 April 2020, and 5 June 2020. After each test, seals were applied to the detected leak areas. The air exchange rate at a pressure of 50 Pa, n50 [1/h], and the airflow rate were as follows in the subsequent tests (see Table 5):

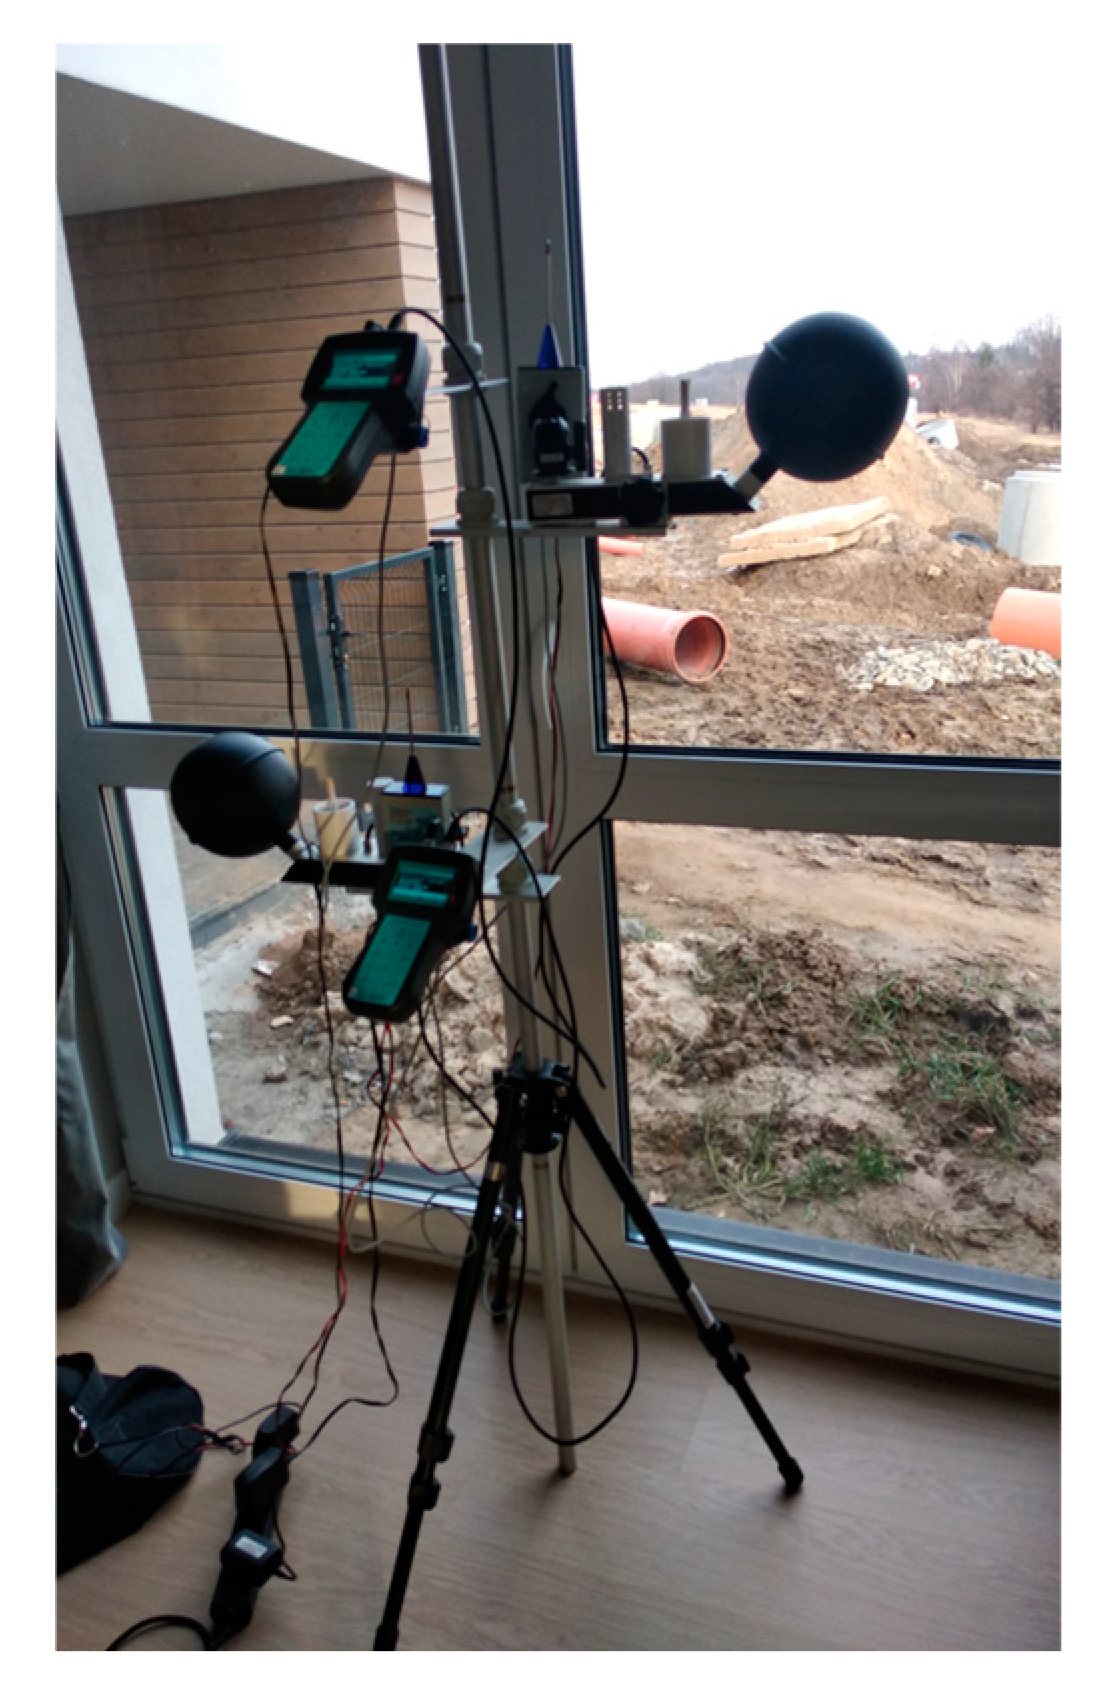
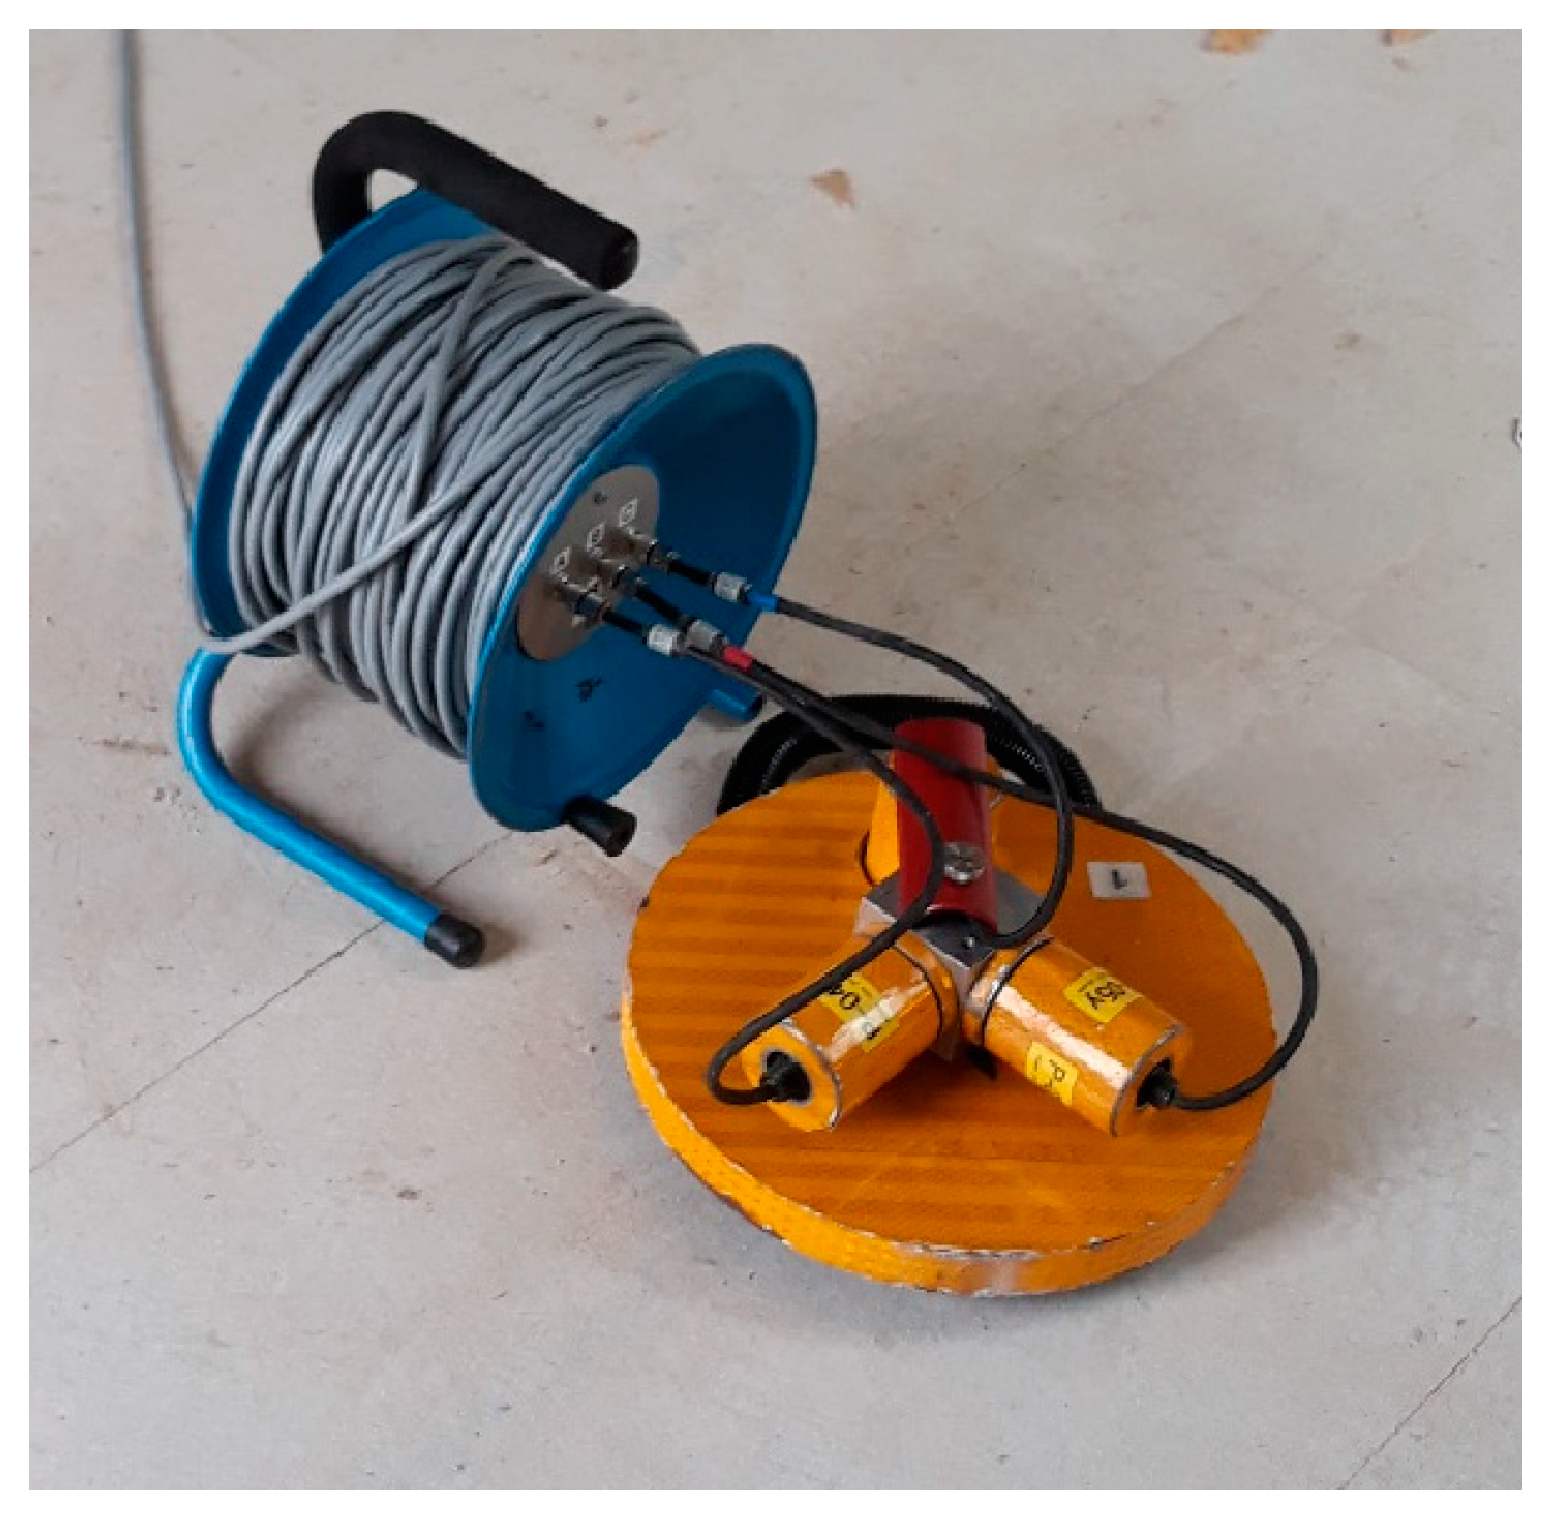
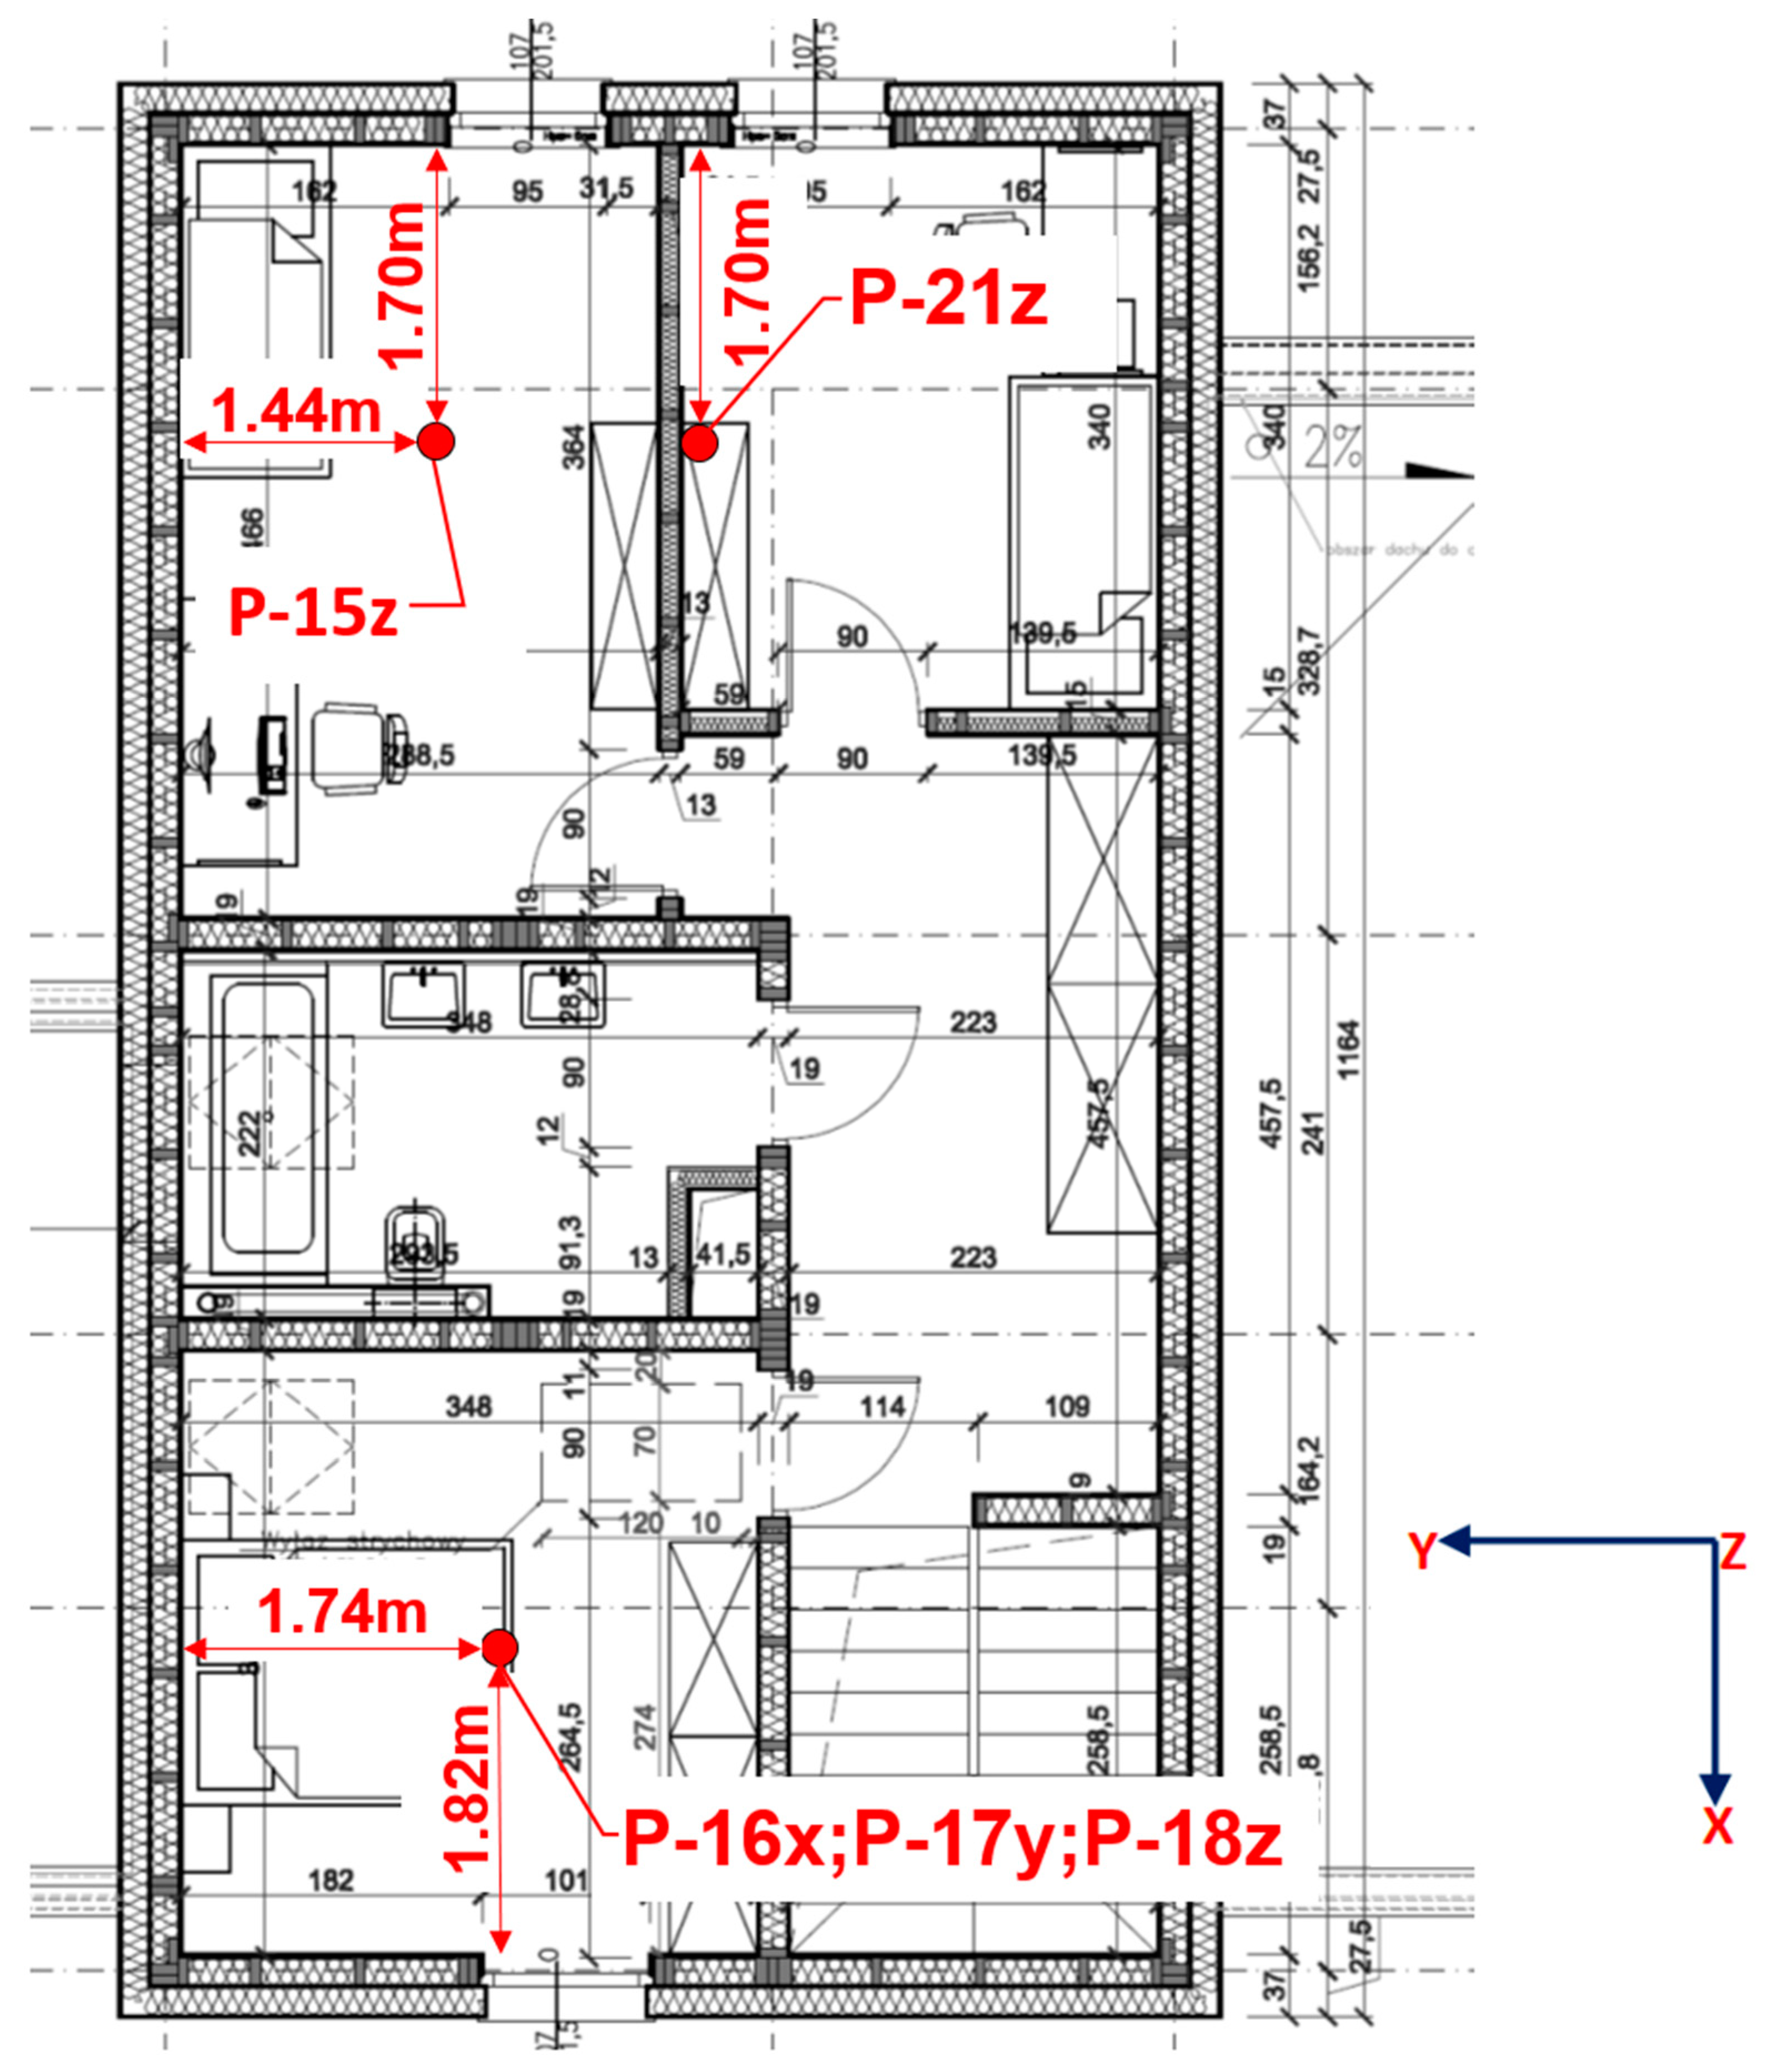
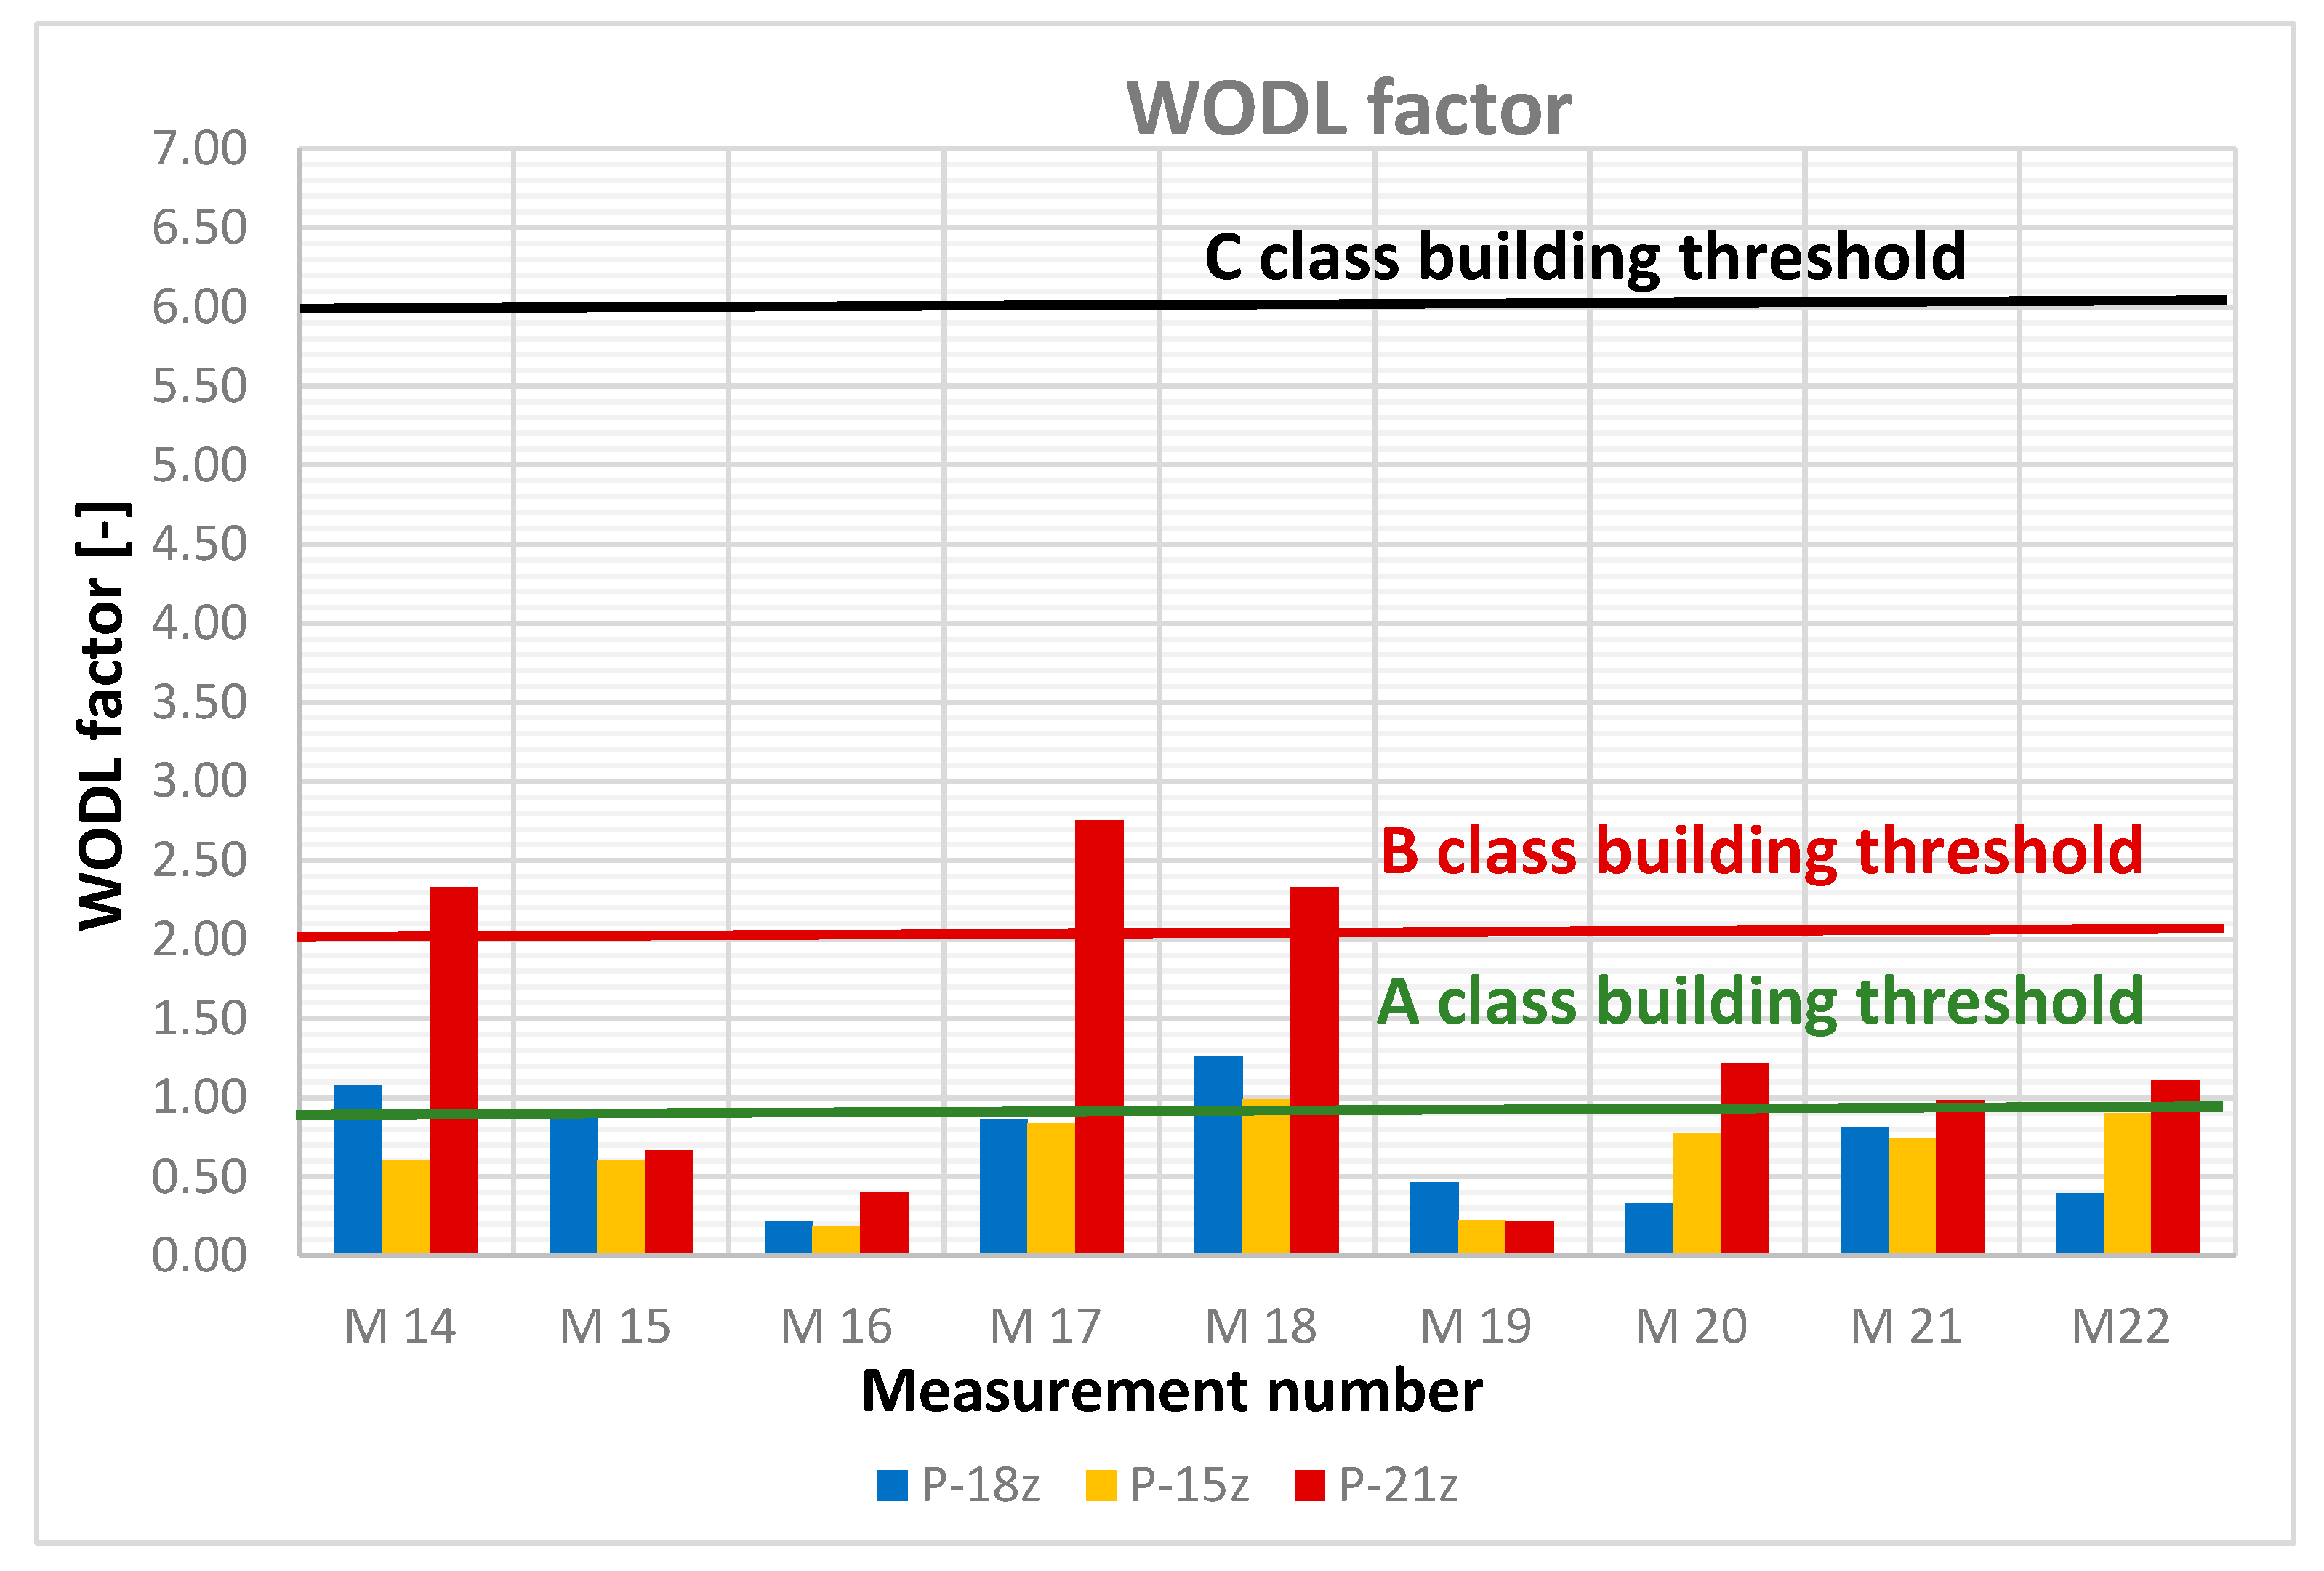
3.2. Vibrational Measurement Description and Results

Vibrational comfort measurements were taken at points of maximum perception of vibration, which, according to [30], is the center of the floor. Acceleration was measured in three orthogonal directions: x (perpendicular to the excitation), y (parallel to the excitation), and z (in the vertical direction). To simulate body weight, the accelerometers were placed on a 30 kg disc (Figure 10).
During the measurements, seismic sensors (type 393B12 from PCB Piezotronics) were used. These seismic sensors have a sensitivity of 10 V/g and a measurement range of ±0.5 g pk (4.9 m/s2 pk). Their frequency range is from 0.15 Hz to 1000 Hz. Their broadband resolution is 0.000008 g rms (0.00008 m/s2 rms). For signal recording, the LMS Scadas Mobile recorder with the ICP® standard signal conditioning system integrated into each channel was used. The use of ICP® conditioners allows for the use of long cables, which greatly facilitates measurement work in buildings with large dimensions and/or when measurements require significant distances between the measurement points and the recording station. This analyzer provides real-time recording for each channel while maintaining high signal dynamics across the full frequency range. The location of the sensors inside the building (attic level) is shown in Figure 11. The most representative direction is Z (vertical), and, for comparison purposes, results from the Z direction were primarily considered.
For dynamic excitation purposes, the passage of a loaded vehicle was used. Seven passages of the vehicle were recorded. In some instances, the human perception threshold was exceeded, but the comfort level according to [30] was not surpassed in any passage. The results are listed in Table 6 and shown in Figure 12.

3.3. The Non-Renewable Primary Energy Indicator EP [kWh/(m2year)]

The non-renewable primary energy indicator EP [kWh/(m2year)] for the analyzed building was calculated based on the following assumptions:
Thermal insulation coefficients of the building envelope elements:
External walls: Uc = 0.12 [W/(m2K)];
Roof: Uc = 0.13 [W/(m2K)];
Ground floor: Uc = 0.10 [W/(m2K)];
Windows: Uw = 0.9 [W/(m2K)];
External doors: Uw = 1.3 [W/(m2K)];
Area with adjustable temperature Af = 114.20 m2;
Usable energy indicator EU = 35.04 kWh/(m2year);
End energy indicator EK = 23.81 kWh/(m2year);
Primary energy indicator EP = 68.65 kWh/(m2year).

4. Evaluation of the Cost Prospects of the Implementation of Utility Functions

The building subject to measurement is intended for permanent human occupancy as a residential building. It is located in a new housing estate of single-family houses, primarily occupied by young families. An analysis of requests for social infrastructure within the 3-hectare area in the suburbs of Krakow, developed with single-family residential buildings, identified the following three utility functions for the house, which appear to be the most socially and economically justified:
  • Variant V1—nursery and kindergarten;
  • Variant V2—shop;
  • Variant V3—office.
The base residential function was labeled as Variant V0.
The suitability of the investigated building for each of the proposed utility functions was analyzed according to the following criteria:
  • F1: Thermal comfort expressed in terms of operative temperature in winter (class A (20 < to ≤ 21), class B (19 < to ≤ 20), and class C (18 < to ≤ 19))
  • F2: Percentage reduction in building airtightness envelope n50 (increase in building envelope airtightness) [1/h] (class A (0 ≤ n50 ≤ 0.6), class B (0.6 < n50 ≤ 1.5), and class C (1.5 < n50 ≤ 3.0))
  • F3: Non-renewable primary energy indicator EP [kWh/(m2year)] (class A (0 ≤ EP ≤ 42), class B (42 < EP ≤ 56), and class C (56 < EP ≤ 70))
  • F4: Vibrations in HPVR (class A, class B, and class C).
Table 7 summarizes the measurement data for the specified criteria for the current state of the building.
Table 8 shows standards of all criteria that the building must meet in the case of the implementation of each of the utility functions.
The current construction phase of the building under study was compared with the standard requirements for the proposed utility functions V0–V3, indicating the required and available class for each of the four criteria F1–F4, as presented in Table 9.
As shown in Table 8, there are three possible relationships between the required class for a certain criterion and the actual class determined based on the measurement results for the building in its current state. These are as follows:
  • The class required by the standards is higher than the current class (indicated in bold).
  • The class required by the standards matches the current class (marked with a pink background).
  • The current class exceeds the requirements of the standards (indicated by a blue background).
The estimation of capital investments needed to improve the building’s condition for each proposed utility function assumes an increase in the class of each criterion by one point (e.g., from B to A) for a conditional cost unit of 1 c.c.o. The required expenditures for each utility function are as follows:
  • Variant V0—base residence: Requires improving criterion F4 by one point (from C to B) and criterion F2 by two points (from C to A):
M(V0) = 1(F4) + 2(F2) = 3 c.c.o.
  • Variant V1—nursery and kindergarten: requires improving criterion F4 by two points (from C to A), criterion F2 by two points (from C to A), and criterion F3 by two points (from C to A):
M(V1) = 2(F4) + 2(F2) + 2(F3) = 6 c.c.o.
  • Variant V2—shop: requires improving criterion F3 by one point (from C to B):
M(V2) = 1(F3) = 1 c.c.o.
  • Variant V3—office: requires improving criterion F3 by one point (from C to B) and criterion F2 by one point (from C to B):
M(V3) = 1(F3) + 1(F2) = 2 c.c.o.
Based on the calculations of the relative capital investment levels required for building renovation, it can be concluded that Variant V2—shop is the most economically attractive for future investments. Implementing Variant V3—office requires twice the repair costs of Variant V2, implementing Variant V0—base residence requires three times more repair costs than Variant V2, and implementing Variant V1—nursery and kindergarten requires the highest repair costs, exceeding those of Variant V2 by six times.

5. Discussion

A holistic approach to the selection of a building’s utility function is rarely the subject of research, which is unfortunate, as such a decision can improve the functionality of buildings and the resulting benefits. Most studies focus on the revitalization of buildings without changing their utility function, for example, in [32], the goal was to explore rehabilitation strategies for multi-family dwellings on the level of function and techniques. The study employs its own methods of analysis using a sample of selected cases as a reference. This is similar to [33], where there are issues related to retrofit planning in residential blocks and areas and analyzing the condition of apartment buildings and their surrounding environment. It also proposes strategies for retrofitting residential areas with apartment buildings.
The work presented in this article is a continuation of research on historic buildings, which has been covered in the following publications [34,35]. In [34], the methodology was applied to a historic building in southern Poland. The proposed new utility function for the analyzed building is to repurpose the historic villa, or part of it, as an art gallery. In [35] the diverse decision criteria involved in selecting a new function for a historic building make this issue multidimensional. Many of these criteria are interrelated and exhibit non-linear characteristics, necessitating a comprehensive network-based approach rather than a traditional hierarchical method for conducting multicriteria analysis
The authors plan to conduct further research on housing estates by size (number of inhabitants) and for communities lacking essential facilities, in line with the 15-min city concept. The results proposed in this work form the basis for further in-depth analysis of the investment attractiveness of the studied utility functions, aiming to find ways to reduce projected costs while simultaneously improving various criteria.

6. Conclusions

Based on the analysis of the provided article, several key conclusions can be drawn regarding the suitability of the investigated building for different utility functions and the associated capital investment required for improvement:
  • The proposed utility functions for the building include a nursery and kindergarten (Variant V1), shop (Variant V2), and office (Variant V3), in addition to the base residential function (Variant V0). These functions were chosen based on social and economic justifications within the housing estate.
  • The suitability of the building for each utility function was assessed based on four criteria: thermal comfort (F1), building airtightness (F2), non-renewable primary energy indicator EP (F3), and vibrations (F4).
  • The current state of the building was compared with the standards specified for each utility function across the four criteria. This comparison revealed variations in compliance, with some criteria meeting the required class, while others needing improvement.
  • The level of capital investment needed to improve the building’s condition for each utility function was estimated based on the assumption of increasing the class of each criterion by one point. The calculated costs varied for each variant, with Variant V2—shop requiring the least investment and Variant V1—nursery and kindergarten requiring the highest.
  • The economic attractiveness of each utility function was assessed based on the relative level of capital investments required for building renovation. Variant V2—shop emerged as the economically beneficial option, while Variant V1—nursery and kindergarten required the highest investment, exceeding the costs of Variant V2 by six times.
In summary, the analysis indicates that Variant V2—shop is the most economically viable option for future investments, while Variant V1—nursery and kindergarten requires significant capital expenditure. These findings provide valuable insights for decisionmakers regarding the optimal utilization of the building space within the housing estate.

Author Contributions

Conceptualization, M.F.-C. and A.K.-K.; methodology, M.F.-C., A.K.-K., A.S. and P.S.; software, M.F.-C.; validation, M.F.-C., A.K.-K., A.S. and P.S.; formal analysis, M.F.-C. and A.S.; investigation, M.F.-C. and A.K.-K.; resources, M.F.-C., A.K.-K. and P.S.; data curation, M.F.-C., A.K.-K., A.S. and P.S.; writing—original draft preparation, M.F.-C., A.K.-K., A.S., D.O.P. and P.S.; writing—review and editing, M.F.-C., A.K.-K., A.S., D.O.P. and P.S.; visualization, M.F.-C.; supervision, M.F.-C. and A.K.-K.; project administration, M.F.-C. and A.K.-K.; funding acquisition, M.F.-C. and A.K.-K. All authors have read and agreed to the published version of the manuscript.

Funding

This research received no external funding.

Institutional Review Board Statement

Not applicable.

Informed Consent Statement

Not applicable.

Data Availability Statement

The original contributions presented in the study are included in the article, further inquiries can be directed to the corresponding author.

Conflicts of Interest

The authors declare no conflicts of interest.

References

  1. Polskie Domy Drewniane SA. Available online: https://pddsa.com.pl/ (accessed on 4 September 2022).
  2. Cabral, M.R.; Blanchet, P. A State of the Art of the Overall Energy Efficiency of Wood Buildings—An Overview and Future Possibilities. Materials 2021, 14, 1848. [Google Scholar] [CrossRef] [PubMed]
  3. Salonvaara, M.; Desjarlais, A. Impact of Insulation Strategies of Cross-Laminated Timber Assemblies on Energy Use, Peak Demand, and Carbon Emissions. Buildings 2024, 14, 1089. [Google Scholar] [CrossRef]
  4. Zmijewki, T.; Wojtowicz-Jankowska, D. Timber—Material of the Future—Examples of Small Wooden Architectural Structures. IOP Conf. Ser. Mater. Sci. Eng. 2017, 245, 082019. [Google Scholar] [CrossRef]
  5. Sulik, P. Budynki o Konstrukcji Drewnianej We Współczesnym Budownictwie Mieszkaniowym. Mater. Bud. 2019, 1, 42–44. [Google Scholar] [CrossRef]
  6. Rizzo, F.; Caracoglia, L.; Piccardo, G. Examining wind-induced floor accelerations in an unconventionally shaped, high-rise building for the design of “smart” screen walls. J. Build. Eng. 2021, 43, 103115. [Google Scholar] [CrossRef]
  7. Rozporządzenie Ministra Rozwoju z Dnia 16 Września 2020 r. Zmieniające Rozporządzenie w Sprawie Warunków Technicznych, Jakim Powinny Odpowiadać Budynki i Ich Usytuowanie. Available online: https://isap.sejm.gov.pl/isap.nsf/DocDetails.xsp?id=WDU20200001608 (accessed on 26 August 2024).
  8. Passivhaus Institut. Available online: https://Passivehouse.Com/ (accessed on 26 August 2024).
  9. Kisilewicz, T.; Fedorczak-Cisak, M.; Barkanyi, T. Active Thermal Insulation as an Element Limiting Heat Loss through External Walls. Energy Build. 2019, 205, 109541. [Google Scholar] [CrossRef]
  10. Nowak, K.; Rojewska-Warchał, M. The Type and Size of Glazing versus Thermal Comfort in Office Spaces; Cracow University of Technology: Kraków, Poland, 2021; ISBN 978-83-66531-70-3. Available online: https://cris.pk.edu.pl/info/article/CUT738fc3dcf14841a3a7d258a683803bcc/ (accessed on 26 August 2024).
  11. Kisilewicz, T. Passive Control of Indoor Climate Conditions in Low Energy Buildings. Energy Procedia 2015, 78, 49–54. [Google Scholar] [CrossRef]
  12. Kisilewicz, T. Wpływ Izolacyjnych, Dynamicznych i Spektralnych Właściwości Przegród Na Bilans Cieplny Budynków Energooszczędnych. 2008. Available online: https://repozytorium.biblos.pk.edu.pl/resources/25806 (accessed on 26 August 2024).
  13. Kovrova, V.; Volkova, V.; Pakrastins, L. The impact of vibration on buildings: Problems and solutions. E3S Web Conf. 2024, 534, 1010. [Google Scholar] [CrossRef]
  14. Khamporn, N.; Chaiaypinunt, S. An Investigation on the Human Thermal Comfort from a Glass Window. Eng. J. 2014, 18, 25–43. [Google Scholar] [CrossRef]
  15. Abdeljaber, O.; Younis, A.; Avci, O.; Catbas, N.; Gul, M.; Celik, O.; Zhang, H. Dynamic Testing of a Laboratory Stadium Structure. In Geotechnical and Structural Engineering Congress 2016, Proceedings of the Joint Geotechnical and Structural Engineering Congress, Phoenix, AZ, USA, 14–17 February 2016; ASCE: Reston, VA, USA, 2016; pp. 1719–1728. [Google Scholar] [CrossRef]
  16. Kowalska-Koczwara, A. Influence of Location of Measurement Point on Evaluation of Human Perception of Vibration. J. Meas. Eng. 2019, 7, 147–154. [Google Scholar] [CrossRef]
  17. ISO 2631-2; Evaluation of Human Exposure to Whole-Body Vibration Part 2: Human Exposure to Continuous and Shock-Induced Vibrations in Buildings (1 to 80 Hz). ISO: Geneva, Switzerland, 1989.
  18. Wu, W.; Divigalpitiya, P. Availability and Adequacy of Facilities in 15 Minute Community Life Circle Located in Old and New Communities. Smart Cities 2023, 6, 2176–2195. [Google Scholar] [CrossRef]
  19. Rodríguez-Hernández, K.L.; Narezo-Balzaretti, J.; Gaxiola-Beltrán, A.L.; Ramírez-Moreno, M.A.; Pérez-Henríquez, B.L.; Ramírez-Mendoza, R.A.; Krajzewicz, D.; Lozoya-Santos, J.d.-J. The Importance of Robust Datasets to Assess Urban Accessibility: A Comparable Study in the Distrito Tec, Monterrey, Mexico, and the Stanford District, San Francisco Bay Area, USA. Appl. Sci. 2022, 12, 12267. [Google Scholar] [CrossRef]
  20. Pozoukidou, G.; Angelidou, M. Urban Planning in the 15-Minute City: Revisited under Sustainable and Smart City Developments until 2030. Smart Cities 2022, 5, 1356–1375. [Google Scholar] [CrossRef]
  21. Fedorczak-Cisak, M.; Górszczyk, J.; Kwiecień, A.; Zając, B.; Kozik, T. Impact of the Use of Flexible Joints to Improve the Energy of Nearly Zero Energy Buildings. In Proceedings of the International Conference on Sustainable Materials, Systems and Structures—SMSS 2019, Rovinj, Croatia, 20–22 March 2019; Energy Efficient Building Design and Legislation 2019; Volume 2, pp. 75–82. [Google Scholar]
  22. Fedorczak-Cisak, M.; Kotowicz, A.; Radziszewska-Zielina, E.; Sroka, B.; Tatara, T.; Barnaś, K. Multi-Criteria Optimisation of an Experimental Complex of Single-Family Nearly Zero-Energy Buildings. Energies 2020, 13, 1541. [Google Scholar] [CrossRef]
  23. PN-EN 16798-1:2019-06; Energy Performance of Buildings—Ventilation for Buildings—Part 1: Indoor Environmental Input Parameters for Design and Assessment of Energy Performance of Buildings Addressing Indoor Air Quality, Thermal Environment, Lighting and Acoustics—Module M1-6. Polish Committee for Standardization: Warszawa, Poland, 2019.
  24. PN-EN ISO 7726:2002; Ergonomics of the Thermal Environment—Instruments for Measuring Physical Quantities (ISO 7726:1998). Polish Committee for Standardization: Warszawa, Poland, 2022.
  25. ISO 9972:2015; Thermal Performance of Buildings—Determination of Air Permeability of Buildings—Fan Pressurization Method. ISO: Geneva, Switzerland, 2015.
  26. Fedorczak-Cisak, M.; Radziszewska-Zielina, E.; Nowak-Ocłoń, M.; Biskupski, J.; Jastrzębski, P.; Kotowicz, A.; Varbanov, P.S.; Klemeš, J.J. A Concept to Maximise Energy Self-Sufficiency of the Housing Stock in Central Europe Based on Renewable Resources and Efficiency Improvement. Energy 2023, 278, 127812. [Google Scholar] [CrossRef]
  27. Ustawa z Dnia 29 Sierpnia 2014 r. o Charakterystyce Energetycznej Budynków (Dz.U. 2014 Poz. 1200). Available online: https://isap.sejm.gov.pl/isap.nsf/DocDetails.xsp?id=WDU20140001200 (accessed on 26 August 2024).
  28. Ustawa z Dnia 7 Października 2022 r.o Zmianie Ustawy o Charakterystyce Energetycznej Budynków Oraz Ustawy—Prawo Budowlane. Available online: https://isap.sejm.gov.pl/isap.nsf/DocDetails.xsp?id=WDU20220002206 (accessed on 14 April 2024).
  29. Boggs, D.W.; Petersen, P. Acceleration Indexes for Human Comfort in Tall Buildings-Peak or RMS? CTBUH Monogr. 1997, 13, 1–21. [Google Scholar]
  30. PN-B-02171: 2017-06; Evaluation of Human Exposure to Vibration in Buildings. Polish Standardization Committee: Warsaw, Poland, 2017.
  31. ISO 7730:2005; Ergonomics of the Thermal Environment—Analytical Determination and Interpretation of Thermal Comfort Using Calculation of the PMV and PPD Indices and Local Thermal Comfort Criteria. ISO: Geneva, Switzerland, 2005.
  32. Martin-Goñi, P.; Avellaneda, J.; González, J.M. Energetic and Functional Rehabilitation of Residential Buildings in Europe: Analysis and Cataloguing of the Strategies Used. Buildings 2024, 14, 525. [Google Scholar] [CrossRef]
  33. Raslanas, S.; Alchimovienė, J.; Banaitienė, N. Residential areas with apartment houses: Analysis of the condition of buildings, planning issues, retrofit strategies and scenarios. Int. J. Strateg. Prop. Manag. 2011, 15, 152–172. [Google Scholar] [CrossRef]
  34. Shymanska, A.; Kowalska-Koczwara, A.; Fedorczak-Cisak, M. Selection of the Utility Function of the Historic Building, Taking into Account Energy Efficiency. Energies 2023, 16, 7956. [Google Scholar] [CrossRef]
  35. Fedorczak-Cisak, M.; Kowalska-Koczwara, A.; Pachla, F.; Radziszewska-Zielina, E.; Szewczyk, B.; Śladowski, G.; Tatara, T. Fuzzy Model for Selecting a Form of Use Alternative for a Historic Building to be Subjected to Adaptive Reuse. Energies 2020, 13, 2809. [Google Scholar] [CrossRef]
Figure 1. Steps for selecting the optimum function of a site located on the outskirts or at a distance from the city.
Applsci 14 08727 g001
Figure 2. Criteria for assessing the cost prospects of implementing a new utility function for a building located on the outskirts or at a distance from the city.
Applsci 14 08727 g002
Figure 3. Settlement users’ rating of the importance of each criterion.
Applsci 14 08727 g003
Figure 4. Identification of the building where the ‘in situ’ tests were carried out (red marked building) [https://www.google.com/maps/place/Libert%C3%B3w]
Applsci 14 08727 g004
Figure 5. Measurement equipment.
Applsci 14 08727 g005
Figure 6. The system for measuring the airtightness of the building envelope is called the ‘Blower Door’ system.
Applsci 14 08727 g006
Figure 7. Duration time definition.
Applsci 14 08727 g007
Figure 8. Occupant comfort measurements in the experimental building.
Applsci 14 08727 g008
Figure 9. Operational temperature values recorded between 7 March and 17 March 2020.
Applsci 14 08727 g009
Figure 10. Measurement disc.
Applsci 14 08727 g010
Figure 11. Location of sensors in the attic.
Applsci 14 08727 g011
Figure 12. Graphical presentation of results from Table 6.
Applsci 14 08727 g012
Table 1. U-value requirements for external walls applicable in selected EU countries (nZEB) and passive buildings [7,8].
NoCountry EUUc [W/m2 K]
1Poland0.20
2Germany0.28
3Slovakia0.15
4Passive buildings0.15
Table 2. Sensor data.
Type of Building/SpaceCategoryMinimum Operating Temperature [°C] (1.0 clo)Maximum Operating Temperature [°C] (Summer Season) 0.5 clo
Residential buildings (bedrooms, living rooms, kitchens), seating position, 1.2 mI21.025.5
II20.026.0
III18.027.0
IV16.028.0
Offices and spaces with similar user activity (individual offices, meeting rooms, classrooms, shops, and restaurants)I21.025.5
II20.026.0
III19.027.0
IV18.028.0
Table 3. The sensor data recording the temperature.
Sensor TypeMeasuring RangeScaleAccuracy
Temperature−20 °C ÷ +50 °C
(wet-bulb thermometer 0 °C to +5 °C)
0.01 °C±0.4 °C
Table 4. Parameters of the sensors in the microclimate testing device.
Type of SensorMeasurement RangeScaleAccuracy
Temperature–20 °C + 50 °C (wet thermometer 0 °C + 5 °C)0.01 °C±0.4 °C
Humidity0–100%0.1 RH (relative humidity)±2% RH (relative humidity)
Air flow velocity0–5 m/s0.01 m/sFor 0–1 m/s:
±0.05 + 0.05xVa m/s
For 1–5 m/s:
± 5%
Table 5. Summary of test results.
Test NumberDataV50 [m3 /h]n50 [1/h]
128 February 2020793.02.27
226 April 2020598.01.71
35 June 2020331.50.95
Table 6. Vibrational measurement results.
Building C—110/2
Measurement/SensorDisc 5Disc 4Disc 6
P-18zP-15z P-21z
f[Hz]HPVRf[Hz]HPVRf[Hz]HPVR
M 14 passage of car 25 km/h251.08800.60632.33
M 15 passage of car 25 km/h250.89160.60160.67
M 16 passage of loaded tip-card—above the building800.2212.50.19160.40
M 17 passage of loaded tip-card—above the building250.86630.83632.75
M 18 passage of loaded tip-card—above the building251.2631.50.99632.33
M 19 passage of loaded tip-card—above the building250.46160.22500.22
M 20 passage of loaded tip-card—beneath the building250.33160.77161.22
M 21 passage of loaded tip-card—beneath the building31.50.81160.74160.98
M 22 passage of loaded tip-card—beneath the building250.40160.90161.11
Maximum Value 1.26 0.99 2.75
Table 7. Summary of measurements.
CriteriaMeasurement DataCompliance Class
F1 Thermal comfort21.03 °CA
F2 Airtightness of the building envelope574.16 m3/h
1.64 1/h
C
F3 Non-renewable primary energy indicator EP68.65 kWh/(m2rok)C
F4 Vibrations in HPVRWODL-factor 2.75C
Table 8. Requirements for variants and classes of building.
Variant V0—Base ResidentionVariant V1—Nursery and KindergartenVariant V2—ShopVariant V3—Office
F121—class A21—class A20—class B20—class B
F20.6—class A0.6—class A3.0—class C1.5—class B
F370—class C42—class A56—class B56—class B
F42.0—class B0.9—class A4.0—class C4.0—class C
Table 9. Combination of utility function and classes.
F1F2F3F4
V0A/AA/CC/CA/C
V1A/AA/CA/CA/C
V2A/AC/CA/CC/C
V3A/AA/CA/CC/C
Disclaimer/Publisher’s Note: The statements, opinions and data contained in all publications are solely those of the individual author(s) and contributor(s) and not of MDPI and/or the editor(s). MDPI and/or the editor(s) disclaim responsibility for any injury to people or property resulting from any ideas, methods, instructions or products referred to in the content.

