Article

Intelligent Detection of Underwater Defects in Concrete Dams Based on YOLOv8s-UEC

by
Chenxi Liang
1,
Yang Zhao
2,3 and
Fei Kang
2,*
1
China Institute of Water Resources and Hydropower Research, Beijing 100048, China
2
School of Infrastructure Engineering, Dalian University of Technology, Dalian 116024, China
3
CCCC Second Harbor Engineering Co., Ltd., Wuhan 430040, China
*
Author to whom correspondence should be addressed.
Appl. Sci. 2024, 14(19), 8731; https://doi.org/10.3390/app14198731
Submission received: 31 August 2024 / Revised: 23 September 2024 / Accepted: 23 September 2024 / Published: 27 September 2024
(This article belongs to the Section Civil Engineering)

Abstract

:
This study proposes a concrete dam underwater apparent defect detection algorithm named YOLOv8s-UEC for intelligent identification of underwater defects. Due to the scarcity of existing images of underwater concrete defects, this study establishes a dataset of underwater defect images by manually constructing defective concrete walls for the training of defect detection networks. For the defect feature ambiguity that exists in underwater defects, the ConvNeXt Block module and Efficient-RepGFPN structure are introduced to enhance the feature extraction capability of the network, and the P2 detection layer is fused to enhance the detection capability of small-size defects such as cracks. The results show that the mean average precision (mAP0.5 and mAP0.5:0.95) of the improved algorithm are increased by 1.4% and 5.8%, and it exhibits good robustness and considerable detection effect for underwater defects.

1. Introduction

Reservoirs and dams serve essential functions, including flood control, power generation, water supply, and irrigation, playing a vital role in safeguarding lives and fostering economic development [1,2,3]. However, during operation, concrete dams are subjected to foundation loads and sudden disasters, leading to noticeable surface defects, such as cracks. These defects not only compromise structural integrity but may also trigger other issues that pose potential hazards to safety [4,5,6,7], even increasing the risk of dam failure. Therefore, regular defect detection of the dam face is essential [8,9,10].
Since most of the dam structure is located under the water surface for a long time, the detection of the underwater part is more difficult [11,12]. Traditional underwater defect detection primarily relies on professional divers wearing diving equipment to carry out operations underwater [13]. However, constrained by the underwater environment and water depth, this method is highly dangerous and unable to work in deep water [11,14]. With the development and maturation of remotely operated vehicle (ROV) technology, it has successfully replaced human divers for underwater inspections in hazardous deep-water environments due to its strong adaptability, high pressure resistance, and ability to operate for extended periods [15,16,17,18]. ROV can carry multi-source sensors, using a variety of advanced technical means, such as underwater camera, sonar detection, remote sensing technology, and robotic arms, to carry out a comprehensive detection and assessment of the dam [19,20,21,22]. Many countries and organizations around the world have successfully applied ROV technology to realize underwater exploration missions for dams. As early as 2001, Japan developed and applied its own underwater exploration ROV to the Miyase Dam field test, and the ROV moved 50 m between the concrete of the dam wall deep in the dam to observe its stratification [23]. The University of Girona in Spain uses its own developed underwater robot equipped with side-scan sonar, speed sensors, underwater cameras, and imaging sonars to inspect the underwater surface of dams and perform underwater image stitching. They observed a significant amount of underwater algae, confirming the feasibility of ROVs for dam surface inspections [24]. The Tokai University in Japan has designed a negative pressure suction cup ROV that can adhere to dam surfaces and move vertically along them using rubber wheels when close to the dam. This design enhances the stability of the ROV during underwater inspections [25]. China used an underwater ROV to detect the upstream dam face of the Tongzilin Dam and to detect underwater seepage through multibeam sonar [26]. The TB-1 ROV developed by Harbin Engineering University successfully observed centimeter-level underwater dam face cracks in the underwater multi-angle detection test for the Gezhouba Dam, which significantly improved the accuracy of the underwater robot detection [27].
With the development of machine vision technology, deep learning methods provide new ideas for underwater detection. Deep learning is a part of machine learning, and deep learning achieves the learning of data features and reveals their intrinsic connections by constructing an artificial neural network and simulating the information transfer between neurons [28,29]. Deep learning algorithms have numerous advantages, including strong feature extraction capabilities, high accuracy in recognition, and good real-time performance [30,31]. By using imaging devices like cameras to collect image data and analyzing it through machine vision, deep learning can effectively carry out large-scale structural defect detection tasks. In underwater detection, underwater defect images can be acquired by ROV and defect detection algorithms can be constructed by deep learning [32,33,34]. The better the diversity of data used for learning, the better the network training effect, and the higher the detection performance of the algorithm [31,35,36,37]. However, due to the underwater environment, the acquisition of concrete underwater defect images requires a lot of time and expensive equipment, the current underwater defect images are very scarce, and the corresponding image data labels for training are also more scarce [18,38]. Some scholars have considered transfer learning to solve this problem.
Transfer learning [39,40] solves the problem of insufficient data and high workload by transferring the knowledge learnt from a baseline dataset to a new problem. Fan et al. [41] proposed an underwater dam crack image segmentation model based on transfer learning, which effectively reduces the workload of data labeling and achieves better segmentation results for underwater dam crack images compared to existing methods, although it suffers from poor real-time performance. Li et al. [38] introduced a two-stage joint recognition method that transfers crack feature knowledge learned from civilian infrastructure to underwater dam structures, developing a real-time segmentation framework for underwater dam cracks, achieving an accuracy of up to 0.9444 on the test set and effectively estimating the geometric features and sizes of the cracks. Cao et al. [42] proposed a method for underwater crack detection based on image stitching and semantic segmentation, which successfully improved m-IOU and F1 scores and demonstrated good generalization capability. Qi et al. [43] developed an underwater crack segmentation network that combines convolutional neural networks and the Otsu algorithm, enabling crack recognition and measurement through preprocessing of underwater images, with a recognition precision of 0.2 mm, surpassing other similar methods. Li et al. [44] proposed a crack disease recognition network for underwater bridge structures based on an improved YOLOv4, with the model size only one-fifth of the original, enhancing detection efficiency and ease of deployment. Despite these studies addressing underwater defect issues and proposing solutions like transfer learning, the lack of underwater defect image samples remains unchanged, which continues to restrict the further development of underwater defect detection technology. Therefore, constructing a dataset of underwater defects for deep learning would significantly aid research in underwater defect detection.
At the same time, there are unique features of underwater defects in concrete dams, such as cracking, spalling, and exposed bars [11,16]. Due to the influence of the underwater environment, defect features on dam surfaces are not obvious and are difficult to distinguish from complex backgrounds, as shown in Figure 1a. Additionally, defects such as cracks and spalling affect each other, resulting in significant differences in the pixel ratios they occupy in the images. The texture and morphological characteristics of different defects also vary, as illustrated in Figure 1b. All the above create great difficulties for underwater defect recognition based on object detection. Therefore, it is necessary to develop an algorithm with high detection accuracy for underwater defect features to achieve multiple underwater defect detection.
The contributions of this study are as follows. First, an underwater defect dataset was established by artificially creating defect specimens and using an ROV for image acquisition, which included cracks, spalling, and exposed areas. Second, model ablation experiments were conducted to address the characteristics of underwater defects, gradually improving the YOLOv8s network by introducing the Efficient-RepGFPN structure and ConvNeXt module, leading to the proposal of the YOLOv8s-UEC network for underwater defect detection. Finally, the performance of the proposed network was tested, demonstrating the feasibility and superiority of the algorithm.

2. Methodology

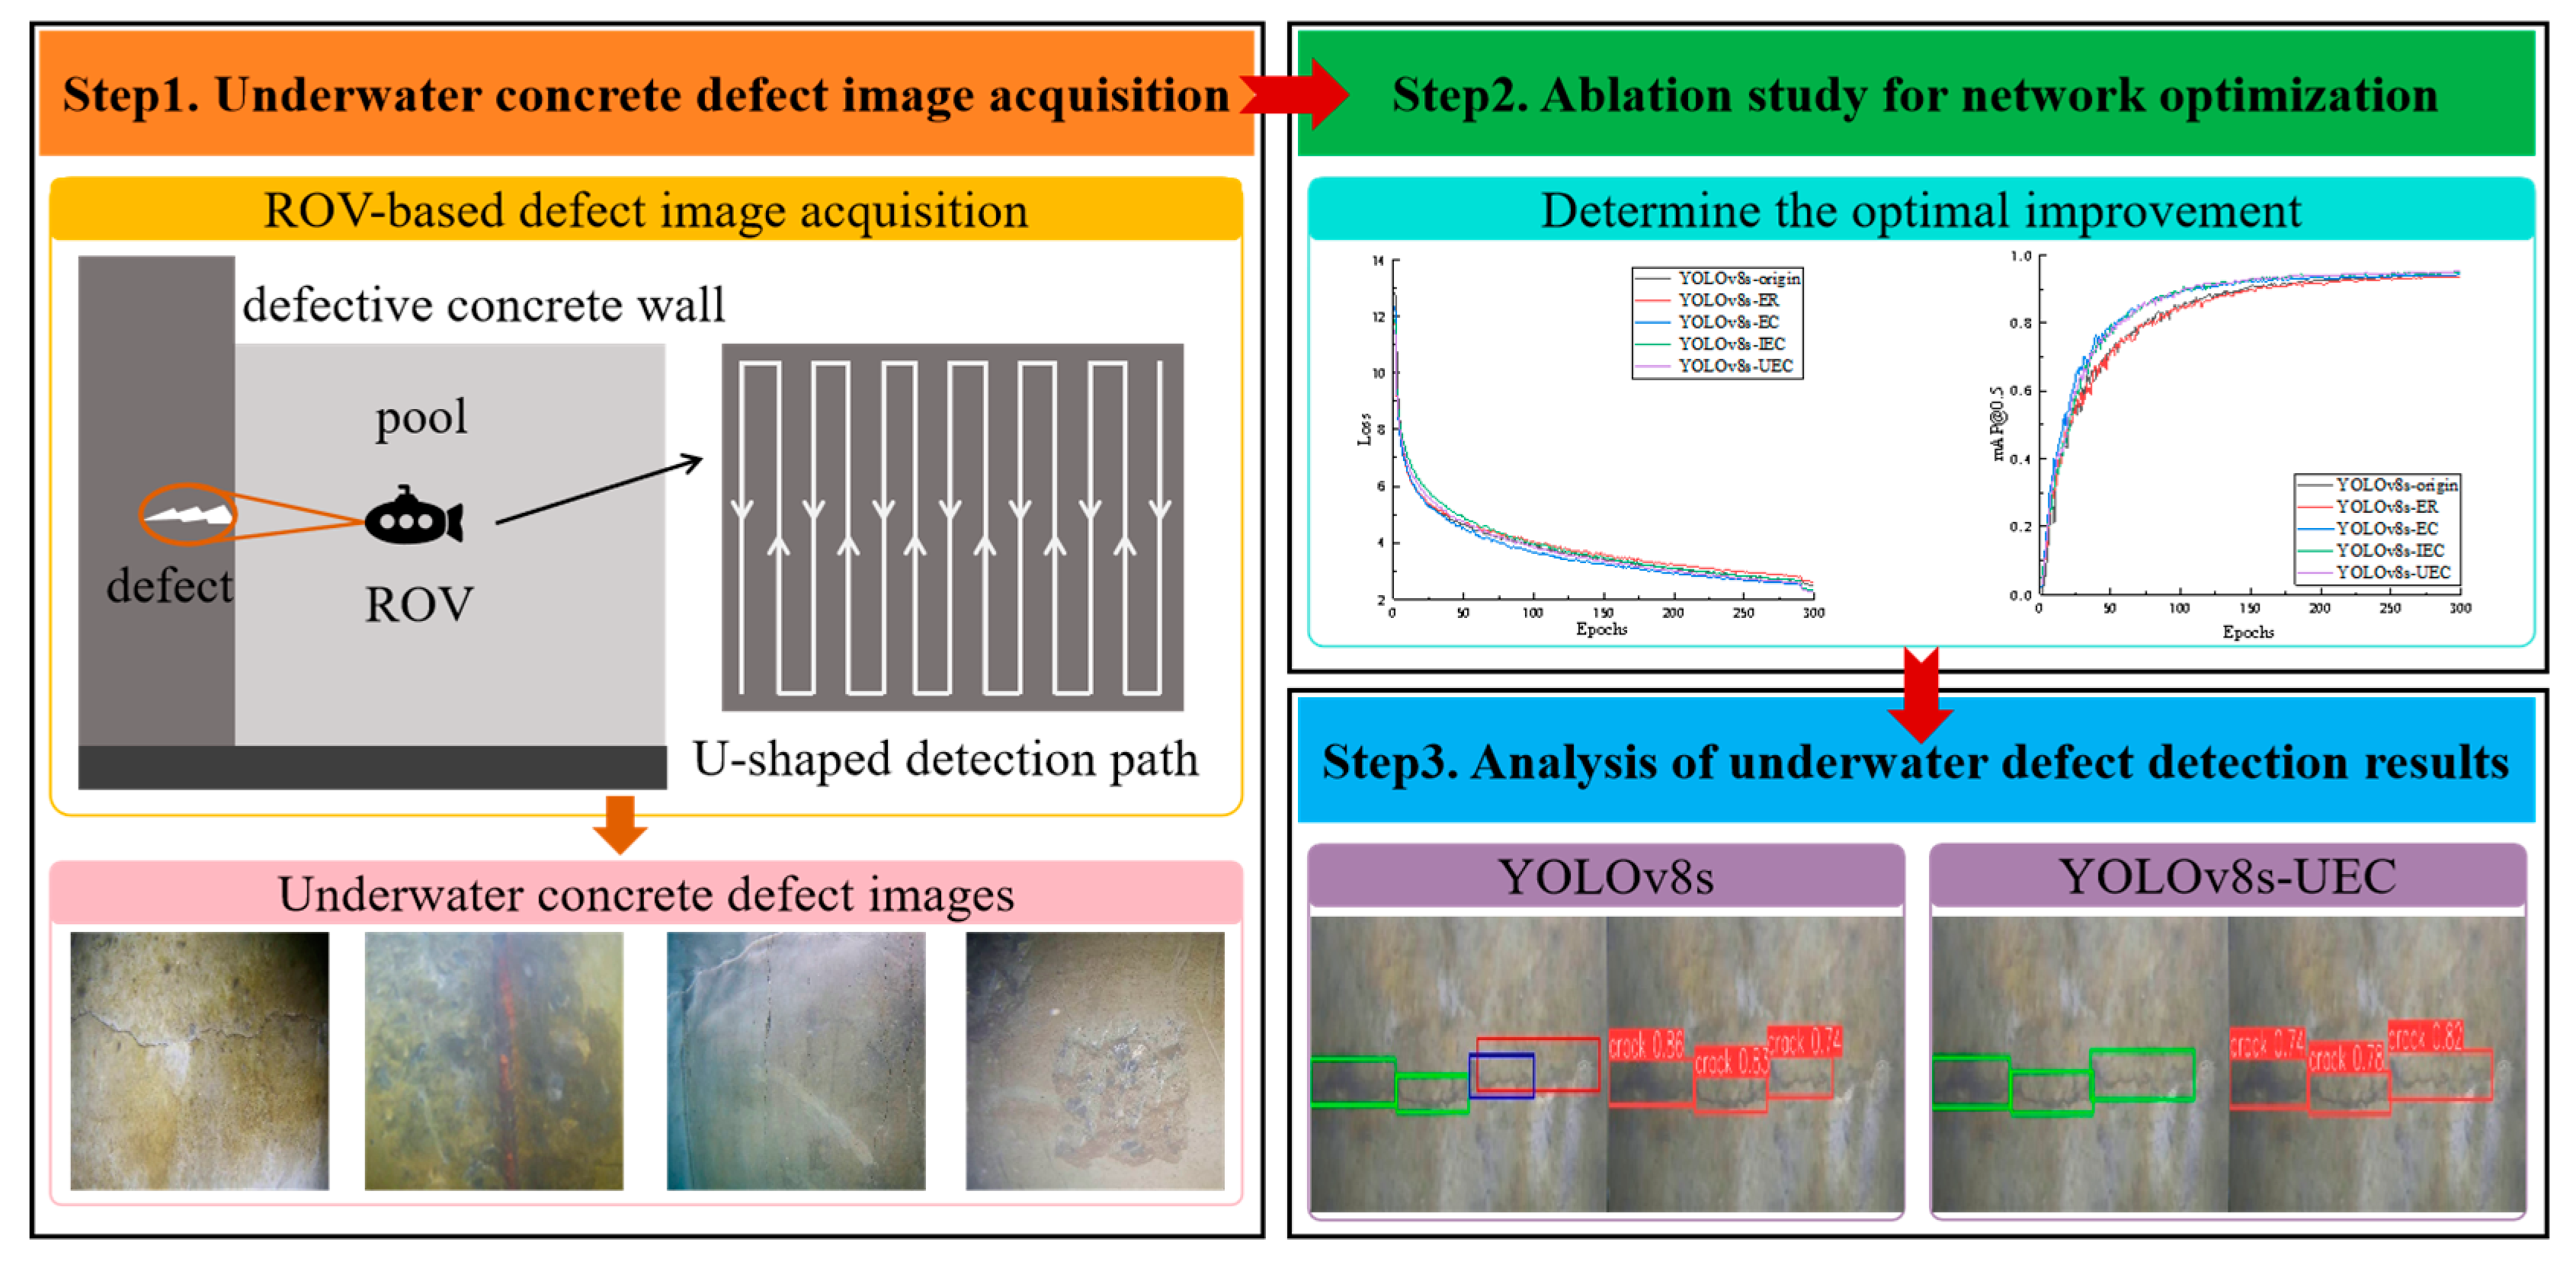
2.1. Procedure of Underwater Defects Detection

The main steps of this study regarding the underwater defect detection method are shown in Figure 2. The detection process is divided into three steps: (1) underwater concrete defects image acquisition; (2) ablation study for network optimization; (3) analysis of underwater defect detection results.
In the first step, since the training of the object detection network requires data samples and labels to provide a basis for network feature learning, considering the difficulty of obtaining actual underwater dam surface defect data, a defective concrete wall is constructed using artificially built concrete defect specimens for data acquisition, and the underwater defect data are collected by the ROV in a U-shaped path from the top to the bottom of the pool.
In the second step, an ablation study is carried out using different combinations of optimized modules and structures, so that the proposed network achieves the best balance between precision and speed. The study uses the dataset established in the first step, ensuring that the experimental parameters are consistent across each group.
Finally, in the third step, the accuracy and applicability of the network in each experimental group are tested and the corresponding detection results are analyzed.

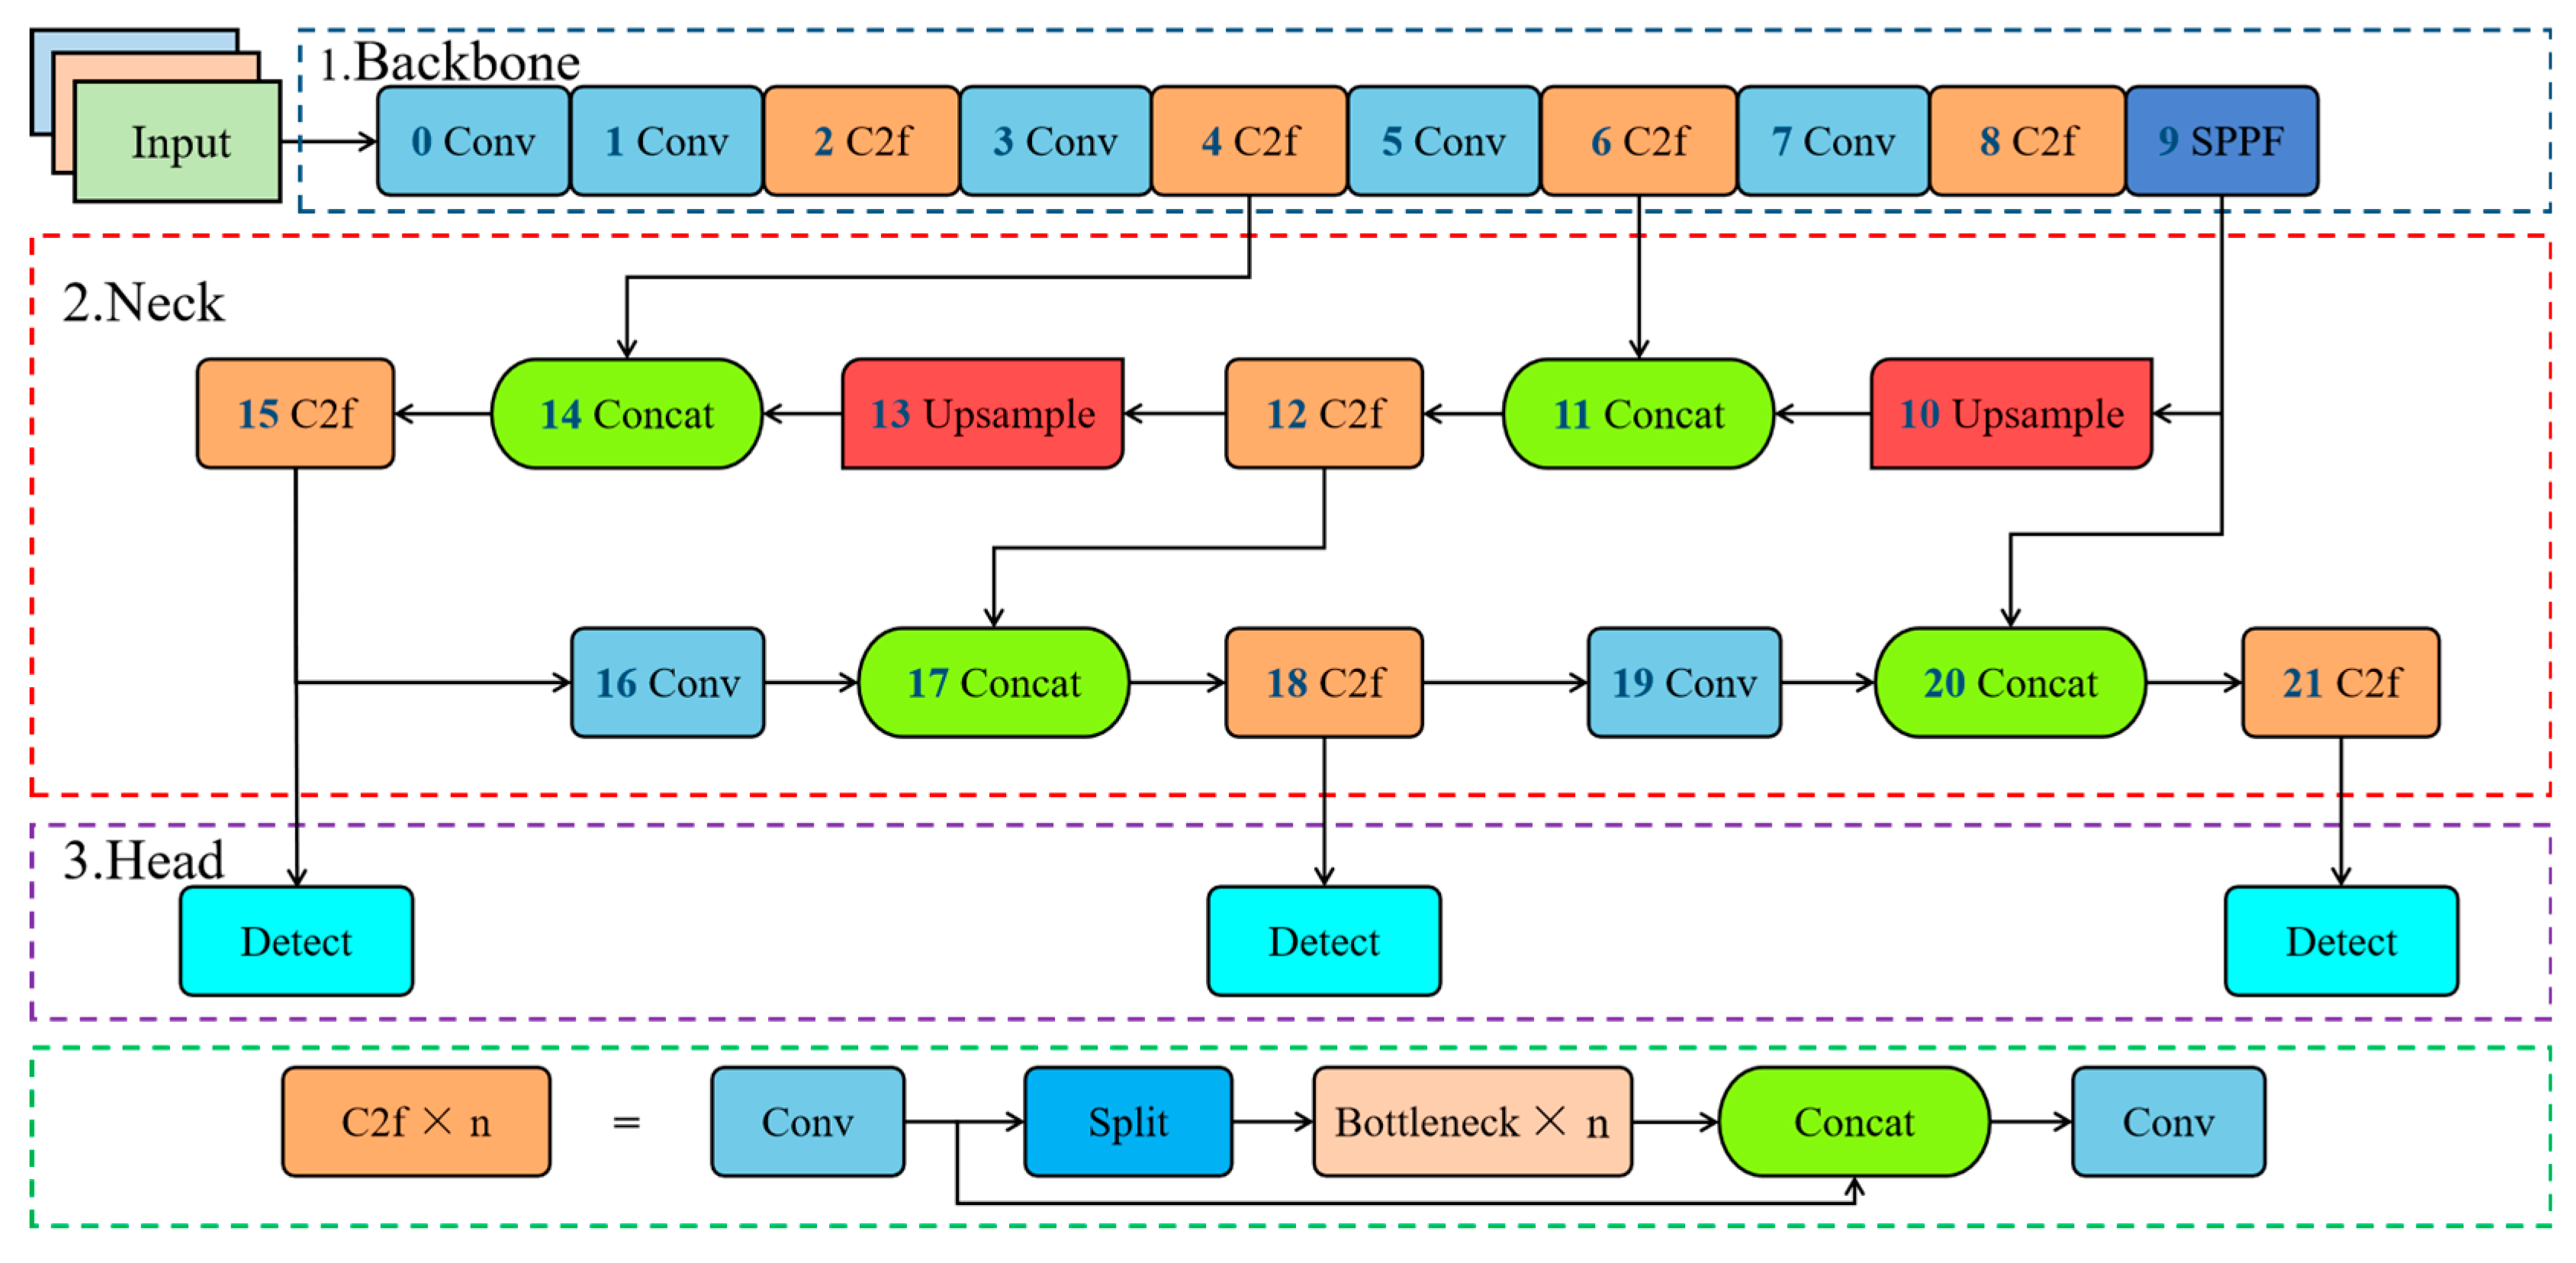
2.2. Original YOLOv8s Network

YOLOv8 is the YOLO series of object detection models released by Ultralytics, which builds on previous versions by optimizing the structure of the backbone and neck network to maintain the best balance between accuracy and speed for object detection tasks in all areas [45]. In addition, during the design and optimization process of YOLOv8, considering the ease of use and deployment of the model, it is suitable for deployment to the mobile terminal for underwater defect detection. According to the network depth and width, YOLOv8 can be divided into 5 sizes of n, s, m, l, and x [46]. Among these, the n-version network model is the smallest but has the worst detection performance; the x-version offers the best detection performance but has a larger model size, making it less suitable for later export and deployment. Based on the number of images in the dataset, which consists of several thousand images, the s or m versions are more appropriate. Considering that larger models require higher computational resources, this study decided to use YOLOv8s as the baseline network for research. The network structure is shown in Figure 3.
The structure of YOLOv8s consists of backbone, neck, and head parts. The backbone part uses the CSPDarkNet structure, including Conv, C2f, and Spatial Pyramid Pooling-Fast (SPPF) modules, which are mainly used for feature extraction of images. The neck part is a crucial component that connects the network backbone and the detection head, primarily responsible for feature fusion and processing to improve detection accuracy and efficiency. The neck part upsamples and fuses channel information from the backbone, sending the detailed information to the detection head for loss calculation and result prediction. The head part of the network adopts a decoupled head structure, which assigns the classification and regression tasks to different branches to improve the accuracy and stability of the prediction.

2.3. Network Improvement Component

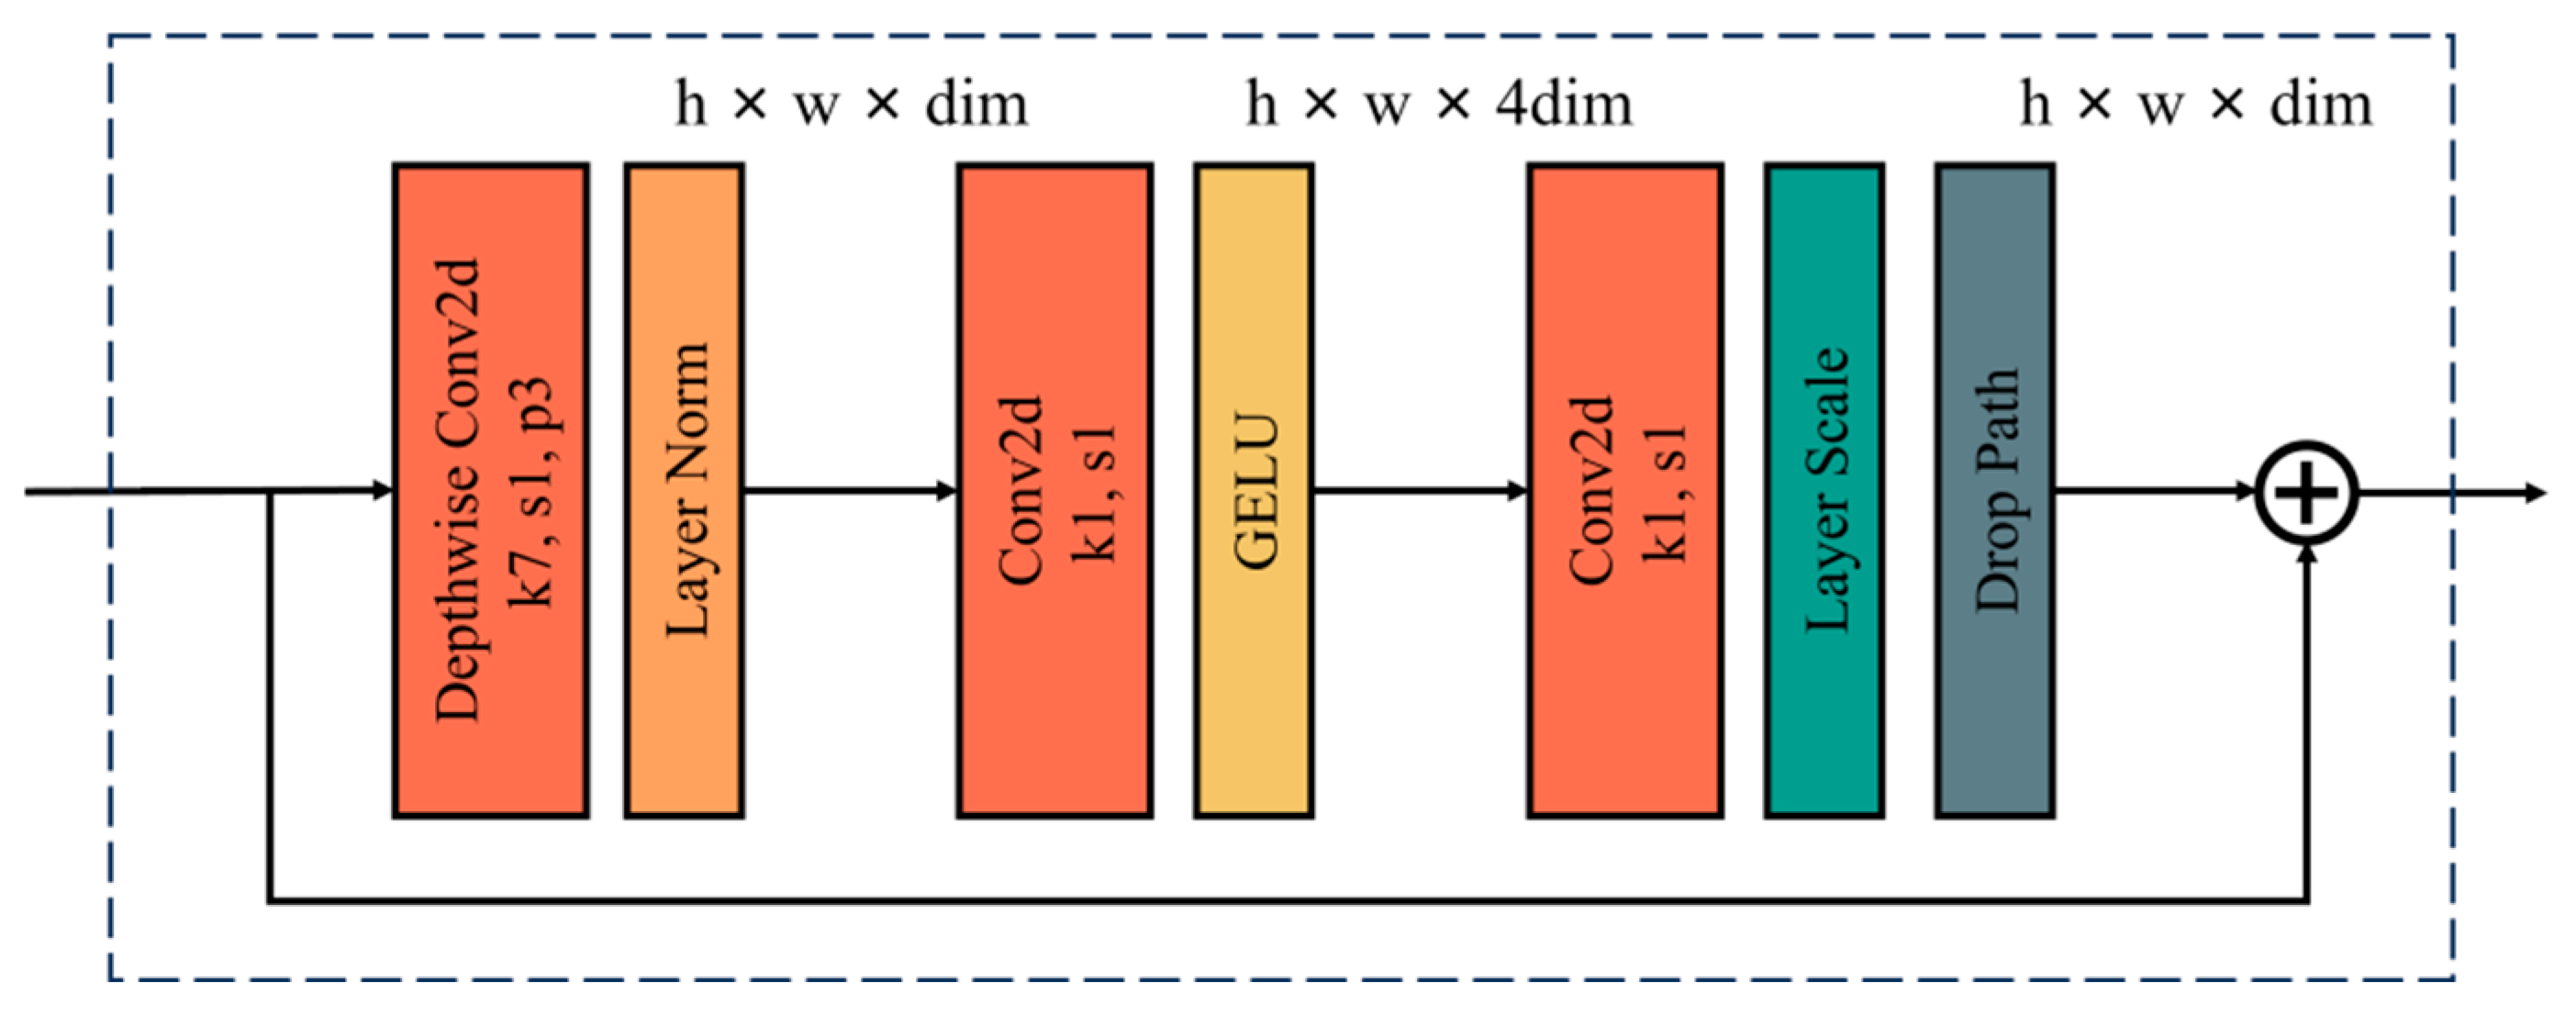
2.3.1. ConvNeXt Block Module

ConvNeXt [47,48] is a pure convolutional model based on the ResNet50 model and improved with reference to the structure of Swin Transformer, and the ConvNeXt Block is the core module of the ConvNeXt network structure, whose structure is shown in Figure 4. ConvNeXt Block adopts the grouped convolution idea, where the number of channels of the input feature maps determines the number of convolution kernels, and each convolution kernel processes a corresponding channel and generates a feature map. All the generated feature maps are stacked in the channel dimension, thus maintaining the same number of channels for both input and output feature maps. Meanwhile, ConvNeXt Block introduces an inverse bottleneck layer structure, which is characterized by two narrow ends and a wide middle, and effectively avoids information loss through the operation of dimension up and then dimension down, which has achieved good results in practice. Compared to ResNet Block, ConvNeXt Block chooses to use Depthwise (DW) convolution and selects the same 7 × 7 large convolution kernel as a Swin Transformer Block. The activation function is also switched from the earlier ReLU to GELU, and fewer activation functions are used. In addition, the same Layer Normalization (LN) as in Swin Transformer Block is chosen, while reducing the LN used.

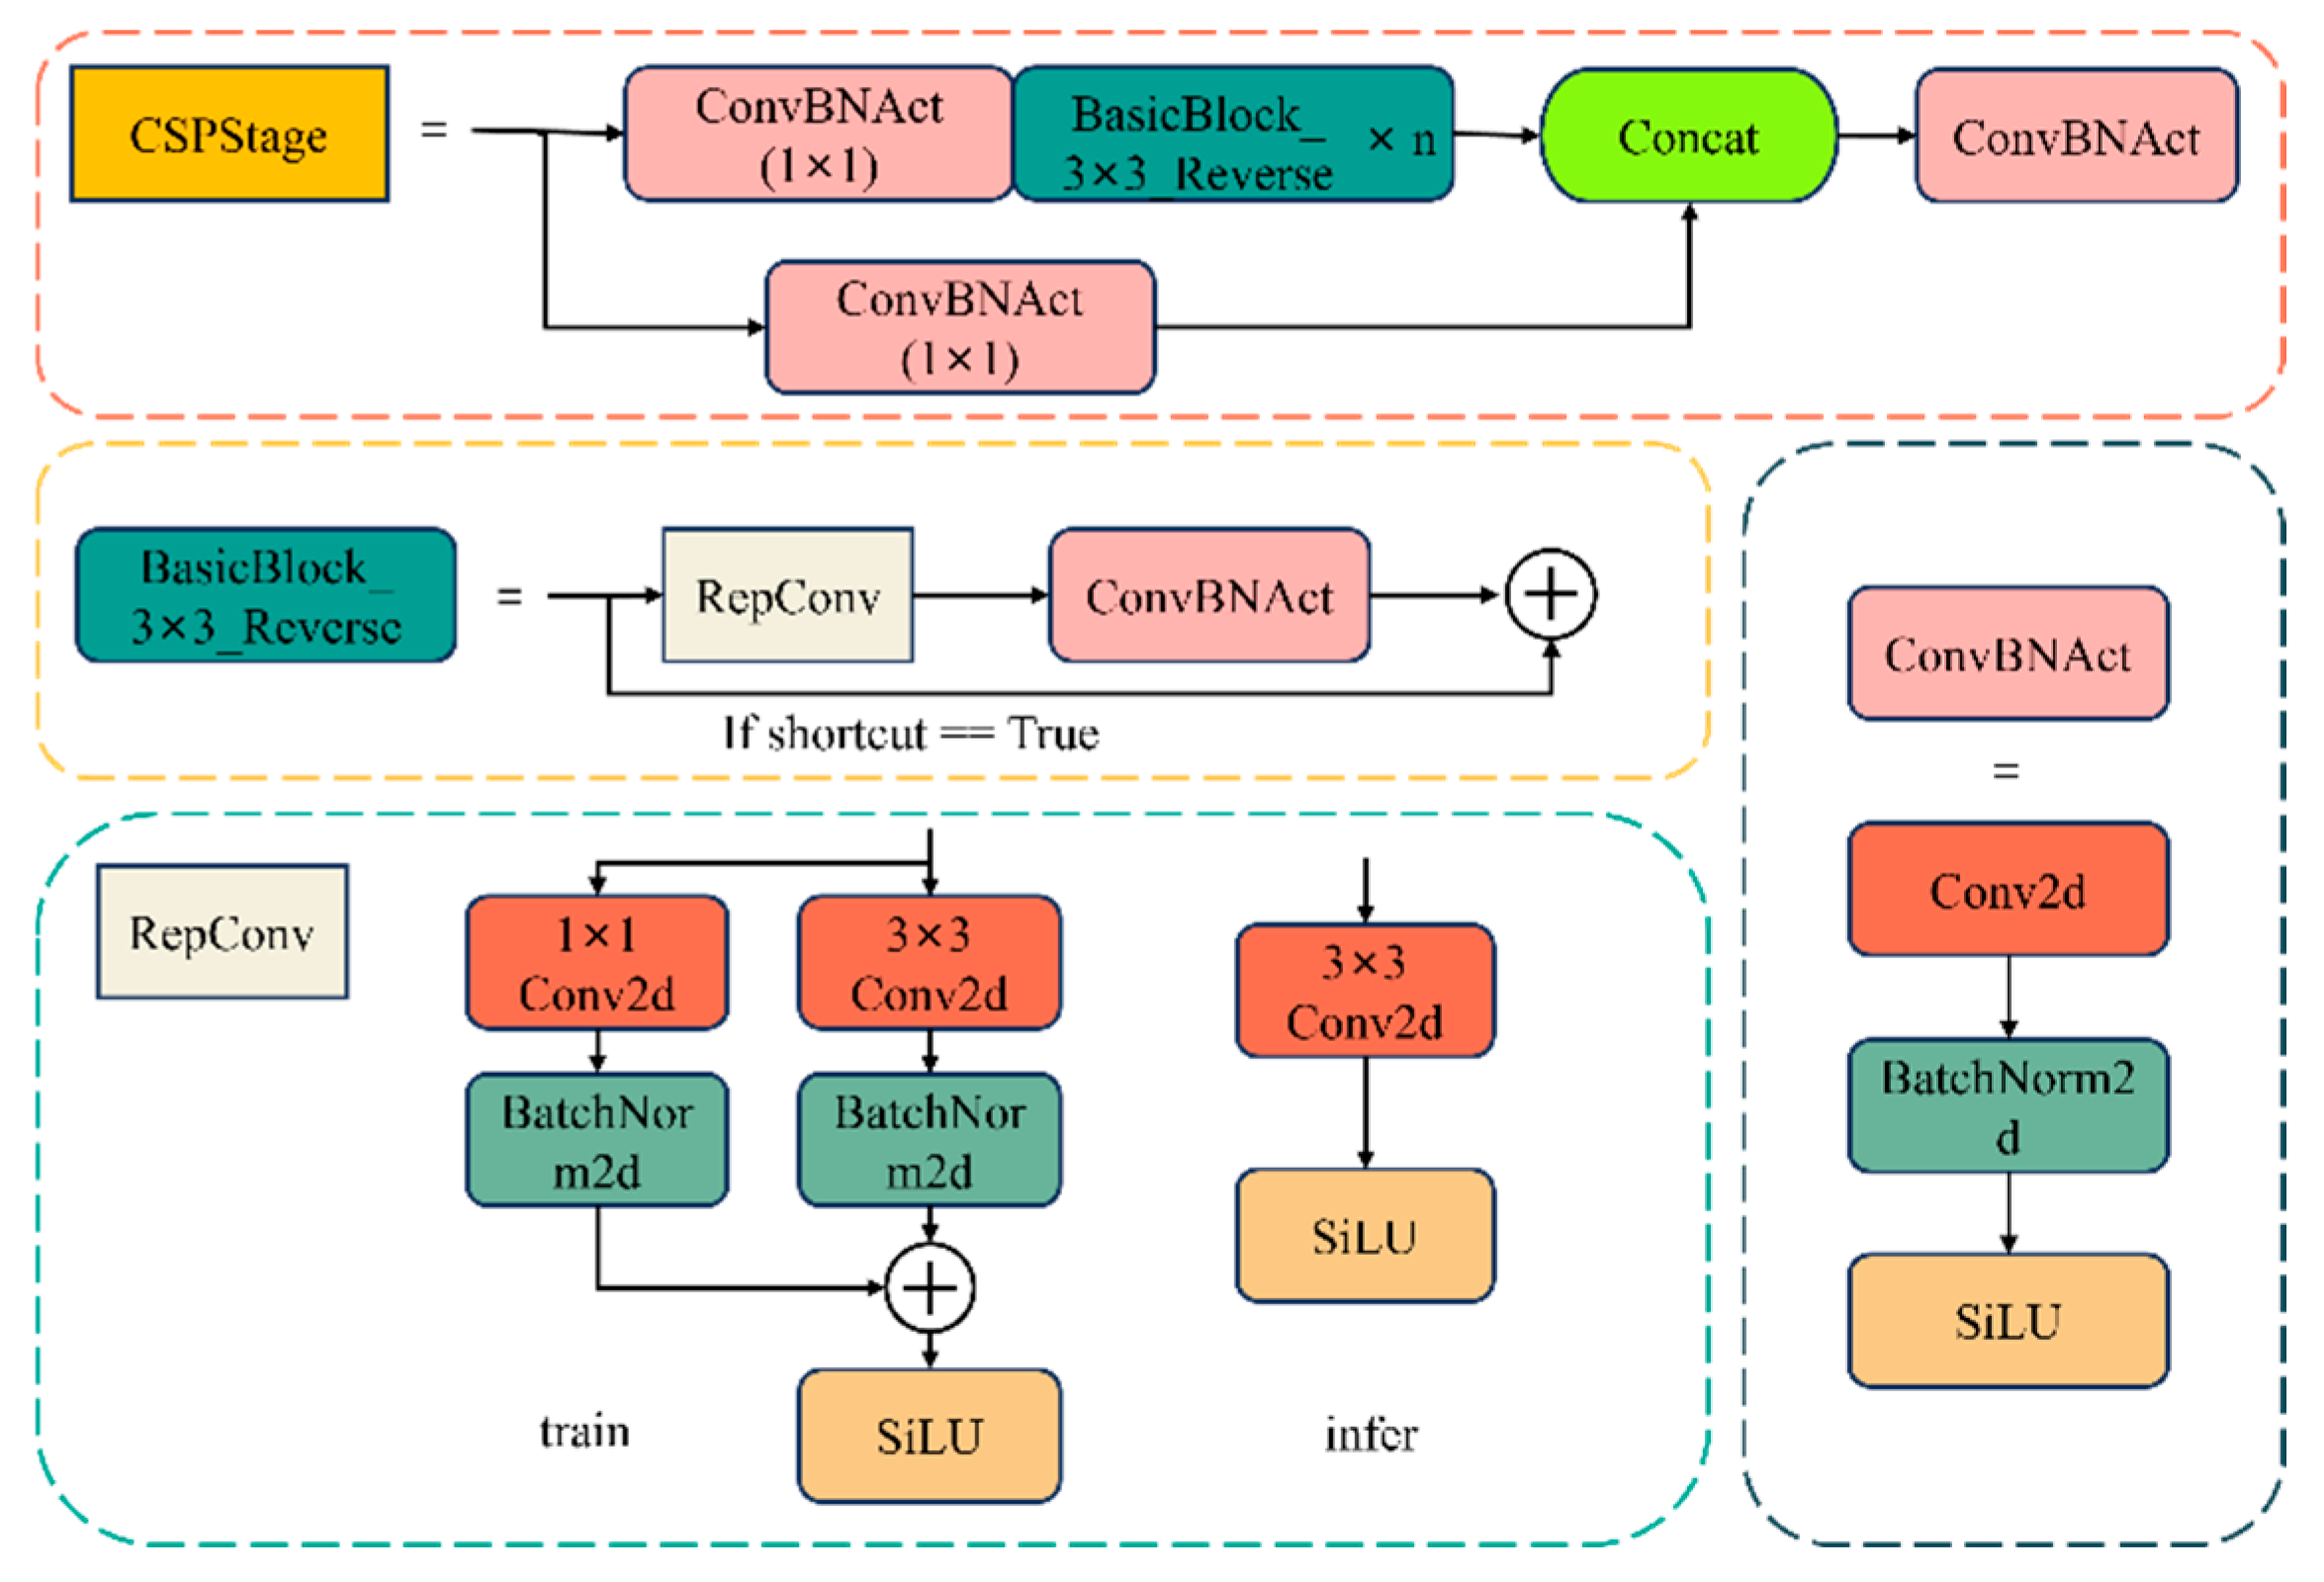
2.3.2. Efficient-RepGFPN Structure

DAMO-YOLO [49] is an object detection algorithm developed by the Alibaba DAMO Academy for Discovery. It makes a series of optimizations and enhancements based on the YOLO framework, such as adjustments to the model structure and updates to the training strategy, to provide faster and more accurate object detection performance on limited-resource devices. Efficient-RepGFPN is a deep neck part adopted by DAMO-YOLO [50], which achieves efficient multi-scale feature fusion. Efficient-RepGFPN structure is shown in Figure 5, and specific optimizations include: (1) Efficient-RepGFPN employs channel dimensions of different scales. Specifically, Efficient-RepGFPN uses varying numbers of channels across different feature layers to better accommodate features at different scales. This design leverages all available computational resources and enhances the efficiency of feature extraction. (2) Efficient-RepGFPN introduces an optimized Queen-Fusion mechanism. Traditional Queen-Fusion involves extensive upsampling and downsampling operations to achieve feature fusion at different scales, resulting in a significant computational burden. Efficient-RepGFPN eliminates redundant upsampling operations in Queen-Fusion to reduce latency, thereby further improving real-time performance. (3) Efficient-RepGFPN improves the original convolution-based feature fusion module by introducing the CSPStage module, which integrates reparameterization mechanisms, Cross-Stage Partial Networks (CSPNet), and Efficient Layer Aggregation Networks (ELAN).
The structure of the CSPStage module is shown in Figure 6, which splits the feature learning path into two parts; one part is directly residual concatenated, and the other part undergoes a series of convolutions before being fused with the first part. This design helps to extract and fuse different levels of feature information, thus enhancing the feature representation. The structure-heavy, parameterized convolution known as RepConv is also employed. This approach utilizes a two-branch structure during training, which is fused into a single branch during inference, thereby reducing inference time.

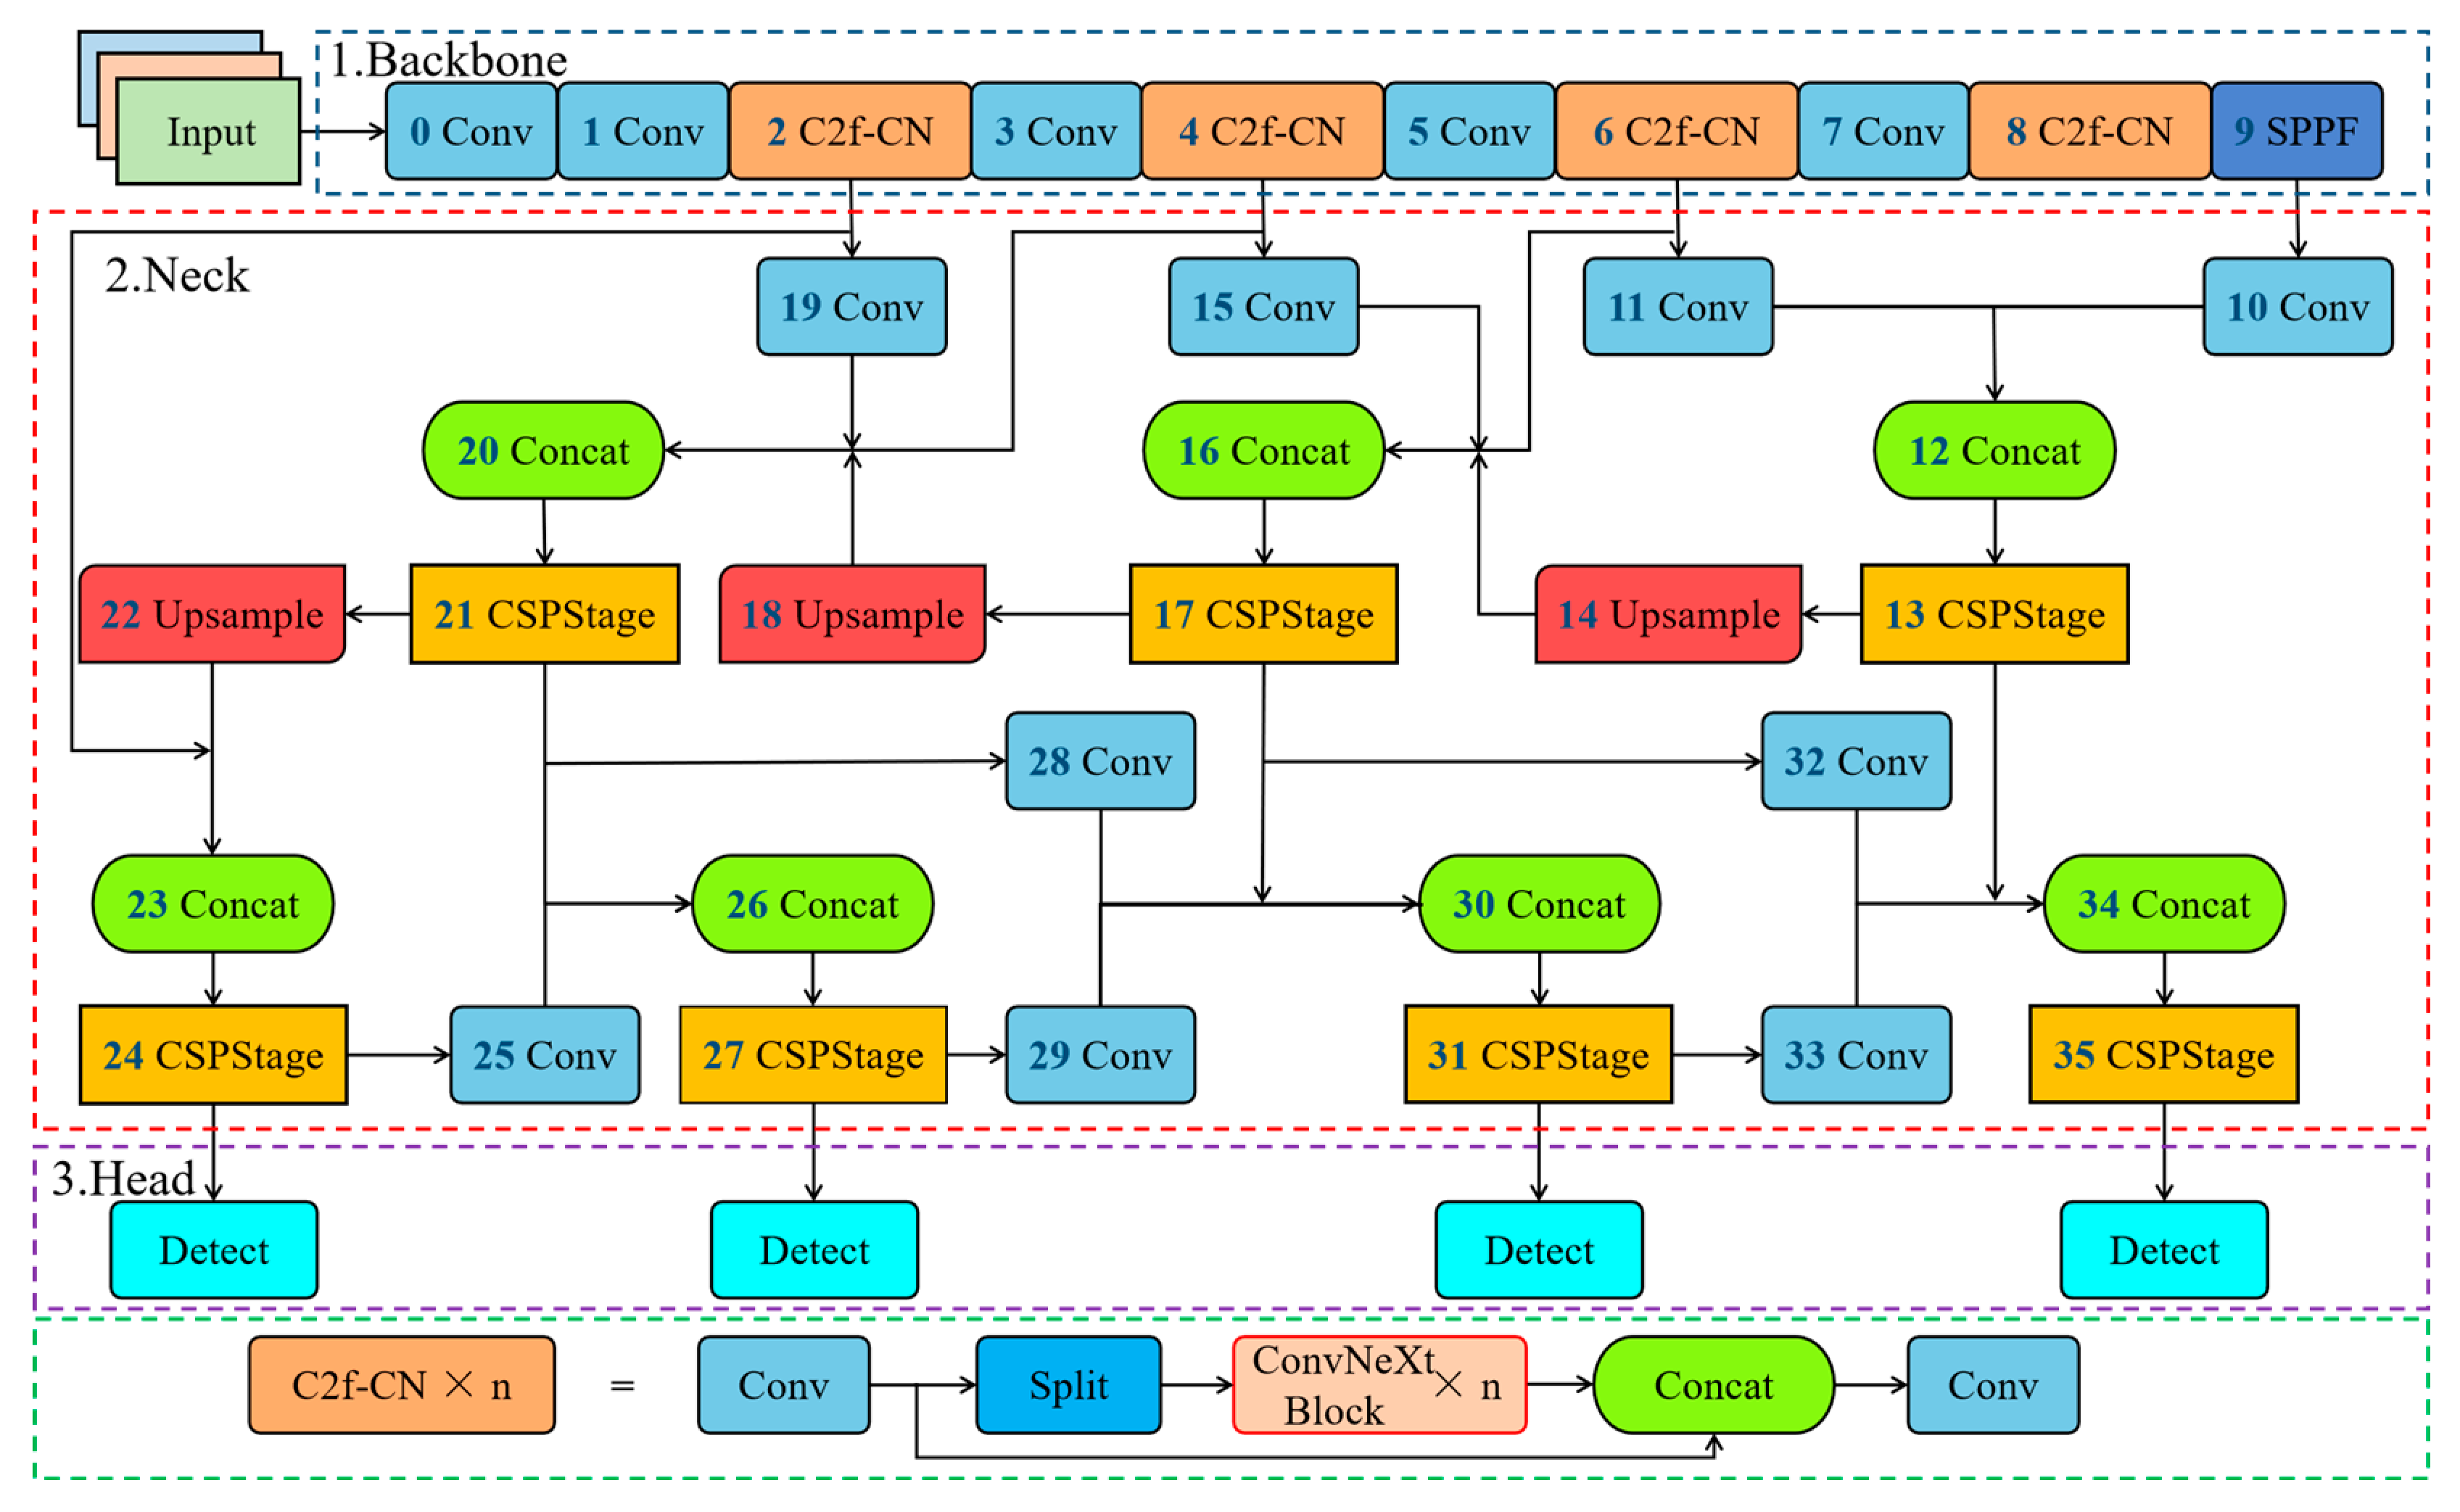
2.4. Proposed YOLOv8s-UEC Network

The structure of YOLOv8 is designed to be applicable across various object detection tasks, resulting in a balanced overall performance. However, in underwater defect detection tasks, challenges arise due to the influence of the underwater environment. Defect features on underwater dam surfaces are not distinct and are often intertwined with complex backgrounds, making them difficult to discern. Defects like cracks and spalling affect each other, leading to significant differences in pixel proportions in images, and various defects have different texture and shape characteristics. These factors present significant challenges for detection. To address the issues of indistinct defect features and blurry boundaries between defects and backgrounds, it is essential to enhance the network’s feature extraction capability. This capability is closely related to the network’s structure and modules; therefore, improving these can effectively boost network performance. Additionally, it is crucial to balance detection accuracy and speed during improvements to avoid sacrificing detection speed due to the addition of excessive modules for accuracy enhancement. Thus, a gradual debugging process is necessary to achieve the best balance between these two aspects.
Another challenge in underwater detection is the significant disparity in pixel proportions occupied by different defects. For example, cracks occupy a small proportion of the image compared to large areas of underwater concrete spalling, falling into the small target category. Small targets are often overlooked or misjudged due to their minimal pixel presence, leading to lower detection accuracy. To improve detection accuracy for small targets, the introduction of the P2 small object detection layer can be beneficial. The P2 layer typically has higher resolution, allowing the model to better capture the details of small-sized targets. Higher resolution feature maps provide more spatial information, aiding in detecting small objects. Moreover, because the P2 layer is in a shallower network position, it can capture finer details, which is crucial for understanding the shape and texture of small targets.
The specific improvement measures are as follows: (1) replacing the neck part of the network with Efficient-RepGFPN to flexibly control the expression ability of high and low layers of features, improve the feature extraction ability of the network, and solve the problem of blurring the boundary between the defects and the background, and the problem of low accuracy caused by the features that are not obvious; (2) introducing the P2 small target detection layer into the Efficient-RepGFPN structure improves detection accuracy for small targets like cracks. This approach addresses the issue of significant differences in pixel ratios among various defects in images, helping to reduce the chances of small target defects being overlooked or misclassified; (3) replacing the bottleneck in the C2f module in the network backbone with a ConvNeXt pure convolutional lightweight high-performance structure, to improve the detection efficiency. The proposed network is referred to as YOLOv8s-UEC (YOLOv8s for underwater defect detection based on improved Efficient-RepGFPN and ConvNeXt Block), as shown in Figure 7.

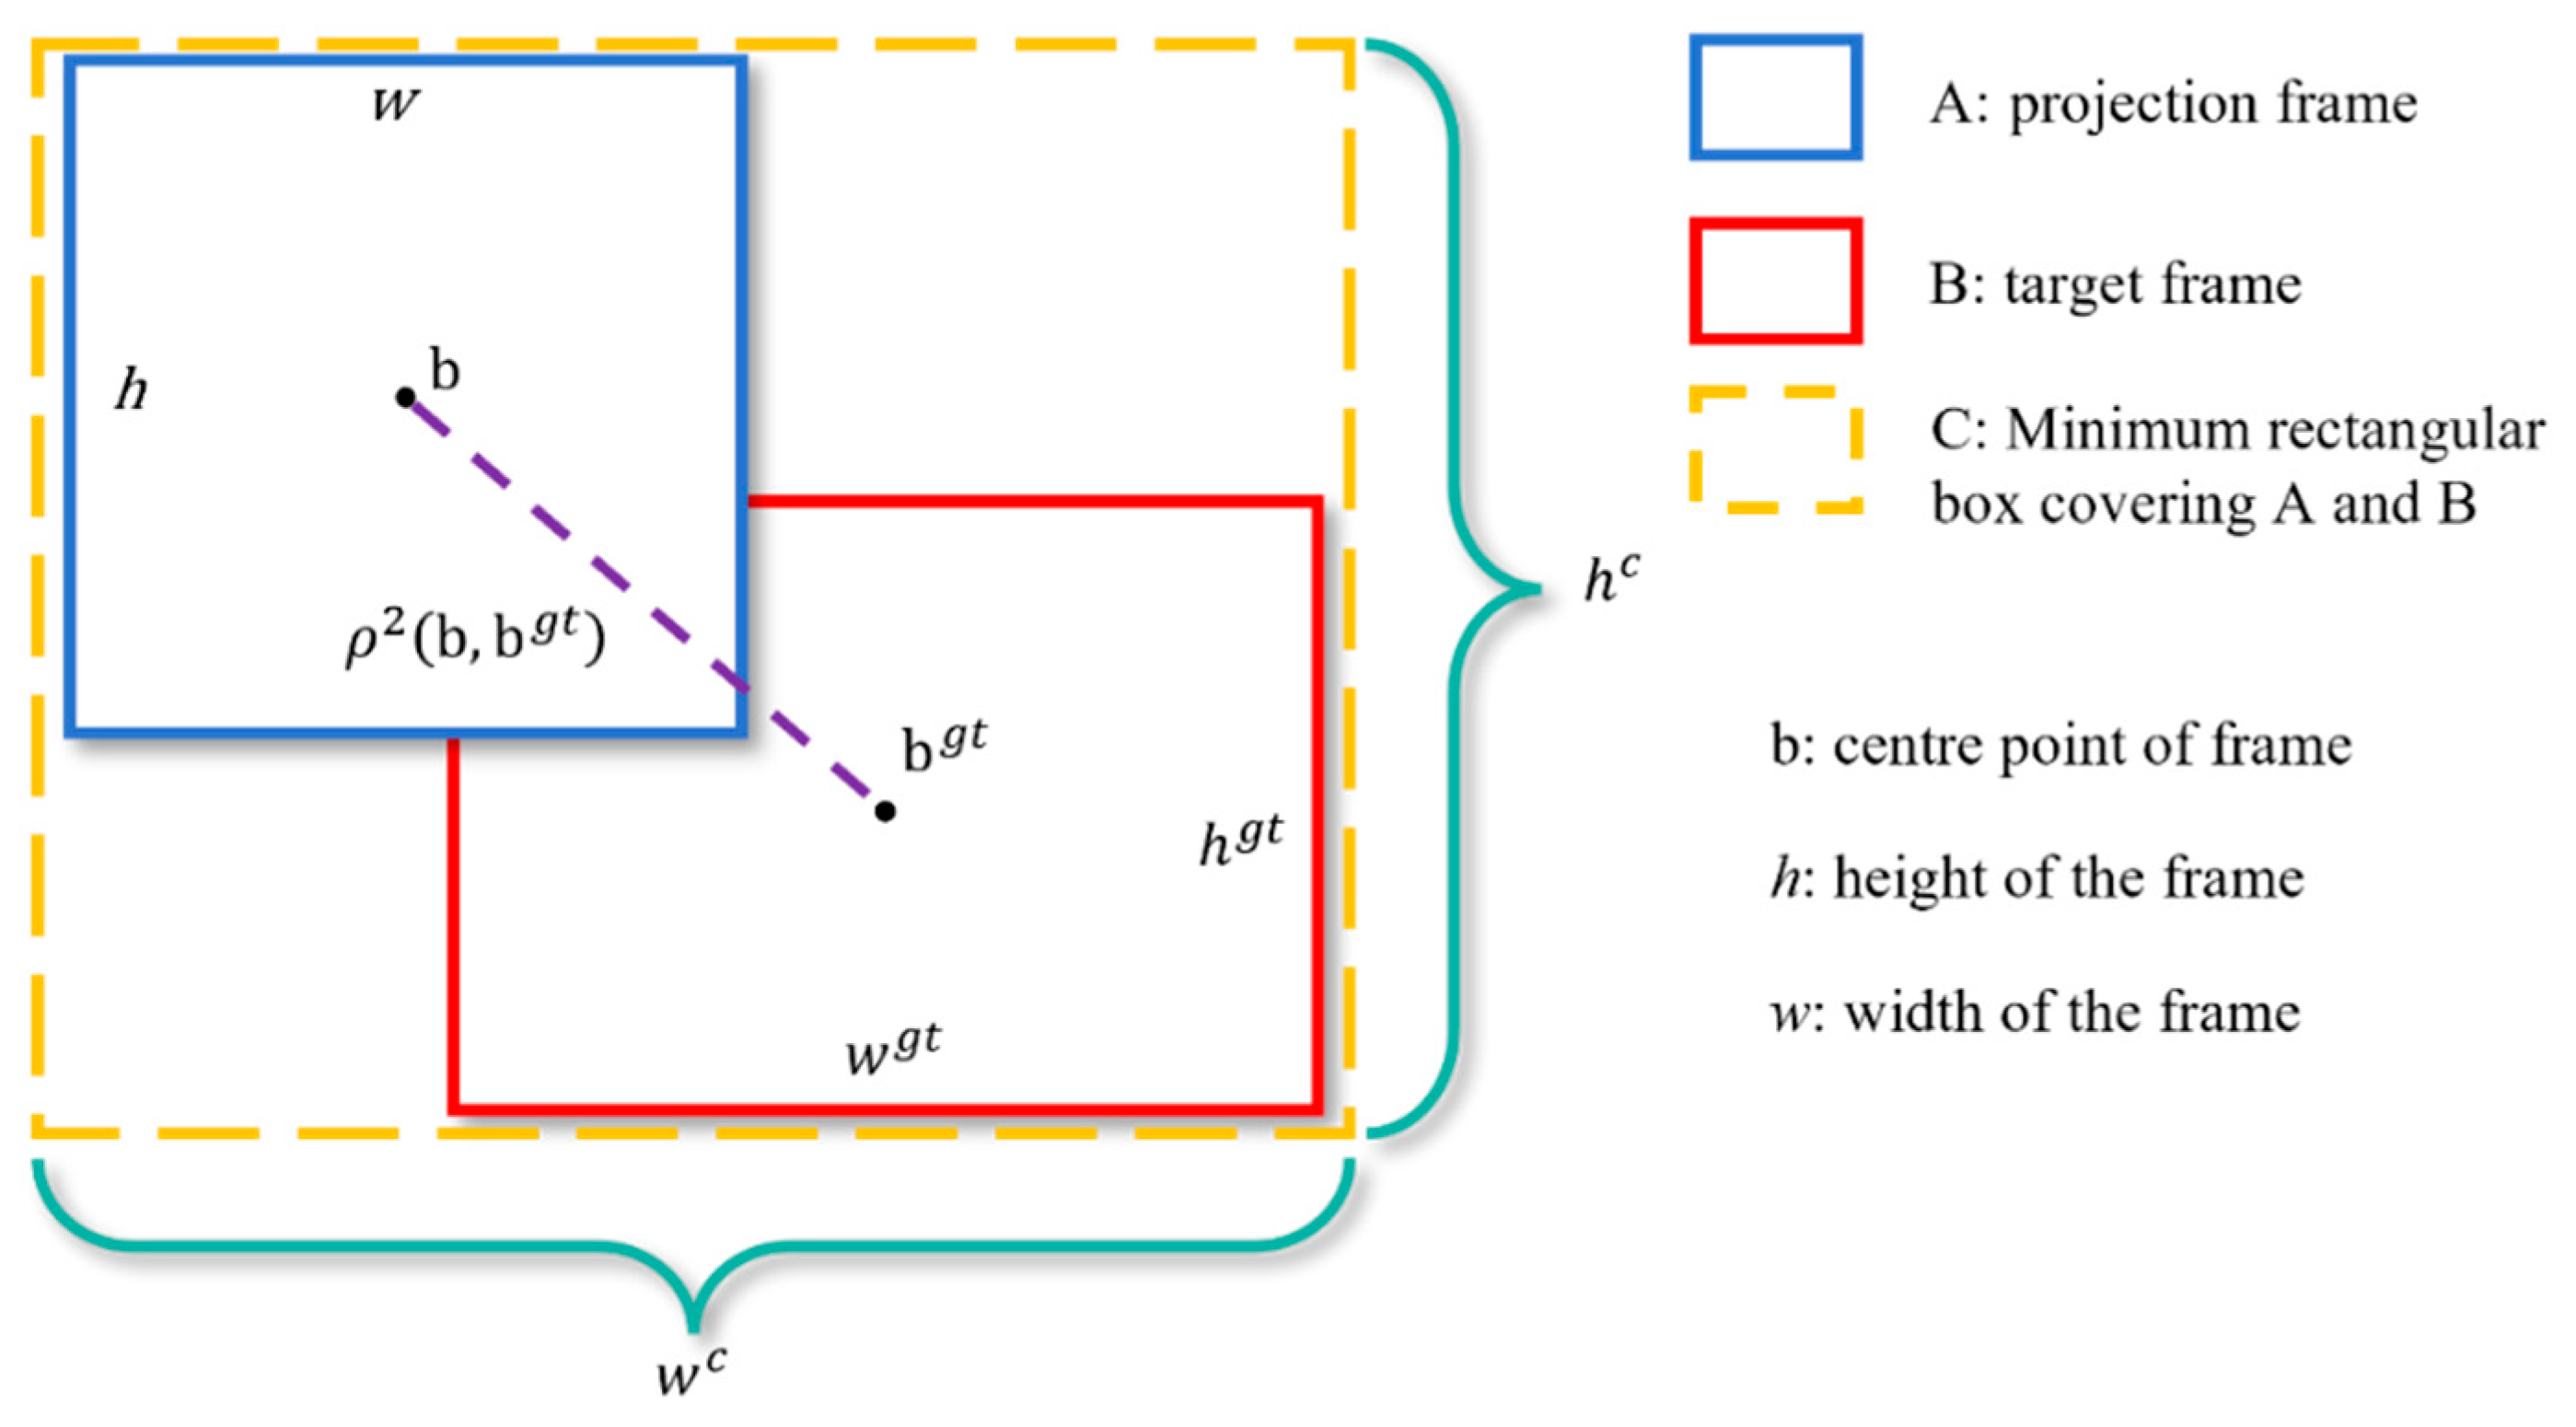
2.5. Adopted Loss Function

The loss function of YOLOv8s consists of two parts: classification loss (Losscla) and regression loss (Lossbox), which can be expressed as:
L o s s = L o s s c l a + L o s s b o x
where the classification loss uses Binary Cross Entropy (BCE), the role of this loss is to determine whether the detection target is classified as such, and based on this output, network confidence results.
The regression loss is caused by the difference in coordinates and dimensions between the predictor box and the object box, and the degree of regression can be measured by the ratio of the predictor box to the object box in regression-type tasks. Intersection over Union (IoU) is a way to describe the degree of overlap between the predictor box and the object box, which can be expressed as:
I O U = | A B | | A B |
where A denotes the prediction box; B denotes the object box. IoU measures the degree of overlap of the two boxes by calculating the ratio of the intersection and concatenation of the areas of the two boxes A and B. Since this method cannot reflect the coordinate relationship between the two boxes, YOLOv8s adopts complete-IoU (CIoU) as the regression loss function. CIoU improves the regression accuracy by simultaneously considering three factors: overlap area, centroid distance, and aspect ratio of the box. The calculation of CIoU is shown in Figure 8, and it can be expressed as follows:
L C I o U = 1 I o U + ρ 2 b , b g t c 2 + α v
c 2 = ( w c ) 2 + ( h c ) 2
α = v 1 I o U + v 2
v = 4 π 2 ( a r c t a n w g t h g t a r c t a n w h )
Since CIoU optimizes the relative aspect ratio of the box width and height, and based on the definition of parameter v in Equation (6), the gradient of v with respect to width w and height h has opposite signs. When the predicted box’s width and height maintain a proportional relationship with the target box’s dimensions, the penalty factor for optimizing the relative aspect ratio in CIoU becomes ineffective, significantly affecting the convergence speed. To address this problem, EIoU [51] proposes a loss function that directly penalizes the actual dimensions of the predicted box widths and heights, and the EIoU calculation is shown in Figure 8, which can be expressed as follows:
L E I o U = 1 I o U + ρ 2 b , b g t c 2 + ρ 2 w , w g t ( w c ) 2 + ρ 2 h , h g t ( h c ) 2
Introducing the Focal L1 loss to address the category imbalance between high- and low-quality samples in the regression task results in Focal-EIoU, denoted as:
L F o c a l E I o U = I o U γ L E I o U
where γ is used to control the curve radian, after the original text and many tests to take 0.5.
Since YOLOv8s uses Anchor-Free prediction, Distribution Focal Loss (DFL) is added to the regression loss to match this prediction method, and the final loss function of YOLOv8s can be expressed as the sum of the three losses:
L o s s = L o s s c l a B C E + L o s s b o x F o c a l E I o U + L o s s b o x D F L

2.6. Evaluation Indicators

In this study, the performance of the proposed network is evaluated using the evaluation metrics of the object detection task, including Precision (P), Recall (R), F1 index, mean category average precision (mAP), and detection speed FPS, which are calculated as follows:
P = T P T P + F P
R = T P T P + F N
F 1 = 2 × P × R P + R
A P = 0 1 P ( R ) d R
m A P = q = 1 Q A P ( q ) Q
In Equations (10) and (11), TP is the number of correctly detected samples, FP is the number of incorrectly detected non-defective samples, and FN is the number of defective samples that were not detected. In Equation (12), F1 is the harmonic mean of precision and recall. The Average Precision (AP) is the area enclosed by the P and R curves and their axes. In Equation (14), Q represents the category, and mAP is the mean value of the AP for different categories. In this study, the evaluation metrics are mAP0.5 and mAP0.5:0.95. mAP0.5 is obtained when the IoU is set to 0.5, while mAP0.5:0.95 is the average of 10 mAP values calculated by incrementally increasing the IoU from 0.5 to 0.95 in steps of 0.05.

3. Experiments and Results

3.1. Data Collection and Preprocessing

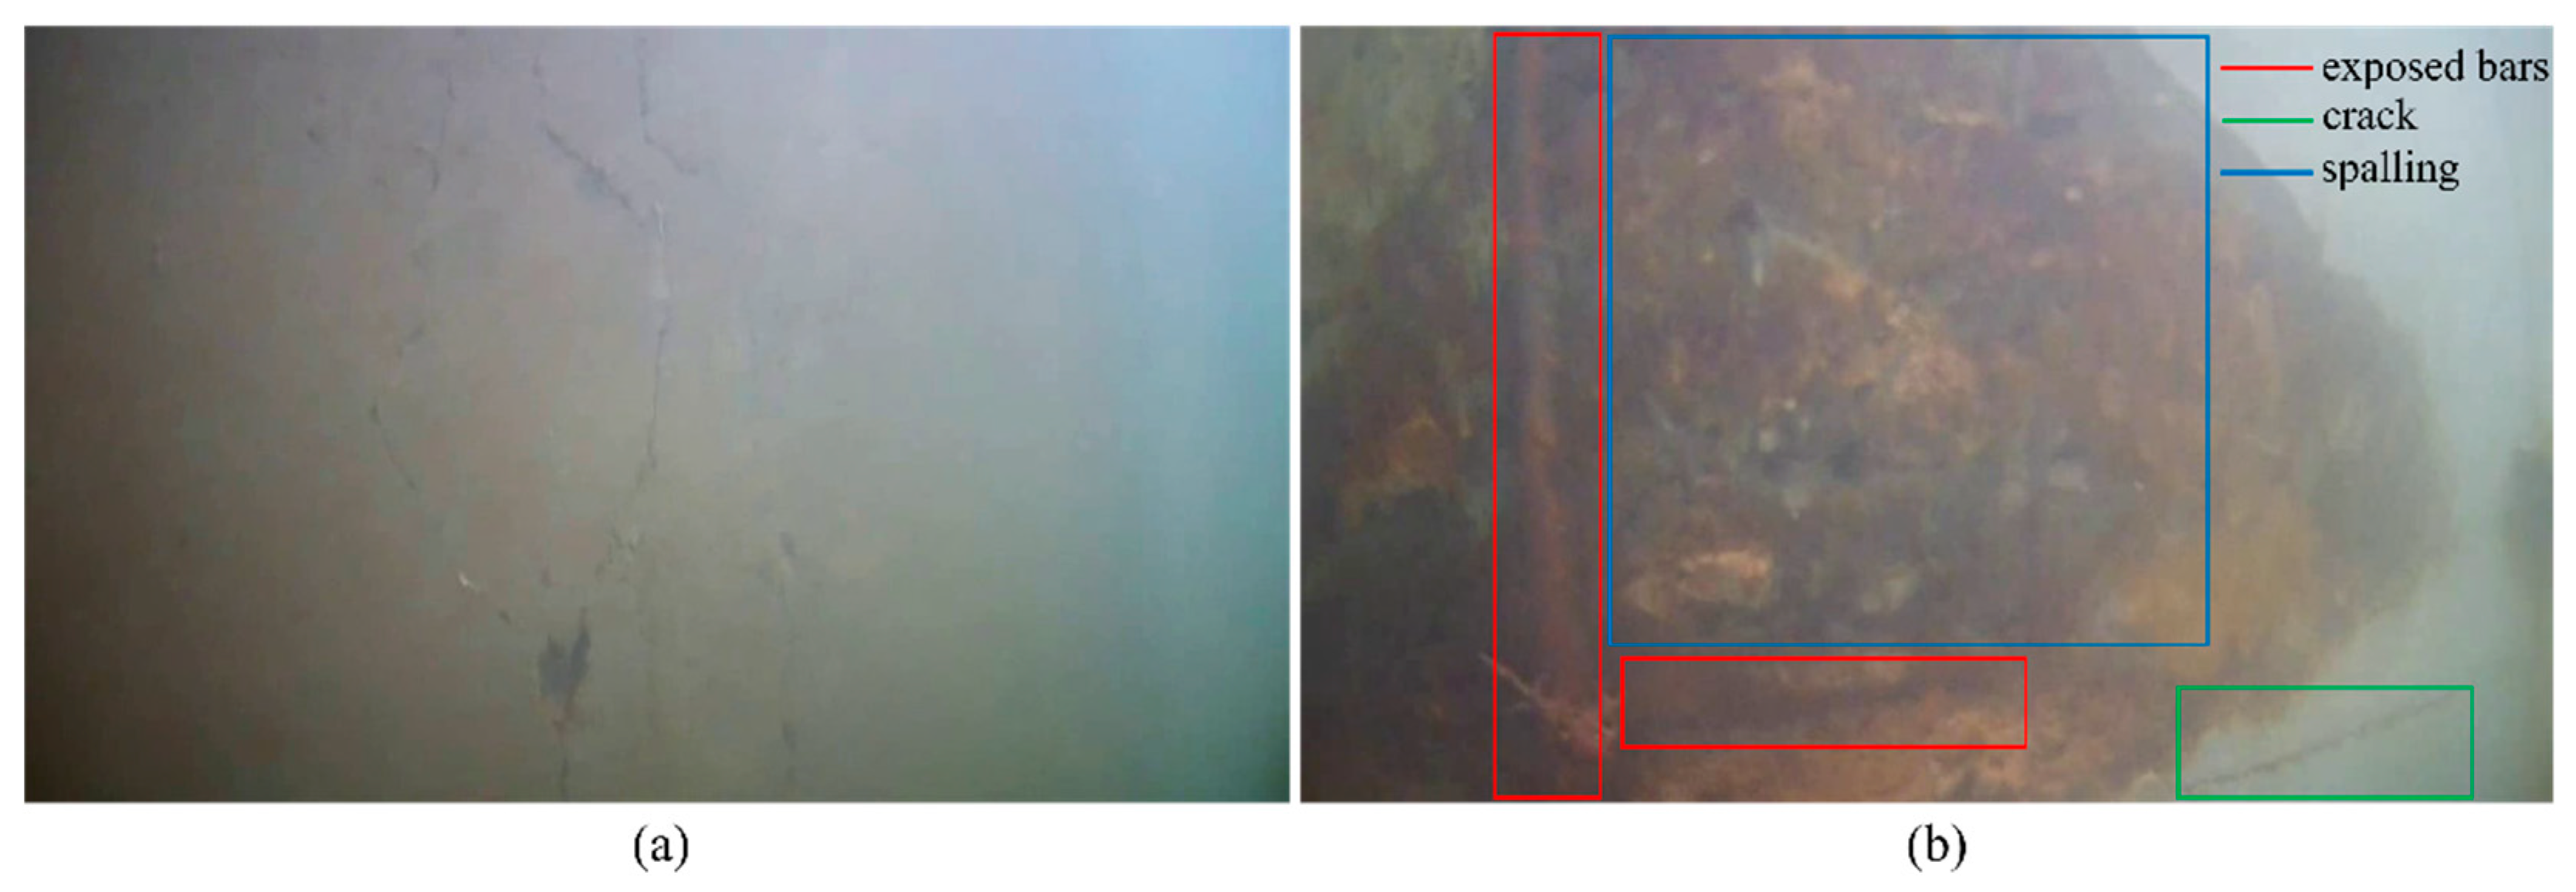
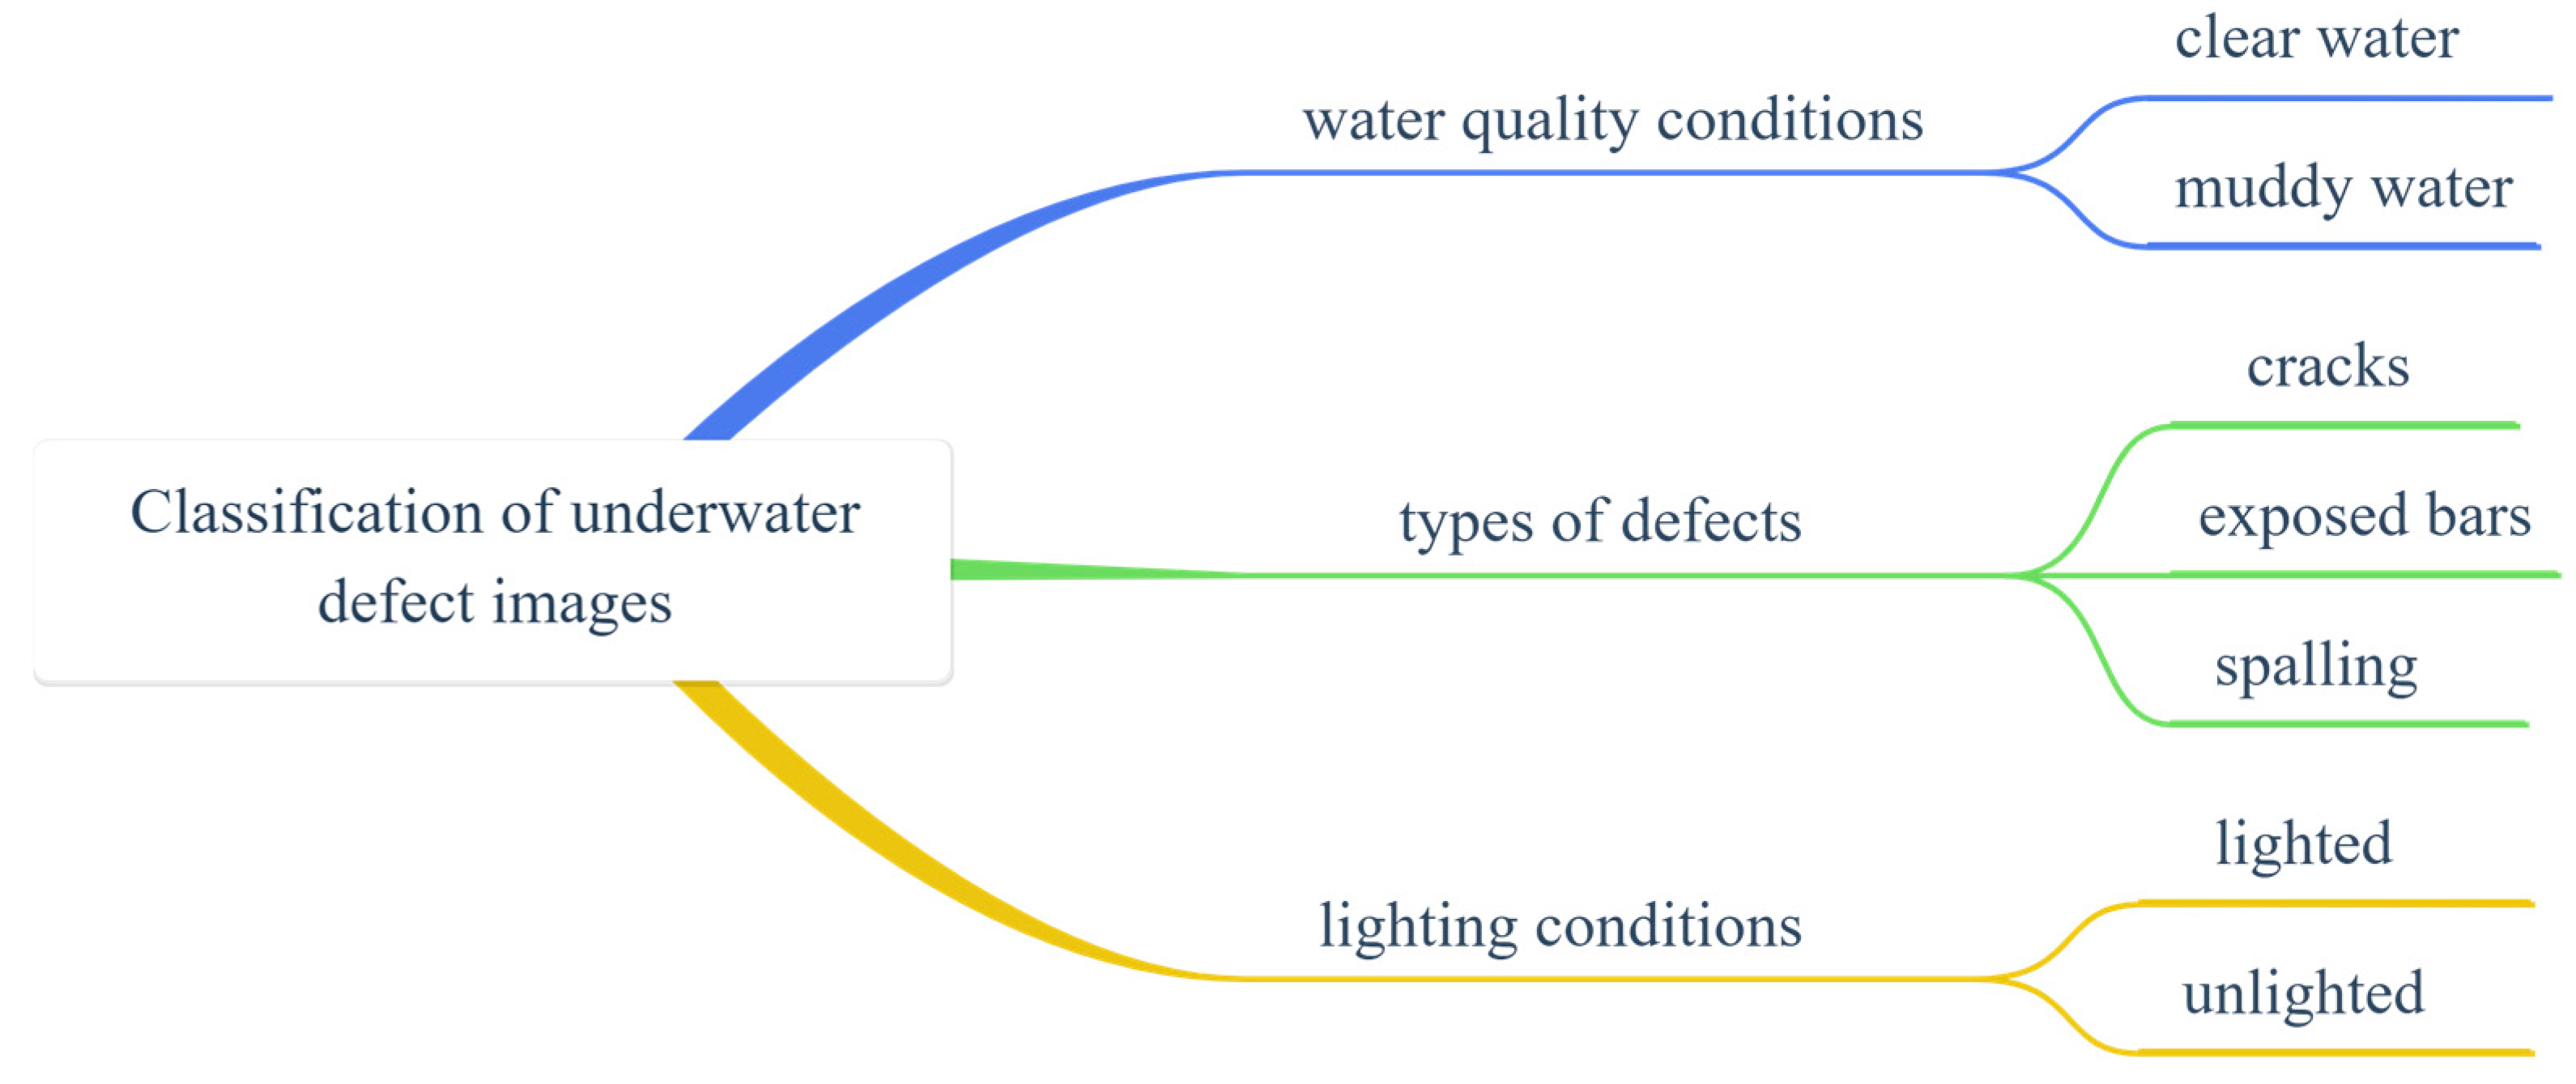
3.1.1. Classification of Underwater Defective Samples

Light and transparency are two factors that must be considered when acquiring optical images in a body of water. In underwater research, the light conditions directly affect the observing equipment and its use, and as the water depth increases, supplementary light sources must be added to the equipment to ensure underwater visibility. In addition, the transparency is affected by factors such as water quality, suspended particulate matter, organic matter, and algae, and a decrease in transparency may result in a blurred image. To establish a diversified underwater defect dataset, as shown in Figure 9, we considered the collection of data samples from various perspectives, such as defect types, water quality conditions and lighting conditions.

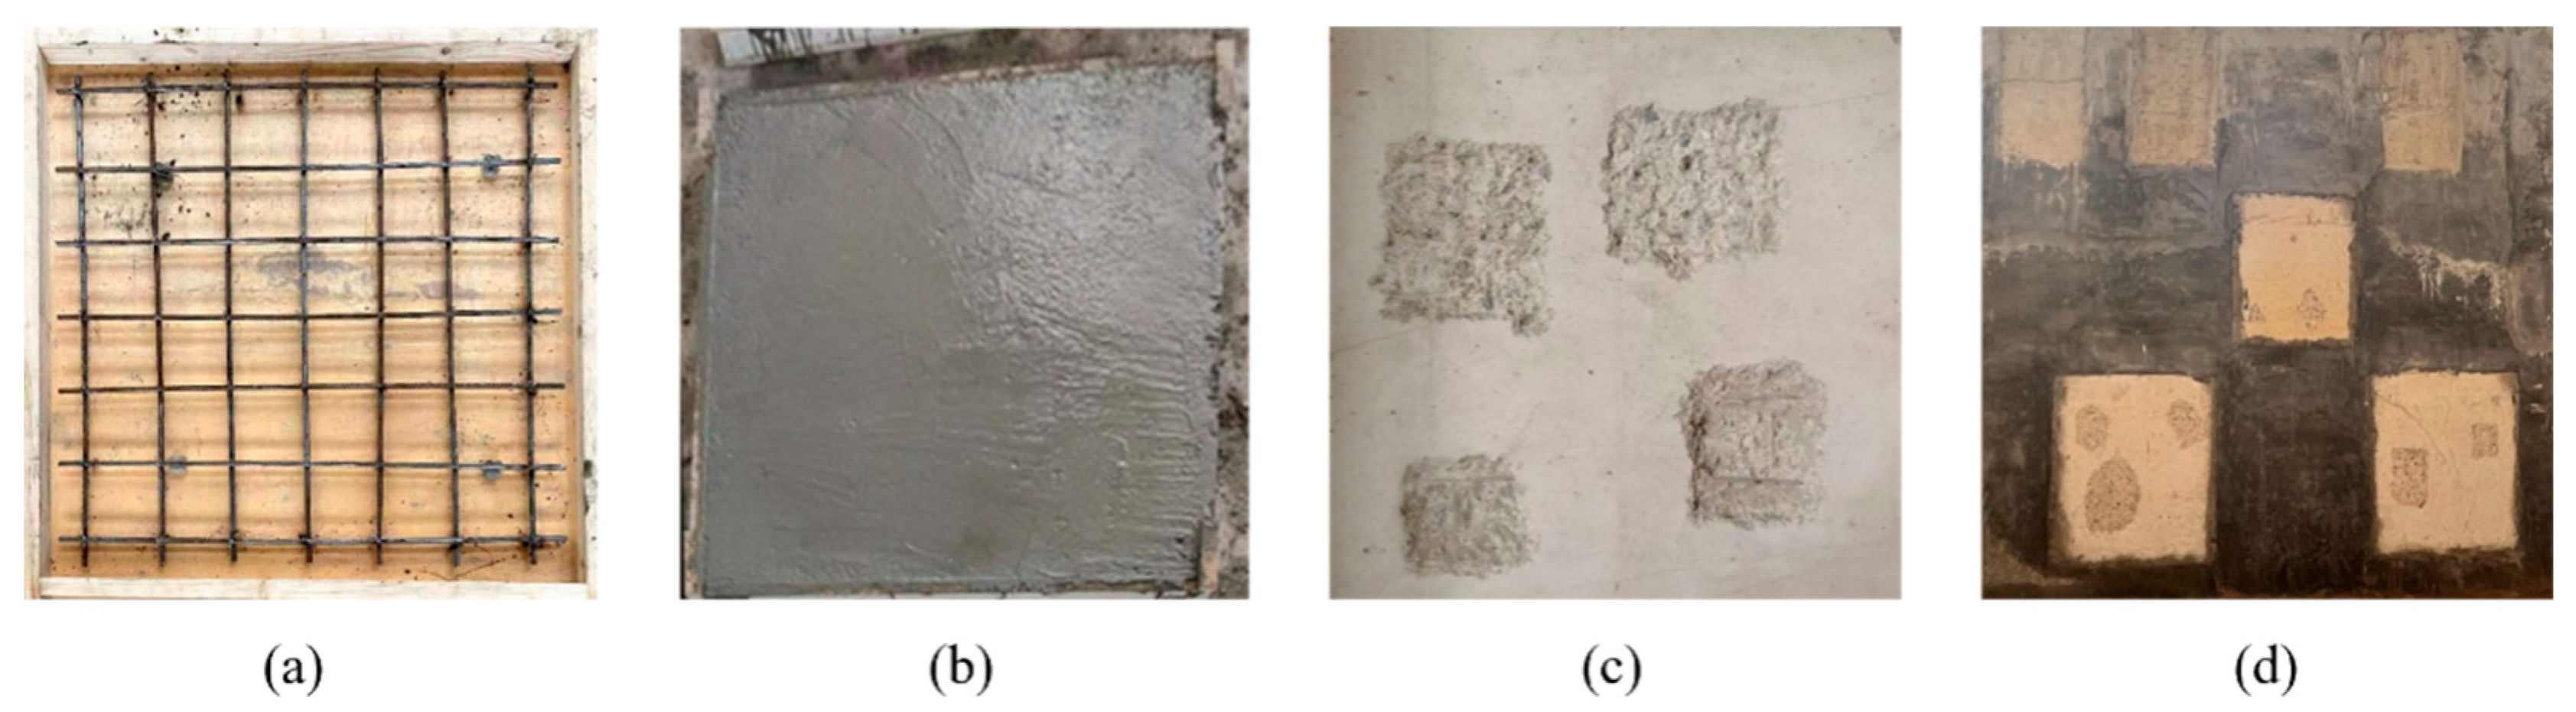
3.1.2. Construction with Defective Concrete Wall

Due to the scarcity of available images of underwater concrete defects, a defective concrete wall was constructed using manually fabricated underwater concrete defect specimens for data collection. As shown in Figure 10a–d, the dimensions of the specimens were first pre-designed and the corresponding specimen molds were customized. Then, the pre-proportioned concrete was poured uniformly into the molds. Next, the concrete specimens were properly cured, and after the curing was completed, defects were manually created on the surface of the specimens to simulate the damage in the real environment. Finally, defect images were collected from the concrete defect wall.

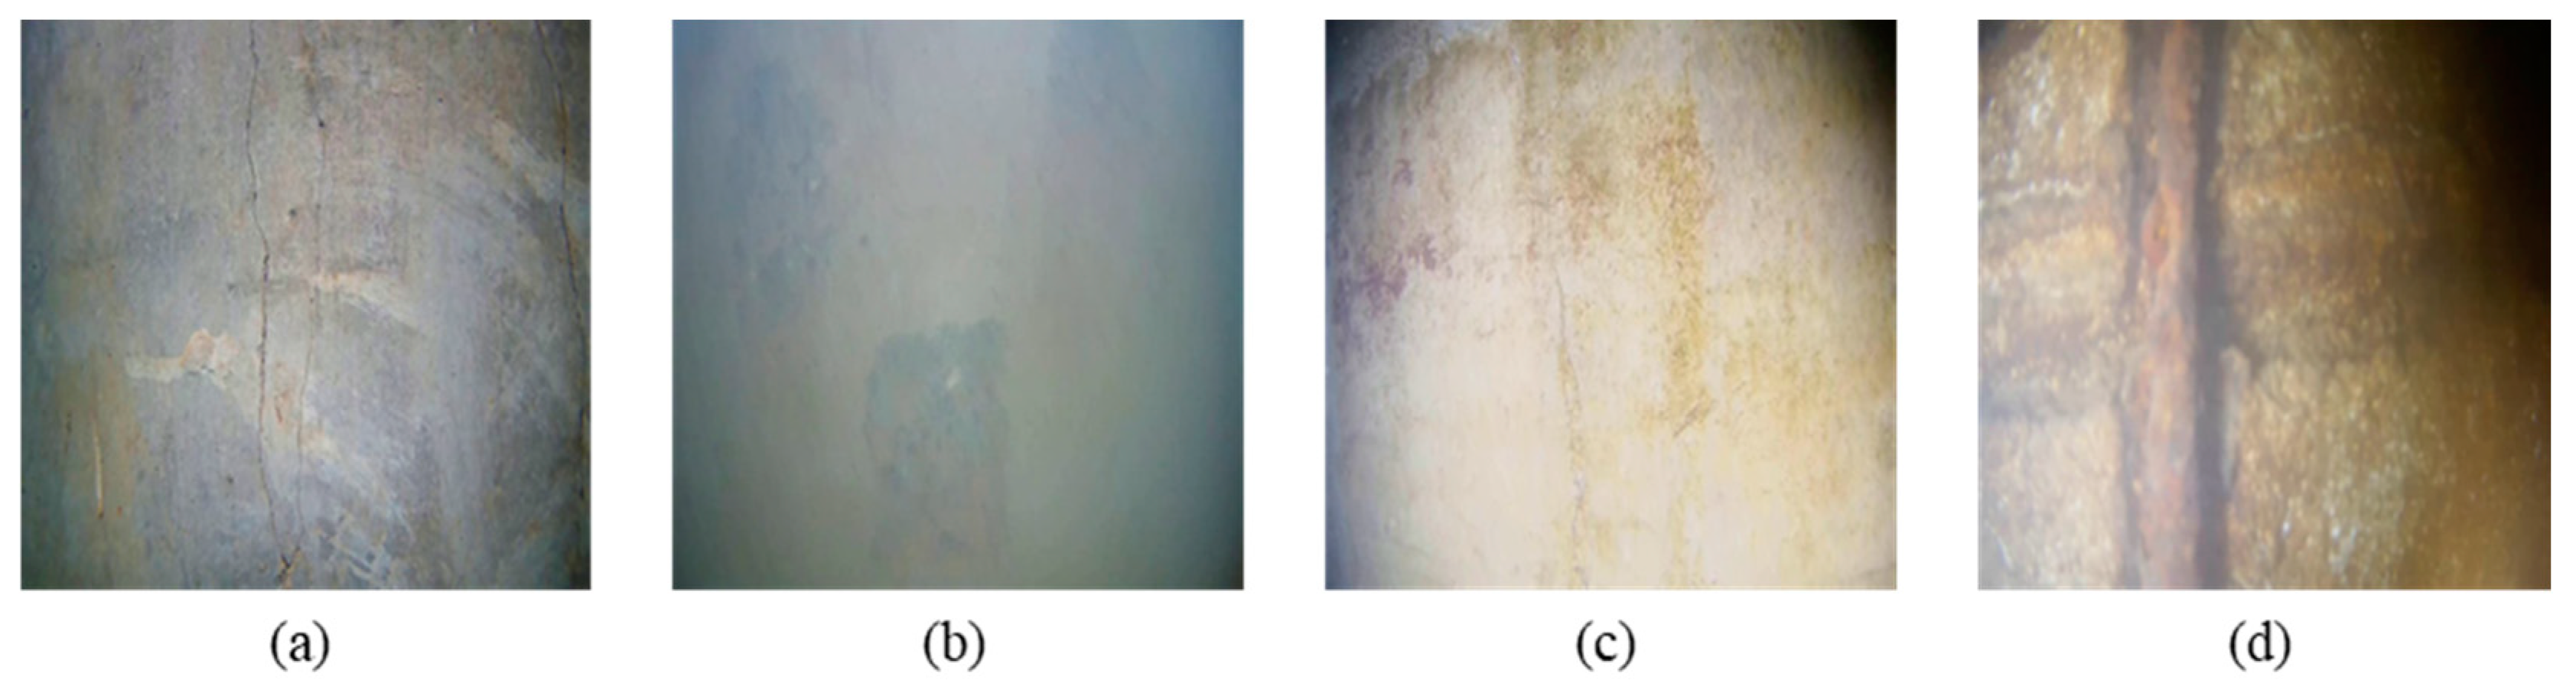
3.1.3. Image Acquisition of Underwater Defects

The ROV was equipped with an underwater camera for underwater defect image acquisition, and the light and water quality conditions were taken as variables, as shown in Figure 11a–d, considering four types of scenes, namely, clear water without light, clear water with light, muddy water without light, and muddy water with light, and acquiring the three types of underwater defects in different scenes to ensure the diversity of the acquired data. During the actual shooting process, optimizing the underwater shooting distance for different scenarios was essential to collect high-quality defect images. This adjustment enhanced the imaging effect, ensuring both the clarity of the images and the completeness of the information captured.
Additionally, due to limitations in the experimental site and the defects in the specimens, this data collection only included three common types of concrete defects: cracks, spalling, and exposed reinforcement. Furthermore, the actual underwater environment of a dam is more complex than the experimental setup: for example, the presence of underwater vegetation obstructing visibility can make it impossible to fully represent the various underwater dam defect situations in this collection.

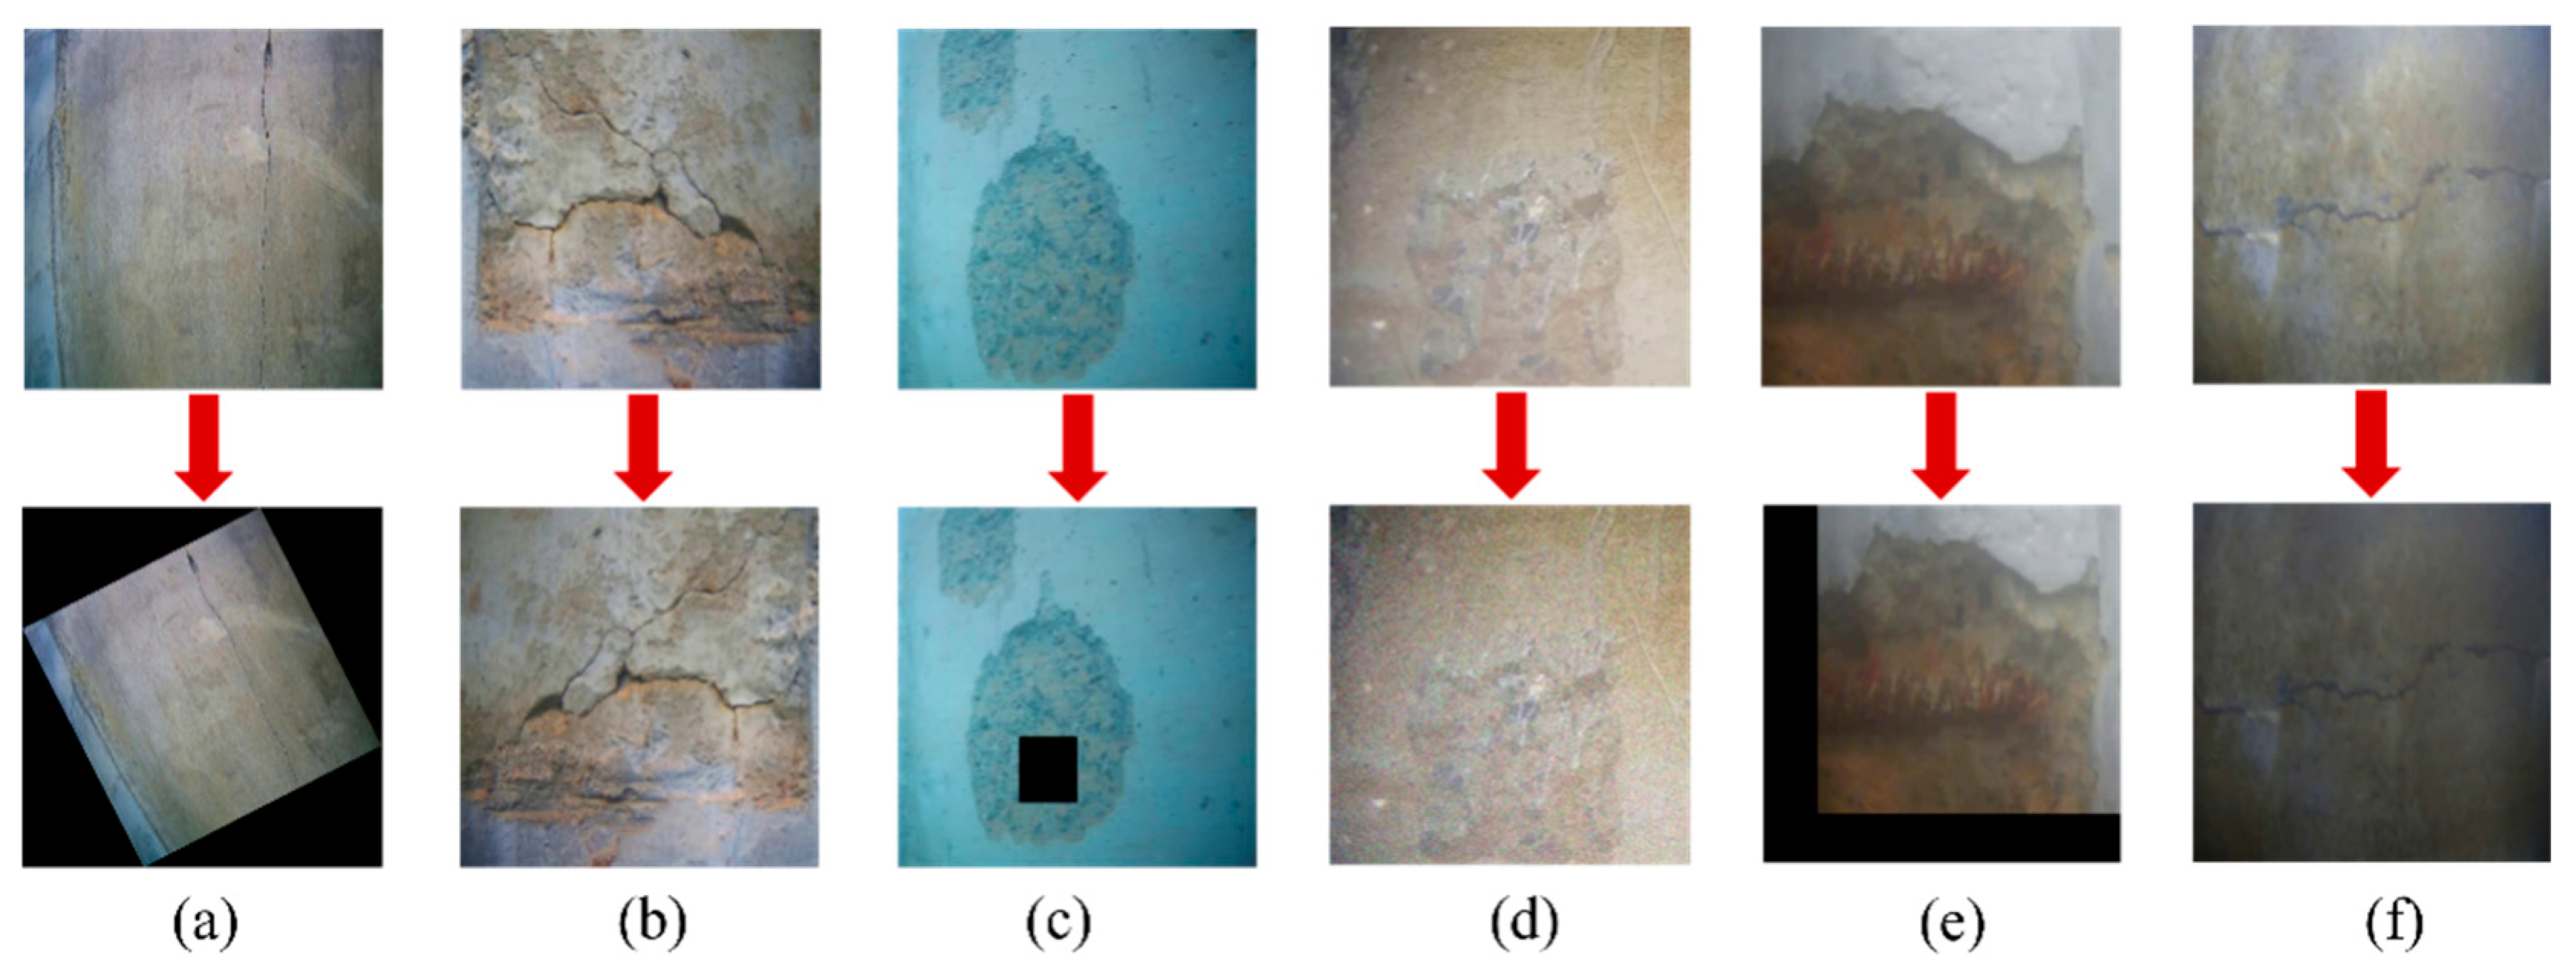
3.1.4. Data Processing

After performing underwater defect image acquisition, the acquired images were processed using various data enhancement methods to further expand the training data and improve the performance of the detection network. Data enhancement helped to maximize the use of limited data resources and make them more valuable. The specific effect of each type of data enhancement is shown in Figure 12. By performing data enhancement on the image data, more data samples were generated, the size of the dataset was expanded, and the overdependence of the model on the training data was reduced, which was very helpful in avoiding overfitting and improving the generalization ability of the model during training. At the same time, the expanded new images introduced randomness or variability, and the model needed to adapt to a variety of different data variations, making the model robust.
The defective regions of the underwater defective images were labeled using labelImg v1.8.1 visual annotation software to obtain data labels of the image defect information for learning by the object detection network. The labeled underwater defective image data were aggregated as the network training dataset, and some images with fuzzy features and poor quality were removed. A total of 2800 underwater defect images were obtained, of which 1600 were crack images, 600 were spalling images, and 600 were exposed bar images.

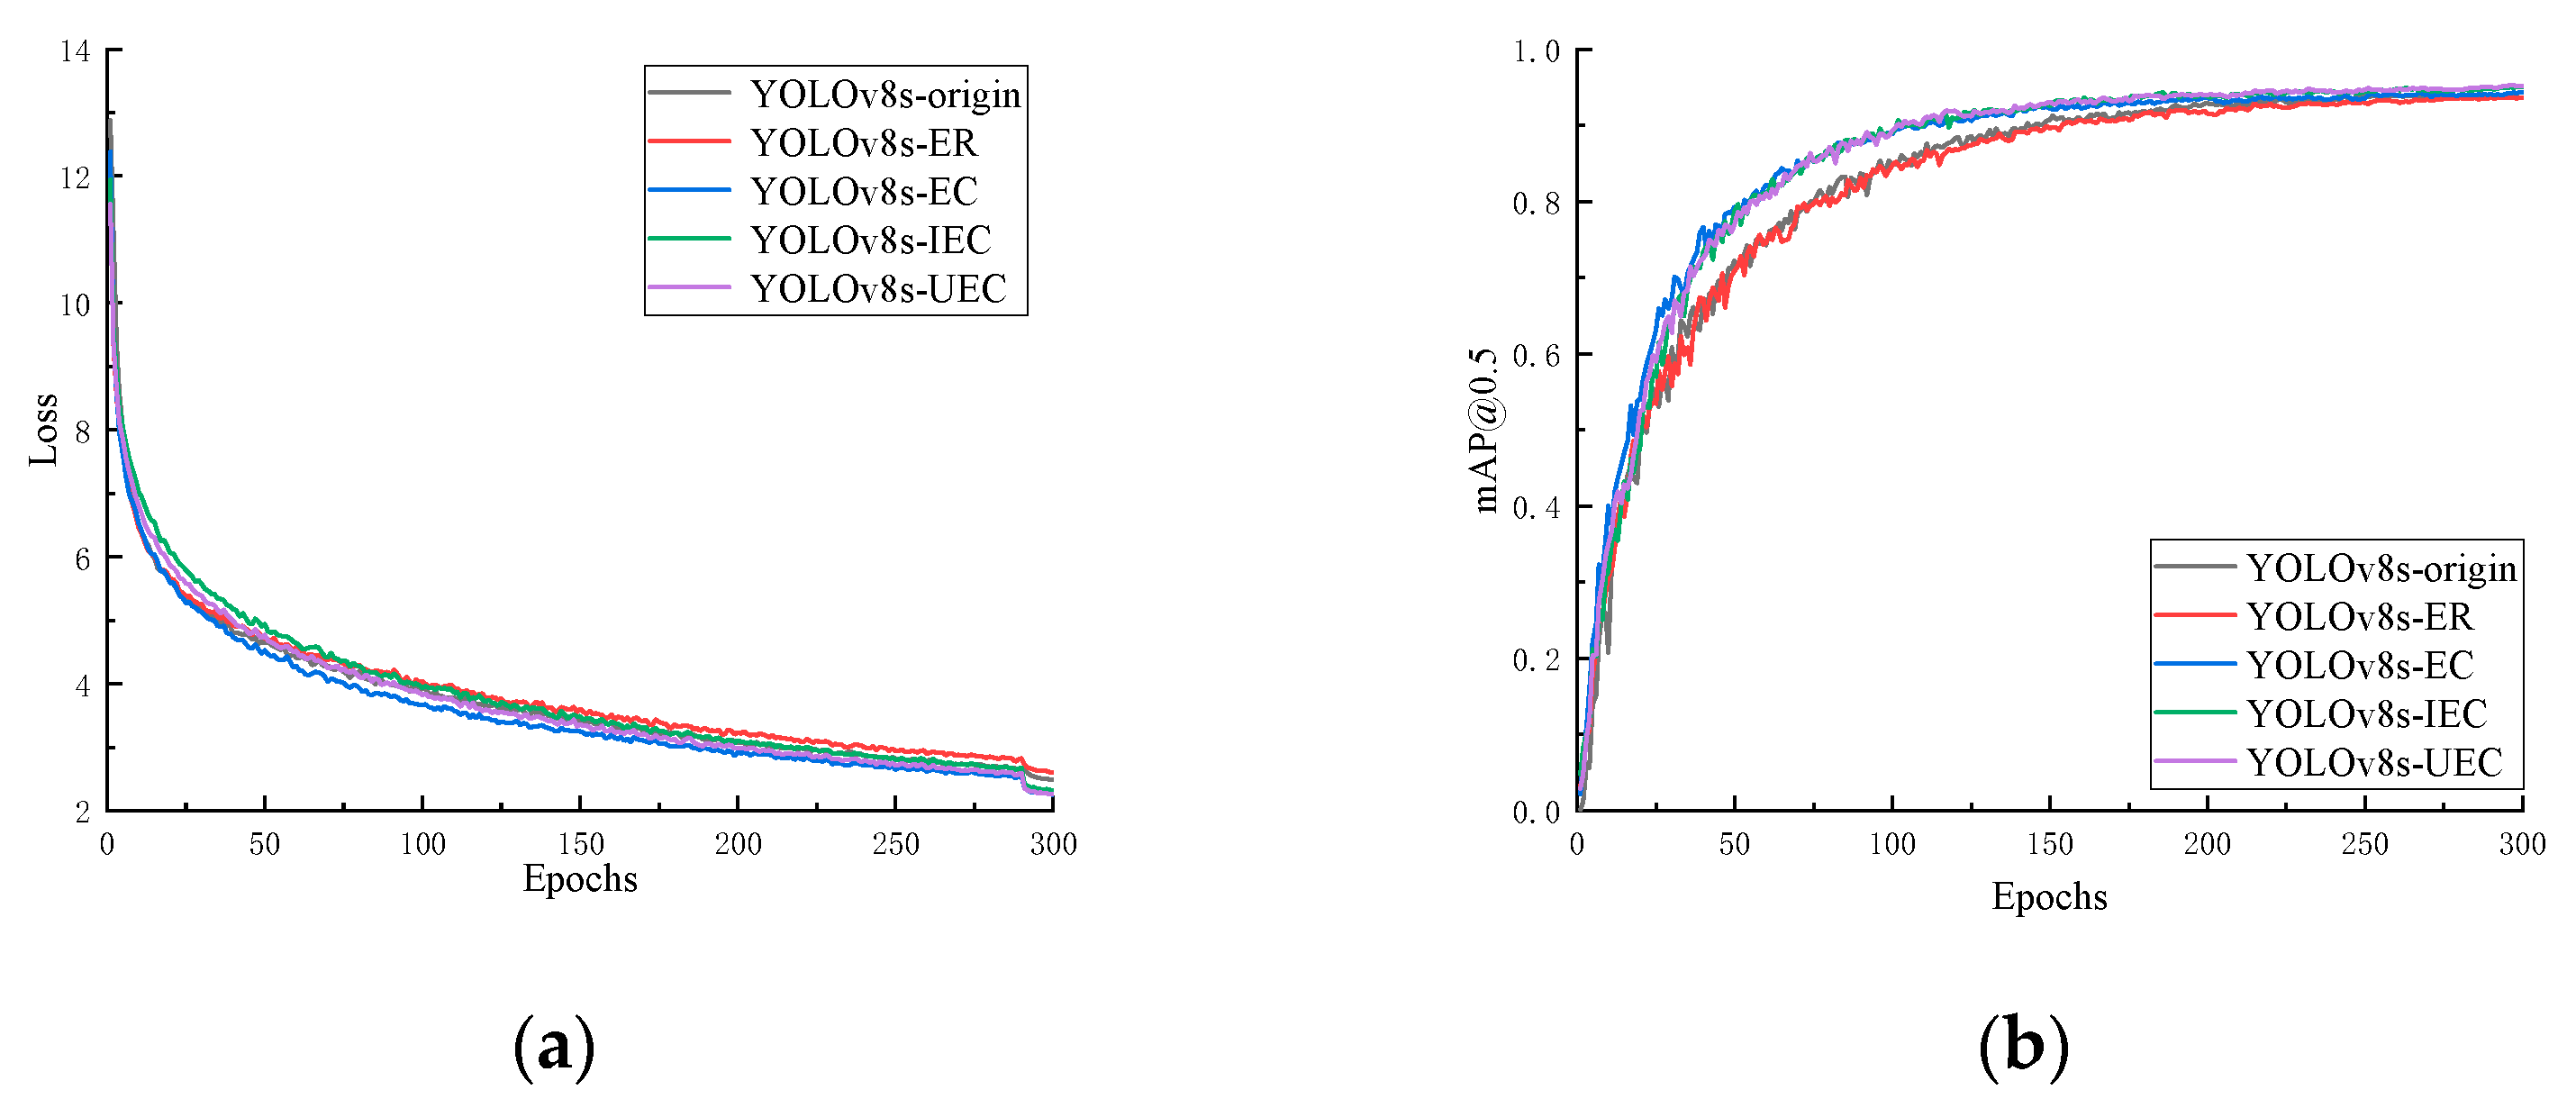
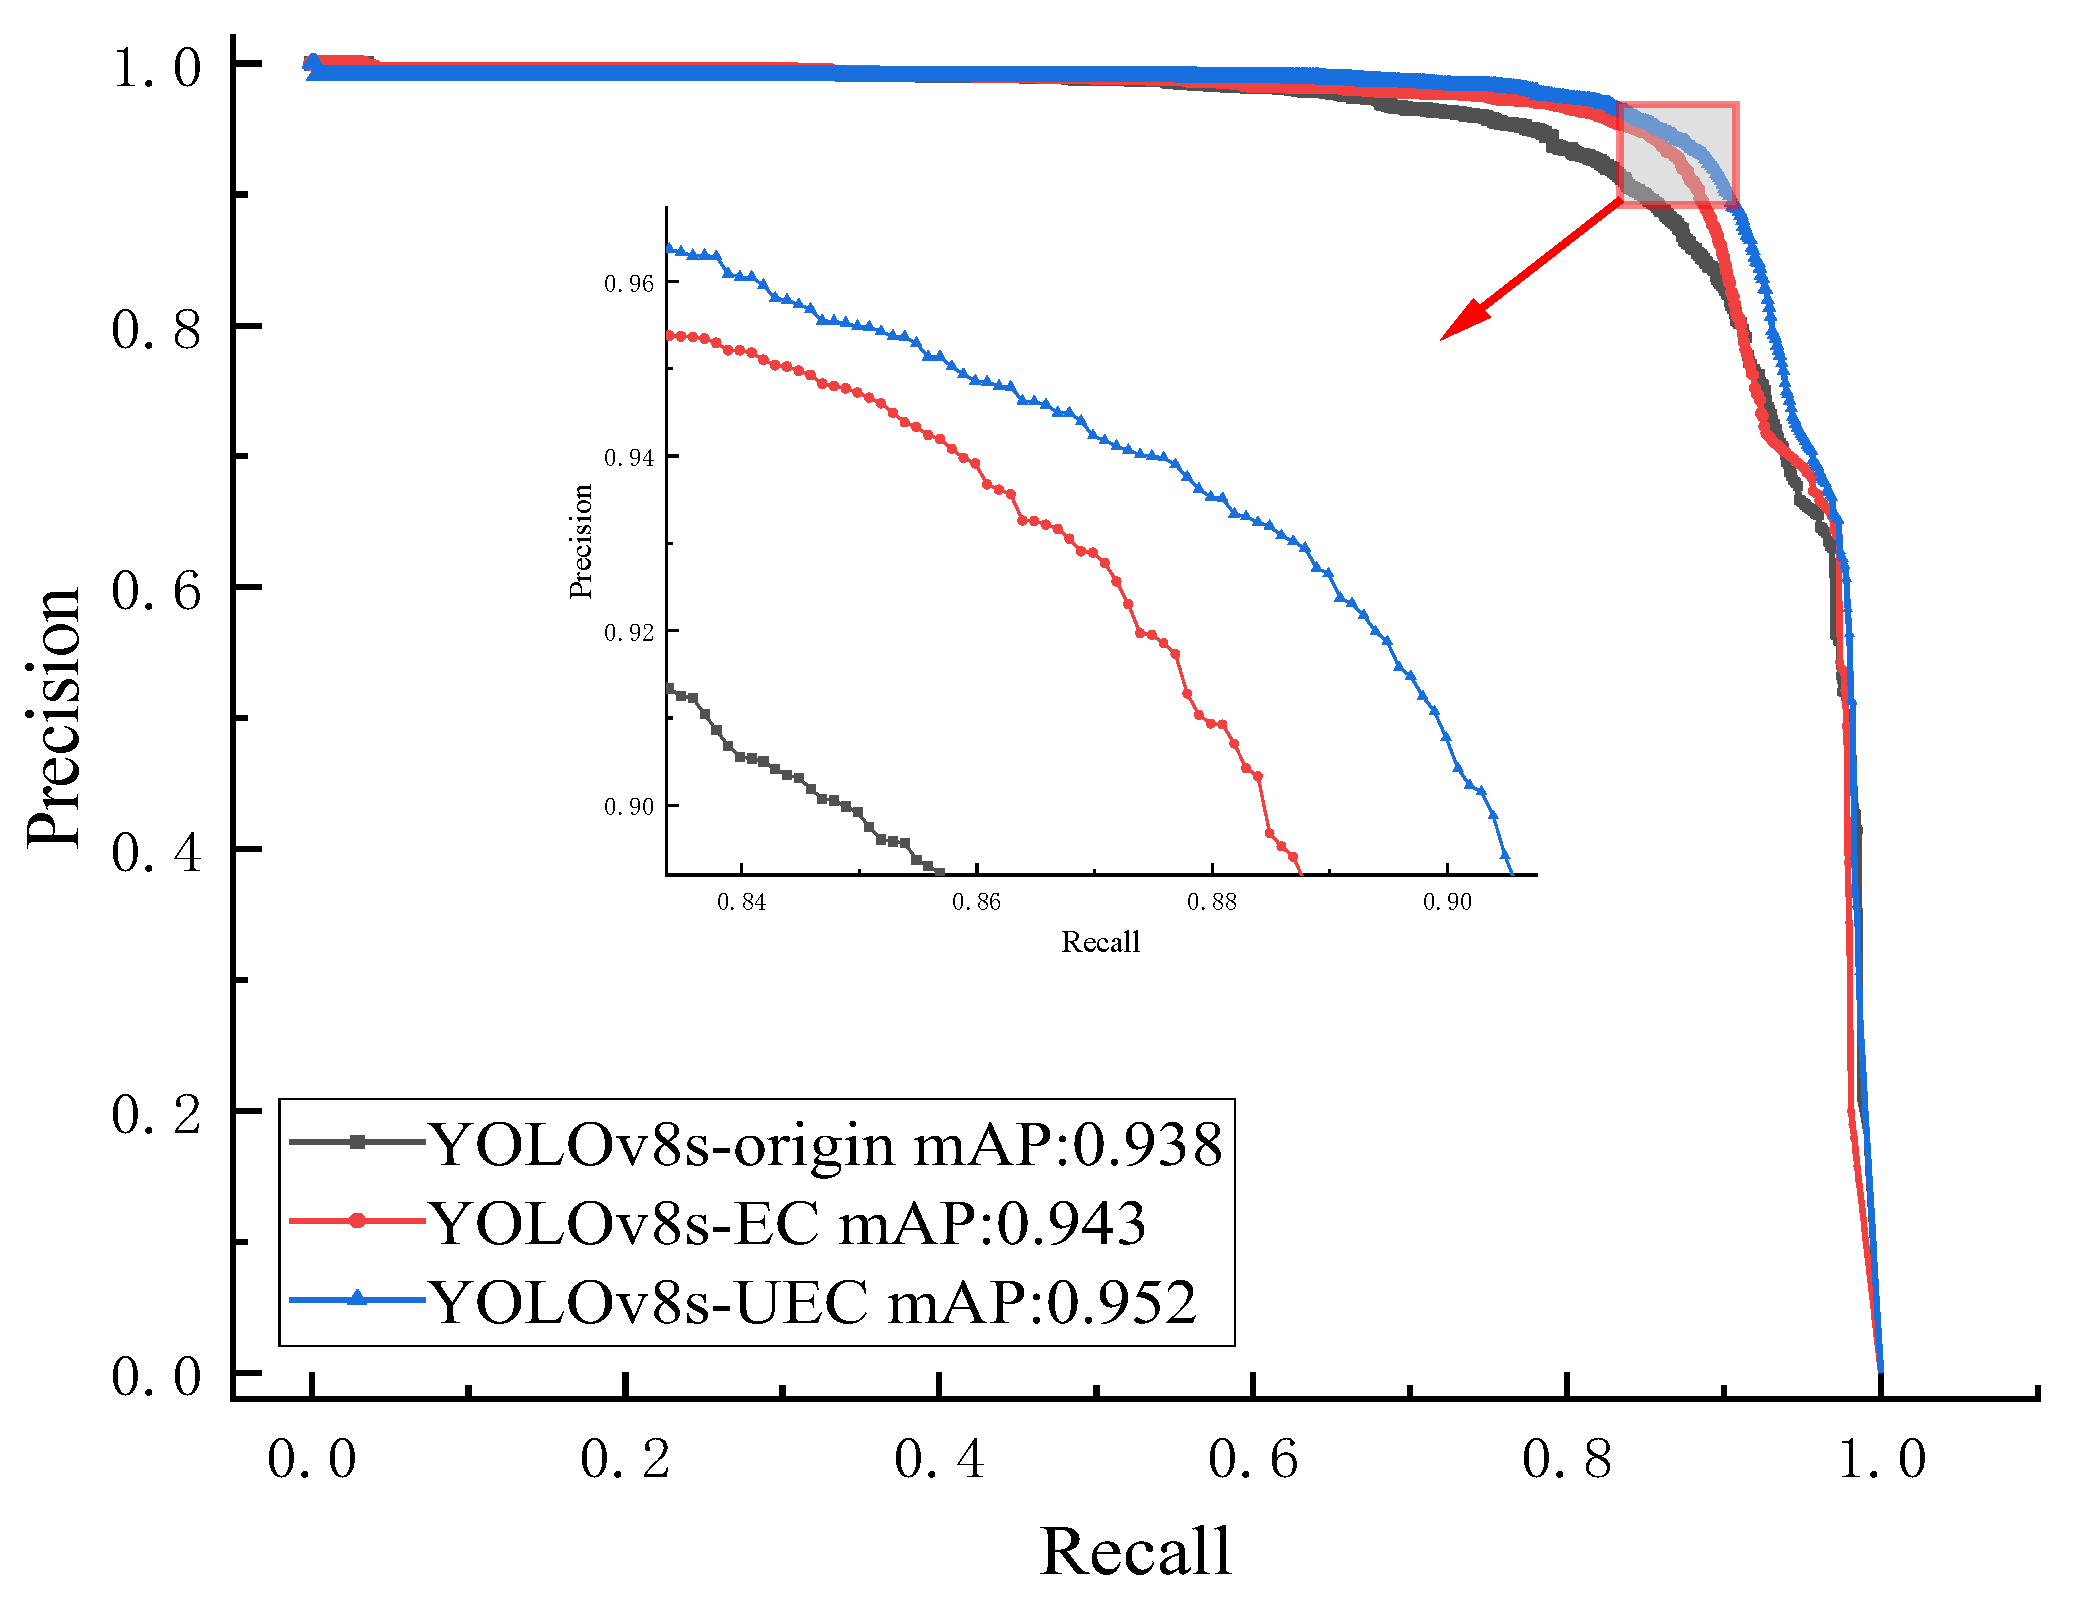
3.2. Network Ablation Study

To ensure that the proposed underwater defect detection network YOLOv8s-UEC had the best performance, an ablation study was carried out using multiple networks containing different improvements and comparing their results to further explore the contribution of each improvement module to the network, and the way of combining the modules is shown in Table 1.
The study was conducted on a workstation equipped with an Intel Core i7-12700F processor manufactured by Intel Corporation (Silicon Valley, Santa Clara, CA, USA), and an NVIDIA 3080 graphics card manufactured by NVIDIA Corporation (Silicon Valley, Santa Clara, CA, USA), with 42 GB of GPU memory. The algorithm ran under training conditions of CUDA 12.2, Python 3.9, and PyTorch 1.12.
To ensure the objectivity of the experimental results, all training parameters for the networks were kept consistent. The batch size was set to 4 based on the GPU memory size. Various training epochs were tested, and when set to 300, the model converged without overfitting. Additionally, mosaic augmentation was disabled in the final 10 epochs, and the initial learning rate was set to 0.01. The training results for five networks are shown in Figure 13, which shows that the training loss tended to converge after slowly decreasing, and after turning off Mosaic enhancement, the loss further decreased to stabilize, before the accuracy gradually increased and finally reached the peak value. The statistical evaluation results of different networks on the test set are summarized in Table 2.
According to Table 2, it can be seen that the detection performance rose with the continuous improvement of the network. By introducing the Efficient-RepGFPN structure, mAP0.5 was improved by 0.3%, while mAP0.5:0.95 was improved by 1.9%; by introducing the ConvNeXt Block module, mAP0.5 was improved by 0.5% while mAP0.5:0.95 was improved by 5.0%; by fusing the P2 detection layer, mAP0.5 was improved by 1.3% while mAP0.5:0.95 was improved by 5.4%, and a certain loss of detection speed was compensated for by using the Focal-EIoU loss while ensuring accuracy. Finally, the proposed YOLOv8s-UEC achieved the highest F1, mAP0.5, and mAP0.5:0.95 values, improving by 2.15%, 1.4%, and 5.8%, respectively, compared to the original network. The network detection speed reached 107 FPS, supporting the need for online detection after model export for deployment on mobile devices. Moreover, the detection performance of different networks for different categories of defects was improved, and the mAP0.5 indexes of each category test are collated in Table 3. According to the data results, the proposed YOLOv8s-UEC network effectively improved the detection accuracy of various types of defects compared with the original network. Adopting the Efficient-RepGFPN structure that integrates the P2 detection layer effectively improved the feature extraction capability of the network, and it had a better capability to deal with the problem of the huge difference in the proportion of pixels occupied by the underwater defects in the image, as well as the blurring of the boundaries between the defects and the background, which proves that the proposed YOLOv8s-UEC network can deal with the task of detecting the underwater defects and has a good performance.
The mAP was calculated based on the area enclosed by the precision–recall curve and the axes, representing the performance of the network. The precision–recall curve displays recall on the x-axis and precision on the y-axis. A larger area enclosed by the curve and the axes indicates better model performance. The precision–recall curves for the three models, YOLOv8s, YOLOv8s-EC, and YOLOv8s-UEC, are shown in Figure 14. The black curve represents YOLOv8s, the red curve represents YOLOv8s-EC, and the blue curve represents YOLOv8s-UEC. Observing the three curves, the area under the blue curve is the largest, followed by the red curve, and the black curve has the smallest area. Clearly, as the model is continuously improved, the area under the curve increases, providing an intuitive representation of the enhanced network performance.
To further verify the performance of YOLOv8s-UEC, we trained other advanced networks, such as Faster R-CNN, YOLOX-s, YOLOv5s, and YOLOv8s, using the established underwater defect dataset. Each experimental group was trained until convergence to ensure optimal results, as shown in Table 4. The detection accuracy of YOLOv8s-UEC improved by 4.9%, 1.6%, 1.0%, and 1.4% compared to Faster R-CNN, YOLOX-s, YOLOv5s, and YOLOv8s. This detection capability met the requirements for efficiency and precision, demonstrating higher application value.

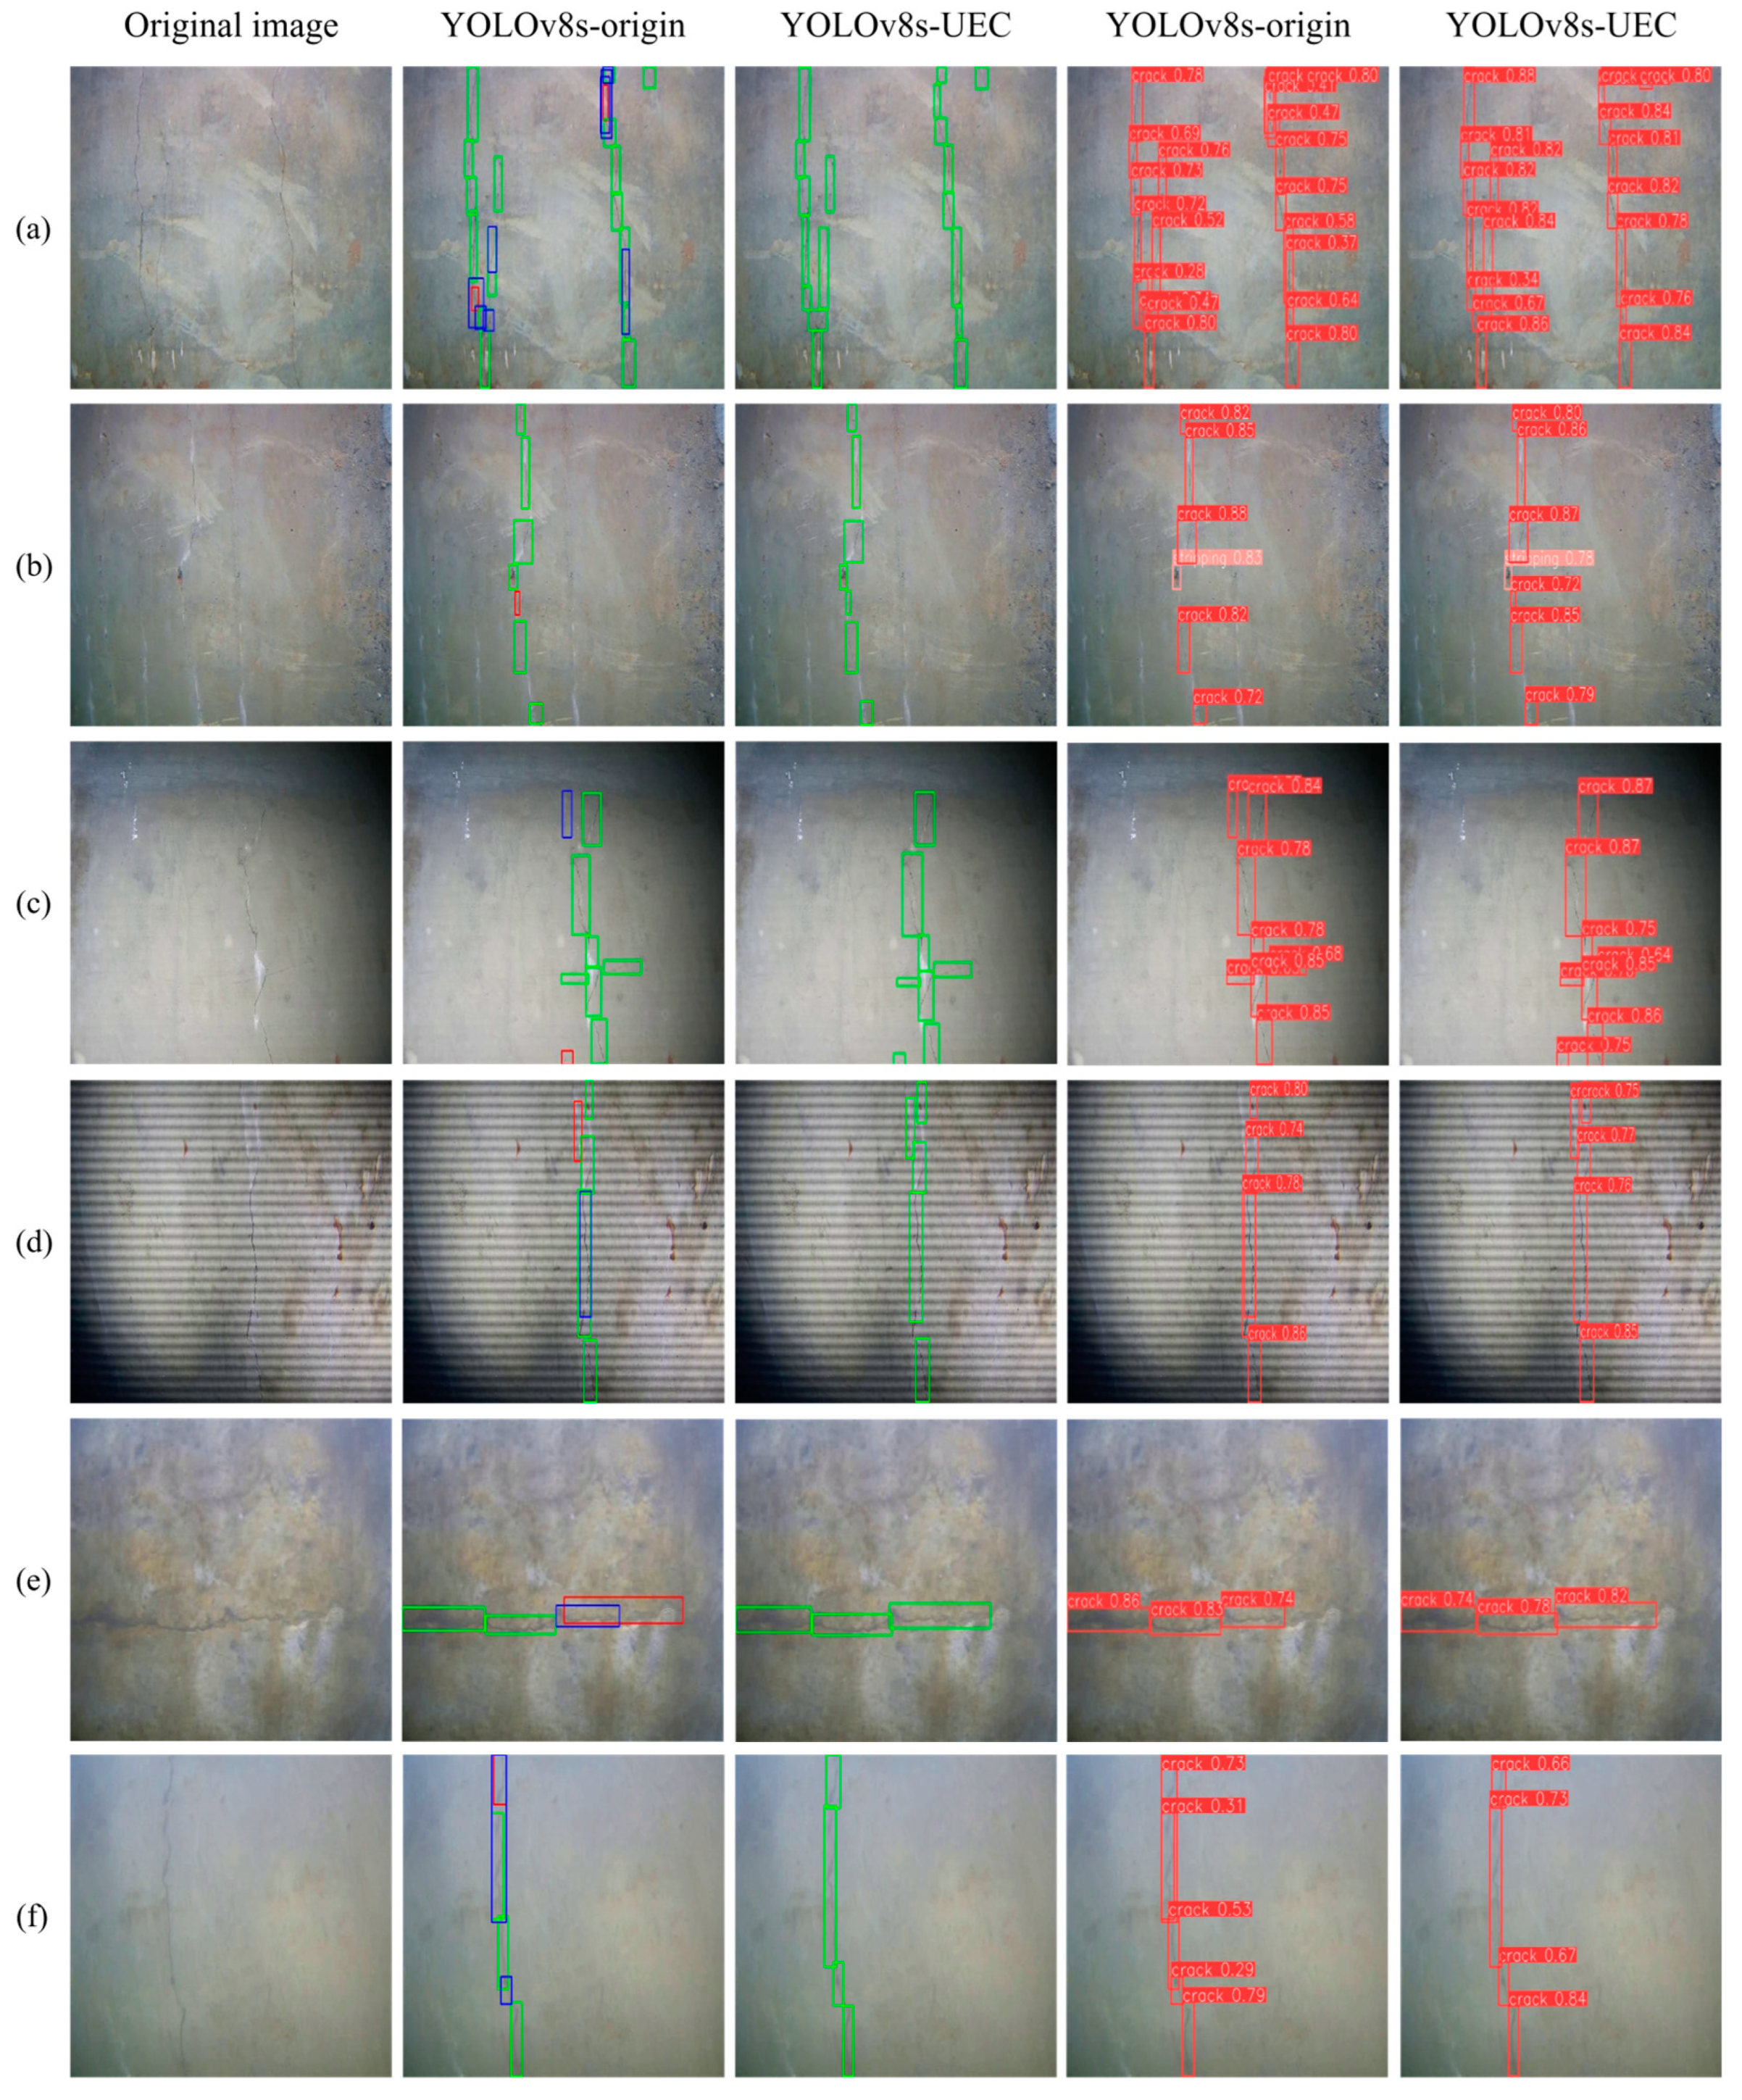
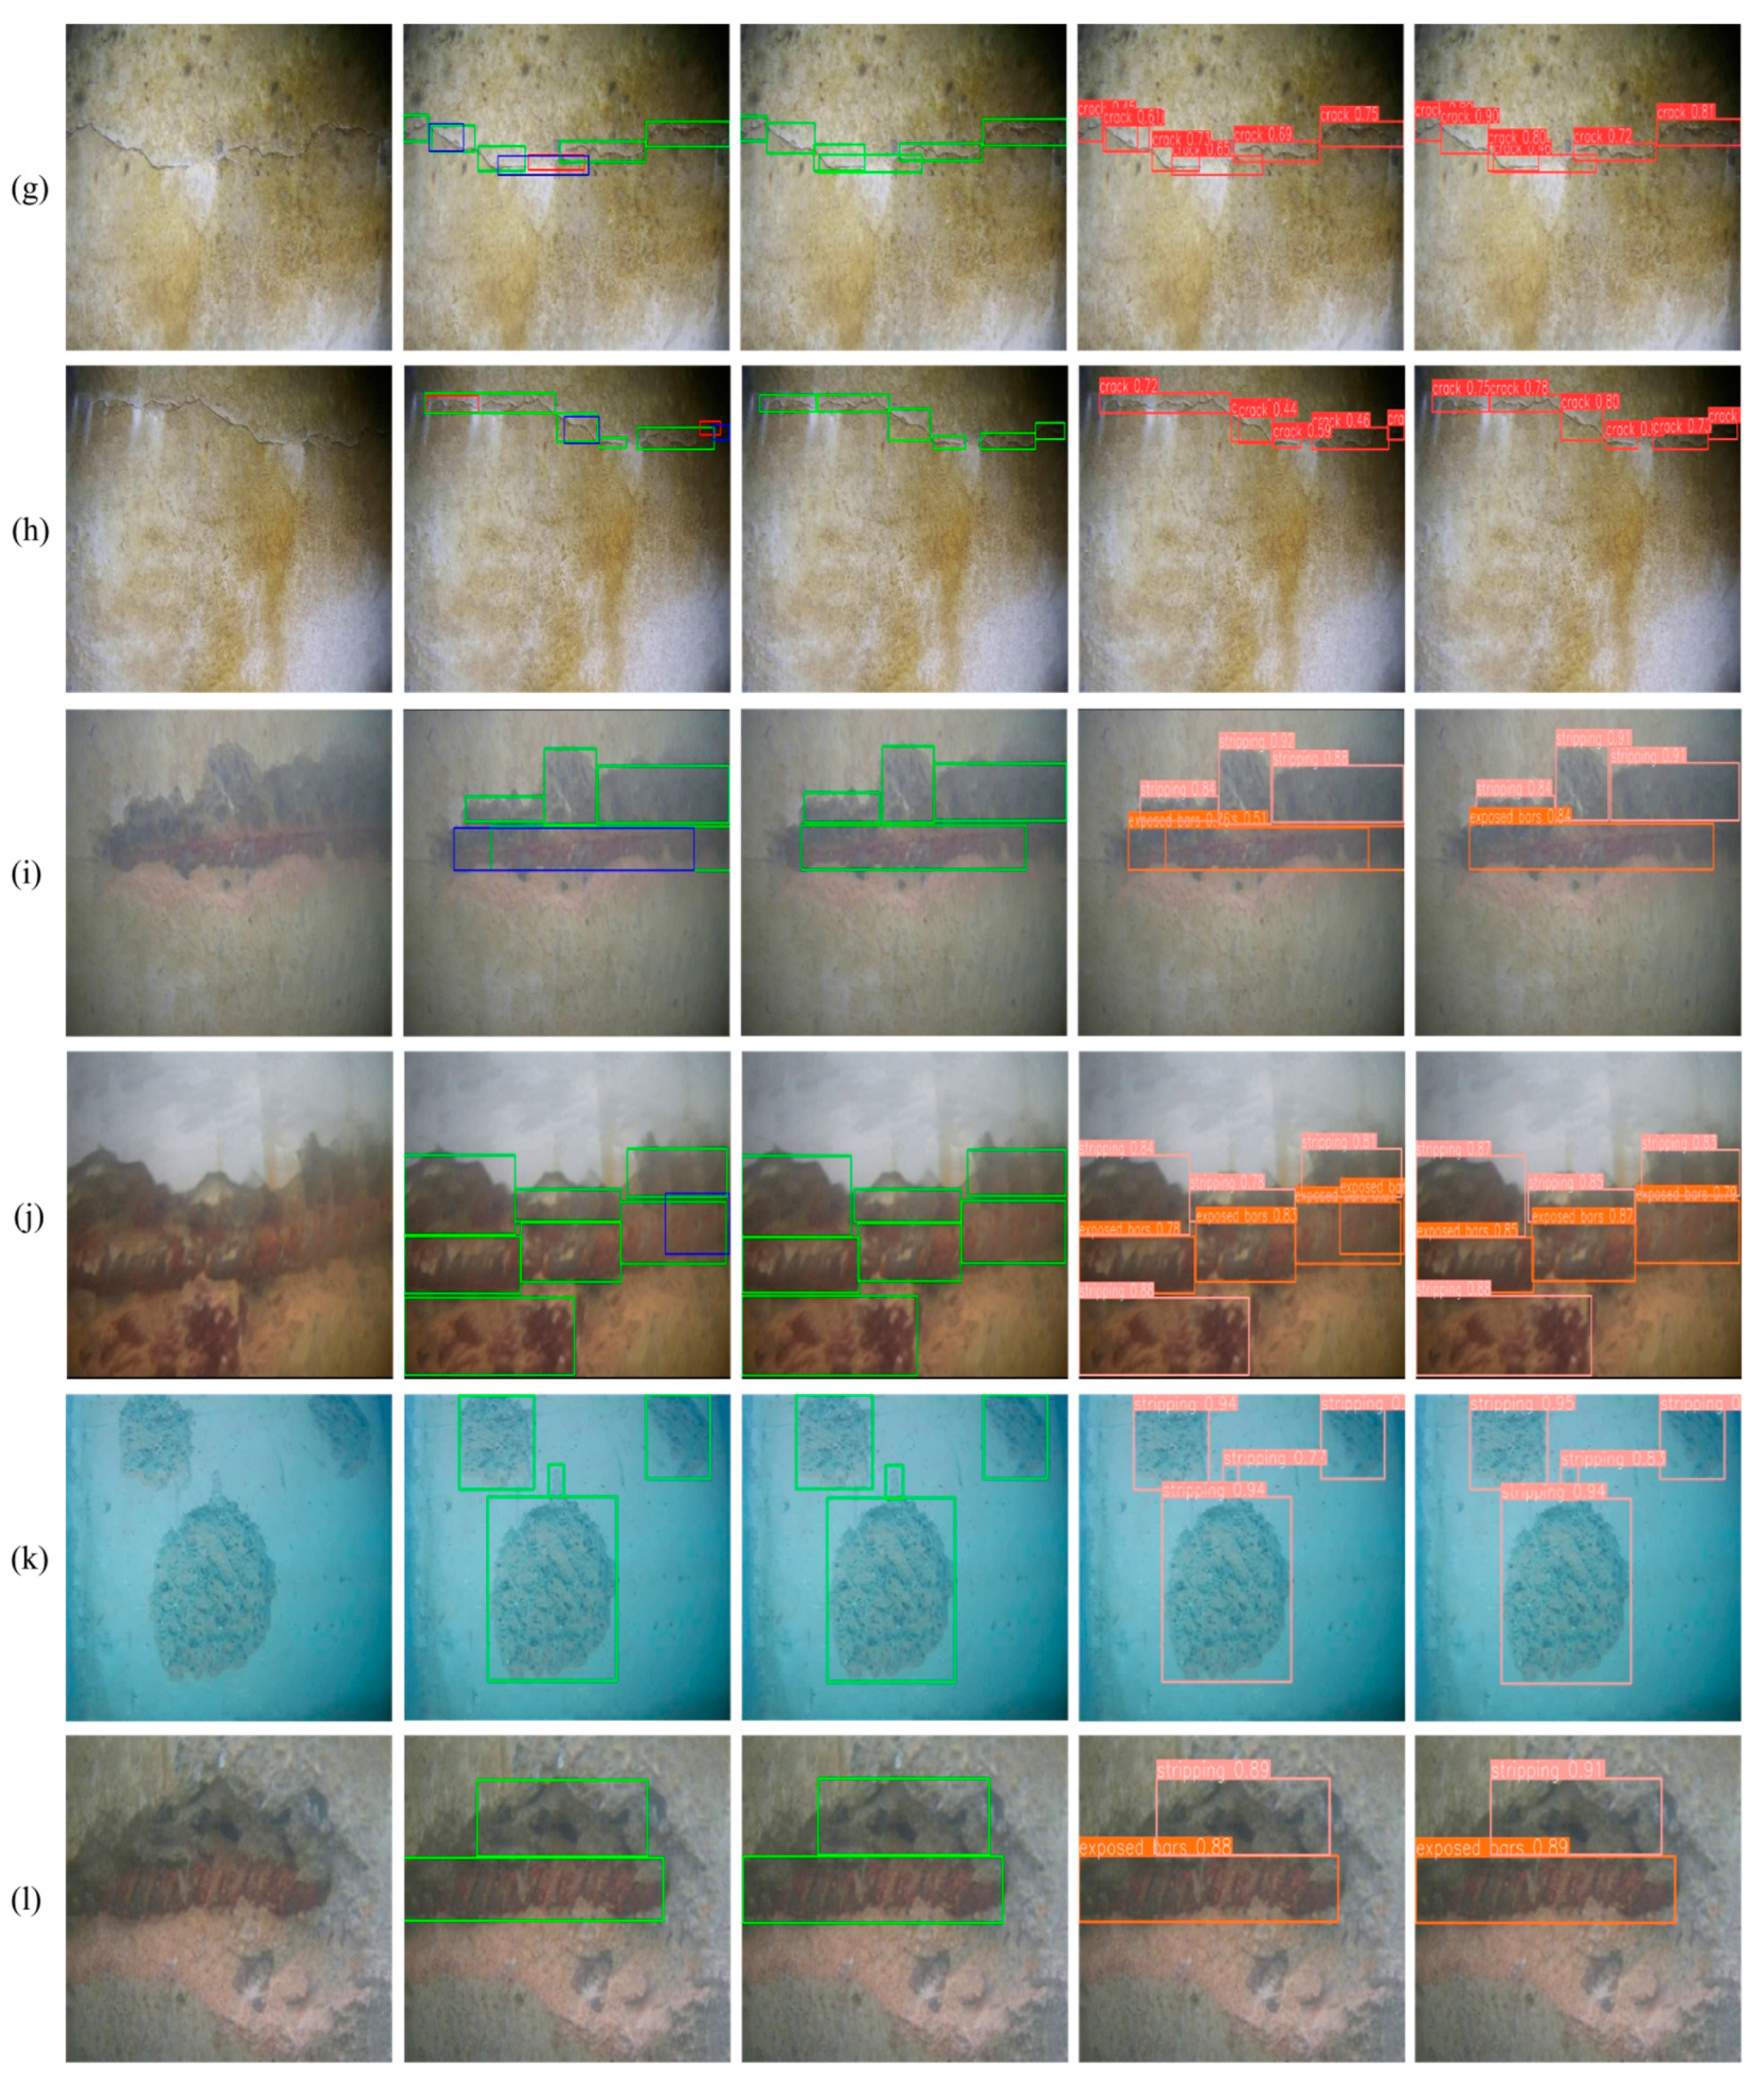
3.3. Underwater Defect Detection Based on YOLOv8s-UEC

The specific detection results on the test set are shown in Figure 15, which shows that the proposed network effectively improved the detection of underwater defects in general and had better robustness. Specifically, the improvement in detection performance was divided into three aspects: (1) the detection effect for small objects such as underwater cracks was improved, (2) the prediction boxes for various types of underwater defects were more reasonable, (3) the proposed network had a higher confidence when the same object is detected.
In addition, the real detection effect of the network was visualized using the ground truth as a benchmark, where the prediction boxes for correctly detected defective samples was marked in green, those for incorrectly detected non-defective samples were marked in blue, and those for missed defective samples were marked in red. Figure 15a–h presents pairs of images showing cracks in clear water without light, clear water with light, muddy water without light, and muddy water with light scenes, respectively, which shows that with the improvement of the network, the missed and incorrectly detected samples of crack defects in different scenes gradually disappeared, which proves that the effectiveness of the proposed network for detecting small objects such as underwater cracks was gradually improved. In Figure 15i,j, the detection effect of the proposed network on the three types of defects is improved, while the output prediction boxes are closer to the ground truth and more reasonable in distribution. In Figure 15k,l, the proposed network has higher confidence than the original network in detecting the same defects, which proves that the proposed network has a higher credibility in judging the defects. Taken together, the results show the proposed network can accurately detect defects of different categories and sizes in different underwater scenes, which shows that YOLOv8s-UEC has high applicability and credibility in the underwater defect recognition task.

4. Conclusions

In this study, we propose YOLOv8s-UEC, a network for underwater defect detection in concrete dams based on the YOLOv8s object detection framework. This model combines an improved Efficient-RepGFPN structure with a P2 detection layer as the neck of the model, replaces the bottleneck of the C2f module in the backbone with the ConvNeXt module, and substitutes the localization loss function with Focal-EIoU. Additionally, due to the time-consuming and costly nature of acquiring underwater defect images, which leads to a scarcity of such data, we constructed defect concrete walls with artificially created samples of cracks, spalling, and exposed bars. We collected underwater defect images using ROVs to create a dataset for network training, addressing the shortage and lack of diversity in underwater defect samples, and providing solid data support for future research in this area.
YOLOv8s-UEC was proposed after systematically testing and evaluating various structures and modules through ablation study. Compared to other models, YOLOv8s-UEC significantly enhanced the defect feature extraction capability in underwater scenes. In the three common categories of underwater defect detection, F1, mAP0.5, and mAP0.5:0.95 increased by 2.15%, 1.4%, and 5.8%, respectively. The model’s processing speed reached 107 FPS, improving detection accuracy and effectiveness while meeting real-time detection requirements. Validation results on the test set showed improved detection of small targets like underwater cracks; the predicted bounding boxes for various underwater defects were more reasonable; and when detecting the same target, the proposed model exhibited higher confidence. Thus, the proposed model is more suitable for underwater defect detection tasks compared to conventional algorithms, making it practically significant for the underwater safety assessment of dams.
In the future, we will further explore the development of underwater defect detection. We plan to utilize underwater robotic equipment to capture real underwater defect images of dams, aiming to create a more generalized defect dataset. Additionally, we will apply pruning or knowledge distillation to the proposed model to reduce the number of parameters and lower the resource requirements for deployment on mobile platforms.

Author Contributions

C.L.: conceptualization, methodology, software, investigation, writing—original draft. Y.Z.: methodology, software, experiments, writing—original draft. F.K.: resources, supervision, project administration, funding acquisition, review and editing. All authors have read and agreed to the published version of the manuscript.

Funding

This research was funded by the National Key R&D Program of China (2022YFB4703404), the National Natural Science Foundation of China (52079022), the Guangxi Key Technologies R&D Program (Gui Ke AB24010003).

Institutional Review Board Statement

Not applicable.

Informed Consent Statement

Not applicable.

Data Availability Statement

The original contributions presented in the study are included in the article, further inquiries can be directed to the corresponding author.

Conflicts of Interest

Author Yang Zhao was employed by the CCCC Second Harbor Engineering Co., Ltd. The remaining authors declare that the research was conducted in the absence of any commercial or financial relationships that could be construed as a potential conflict of interest.

References

  1. Kang, F.; Li, J. Displacement model for concrete dam safety monitoring via Gaussian process regression considering extreme air temperature. J. Struct. Eng. 2020, 146, 05019001. [Google Scholar] [CrossRef]
  2. Jia, J. A technical review of hydro-project development in China. Engineering 2016, 2, 302–312. [Google Scholar] [CrossRef]
  3. Ma, H.; Chi, F. Technical progress on researches for the safety of high concrete-faced rockfill dams. Engineering 2016, 2, 332–339. [Google Scholar] [CrossRef]
  4. Zhao, S.; Kang, F.; Li, J. Concrete dam damage detection and localisation based on YOLOv5s-HSC and photogrammetric 3D reconstruction. Autom. Constr. 2022, 143, 104555. [Google Scholar] [CrossRef]
  5. Huang, B.; Kang, F.; Li, J.; Wang, F. Displacement prediction model for high arch dams using long short-term memory based encoder-decoder with dual-stage attention considering measured dam temperature. Eng. Struct. 2023, 280, 115686. [Google Scholar] [CrossRef]
  6. Kang, F.; Wu, Y.; Ma, J.; Li, J. Structural identification of super high arch dams using Gaussian process regression with improved salp swarm algorithm. Eng. Struct. 2023, 286, 116150. [Google Scholar] [CrossRef]
  7. Chen, D.; Kang, F.; Chen, J.; Zhu, S.; Li, H. Effect of light source wavelength on surface defect imaging in deep-water concrete dams. NDT E Int. 2024, 147, 103198. [Google Scholar] [CrossRef]
  8. Ma, C.; Zhao, W.; Li, G.; Liu, J.; Deng, J.; Ding, W. The ground penetrating radar response recognition of hidden dam defects using multi-output convolutional neural network. J. Appl. Geophys. 2024, 225, 105397. [Google Scholar] [CrossRef]
  9. Zheng, M.; Lei, Z.; Zhang, K. Intelligent detection of building cracks based on deep learning. Image Vis. Comput. 2020, 103, 103987. [Google Scholar] [CrossRef]
  10. Shimono, S.; Matsubara, O.; Toyama, S.; Nishizawa, U. Development of underwater inspection system for dam inspection. In Proceedings of the OCEANS 2015-MTS/IEEE, Washington, DC, USA, 19–22 October 2015; IEEE: Piscataway, NJ, USA, 2015; pp. 1–6. [Google Scholar]
  11. Qu, Y.; Zou, D.; Kong, X.; Yu, X.; Chen, K. Seismic cracking evolution for anti-seepage face slabs in concrete faced rockfill dams based on cohesive zone model in explicit SBFEM-FEM frame. Soil Dyn. Earthq. Eng. 2020, 133, 106106. [Google Scholar] [CrossRef]
  12. Grömer, M.; Nocerino, E.; Calantropio, A.; Menna, F.; Dreier, A.; Winiwarter, L.; Mandlburger, G. High-detail and low-cost underwater inspection of large-scale hydropower dams. Int. Arch. Photogramm. Remote Sens. Spat. Inf. Sci. 2024, 48, 115–120. [Google Scholar] [CrossRef]
  13. Paraschos, D.; Papadakis, N.K. Autonomous underwater vehicle challenge: Design and construction of a medium-sized, AI-enabled low-cost prototype. J. Def. Model. Simul. 2024, 21, 269–281. [Google Scholar] [CrossRef]
  14. Cardaillac, A.; Skjetne, R.; Ludvigsen, M. ROV-Based Autonomous Maneuvering for Ship Hull Inspection with Coverage Monitoring. J. Intell. Robot. Syst. Theory Appl. 2024, 110, 59. [Google Scholar] [CrossRef]
  15. Kazmi, W.; Ridao, P.; Romagos, D.R.; Hernandez, E. Dam wall detection and tracking using a mechanically scanned imaging sonar. In Proceedings of the 2009 IEEE International Conference on Robotics and Automation, Kobe, Japan, 12–17 May 2009; IEEE: Piscataway, NJ, USA, 2009; pp. 3595–3600. [Google Scholar]
  16. Zhou, H.; Liu, A.; Li, W.; Chen, B.; Wang, J.; Wu, Z.; Yang, Y. Method for 3D reconstruction of surface diseases of underwater concrete structures based on ROV. Eng. Mech. 2024, 41, 129–135. [Google Scholar]
  17. Neto, E.C.; Sá, R.C.; Holanda, G.C.; da Mota, F.A.X.; Varela, A.T.; Araújo, A.L.C.; Loiola, I.J.; Oliveira, R.; de Alexandria, A.R.; de Albuquerque, V.H.C. Autonomous underwater vehicle to inspect hydroelectric dams. Int. J. Comput. Appl. 2014, 101, 1–11. [Google Scholar]
  18. Chen, D.; Huang, B.; Kang, F. A review of detection technologies for underwater cracks on concrete dam surfaces. Appl. Sci. 2023, 13, 3564. [Google Scholar] [CrossRef]
  19. Sakagami, N.; Takemura, F.; Ono, R.; Katagiri, C.; Nakanishi, Y.; Yamamoto, Y. Observation support system of an ROV for underwater archaeology. In Proceedings of the 2015 International Conference on Intelligent Informatics and Biomedical Sciences, Okinawa, Japan, 28–30 November 2015; IEEE: Piscataway, NJ, USA, 2015; pp. 192–196. [Google Scholar]
  20. Cheng, C.; Wang, C.; Yang, D.; Liu, W.; Zhang, F. Underwater localization and mapping based on multi-beam forward looking sonar. Front. Neurorobotics 2022, 15, 801956. [Google Scholar] [CrossRef]
  21. Yoerger, D.; Bradley, A.; Jakuba, M.; German, C.; Shank, T.; Tivey, M. Autonomous and remotely operated vehicle technology for hydrothermal vent discovery, exploration, and sampling. Oceanography 2007, 20, 152–161. [Google Scholar] [CrossRef]
  22. Shi, P.; Fan, X.; Wang, G. A novel underwater dam crack detection algorithm based on sonar images. In Proceedings of the 2015 5th International Conference on Computer Sciences and Automation Engineering (ICCSAE 2015), Sanya, China, 14–15 November 2015; Atlantis Press: Amsterdam, The Netherlands, 2016; pp. 452–456. [Google Scholar]
  23. Sugimoto, H.; Moriya, Y.; Ogasawara, T. Underwater survey system of dam embankment by remotely operated vehicle. In Proceedings of the 2017 IEEE Underwater Technology (UT), Busan, Republic of Korea, 21–24 February 2017; IEEE: Piscataway, NJ, USA, 2017; pp. 1–6. [Google Scholar]
  24. Ridao, P.; Carreras, M.; Ribas, D.; Garcia, R. Visual inspection of hydroelectric dams using an autonomous underwater vehicle. J. Field Robot. 2010, 27, 759–778. [Google Scholar] [CrossRef]
  25. Sakagami, N.; Yumoto, Y.; Takebayashi, T.; Kawamura, S. Development of dam inspection robot with negative pressure effect plate. J. Field Robot. 2019, 36, 1422–1435. [Google Scholar] [CrossRef]
  26. Qi, N.; Nie, Q.; Lai, J.; Chen, Y.; Li, Y. Key Technology and Practice of Underwater Intelligent Inspection in Multiple Scenarios of Hydropower Station. J. Tsinghua Univ. (Sci. Technol.) 2023, 63, 1124–1134. [Google Scholar]
  27. Sun, Y.; Pang, Y.; Wan, L.; Qin, Z. Study of underwater robotic GDROV programme for dam detection. Ship Ocean Eng. 2006, 35, 84–86. [Google Scholar]
  28. LeCun, Y.; Bengio, Y.; Hinton, G. Deep learning. Nature 2015, 521, 436–444. [Google Scholar] [CrossRef] [PubMed]
  29. Janiesch, C.; Zschech, P.; Heinrich, K. Machine learning and deep learning. Electron. Mark. 2021, 31, 685–695. [Google Scholar] [CrossRef]
  30. Shinde, P.; Shah, S. A review of machine learning and deep learning applications. In Proceedings of the 2018 Fourth International Conference on Computing Communication Control And Automation (ICCUBEA), Pune, India, 16–18 August 2018; IEEE: Piscataway, NJ, USA, 2018; pp. 1–6. [Google Scholar]
  31. Feng, C.; Zhang, H.; Wang, H.; Wang, S.; Li, Y. Automatic pixel-level crack detection on dam surface using deep convolutional network. Sensors 2020, 20, 2069. [Google Scholar] [CrossRef] [PubMed]
  32. Ni, T.; Zhou, R.; Gu, C.; Yang, Y. Measurement of concrete crack feature with android smartphone APP based on digital image processing techniques. Measurement 2020, 150, 107093. [Google Scholar] [CrossRef]
  33. Miao, Z.; Ji, X.; Okazaki, T.; Takahashi, N. Pixel-level multicategory detection of visible seismic damage of reinforced concrete components. Comput.-Aided Civ. Infrastruct. Eng. 2021, 36, 620–637. [Google Scholar] [CrossRef]
  34. Tan, Y.; Cai, R.; Li, J.; Chen, P.; Wang, M. Automatic detection of sewer defects based on improved you only look once algorithm. Autom. Constr. 2021, 131, 103912. [Google Scholar] [CrossRef]
  35. Park, S.; Eem, S.; Jeon, H. Concrete crack detection and quantification using deep learning and structured light. Constr. Build. Mater. 2020, 252, 119096. [Google Scholar] [CrossRef]
  36. Yu, Z.; Shen, Y.; Shen, C. A real-time detection approach for bridge cracks based on YOLOv4-FPM. Autom. Constr. 2021, 122, 103514. [Google Scholar] [CrossRef]
  37. Zhu, J.; Zhong, J.; Ma, T.; Huang, X.; Zhang, W.; Zhou, Y. Pavement distress detection using convolutional neural networks with images captured via UAV. Autom. Constr. 2022, 133, 103991. [Google Scholar] [CrossRef]
  38. Li, Y.; Bao, T.; Huang, X.; Chen, H.; Xu, B.; Shu, X.; Zhou, Y.; Cao, Q.; Tu, J.; Wang, R.; et al. Underwater crack pixel-wise identification and quantification for dams via lightweight semantic segmentation and transfer learning. Autom. Constr. 2022, 144, 104600. [Google Scholar] [CrossRef]
  39. Torrey, L.; Shavlik, J. Transfer learning. In Handbook of Research on Machine Learning Applications and Trends: Algorithms, Methods, and Techniques; IGI Global: Hershey, PA, USA, 2010; pp. 242–264. [Google Scholar]
  40. Pan, S.; Yang, Q. A survey on transfer learning. IEEE Trans. Knowl. Data Eng. 2009, 22, 1345–1359. [Google Scholar] [CrossRef]
  41. Fan, X.; Cao, P.; Shi, P.; Chen, X.; Zhou, X.; Gong, Q. An underwater dam crack image segmentation method based on multi-level adversarial transfer learning. Neurocomputing 2022, 505, 19–29. [Google Scholar] [CrossRef]
  42. Cao, W.; Li, J. Detecting large-scale underwater cracks based on remote operated vehicle and graph convolutional neural network. Front. Struct. Civ. Eng. 2022, 16, 1378–1396. [Google Scholar] [CrossRef]
  43. Qi, Z.; Liu, D.; Zhang, J.; Chen, J. Micro-concrete crack detection of underwater structures based on convolutional neural network. Mach. Vis. Appl. 2022, 33, 74. [Google Scholar] [CrossRef]
  44. Li, X.; Sun, H.; Song, T.; Zhang, T.; Meng, Q. A method of underwater bridge structure damage detection method based on a lightweight deep convolutional network. IET Image Process. 2022, 16, 3893–3909. [Google Scholar] [CrossRef]
  45. Terven, J.; Córdova-Esparza, D.-M.; Romero-González, J.-A. A comprehensive review of yolo architectures in computer vision: From yolov1 to yolov8 and yolo-nas. Mach. Learn. Knowl. Extr. 2023, 5, 1680–1716. [Google Scholar] [CrossRef]
  46. Wu, Y.; Han, Q.; Jin, Q.; Li, J.; Zhang, Y. LCA-YOLOv8-Seg: An Improved Lightweight YOLOv8-Seg for Real-Time Pixel-Level Crack Detection of Dams and Bridges. Appl. Sci. 2023, 13, 10583. [Google Scholar] [CrossRef]
  47. Liu, Z.; Mao, H.; Wu, C.Y.; Feichtenhofer, C.; Darrell, T.; Xie, S. A convnet for the 2020s. In Proceedings of the IEEE/CVF Conference on Computer Vision and Pattern Recognition, New Orleans, LA, USA, 18–24 June 2022; pp. 11976–11986. [Google Scholar]
  48. Bai, H.; Liang, X. A very lightweight image super-resolution network. Sci. Rep. 2024, 14, 13850. [Google Scholar] [CrossRef]
  49. Xu, X.; Jiang, Y.; Chen, W.; Huang, Y.; Zhang, Y.; Sun, X. Damo-yolo: A report on real-time object detection design. arXiv 2022, arXiv:2211.15444. [Google Scholar]
  50. Sun, Z.; Li, P.; Meng, Q.; Sun, Y.; Bi, Y. An Improved YOLOv5 Method to Detect Tailings Ponds from High-Resolution Remote Sensing Images. Remote Sens. 2023, 15, 1796. [Google Scholar] [CrossRef]
  51. Zhang, Y.-F.; Ren, W.; Zhang, Z.; Jia, Z.; Wang, L.; Tan, T. Focal and efficient IOU loss for accurate bounding box regression. Neurocomputing 2022, 506, 146–157. [Google Scholar] [CrossRef]
Figure 1. Problems faced in underwater defect detection: (a) defect features are difficult to distinguish; (b) defect size varies greatly.
Applsci 14 08731 g001
Figure 2. Introduction to underwater defect detection methodology.
Applsci 14 08731 g002
Figure 3. Architecture of the YOLOv8s network.
Applsci 14 08731 g003
Figure 4. Structure of ConvNeXt Block.
Applsci 14 08731 g004
Figure 5. Structure of Efficient-RepGFPN.
Applsci 14 08731 g005
Figure 6. Structure of Efficient RepGFPN feature fusion module CSPStage.
Applsci 14 08731 g006
Figure 7. Proposed underwater defect detection network YOLOv8s-UEC.
Applsci 14 08731 g007
Figure 8. Principle of loss function calculation.
Applsci 14 08731 g008
Figure 9. The classification of underwater defect data.
Applsci 14 08731 g009
Figure 10. Construction process of defective concrete walls: (a) specimen molds, (b) concrete pouring, (c) defect production, (d) defective wall construction.
Applsci 14 08731 g010
Figure 11. Defect images in different scenes: (a) clear water without light, (b) muddy water without light, (c) clear water with light, (d) muddy water with light.
Applsci 14 08731 g011
Figure 12. The effect of different data enhancement: (a) rotation, (b) flipping, (c) random erasure, (d) adding noise, (e) panning, (f) brightness adjustment.
Applsci 14 08731 g012
Figure 13. Loss and mAP curves of different networks in training process: (a) loss curve, (b) mAP curve.
Applsci 14 08731 g013
Figure 14. Precision–recall curve of different networks.
Applsci 14 08731 g014
Figure 15. Underwater defect detection based on YOLOv8s and the proposed YOLOv8s-UEC network: (ah) small-size crack detection in different environments; (i,j) more reasonable prediction boxes; (k,l) higher confidence.
Applsci 14 08731 g015aApplsci 14 08731 g015b
Table 1. Network settings for different improvement methods.
Network
Name
Network
Structure
Adopted
Module
Loss
Function
Head
Number
YOLOv8sOriginC2fCIoU3
YOLOv8s-ERE-RepGFPNC2fCIoU3
YOLOv8s-ECE-RepGFPNC2fCIoU3
YOLOv8s-IECE-RepGFPN + P2C2f-CNCIoU4
YOLOv8s-UECE-RepGFPN + P2C2f-CNFocal-EIoU4
Table 2. Comprehensive test results of different networks.
NetworkPrecisionRecallF1mAP0.5mAP0.5:0.95FPS
YOLOv8s91.6%90.0%0.907993.8%74.1%121
YOLOv8s-ER92.1%90.6%0.913494.1%76.0%114
YOLOv8s-EC93.9%91.4%0.926394.3%79.1%115
YOLOv8s-IEC94.5%90.7%0.925695.1%79.5%82
YOLOv8s-UEC93.9%91.6%0.927495.2%79.9%107
Table 3. Results of mAP0.5 in different network for various defects.
Network NameCrackSpallingExposed Bars
YOLOv8s86.3%97.9%97.1%
YOLOv8s-ER87.5%97.6%97.2%
YOLOv8s-EC87.9%97.8%97.3%
YOLOv8s-IEC89.9%98.0%97.5%
YOLOv8s-UEC89.3%98.4%97.9%
Table 4. Detection results of other advanced networks.
NetworkPrecisionRecallF1mAP0.5FPS
Faster R-CNN93.7%78.9%0.856790.3%39
YOLOX-s91.3%90.6%0.909593.6%84
YOLOv5s93.4%91.0%0.921894.2%101
YOLOv8s91.6%90.0%0.907993.8%121
YOLOv8s-UEC93.9%91.6%0.927495.2%107
Disclaimer/Publisher’s Note: The statements, opinions and data contained in all publications are solely those of the individual author(s) and contributor(s) and not of MDPI and/or the editor(s). MDPI and/or the editor(s) disclaim responsibility for any injury to people or property resulting from any ideas, methods, instructions or products referred to in the content.

