Article

Molecular Simulation of CH4 Adsorption Characteristics under the Coupling of Different Temperature and Water Content

1
School of Safety and Emergency Management Engineering, Taiyuan University of Technology, Taiyuan 030024, China
2
Graduate Education Innovation Center for Shanxi Coal Mine Safety, Taiyuan University of Technology, Taiyuan 030024, China
*
Author to whom correspondence should be addressed.
Appl. Sci. 2024, 14(19), 8757; https://doi.org/10.3390/app14198757 (registering DOI)
Submission received: 6 September 2024 / Revised: 20 September 2024 / Accepted: 25 September 2024 / Published: 28 September 2024
(This article belongs to the Special Issue Coalbed Degassing Method and Technology)

Abstract

:
The adsorption characteristics of CH4 have an important influence on gas content prediction, gas extraction, and hazard prevention. Therefore, we explored the mechanism of CH4 adsorption under the action of water and temperature to grasp the influence of water and temperature on the adsorption characteristics of CH4. In this paper, a giant, regular-system Monte Carlo method is used to simulate the CH4 adsorption behavior at the molecular level under different temperatures, water contents, and the coupling of both. The results indicate that an empirical formula for the coupling effect of temperature and water content on CH4 adsorption was obtained. The impact of different effects on CH4 adsorption is as follows: coupling effect > single temperature effect > single water content effect. The optimal combination is at a temperature of 363 K and a water content of 8.31%. Compared with the CH4 adsorption capacity without water at room temperature, the CH4 adsorption capacity is reduced by 68.04% under the coupling effect of the optimal combination. Temperature has a negative effect on the adsorption of CH4, and temperature changes the adsorption capacity by changing the average molecular kinetic energy of CH4. The reason why the increase in H2O reduces the adsorption capacity of CH4 is that the interaction between H2O and the oxygen-containing functional groups of coal is stronger than that of CH4. As the water content increases, the adsorption heat decreases, thereby inhibiting the adsorption of CH4. In addition, H2O has a smaller molecular dynamics radius as compared to CH4; the larger the free volume and surface area in the pore structure, the more adsorption pores it occupies, resulting in a more significant reduction in the adsorption of CH4.

1. Introduction

CH4 is a high-quality, efficient energy source and is also the second-largest greenhouse gas after carbon dioxide [1,2]. CH4 emissions account for about 18% of the global emissions of greenhouse gases, and their development and utilization are of great significance for clean energy and carbon emission reduction [3]. CH4 is mainly stored in coal seams in adsorbed and free states, of which more than 80–90% is stored in adsorbed states. Research on the adsorption capacity of coal for methane is an important basis for the calculation and exploitation of coalbed methane reserves [4].
In recent years, numerous scholars have carried out a lot of research on the characterization of CH4 adsorption by coal. Li Shugang et al. quantitatively characterized the methane adsorption characteristics using microporous filling and monolayer adsorption theory and clarified the mechanism of methane adsorption in adsorption pores [5]. Feng Zengzhao et al. investigated the effect of water on the adsorption characteristics of coal and found a linear relationship between the CH4 adsorption content of coal and the water content [6]. Qin Lei et al. studied the adsorption characteristics of gas after the addition of low-temperature liquid nitrogen, utilizing a low-temperature liquid nitrogen adsorption instrument, and concluded that the temperature decreases the content of oxygen-containing functional groups [7]. Li Xijian studied the adsorption of methane by coal through molecular simulation and concluded that the porosity, temperature, water, and ash content of coal affected the adsorption of methane by coal [8]. Zheng Chao et al. investigated the effect of water on the desorption/adsorption of CBM and found that the effect of water on adsorption in coal reservoirs is limited by the pore structure and that the mode of coal–water interaction in micropores is the core of CBM adsorption [9]. Li Bobo et al. concluded that the adsorption amount of the coal body is inversely proportional to the water content by conducting coal rock adsorption experiments [10]. Li et al. investigated the change in the adsorption energy of coal bodies under different temperature and pressure conditions and concluded that the physical properties and internal chemical structure of coal bodies would affect the change in gas adsorption energy [11]. Zhang et al. investigated the adsorption of CH4 by nanopores using molecular simulation and concluded that the change in CH4 adsorption was related to temperature, pressure, and burial depth, and was consistent with the reasons for the change in adsorption amount and adsorption heat [12]. Yan et al. investigated the relationship between the pore structure of the coal body and the adsorption of the gas at different temperatures. Researchers used low-temperature nitrogen adsorption and isothermal adsorption experiments to study the free energy of adsorption and entropy of adsorption of coal samples, concluding that both decreased gradually with an increase in temperature [13]. Cai et al. found that initial free gas pressure affects the heat of adsorption of the coal body, and the larger the initial gas pressure is, the smaller the heat of adsorption is [14].
The existing studies mainly focus on the CH4 adsorption characteristics under the influence of single factors of temperature and water content, and there are a lack of studies on the influence of the coupling of the two. Therefore, in this paper, we use a coal sample from the Ping coal mine (PM) as the research object and utilize molecular simulation methods to study the effects of different temperatures, water contents, and the coupling of the two on the CH4 adsorption characteristics.

2. Model Construction and Simulation Parameters

2.1. Coal Quality Analysis

The experimental coal samples were analyzed industrially according to GB/T 212-2008 “Methods of Industrial Analysis of Coal” [15]. Then, the maximum specular group reflectance of the coal sample was measured according to GB/T 8899-2013 “Coal microclassification and mineral determination methods” [16]. The experimental results are shown in Table 1.

2.2. Coal Model Construction and Parameters

The model data from the literature [17] were used as a basis to construct the model in this paper, as shown in Figure 1a, with the following structural parameters: the molecular formula C108H71O4N, a model molecular weight of 1445, an elemental content of C of 86.69%, an elemental content of H of 4.91%, an elemental content of O of 4.43%, and an elemental content of N of 0.97%.
The Forcite module in Materials Studio was selected for geometry optimization and annealed to obtain the lowest energy configuration of the coal model, as shown in Figure 1b. Specific parameter settings were as follows: Geometry optimization was selected for the task, COMPASS was selected for the force field, and charge equilibration (QEq) was used to calculate the charge. Specific parameter settings for the molecular dynamics optimization were the following: Anneal was selected for the task; the total number of annealing cycles was 10; the initial temperature was 300 K; the maximum temperature was 600 K; and the NVT system was used. The simulation time was 10 ps, the temperature control method was Nose, and the force field was set as described above.
The 15 optimized basic structural units were randomly placed into the empty box to establish the periodic boundary conditions of the structure of the coal model, and the optimized coal structure model cell parameters were obtained, in which the prism length was A = B = C = 2.8 nm, the inter-prism angle was α = β = γ = 90°, and the cell density was 1.1%. The optimized dry coal model of the E9-10 seam of the PINGDINGSHAN BAMINE is shown in Figure 1c.

2.3. Simulation Program

The Grand Canonical Ensemble Monte Carlo (GCMC) method was used to simulate the adsorption of CH4 at different temperatures, water contents, and mutual coupling. The Sorption module of Materials Studio was used, with Adsorption Isotherm selected for the task item, COMPASS selected for the force field, and pressures ranging from 0.01 to 10 MPa.
(1) In the study of temperature effects, the simulation temperatures were set to 223 K, 243 K, 263 K, 303 K, 313 K, 343 K, and 363 K, and the adsorbent was a dry coal model with 0% water content.
(2) In the simulation of different water content, the temperature was fixed at 303 K, and the adsorbent was set as a coal structure model with water content of 1.10%, 4.27%, and 8.31%, respectively.
(3) In analyzing the coupling process adsorption, orthogonal tests were set up for different temperatures and water contents, and the primary and secondary order of the influencing factors were determined by polar analysis.
The number of gas molecules adsorbed in a single crystal cell can be obtained by GCMC simulation. Formula (1) is replaced by the amount of adsorption commonly used in the experiment:
V = 1000 N N A · M ,
In the equation: V is the adsorption capacity, mmol/g; N is the number of gas molecules adsorbed in a single unit cell, moleculars/u.c; NA is the Avogadro constant, 6.02 × 10²³; M is the unit cell mass, g.
The isothermal data were fitted by the Langmuir Equation (2):
V = a b p 1 + b p ,
In the equation, V is the adsorption capacity, mmol/g; a is the saturated adsorption parameter, mmol/g; b is the adsorption equilibrium parameter, MPa−1; p is pressure, MPa.

3. Simulation Results and Analysis

3.1. Effect of Temperature on Methane Adsorption Performance

Temperature is one of the important factors that affects CH4 adsorption [18]. The isothermal adsorption data obtained from the simulation were fitted with the Langmuir equation, and the R2 was 0.993~0.996, which was a good fit, indicating that the simulation results were reliable. Based on the values of adsorption constants a and b under different temperature conditions, the methane adsorption quantities X1~X10 at pressures ranging from 1 to 10 MPa were calculated, respectively, and the correction coefficient ηt of 303 K was taken as 1, which resulted in the curve of the average value of the correction coefficient ηt versus the temperature under different temperature conditions, as shown in Figure 2.
It can be seen from Figure 2 that the change in temperature correction coefficient ηt with temperature t satisfies Equation (3):
η t = 1.27 e 0.009 t ,
In the formula: ηt is the temperature correction coefficient; t is temperature, °C.
Adsorption of CH4 at different temperatures were obtained by considering the temperature based on the Langmuir equation as shown in Figure 3. From the figure, it can be seen that the absolute adsorption amount of CH4 decreases gradually with the increase in temperature, and the heat of adsorption decreases gradually under the same pressure. High-temperature environments inhibit the adsorption of CH4 on coal because the increase in temperature increases the average kinetic energy of CH4 molecules, weakening the van der Waals forces between CH4 molecules. Low-temperature environments are just the opposite, where cooling reduces the kinetic energy of free CH4 molecules, allowing the van der Waals forces between CH4 molecules to increase.

3.2. Effect of Different Water Content on Methane Adsorption Performance

The actual coal seam contains a large amount of water, and the water content in the coal seam is also an important factor affecting CH4 adsorption [19,20]. In order to clarify the effect of different water contents on CH4 adsorption, different water molecules were added to the dry coal model, and the coal models with water content of 1.1%, 4.27%, and 8.31% were constructed, respectively. The number of water molecules were 23, 64, and 110, respectively. The molecular models with different water contents are shown in Figure 4, where the green ball-and-stick models represent the water molecules.
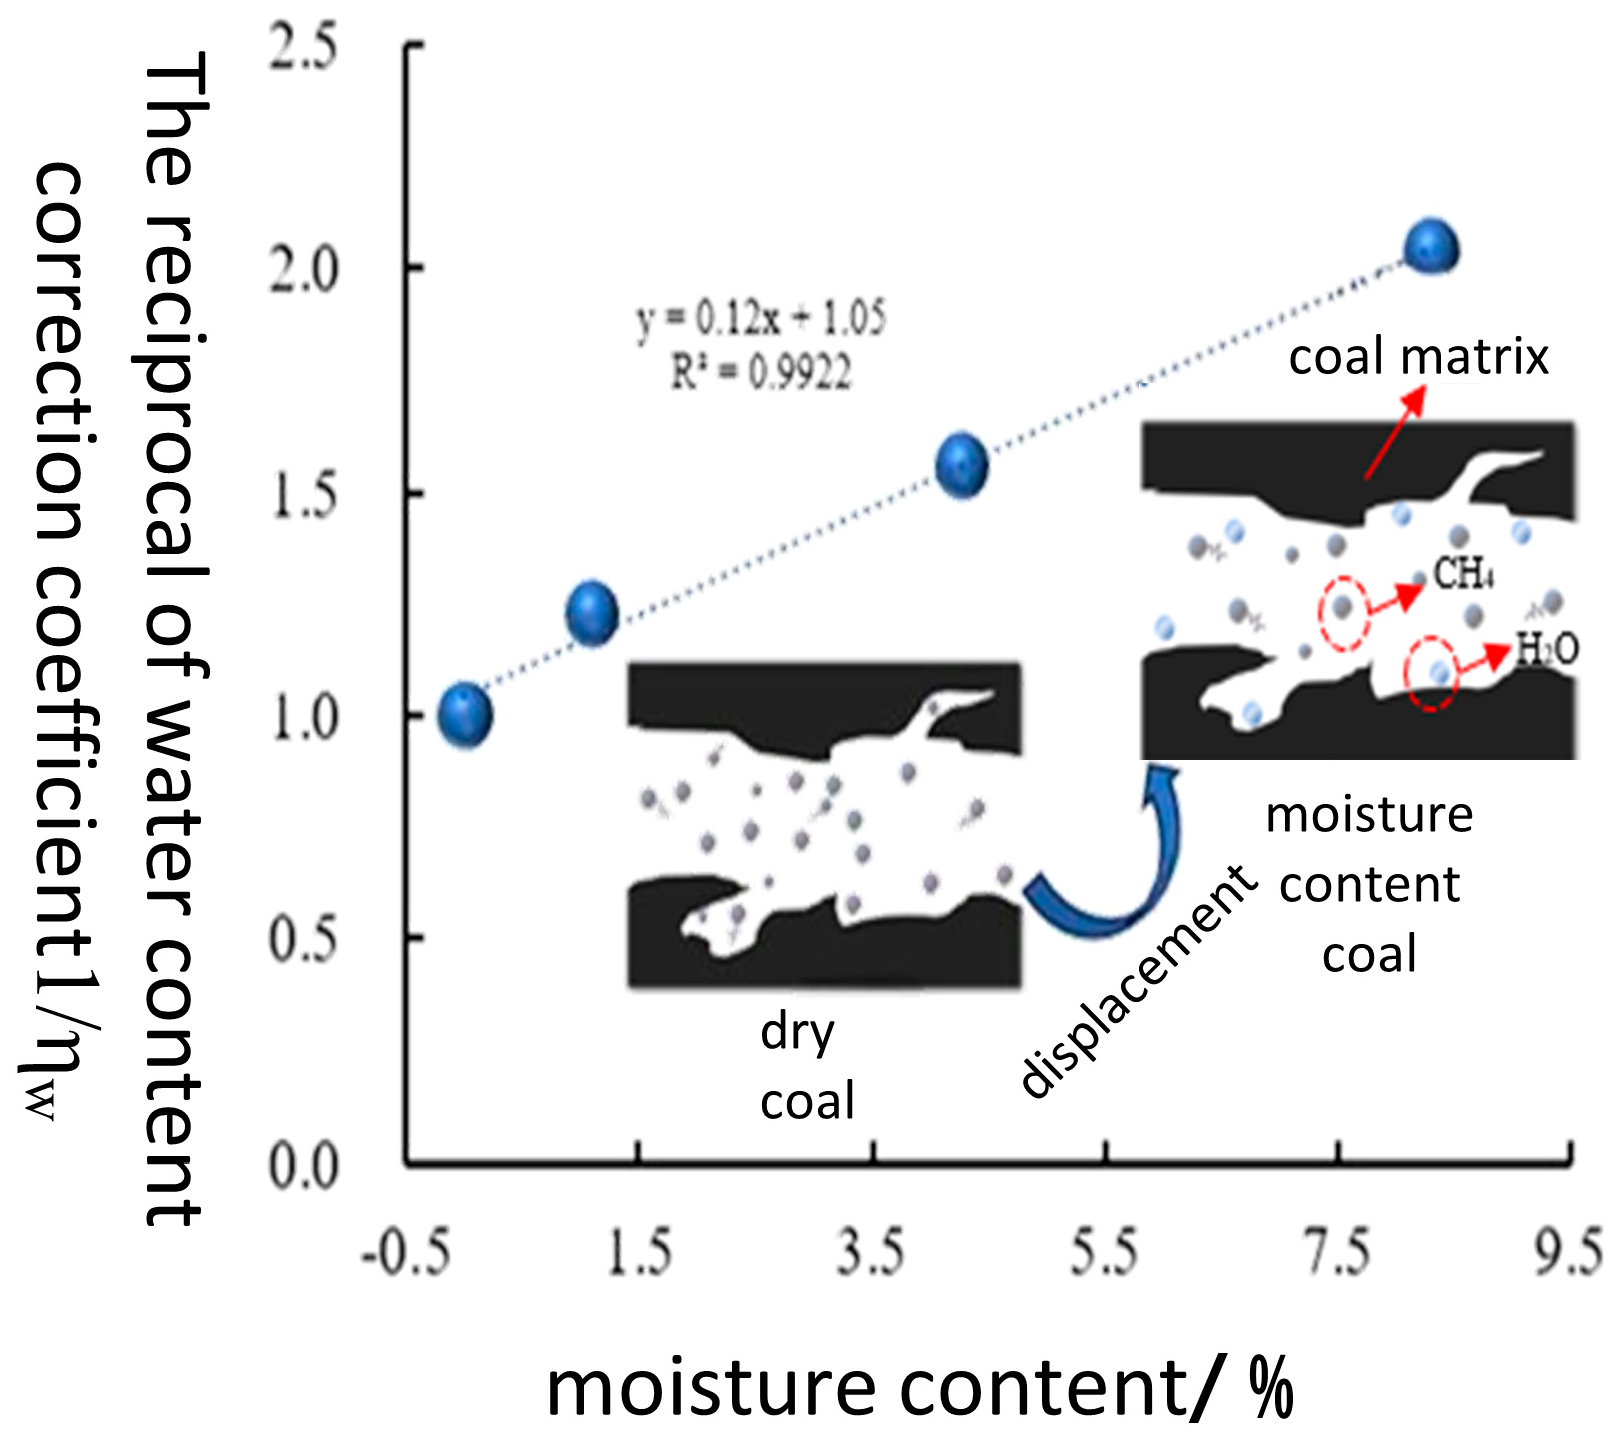
The isothermal adsorption data obtained from the simulation were fitted with the Langmuir equation. The fitting parameters of the Langmuir equation with different water content as shown in Table 2. Based on the adsorption constants a and b, with values under different water content conditions, the methane adsorption capacity X1~X10 at a pressure of 1~10 MPa was calculated, respectively. With the correction coefficient of 0% water content as 1, the curve of water content and 1/ηw under different water content conditions was obtained, as shown in Figure 5. From Figure 5, it can be seen that the temperature correction factor ηw and water content w satisfy Equation (4):
η w = 1 1.04 + 0.12 w ,
In the formula, ηw is the correction coefficient of water content; w is temperature, %.
The isothermal adsorption curves and heat of adsorption of CH4 after Langmuir’s equation and consideration of water content correction are shown in Figure 6. From Figure 6a, it can be seen that the adsorption of CH4 decreases with increasing water content when the temperature and pressure are certain. According to the fitted data, the limiting adsorption amount of CH4 decreased by 15.2%, 28.09%, and 40.46% with the increase in water content relative to the water content of 0%, respectively, and the increase in water content had an inhibitory effect on the adsorption of CH4.
The magnitude of the heat of adsorption can be used to measure the strength of gas adsorption by the coal body [21]. From Figure 6b, it can be seen that the heat of adsorption of CH4 by the coal body decreases gradually when the water content increases from 1.1% to 8.31%. The heat of adsorption decreases because the addition of H2O competes with CH4 for adsorption and H2O is more readily adsorbed in the coal.
Figure 7 shows the adsorption sites occupied by water molecules and methane molecules at 303 K under different water content conditions. The linear structure in the figure is a coal model, the red dot is the density distribution of CH4, and the green ball-and-stick structure is composed of H2O molecules. From the figure, it can be seen that the density distribution of CH4 in the crystalline cells is different under different water contents. With more water molecules, there is less CH4 adsorption, the red dotted distribution decreases, the gas density distribution in some positions decreases, and the gas distribution is close to the position of water molecules. This is because the number of adsorption sites on the surface of the coal body is certain, but there is competitive adsorption behavior between molecules. The gas with strong adsorption capacity can replace the gas with weak adsorption capacity and occupy the adsorption site, while the gas with weak adsorption capacity is desorbed [22,23]. H2O can better combine with the oxygen-containing functional groups in the coal, which is more conducive to the occupancy of the adsorption sites, and it has a repellent effect on CH4. Therefore, with the increase in water content, the CH4 adsorbed by the coal body gradually decreases.
In addition, during the coalification process, the short fat chains of coal molecules will be shed, and a large number of ultra-micro pores will be formed in the later stage. These pores provide a large specific surface area, which is the main space for the adsorption of gas molecules [24]. In order to better explore the effect of H2O on CH4 adsorption, H2O and CH4 were used as probe molecules to detect the pore structure of the unit cell. The molecular dynamics diameters of H2O and CH4 were 0.26 nm and 0.38 nm, respectively. Figure 8 shows the pores detected by probe molecules with different diameters, and the blue part represents the detected pores.
From the figure, it can be clearly seen that the pore distribution detected by the H2O probe molecules is denser and the free volume of the pore structure is larger. A larger free volume in the coal pore structure means that gas molecules have more freedom in the pore structure. This improves the chances of contact between gas molecules and the coal surface, which promotes the adsorption of gas molecules by the coal [25]. For H2O with smaller molecular dynamics diameters, it is easier to enter the pore structure of coal. The H2O that enters the pore structure first will take priority during adsorption and first adsorb on the surface structure of coal, thereby reducing the probability of CH4 adsorption.

3.3. Effect of Temperature and Water Content Coupling on Methane Adsorption Performance

3.3.1. Orthogonal Test Design

An orthogonal test was designed to simulate the effect of temperature and water content coupling on CH4 adsorption. The experimental design was carried out as a two-factor, nine-level orthogonal test, and the determined levels of each factor are shown in Table 3.
The two experimental factors, temperature and water content, and their corresponding levels were arranged sequentially without considering the interaction of individual factors. Based on the results of polar analysis, the effects on CH4 adsorption under different factors were plotted and the experimental factors were ranked in order of significance. The orthogonal table is shown in Table 4.

3.3.2. Analysis of Extreme Variance of Test Results

The polar analysis is shown in Table 5, where K is the sum of the experimental results corresponding to the influencing factors, k is the mean value of K, and R is the polar deviation of the factors. From the table, it can be seen that the effect of temperature on CH4 adsorption is more significant, and the best-optimized combination is a water content of 8.31% and a temperature of 363 K.
To consider the effect of combined water and temperature on CH4 adsorption, Equations (3) and (4) are synthesized to obtain the empirical Equation (5) for the coupled effect of water and temperature:
X O = X d 1.27 e 0.009 t 1 ( 1.05 + 0.12 w )
In the equation, Xo is the adsorption amount of coupling, mmol/g; Xd is the adsorption capacity of dry coal at room temperature, mmol/g; t is the temperature, °C; w is the water content of coal, %.
To verify the accuracy of the empirical equation, the simulated data were fitted with Equation (5) and the Langmuir equation, and the fitting parameters are shown in Table 6. From the table, it can be seen that the difference between the empirical equation and the limit adsorption amount of CH4 obtained by Langmuir is no more than 2.9%, and the empirical equations with the R2 ranging from 0.989 to 0.996 have a good fitting degree, detailed information is shown in Table 7.
The isothermal adsorption curve of CH4 under coupling is shown in Figure 9, from which it can be seen that the adsorption amount of CH4 increases gradually with the increase in pressure under the condition of a specific temperature and water content, indicating that the coupling will not change the overall trend of CH4 adsorption. When one of the variables of water content and temperature is fixed, the CH4 adsorption gradually decreases with the increase in the other variable. According to the fitted data, compared with the limiting CH4 adsorption amount at room temperature without water, the limiting CH4 adsorption amount of the optimal combination of single conditions decreased by 23.2% and 40.46%, respectively, while it decreased by 67.61% under the coupling effect, which indicates that the coupling of temperature and water content inhibits the adsorption of CH4 from the coal body more significantly.

3.4. Mechanism of Coupling Effect on CH4 Adsorption

The effect of different actions on CH4 adsorption can be obtained through analysis, as follows: coupling action > single temperature action > single water content action. First of all, the structure of the coal model is complex, containing a variety of functional groups. The structure of each functional group is different, with different intermolecular forces. The adsorption capacity of the gas is different, which will form adsorption sites with different adsorption capacities [26]. The interaction force between coal and H2O is stronger than that between coal and CH4, and H2O is easier to combine with oxygen-containing functional groups in coal, thus occupying adsorption sites. When the water content increases, more CH4 is displaced from the coal, which manifests as a decrease in adsorption. In addition, the molecular dynamics radius of H2O is smaller than that of CH4. H2O enters the coal and can detect a richer specific surface area. Part of the pore surface will be covered by H2O, resulting in the weakening of the adsorption of CH4 by coal and preventing CH4 from binding to the adsorption sites on the coal surface. Adsorption is an exothermic reaction, with increasing temperature inhibiting CH4 adsorption and decreasing temperature, promoting CH4 adsorption. When water content and temperature are coupled, the addition of temperature changes the average molecular kinetic energy of CH4, and CH4 is more susceptible to van der Waals forces, which increases the extent of CH4 adsorption effects on coal. The mechanism of the effect of coupling on CH4 adsorption is shown in Figure 10.

4. Conclusions

(1) The effect of coupled action on methane adsorption is significantly stronger than that of single action. The effect of different actions on CH4 adsorption: coupling action > single temperature action > single water content action. The optimal combination of the effects on methane adsorption was temperature 363 K and water content 8.31%, and the CH4 adsorption was reduced by 67.61% under the coupling effect compared with that of CH4 adsorption without water at room temperature.
(2) Considering the effects of temperature and water content comprehensively, the empirical equations for the effects of the coupling of the two on CH4 adsorption amount were obtained based on analyzing the correction coefficients of temperature and water content.
(3) Temperature has a negative effect on the adsorption of CH4. The adsorption of CH4 is an exothermic reaction. Temperature will change the average kinetic energy of CH4 molecules, thereby changing the adsorption of CH4. The absolute adsorption capacity of CH4 at low temperatures is significantly greater than that at high temperatures.
(4) The increase in water content has an inhibitory effect on the adsorption of CH4. An increase in H2O decreases the heat of adsorption. Water molecules can more easily occupy the advantageous adsorption sites due to their small kinetic diameter and structure, which is more favorable for combining with the coal molecule structure and entering the coal molecule. This reduces the adsorption of CH4 by coal.

Author Contributions

G.H. writing—original draft, data curation, and data analysis. Y.G. and J.C., review and editing, conception, methodology, and software. S.Z. and Z.L., data curation, investigation. All authors have read and agreed to the published version of the manuscript.

Funding

Project 52334007 supported by National Natural Science Foundation of China. Supported by Fundamental Research Program of Shanxi Province (202203021211160). Supported by Postgraduate Teaching Reform Project of Shanxi Province (2022YJJG039). The Research Project Supported by Shanxi Scholarship Council of China (2022-053, 2023-057).

Institutional Review Board Statement

Not applicable.

Informed Consent Statement

Not applicable.

Data Availability Statement

The data presented in this study are available on request from the corresponding author. The data are not publicly available due to privacy.

Conflicts of Interest

The authors declare no conflicts of interest.

References

  1. He, Z.; Zhang, W.; Kang, J.; Wu, J.; Wang, T. Coupling numerical simulation of competitive adsorption in the process of carbon dioxide displacement of coalbed methane. Min. Res. Dev. 2023, 43, 133–138. [Google Scholar]
  2. Fu, X.; Zang, X.; Wei, C. Review of research on testing simulation and prediction of coalbed methane content. J. China Univ. Min. Technol. 2021, 50, 13–31. [Google Scholar]
  3. Ren, Z.; Wu, T.; Gao, S. Microscopic adsorption pattern of methane in the nanopores of dark shales. Nat. Gas Geosci. 2022, 33, 1926–1935. [Google Scholar]
  4. Chen, L.; Huang, D.B.; Wang, S.Y.; Nie, Y.N.; He, Y.L.; Tao, W.Q. A study on dynamic desorption process of methane in slits. Energy 2019, 175, 1174–1180. [Google Scholar] [CrossRef]
  5. Li, S.; Zhou, Y.; Hu, B.; Qin, X.; Kong, X.; Bai, Y.; Zang, J. Structural characteristics of adsorption pores in low-rank coals and their effects on methane adsorption performance. Coal Geol. Explor. 2023, 51, 127–136. [Google Scholar]
  6. Feng, Z.; Zhao, D.; Zhao, Y. Experimental study on impact of water patio to adsorption of lump coal. Chin. J. Rock Mech. Eng. 2009, 28, 3291–3295. [Google Scholar]
  7. Qin, L.; Wang, P.; Lin, H.; Li, S.; Zhao, P.; Ma, C. Research on gas adsorption characteristics of coal after the action of low temperature liquid nitrogen. J. China Univ. Min. Technol. 2022, 51, 914–922. [Google Scholar]
  8. Li, X.; Xu, H. Feasibility analysis on MC simulation in coalbed methane adsorption and desorption. Coal Technol. 2010, 29, 84–86. [Google Scholar]
  9. Zheng, C.; Ma, D.; Chen, Y.; Ji, Y.; Wang, L.; Wang, X. Research micro effect of water on coalbed methane adsorption/desorption. Coal Sci. Technol. 2023, 51, 256–268. [Google Scholar]
  10. Li, B.; Li, J.; Yang, K.; Ren, C.; Xu, J.; Chen, S. On the mechanism of coal-bed methane adsorption and the water effects on account of its permeability. J. Saf. Environ. 2021, 21, 590–598. [Google Scholar]
  11. Li, X.; Chen, X.; Zheng, F.; Zhang, M.; Zhang, Q.; Jia, S. Energy calculation and simulation of methane adsorbed by coal with different metamorphic grades. ACS Omega 2020, 5, 14976–14986. [Google Scholar] [CrossRef] [PubMed]
  12. Zhang, T.; He, Y.; Yang, Y.; Wu, K. Molecular simulation of shale gas adsorption in organic-matter nanopores. Nat. Gas Geosci. 2017, 28, 146–155. [Google Scholar] [CrossRef]
  13. Yan, M.; Bai, Y.; Li, S.; Lin, H.; Yan, D.; Shu, C.M. Factors influencing the gas adsorption thermodynamic characteristics of low-rank coal. Fuel 2019, 248, 117–126. [Google Scholar] [CrossRef]
  14. Cai, T.T.; Feng, Z.C.; Jiang, Y.L.; Zhao, D. Thermodynamic characteristics of methane adsorption of coal with different initial gas pressures at different temperatures. Adv. Mater. Sci. Eng. 2019, 2019, 4751209. [Google Scholar] [CrossRef]
  15. GB/T 212-2008; Methods of Industrial Analysis of Coal. National Standard of the People’s Republic of China: Beijing, China, 2008.
  16. GB/T 8899-2013; Coal Micro Classification and Mineral Determination Methods. National Standard of the People’s Republic of China: Beijing, China, 2013.
  17. Cha, W. Study on the Microscopic Difference of Tectonic Coal in Pingdingshan Mining Area and the Construction of Bituminous Coal Organic Small Molecule Model. Master’s Thesis, China University of Mining and Technology, Xuzhou, China, 2020. [Google Scholar]
  18. Wang, L.; Wang, Z.; Li, X.; Yang, Y. Molecular Dynamics Mechanism of CH4 Diffusion Inhibition by Low Temperature in Anthracite Microcrystallites. ACS Omega 2020, 5, 23420–23428. [Google Scholar] [CrossRef]
  19. Yue, J.; Li, H.; Sun, Y.; Shao, X.; Li, Z.; Li, H. Study on adsorption properties of coal for methane and deuterated methane. Coal Sci. Technol. 2022, 50, 93–99. [Google Scholar]
  20. Chen, Y.; Ma, Z.; Ma, D.; Li, W.; Li, G.; Yang, F.; Zheng, C.; Teng, J.; Ji, Y. effects of wettability differences of different macroscopic composition of coal on methane adsorption and desorption. Coal Sci. Technol. 2021, 49, 47–55. [Google Scholar]
  21. Li, Z.; Bai, Y.; Yu, H.; Gao, Y. Molecular simulation of adsorption thermodynamic properties of CH4 and CO2 at different temperature and water content conditions. Saf. Coal Mines 2022, 53, 112–119. [Google Scholar]
  22. Lin, B.; Li, Y.; Yang, K.; Kong, J.; Zhang, X. Competitive adsorption mechanism of H2O and CH4 on coal surface. J. Xi’an Univ. Sci. Technol. 2018, 38, 878–885+918. [Google Scholar]
  23. Zhang, S.; Sang, S.; Yang, Z. Mechanism analysis on the effect of liquid water on coal adsorbing methane. J. China Univ. Min. Technol. 2009, 38, 707–712. [Google Scholar]
  24. Xing, F.; Xu, H.; Tang, D.; Yang, J.; Chen, Y.; Wang, M. Physical property evolution of low-rank coal reservoir and its influence on reservoir evaluation. J. Pet. Sci. 2022, 43, 637–647. [Google Scholar]
  25. Xiang, J.; Zeng, F.; Liang, H.; Li, B.; Song, X. Molecular simulation of the CH4/CO2/H2O adsorption onto the molecular structure of coal. Sci. China Earth Sci. 2014, 44, 1418–1428. [Google Scholar] [CrossRef]
  26. Nie, B.; He, X.; Wang, E.; Zhang, L. Micro-Mechanism of coal adsorbing water. J. China Univ. Min. Technol. 2004, 33, 17–21. [Google Scholar]
Figure 1. Coal model construction: (a) Coal model; (b) lowest energy configuration; (c) coal structure unit cell.
Applsci 14 08757 g001
Figure 2. Temperature correction coefficient vs. temperature.
Applsci 14 08757 g002
Figure 3. Methane adsorption capacity and heat adsorption heat at different temperatures: (a) Isothermal adsorption curves of CH4 at different temperatures; (b) CH4 adsorption heat at different temperatures.
Applsci 14 08757 g003
Figure 4. Molecular structure models with different water content (a) 0% H2O (b) 1.1% H2O (c) 4.27% H2O (d) 8.31% H2O.
Applsci 14 08757 g004
Figure 5. 1/ηw with water content curve.
Applsci 14 08757 g005
Figure 6. Methane adsorption capacity and heat adsorption heat with different water content: (a) Isothermal adsorption curves of CH4 with different water content; (b) adsorption heat of CH4 with different water content.
Applsci 14 08757 g006
Figure 7. Methane adsorption sites with different waters: (a) 0%H2O; (b) 1.1%H2O; (c) 4.35%H2O; (d) 8.31%H2O.
Applsci 14 08757 g007
Figure 8. The porosity of probe molecules with different diameters (a) with the diameter of (H2O) as 0.26 nm (b) with the diameter of (CH4) as 0.38 nm.
Applsci 14 08757 g008
Figure 9. CH4 isothermal adsorption curve under coupling: (a) 1.1%H2O; (b) 4.27%H2O; (c) 8.31%H2O.
Applsci 14 08757 g009
Figure 10. Mechanism of influence of coupling on CH4 adsorption.
Applsci 14 08757 g010
Table 1. Analysis of coal sample components.
Coal SampleMaximum Vitrinite Reflectance/
%
Water/%Ash/%Volatiles/%Fixed Carbon/%
PM1.904.659.9313.2672.16
Table 2. The fitting parameters of the Langmuir equation with different water content.
Water Contenta/(mmol/g)b/MPa−1R2
0%3.880.100.995
1.1%3.290.230.991
4.27%2.790.220.994
8.31%2.310.260.992
Table 3. Experimental factors and levels.
NumberingExperiment Factor
Temperature/KWater Content/%
12231.10
22434.27
32638.31
4313-
5343-
6363-
Table 4. Orthogonal table.
NumberingExperiment Factor
Factor 1 (Water Content)Factor 2 (Temperature)
111
232
323
434
515
626
736
825
921
1012
1114
1233
1324
1413
1535
1616
1722
1831
Table 5. Range analysis.
ItemLevelFactor 1 (Water Content)Factor 2 (Temperature)
K18.525.57
28.025.25
37.104.54
4-3.15
5-2.65
6-2.47
k11.421.86
21.341.75
31.181.51
4-1.05
5-0.88
6-0.82
R0.241.03
Table 6. Coupling effect Langmuir equation fitting parameters.
Temperature (K)a/(mmol/g)b/MPa−1
0.00%(L/J) *1.10% (L/J)4.27%(L/J)8.31% (L/J)0.00% (L/J)1.10% (L/J)4.27% (L/J)8.31% (L/J)
223.005.35/5.334.63/4.533.99/3.943.35/3.330.09/0.070.10/0.090.11/0.120.15/0.14
243.004.07/4.153.95/3.973.56/3.623.20/3.240.11/0.110.15/0.140.16/0.150.13/0.15
263.004.03/3.993.66/3.723.01/3.002.60/2.590.16/0.150.14/0.120.18/0.170.24/0.23
303.003.88/3.863.29/3.202.79/2.692.31/2.300.10/0.120.23/0.250.22/0.220.26/0.28
313.003.57/3.472.98/2.902.64/2.662.14/2.160.11/0.100.15/0.170.19/0.160.17/0.15
343.003.46/3.392.61/2.602.30/2.341.55/1.590.19/0.180.23/0.270.22/0.210.25/0.25
363.002.98/2.992.37/2.341.69/1.681.24/1.250.22/0.200.38/0.360.30/0.290.39/0.37
* L is the Langmuir equation fitting, and J is the value obtained by the empirical formula fitting.
Table 7. R2 after fitting the Langmuir equation with coupled effects.
Coupling EffectR2
223.00 K + 1.10%0.96847
223.00 K + 4.27%0.74753
223.00 K + 8.31%0.97558
243.00 K + 1.10%0.99894
243.00 K + 4.27%0.95586
243.00 K + 8.31%0.997
263.00 K + 1.10%0.99463
263.00 K + 4.27%0.99487
263.00 K + 8.31%0.99952
313.00 K + 1.10%0.96832
313.00 K + 4.27%0.98273
313.00 K + 8.31%0.99609
343.00 K + 1.10%0.92212
343.00 K + 4.27%0.99146
343.00 K + 8.31%0.99261
363.00 K + 1.10%0.93762
363.00 K + 4.27%0.97839
363.00 K + 8.31%0.99352
Disclaimer/Publisher’s Note: The statements, opinions and data contained in all publications are solely those of the individual author(s) and contributor(s) and not of MDPI and/or the editor(s). MDPI and/or the editor(s) disclaim responsibility for any injury to people or property resulting from any ideas, methods, instructions or products referred to in the content.

