
DCW-YOLO: An Improved Method for Surface Damage Detection of Wind Turbine Blades


Abstract
:1. Introduction
- (1)
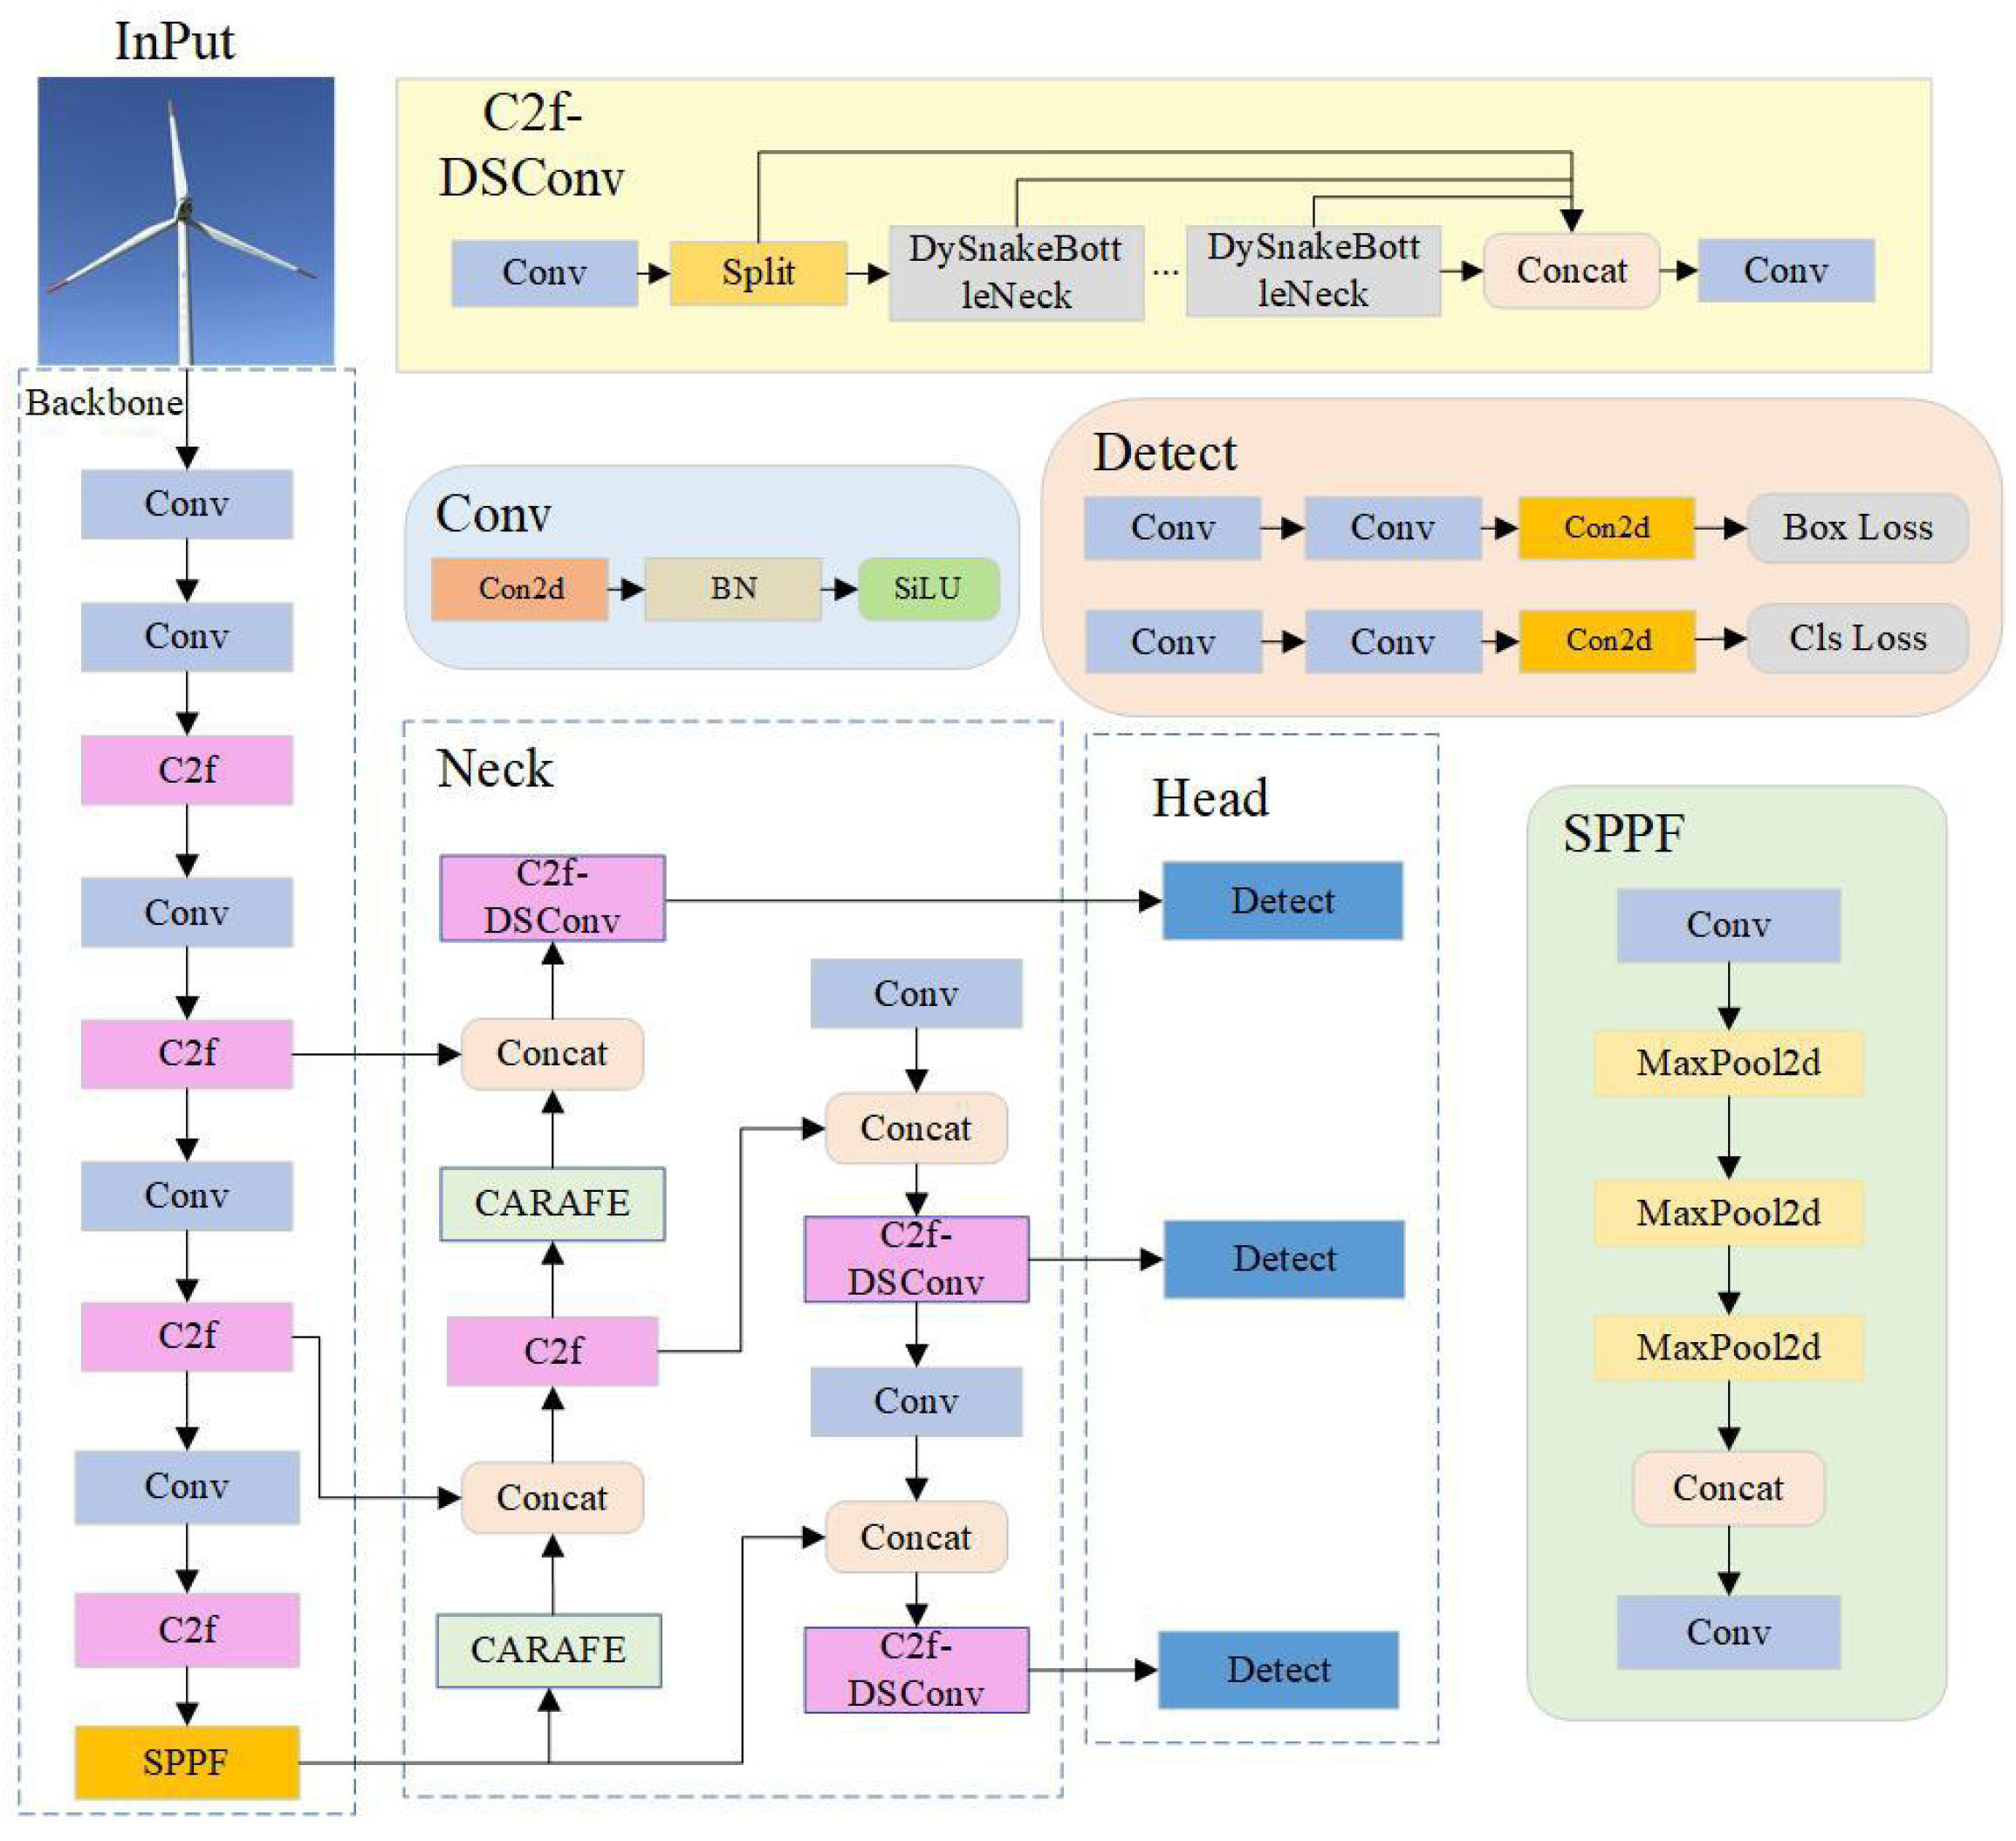
- In the C2F module, we have incorporated DSConv, enabling the model to better focus on the geometric structures within WTB images, thus enhancing the accuracy of detecting small-area damages and intricate cracks.
- (2)
- Replacing the upsampling method with CARAFE effectively reduces the loss of image feature information during the upsampling process, enhancing the feature extraction capability of the feature enhancement network.
- (3)
- The loss function is optimized by the WIoUV3 strategy. This strategy enables more accurate regression of target bounding boxes, rendering them more reliable in scenarios of WTBs damage localization.
2. Related Work
2.1. Conventional Approaches
2.2. Deep Learning Methods
3. Methodology
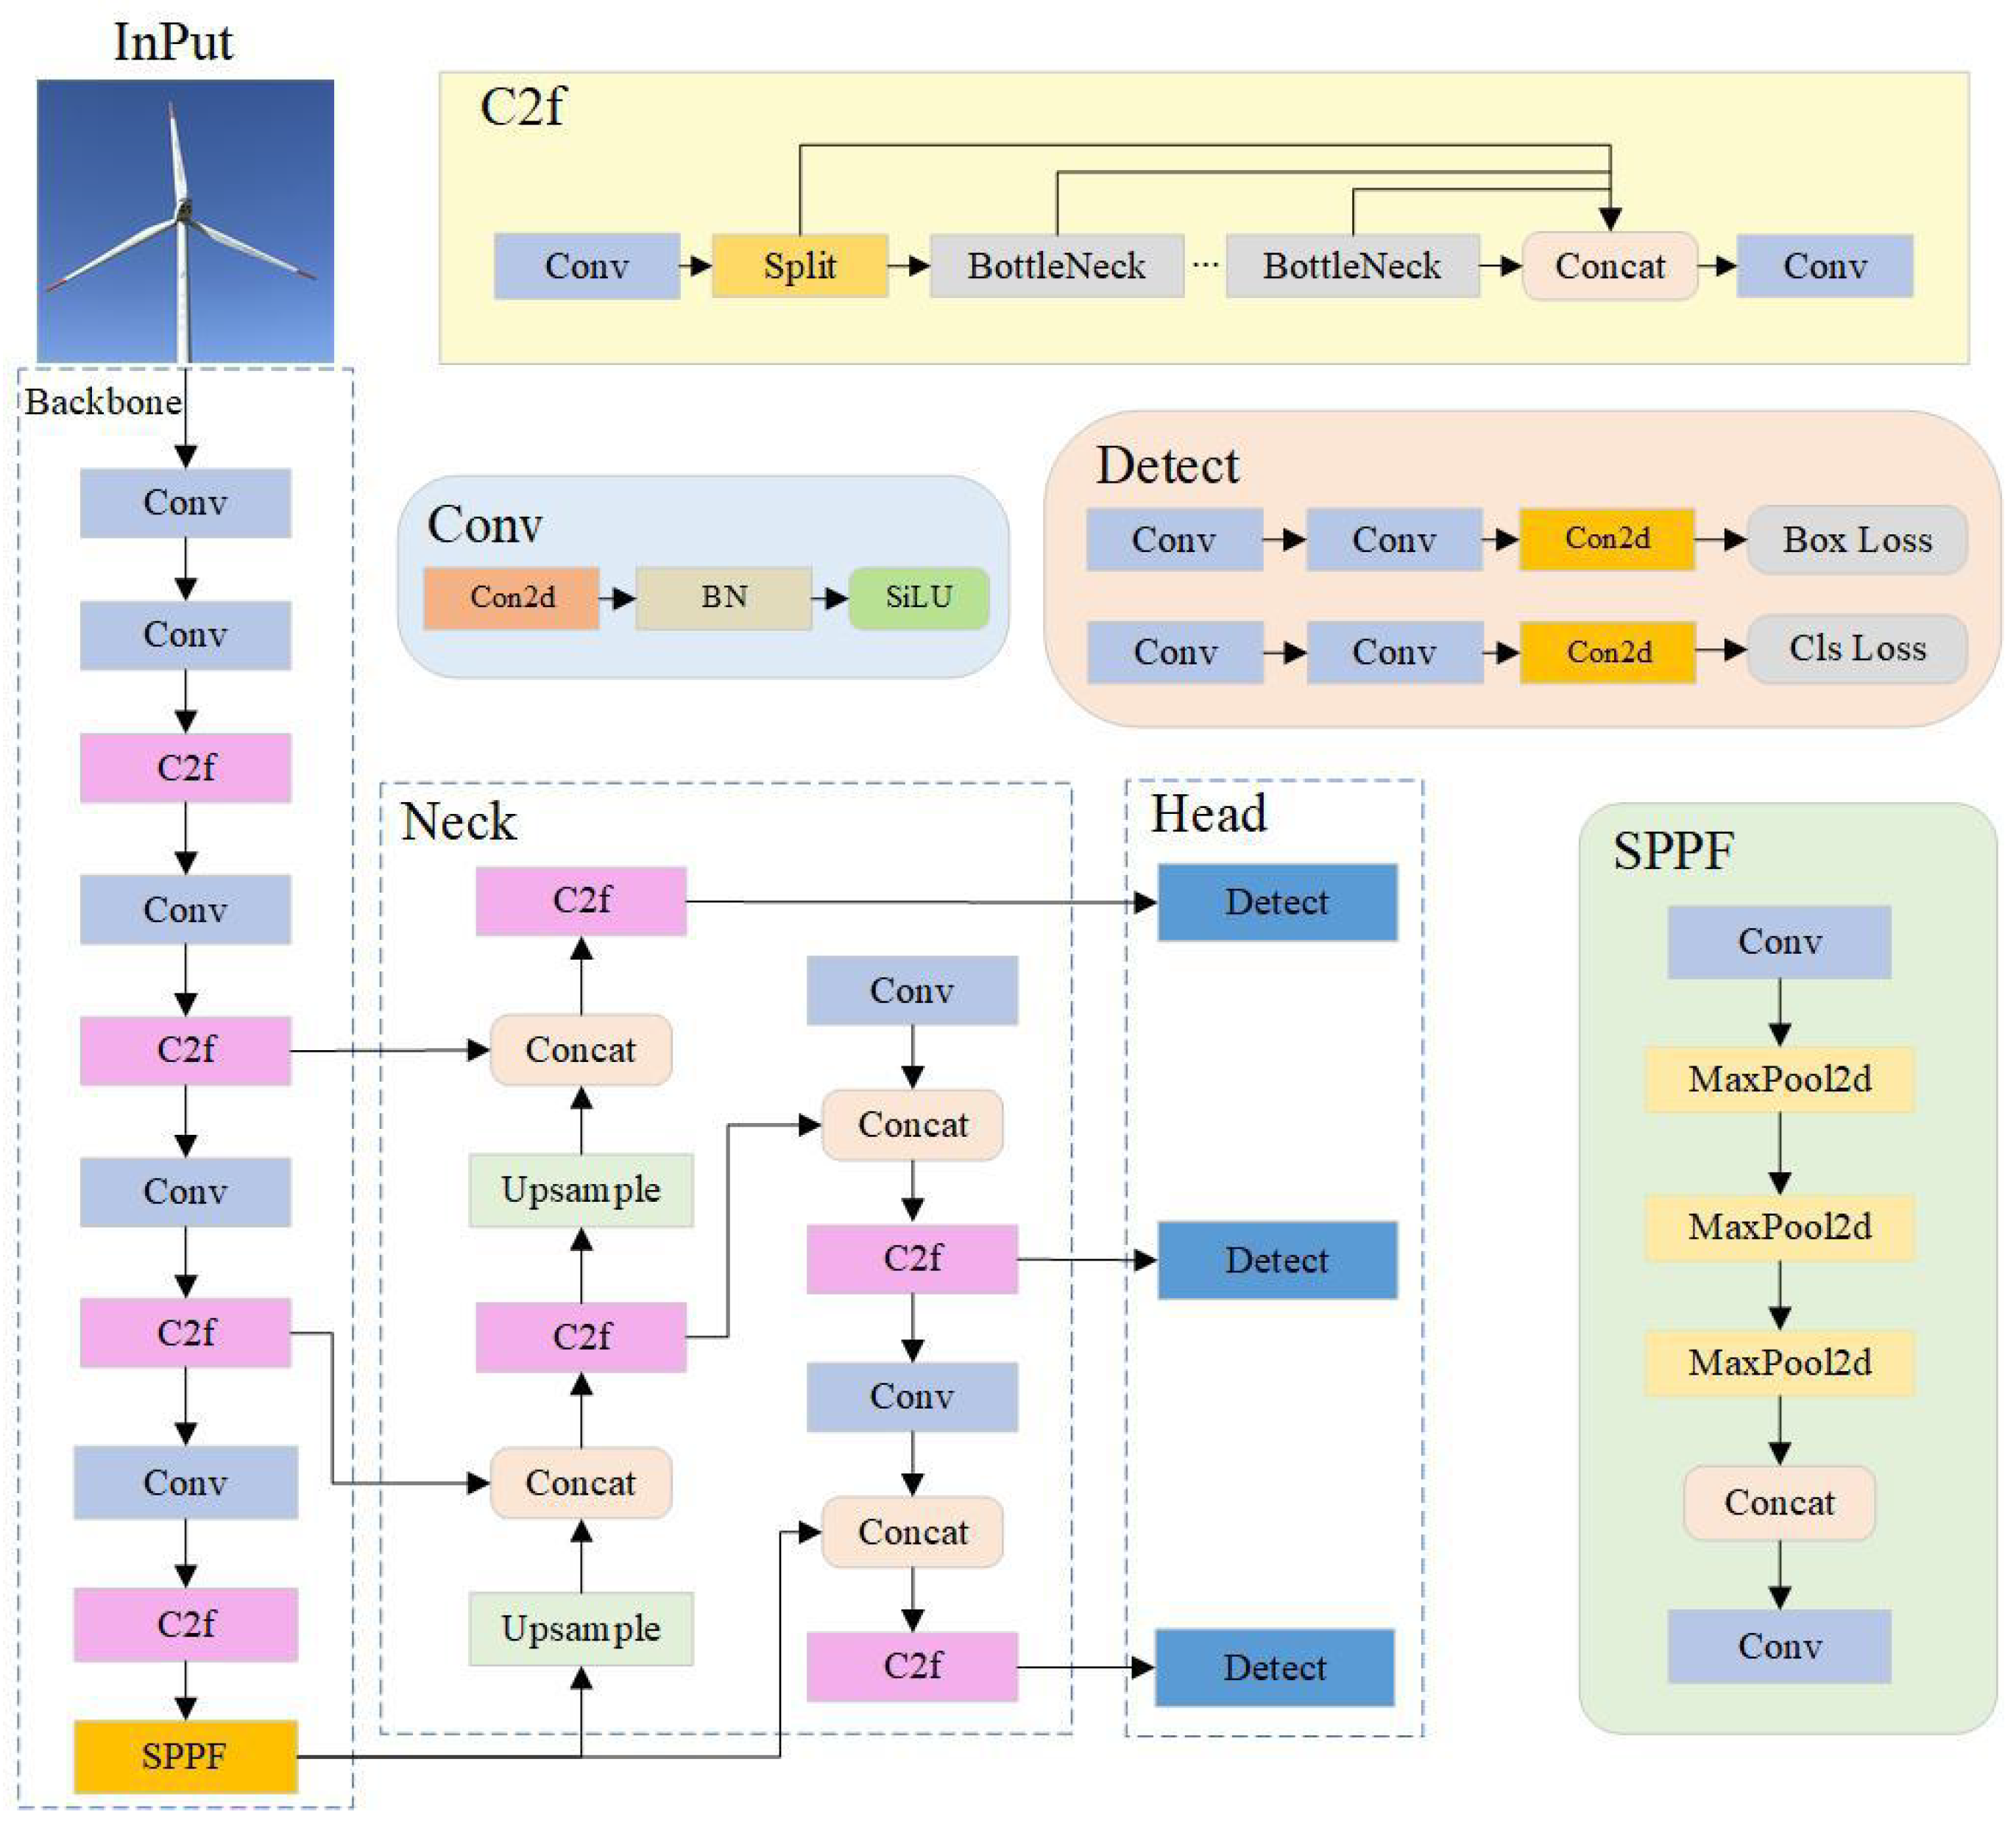
3.1. YOLO Algorithm
3.2. DCW-YOLO Algorithm
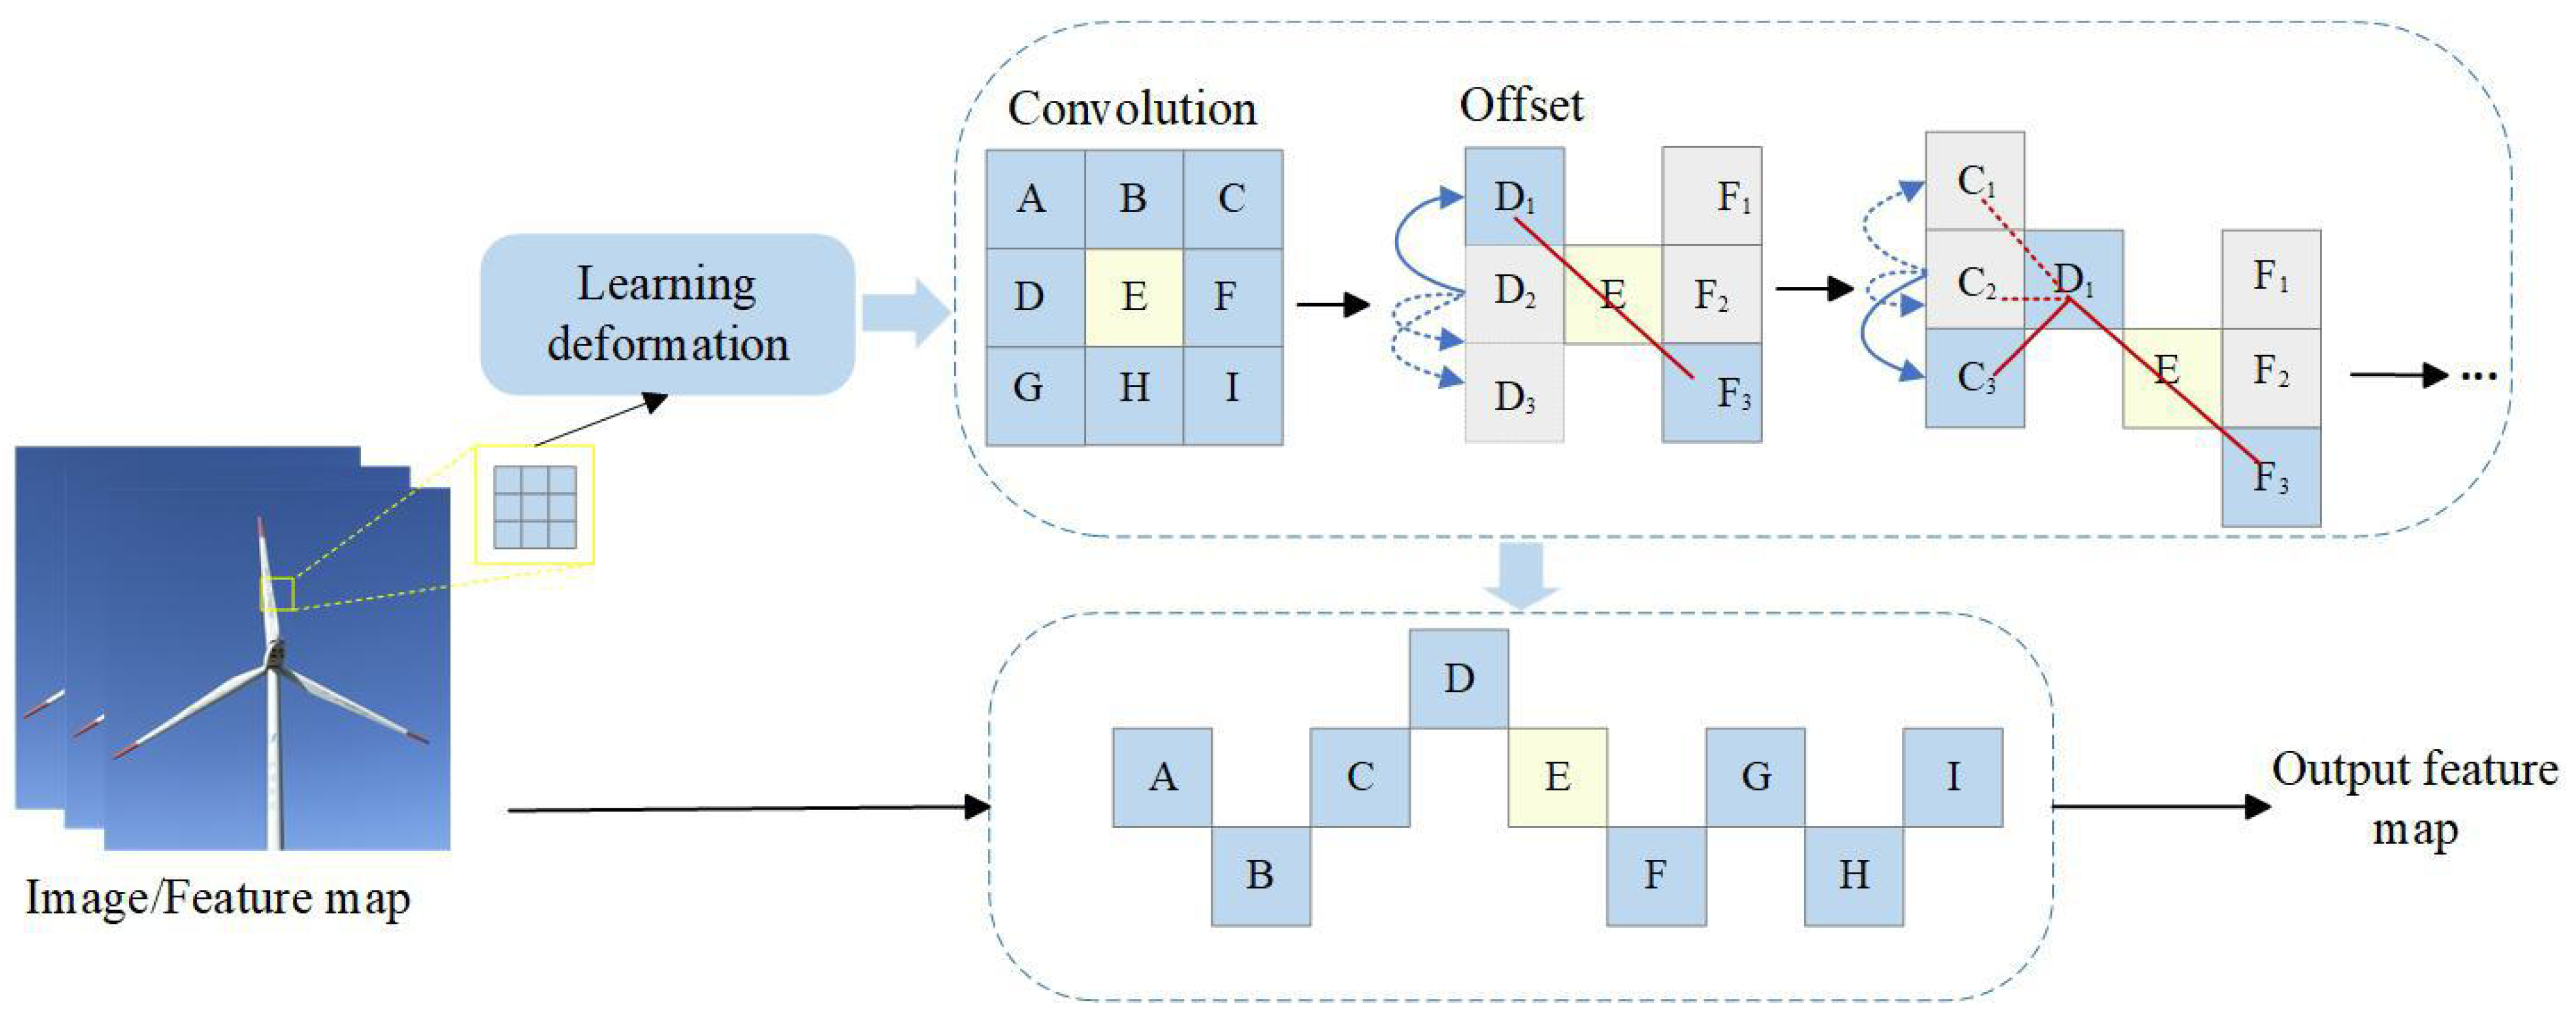
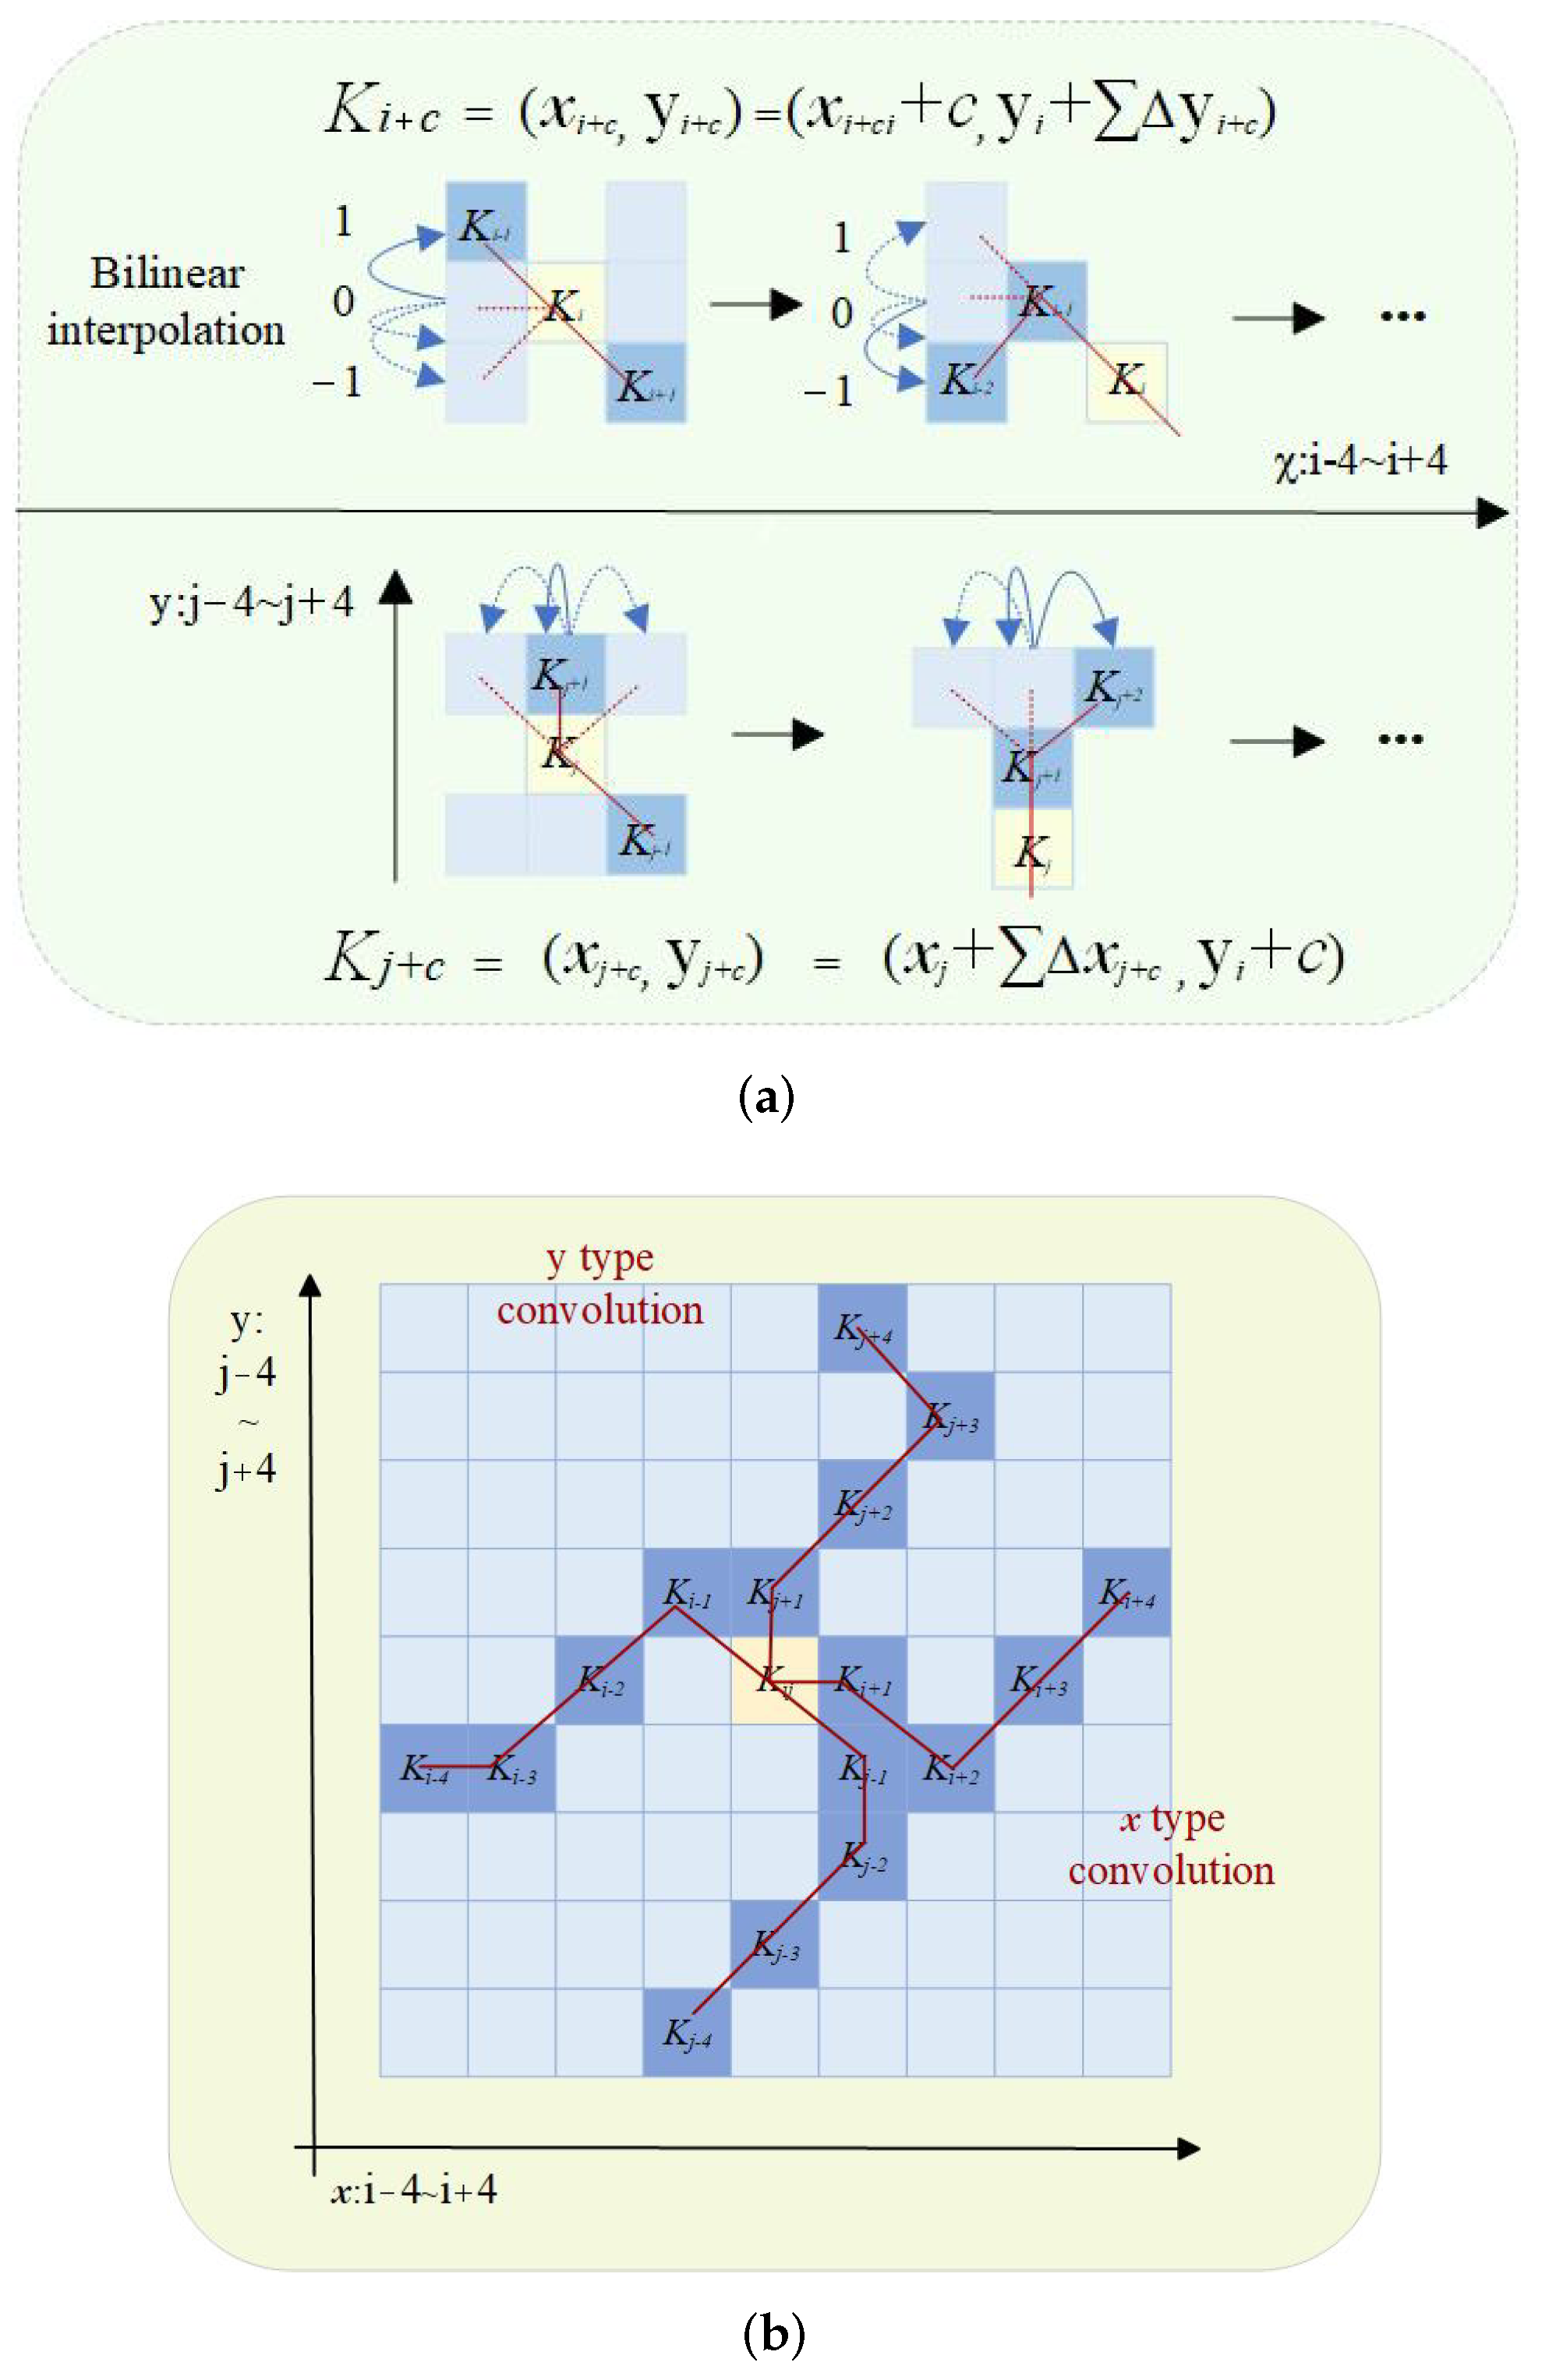
3.2.1. DSConv
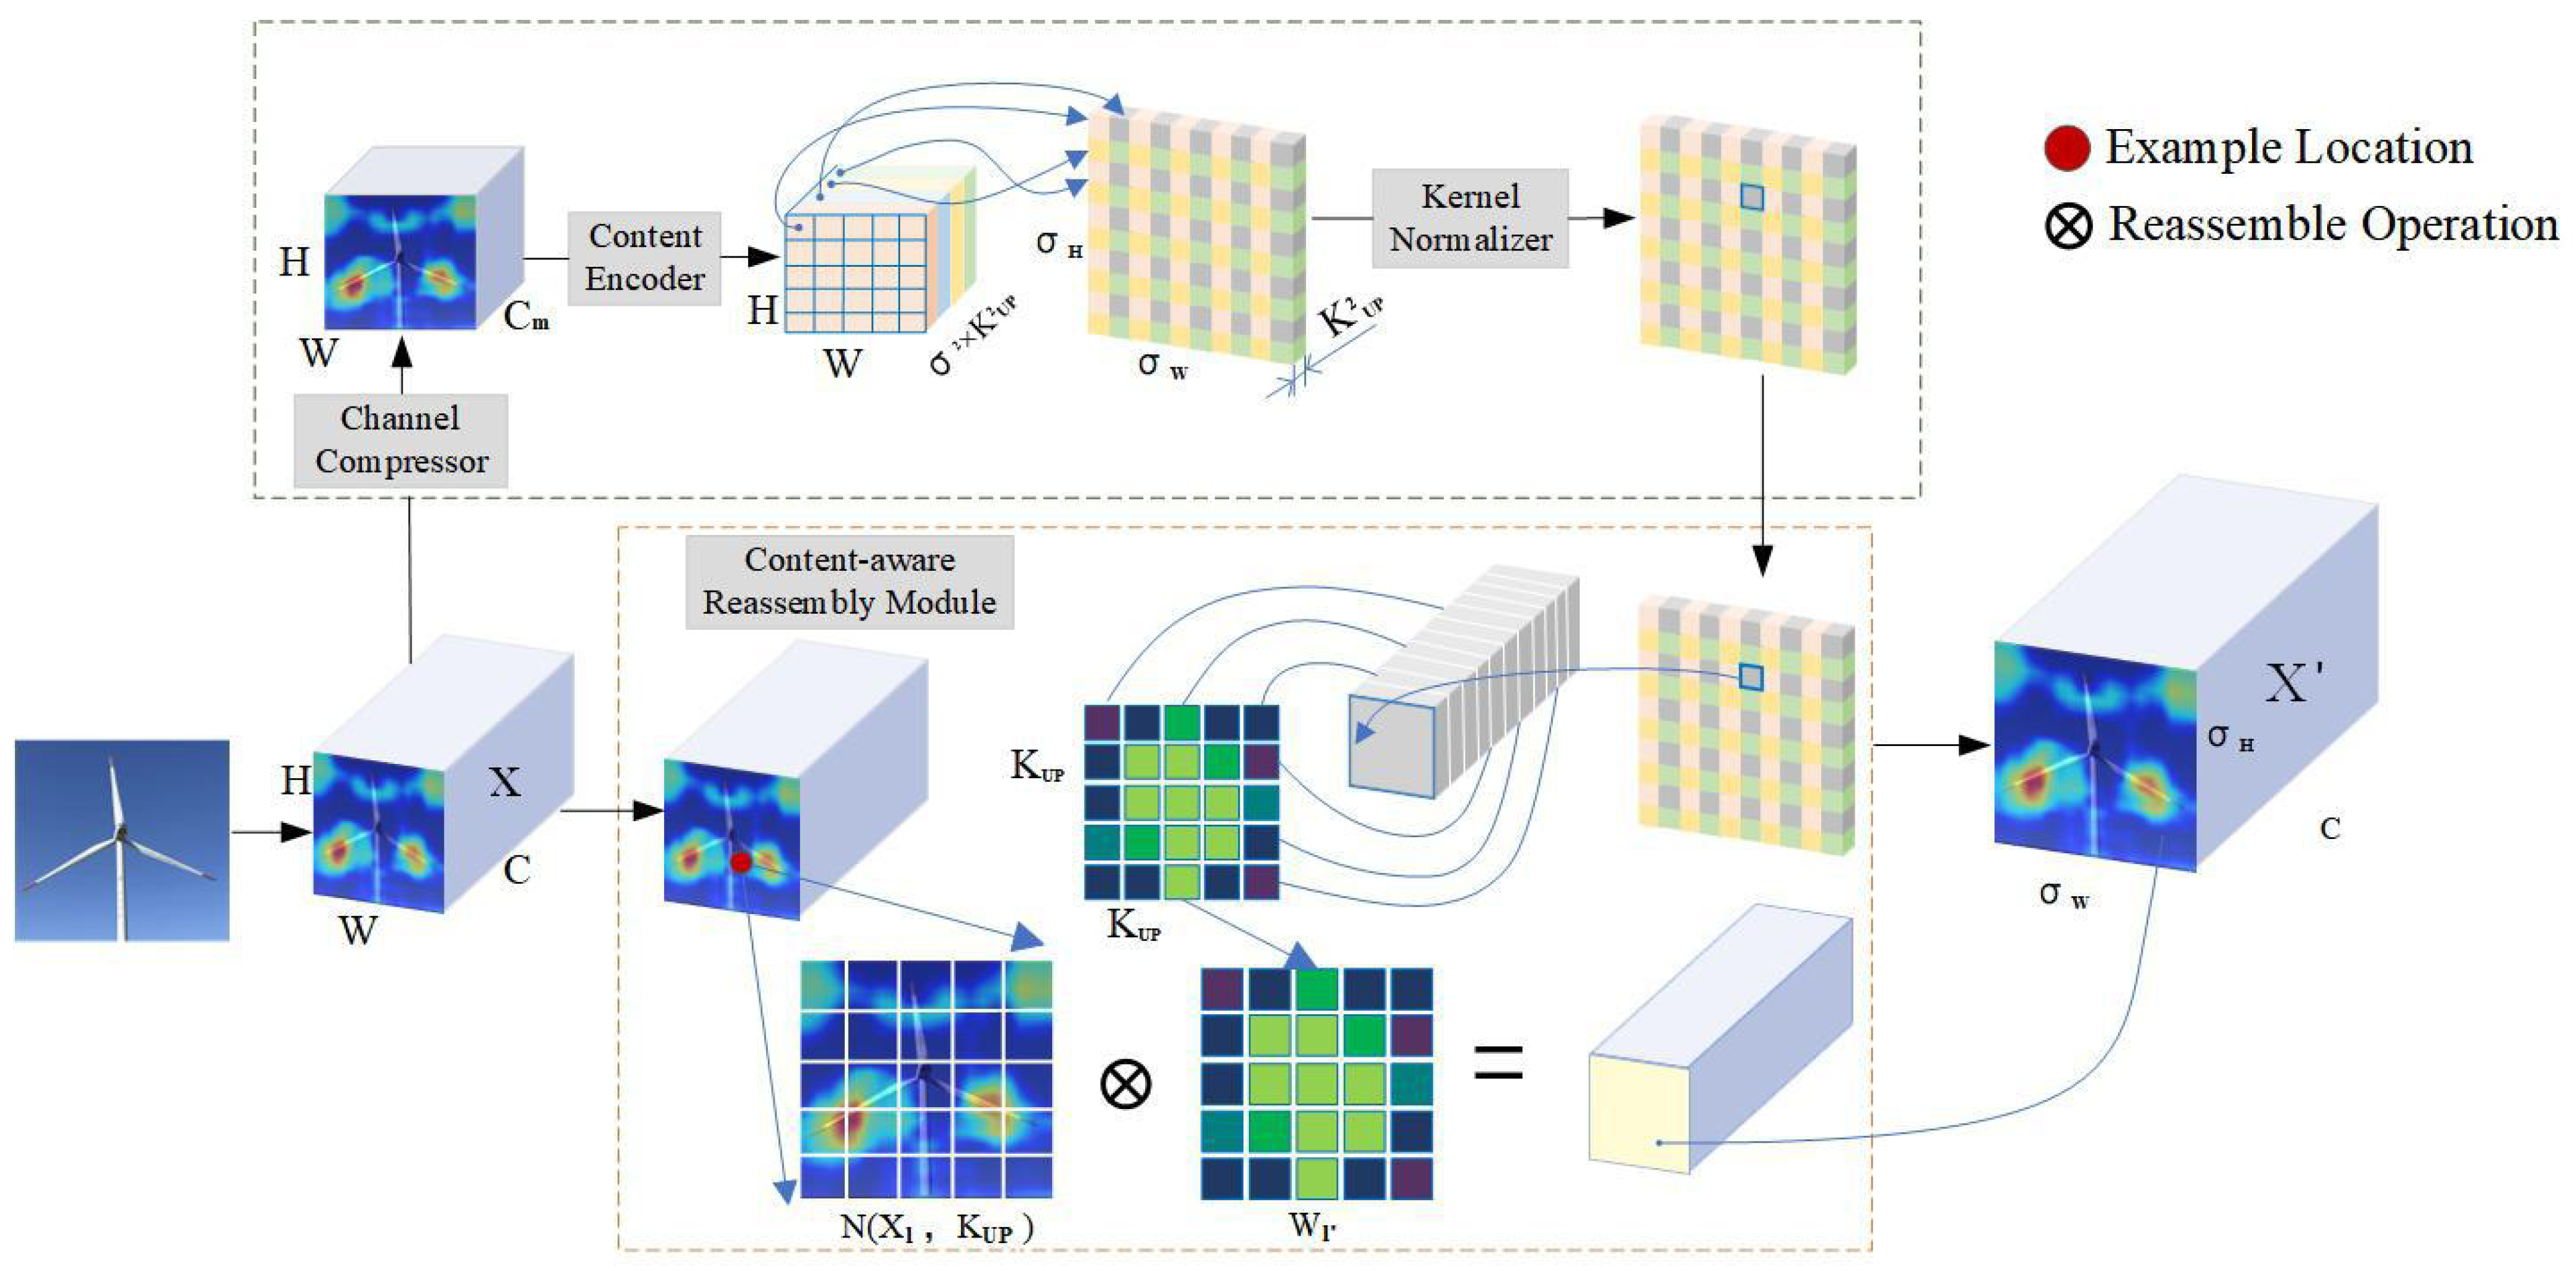
3.2.2. CARAFE
3.2.3. Improved Loss Function
4. Experiment
4.1. Data Collection and Preparation
4.2. Evaluation Metrics
4.3. Results and Analysis
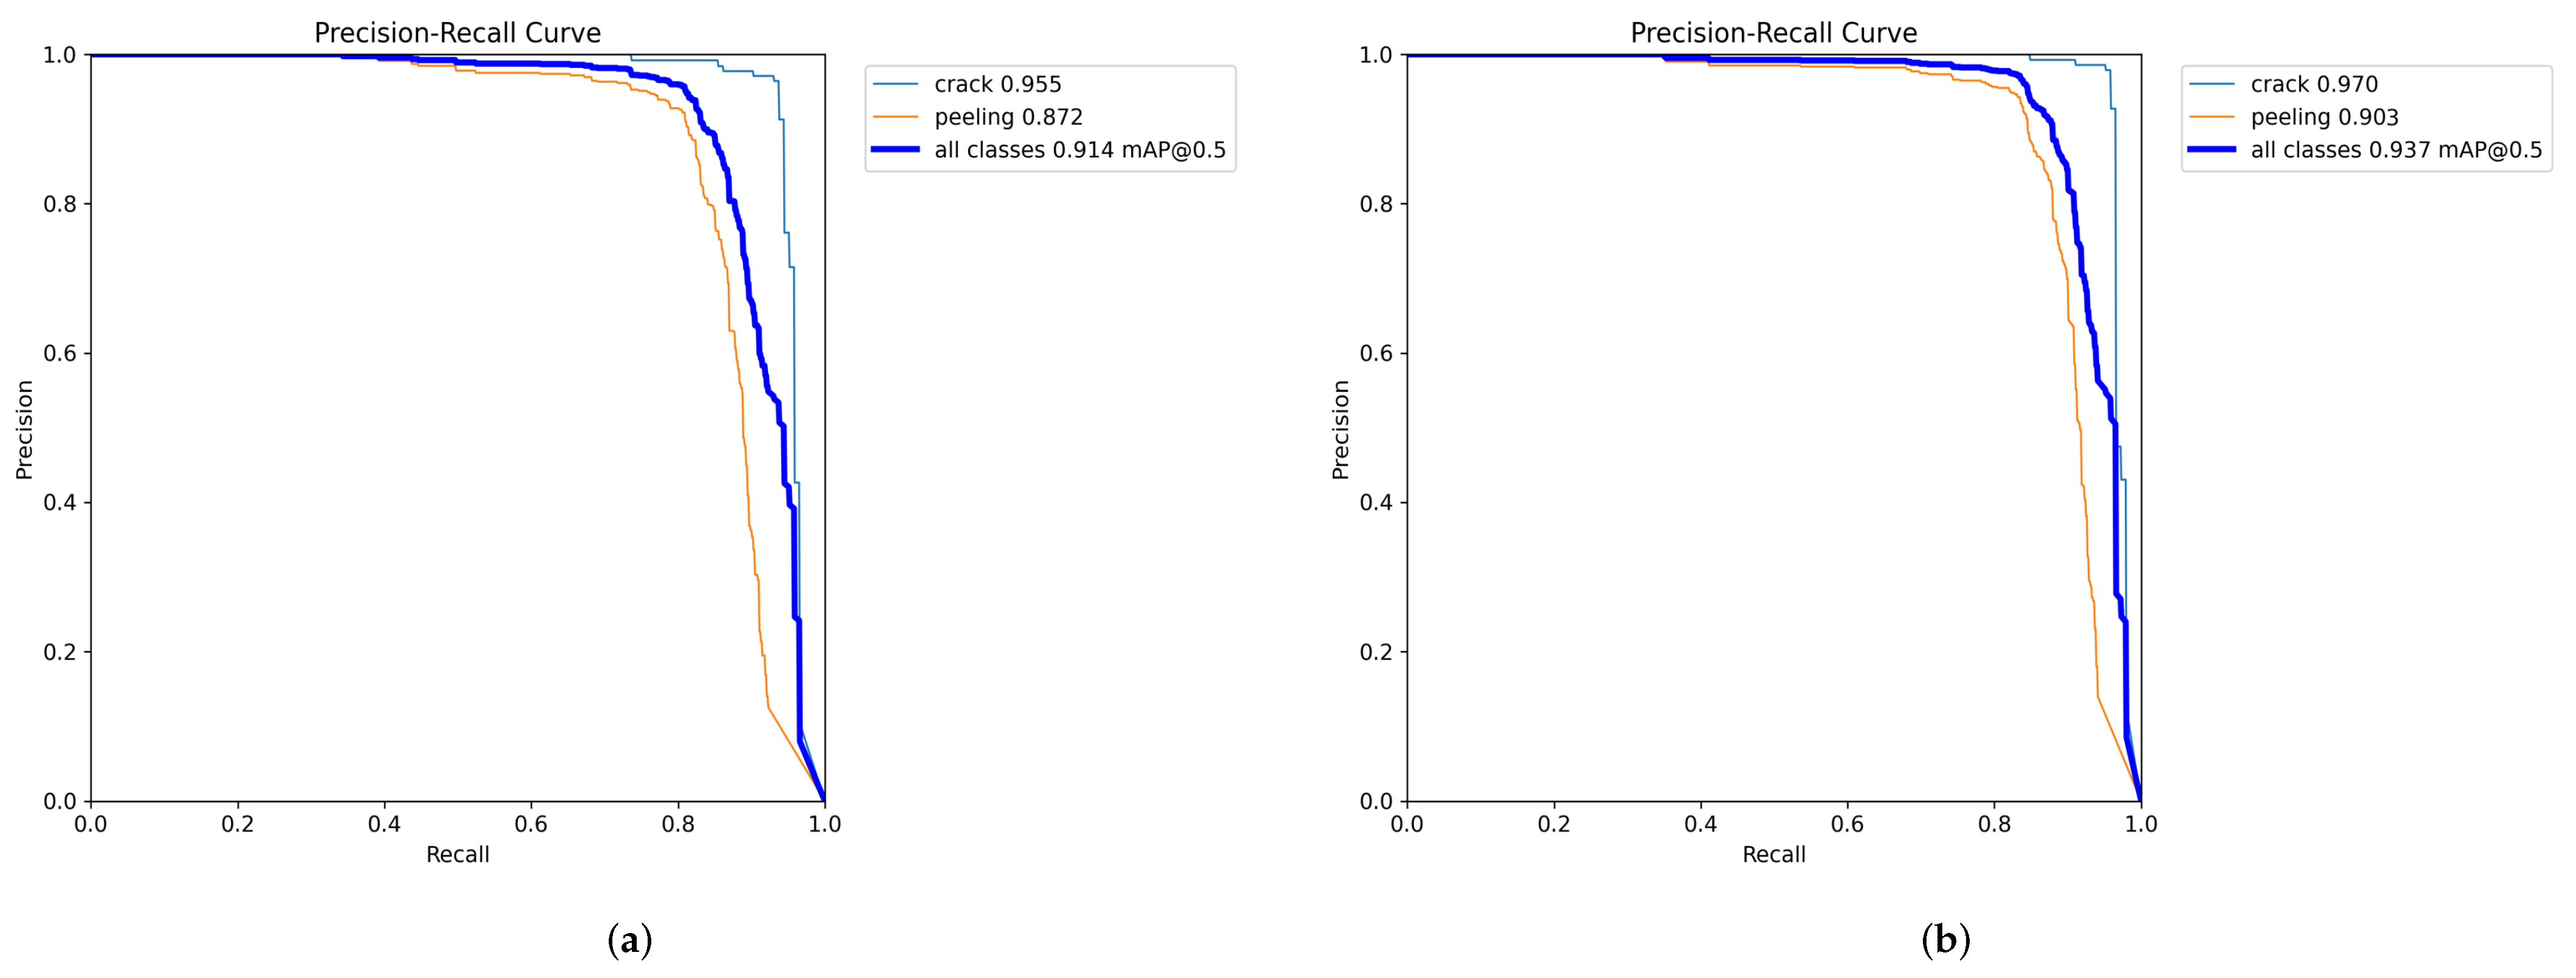
4.3.1. Ablation Experiment
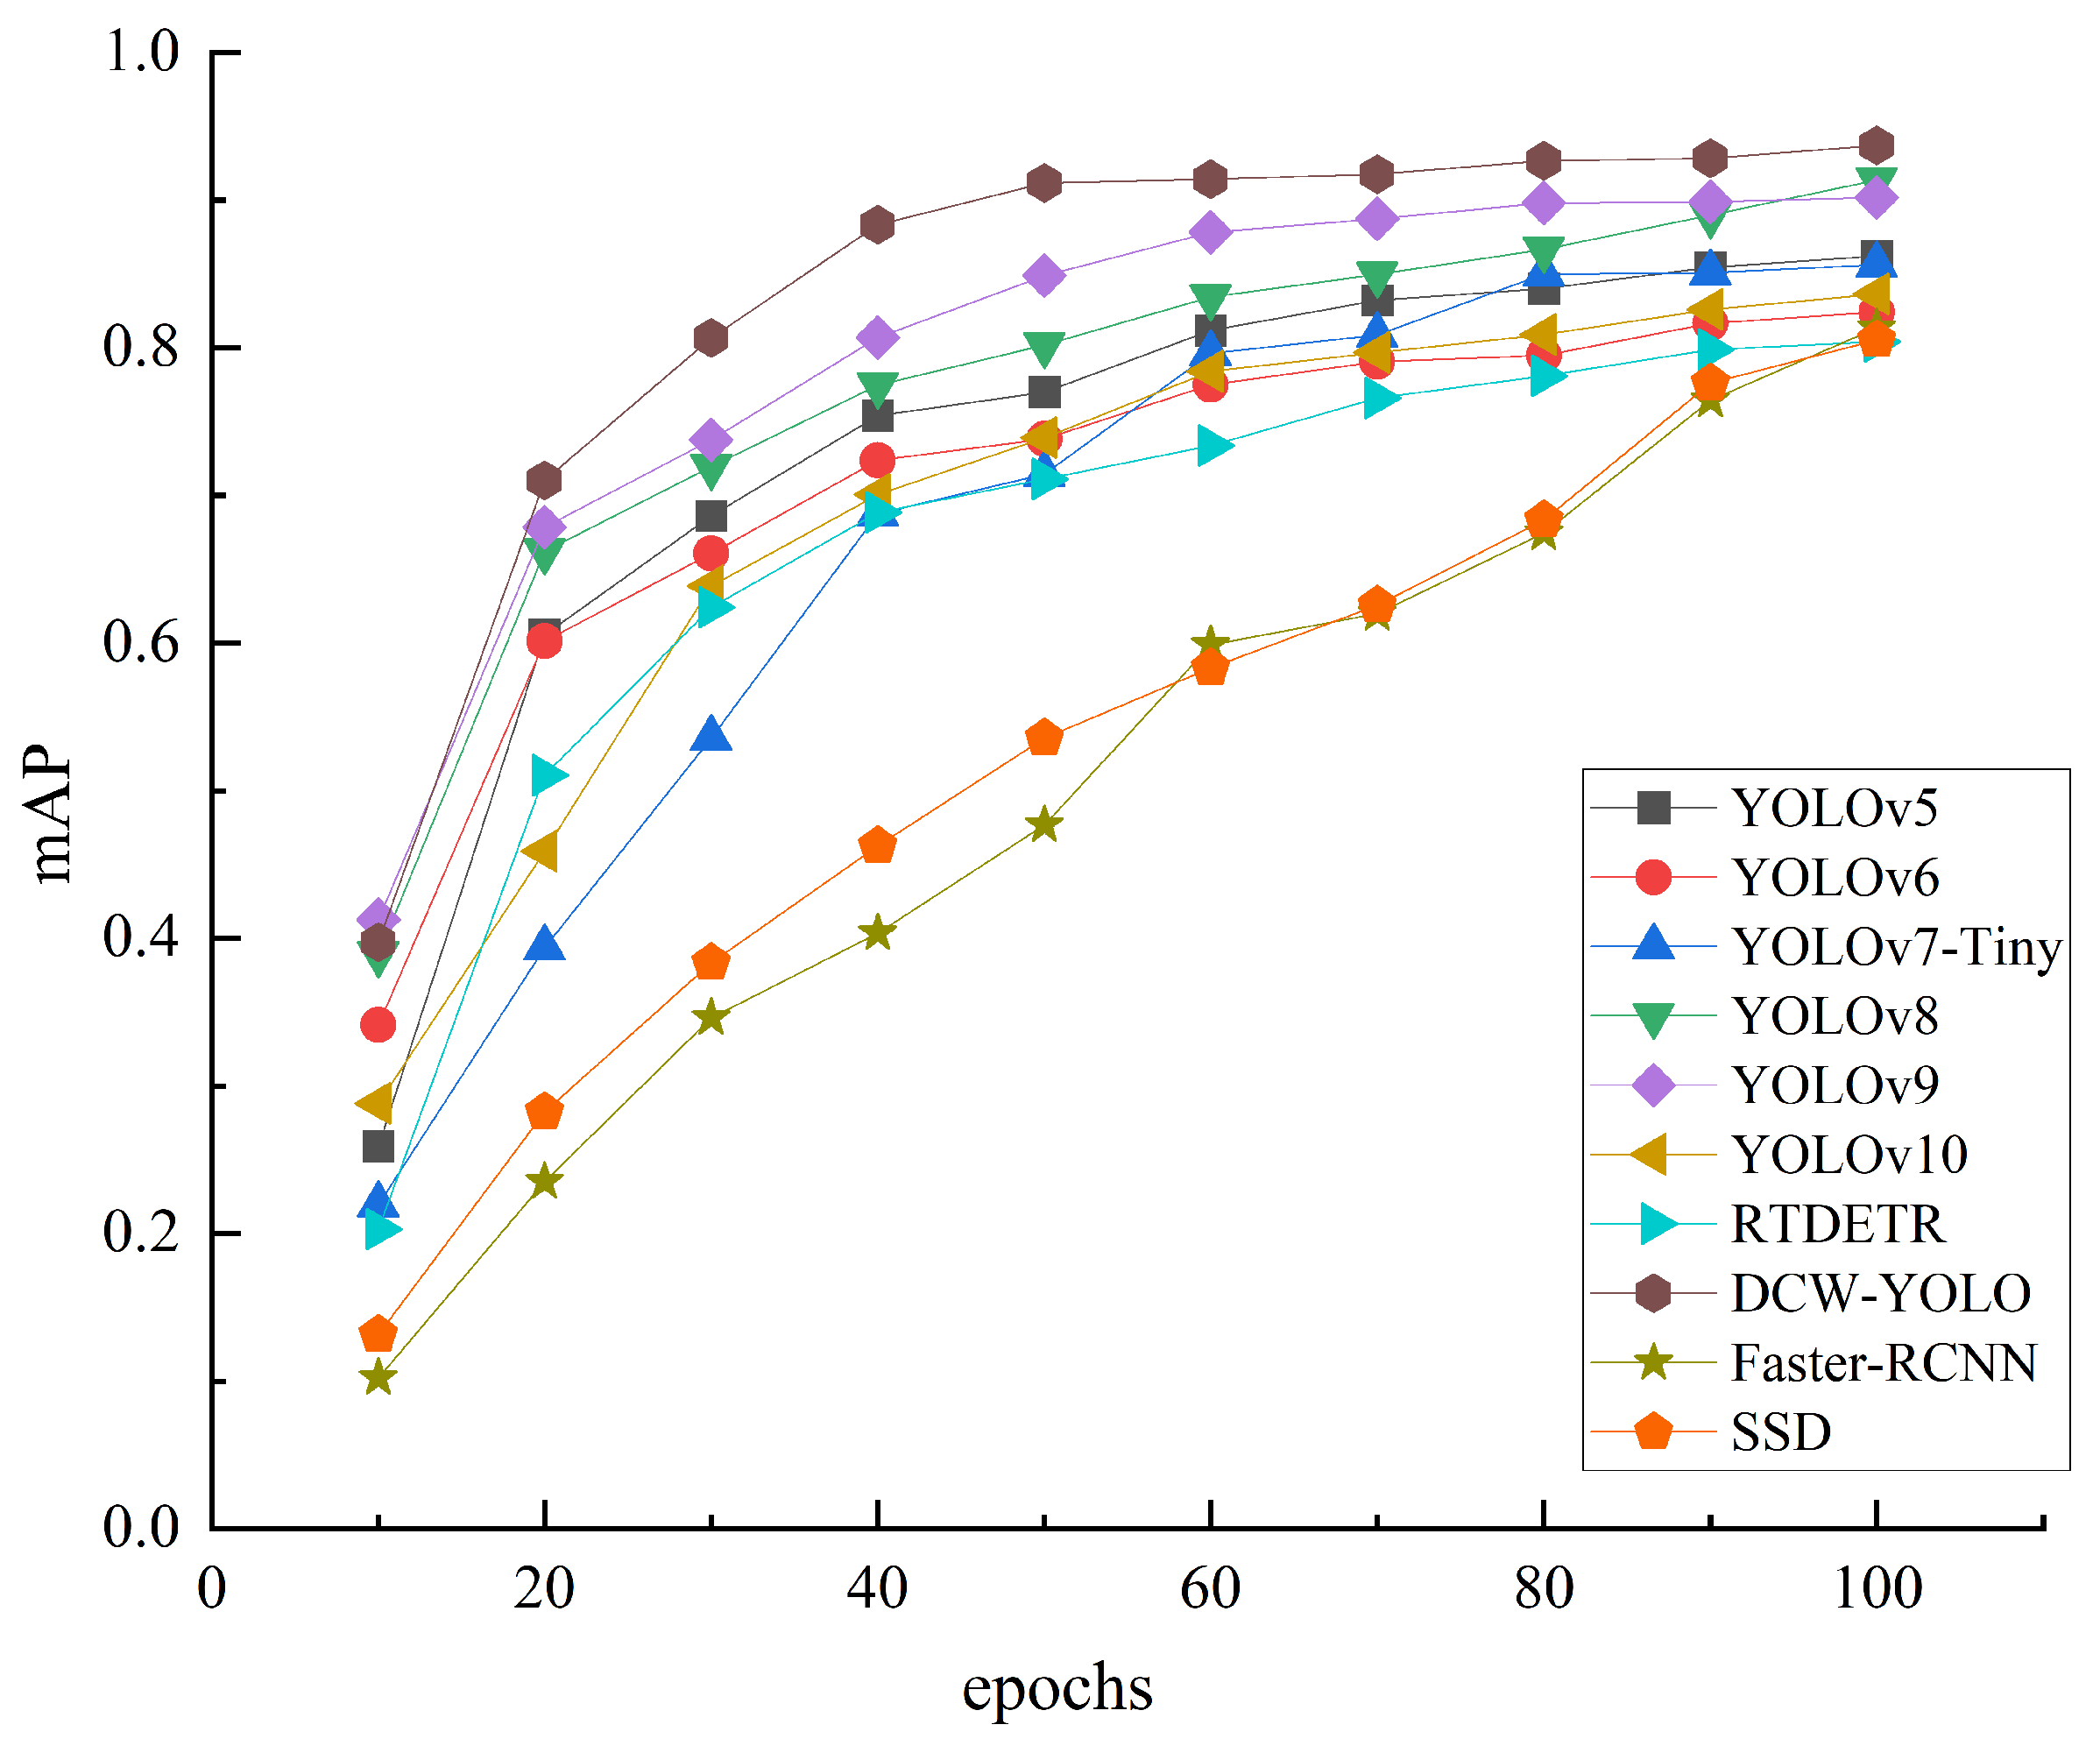
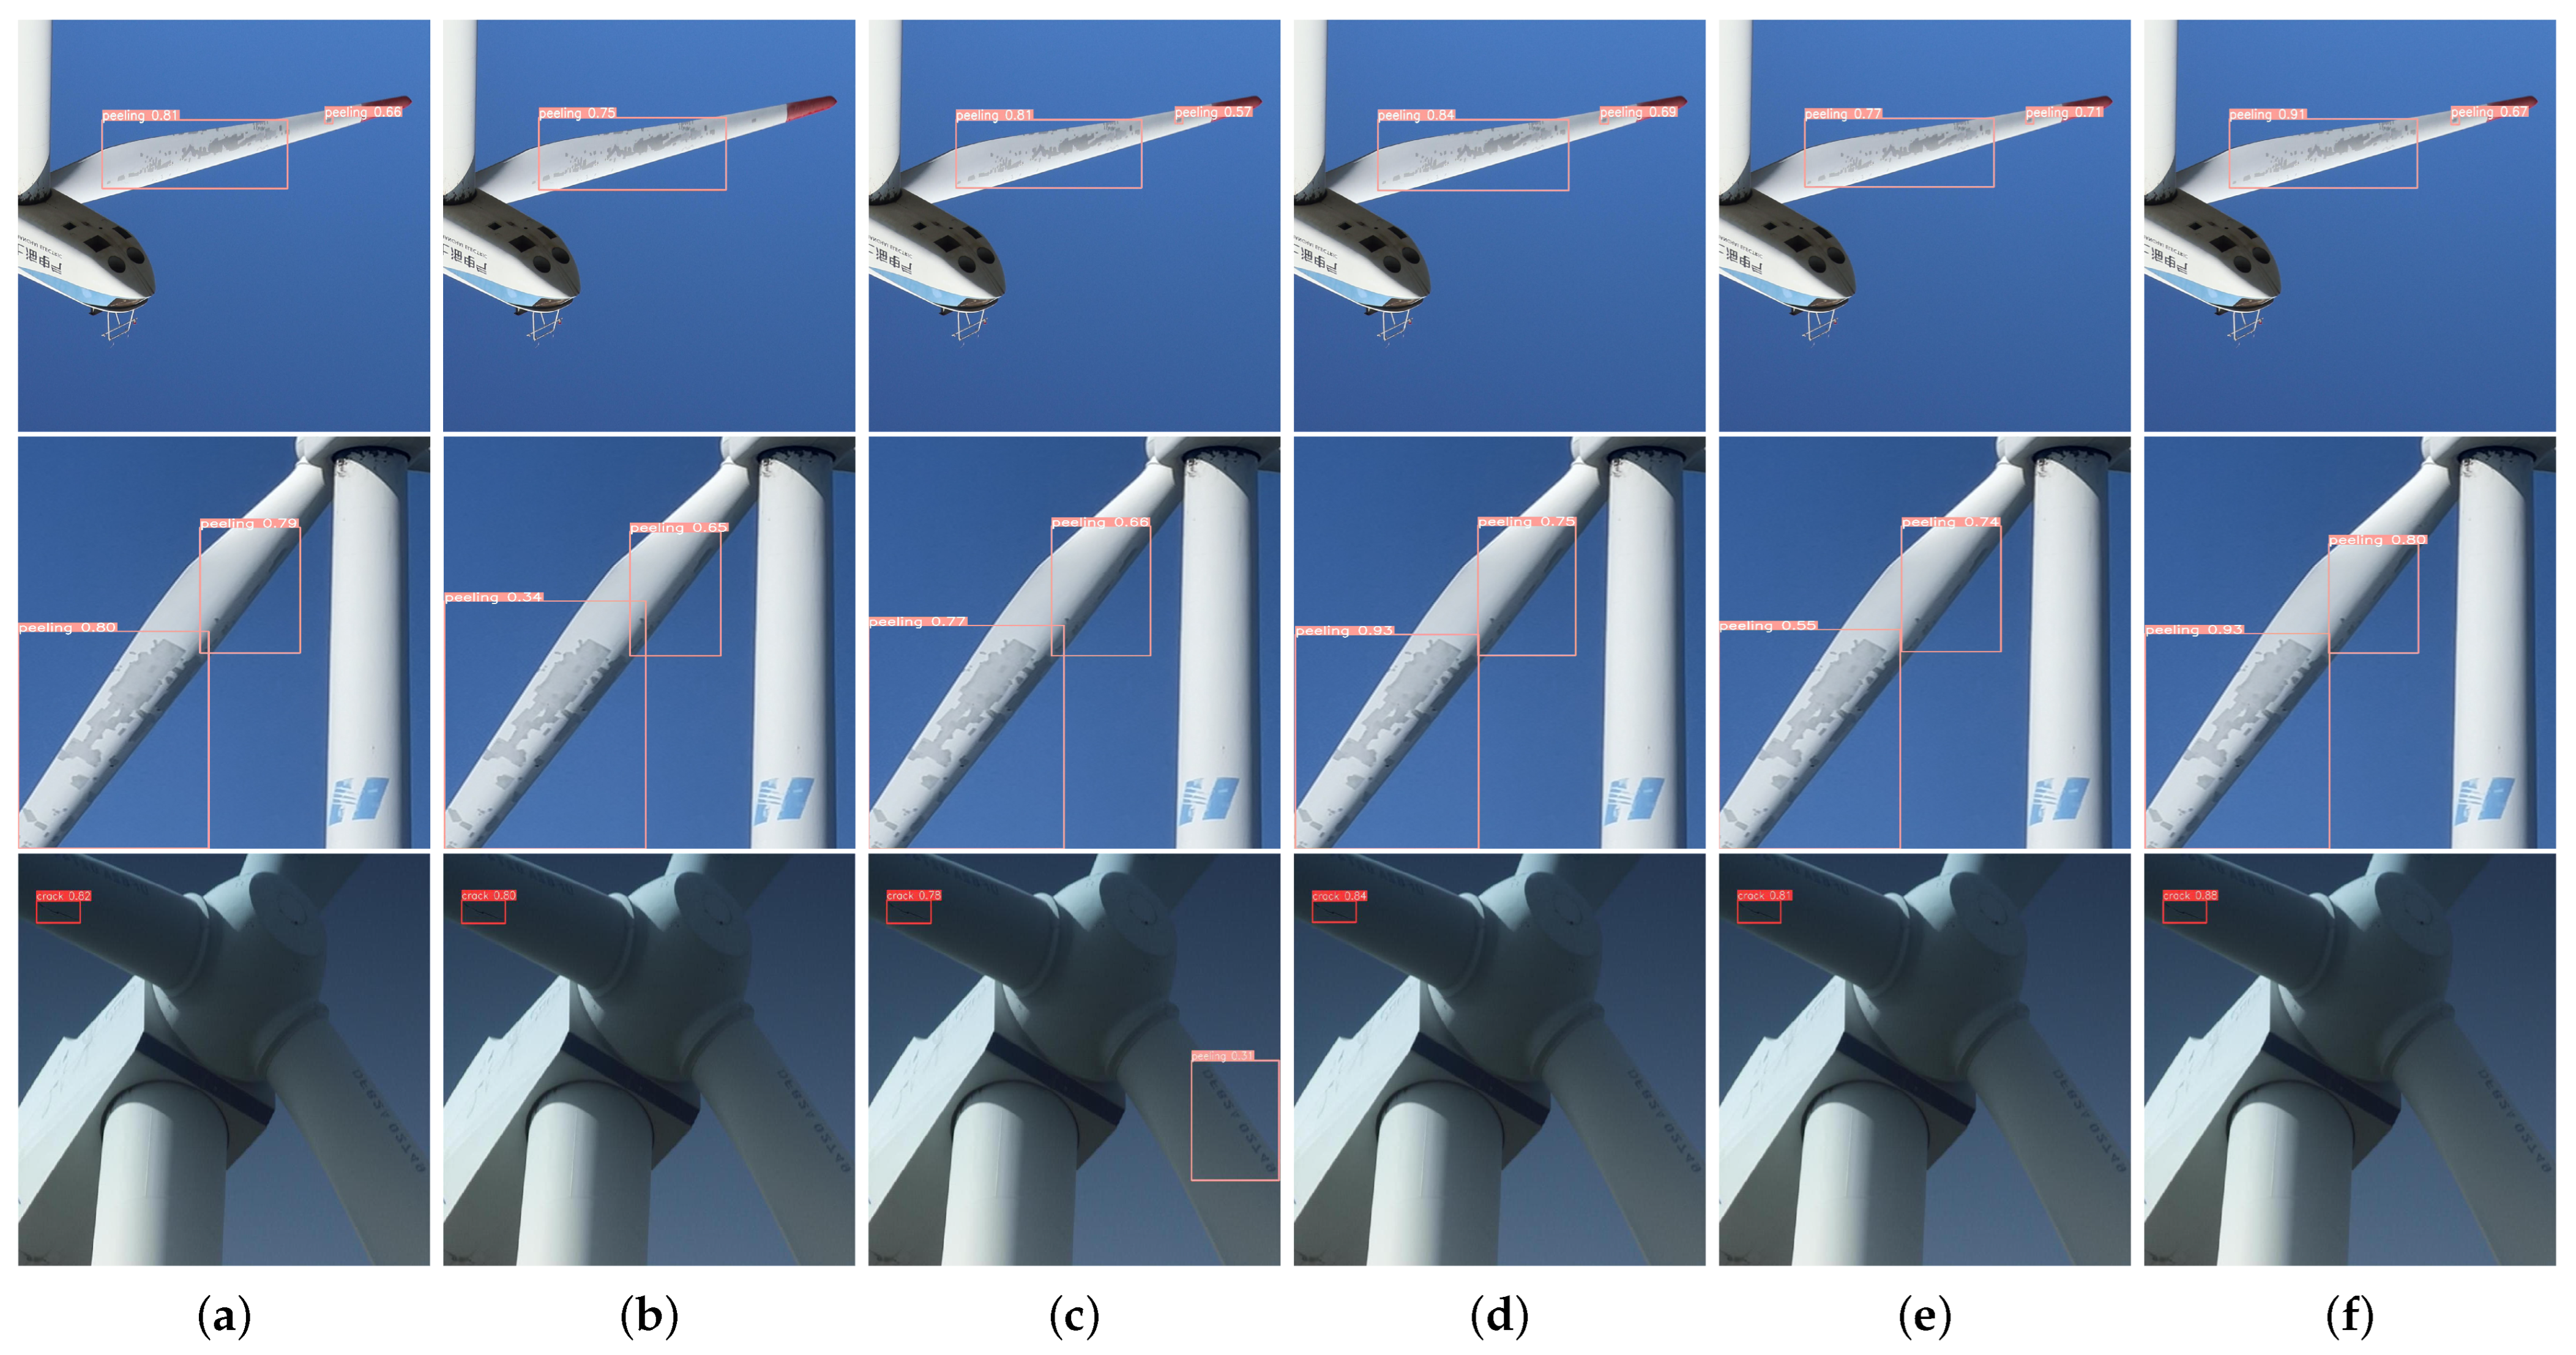
4.3.2. Comparison Experiment
5. Conclusions
Author Contributions
Funding
Institutional Review Board Statement
Informed Consent Statement
Data Availability Statement
Conflicts of Interest
References
- Dincer, I. Renewable energy and sustainable development: A crucial review. Renew. Sustain. Energy Rev. 2000, 4, 157–175. [Google Scholar] [CrossRef]
- Global Wind Energy Council. Global Wind Report 2023. Available online: https://gwec.net/globalwindreport2023 (accessed on 6 May 2023).
- Du, Y.; Zhou, S.; Jing, X.; Peng, Y.; Wu, H.; Kwok, N. Damage detection techniques for wind turbine blades: A review. Mech. Syst. Signal Process. 2020, 141, 106445. [Google Scholar] [CrossRef]
- Jureczko, M.; Pawlak, M.; Mężyk, A. Optimisation of wind turbine blades. J. Mater. Process. Technol. 2005, 167, 463–471. [Google Scholar] [CrossRef]
- Mishnaevsky, L., Jr. Root causes and mechanisms of failure of wind turbine blades: Overview. Materials 2022, 15, 2959. [Google Scholar] [CrossRef]
- Kaewniam, P.; Cao, M.; Alkayem, N.F.; Li, D.; Manoach, E. Recent advances in damage detection of wind turbine blades: A state-of-the-art review. Renew. Sustain. Energy Rev. 2022, 167, 112723. [Google Scholar] [CrossRef]
- McKenna, R.; vd Leye, P.O.; Fichtner, W. Key challenges and prospects for large wind turbines. Renew. Sustain. Energy Rev. 2016, 53, 1212–1221. [Google Scholar] [CrossRef]
- Hang, X.; Zhu, X.; Gao, X.; Wang, Y.; Liu, L. Study on crack monitoring method of wind turbine blade based on AI model: Integration of classification, detection, segmentation and fault level evaluation. Renew. Energy 2024, 224, 120152. [Google Scholar] [CrossRef]
- Liu, J.; Wang, X.; Wu, S.; Wan, L.; Xie, F. Wind turbine fault detection based on deep residual networks. Expert Syst. Appl. 2023, 213, 119102. [Google Scholar] [CrossRef]
- Zhou, Y.; Cao, R.; Li, P.; Ma, X.; Hu, X.; Li, F. A damage detection system for inner bore of electromagnetic railgun launcher based on deep learning and computer vision. Expert Syst. Appl. 2022, 202, 117351. [Google Scholar] [CrossRef]
- de Paula Monteiro, R.; Lozada, M.C.; Mendieta, D.R.C.; Loja, R.V.S.; Bastos Filho, C.J.A. A hybrid prototype selection-based deep learning approach for anomaly detection in industrial machines. Expert Syst. Appl. 2022, 204, 117528. [Google Scholar] [CrossRef]
- Ren, S.; He, K.; Girshick, R.; Sun, J. Faster r-cnn: Towards real-time object detection with region proposal networks. Adv. Neural Inf. Process. Syst. 2015, 28, 1137–1149. [Google Scholar] [CrossRef] [PubMed]
- He, K.; Gkioxari, G.; Dollár, P.; Girshick, R. Mask r-cnn. In Proceedings of the IEEE International Conference on Computer Vision, Venice, Italy, 22–29 October 2017; pp. 2961–2969. [Google Scholar]
- Liu, W.; Anguelov, D.; Erhan, D.; Szegedy, C.; Reed, S.; Fu, C.Y.; Berg, A.C. Ssd: Single shot multibox detector. In Proceedings of the Computer Vision–ECCV 2016: 14th European Conference, Amsterdam, The Netherlands, 11–14 October 2016; Springer: Berlin/Heidelberg, Germany, 2016. Part I. Volume 14, pp. 21–37. [Google Scholar]
- Ou, Y.; Chatzi, E.N.; Dertimanis, V.K.; Spiridonakos, M.D. Vibration-based experimental damage detection of a small-scale wind turbine blade. Struct. Health Monit. 2017, 16, 79–96. [Google Scholar] [CrossRef]
- Ghoshal, A.; Sundaresan, M.J.; Schulz, M.J.; Pai, P.F. Structural health monitoring techniques for wind turbine blades. J. Wind Eng. Ind. Aerodyn. 2000, 85, 309–324. [Google Scholar] [CrossRef]
- Liu, Z.; Zhang, L.; Carrasco, J. Vibration analysis for large-scale wind turbine blade bearing fault detection with an empirical wavelet thresholding method. Renew. Energy 2020, 146, 99–110. [Google Scholar] [CrossRef]
- Kumpati, R.; Skarka, W.; Ontipuli, S.K. Current trends in integration of nondestructive testing methods for engineered materials testing. Sensors 2021, 21, 6175. [Google Scholar] [CrossRef]
- Tang, J.; Soua, S.; Mares, C.; Gan, T.H. An experimental study of acoustic emission methodology for in service condition monitoring of wind turbine blades. Renew. Energy 2016, 99, 170–179. [Google Scholar] [CrossRef]
- Xu, D.; Liu, P.; Chen, Z. Damage mode identification and singular signal detection of composite wind turbine blade using acoustic emission. Compos. Struct. 2021, 255, 112954. [Google Scholar] [CrossRef]
- Yang, B.; Sun, D. Testing, inspecting and monitoring technologies for wind turbine blades: A survey. Renew. Sustain. Energy Rev. 2013, 22, 515–526. [Google Scholar] [CrossRef]
- Yang, K.; Rongong, J.A.; Worden, K. Damage detection in a laboratory wind turbine blade using techniques of ultrasonic NDT and SHM. Strain 2018, 54, e12290. [Google Scholar] [CrossRef]
- Oliveira, M.A.; Simas Filho, E.F.; Albuquerque, M.C.; Santos, Y.T.; Da Silva, I.C.; Farias, C.T. Ultrasound-based identification of damage in wind turbine blades using novelty detection. Ultrasonics 2020, 108, 106166. [Google Scholar] [CrossRef]
- Mori, M.; Novak, L.; Sekavčnik, M. Measurements on rotating blades using IR thermography. Exp. Therm. Fluid Sci. 2007, 32, 387–396. [Google Scholar] [CrossRef]
- Sanati, H.; Wood, D.; Sun, Q. Condition monitoring of wind turbine blades using active and passive thermography. Appl. Sci. 2018, 8, 2004. [Google Scholar] [CrossRef]
- Hwang, S.; An, Y.K.; Yang, J.; Sohn, H. Remote inspection of internal delamination in wind turbine blades using continuous line laser scanning thermography. Int. J. Precis. Eng. Manuf.-Green Technol. 2020, 7, 699–712. [Google Scholar] [CrossRef]
- Zhu, X.; Hang, X.; Gao, X.; Yang, X.; Xu, Z.; Wang, Y.; Liu, H. Research on crack detection method of wind turbine blade based on a deep learning method. Appl. Energy 2022, 328, 120241. [Google Scholar]
- Guo, S.; Tian, H.; Wang, W. A Method for Solving Path Planning Problems in Complex Scenarios. Comput. Technol. Dev. 2022, 32, 27–33. [Google Scholar]
- Guo, J.; Liu, C.; Cao, J.; Jiang, D. Damage identification of wind turbine blades with deep convolutional neural networks. Renew. Energy 2021, 174, 122–133. [Google Scholar] [CrossRef]
- Yang, X.; Zhang, Y.; Lv, W.; Wang, D. Image recognition of wind turbine blade damage based on a deep learning model with transfer learning and an ensemble learning classifier. Renew. Energy 2021, 163, 386–397. [Google Scholar] [CrossRef]
- Lv, L.; Yao, Z.; Wang, E.; Ren, X.; Pang, R.; Wang, H.; Zhang, Y.; Wu, H. Efficient and Accurate Damage Detector for Wind Turbine Blade Images. IEEE Access 2022, 10, 123378–123386. [Google Scholar] [CrossRef]
- Zhang, Y.; Yang, Y.; Sun, J.; Ji, R.; Zhang, P.; Shan, H. Surface Defect Detection of Wind Turbine Based on Lightweight YOLOv5s Model. Measurement 2023, 220, 113222. [Google Scholar] [CrossRef]
- Ran, X.; Zhang, S.; Wang, H.; Zhang, Z. An Improved Algorithm for Wind Turbine Blade Defect Detection. IEEE Access 2022, 10, 122171–122181. [Google Scholar] [CrossRef]
- Hu, Y.; Wang, L.; Kou, T.; Zhang, M. YOLO-Tiny-attention: An Improved Algorithm for Fault Detection of Wind Turbine Blade. In Proceedings of the 2023 8th International Conference on Intelligent Computing and Signal Processing (ICSP), Xi’an, China, 21–23 April 2023; pp. 1228–1232. [Google Scholar]
- Wang, C.Y.; Bochkovskiy, A.; Liao, H.Y.M. YOLOv7: Trainable bag-of-freebies sets new state-of-the-art for real-time object detectors. In Proceedings of the IEEE/CVF Conference on Computer Vision and Pattern Recognition, Vancouver, BC, Canada, 18–22 June 2023; pp. 7464–7475. [Google Scholar]
- Wang, C.Y.; Bochkovskiy, A.; Liao, H.Y.M. Scaled-yolov4: Scaling cross stage partial network. In Proceedings of the IEEE/CVF Conference on Computer Vision and Pattern Recognition, Virtual Event, 19–25 June 2021; pp. 13029–13038. [Google Scholar]
- Liu, Y.; Yang, F.; Hu, P. Parallel FPN algorithm based on cascade R-CNN for object detection from UAV aerial images. Laser Optoelectron. Prog 2020, 57, 201505. [Google Scholar]
- Wang, Y. Symposium Title: The Fronto-Parietal Network (FPN): Supporting a Top-Down Control of Executive Functioning. Int. J. Psychophysiol. 2021, 168, S39. [Google Scholar] [CrossRef]
- Ge, Z.; Liu, S.; Wang, F.; Li, Z.; Sun, J. Yolox: Exceeding yolo series in 2021. arXiv 2021, arXiv:2107.08430. [Google Scholar]
- Li, X.; Wang, W.; Wu, L.; Chen, S.; Hu, X.; Li, J.; Tang, J.; Yang, J. Generalized focal loss: Learning qualified and distributed bounding boxes for dense object detection. Adv. Neural Inf. Process. Syst. 2020, 33, 21002–21012. [Google Scholar]
- Zheng, Z.; Wang, P.; Liu, W.; Li, J.; Ye, R.; Ren, D. Distance-IoU loss: Faster and better learning for bounding box regression. In Proceedings of the AAAI Conference on Artificial Intelligence, New York, NY, USA, 7–12 February 2020; Volume 34, pp. 12993–13000. [Google Scholar]
- Feng, C.; Zhong, Y.; Gao, Y.; Scott, M.R.; Huang, W. Tood: Task-aligned one-stage object detection. In Proceedings of the 2021 IEEE/CVF International Conference on Computer Vision (ICCV) IEEE Computer Society, Montreal, QC, Canada, (Virtual Event), 11–17 October 2021; pp. 3490–3499. [Google Scholar]
- Qi, Y.; He, Y.; Qi, X.; Zhang, Y.; Yang, G. Dynamic snake convolution based on topological geometric constraints for tubular structure segmentation. In Proceedings of the IEEE/CVF International Conference on Computer Vision, Paris, France, 2–6 October 2023; pp. 6070–6079. [Google Scholar]
- Wang, J.; Chen, K.; Xu, R.; Liu, Z.; Loy, C.C.; Lin, D. Carafe: Content-aware reassembly of features. In Proceedings of the IEEE/CVF International Conference on Computer Vision, Seoul, Republic of Korea, 27 October–2 November 2019; pp. 3007–3016. [Google Scholar]
- Tong, Z.; Chen, Y.; Xu, Z.; Yu, R. Wise-IoU: Bounding Box Regression Loss with Dynamic Focusing Mechanism. arXiv 2023, arXiv:2301.10051. [Google Scholar]
- Li, C.; Li, L.; Jiang, H.; Weng, K.; Geng, Y.; Li, L.; Ke, Z.; Li, Q.; Cheng, M.; Nie, W.; et al. YOLOv6: A single-stage object detection framework for industrial applications. arXiv 2022, arXiv:2209.02976. [Google Scholar]
- Wang, C.Y.; Yeh, I.H.; Liao, H.Y.M. YOLOv9: Learning What You Want to Learn Using Programmable Gradient Information. arXiv 2024, arXiv:2402.13616. [Google Scholar]
- Wang, A.; Chen, H.; Liu, L.; Chen, K.; Lin, Z.; Han, J.; Ding, G. Yolov10: Real-time end-to-end object detection. arXiv 2024, arXiv:2405.14458. [Google Scholar]
- Lv, W.; Xu, S.; Zhao, Y.; Wang, G.; Wei, J.; Cui, C.; Du, Y.; Dang, Q.; Liu, Y. Detrs beat yolos on real-time object detection. arXiv 2023, arXiv:2304.08069. [Google Scholar]


| DSConv | CARAFE | WIoUv3 | P | R | [email protected] | [email protected]–0.95 | Params (M) | GFLOPs (G) |
|---|---|---|---|---|---|---|---|---|
| 0.936 | 0.871 | 0.914 | 0.689 | 3.01 | 8.1 | |||
| √ | 0.943 | 0.876 | 0.927 | 0.692 | 3.31 | 8.5 | ||
| √ | 0.944 | 0.882 | 0.923 | 0.698 | 3.14 | 8.6 | ||
| √ | 0.938 | 0.875 | 0.925 | 0.690 | 3.01 | 8.1 | ||
| √ | √ | 0.949 | 0.887 | 0.925 | 0.704 | 3.49 | 9.0 | |
| √ | √ | 0.947 | 0.884 | 0.924 | 0.701 | 3.14 | 8.6 | |
| √ | √ | 0.945 | 0.877 | 0.931 | 0.697 | 3.36 | 8.5 | |
| √ | √ | √ | 0.968 | 0.89 | 0.937 | 0.712 | 3.35 | 8.5 |
| Input Images | P | R | [email protected] | [email protected]–0.95 | Training Time (Hours) |
|---|---|---|---|---|---|
| 400 | 0.939 | 0.704 | 0.782 | 0.508 | 0.233 |
| 600 | 0.936 | 0.871 | 0.914 | 0.689 | 0.676 |
| 800 | 0.918 | 0.826 | 0.893 | 0.635 | 0.727 |
| Method | P | R | [email protected] | [email protected]–0.95 | Params (M) | GFLOPs (G) |
|---|---|---|---|---|---|---|
| Faster R-CNN [12] | 0.903 | 0.807 | 0.813 | 0.560 | 44.68 | 147.6 |
| SSD [14] | 0.899 | 0.796 | 0.805 | 0.547 | 22.85 | 27.7 |
| YOLOv5 | 0.929 | 0.797 | 0.862 | 0.593 | 2.51 | 7.1 |
| YOLOv6 [46] | 0.897 | 0.747 | 0.824 | 0.566 | 4.23 | 11.8 |
| YOLOv7-Tiny [35] | 0.911 | 0.799 | 0.856 | 0.544 | 6.02 | 13.2 |
| RT-DETR [49] | 0.801 | 0.741 | 0.804 | 0.541 | 31.99 | 103.4 |
| YOLOv8 | 0.936 | 0.871 | 0.914 | 0.689 | 3.01 | 8.1 |
| YOLOv9 [47] | 0.954 | 0.842 | 0.902 | 0.668 | 25.32 | 102.3 |
| YOLOv10 [48] | 0.874 | 0.736 | 0.831 | 0.572 | 2.69 | 8.2 |
| DCW-YOLO | 0.968 | 0.890 | 0.937 | 0.712 | 3.35 | 8.5 |
Disclaimer/Publisher’s Note: The statements, opinions and data contained in all publications are solely those of the individual author(s) and contributor(s) and not of MDPI and/or the editor(s). MDPI and/or the editor(s) disclaim responsibility for any injury to people or property resulting from any ideas, methods, instructions or products referred to in the content. |
© 2024 by the authors. Licensee MDPI, Basel, Switzerland. This article is an open access article distributed under the terms and conditions of the Creative Commons Attribution (CC BY) license (https://creativecommons.org/licenses/by/4.0/).
Share and Cite
Zou, L.; Chen, A.; Li, C.; Yang, X.; Sun, Y. DCW-YOLO: An Improved Method for Surface Damage Detection of Wind Turbine Blades. Appl. Sci. 2024, 14, 8763. https://doi.org/10.3390/app14198763
Zou L, Chen A, Li C, Yang X, Sun Y. DCW-YOLO: An Improved Method for Surface Damage Detection of Wind Turbine Blades. Applied Sciences. 2024; 14(19):8763. https://doi.org/10.3390/app14198763
Chicago/Turabian StyleZou, Li, Anqi Chen, Chunzi Li, Xinhua Yang, and Yibo Sun. 2024. "DCW-YOLO: An Improved Method for Surface Damage Detection of Wind Turbine Blades" Applied Sciences 14, no. 19: 8763. https://doi.org/10.3390/app14198763