
Signaling Pathways in Clear Cell Renal Cell Carcinoma and Candidate Drugs Unveiled through Transcriptomic Network Analysis of Hub Genes


Abstract
:1. Introduction
2. Materials and Methods
2.1. Data Retrieval and Preliminary Processing
2.2. Weighted Gene Co-Expression Network Analysis (WGCNA)
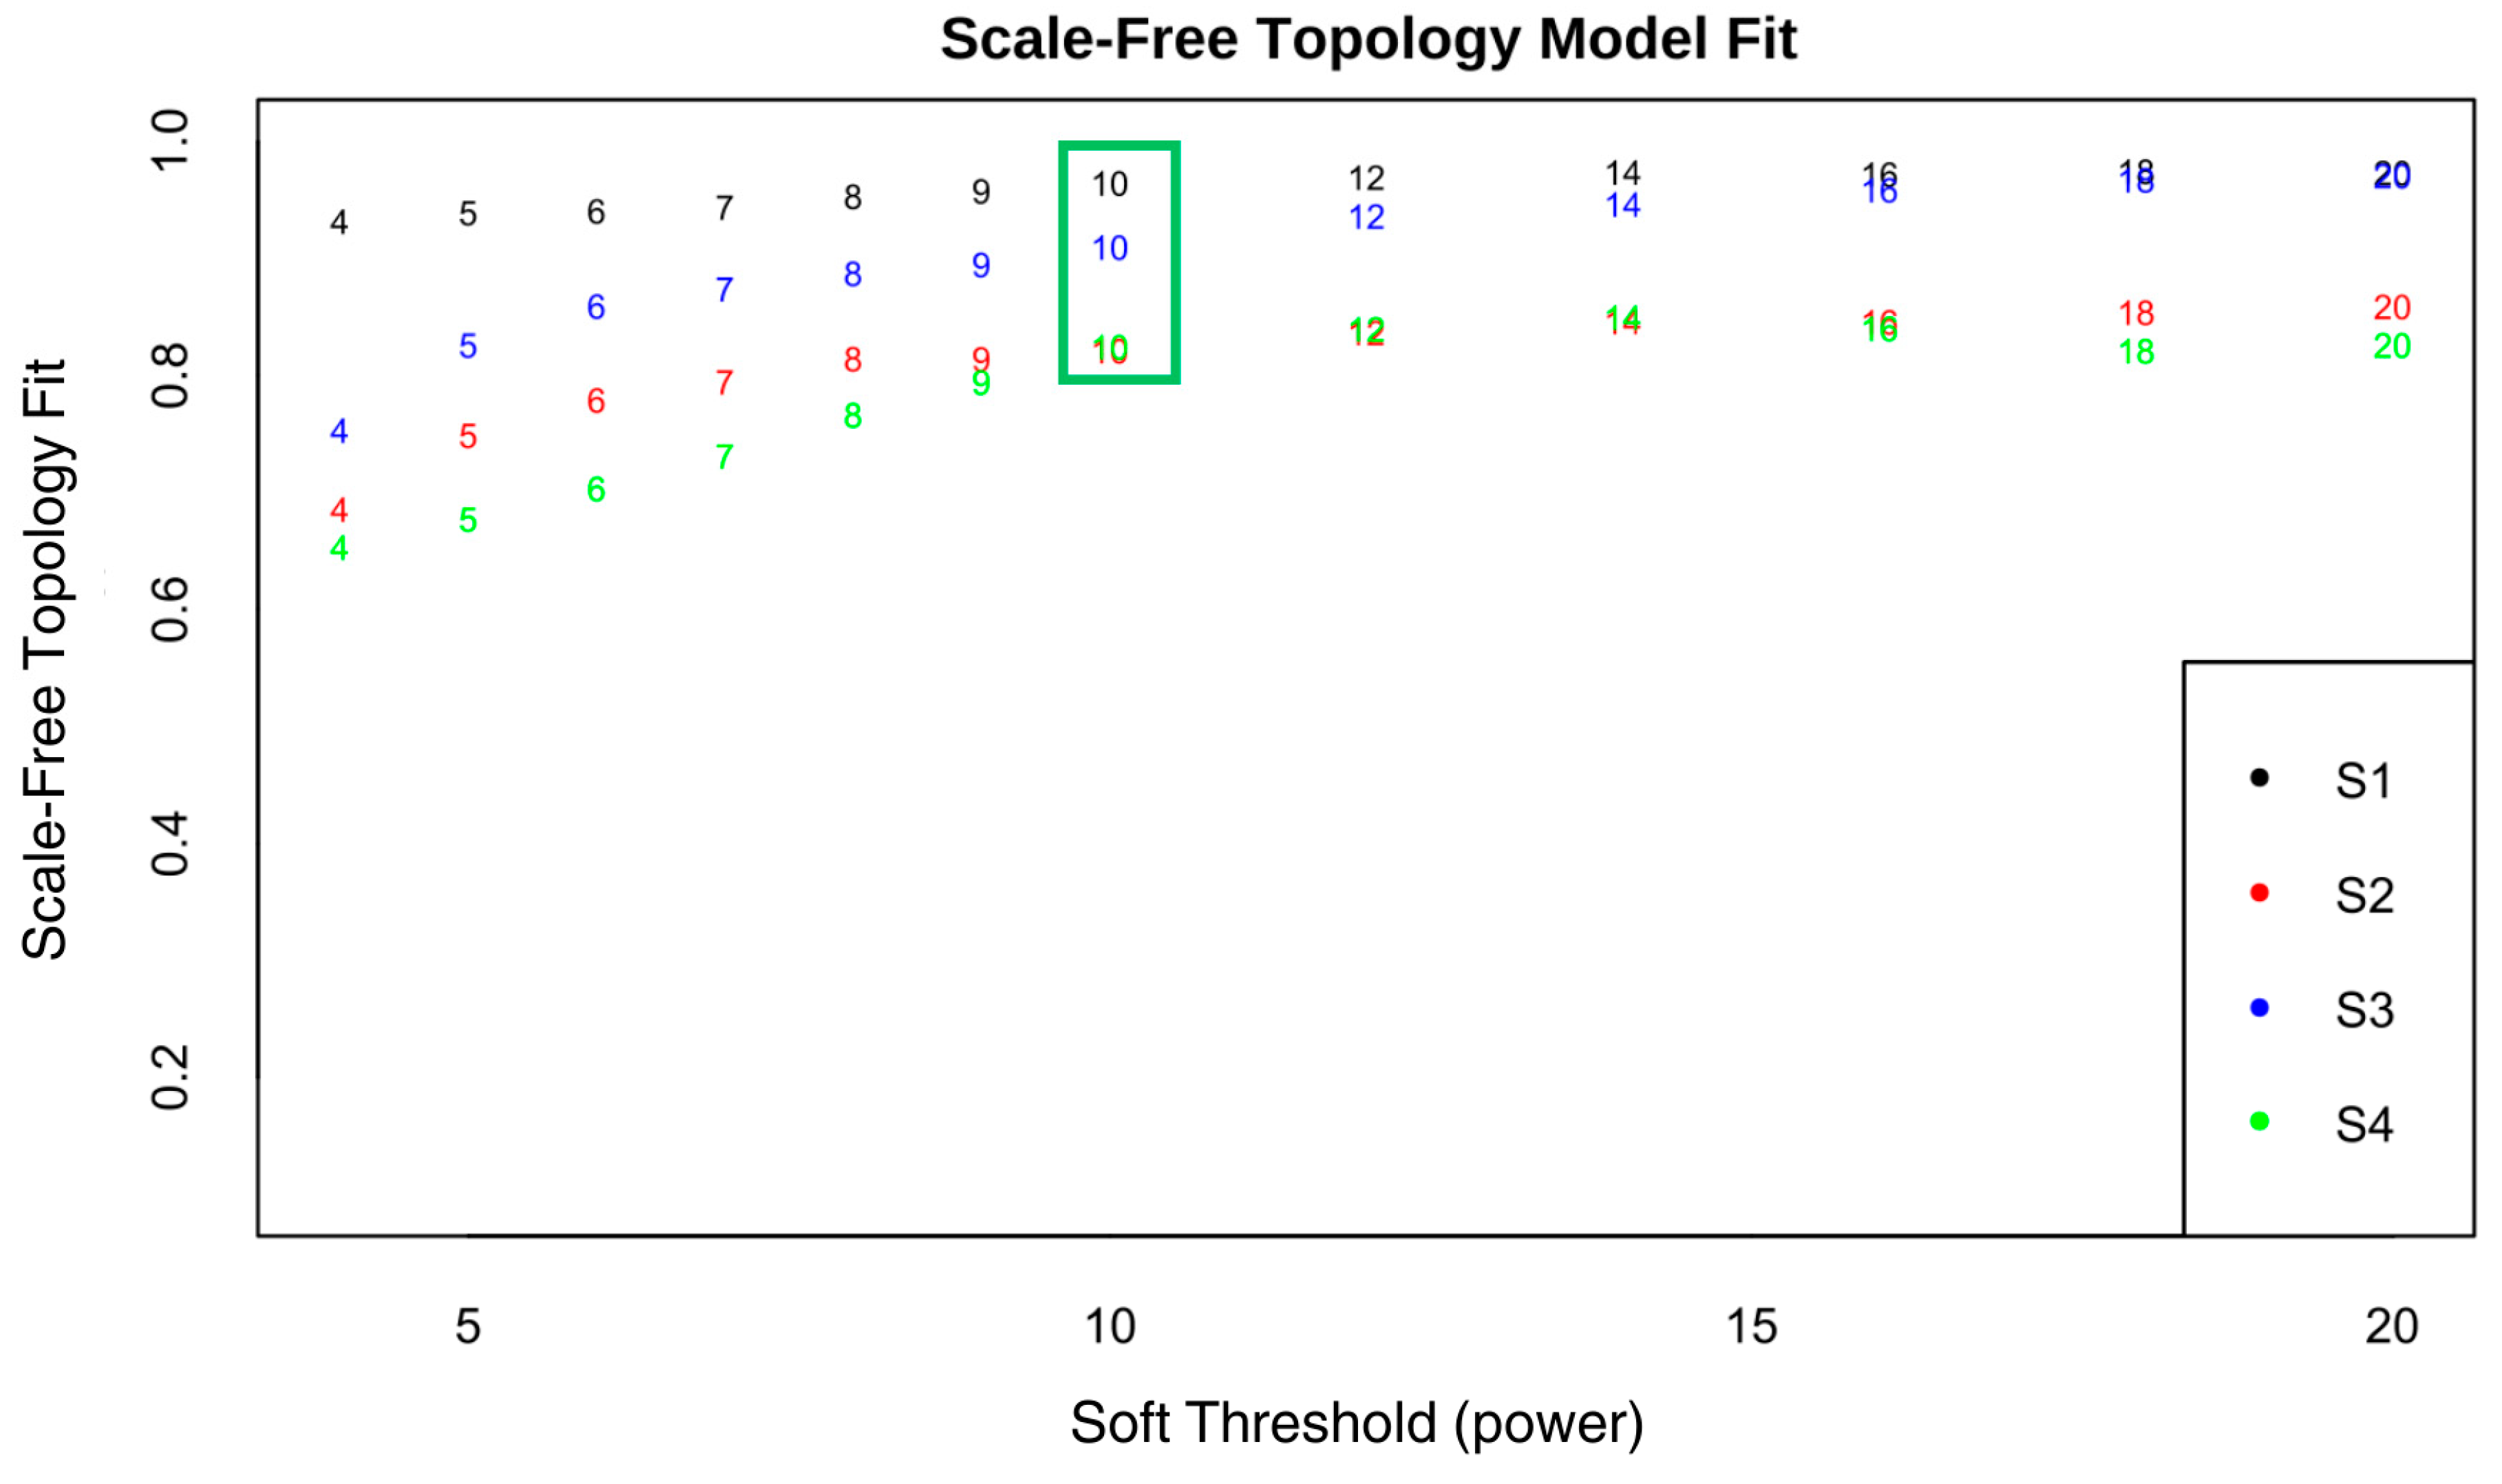
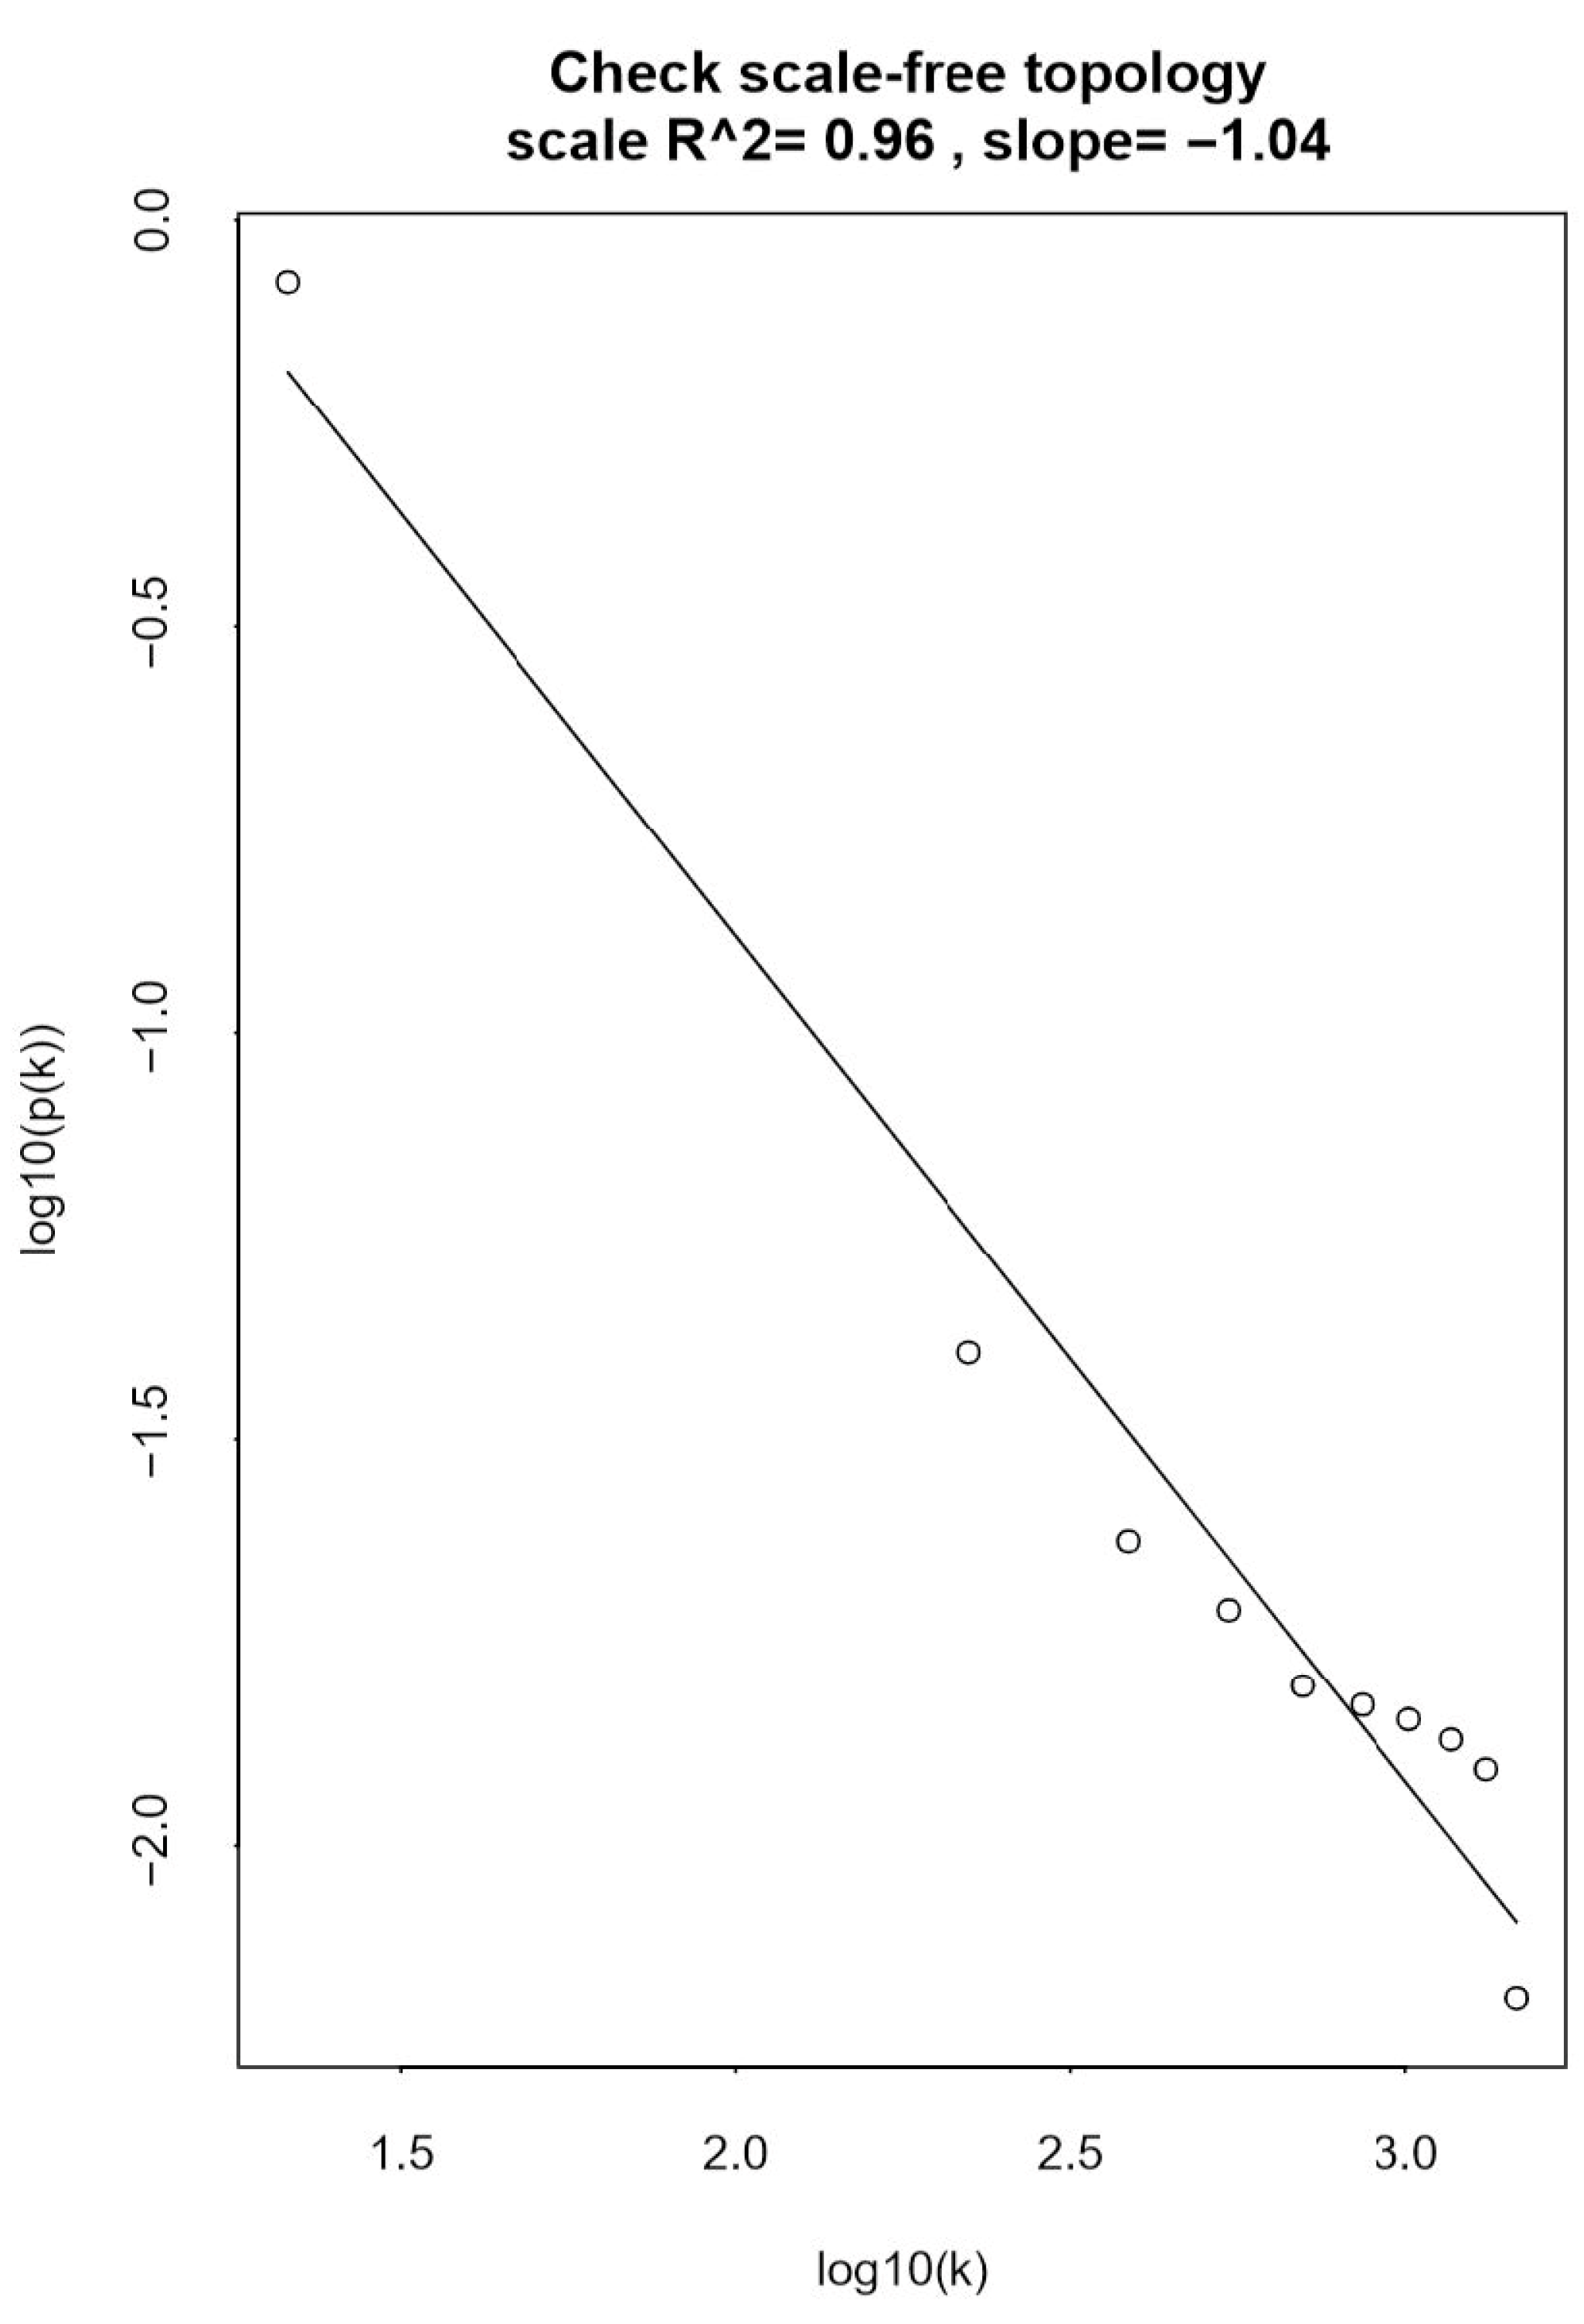
2.2.1. Determining the Optimal Soft-Thresholding Power for Scale-Free Network
2.2.2. Construction of Networks and Identification of Modules
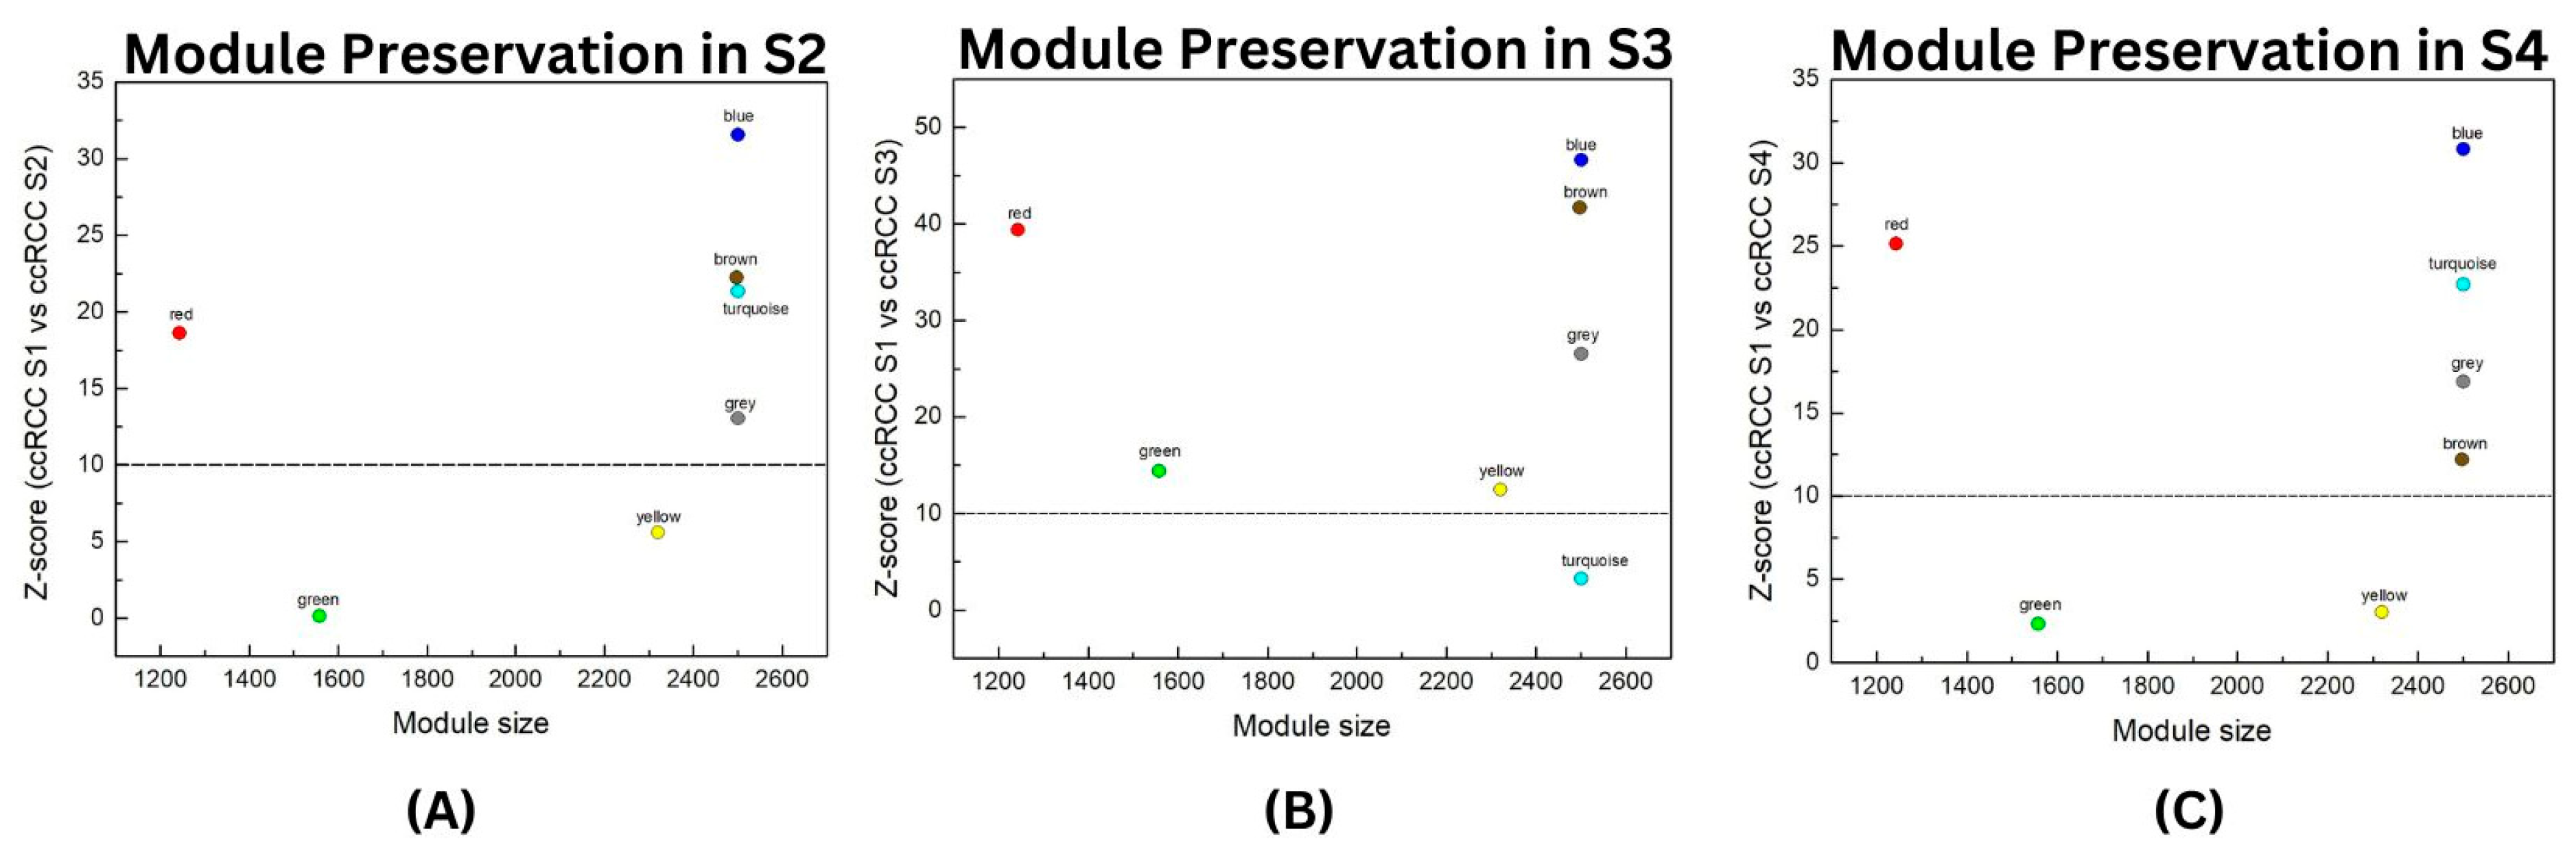
2.3. Module Preservation Analysis
2.4. Gene Ontology (GO) and Kyoto Encyclopedia of Genes and Genomes (KEGG) Pathways Analysis
2.5. Protein–Protein Interaction (PPI) Network Analysis
2.6. Survival Analysis of Hub Genes
2.7. Drug Repurposing Analysis
3. Results
3.1. Weighted Gene Co-Expression Network Analysis (WGCNA)
3.1.1. Scale-Free Network Analysis of the ccRCC Datasets
3.1.2. Network Construction and Module Identification
3.2. Module Preservation Analysis
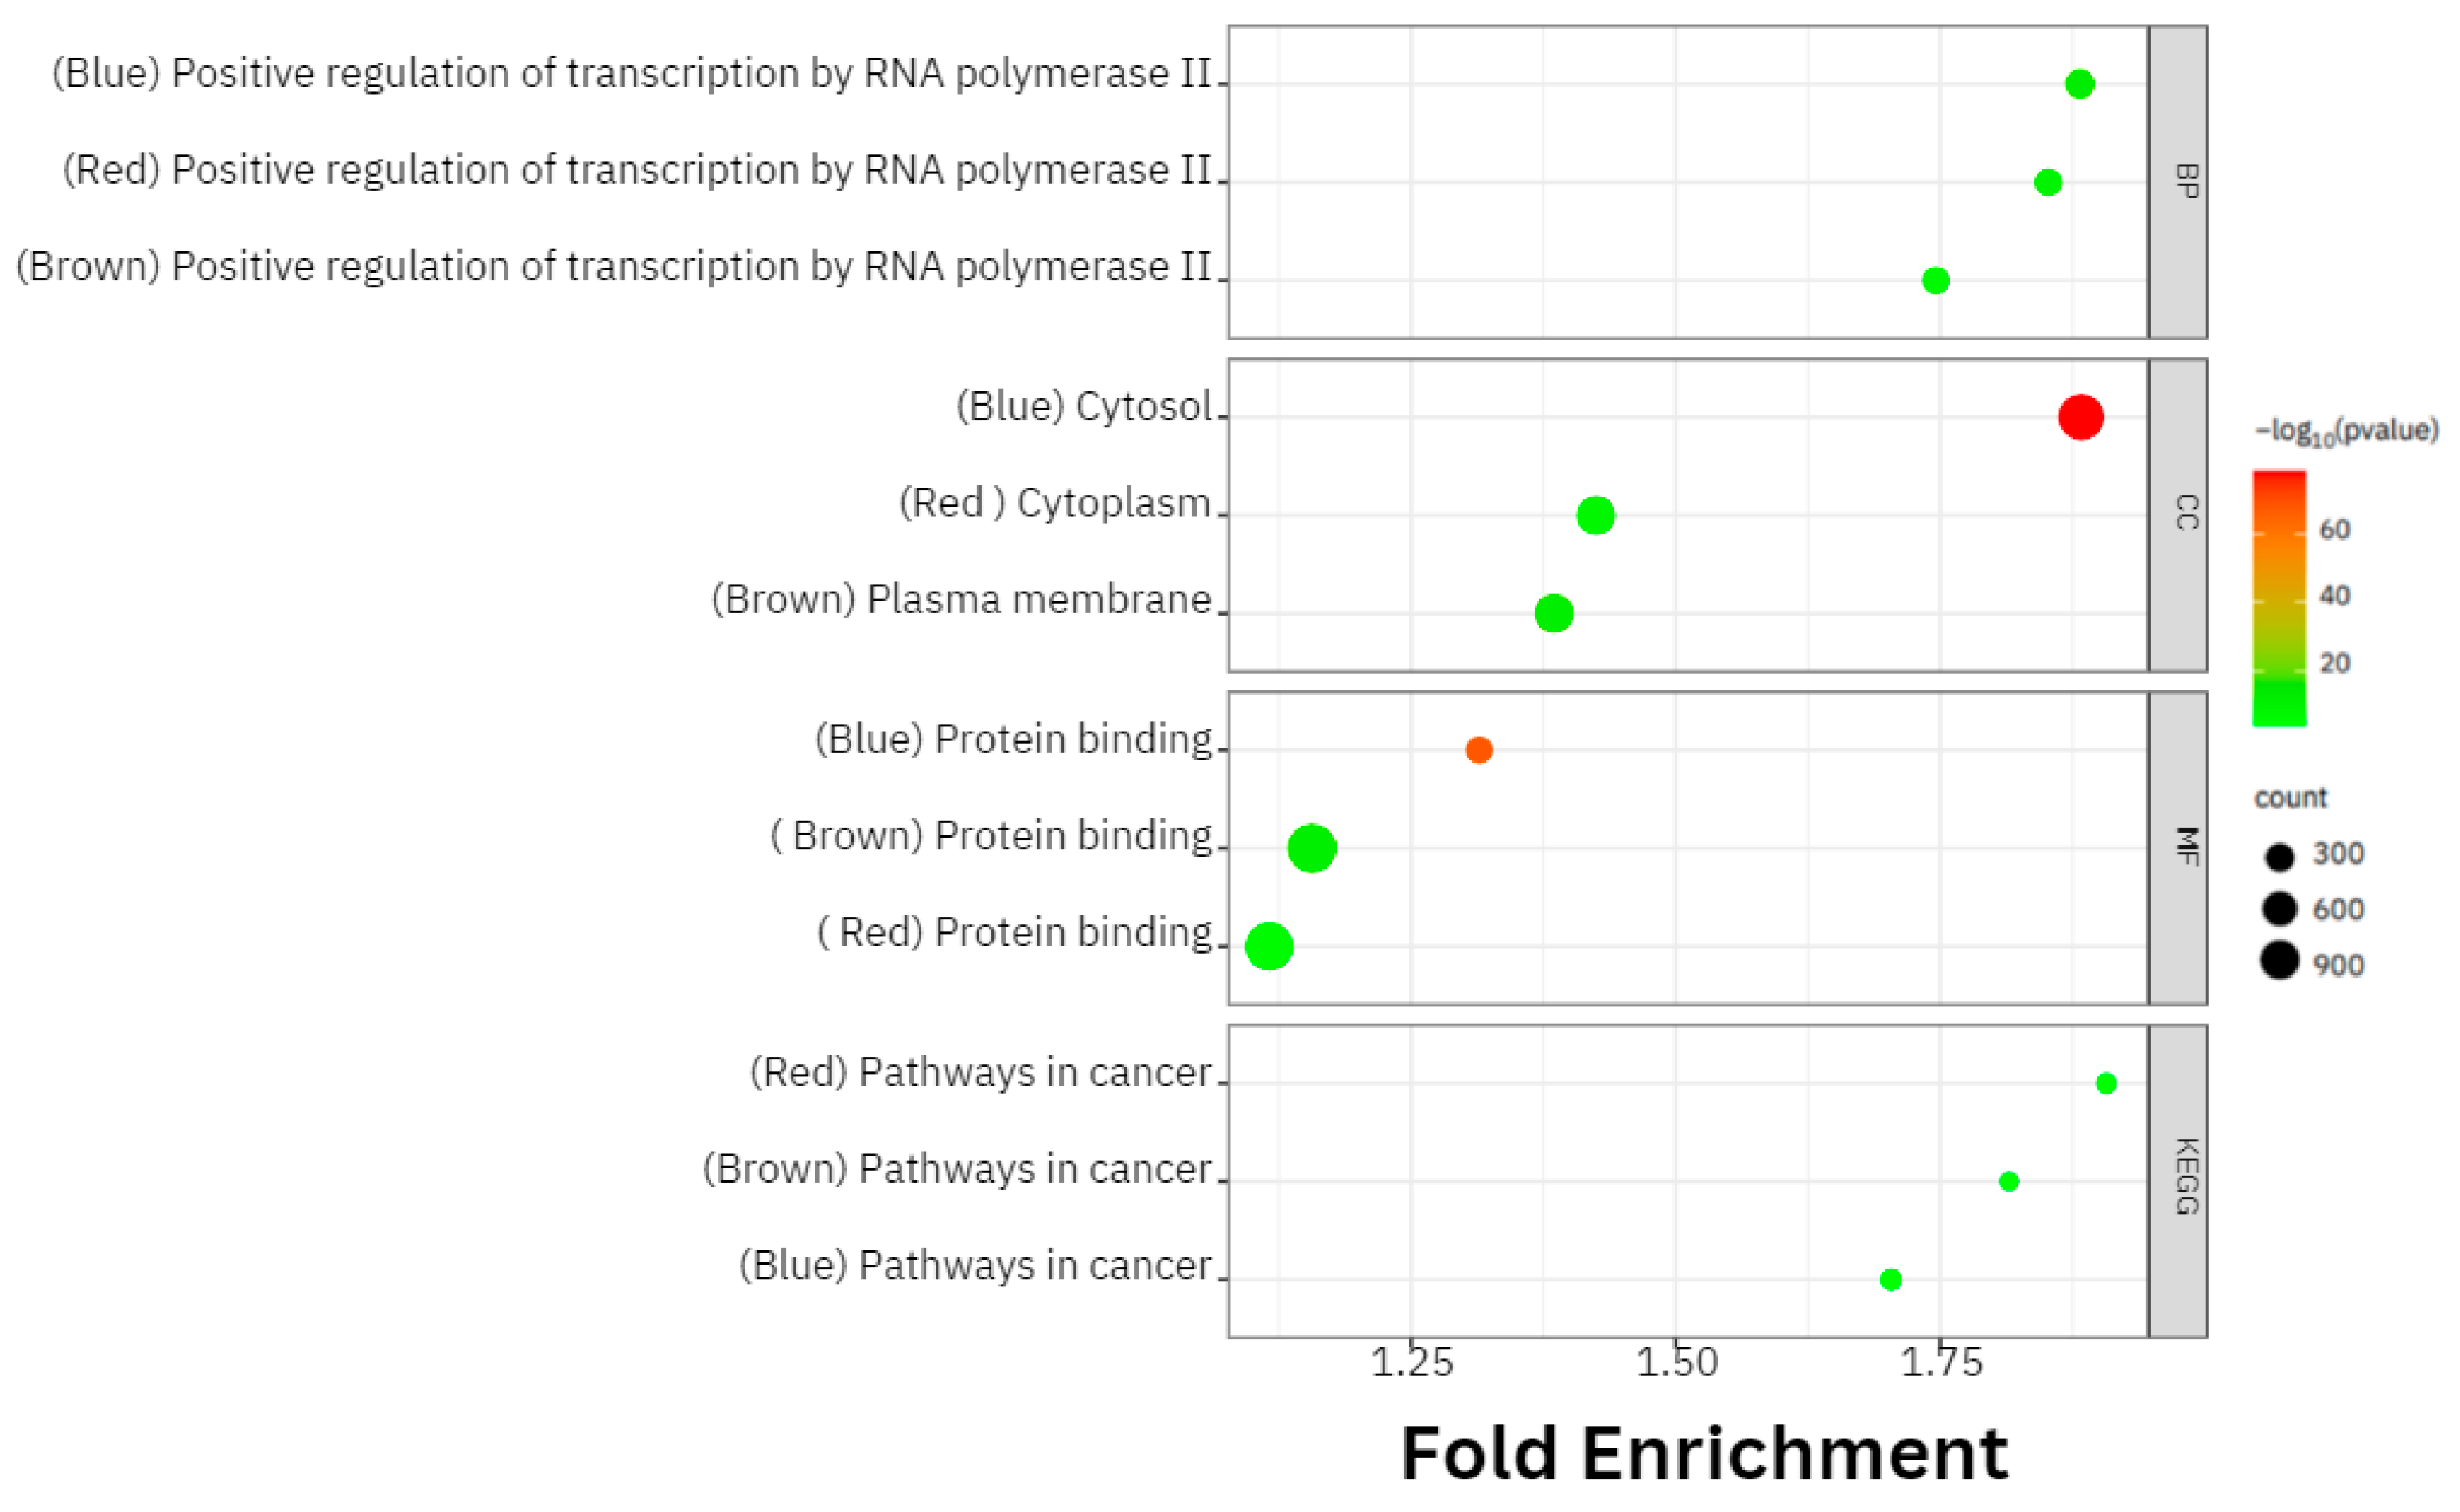
3.3. Gene Ontology (GO) and Kyoto Encyclopedia of Genes and Genomes (KEGG) Pathways Analyses
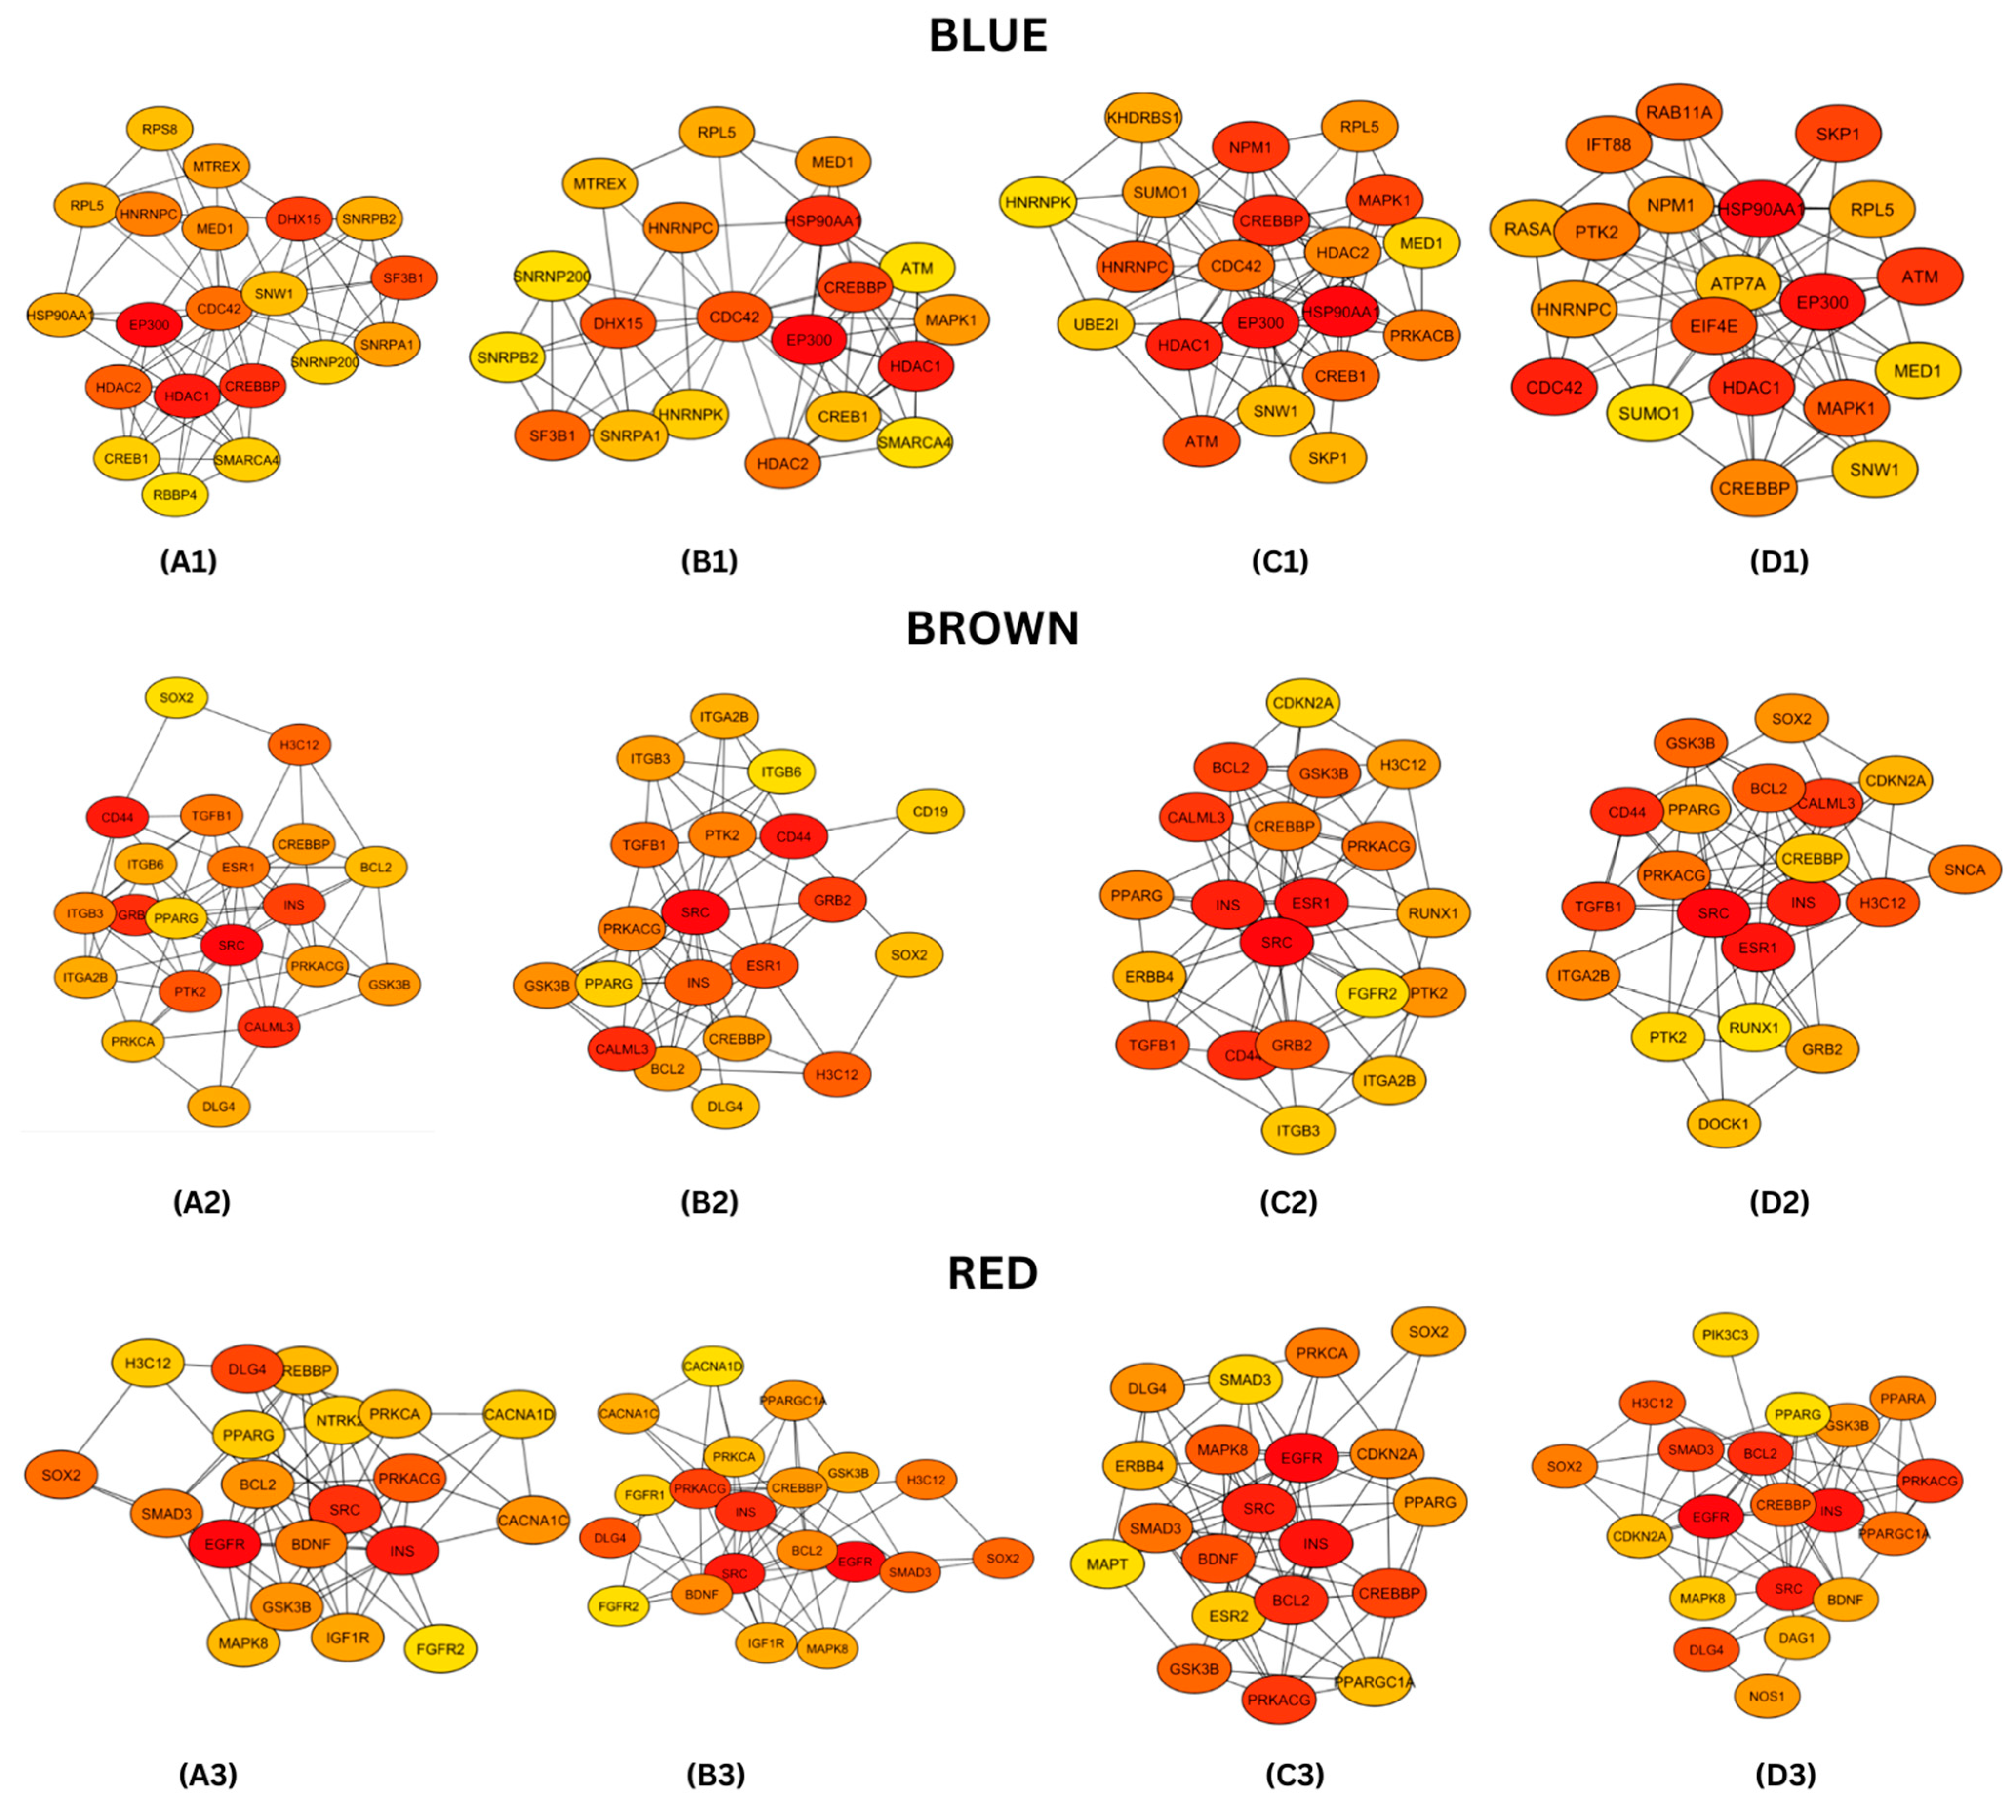
3.4. Protein–Protein Interaction (PPI) Networks and Hub Genes Analysis
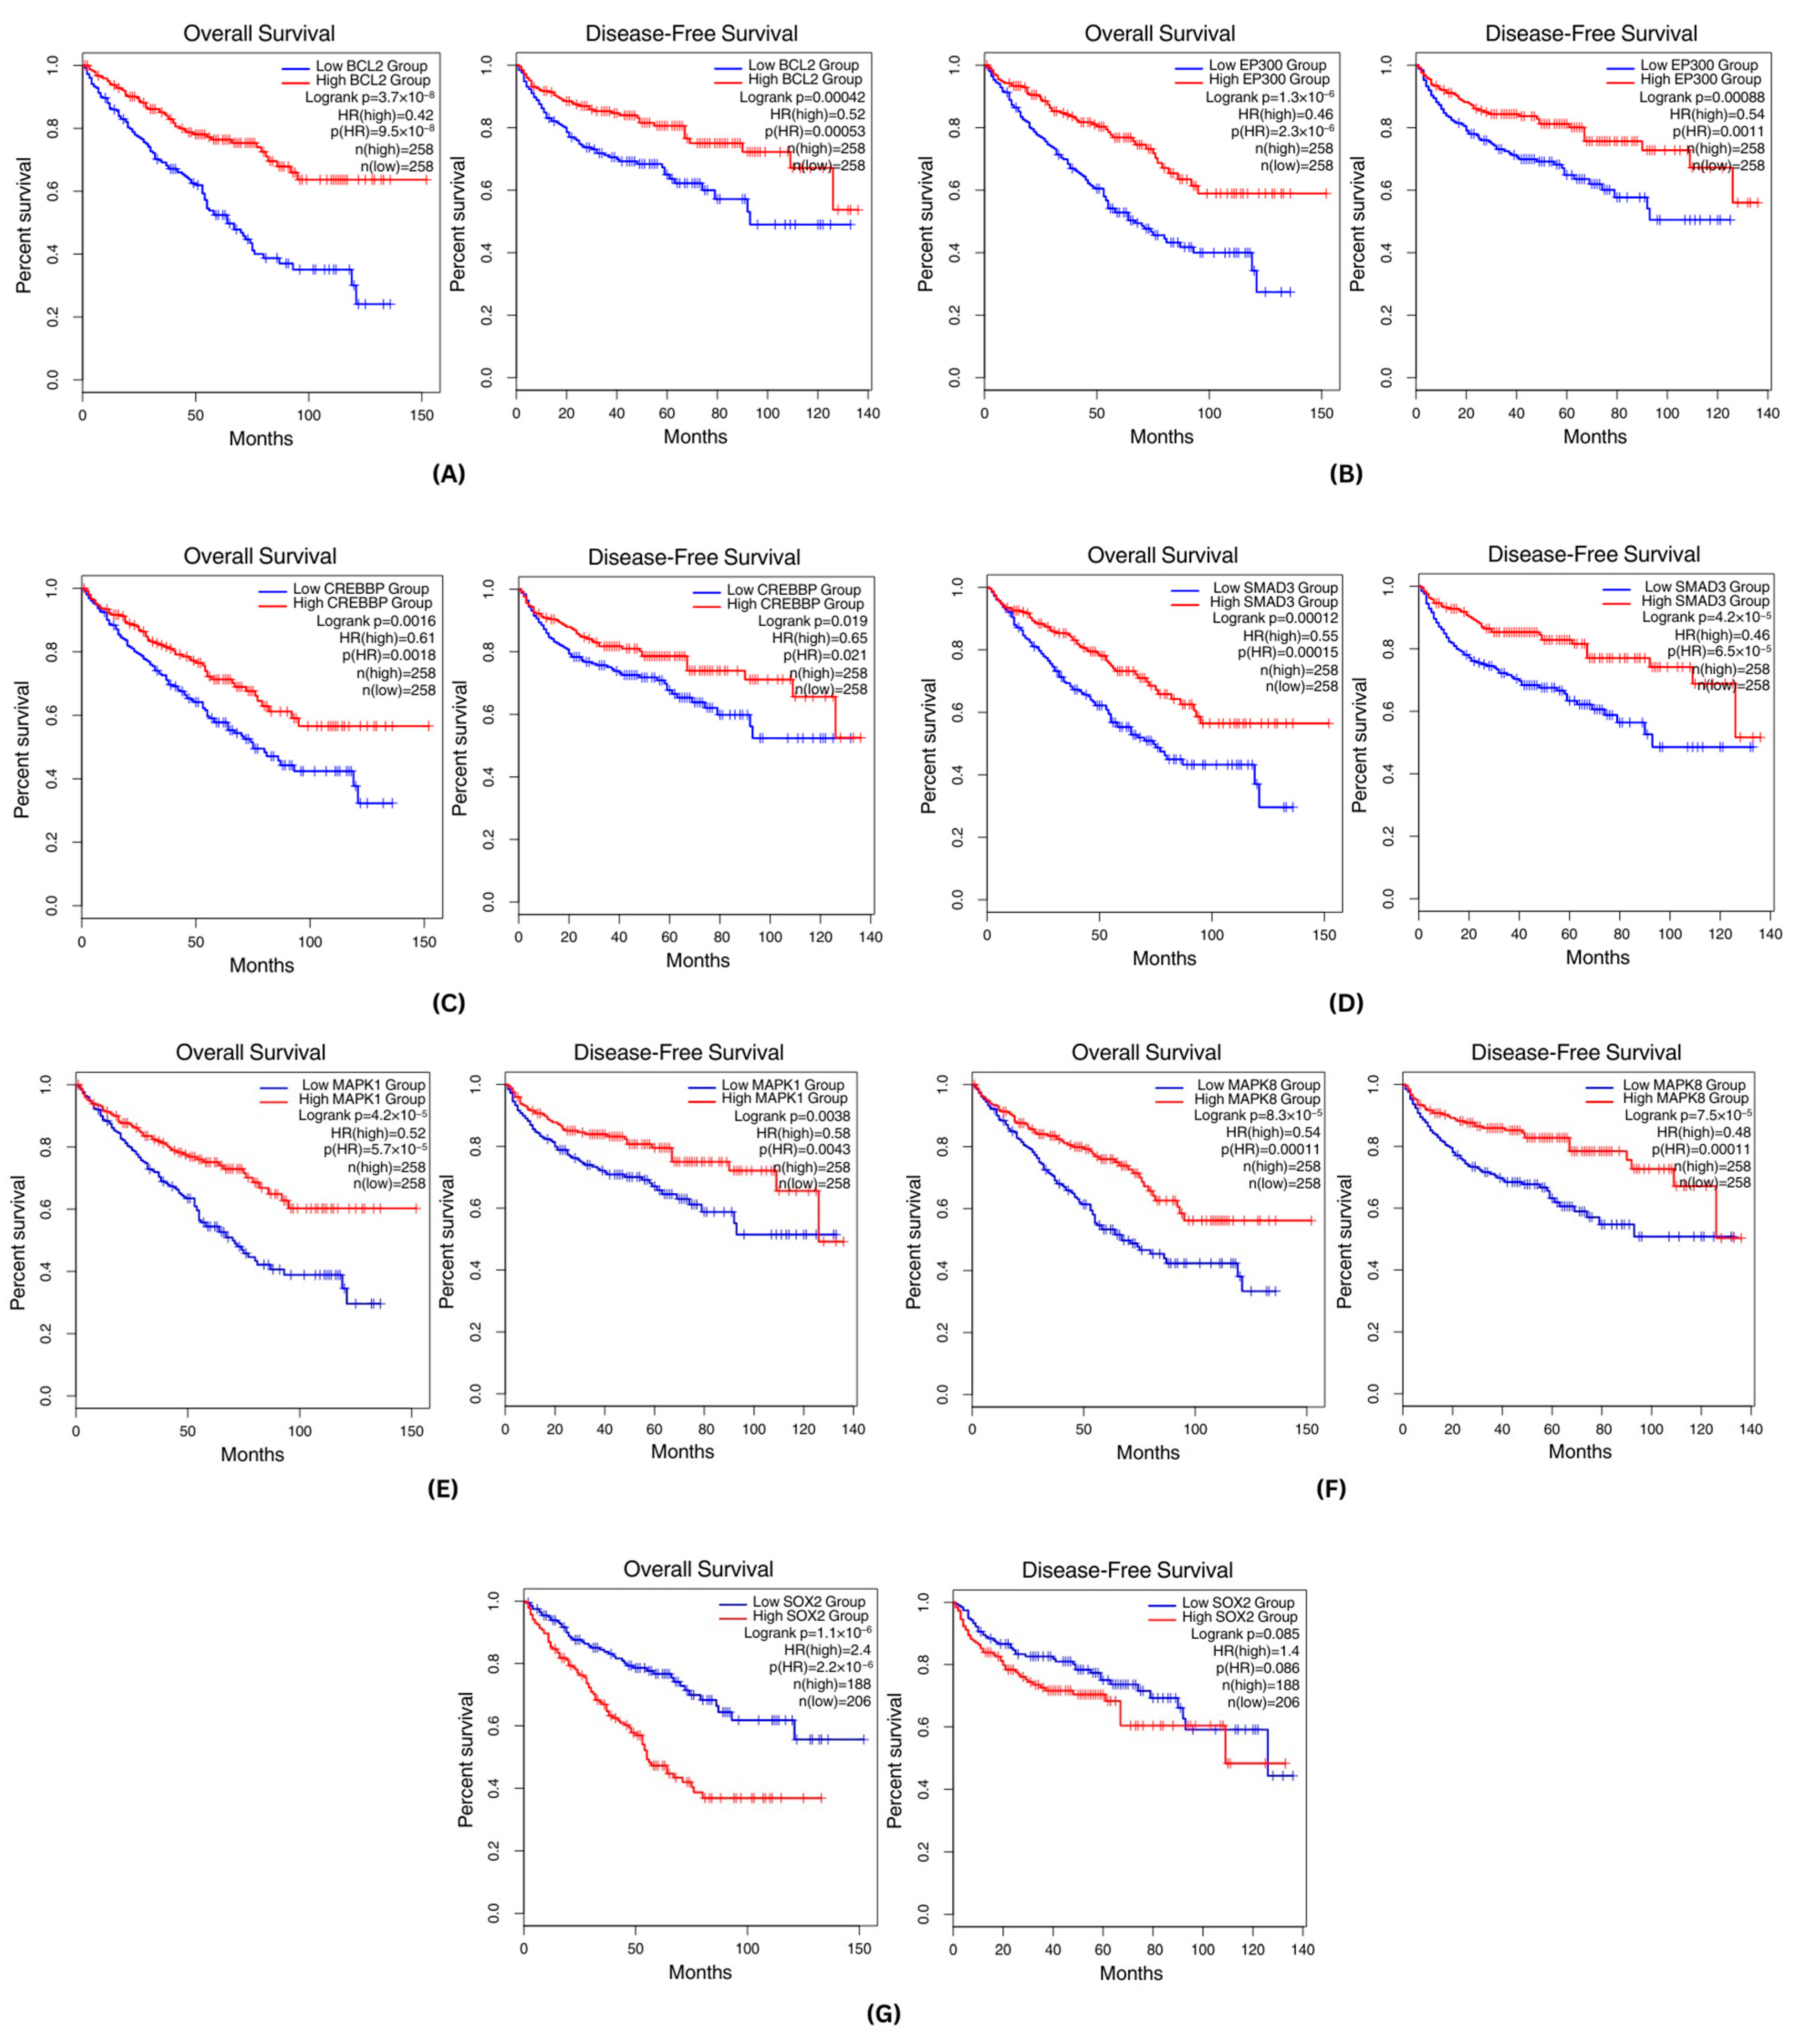
3.5. Survival Analysis
3.6. Drug Repurposing Analysis
4. Discussion
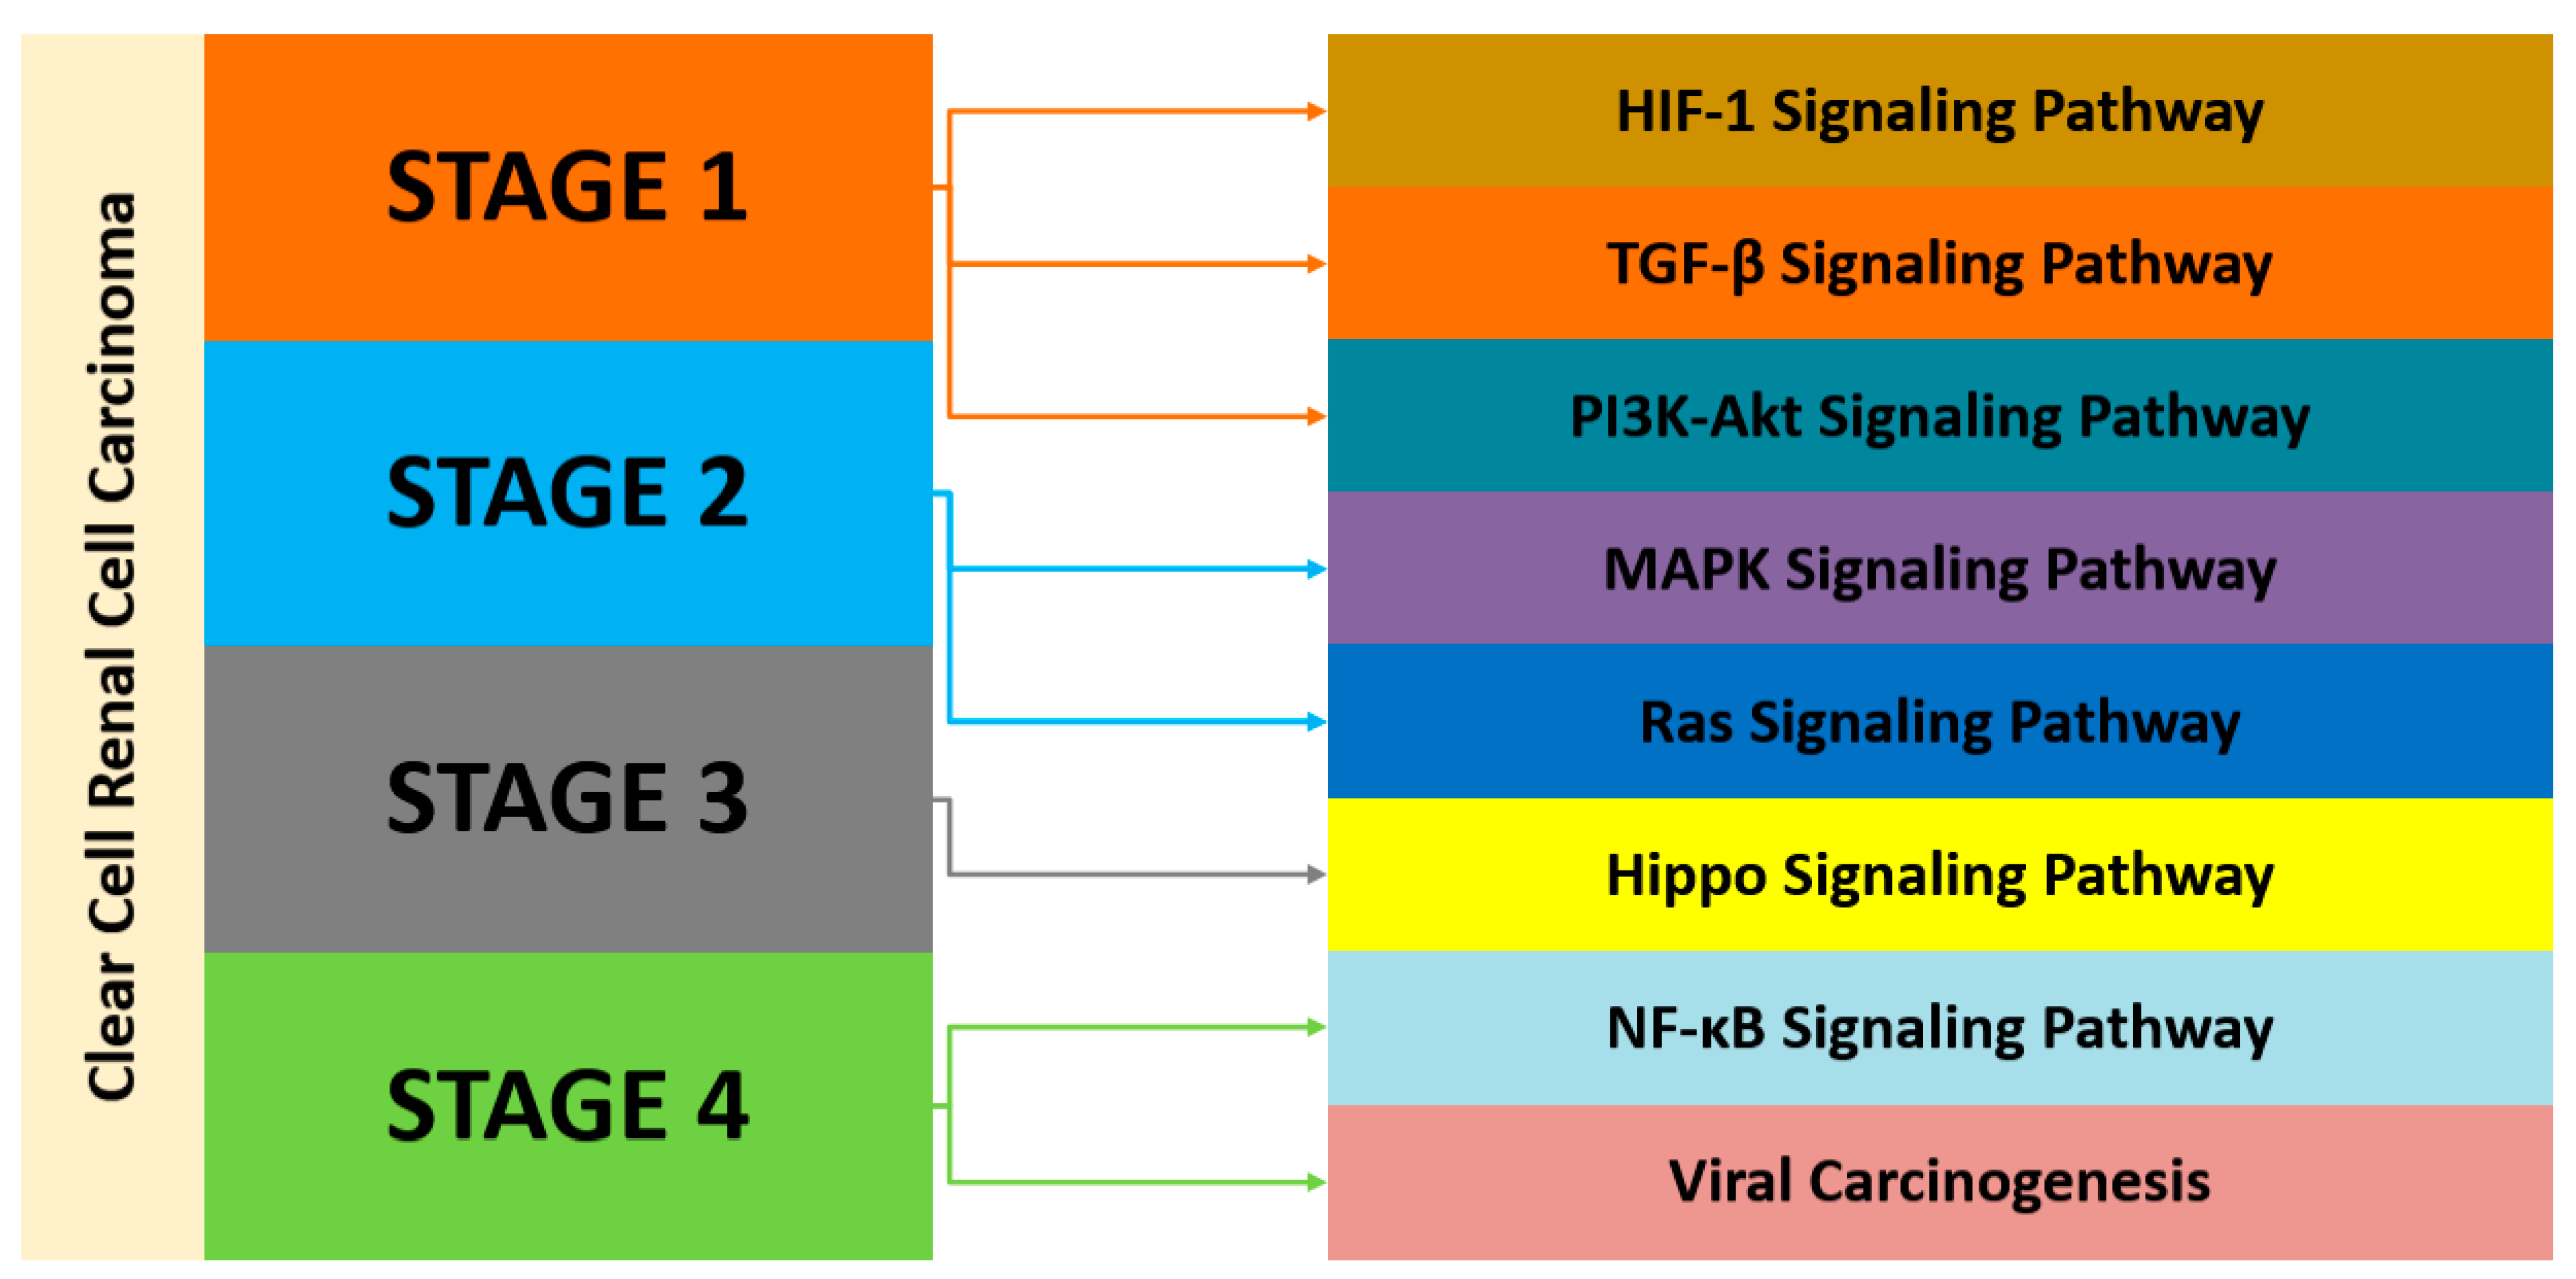
4.1. Gene Expression Modules and Pathway Analysis across the Datasets
4.2. Module Key Hub Genes and Their Protein Functions
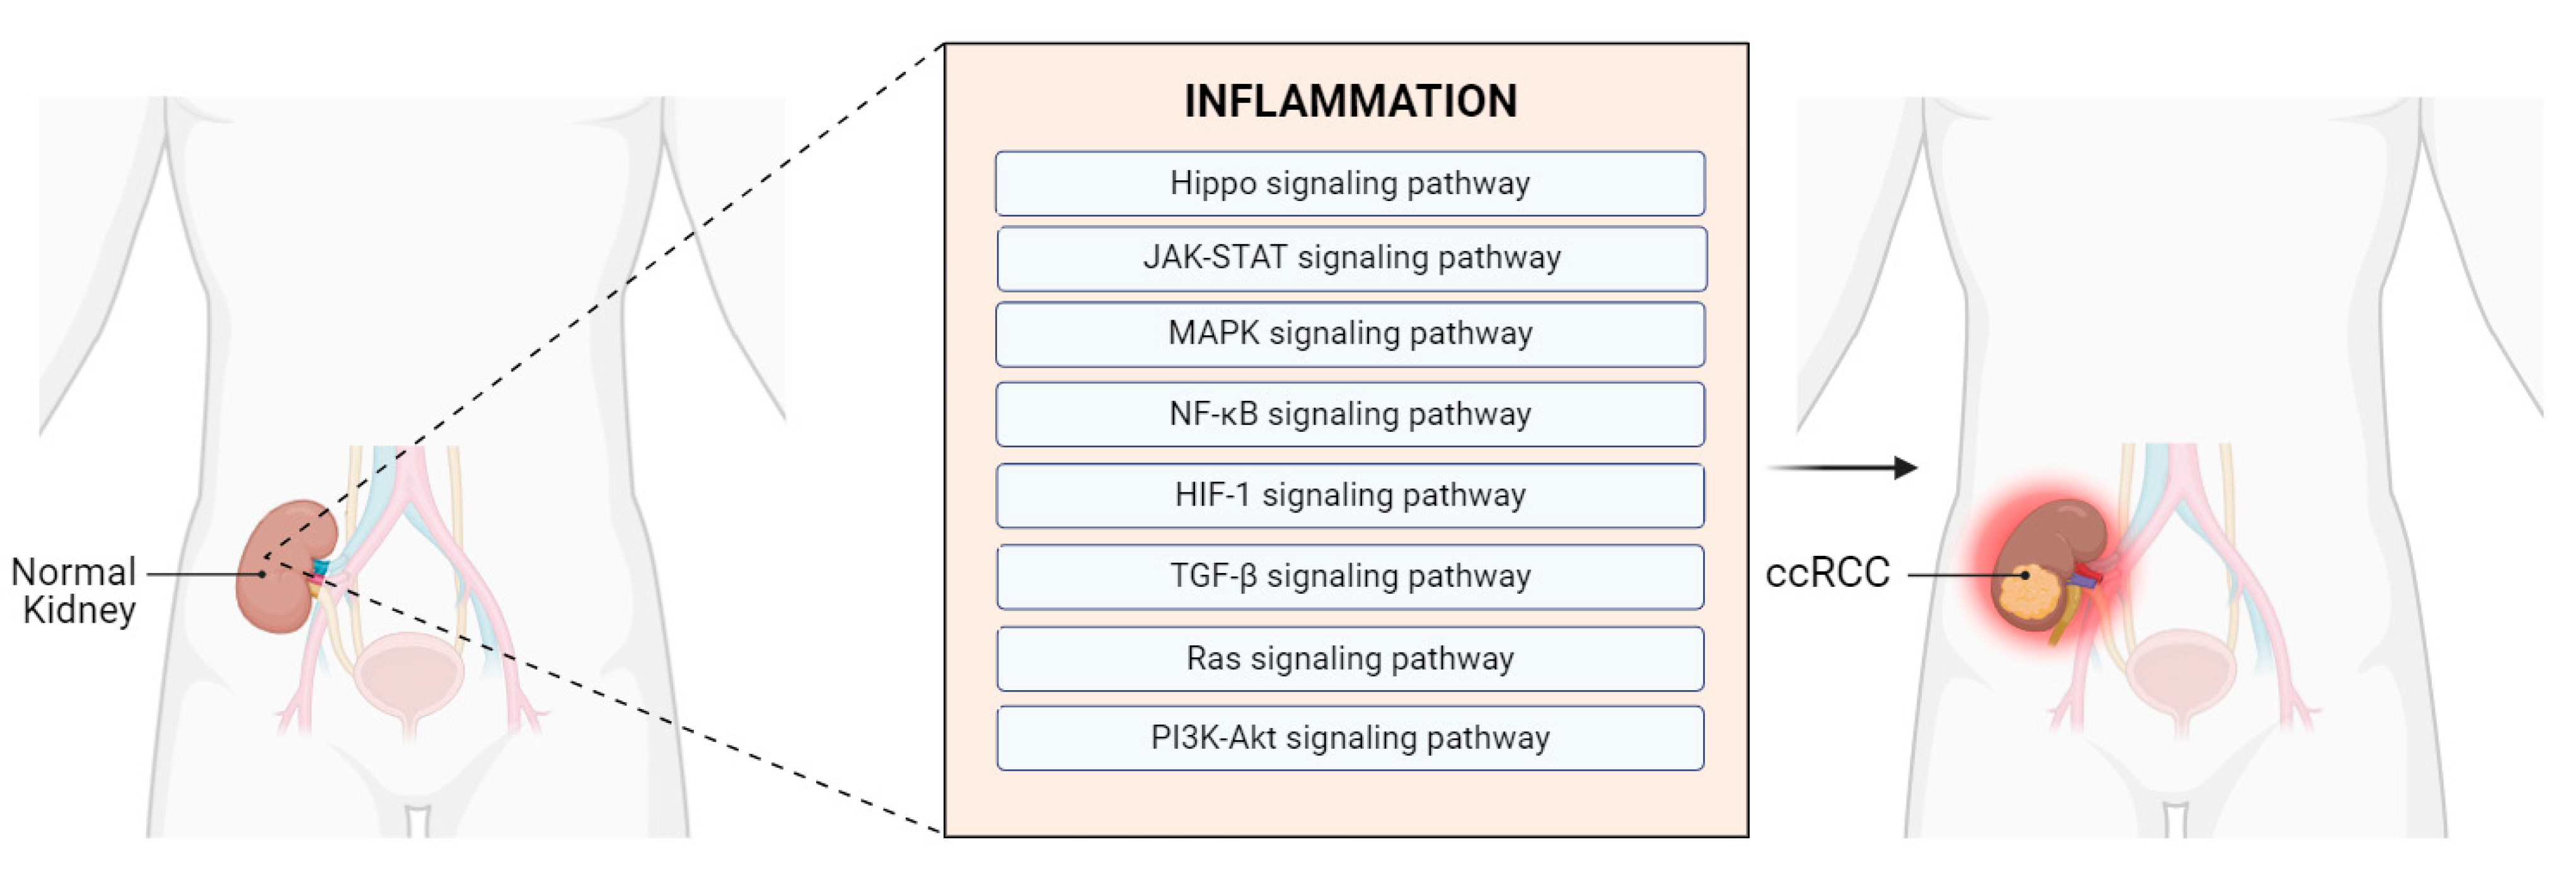
4.2.1. Involvement of Hub Genes in Inflammation-Related Pathways Associated with ccRCC
4.2.2. Protein Chaperones and Epigenetic Regulators in Inflammation and Tumor Development in ccRCC
4.2.3. Metabolic Reprogramming in ccRCC
4.3. Viral Infections Associated with ccRCC
4.4. Drug Repurposing Based on Gene Signatures
5. Conclusions
Supplementary Materials
Author Contributions
Funding
Institutional Review Board Statement
Informed Consent Statement
Data Availability Statement
Acknowledgments
Conflicts of Interest
Appendix A

| KEGG | Term | Count | p-Value |
|---|---|---|---|
| Blue | Pathways in cancer | 68 | 1.27 × 10⁻⁵ |
| Viral carcinogenesis | 33 | 5.01 × 10⁻⁵ | |
| Ras signaling pathway | 29 | 0.01091 | |
| TGF-β signaling pathway | 18 | 0.002582 | |
| Renal cell carcinoma | 16 | 1.63 × 10⁻⁴ | |
| Brown | Pathways in cancer | 65 | 2.69 × 10⁻⁶ |
| PI3K-Akt signaling pathway | 46 | 3.74 × 10⁻⁵ | |
| MAPK signaling pathway | 37 | 4.46 × 10⁻⁴ | |
| Hippo signaling pathway | 23 | 7.59 × 10⁻⁴ | |
| Renal cell carcinoma | 11 | 0.017668 | |
| Red | Pathways in cancer | 66 | 2.69 × 10⁻⁶ |
| MAPK signaling pathway | 43 | 1.50 × 10⁻⁶ | |
| PI3K-Akt signaling pathway | 41 | 5.81 × 10⁻⁴ | |
| Ras signaling pathway | 30 | 7.19 × 10⁻⁴ | |
| HIF-1 signaling pathway | 17 | 0.003199 |
| KEGG | Term | Count | p-Value |
|---|---|---|---|
| Turquoise | Pathways in cancer | 63 | 3.51 × 10⁻⁶ |
| PI3K-Akt signaling pathway | 47 | 7.03 × 10⁻⁶ | |
| MAPK signaling pathway | 37 | 2.28 × 10⁻⁴ | |
| Hippo signaling pathway | 21 | 0.002751 | |
| mTOR signaling pathway | 19 | 0.013614 | |
| Yellow | Metabolic pathways | 123 | 0.029441 |
| Pathways in cancer | 60 | 6.99 × 10⁻⁵ | |
| EGFR tyrosine kinase inhibitor resistance | 14 | 2.31 × 10⁻³ | |
| NF-kB signaling pathway | 14 | 0.022381 | |
| HIF-1 signaling pathway | 14 | 0.029444 | |
| Green | Pathways in cancer | 58 | 5.47 × 10⁻⁴ |
| Human papillomavirus infection | 35 | 0.013714 | |
| Human cytomegalovirus infection | 30 | 8.63 × 10⁻⁴ | |
| Viral carcinogenesis | 24 | 0.014283 | |
| Viral myocarditis | 16 | 5.64 × 10⁻⁵ |
| Category | Term | Count | p-Value |
|---|---|---|---|
| BP | GO:0045944~positive regulation of transcription by RNA polymerase II | 152 | 2.35 × 10⁻¹⁴ |
| GO:0045893~positive regulation of DNA-templated transcription | 94 | 4.34 × 10⁻¹¹ | |
| GO:0006338~chromatin remodeling | 69 | 3.39 × 10⁻¹⁷ | |
| GO:0000398~mRNA splicing, via spliceosome | 47 | 2.93 × 10⁻¹⁴ | |
| GO:0008380~RNA splicing | 38 | 5.65 × 10⁻⁹ | |
| CC | GO:0005829~cytosol | 656 | 6.62 × 10−79 |
| GO:0005634~nucleus | 627 | 2.76 × 10−50 | |
| GO:0005737~cytoplasm | 550 | 9.12 × 10⁻³⁴ | |
| GO:0005654~nucleoplasm | 544 | 2.40 × 10−85 | |
| GO:0000785~chromatin | 120 | 1.89 × 10⁻⁸ | |
| MF | GO:0005515~protein binding | 1116 | 7.48 × 10−69 |
| GO:0003723~RNA binding | 248 | 7.34 × 10−46 | |
| GO:0042802~identical protein binding | 169 | 3.16 × 10⁻⁷ | |
| GO:0061629~RNA polymerase II-specific DNA-binding transcription factor binding | 31 | 4.44 × 10⁻⁶ | |
| GO:0140297~DNA-binding transcription factor binding | 30 | 3.22 × 10⁻⁶ |
| Category | Term | Count | p-Value |
|---|---|---|---|
| BP | GO:0045944~positive regulation of transcription by RNA polymerase II | 115 | 4.74 × 10⁻⁹ |
| GO:0007165~signal transduction | 114 | 4.41 × 10⁻⁹ | |
| GO:0000122~negative regulation of transcription by RNA polymerase II | 81 | 2.91 × 10⁻⁵ | |
| GO:0045893~positive regulation of DNA-templated transcription | 68 | 2.60 × 10⁻⁶ | |
| GO:0008380~RNA splicing | 38 | 5.65 × 10⁻⁹ | |
| CC | GO:0005886~plasma membrane | 389 | 5.98 × 10⁻¹⁴ |
| GO:0005829~cytosol | 363 | 2.61 × 10⁻⁸ | |
| GO:0005737~cytoplasm | 345 | 6.44 × 10⁻⁵ | |
| GO:0005654~nucleoplasm | 245 | 5.81 × 10⁻⁴ | |
| GO:0070062~extracellular exosome | 188 | 1.76 × 10⁻¹² | |
| MF | GO:0005515~protein binding | 790 | 8.86 × 10⁻¹⁴ |
| GO:0042802~identical protein binding | 133 | 2.09 × 10⁻⁵ | |
| GO:0004672~protein kinase activity | 27 | 3.93 × 10⁻³ | |
| GO:0005178~integrin binding | 22 | 1.55 × 10⁻⁴ | |
| GO:0004713~protein tyrosine kinase activity | 17 | 1.26 × 10⁻⁴ |
| Category | Term | Count | p-Value |
|---|---|---|---|
| BP | GO:0045944~positive regulation of transcription by RNA polymerase II | 118 | 7.69 × 10⁻¹¹ |
| GO:0007165~signal transduction | 103 | 7.45 × 10⁻⁷ | |
| GO:0030154~cell differentiation | 58 | 3.70 × 10⁻⁵ | |
| GO:0045893~positive regulation of DNA-templated transcription | 56 | 0.0013 | |
| GO:0008284~positive regulation of cell population proliferation | 50 | 1.10 × 10⁻⁵ | |
| CC | GO:0005737~cytoplasm | 368 | 1.72 × 10⁻⁹ |
| GO:0005829~cytosol | 351 | 1.53 × 10⁻⁷ | |
| GO:0005654~nucleoplasm | 240 | 5.72 × 10⁻⁴ | |
| GO:0048471~perinuclear region of cytoplasm | 54 | 6.57 × 10⁻³ | |
| GO:0032991~protein-containing complex | 49 | 8.41 × 10⁻³ | |
| MF | GO:0005515~protein binding | 747 | 4.49 × 10⁻⁸ |
| GO:0042802~identical protein binding | 129 | 4.40 × 10⁻⁵ | |
| GO:0106310~protein serine kinase activity | 34 | 1.76 × 10⁻³ | |
| GO:0045296~cadherin binding | 33 | 8.03 × 10⁻⁴ | |
| GO:0043565~sequence-specific DNA binding | 32 | 1.00 × 10⁻⁴ |
References
- Muglia, V.F.; Prando, A. Renal Cell Carcinoma: Histological Classification and Correlation with Imaging Findings. Radiol. Bras. 2015, 48, 166–174. [Google Scholar] [CrossRef] [PubMed]
- Kanwal, R. Metastasis in Renal Cell Carcinoma: Biology and Treatment. Adv. Cancer Biol.-Metastasis 2023, 7, 100094. [Google Scholar] [CrossRef]
- Sanchez, D.J.; Simon, M.C. Genetic and Metabolic Hallmarks of Clear Cell Renal Cell Carcinoma. Biochim. Biophys. Acta (BBA)-Rev. Cancer 2018, 1870, 23–31. [Google Scholar] [CrossRef] [PubMed]
- Lam, J.; Klatte, T.; Breda, A. Staging of Renal Cell Carcinoma: Current Concepts. Indian J. Urol. 2009, 25, 446. [Google Scholar] [CrossRef] [PubMed]
- Cheaib, J.G.; Patel, H.D.; Johnson, M.H.; Gorin, M.A.; Haut, E.R.; Canner, J.K.; Allaf, M.E.; Pierorazio, P.M. Stage-Specific Conditional Survival in Renal Cell Carcinoma after Nephrectomy. Urol. Oncol. Semin. Orig. Investig. 2020, 38, 6.e1–6.e7. [Google Scholar] [CrossRef]
- Swami, U.; Nussenzveig, R.H.; Haaland, B.; Agarwal, N. Revisiting AJCC TNM Staging for Renal Cell Carcinoma: Quest for Improvement. Ann. Transl. Med. 2019, 7 (Suppl. S1), S18. [Google Scholar] [CrossRef]
- Kane, C.J.; Mallin, K.; Ritchey, J.; Cooperberg, M.R.; Carroll, P.R. Renal Cell Cancer Stage Migration. Cancer 2008, 113, 78–83. [Google Scholar] [CrossRef]
- Garfield, K.; LaGrange, C.A. Renal Cell Cancer; StatPearls Publishing: Treasure Island, FL, USA, 2024. [Google Scholar]
- Warren, A.Y.; Harrison, D. WHO/ISUP Classification, Grading and Pathological Staging of Renal Cell Carcinoma: Standards and Controversies. World J. Urol. 2018, 36, 1913–1926. [Google Scholar] [CrossRef]
- Rathmell, W.K.; Chen, S. VHL Inactivation in Renal Cell Carcinoma: Implications for Diagnosis, Prognosis and Treatment. Expert. Rev. Anticancer Ther. 2008, 8, 63–73. [Google Scholar] [CrossRef]
- Seizinger, B.R.; Rouleau, G.A.; Ozelius, L.J.; Lane, A.H.; Farmer, G.E.; Lamiell, J.M.; Haines, J.; Yuen, J.W.M.; Collins, D.; Majoor-Krakauer, D.; et al. Von Hippel–Lindau Disease Maps to the Region of Chromosome 3 Associated with Renal Cell Carcinoma. Nature 1988, 332, 268–269. [Google Scholar] [CrossRef]
- Los, M.; Jansen, G.H.; Kaelin, W.G.; Lips, C.J.; Blijham, G.H.; Voest, E.E. Expression Pattern of the von Hippel-Lindau Protein in Human Tissues. Lab. Investig. 1996, 75, 231–238. [Google Scholar] [PubMed]
- Latif, F.; Tory, K.; Gnarra, J.; Yao, M.; Duh, F.-M.; Orcutt, M.L.; Stackhouse, T.; Kuzmin, I.; Modi, W.; Geil, L.; et al. Identification of the von Hippel-Lindau Disease Tumor Suppressor Gene. Science (1979) 1993, 260, 1317–1320. [Google Scholar] [CrossRef] [PubMed]
- Kruk, L.; Mamtimin, M.; Braun, A.; Anders, H.-J.; Andrassy, J.; Gudermann, T.; Mammadova-Bach, E. Inflammatory Networks in Renal Cell Carcinoma. Cancers 2023, 15, 2212. [Google Scholar] [CrossRef]
- Mertz, K.D.; Demichelis, F.; Kim, R.; Schraml, P.; Storz, M.; Diener, P.-A.; Moch, H.; Rubin, M.A. Automated Immunofluorescence Analysis Defines Microvessel Area as a Prognostic Parameter in Clear Cell Renal Cell Cancer. Hum. Pathol. 2007, 38, 1454–1462. [Google Scholar] [CrossRef]
- Qian, C.; Huang, D.; Wondergem, B.; Teh, B.T. Complexity of Tumor Vasculature in Clear Cell Renal Cell Carcinoma. Cancer 2009, 115 (Suppl. S10), 2282–2289. [Google Scholar] [CrossRef]
- de Vivar Chevez, A.R.; Finke, J.; Bukowski, R. The Role of Inflammation in Kidney Cancer. In Inflammation and Cancer; Springer: Basel, Switzerland, 2014; pp. 197–234. [Google Scholar] [CrossRef]
- Godwin, J.L.; Zibelman, M.; Plimack, E.R.; Geynisman, D.M. Immune Checkpoint Blockade as a Novel Immunotherapeutic Strategy for Renal Cell Carcinoma: A Review of Clinical Trials. Discov. Med. 2014, 18, 341–350. [Google Scholar]
- Hwang, A.; Mehra, V.; Chhetri, J.; Ali, S.; Tran, M.; Roddie, C. Current Treatment Options for Renal Cell Carcinoma: Focus on Cell-Based Immunotherapy. Cancers 2024, 16, 1209. [Google Scholar] [CrossRef]
- Yang, J.; Wang, K.; Yang, Z. Treatment Strategies for Clear Cell Renal Cell Carcinoma: Past, Present and Future. Front. Oncol. 2023, 13, 1133832. [Google Scholar] [CrossRef] [PubMed]
- Randrup Hansen, C.; Grimm, D.; Bauer, J.; Wehland, M.; Magnusson, N. Effects and Side Effects of Using Sorafenib and Sunitinib in the Treatment of Metastatic Renal Cell Carcinoma. Int. J. Mol. Sci. 2017, 18, 461. [Google Scholar] [CrossRef]
- Jin, J.; Xie, Y.; Zhang, J.-S.; Wang, J.-Q.; Dai, S.-J.; He, W.; Li, S.-Y.; Ashby, C.R.; Chen, Z.-S.; He, Q. Sunitinib Resistance in Renal Cell Carcinoma: From Molecular Mechanisms to Predictive Biomarkers. Drug Resist. Updates 2023, 67, 100929. [Google Scholar] [CrossRef]
- Langfelder, P.; Horvath, S. WGCNA: An R Package for Weighted Correlation Network Analysis. BMC Bioinform. 2008, 9, 559. [Google Scholar] [CrossRef] [PubMed]
- Manuel, M.T.A.; Tayo, L.L. Navigating the Gene Co-Expression Network and Drug Repurposing Opportunities for Brain Disorders Associated with Neurocognitive Impairment. Brain Sci. 2023, 13, 1564. [Google Scholar] [CrossRef] [PubMed]
- Pasamba, E.C.; Orda, M.A.; Villanueva, B.H.A.; Tsai, P.-W.; Tayo, L.L. Transcriptomic Analysis of Hub Genes Reveals Associated Inflammatory Pathways in Estrogen-Dependent Gynecological Diseases. Biology 2024, 13, 397. [Google Scholar] [CrossRef] [PubMed]
- Orda, M.A.; Fowler, P.M.P.T.; Tayo, L.L. Modular Hub Genes in DNA Microarray Suggest Potential Signaling Pathway Interconnectivity in Various Glioma Grades. Biology 2024, 13, 206. [Google Scholar] [CrossRef] [PubMed]
- Lv, J.-H.; Hou, A.-J.; Zhang, S.-H.; Dong, J.-J.; Kuang, H.-X.; Yang, L.; Jiang, H. WGCNA Combined with Machine Learning to Find Potential Biomarkers of Liver Cancer. Medicine 2023, 102, e36536. [Google Scholar] [CrossRef]
- Yin, X.; Wang, P.; Yang, T.; Li, G.; Teng, X.; Huang, W.; Yu, H. Identification of Key Modules and Genes Associated with Breast Cancer Prognosis Using WGCNA and CeRNA Network Analysis. Aging 2021, 13, 2519–2538. [Google Scholar] [CrossRef]
- Zhu, Y.; Yang, X.; Zu, Y. Integrated Analysis of WGCNA and Machine Learning Identified Diagnostic Biomarkers in Dilated Cardiomyopathy with Heart Failure. Front. Cell Dev. Biol. 2022, 10, 1089915. [Google Scholar] [CrossRef]
- Mailem, R.C.; Tayo, L.L. Drug Repurposing Using Gene Co-Expression and Module Preservation Analysis in Acute Respiratory Distress Syndrome (ARDS), Systemic Inflammatory Response Syndrome (SIRS), Sepsis, and COVID-19. Biology 2022, 11, 1827. [Google Scholar] [CrossRef]
- Makino, T.; Kadomoto, S.; Izumi, K.; Mizokami, A. Epidemiology and Prevention of Renal Cell Carcinoma. Cancers 2022, 14, 4059. [Google Scholar] [CrossRef]
- Schiavoni, V.; Campagna, R.; Pozzi, V.; Cecati, M.; Milanese, G.; Sartini, D.; Salvolini, E.; Galosi, A.B.; Emanuelli, M. Recent Advances in the Management of Clear Cell Renal Cell Carcinoma: Novel Biomarkers and Targeted Therapies. Cancers 2023, 15, 3207. [Google Scholar] [CrossRef]
- Mattila, K.E.; Vainio, P.; Jaakkola, P.M. Prognostic Factors for Localized Clear Cell Renal Cell Carcinoma and Their Application in Adjuvant Therapy. Cancers 2022, 14, 239. [Google Scholar] [CrossRef]
- Infantino, V.; Santarsiero, A.; Convertini, P.; Todisco, S.; Iacobazzi, V. Cancer Cell Metabolism in Hypoxia: Role of HIF-1 as Key Regulator and Therapeutic Target. Int. J. Mol. Sci. 2021, 22, 5703. [Google Scholar] [CrossRef] [PubMed]
- Zhao, Y.; Xing, C.; Deng, Y.; Ye, C.; Peng, H. HIF-1α Signaling: Essential Roles in Tumorigenesis and Implications in Targeted Therapies. Genes Dis. 2024, 11, 234–251. [Google Scholar] [CrossRef]
- Lombardi, O.; Robert Mole, D. HIF Pathways in Clear Cell Renal Cancer. In Biomarkers and Bioanalysis Overview; IntechOpen: London, UK, 2021. [Google Scholar] [CrossRef]
- Malkov, M.I.; Lee, C.T.; Taylor, C.T. Regulation of the Hypoxia-Inducible Factor (HIF) by Pro-Inflammatory Cytokines. Cells 2021, 10, 2340. [Google Scholar] [CrossRef] [PubMed]
- Reiss, M. TGF-β and Cancer. Microbes Infect. 1999, 1, 1327–1347. [Google Scholar] [CrossRef] [PubMed]
- Sanjabi, S.; Oh, S.A.; Li, M.O. Regulation of the Immune Response by TGF-β: From Conception to Autoimmunity and Infection. Cold Spring Harb. Perspect. Biol. 2017, 9, a022236. [Google Scholar] [CrossRef]
- Giarratana, A.O.; Prendergast, C.M.; Salvatore, M.M.; Capaccione, K.M. TGF-β Signaling: Critical Nexus of Fibrogenesis and Cancer. J. Transl. Med. 2024, 22, 594. [Google Scholar] [CrossRef] [PubMed]
- Derynck, R.; Turley, S.J.; Akhurst, R.J. TGFβ Biology in Cancer Progression and Immunotherapy. Nat. Rev. Clin. Oncol. 2021, 18, 9–34. [Google Scholar] [CrossRef]
- Contreras, A.; Sánchez, S.A.; Rodríguez-Medina, C.; Botero, J.E. The Role and Impact of Viruses on Cancer Development. Periodontol. 2000 2024. [Google Scholar] [CrossRef]
- Guo, Y.; Pan, W.; Liu, S.; Shen, Z.; Xu, Y.; Hu, L. ERK/MAPK Signalling Pathway and Tumorigenesis (Review). Exp. Ther. Med. 2020, 19, 1997–2007. [Google Scholar] [CrossRef]
- Jayakumar, T.; Lin, K.-C.; Chang, C.-C.; Hsia, C.-W.; Manubolu, M.; Huang, W.-C.; Sheu, J.-R.; Hsia, C.-H. Targeting MAPK/NF-κB Pathways in Anti-Inflammatory Potential of Rutaecarpine: Impact on Src/FAK-Mediated Macrophage Migration. Int. J. Mol. Sci. 2021, 23, 92. [Google Scholar] [CrossRef] [PubMed]
- Brägelmann, J.; Lorenz, C.; Borchmann, S.; Nishii, K.; Wegner, J.; Meder, L.; Ostendorp, J.; Ast, D.F.; Heimsoeth, A.; Nakasuka, T.; et al. MAPK-Pathway Inhibition Mediates Inflammatory Reprogramming and Sensitizes Tumors to Targeted Activation of Innate Immunity Sensor RIG-I. Nat. Commun. 2021, 12, 5505. [Google Scholar] [CrossRef]
- Lv, L.; Zhou, X. Targeting Hippo Signaling in Cancer: Novel Perspectives and Therapeutic Potential. MedComm 2023, 4, e375. [Google Scholar] [CrossRef] [PubMed]
- Yang, Y.; Zhou, H.; Huang, X.; Wu, C.; Zheng, K.; Deng, J.; Zheng, Y.; Wang, J.; Chi, X.; Ma, X.; et al. Innate Immune and Proinflammatory Signals Activate the Hippo Pathway via a Tak1-STRIPAK-Tao Axis. Nat. Commun. 2024, 15, 145. [Google Scholar] [CrossRef] [PubMed]
- Fernandez-Medarde, A.; Santos, E. Ras in Cancer and Developmental Diseases. Genes Cancer 2011, 2, 344–358. [Google Scholar] [CrossRef] [PubMed]
- Sadeghi Shaker, M.; Rokni, M.; Mahmoudi, M.; Farhadi, E. Ras Family Signaling Pathway in Immunopathogenesis of Inflammatory Rheumatic Diseases. Front. Immunol. 2023, 14, 1151246. [Google Scholar] [CrossRef]
- Xiao, K.; Liu, C.; Tu, Z.; Xu, Q.; Chen, S.; Zhang, Y.; Wang, X.; Zhang, J.; Hu, C.-A.A.; Liu, Y. Activation of the NF-κB and MAPK Signaling Pathways Contributes to the Inflammatory Responses, but Not Cell Injury, in IPEC-1 Cells Challenged with Hydrogen Peroxide. Oxid. Med. Cell. Longev. 2020, 2020, 1–14. [Google Scholar] [CrossRef]
- Guo, P.; Wang, Z.; Zhou, Z.; Tai, Y.; Zhang, A.; Wei, W.; Wang, Q. Immuno-Hippo: Research Progress of the Hippo Pathway in Autoimmune Disease. Immunol. Lett. 2021, 230, 11–20. [Google Scholar] [CrossRef]
- Yang, Y.; Gan, X.; Zhang, W.; Zhu, B.; Huangfu, Z.; Shi, X.; Wang, L. Research Progress of the Hippo Signaling Pathway in Renal Cell Carcinoma. Asian J. Urol. 2024. [Google Scholar] [CrossRef]
- Sun, Y.; Jin, D.; Zhang, Z.; Jin, D.; Xue, J.; Duan, L.; Zhang, Y.; Kang, X.; Lian, F. The Critical Role of the Hippo Signaling Pathway in Kidney Diseases. Front. Pharmacol. 2022, 13, 988175. [Google Scholar] [CrossRef]
- Pavitra, E.; Kancharla, J.; Gupta, V.K.; Prasad, K.; Sung, J.Y.; Kim, J.; Tej, M.B.; Choi, R.; Lee, J.-H.; Han, Y.-K.; et al. The Role of NF-κB in Breast Cancer Initiation, Growth, Metastasis, and Resistance to Chemotherapy. Biomed. Pharmacother. 2023, 163, 114822. [Google Scholar] [CrossRef] [PubMed]
- Lin, Y.; Bai, L.; Chen, W.; Xu, S. The NF-κB Activation Pathways, Emerging Molecular Targets for Cancer Prevention and Therapy. Expert. Opin. Ther. Targets 2010, 14, 45–55. [Google Scholar] [CrossRef]
- Guo, Q.; Jin, Y.; Chen, X.; Ye, X.; Shen, X.; Lin, M.; Zeng, C.; Zhou, T.; Zhang, J. NF-κB in Biology and Targeted Therapy: New Insights and Translational Implications. Signal Transduct. Target. Ther. 2024, 9, 53. [Google Scholar] [CrossRef]
- D’Ignazio, L.; Bandarra, D.; Rocha, S. NF-κB and HIF Crosstalk in Immune Responses. FEBS J. 2016, 283, 413–424. [Google Scholar] [CrossRef] [PubMed]
- D’Ignazio, L.; Batie, M.; Rocha, S. Hypoxia and Inflammation in Cancer, Focus on HIF and NF-κB. Biomedicines 2017, 5, 21. [Google Scholar] [CrossRef]
- Li, X.; Cho, Y.S.; Zhu, J.; Zhuo, S.; Jiang, J. The Hippo Pathway Effector YAP Inhibits HIF2 Signaling and CcRCC Tumor Growth. Cell Discov. 2022, 8, 103. [Google Scholar] [CrossRef] [PubMed]
- Morgos, D.-T.; Stefani, C.; Miricescu, D.; Greabu, M.; Stanciu, S.; Nica, S.; Stanescu-Spinu, I.-I.; Balan, D.G.; Balcangiu-Stroescu, A.-E.; Coculescu, E.-C.; et al. Targeting PI3K/AKT/MTOR and MAPK Signaling Pathways in Gastric Cancer. Int. J. Mol. Sci. 2024, 25, 1848. [Google Scholar] [CrossRef]
- Fernandes, J.V.; De Medeiros Fernandes, T.A.A.; De Azevedo, J.C.V.; Cobucci, R.N.O.; De Carvalho, M.G.F.; Andrade, V.S.; De Araújo, J.M.G. Link between Chronic Inflammation and Human Papillomavirus-Induced Carcinogenesis (Review). Oncol. Lett. 2015, 9, 1015–1026. [Google Scholar] [CrossRef]
- Compton, T.; Kurt-Jones, E.A.; Boehme, K.W.; Belko, J.; Latz, E.; Golenbock, D.T.; Finberg, R.W. Human Cytomegalovirus Activates Inflammatory Cytokine Responses via CD14 and Toll-Like Receptor 2. J. Virol. 2003, 77, 4588–4596. [Google Scholar] [CrossRef]
- Kellogg, C.; Kouznetsova, V.L.; Tsigelny, I.F. Implications of Viral Infection in Cancer Development. Biochim. Biophys. Acta (BBA)-Rev. Cancer 2021, 1876, 188622. [Google Scholar] [CrossRef]
- Raji, L.; Tetteh, A.; Amin, A.R.M.R. Role of C-Src in Carcinogenesis and Drug Resistance. Cancers 2023, 16, 32. [Google Scholar] [CrossRef] [PubMed]
- Liu, Y.-P.; Zheng, C.-C.; Huang, Y.-N.; He, M.-L.; Xu, W.W.; Li, B. Molecular Mechanisms of Chemo- and Radiotherapy Resistance and the Potential Implications for Cancer Treatment. MedComm 2021, 2, 315–340. [Google Scholar] [CrossRef] [PubMed]
- Cossu-Rocca, P.; Muroni, M.R.; Sanges, F.; Sotgiu, G.; Asunis, A.; Tanca, L.; Onnis, D.; Pira, G.; Manca, A.; Dore, S.; et al. EGFR Kinase-Dependent and Kinase-Independent Roles in Clear Cell Renal Cell Carcinoma. Am. J. Cancer Res. 2016, 6, 71–83. [Google Scholar] [PubMed]
- Pu, Y.-S.; Huang, C.-Y.; Kuo, Y.-Z.; Kang, W.-Y.; Liu, G.-Y.; Huang, A.-M.; Yu, H.-J.; Lai, M.-K.; Huang, S.-P.; Wu, W.-J.; et al. Characterization of Membranous and Cytoplasmic EGFR Expression in Human Normal Renal Cortex and Renal Cell Carcinoma. J. Biomed. Sci. 2009, 16, 82. [Google Scholar] [CrossRef]
- Johnson, P.; Ruffell, B. CD44 and Its Role in Inflammation and Inflammatory Diseases. Inflamm. Allergy Drug Targets 2009, 8, 208–220. [Google Scholar] [CrossRef]
- Liang, G.; Li, S.; Du, W.; Ke, Q.; Cai, J.; Yang, J. Hypoxia Regulates CD44 Expression via Hypoxia-Inducible Factor-1α in Human Gastric Cancer Cells. Oncol. Lett. 2017, 13, 967–972. [Google Scholar] [CrossRef]
- Ryu, D.; Ryoo, I.; Kwak, M.-K. Overexpression of CD44 Standard Isoform Upregulates HIF-1α Signaling in Hypoxic Breast Cancer Cells. Biomol. Ther. 2018, 26, 487–493. [Google Scholar] [CrossRef]
- Papanastasiou, A.D.; Peroukidis, S.; Sirinian, C.; Arkoumani, E.; Chaniotis, D.; Zizi-Sermpetzoglou, A. CD44 Expression in Clear Cell Renal Cell Carcinoma (CcRCC) Correlates with Tumor Grade and Patient Survival and Is Affected by Gene Methylation. Genes 2024, 15, 537. [Google Scholar] [CrossRef]
- Kuwahara, G.; Hashimoto, T.; Tsuneki, M.; Yamamoto, K.; Assi, R.; Foster, T.R.; Hanisch, J.J.; Bai, H.; Hu, H.; Protack, C.D.; et al. CD44 Promotes Inflammation and Extracellular Matrix Production during Arteriovenous Fistula Maturation. Arterioscler. Thromb. Vasc. Biol. 2017, 37, 1147–1156. [Google Scholar] [CrossRef]
- Du, T.; Wu, Z.; Wu, Y.; Liu, Y.; Song, Y.; Ma, L. CD44 Is Associated with Poor Prognosis of CcRCC and Facilitates CcRCC Cell Migration and Invasion through HAS1/MMP9. Biomedicines 2023, 11, 2077. [Google Scholar] [CrossRef]
- Yaghobi, Z.; Movassaghpour, A.; Talebi, M.; Abdoli Shadbad, M.; Hajiasgharzadeh, K.; Pourvahdani, S.; Baradaran, B. The Role of CD44 in Cancer Chemoresistance: A Concise Review. Eur. J. Pharmacol. 2021, 903, 174147. [Google Scholar] [CrossRef] [PubMed]
- Njouendou, A.J.; Szarvas, T.; Tiofack, A.A.Z.; Kenfack, R.N.; Tonouo, P.D.; Ananga, S.N.; Bell, E.H.M.D.; Simo, G.; Hoheisel, J.D.; Siveke, J.T.; et al. SOX2 Dosage Sustains Tumor-Promoting Inflammation to Drive Disease Aggressiveness by Modulating the FOSL2/IL6 Axis. Mol. Cancer 2023, 22, 52. [Google Scholar] [CrossRef] [PubMed]
- Gu, W.; Wang, B.; Wan, F.; Wu, J.; Lu, X.; Wang, H.; Zhu, Y.; Zhang, H.; Shi, G.; Dai, B.; et al. SOX2 and SOX12 Are Predictive of Prognosis in Patients with Clear Cell Renal Cell Carcinoma. Oncol. Lett. 2018, 15, 4564–4570. [Google Scholar] [CrossRef] [PubMed]
- Zhang, S.; Xiong, X.; Sun, Y. Functional Characterization of SOX2 as an Anticancer Target. Signal Transduct. Target. Ther. 2020, 5, 135. [Google Scholar] [CrossRef]
- Castillo-Rodríguez, R.A.; Trejo-Solís, C.; Cabrera-Cano, A.; Gómez-Manzo, S.; Dávila-Borja, V.M. Hypoxia as a Modulator of Inflammation and Immune Response in Cancer. Cancers 2022, 14, 2291. [Google Scholar] [CrossRef]
- Deka, K.; Li, Y. Transcriptional Regulation during Aberrant Activation of NF-κB Signalling in Cancer. Cells 2023, 12, 788. [Google Scholar] [CrossRef]
- Karin, M. NF-κB as a Critical Link between Inflammation and Cancer. Cold Spring Harb. Perspect. Biol. 2009, 1, a000141. [Google Scholar] [CrossRef]
- Labrousse-Arias, D.; Martínez-Alonso, E.; Corral-Escariz, M.; Bienes-Martínez, R.; Berridy, J.; Serrano-Oviedo, L.; Conde, E.; García-Bermejo, M.-L.; Giménez-Bachs, J.M.; Salinas-Sánchez, A.S.; et al. VHL Promotes Immune Response against Renal Cell Carcinoma via NF-κB–Dependent Regulation of VCAM-1. J. Cell Biol. 2017, 216, 835–847. [Google Scholar] [CrossRef]
- Mirzaei, S.; Saghari, S.; Bassiri, F.; Raesi, R.; Zarrabi, A.; Hushmandi, K.; Sethi, G.; Tergaonkar, V. NF-κB as a Regulator of Cancer Metastasis and Therapy Response: A Focus on Epithelial–Mesenchymal Transition. J. Cell Physiol. 2022, 237, 2770–2795. [Google Scholar] [CrossRef]
- Campbell, K.J.; Tait, S.W.G. Targeting BCL-2 Regulated Apoptosis in Cancer. Open Biol. 2018, 8, 180002. [Google Scholar] [CrossRef]
- Kapoor, I.; Bodo, J.; Hill, B.T.; Hsi, E.D.; Almasan, A. Targeting BCL-2 in B-Cell Malignancies and Overcoming Therapeutic Resistance. Cell Death Dis. 2020, 11, 941. [Google Scholar] [CrossRef] [PubMed]
- Ren, W.; Xue, B.; Chen, M.; Liu, L.; Zu, X. Low Expression of ATM Indicates a Poor Prognosis in Clear Cell Renal Cell Carcinoma. Clin. Genitourin. Cancer 2019, 17, e433–e439. [Google Scholar] [CrossRef] [PubMed]
- Roelants, C.; Giacosa, S.; Pillet, C.; Bussat, R.; Champelovier, P.; Bastien, O.; Guyon, L.; Arnoux, V.; Cochet, C.; Filhol, O. Combined Inhibition of PI3K and Src Kinases Demonstrates Synergistic Therapeutic Efficacy in Clear-Cell Renal Carcinoma. Oncotarget 2018, 9, 30066–30078. [Google Scholar] [CrossRef] [PubMed]
- Slack, C. Ras Signaling in Aging and Metabolic Regulation. Nutr. Healthy Aging 2017, 4, 195–205. [Google Scholar] [CrossRef]
- Yi, M.; Li, T.; Niu, M.; Zhang, H.; Wu, Y.; Wu, K.; Dai, Z. Targeting Cytokine and Chemokine Signaling Pathways for Cancer Therapy. Signal Transduct. Target. Ther. 2024, 9, 176. [Google Scholar] [CrossRef]
- Ozga, A.J.; Chow, M.T.; Luster, A.D. Chemokines and the Immune Response to Cancer. Immunity 2021, 54, 859–874. [Google Scholar] [CrossRef]
- Li, H.; Wu, M.; Zhao, X. Role of Chemokine Systems in Cancer and Inflammatory Diseases. MedComm 2022, 3, e147. [Google Scholar] [CrossRef]
- Nagarsheth, N.; Wicha, M.S.; Zou, W. Chemokines in the Cancer Microenvironment and Their Relevance in Cancer Immunotherapy. Nat. Rev. Immunol. 2017, 17, 559–572. [Google Scholar] [CrossRef]
- Fu, M.; Hu, Y.; Lan, T.; Guan, K.-L.; Luo, T.; Luo, M. The Hippo Signalling Pathway and Its Implications in Human Health and Diseases. Signal Transduct. Target. Ther. 2022, 7, 376. [Google Scholar] [CrossRef]
- Hussein, N.A.; Ebid, S.A.; Ahmad, M.A.; Khedr, G.E.; Saad, D.M. The Possible Correlation between MiR-762, Hippo Signaling Pathway, TWIST1, and SMAD3 in Lung Cancer and Chronic Inflammatory Diseases. Sci. Rep. 2024, 14, 8246. [Google Scholar] [CrossRef]
- Cheng, Y.; Chen, J.; Shi, Y.; Fang, X.; Tang, Z. MAPK Signaling Pathway in Oral Squamous Cell Carcinoma: Biological Function and Targeted Therapy. Cancers 2022, 14, 4625. [Google Scholar] [CrossRef] [PubMed]
- Broom, O.J.; Widjaya, B.; Troelsen, J.; Olsen, J.; Nielsen, O.H. Mitogen Activated Protein Kinases: A Role in Inflammatory Bowel Disease? Clin. Exp. Immunol. 2009, 158, 272–280. [Google Scholar] [CrossRef] [PubMed]
- Manzoor, Z.; Koh, Y.-S. Mitogen-Activated Protein Kinases in Inflammation. J. Bacteriol. Virol. 2012, 42, 189. [Google Scholar] [CrossRef]
- Xie, Q.; Liu, R.; Zou, Z.; Feng, Y.; Huang, Y.; Xu, G.; Sun, W.; Liang, Y.; Zhong, W. MYPT1 Inhibits the Metastasis of Renal Clear Cell Carcinoma via the MAPK8/N-cadherin Pathway. FEBS Open Bio 2022, 12, 2083–2095. [Google Scholar] [CrossRef]
- Hoffmeister, L.; Diekmann, M.; Brand, K.; Huber, R. GSK3: A Kinase Balancing Promotion and Resolution of Inflammation. Cells 2020, 9, 820. [Google Scholar] [CrossRef]
- Guo, H.; German, P.; Bai, S.; Barnes, S.; Guo, W.; Qi, X.; Lou, H.; Liang, J.; Jonasch, E.; Mills, G.B.; et al. The PI3K/AKT Pathway and Renal Cell Carcinoma. J. Genet. Genom. 2015, 42, 343–353. [Google Scholar] [CrossRef]
- Banumathy, G.; Cairns, P. Signaling Pathways in Renal Cell Carcinoma. Cancer Biol. Ther. 2010, 10, 658–664. [Google Scholar] [CrossRef]
- Sourbier, C.; Lindner, V.; Lang, H.; Agouni, A.; Schordan, E.; Danilin, S.; Rothhut, S.; Jacqmin, D.; Helwig, J.-J.; Massfelder, T. The Phosphoinositide 3-Kinase/Akt Pathway: A New Target in Human Renal Cell Carcinoma Therapy. Cancer Res. 2006, 66, 5130–5142. [Google Scholar] [CrossRef]
- Henderson, B.; Pockley, A.G. Molecular Chaperones and Protein-Folding Catalysts as Intercellular Signaling Regulators in Immunity and Inflammation. J. Leukoc. Biol. 2010, 88, 445–462. [Google Scholar] [CrossRef]
- Zhao, H.; Raines, L.N.; Huang, S.C.-C. Molecular Chaperones: Molecular Assembly Line Brings Metabolism and Immunity in Shape. Metabolites 2020, 10, 394. [Google Scholar] [CrossRef]
- Neckers, L.; Tatu, U. Molecular Chaperones in Pathogen Virulence: Emerging New Targets for Therapy. Cell Host Microbe 2008, 4, 519–527. [Google Scholar] [CrossRef] [PubMed]
- Horváth, I.; Multhoff, G.; Sonnleitner, A.; Vígh, L. Membrane-Associated Stress Proteins: More than Simply Chaperones. Biochim. Biophys. Acta (BBA)-Biomembr. 2008, 1778, 1653–1664. [Google Scholar] [CrossRef] [PubMed]
- Vezzani, B.; Carinci, M.; Previati, M.; Giacovazzi, S.; Della Sala, M.; Gafà, R.; Lanza, G.; Wieckowski, M.R.; Pinton, P.; Giorgi, C. Epigenetic Regulation: A Link between Inflammation and Carcinogenesis. Cancers 2022, 14, 1221. [Google Scholar] [CrossRef] [PubMed]
- Angulo, J.C.; Manini, C.; López, J.I.; Pueyo, A.; Colás, B.; Ropero, S. The Role of Epigenetics in the Progression of Clear Cell Renal Cell Carcinoma and the Basis for Future Epigenetic Treatments. Cancers 2021, 13, 2071. [Google Scholar] [CrossRef]
- Stylianou, E. Epigenetics of Chronic Inflammatory Diseases. J. Inflamm. Res. 2018, 12, 1–14. [Google Scholar] [CrossRef]
- Wei, H.; Zhang, Y.; Jia, Y.; Chen, X.; Niu, T.; Chatterjee, A.; He, P.; Hou, G. Heat Shock Protein 90: Biological Functions, Diseases, and Therapeutic Targets. MedComm 2024, 5, e470. [Google Scholar] [CrossRef]
- Zuehlke, A.D.; Beebe, K.; Neckers, L.; Prince, T. Regulation and Function of the Human HSP90AA1 Gene. Gene 2015, 570, 8–16. [Google Scholar] [CrossRef]
- Ashburner, B.P.; Westerheide, S.D.; Baldwin, A.S. The P65 (RelA) Subunit of NF-κB Interacts with the Histone Deacetylase (HDAC) Corepressors HDAC1 and HDAC2 To Negatively Regulate Gene Expression. Mol. Cell Biol. 2001, 21, 7065–7077. [Google Scholar] [CrossRef]
- Yang, J.; Xu, J.; Wang, W.; Zhang, B.; Yu, X.; Shi, S. Epigenetic Regulation in the Tumor Microenvironment: Molecular Mechanisms and Therapeutic Targets. Signal Transduct. Target. Ther. 2023, 8, 210. [Google Scholar] [CrossRef]
- Hamilton, J.P. Epigenetics: Principles and Practice. Dig. Dis. 2011, 29, 130–135. [Google Scholar] [CrossRef]
- Bure, I.V.; Nemtsova, M.V.; Kuznetsova, E.B. Histone Modifications and Non-Coding RNAs: Mutual Epigenetic Regulation and Role in Pathogenesis. Int. J. Mol. Sci. 2022, 23, 5801. [Google Scholar] [CrossRef] [PubMed]
- Tang, J.; Yan, H.; Zhuang, S. Histone Deacetylases as Targets for Treatment of Multiple Diseases. Clin. Sci. 2013, 124, 651–662. [Google Scholar] [CrossRef]
- Husain, S.; Obert, E.; Singh, S.; Schnabolk, G. Inhibition of HDAC1 and 3 in the Presence of Systemic Inflammation Reduces Retinal Degeneration in a Model of Dry Age-Related Macular Degeneration. J. Ocul. Pharmacol. Ther. 2024, 40, 397–406. [Google Scholar] [CrossRef] [PubMed]
- Matt, T. Transcriptional Control of the Inflammatory Response: A Role for the CREB-Binding Protein (CBP). Acta Med. Austriaca 2002, 29, 77–79. [Google Scholar] [CrossRef]
- Zhu, Y.; Wang, Z.; Li, Y.; Peng, H.; Liu, J.; Zhang, J.; Xiao, X. The Role of CREBBP/EP300 and Its Therapeutic Implications in Hematological Malignancies. Cancers 2023, 15, 1219. [Google Scholar] [CrossRef]
- Zhu, H.; Wang, X.; Lu, S.; Ou, K. Metabolic Reprogramming of Clear Cell Renal Cell Carcinoma. Front. Endocrinol. 2023, 14, 1195500. [Google Scholar] [CrossRef]
- Wettersten, H.I.; Aboud, O.A.; Lara, P.N.; Weiss, R.H. Metabolic Reprogramming in Clear Cell Renal Cell Carcinoma. Nat. Rev. Nephrol. 2017, 13, 410–419. [Google Scholar] [CrossRef]
- Monteiro, M.S.; Barros, A.S.; Pinto, J.; Carvalho, M.; Pires-Luís, A.S.; Henrique, R.; Jerónimo, C.; Bastos, M.d.L.; Gil, A.M.; Guedes de Pinho, P. Nuclear Magnetic Resonance Metabolomics Reveals an Excretory Metabolic Signature of Renal Cell Carcinoma. Sci. Rep. 2016, 6, 37275. [Google Scholar] [CrossRef] [PubMed]
- Wang, L.; Fang, Z.; Gao, P.; Zheng, J. GLUD1 Suppresses Renal Tumorigenesis and Development via Inhibiting PI3K/Akt/MTOR Pathway. Front. Oncol. 2022, 12, 975517. [Google Scholar] [CrossRef]
- Coloff, J.L.; Murphy, J.P.; Braun, C.R.; Harris, I.S.; Shelton, L.M.; Kami, K.; Gygi, S.P.; Selfors, L.M.; Brugge, J.S. Differential Glutamate Metabolism in Proliferating and Quiescent Mammary Epithelial Cells. Cell Metab. 2016, 23, 867–880. [Google Scholar] [CrossRef]
- Craze, M.L.; El-Ansari, R.; Aleskandarany, M.A.; Cheng, K.W.; Alfarsi, L.; Masisi, B.; Diez-Rodriguez, M.; Nolan, C.C.; Ellis, I.O.; Rakha, E.A.; et al. Glutamate Dehydrogenase (GLUD1) Expression in Breast Cancer. Breast Cancer Res. Treat. 2019, 174, 79–91. [Google Scholar] [CrossRef] [PubMed]
- Wu, Y.-J.; Hu, Z.-L.; Hu, S.-D.; Li, Y.-X.; Xing, X.-W.; Yang, Y.; Du, X.-H. Glutamate Dehydrogenase Inhibits Tumor Growth in Gastric Cancer through the Notch Signaling Pathway. Cancer Biomark. 2019, 26, 303–312. [Google Scholar] [CrossRef] [PubMed]
- Ragone, R.; Sallustio, F.; Piccinonna, S.; Rutigliano, M.; Vanessa, G.; Palazzo, S.; Lucarelli, G.; Ditonno, P.; Battaglia, M.; Fanizzi, F.; et al. Renal Cell Carcinoma: A Study through NMR-Based Metabolomics Combined with Transcriptomics. Diseases 2016, 4, 7. [Google Scholar] [CrossRef]
- Bersanelli, M.; Casartelli, C.; Buti, S.; Porta, C. Renal Cell Carcinoma and Viral Infections: A Dangerous Relationship? World J. Nephrol. 2022, 11, 1–12. [Google Scholar] [CrossRef]
- Chaudhary, R.; Meher, A.; Krishnamoorthy, P.; Kumar, H. Interplay of Host and Viral Factors in Inflammatory Pathway Mediated Cytokine Storm during RNA Virus Infection. Curr. Res. Immunol. 2023, 4, 100062. [Google Scholar] [CrossRef]
- Sarier, M. Association between Human Papillomavirus and Urological Cancers: An Update. In Molecular Mechanisms in Cancer; IntechOpen: London, UK, 2022. [Google Scholar] [CrossRef]
- Read, S.A.; Douglas, M.W. Virus Induced Inflammation and Cancer Development. Cancer Lett. 2014, 345, 174–181. [Google Scholar] [CrossRef]
- Farhadi, A.; Behzad-Behbahani, A.; Geramizadeh, B.; Sekawi, Z.; Rahsaz, M.; Sharifzadeh, S. High-risk Human Papillomavirus Infection in Different Histological Subtypes of Renal Cell Carcinoma. J. Med. Virol. 2014, 86, 1134–1144. [Google Scholar] [CrossRef] [PubMed]
- Salehipoor, M.; Khezri, A.; Behzad-Behbahani, A.; Geramizadeh, B.; Rahsaz, M.; Aghdaei, M.; Afrasiabi, M.A. Role of Viruses in Renal Cell Carcinoma. Saudi J. Kidney Dis. Transpl. 2012, 23, 53–57. [Google Scholar]
- Rinaldi, I.; Muthalib, A.; Sutandar, J.W.; Kuncoro, H.A.; Harsono, B.I.; Susanto, N.; Setiawan, T.; Winston, K.; Dewantara, I.R.; Amin, I.F.; et al. Cytomegalovirus Infection in Patient with Clear Cell Renal Cell Carcinoma. Case Rep. Med. 2023, 2023, 1–6. [Google Scholar] [CrossRef]
- Vlachos, N.; Lampros, M.; Voulgaris, S.; Alexiou, G.A. Repurposing Antipsychotics for Cancer Treatment. Biomedicines 2021, 9, 1785. [Google Scholar] [CrossRef]
- Xia, Y.; Sun, M.; Huang, H.; Jin, W.-L. Drug Repurposing for Cancer Therapy. Signal Transduct. Target. Ther. 2024, 9, 92. [Google Scholar] [CrossRef] [PubMed]
- Duarte, T.; Barbisan, F.; do Prado-Lima, P.A.S.; Azzolin, V.F.; da Cruz Jung, I.E.; Duarte, M.M.M.F.; Teixeira, C.F.; Mastella, M.H.; da Cruz, I.B.M. Ziprasidone, a Second-Generation Antipsychotic Drug, Triggers a Macrophage Inflammatory Response in Vitro. Cytokine 2018, 106, 101–107. [Google Scholar] [CrossRef] [PubMed]
- Yang, Y.; Zheng, M.; Han, F.; Shang, L.; Li, M.; Gu, X.; Li, H.; Chen, L. Ziprasidone Suppresses Pancreatic Adenocarcinoma Cell Proliferation by Targeting GOT1 to Trigger Glutamine Metabolism Reprogramming. J. Mol. Med. 2022, 100, 599–612. [Google Scholar] [CrossRef] [PubMed]
- Sahu, A.; Ahmad, S.; Imtiyaz, K.; Kizhakkeppurath Kumaran, A.; Islam, M.; Raza, K.; Easwaran, M.; Kurukkan Kunnath, A.; Rizvi, M.A.; Verma, S. In-Silico and in-Vitro Study Reveals Ziprasidone as a Potential Aromatase Inhibitor against Breast Carcinoma. Sci. Rep. 2023, 13, 16545. [Google Scholar] [CrossRef] [PubMed]
- Cai, N.; Zhou, W.; Ye, L.-L.; Chen, J.; Liang, Q.-N.; Chang, G.; Chen, J.-J. The STAT3 Inhibitor Pimozide Impedes Cell Proliferation and Induces ROS Generation in Human Osteosarcoma by Suppressing Catalase Expression. Am. J. Transl. Res. 2017, 9, 3853–3866. [Google Scholar]
- Rho, S.B.; Kim, B.-R.; Kang, S. A Gene Signature-Based Approach Identifies Thioridazine as an Inhibitor of Phosphatidylinositol-3′-Kinase (PI3K)/AKT Pathway in Ovarian Cancer Cells. Gynecol. Oncol. 2011, 120, 121–127. [Google Scholar] [CrossRef]
- Kang, S.; Dong, S.M.; Kim, B.-R.; Park, M.S.; Trink, B.; Byun, H.-J.; Rho, S.B. Thioridazine Induces Apoptosis by Targeting the PI3K/Akt/MTOR Pathway in Cervical and Endometrial Cancer Cells. Apoptosis 2012, 17, 989–997. [Google Scholar] [CrossRef]
- Sousa, S.M.; Xavier, C.P.R.; Vasconcelos, M.H.; Palmeira, A. Repurposing Some of the Well-Known Non-Steroid Anti-Inflammatory Drugs (NSAIDs) for Cancer Treatment. Curr. Top. Med. Chem. 2023, 23, 1171–1195. [Google Scholar] [CrossRef]
- Schwandt, A.; Garcia, J.A.; Elson, P.; Wyckhouse, J.; Finke, J.H.; Ireland, J.; Triozzi, P.; Zhou, M.; Dreicer, R.; Rini, B.I. Clinical and Immunomodulatory Effects of Celecoxib Plus Interferon-Alpha in Metastatic Renal Cell Carcinoma Patients with COX-2 Tumor Immunostaining. J. Clin. Immunol. 2011, 31, 690–698. [Google Scholar] [CrossRef]
- Neve, V.; Kamble, A.; Karwa, P. Repurposing of Drug Aspirin in Colon Cancer: Therapeutic Approach. Clin. Cancer Investig. J. 2024, 13, 23–28. [Google Scholar] [CrossRef]
- Endo, H.; Yano, M.; Okumura, Y.; Kido, H. Ibuprofen Enhances the Anticancer Activity of Cisplatin in Lung Cancer Cells by Inhibiting the Heat Shock Protein 70. Cell Death Dis. 2014, 5, e1027. [Google Scholar] [CrossRef] [PubMed]
- McQuerry, J.A.; Chen, J.; Chang, J.T.; Bild, A.H. Tepoxalin Increases Chemotherapy Efficacy in Drug-Resistant Breast Cancer Cells Overexpressing the Multidrug Transporter Gene ABCB1. Transl. Oncol. 2021, 14, 101181. [Google Scholar] [CrossRef] [PubMed]
- Deb, J.; Majumder, J.; Bhattacharyya, S.; Jana, S.S. A Novel Naproxen Derivative Capable of Displaying Anti-Cancer and Anti-Migratory Properties against Human Breast Cancer Cells. BMC Cancer 2014, 14, 567. [Google Scholar] [CrossRef]
- Emam Kassab, S. Indomethacin from Anti-Inflammatory to Anticancer Agent. In Medicinal Chemistry; IntechOpen: London, UK, 2019. [Google Scholar] [CrossRef]
- Famaey, J.P.; Gaci, O.; Ginsberg, F. Fentiazac in the Treatment of Osteoarthritis and Tendinitis. Curr. Med. Res. Opin. 1983, 8, 675–681. [Google Scholar] [CrossRef]
- Purssell, E. Cyclooxygenase Inhibitors Inhibit Antibody Response through Interference with MAPK/ERK Pathways and BLIMP-1 Inhibition. Med. Hypotheses 2014, 83, 372–377. [Google Scholar] [CrossRef]
- Abo-El Fetoh, M.E.; Abdel-Fattah, M.M.; Mohamed, W.R.; Ramadan, L.A.A.; Afify, H. Cyclooxygenase-2 Activates EGFR–ERK1/2 Pathway via PGE2-Mediated ADAM-17 Signaling in Testosterone-Induced Benign Prostatic Hyperplasia. Inflammopharmacology 2023, 31, 499–516. [Google Scholar] [CrossRef]
- Marcade, M.; Bourdin, J.; Loiseau, N.; Peillon, H.; Rayer, A.; Drouin, D.; Schweighoffer, F.; Désiré, L. Etazolate, a Neuroprotective Drug Linking GABA A Receptor Pharmacology to Amyloid Precursor Protein Processing. J. Neurochem. 2008, 106, 392–404. [Google Scholar] [CrossRef] [PubMed]
- Balaraman, R.; Gandhi, H. Asenapine, a New Sublingual Atypical Antipsychotic. J. Pharmacol. Pharmacother. 2010, 1, 60–61. [Google Scholar] [CrossRef]
- DRUGBANK. Asenapine: Uses, Interactions, Mechanism of Action|DrugBank Online. Available online: https://go.drugbank.com/drugs/DB06216 (accessed on 9 August 2024).
- Aronson, J.K. Dicycloverine. In Meyler’s Side Effects of Drugs; Elsevier: Amsterdam, The Netherlands, 2016; p. 950. [Google Scholar] [CrossRef]
- Shang, D.; Han, T.; Xu, X.; Liu, Y. Decitabine Induces G2/M Cell Cycle Arrest by Suppressing P38/NF-κB Signaling in Human Renal Clear Cell Carcinoma. Int. J. Clin. Exp. Pathol. 2015, 8, 11140–11148. [Google Scholar]
- Broussy, S.; Laaroussi, H.; Vidal, M. Biochemical Mechanism and Biological Effects of the Inhibition of Silent Information Regulator 1 (SIRT1) by EX-527 (SEN0014196 or Selisistat). J. Enzym. Inhib. Med. Chem. 2020, 35, 1124–1136. [Google Scholar] [CrossRef]
- Yang, Y.; Liu, Y.; Wang, Y.; Chao, Y.; Zhang, J.; Jia, Y.; Tie, J.; Hu, D. Regulation of SIRT1 and Its Roles in Inflammation. Front. Immunol. 2022, 13, 831168. [Google Scholar] [CrossRef] [PubMed]
- Giacosa, S.; Pillet, C.; Séraudie, I.; Guyon, L.; Wallez, Y.; Roelants, C.; Battail, C.; Evrard, B.; Chalmel, F.; Barette, C.; et al. Cooperative Blockade of CK2 and ATM Kinases Drives Apoptosis in VHL-Deficient Renal Carcinoma Cells through ROS Overproduction. Cancers 2021, 13, 576. [Google Scholar] [CrossRef] [PubMed]
- Lambert, H.; Chen, M.; Cabral, C. Antimicrobial Resistance, Inflammatory Responses: A Comparative Analysis of Pathogenicities, Knowledge Hybrids and the Semantics of Antibiotic Use. Palgrave Commun. 2019, 5, 85. [Google Scholar] [CrossRef]
- Rad, E.Y.; Saboori, S.; Tammam, J.; Thondre, P.S.; Coe, S. The Effect of Niacin on Inflammatory Markers and Adipokines: A Systematic Review and Meta-Analysis of Interventional Studies. Eur. J. Nutr. 2024, 63, 2011–2024. [Google Scholar] [CrossRef]


| Accession No. | GSE53757 | GSE22541 | GSE66272 | GSE73731 |
|---|---|---|---|---|
| Condition | ccRCC Stage 1 (S1) | ccRCC Stage 2 (S2) | ccRCC Stage 3 (S3) | ccRCC Stage 4 (S4) |
| Type | Expression Profiling by Array | |||
| Platform | GPL570—HG-U133 Plus 2 Affymetrix Human Genome U133 Plus 2.0 Array | |||
| Source | Primary Tumor Samples | |||
| No. of Samples | 24 | 21 | 27 | 44 |
| Genes | Drug | Mechanism | Tau | FDR | |
|---|---|---|---|---|---|
| Upregulated | ATM, CDC4, GSK3B, ITGA2B, MAPK8, MED1, PPARG, RPL5, CD44, HNRNPC, BCL2, CALML3, EGFR, GRB2, HDAC1, HSP90AA1, INS, PRKACG, SOX2, SRC, SMAD3, MAPK1, and TGFB1 | Ziprasidone | Dopamine receptor antagonist, Serotonin receptor antagonist | −99.0039 | 0.00884 |
| Etazolate | Phosphodiesterase inhibitor | −98.9247 | 0.00207 | ||
| Trequinsin | Phosphodiesterase inhibitor | −97.5632 | 0.00557 | ||
| Dicycloverine | Acetylcholine receptor antagonist | −97.26467 | 0.00936 | ||
| Decitabine | DNA methyltransferase inhibitor | −96.3448 | 0.00267 | ||
| Downregulated | PTK2, BDNF, CREBBP, DLG4, EP300, H3C12, and ESR1 | Fentiazac | Cyclooxygenase inhibitor | −99.6497 | 0.001254 |
| Asenapine | Dopamine receptor antagonist, serotonin receptor antagonist | −99.2415 | 0.007037 | ||
| Ku-60019 | ATM kinase inhibitor | −99.1959 | 0.007115 | ||
| Fr-180204 | MAP kinase inhibitor | −98.2394 | 0.000190 | ||
| Niacin | NAD precursor, vitamin B | −98.2211 | 0.002544 |
Disclaimer/Publisher’s Note: The statements, opinions and data contained in all publications are solely those of the individual author(s) and contributor(s) and not of MDPI and/or the editor(s). MDPI and/or the editor(s) disclaim responsibility for any injury to people or property resulting from any ideas, methods, instructions or products referred to in the content. |
© 2024 by the authors. Licensee MDPI, Basel, Switzerland. This article is an open access article distributed under the terms and conditions of the Creative Commons Attribution (CC BY) license (https://creativecommons.org/licenses/by/4.0/).
Share and Cite
Suratos, K.S.; Orda, M.A.; Tsai, P.-W.; Tayo, L.L. Signaling Pathways in Clear Cell Renal Cell Carcinoma and Candidate Drugs Unveiled through Transcriptomic Network Analysis of Hub Genes. Appl. Sci. 2024, 14, 8768. https://doi.org/10.3390/app14198768
Suratos KS, Orda MA, Tsai P-W, Tayo LL. Signaling Pathways in Clear Cell Renal Cell Carcinoma and Candidate Drugs Unveiled through Transcriptomic Network Analysis of Hub Genes. Applied Sciences. 2024; 14(19):8768. https://doi.org/10.3390/app14198768
Chicago/Turabian StyleSuratos, Khyle S., Marco A. Orda, Po-Wei Tsai, and Lemmuel L. Tayo. 2024. "Signaling Pathways in Clear Cell Renal Cell Carcinoma and Candidate Drugs Unveiled through Transcriptomic Network Analysis of Hub Genes" Applied Sciences 14, no. 19: 8768. https://doi.org/10.3390/app14198768