Article

Upgrading Biomass Wastes to Graphene Quantum Dots with White-Light-Emitting Features in the Solid State

1
EA4632, LCP-A2MC, Institut de Chimie et Physique des Matériaux, Université de Lorraine, F-57070 Metz, France
2
Cordouan Technologies, Cité de la Photonique, 11 Avenue Canteranne, F-33600 Pessac, France
3
Institut Jean Lamour, Université de Lorraine, CNRS, UMR 7198, F-57078 Metz, France
4
CNRS, L2CM, UMR7053, Institut de Chimie et Physique des Matériaux, Université de Lorraine, B.P 95823, F-57078 Metz, France
*
Author to whom correspondence should be addressed.
Appl. Sci. 2024, 14(19), 8807; https://doi.org/10.3390/app14198807 (registering DOI)
Submission received: 30 August 2024 / Revised: 20 September 2024 / Accepted: 25 September 2024 / Published: 30 September 2024
(This article belongs to the Special Issue Advances in Organic Synthetic Chemistry)

Abstract

:
The emergence of bio-based carbonaceous materials for various applications has attracted significant attention during the last few years. Here, we report a rapid, efficient, and reproducible microwave-assisted synthesis of graphene quantum dots (GQDs) with identical features irrespective of the nature of biomass waste investigated. The synthesized GQDs were fully characterized by X-ray photoelectron spectroscopy, Fourier-transform infrared spectroscopy, transmission electron microscopy, and dynamic light scattering. The nanoparticles displayed narrow sizes of 1–2 nm and high solubility in polar solvents such as water and ethanol. The protocol described herein is advantageous in comparison to dealing with the synthesis of GQDs from biomass waste previously reported since our protocol is faster owing to the use of microwave heating and the avoidance of dialysis for the purification step. Furthermore, in solution, the water-soluble particles showed excitation-dependent photoluminescence ranging from blue to orange emission wavelengths. Interestingly, thin films displayed white-light emission under 325 nm UV-light excitation, while aggregation-induced quenching was usually observed, opening the way for their potential use as a phosphor in white-light-emitting diodes.

1. Introduction

Carbon dots were fortuitously discovered in 2004 [1] as an unexpected fluorescent material within arc-discharge soot. Since then, carbon dots have rapidly emerged as a new, fascinating member of the carbon nanomaterial family alongside carbon nanotubes, fullerenes, and graphene. To date, the term “carbon dots” has usually referred to various nanosized materials mainly composed of carbon. These materials can be divided into two main categories, i.e., graphene quantum dots (GQDs) and carbon nanodots (CDs) [2]. GQDs can be described as zero-dimensional (0D) nanomaterials possessing lateral dimensions that are larger than their height and composed of a few layers of graphene sheets bearing functional groups at the edges. According to their graphene-like structure, GQDs usually display intrinsic crystal lattices which can be evidenced by HR-TEM characterizations in the range of 0.15 to 0.25 nm [3]. In contrast to GQDs, the core structure of CDs is quasi-spherical nanoparticles composed of an amorphous lattice structure [4].
Graphene quantum dots have been the subject of many published investigations and reviews [5,6], owing to their wide range of attributes, e.g., excitation-dependent photoluminescence [7], chemical inertness, solubility in various polar solvents, possible further functionalization, resistance to photobleaching, biocompatibility [8], and low cost. GQDs are nanometer-sized particles (<20 nm) consisting of a partial sp2-hybridized graphitic core bearing various oxygen- and nitrogen-containing functional groups, where O- and N- atoms are involved in the formation of carbonyl, hydroxyl, epoxy, and amine moieties, mostly located at the edges. The presence of these functionalities allows GQDs to be highly soluble in many organic solvents, thus making their processability much easier than that of most other carbon-based materials [9,10].
Since their discovery, it has been demonstrated that GQDs have valuable applications in many domains ranging from anti-counterfeiting [11], photocatalysis [12,13], batteries [14], supercapacitors [15,16,17], solar cells [18,19,20], LEDs [21,22], sensors [23,24], bioimaging [25], and as drug carriers [26]. Graphene quantum dots can be synthesized either by bottom-up or top-down approaches [27,28]. Bottom-up synthetic strategies relate to physical or chemical treatments of small organic molecules to promote their graphitization. In comparison, top-down approaches refer to the miniaturization of large carbon-based materials (graphite, graphene oxide, carbon nanotubes, or fullerenes) by either hydrothermal or solvothermal cutting [29], microwave-assisted exfoliation [30], electrochemical methods [31], or oxidation [32]. Alternatively, GQDs can be synthesized from biomass-originating raw materials such as biochar [33] or rice husks [34], thus limiting the overall process cost. Nevertheless, typically, the majority of techniques used to prepare GQDs are limited to laboratory-sized operations with long reaction times, the use of high pressure and high temperature, and expensive materials. Also, ultracentrifugation and/or dialysis remain the main techniques to purify GQDs, while being limited to small quantities. While graphene quantum dots are already commercially available from some suppliers around the world, nowadays, only a few dozen milligrams can be accessed at a price of ca. EUR 5000/g, hampering the development of GQD-based applications at industrial scale. High-quality GQDs have to be synthesized through cost-effective, reproducible, and scalable processes in order to facilitate the applications to reach industry.
Herein, we report on the synthesis and characterizations of small GQDs (≈1–2 nm) that were prepared from various biomass wastes (orange peel, date stones, and oak acorns) in a straightforward, rapid, and high-yielding chemical transformation performed under fast microwave heating. The two-step procedure afforded the GQDs excellent uniformity (in terms of size, morphology, chemical composition, and photophysical properties) irrespective of the different biomass waste source investigated. The water-soluble particles showed excitation-dependent photoluminescence ranging from blue to orange emission wavelengths in water solution. Interestingly, thin films displayed white-light emission under UV excitation, while aggregation-induced quenching was usually observed in the solid state.

2. Materials and Methods

2.1. Materials and Chemicals

All solvents were of reagent grade. All chemicals were used as received. Water was of high purity characterized in terms of resistivity (typically 18.2 mΩ.cm at 25 °C). Nitric acid was purchased from Merck (puriss. p.a., 65.0–67.0%). Sulfuric acid was purchased from VWR International (95–97%).

2.2. Synthesis and Purification of GQDs

Various source materials, such as orange peel (A0), date stones (B0), and oak acorns (C0) were first dried at 70 °C for 24 h, then crushed and ground. Then, GQDs were prepared in two steps under microwave-assisted heating in a Monowave 400 device (Anton Paar) following a procedure that has been recently reported [35,36]. Briefly, dried powder of various non-food biomass wastes (200 mg) was suspended in conc. H2SO4 (16 mL) in a G30 reaction tube and subjected to carbonization at 180 °C for 5 min. After being cooled, the reaction medium was carefully diluted in water (200 mL) and the dark carbonized suspension was recovered by centrifugation and subsequently dried at 70 °C overnight. The yield of this step was 47% from orange peels (A1, 92 mg), 38% from date stones (B1, 76 mg), and 35% from oak acorns (C1, 70 mg). In the second step, the carbonized materials (50 mg) were heated with conc. HNO3 (5 mL) in a G10 reaction vessel at 150 °C for 5 min. After cooling and concentration to dryness, 40% of GQDs were obtained from orange peel (A2, 20 mg), 32% from date stones (B2, 16 mg), and 34% from oak acorns (C2, 17 mg).

2.3. Characterization

Fourier-transform infrared spectroscopy (FT-IR) was performed on a Nicolet iS5 FT-IR Spectrometer. Elemental analyses were performed on a CHNS-O analyzer from Thermo Scientific and results are given as average of three independent measurements.
The average particle size of CDs was measured by DLS using a VASCO KIN Particle Size Analyzer apparatus (Cordouan Technologies, Pessac, France). All measurements were performed on freshly prepared suspension diluted in ultrapure water, at 25 °C and in triplicate. Data were analyzed using the multimodal number distribution Nano Kin® software supplied with the instrument and expressed as mean (±SD).
UV-vis spectra were obtained with a Varian Cary® 50 UV-Vis spectrophotometer. Fluorescence emission spectra were obtained using a FluoroMax-3 spectrofluorophotometer (Horiba Jobin Yvon) at 298 K.
SEM images were acquired on a TESCAN VEGA 3 scanning electron microscope equipped with a tungsten filament electron source operating at 30 kV. Samples were prepared by depositing dry powders on conductive tapes. The conductivity of the sample surface was further improved by a very thin conductive carbon coating to prevent charge build-up on it prior to SEM analysis.
Transmission electron microscopy (TEM) investigations were carried out using a JEM—ARM 200F Cold FEG TEM/STEM operating at 200 kV and equipped with a spherical aberration (Cs) probe and image correctors (point resolution 0.12 nm in TEM mode). Grids were prepared by placing a drop of GQD solution (200 µg/mL in water) on a carbon-coated copper grid for four minutes. The drop was then removed by mean of a blotting paper and the grid dried at room temperature for five minutes and at 80 °C for twenty minutes.
The X-ray photoelectron spectrometry (XPS) analyses were performed on a Kratos Axis Ultra (Kratos Analytical, U.K.). The spectrometer is equipped with a monochromatic Al Kα source (1486.6 eV). All spectra were recorded at a 90° take-off angle, with an analyzed area of about 0.7 × 0.3 mm. Survey spectra were acquired with a 1.0 eV step and 160 eV analyzer pass energy. The high-resolution regions were acquired with a 0.1 eV step (0.05 eV for O 1 s and C 1 s) and 20 eV pass energy. A neutralizer was used to perform the recording to compensate for the charge effects. Curves were fitted using a Gaussian/Lorentzian (70/30) peak shape after Shirley’s background subtraction and using CasaXPS software. The carbon C 1s was calibrated at 284.8 eV for C-C and C-H bonds.

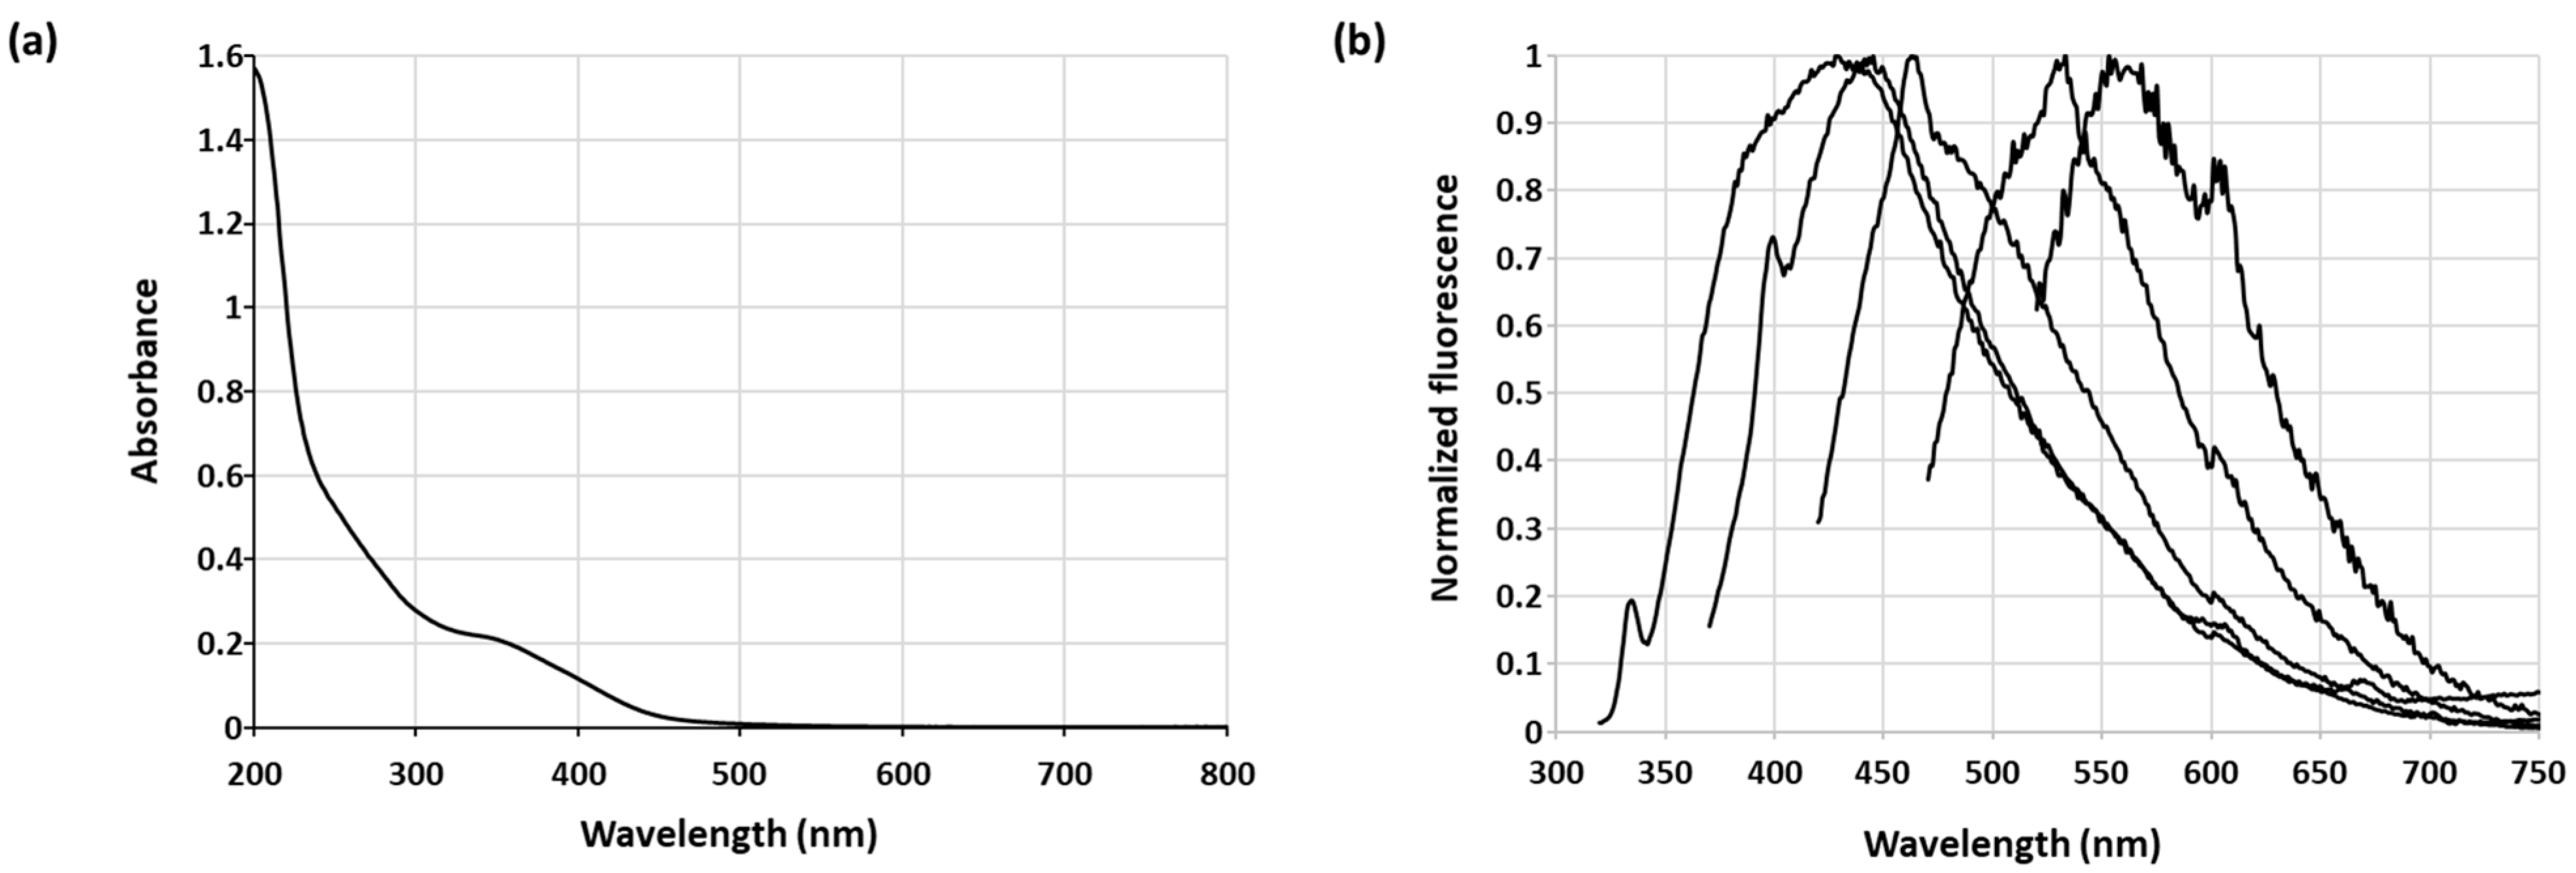
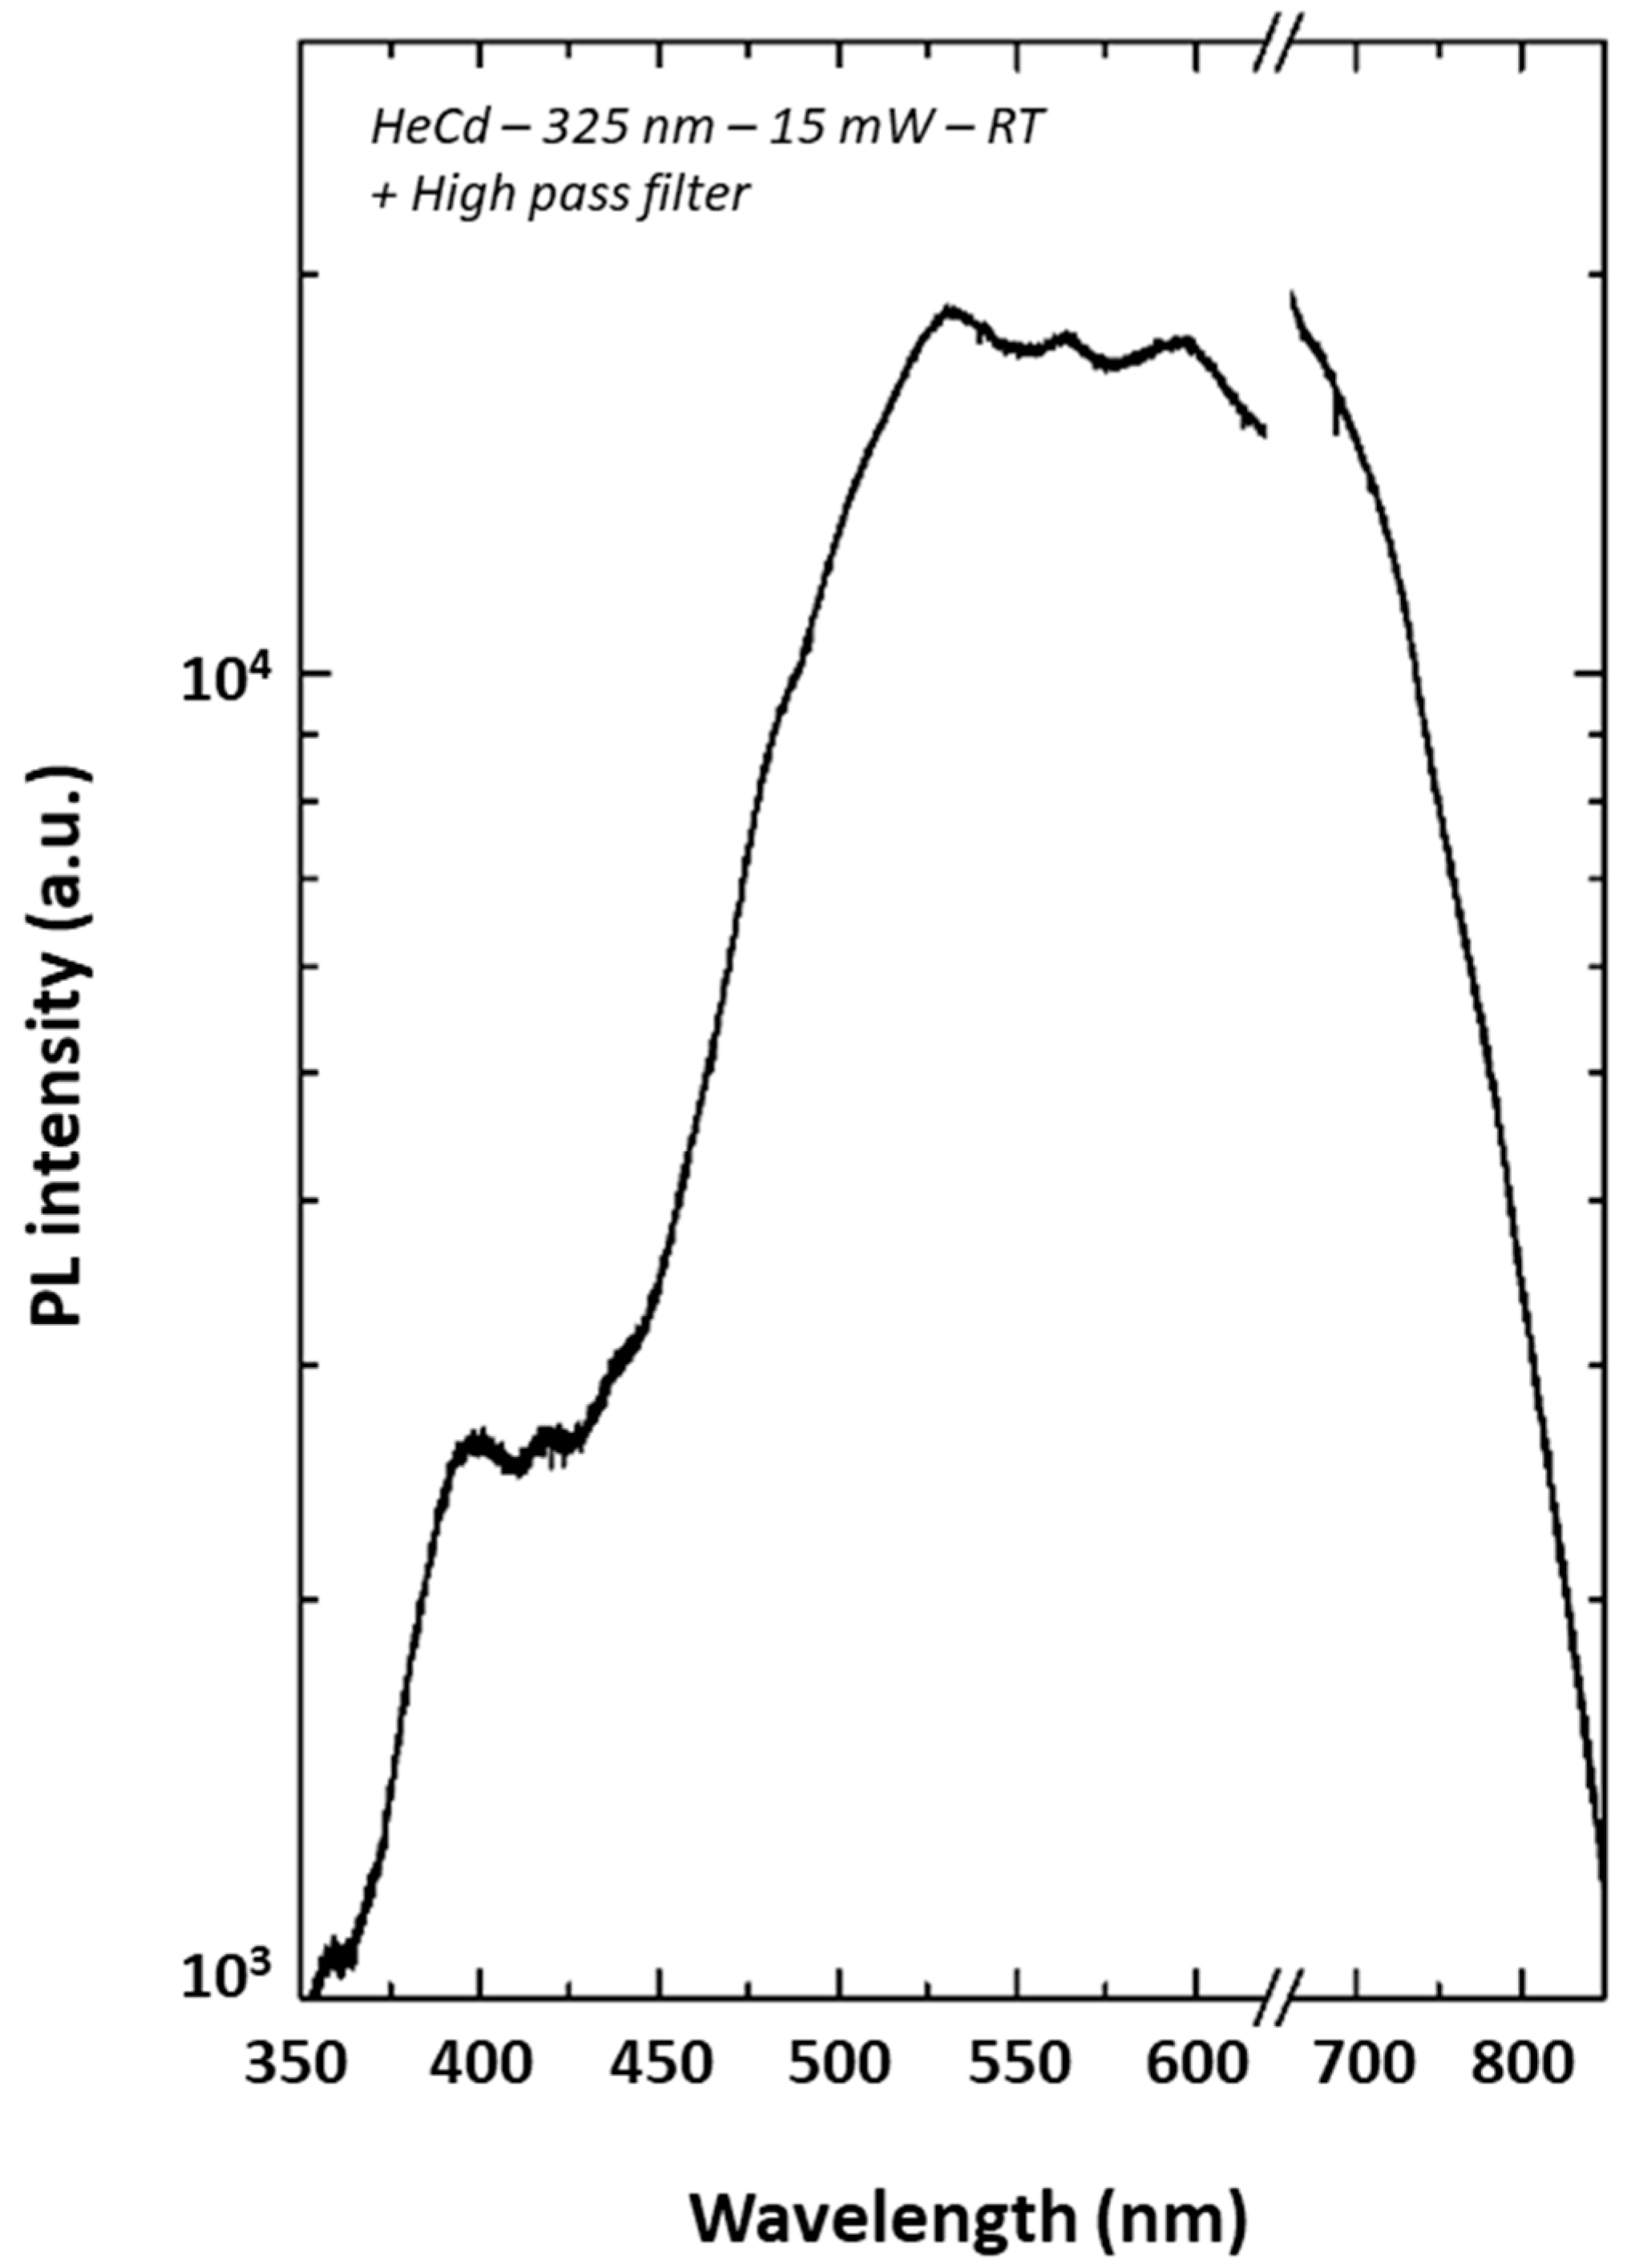
3. Results and Discussion

In this work, GQDs were prepared by a facile two-step MW-assisted synthesis with biomass wastes (orange peel (A0), date stones (B0), and oak acorns (C0)) as starting materials. Firstly, the materials were dried, crushed, and ground to give homogeneous powders as precursors. The microstructures of these powders were evaluated by scanning electron microscopy (SEM). Images (Figure 1a–c) demonstrate that all precursors’ powders displayed important micro-porosity.
Within the first step, A0–C0 powders were subjected to acidic hydrothermal treatment in monomode microwave reactors. The microwave heating method usually allows for the setting up of green, fast, and economic processes in comparison with conventional refluxing or solvothermal methods. Furthermore, monomode microwave reactors allowed us to set up chemical transformations with an accurate implementation of synthetic parameters (i.e., temperature and pressure) with high reproducibility between batches. Thus, samples A0–C0 were heated at 180 °C for 5 min in conc. sulfuric acid to afford carbonaceous products A1–C1 as dark powders. During this step, cellulose-based starting materials A0–C0 underwent various successive chemical transformations such as depolymerization, dehydration, and further polymerization, resulting in the formation of materials A1–C1 with yields ranging from 35 to 47% (wt%). Their chemical composition was evaluated by elemental analysis and FT-IR spectroscopy (Figure 2). Elemental analyses revealed that oxygen content decreased significantly during the first step of our process, which was in line with the dehydration process. Furthermore, sulfur atoms were included inside the structure, even if at a low amount (1.7–2.2%).
The Fourier-transform infrared (FT-IR) spectra of products A1–C1 were highly similar irrespective of the nature of the biomass waste and clearly showed the presence of oxygen-containing functional groups such as carboxylic acid and hydroxyl groups. The presence of carboxylic acid functional groups was confirmed by the presence of a broad band in the region of 3300–2500 cm−1. In addition, C=O stretching was observed in the region of 1700 cm−1 and C-O-C stretching in the region of 1000 to 1200 cm−1. Furthermore, a strong stretching vibration of C=C could be observed at 1574–1580 cm−1, indicating the presence of sp2 units. We could also identify bands of small intensities at around 3000–3100 cm−1, corresponding to C-H stretching.
The SEM images (Figure 1d–f) indicate that the shape of carbonaceous materials generated during the first step was not uniform. While A1 was composed of angular microstructures, B1 and C1 were generally spherical. The particle sizes were a few dozen micrometers.
In the second step, carbonaceous materials A1–C1 were treated with conc. nitric acid in microwave reactors at 150 °C for 5 min, after which the black carbon suspension was completely digested to afford a clear orange solution. After purification, the final A2–C2 GQDs were obtained as yellowish powders with yields ranging from 33 to 40% (wt%). After purification, the prepared GQDs were then systematically characterized in terms of chemical composition (elemental analysis and XPS), size (DLS and TEM), and photophysical properties (absorbance and luminescence spectroscopies).
GQDs A2–C2 displayed almost the same chemical composition as that evidenced by X-ray photoelectron spectroscopy (Figure 3a and Figures S1a and S2a, and Table 1). From the full-scan XPS spectrum (Figure 3a) C, N, O, and S were detected with peaks at 284.8 eV (C1s), 405.9 eV (N1s), 532.9 eV (O1s), and 167.6 eV (S2p), respectively. All GQDs displayed almost the same spectra. To determine the C and N configurations in the A2 GQDs, C1s and N1s spectra were analyzed (Figure 3b,c). The C1s spectra could be decomposed into four main peaks at 284.8 eV, 286.1 eV, 287.5 eV, and 288.9 eV, attributed to sp2 C=C, C-O/C-N, C=O, and COOH groups, respectively. The N1s spectrum could be deconvoluted into three peaks centered at 400.4 eV, 402.1 eV, and 405.9 eV, corresponding to pyridinic/pyrrolic N, graphitic N, and N-O, respectively. The N-O moieties could presumably be attributed to nitro functional groups (NO2) linked to the aromatic structure, originating from nitric acid treatment. This was in perfect agreement with previous reports [37,38]. As a matter of fact, nitration of aromatic rings can occur during electrophilic aromatic substitutions without the need for sulfuric acid as catalyst [39]. In addition, the O1s signal at 531.6 eV demonstrated the presence of C=O bonds. Finally, the S2p signal at 166.9 clearly demonstrated the presence of oxidized forms of sulfur-based functional groups, very likely sulfones and sulfoxides [40,41]. Furthermore, the elemental molar ratio of C, N, S, and O for the three GQD batches A2–C2 was calculated from the XPS analyses and the results are depicted in Table 1.
First, the elemental content was similar in the three samples investigated in spite of the different biomass waste sources. While the oxygen content was hardly modified during the second step, sulfur was incorporated within the structures in the range of 0.3–1.8%. Additionally, we observed that nitrogen content increased to reach 4–5.4% atomic content, thereby confirming the presence of nitrogen-based functional groups, very likely nitro groups as supposed on the basis of XPS data. FT-IR spectroscopy was used to further characterize the nature of functional groups in A2–C2 (Figure 3d, Figures S1b and S2b). All samples displayed identical IR profiles with four main bands, but with some slight differences based on respective intensities. The IR band located at 3300–3500 cm−1 could be assigned to carboxylic acid functional groups, the intense band at 1600–1610 cm−1 was assigned to C=C bonds as the elementary units of sp2 conjugated graphene structure, the band at 1340–1350 cm−1 was assigned to NO2 stretching, and the one at 1110 cm−1 reflected the stretching of C-O bonds which could have originated from epoxy groups. These IR results fully support the existence of various oxygen-based functional groups on the surface of GQDs, which is fully consistent with XPS data. Furthermore, the identification of the presence of various functional groups on GQDs was consistent with their excellent solubility properties in many solvents such as water, ethanol, methanol, acetone, and dimethylformamide. For instance, GQD solubility in water is ~2 mg.mL−1, while it is ~500 mg·mL−1 in pure ethanol.
The size of the final graphene quantum dots was determined by DLS from aqueous suspensions (Figure 4a and Figure S3). The results indicated that all GQDs displayed a narrow size distribution centered at approximately 1.6–1.7 nm. This highlights the success of our protocol to form nanoparticles of identical size and chemical composition regardless of the waste source investigated. Also, these observations attest to the high dispersibility of our GQDs in solution. The high-resolution transmission electron microscopy (HR-TEM) images (Figure 4b,c and Figure S4) totally corroborate the observations made by DLS, depicting individual nanoparticles of less than 2 nm.
It is noteworthy that nanoparticles had a tendency to aggregate when deposited on the holey carbon-based TEM grids (Figure 4a) which is expected for planar aromatic fragments due to strong van der Waals attractions between graphene-like sheets. Also, GQD TEM images show clear hexagonal honeycomb networks, as expected for graphene quantum dots [42]. Also, the high-resolution TEM (HR-TEM) image (Figure 4b) exhibits crystal structures. Detectable lattices in the selected-area electron-diffraction (SAED, inset of Figure 4b) pattern revealed the crystalline structure of GQDs. Well-resolved lattice fringes with an interplanar spacing of 0.210 nm were observed, which is close to the (101) facet of carbon graphite.
The synthesis of graphene quantum dots from biomass wastes has emerged as a credible alternative feedstock owing to their renewable, cheap, and green characteristics, particularly in comparison with glucose and citric acid, which that have been extensively used as precursors for GQD synthesis [43,44]. In that context, many biomass sources such as rice husks [34], plant leaves [45], charcoal [46], honey [47], coffee [48], and lignin [49] have been used to produce GQDs. In comparison with this investigation, Table 2 depicts the synthetic routes, purification procedures, yields, and range of sizes reported in recent and relevant publications.
Among the various synthetic routes reported to produce GQDs from biomass precursors, the procedure we developed is extremely rapid owing to the use of microwave heating which allow each step to proceed in five minutes, while other procedures need some hours to proceed. Considering the purification step, avoiding the use of dialysis is a substantial advantage since that purification technique is expensive and very time-consuming. Also, it is worth considering that the GQDs we produced were of smaller size than most of those reported in the literature. Finally, the weight percentage yield was in the same range as other reported yields.
The optical properties of the GQDs prepared from different waste sources were further examined in detail. The UV-vis absorption spectrum of A2 (Figure 5a) was identical to those of B2 and C2 (Figures S5a and S6a, respectively). The light-yellow solution showed two absorption peaks in the UV range, including a small and broad one centered at 350 nm ascribed to n − π* transitions in C=O and a peak at 200 nm which was related to π electron transition from π to π* of C=C bonds in the aromatic domains of the graphitic structure. Steady-state fluorescence spectroscopy was performed with diluted water solutions of A2–C2 in order to get insight into the photoluminescence features of the prepared nanoparticles. All samples displayed typical excitation-dependent photoluminescence behavior using different excitation wavelengths ranging from 300 nm to 500 nm (Figure 5b and Figures S5b and S6b). With the increase in the excitation wavelength, GQDs displayed emission peaks, shifting to longer wavelengths up to 600 nm when excited at 500 nm. Although the excitation-dependent PL mechanism is still a controversial topic [50], this tunable emission is of great interest for applications in various domains. The origin of this excitation-dependent photoluminescence is very likely the result of defect emission, i.e., the recombination of an excited electron in the various surface states with holes in the valence band [7]. Indeed, we could eliminate the quantum-confinement effect according to the narrow size distribution of the as-prepared nanoparticles. The multi-photoluminescence colors of the GQDs could be of high interest for multicolored bioimaging and could be modulated through surface functionalization.
During the course of a current research project dealing with the synthesis of new organic materials for energy applications in solid devices, we were interested in studying the photoluminescence of our GQDs in the solid state. Aggregation-induced luminescence quenching of carbon-based nanomaterials (CDs and GQDs) is the main obstacle for their application in the solid state. Indeed, solid-state fluorescence is highly desirable in numerous applications such as optoelectronic devices and sensors, which generally require photoluminescent materials emitting in the solid state. Some rare recent reports deal with the emission of CD-based films [51,52,53]. We were pleased to observe (Figure 6 and Figure S7) that our GQDs deposited on a silicon wafer displayed a white-light emission without the need for dilution inside a solid dispersant, as has been described in recent studies using agarose [51], polyvinyl alcohol (PVA) [52], or silica matrix [53]. Thus, all A2–C2 GQD samples displayed almost identical white-light emission profiles under 325 nm, with a broad peak centered at 550 nm. It is noteworthy that the emission of our GQDs in the solid state was completely different to the emissions observed in solution and the reason for this is still unclear.

4. Conclusions

In summary, we have developed a straightforward and reproducible method to prepare graphene quantum dots (GQDs) from biomass waste of different natures by a two-step microwave-assisted synthesis. Preparations were carried out at laboratory scale and could be easily scaled-up, as we proved within our recent patent [36]. To date, we have been delighted to observe that, in spite of the nature of the waste investigated, the resulting GQDs displayed similar properties, regarding their chemical composition and their size and morphology as well as their photophysical properties. DLS and TEM analyses showed that the as-prepared GQDs were monodispersed with similar size distribution in the range of 1–2 nm and with crystal lattices similar to those observed in graphite. In terms of chemical composition, XPS and IR analyses allowed us to identify the presence of some functional groups such as carboxylic acid, and hydroxyl, ether, nitro, and sulfoxide groups that were connected to the graphene-like structure backbone. Regarding the photophysical properties, the nanoparticles exhibited excitation-dependent photoluminescence that was very likely the result of defect emission, i.e., the recombination of an excited electron in the various surface states with a hole in the valence band. Interestingly, our nanoparticles displayed a white-light-emitting feature under UV-light excitation in the solid state. This is a noteworthy point since most CDs and organic molecules are not emissive in the solid state due to multiple FRET occurring between close objects. Furthermore, aggregation-induced luminescence quenching of carbon-based nanomaterials is the main obstacle for their applications, such as in optoelectronic devices and sensors. These encouraging results, combined with the ease of synthesis, make our cheap and easily accessible GQDs very promising nanomaterials as a new phosphor in white-light-emitting diodes and full-color display panels. In this direction, work is currently underway to fabricate GQD-based films and evaluate their electroluminescence features.

Supplementary Materials

The following supporting information can be downloaded at: https://www.mdpi.com/article/10.3390/app14198807/s1. Figure S1. (a) XPS survey scan of the GQDs B2. (b) ATR-FTIR spectra of GQDs B2. Figure S2. (a) XPS survey scan of the GQDs C2. (b) ATR-FTIR spectra of GQDs C2. Figure S3. DLS size distribution (by number) of (a) B2 and (b) C2 dispersed GQDs water suspension at a concentration of 1mg/mL. Figure S4. HR-TEM images of the as-prepared GQDs (a) B2 and (b) C2. Figure S5. Photophysical properties of water-dispersed GQDs B2. (a) UV-vis spectrum and (b) normalized emission spectra of GQDs recorded for progressively longer excitation wavelengths ranging from 300 to 500 nm (with a 50 nm increment). Figure S6. Photophysical properties of water-dispersed GQDs C2. (a) UV-vis spectrum and (b) normalized emission spectra of GQDs recorded for progressively longer excitation wavelengths ranging from 300 to 500 nm (with a 50 nm increment). Figure S7. White light emission obtained from GQDs films deposited on a silicon wafer based on GQDs B2 and C2. The spectrum has been truncated at 650 nm for clarity in order to remove the peak corresponding to the second harmonic of excitation.

Author Contributions

P.P. was mainly responsible for writing the manuscript. P.M., P.F., J.-J.G., B.M., S.D. and P.P. reviewed the manuscript. All authors have read and agreed to the published version of the manuscript.

Funding

This research was funded by Institut Jean Barriol (Université de Lorrraine) and SATT Sayens (GREEN-CQDs project).

Institutional Review Board Statement

Not applicable.

Informed Consent Statement

Not applicable.

Data Availability Statement

The original contributions presented in the study are included in the article/supplementary material, further inquiries can be directed to the corresponding author.

Acknowledgments

The authors would like to thank V. Vaillant for performing elemental analyses. We thank Boulkrah Hafida, (Département de Pétrochimie et Génie des Procédés, Université du 20 août 1955-Skikda—Algérie) for the preparation of the precursor waste biomass. We thank Aurélien Renard from the spectroscopy and microscopy Service Facility of SMI LCPME (Université de Lorraine-CNRS). We thank Jaafar Ghanbaja and Mélanie Emo ((Institut Jean Lamour) for HR-TEM measurements.

Conflicts of Interest

Author Benoit Maxit is employed by the company Cordouan Technologies. The remaining authors declare that the research was conducted in the absence of any commercial or financial relationships that could be construed as a potential conflict of interest.

References

  1. Xu, X.; Ray, R.; Gu, Y.; Ploehn, H.J.; Gearheart, L.; Raker, K.; Scrivens, W.A. Electrophoretic Analysis and Purification of Fluorescent Single-Walled Carbon Nanotube Fragments. J. Am. Chem. Soc. 2004, 126, 12736–12737. [Google Scholar] [CrossRef] [PubMed]
  2. Selva Sharma, A.; Lee, N.Y. Comprehensive review on fluorescent carbon dots and their applications in nucleic acid detection, nucleolus targeted imaging and gene delivery. Analyst 2024, 149, 4095–4115. [Google Scholar] [CrossRef] [PubMed]
  3. Liu, J.; Li, R.; Yang, B. Carbon Dots: A New Type of Carbon-Based Nanomaterial with Wide Applications. ACS Cent. Sci. 2020, 6, 2179–2195. [Google Scholar] [CrossRef] [PubMed]
  4. Bao, L.; Zhang, Z.; Tian, Z.; Zhang, L.; Liu, C.; Lin, Y.; Qi, B.; Pang, D. Electrochemical Tuning of Luminescent Carbon Nanodots: From Preparation to Luminescence Mechanism. Adv. Mater. 2011, 23, 5801–5806. [Google Scholar] [CrossRef]
  5. Lim, S.Y.; Shen, W.; Gao, Z. Carbon quantum dots and their applications. Chem. Soc. Rev. 2015, 44, 362–381. [Google Scholar] [CrossRef]
  6. Gozali Balkanloo, P.; Mohammad Sharifi, K.; Poursattar Marjani, A. Graphene quantum dots: Synthesis, characterization, and application in wastewater treatment: A review. Mater. Adv. 2023, 4, 4272–4293. [Google Scholar] [CrossRef]
  7. Lai, S.; Jin, Y.; Shi, L.; Zhou, R.; Zhou, Y.; An, D. Mechanisms behind excitation- and concentration-dependent multicolor photoluminescence in graphene quantum dots. Nanoscale 2020, 12, 591–601. [Google Scholar] [CrossRef]
  8. Wang, S.; Cole, I.S.; Li, Q. The toxicity of graphene quantum dots. RSC Adv. 2016, 6, 89867–89878. [Google Scholar] [CrossRef]
  9. Dorontić, S.; Jovanović, S.; Bonasera, A. Shedding Light on Graphene Quantum Dots: Key Synthetic Strategies, Characterization Tools, and Cutting-Edge Applications. Materials 2021, 14, 6153. [Google Scholar] [CrossRef]
  10. Pierrat, P.; Gaumet, J.-J. Graphene quantum dots: Emerging organic materials with remarkable and tunable luminescence features. Tetrahedron Lett. 2020, 61, 152554. [Google Scholar] [CrossRef]
  11. Zhao, Y.; Gu, B.; Guo, G.; Li, Y.; Li, T.; Zhu, Y.; Wang, X.; Chen, D. Bright Tunable Multicolor Graphene Quantum Dots for Light-Emitting Devices and Anticounterfeiting Applications. ACS Appl. Nano Mater. 2023, 6, 3245–3253. [Google Scholar] [CrossRef]
  12. Nie, Q.; Jia, L.; Luan, J.; Cui, Y.; Liu, J.; Tan, Z.; Yu, H. Graphene quantum dots/BiOCl visible-light active photocatalyst for degradation of NO. Chem. Eng. Sci. 2024, 285, 119614. [Google Scholar] [CrossRef]
  13. Selvakumar, T.; Rajaram, M.; Natarajan, A.; Harikrishnan, L.; Alwar, K.; Rajaram, A. Highly Efficient Sulfur and Nitrogen Codoped Graphene Quantum Dots as a Metal-Free Green Photocatalyst for Photocatalysis and Fluorescent Ink Applications. ACS Omega 2022, 7, 12825–12834. [Google Scholar] [CrossRef]
  14. Vijaya Kumar Saroja, A.P.; Garapati, M.S.; ShyiamalaDevi, R.; Kamaraj, M.; Ramaprabhu, S. Facile synthesis of heteroatom doped and undoped graphene quantum dots as active materials for reversible lithium and sodium ions storage. Appl. Surf. Sci. 2020, 504, 144430. [Google Scholar] [CrossRef]
  15. Zhao, J.; Zhu, J.; Li, Y.; Wang, L.; Dong, Y.; Jiang, Z.; Fan, C.; Cao, Y.; Sheng, R.; Liu, A.; et al. Graphene Quantum Dot Reinforced Electrospun Carbon Nanofiber Fabrics with High Surface Area for Ultrahigh Rate Supercapacitors. ACS Appl. Mater. Interfaces 2020, 12, 11669–11678. [Google Scholar] [CrossRef]
  16. Zhang, W.; Yang, Y.; Xia, R.; Li, Y.; Zhao, J.; Lin, L.; Cao, J.; Wang, Q.; Liu, Y.; Guo, H. Graphene-quantum-dots-induced MnO2 with needle-like nanostructure grown on carbonized wood as advanced electrode for supercapacitors. Carbon 2020, 162, 114–123. [Google Scholar] [CrossRef]
  17. Zahir, N.; Magri, P.; Luo, W.; Gaumet, J.J.; Pierrat, P. Recent Advances on Graphene Quantum Dots for Electrochemical Energy Storage Devices. Energy Environ. Mater. 2022, 5, 201–214. [Google Scholar] [CrossRef]
  18. Mahalingam, S.; Manap, A.; Omar, A.; Low, F.W.; Afandi, N.F.; Chia, C.H.; Rahim, N.A. Functionalized graphene quantum dots for dye-sensitized solar cell: Key challenges, recent developments and future prospects. Renew. Sustain. Energy Rev. 2021, 144, 110999. [Google Scholar] [CrossRef]
  19. Zhu, Z.; Ma, J.; Wang, Z.; Mu, C.; Fan, Z.; Du, L.; Bai, Y.; Fan, L.; Yan, H.; Phillips, D.L.; et al. Efficiency Enhancement of Perovskite Solar Cells through Fast Electron Extraction: The Role of Graphene Quantum Dots. J. Am. Chem. Soc. 2014, 136, 3760–3763. [Google Scholar] [CrossRef]
  20. Li, M.; Ni, W.; Kan, B.; Wan, X.; Zhang, L.; Zhang, Q.; Long, G.; Zuo, Y.; Chen, Y. Graphene quantum dots as the hole transport layer material for high-performance organic solar cells. Phys. Chem. Chem. Phys. 2013, 15, 18973. [Google Scholar] [CrossRef]
  21. Lyu, B.; Li, H.-J.; Xue, F.; Sai, L.; Gui, B.; Qian, D.; Wang, X.; Yang, J. Facile, gram-scale and eco-friendly synthesis of multi-color graphene quantum dots by thermal-driven advanced oxidation process. Chem. Eng. J. 2020, 388, 124285. [Google Scholar] [CrossRef]
  22. Yin, L.; Zhou, J.; Li, W.; Zhang, J.; Wang, L. Yellow fluorescent graphene quantum dots as a phosphor for white tunable light-emitting diodes. RSC Adv. 2019, 9, 9301–9307. [Google Scholar] [CrossRef] [PubMed]
  23. Ren, Q.; Ga, L.; Ai, J. Rapid Synthesis of Highly Fluorescent Nitrogen-Doped Graphene Quantum Dots for Effective Detection of Ferric Ions and as Fluorescent Ink. ACS Omega 2019, 4, 15842–15848. [Google Scholar] [CrossRef]
  24. Deka, M.J.; Chowdhury, D. CVD Assisted Hydrophobic Graphene Quantum Dots: Fluorescence Sensor for Aromatic Amino Acids. ChemistrySelect 2017, 2, 1999–2005. [Google Scholar] [CrossRef]
  25. Rasheed, P.A.; Ankitha, M.; Pillai, V.K.; Alwarappan, S. Graphene quantum dots for biosensing and bioimaging. RSC Adv. 2024, 14, 16001–16023. [Google Scholar] [CrossRef]
  26. Mohammed-Ahmed, H.K.; Nakipoglu, M.; Tezcaner, A.; Keskin, D.; Evis, Z. Functionalization of graphene oxide quantum dots for anticancer drug delivery. J. Drug Deliv. Sci. Technol. 2023, 80, 104199. [Google Scholar] [CrossRef]
  27. Bak, S.; Kim, D.; Lee, H. Graphene quantum dots and their possible energy applications: A review. Curr. Appl. Phys. 2016, 16, 1192–1201. [Google Scholar] [CrossRef]
  28. Tian, P.; Tang, L.; Teng, K.S.; Lau, S.P. Graphene quantum dots from chemistry to applications. Mater. Today Chem. 2018, 10, 221–258. [Google Scholar] [CrossRef]
  29. Tian, R.; Zhong, S.; Wu, J.; Jiang, W.; Shen, Y.; Jiang, W.; Wang, T. Solvothermal method to prepare graphene quantum dots by hydrogen peroxide. Opt. Mater. 2016, 60, 204–208. [Google Scholar] [CrossRef]
  30. Lin, J.; Huang, Y.; Wang, S.; Chen, G. Microwave-Assisted Rapid Exfoliation of Graphite into Graphene by Using Ammonium Bicarbonate as the Intercalation Agent. Ind. Eng. Chem. Res. 2017, 56, 9341–9346. [Google Scholar] [CrossRef]
  31. Ahirwar, S.; Mallick, S.; Bahadur, D. Electrochemical Method To Prepare Graphene Quantum Dots and Graphene Oxide Quantum Dots. ACS Omega 2017, 2, 8343–8353. [Google Scholar] [CrossRef] [PubMed]
  32. Shin, Y.; Park, J.; Hyun, D.; Yang, J.; Lee, H. Generation of graphene quantum dots by the oxidative cleavage of graphene oxide using the oxone oxidant. New J. Chem. 2015, 39, 2425–2428. [Google Scholar] [CrossRef]
  33. Abbas, A.; Mariana, L.T.; Phan, A.N. Biomass-waste derived graphene quantum dots and their applications. Carbon 2018, 140, 77–99. [Google Scholar] [CrossRef]
  34. Wang, Z.; Yu, J.; Zhang, X.; Li, N.; Liu, B.; Li, Y.; Wang, Y.; Wang, W.; Li, Y.; Zhang, L.; et al. Large-Scale and Controllable Synthesis of Graphene Quantum Dots from Rice Husk Biomass: A Comprehensive Utilization Strategy. ACS Appl. Mater. Interfaces 2016, 8, 1434–1439. [Google Scholar] [CrossRef] [PubMed]
  35. Pierrat, P.; Magri, P.; Gaumet, J.-J. Solid-State Fluorescent Graphene-Based Quantum Dots. WO2023194683, 12 October 2023. [Google Scholar]
  36. Pierrat, P.; Magri, P.; Gaumet, J.-J. Solid-State Fluorescent Graphene-Based Quantum Dots. FR3134385, 13 October 2023. [Google Scholar]
  37. Shao, T.; Wang, G.; An, X.; Zhuo, S.; Xia, Y.; Zhu, C. A reformative oxidation strategy using high concentration nitric acid for enhancing the emission performance of graphene quantum dots. RSC Adv. 2014, 4, 47977–47981. [Google Scholar] [CrossRef]
  38. Kwon, W.; Kim, Y.-H.; Lee, C.-L.; Lee, M.; Choi, H.C.; Lee, T.-W.; Rhee, S.-W. Electroluminescence from Graphene Quantum Dots Prepared by Amidative Cutting of Tattered Graphite. Nano Lett. 2014, 14, 1306–1311. [Google Scholar] [CrossRef]
  39. Yang, G.; Hu, H.; Zhou, Y.; Hu, Y.; Huang, H.; Nie, F.; Shi, W. Synthesis of one-molecule-thick single-crystalline nanosheets of energetic material for high-sensitive force sensor. Sci. Rep. 2012, 2, 698. [Google Scholar] [CrossRef]
  40. Upare, P.P.; Yoon, J.-W.; Kim, M.Y.; Kang, H.-Y.; Hwang, D.W.; Hwang, Y.K.; Kung, H.H.; Chang, J.-S. Chemical conversion of biomass-derived hexose sugars to levulinic acid over sulfonic acid-functionalized graphene oxide catalysts. Green Chem. 2013, 15, 2935. [Google Scholar] [CrossRef]
  41. Li, S.; Li, Y.; Cao, J.; Zhu, J.; Fan, L.; Li, X. Sulfur-Doped Graphene Quantum Dots as a Novel Fluorescent Probe for Highly Selective and Sensitive Detection of Fe 3+. Anal. Chem. 2014, 86, 10201–10207. [Google Scholar] [CrossRef]
  42. Wang, L.; Wang, Y.; Xu, T.; Liao, H.; Yao, C.; Liu, Y.; Li, Z.; Chen, Z.; Pan, D.; Sun, L.; et al. Gram-scale synthesis of single-crystalline graphene quantum dots with superior optical properties. Nat. Commun. 2014, 5, 5357. [Google Scholar] [CrossRef]
  43. Shi, S.-C.; Liu, H.-H.; Chen, T.-H.; Chen, C.-K.; Ko, B.-T. Preparation of aldehyde-graphene quantum dots from glucose for controlled release of anticancer drug. Front. Mater. 2023, 10, 1180745. [Google Scholar] [CrossRef]
  44. Zhu, S.; Bai, X.; Wang, T.; Shi, Q.; Zhu, J.; Wang, B. One-step synthesis of fluorescent graphene quantum dots as an effective fluorescence probe for vanillin detection. RSC Adv. 2021, 11, 9121–9129. [Google Scholar] [CrossRef]
  45. Suryawanshi, A.; Biswal, M.; Mhamane, D.; Gokhale, R.; Patil, S.; Guin, D.; Ogale, S. Large scale synthesis of graphene quantum dots (GQDs) from waste biomass and their use as an efficient and selective photoluminescence on–off–on probe for Ag+ ions. Nanoscale 2014, 6, 11664–11670. [Google Scholar] [CrossRef] [PubMed]
  46. Singh, A.; Kumar, S.; Ojha, A.K. Charcoal derived graphene quantum dots for flexible supercapacitor oriented applications. New J. Chem. 2020, 44, 11085–11091. [Google Scholar] [CrossRef]
  47. Mahesh, S.; Lekshmi, C.L.; Renuka, K.D.; Joseph, K. Simple and Cost-Effective Synthesis of Fluorescent Graphene Quantum Dots from Honey: Application as Stable Security Ink and White-Light Emission. Part. Part. Syst. Charact. 2016, 33, 70–74. [Google Scholar] [CrossRef]
  48. Wang, L.; Li, W.; Wu, B.; Li, Z.; Wang, S.; Liu, Y.; Pan, D.; Wu, M. Facile synthesis of fluorescent graphene quantum dots from coffee grounds for bioimaging and sensing. Chem. Eng. J. 2016, 300, 75–82. [Google Scholar] [CrossRef]
  49. Ding, Z.; Li, F.; Wen, J.; Wang, X.; Sun, R. Gram-scale synthesis of single-crystalline graphene quantum dots derived from lignin biomass. Green Chem. 2018, 20, 1383–1390. [Google Scholar] [CrossRef]
  50. Gan, Z.; Xu, H.; Hao, Y. Mechanism for excitation-dependent photoluminescence from graphene quantum dots and other graphene oxide derivates: Consensus, debates and challenges. Nanoscale 2016, 8, 7794–7807. [Google Scholar] [CrossRef]
  51. Yu, T.; Wang, H.; Guo, C.; Zhai, Y.; Yang, J.; Yuan, J. A rapid microwave synthesis of green-emissive carbon dots with solid-state fluorescence and pH-sensitive properties. R. Soc. Open Sci. 2018, 5, 180245. [Google Scholar] [CrossRef]
  52. Ahmad, K.; Pal, A.; Pan, U.N.; Chattopadhyay, A.; Paul, A. Synthesis of single-particle level white-light-emitting carbon dots via a one-step microwave method. J. Mater. Chem. C 2018, 6, 6691–6697. [Google Scholar] [CrossRef]
  53. Zhou, D.; Li, D.; Jing, P.; Zhai, Y.; Shen, D.; Qu, S.; Rogach, A.L. Conquering Aggregation-Induced Solid-State Luminescence Quenching of Carbon Dots through a Carbon Dots-Triggered Silica Gelation Process. Chem. Mater. 2017, 29, 1779–1787. [Google Scholar] [CrossRef]
Figure 1. SEM images of starting powders from (a) orange peel A0, (b) date stones B0, and (c) oak acorns C0, and carbonaceous materials obtained after the first step of the process: (d) A1, (e) B1, and (f) C1.
Applsci 14 08807 g001
Figure 2. (a) Elemental analysis of A0-C0 and A1-C1. FT-IR spectra of A1 (b), B1 (c), and C1 (d).
Applsci 14 08807 g002
Figure 3. (a) XPS survey of A2 GQDs (originating from orange peel). (b) Deconvoluted C1s spectrum of A2 GQDs. (c) Deconvoluted N1s spectrum of A2 GQDs. (d) FT-IR spectrum of A2 GQDs.
Applsci 14 08807 g003
Figure 4. Size characterization of A2 GGDs (originating from orange peel) determined by (a,b) HR-TEM and (c) DLS with analysis by number. The micrograph (a) depicts dispersed GDQs on the carbon support. An individual graphene quantum dot of ~2 nm is depicted in (b) with inset depicting the diffraction and fringe pattern.
Applsci 14 08807 g004
Figure 5. Photophysical properties of water-dispersed A2 GQDs. (a) UV-vis spectrum and (b) normalized emission spectra of GQDs recorded for progressively longer excitation wavelengths ranging from 300 to 500 nm (with a 50 nm increment).
Applsci 14 08807 g005
Figure 6. White-light emission (λexc. = 325 nm) of A2-based films deposited on a silicon wafer. The spectrum has been truncated at 650 nm to remove the peak corresponding to the excitation second harmonic.
Applsci 14 08807 g006
Table 1. Percentage of C, N, O, and S atoms in GDQs A2 (synthesized from orange peel), B2 (synthesized from date stones), and C2 (synthesized from oak acorns) determined by XPS measurements *.
Sample A2Sample B2Sample C2
C content (%)58.1 ± 2.164.7 ± 2.265.2 ± 2.4
N content (%)5.4 ± 0.24.0 ± 0.14.9 ± 0.2
O content (%)34.7 ± 1.230.5 ± 1.029.6 ± 1.1
S content (%)1.8 ± 0.10.8 ± 0.10.3 ± 0.1
* The elemental analysis results are expressed as the mean of three independent measurements ± the standard deviation.
Table 2. Various bioprecursors used to produce GQDs and relevant information.
PrecursorsSynthetic MethodsPurification ProcedureSize Range (nm)Yield (wt%)Ref.
Rice husks
-
Tube furnace 700 °C for 2 h
-
NaOH 700 °C for 2 h
-
Ultrasonication with H2SO4 and HNO3 for 10 h
-
Solvothermal heating at 200 °C for 10 h
Filtration with 0.22 µm3–6 15[34]
Plant leaves
-
Neem leaves pyrolyzed at 1000 °C for 5 h under Ar
-
Ball-milling for 1 h
-
H2SO4:HNO3 (3:1 mixture) at 90 °C for 5 h
NaOH and filtration with 0.22 µm5–6/*[45]
Charcoal
-
H2SO4:HNO3 (3:1 mixture) sonication for 2 h
-
100 °C for 24 h
Simple filtration and drying2–15 /*[46]
Honey
-
Honey + 1-Butanol at 80 °C for 1 h
-
Hexadecylamine at 160 °C
Centrifugation1–3/*[47]
Coffee
-
Hydrazine and ultrasonication for 30 min
-
Solvothermal heating at 200 °C for 10 h
Filtration with 0.22 µm, then dialysis for 2 days2–5 33[48]
Lignin
-
Ultrasonication for 12 h
-
Solvothermal heating at 180 °C for 24 h
Dialysis for 2 days2–6 21[49]
Orange peel
-
H2SO4, 180 °C for 5 min, microwave
-
HNO3, 150 °C for 5 min, microwave
Evaporation1–220This work
* The yield (weight percentage) has not been given.
Disclaimer/Publisher’s Note: The statements, opinions and data contained in all publications are solely those of the individual author(s) and contributor(s) and not of MDPI and/or the editor(s). MDPI and/or the editor(s) disclaim responsibility for any injury to people or property resulting from any ideas, methods, instructions or products referred to in the content.

