Article

Characterization of Hydraulic Spool Clamping Triggered by Solid Particles Based on Mechanical Model and Experiment Research

by
Qianpeng Chen
1,*,
Min Liu
1,
Hong Ji
1,
Wenwei Chai
2 and
Changmin Luo
2
1
Energy and Power Engineering Department, Lanzhou University of Technology, Lanzhou 730050, China
2
Guizhou Honglin Aero Engine Control Technology Co., Ltd., Guizhou 550000, China
*
Author to whom correspondence should be addressed.
Appl. Sci. 2024, 14(19), 8880; https://doi.org/10.3390/app14198880
Submission received: 28 May 2024 / Revised: 13 July 2024 / Accepted: 25 July 2024 / Published: 2 October 2024
(This article belongs to the Section Applied Industrial Technologies)

Abstract

:
Hydraulic spool valves may clamp under the action of sensitive particles when working in hydraulic oils that contain solid particles, which will then bring about a devastating detriment to the machines. According to the failure statistics of hydraulic systems organized by ISO, more than 80% of the operational failures of hydraulic systems are caused by fluid contamination, and particulate contamination is the most important factor causing spool valve stagnation. In this paper, we considered various factors, including the material, size, and concentration of particles and the spool postures, and built a systematic spool clamping mechanical model. A device was designed to measure the spool valve friction under the action of particles. The influence of particle material, concentration, and size on the friction force of spool valves was investigated. By experiments, we measured the spool clamping force under the action of each single factor and then fitted the datum quantity of spool clamping force and the empirical equation of pulsating quantity. The study results demonstrate three types of non-ideal postures of spools in a valve hole, which are off-center, tilting, and off-center with tilting. Those three postures can engender clamping risk zones with different ranges inside the clearance between spool valves, increasing the risk of spool clamping. The kind of particles is found to have a certain but limited impact on the spool clamping force. Usually, particles with a higher elastic modulus can trigger a larger spool clamping force, which is in line with the theoretical equation. Within a certain range, the probability density distribution of particle size tallies with the normal distribution function, where the “sensitive particles” take up 0.7–1 of the clearance between spool valves. A higher particle volume fraction in oils means a greater number of sensitive particles and a larger spool clamping force. For the particles of a similar size with the clearance between spool valves, when their volume concentration tops over the “sensitive concentration”, namely 5%, the risk of spool clamping rises in a drastic manner. This study provides a theoretical reference and an empirical equation for the mechanism of spool clamping under the action of particles, as well as a definite quantitative indicator for the prediction and estimation of spool clamping which is of positive significance for the study of the predictive maintenance of hydraulic equipment.

1. Introduction

Spool valves are the best representative of hydraulic valves. They have diversified control modes, which allow extensive use in the hydraulic control system of various engineering machinery, marine equipment, and aircraft [1]. The clearance between spool valves ranges from serval microns to dozens of microns, playing the role of clearance sealing and movement directing. In practice, the movement of spools is subject to different factors. The clamping of spool movement will lead the actuators to crawling and even failure, then precipitating safety accidents. Similarly, the clamping of precision spool valves will result in a failure of pump displacement regulation, leading the hydraulic system to instability. Therefore, spool clamping is considered as not only the major cause of degrading fluid control and function loss of hydraulic valves but also an important root for the declining reliability of hydraulic systems.

1.1. Study of Solid Particles in Hydraulically Contaminated Fluids

Studies have shown that over 70% of failures are due to contaminants in the hydraulic fluid, with 60–70% of these failures due to solid particles. Nejc Novak et al. investigated the effect of different contaminants on accelerated wear and showed that oil contaminated with wear particles reduced the volumetric efficiency of gear pumps by 18%, while oil contaminated with test dust reduced the volumetric efficiency of gear pumps by 76% [2]. Xinqiang Liu et al. investigated the erosion behavior of solid particles on notchless hydraulic slide valves and their effects, and found that there was erosion angle damage on the valve spool by measuring the micro-morphology of the spool surface [3]. Some scholars have investigated the influences of contaminated oil on hydraulic systems [4,5,6]. Jack Edmonds and Michael S. Resner et al. applied acoustics to detect precursor-worn debris particles in size of less than 3 μm. By monitoring the size and generation speed of those tiny particles and analyzing their wear trend, accelerating wear can be predicted prior to the occurrence of disastrous damages [7]. In recent years, studies on the solid particles in oils have been further specified, and in particular, there have been studies on the forces that single particles bear in flow fields and their migration state [8,9,10,11,12]. Besides, many scholars have studied such characteristics of particles as migration, clustering, collision, diffusion movement, and received forces in fluid fields by numerical computation or experimental methods [13,14,15,16,17,18].

1.2. Modeling of Solid Particle Wear on Hydraulic Valves

The hazards of solid particles on hydraulic valves cannot be ignored, so researchers have developed different models to explore the wear and erosion mechanisms of solid particles on hydraulic valves. On the basis of dynamic system modeling principles, Yun-Xia Chen and Wen-Jun Gong employed the Archard model and trisome abrasive wear model for the adhesive wear experiment and abrasive wear experiment separately. Moreover, they calculated the actual wear volumes and established their coupled wear model [19,20]. The studies on the erosion of particles onto the valve orifice are mainly concentrated on the zero position characteristics and micromotion of the servo valve orifices [21,22,23]. Some scholars have developed an erosive wear model to study the effect of solid particles on hydraulic valves [24,25,26]. Fei Sun and Yong-Bao Feng et al. found that when the mass flow rate is kept unchanged, the wear rate of valve orifices increases overall as the particle diameter enlarges, and is sensitive to a certain particle diameter. They also found that as the opening of valve orifices expands, the corresponding diameter of sensitive particles enlarges accordingly [27]. Jian-Jun Zhang et al. proposed a numerical method for one-way fluid–particle coupling and verified it experimentally. On this basis, the trajectory of spherical iron particles in the valve cavity was numerically simulated using a two-dimensional flow model [28].

1.3. Study of Spool Clamping

Compared with the abrasive wear and erosion wear that particles make onto spool valves, the spool clamping induced after particles invade valve clearances might lead hydraulic mechanical control to a failure, which is often followed by a devastating consequence. Therefore, it is necessary to pay more attention to spool clamping. Some scholars have proposed the concept of sensitive particles and explored the mechanism by which solid particles cause spool clamping [29,30,31,32]. Hong Ji and Teng-Xia Cui et al. simplified the micro fit clearance of spool valves into a 2D model and approximated the outer shapes of sensitive particles to squares. Using the arbitrary Lagrangian–Eulerian method of fluid–structure interaction module in the COMSOL 5.2 software, they simulated the motion characteristics of square particles in the clearance of spool valves. They found the rotation phenomenon of those particles in the valve clearance, which explained at the micro level the mechanism that non-spheric particles induce spool clamping [33]. Several authors have investigated the effect of different forces and geometric parameters on spool clamping [34,35,36]. Shen-Zhe Zhang et al. used the sliding mesh technique to establish the numerical model of hydraulic slide valves with different inlet and outlet space angles and control surface structures, and analyzed the force characteristics of the spool at different openings and inlet flow rates. The results showed that the spool tilted deeper with the increase in inlet flow rate [37]. Yong Yang et al. studied the friction force acting on the spool by the influence of the spool motion state and the results show that in a certain range, the greater the change in spool displacement, the greater the change in friction [38]. Moreover, some other scholars investigated the influence of valve postures and clearance shapes and structures on spool clamping [39,40,41,42].

1.4. Summary

The existing studies firstly clarified the hazards of oil contamination on hydraulic spool valve failure, which illustrated the importance of this study. Some scholars have shown the motion characteristics of particle transport, aggregation, rotation, collision, etc. through numerical simulation and visualization tests, which provide scientific references for the force analysis of individual particles in the clearances in this study. In addition, some scholars have analyzed the causes of spool valve hysteresis, including roughness, clearance size, spool tilt, and other factors on the spool valve hysteresis, which provides theoretical guidance for the mathematical modeling of the spool hysteresis force under the action of particles in this study. There are also some gaps in the existing studies; for example, no one has directly measured the spool valve hysteresis force under the action of particles, and no one has developed the relevant test apparatus, and only a few studies have focused on the spool clamping problem caused by particle intrusion into the spool due to the lack of a systematic theoretical framework and the difficulty of numerical calculation and simulation. Meanwhile, experimental studies and theories that take into account the multifactor coupling of particle material and size, concentration, and spool postures have not been proposed. From a microscopic point of view, it has been realized that the precise fit between the spools is extremely sensitive to oil contamination, especially solid particle contaminants. Figure 1 illustrates the process of solid particles invading valve clearance. The oil in the valve clearance flows under pressure difference, which is known as “internal leakage”. Under the co-action of internal leakage and spool sliding, solid particles can invade the valve clearance in an extremely easy way. It can be found that the particles invading the valve clearance vary in size, and the particles whose size is closer to that of the valve clearance can cause spool clamping easier. In this study, the mathematical model of hysteresis force under the action of particles is systematically established through the clamping force measurement test, taking into account the conditions of particles and the spool postures, connecting the microscopic motion of particles in the clearances with the macroscopic phenomenon of spool valve hysteresis, which is innovative and provides the theoretical basis for the similar topics.

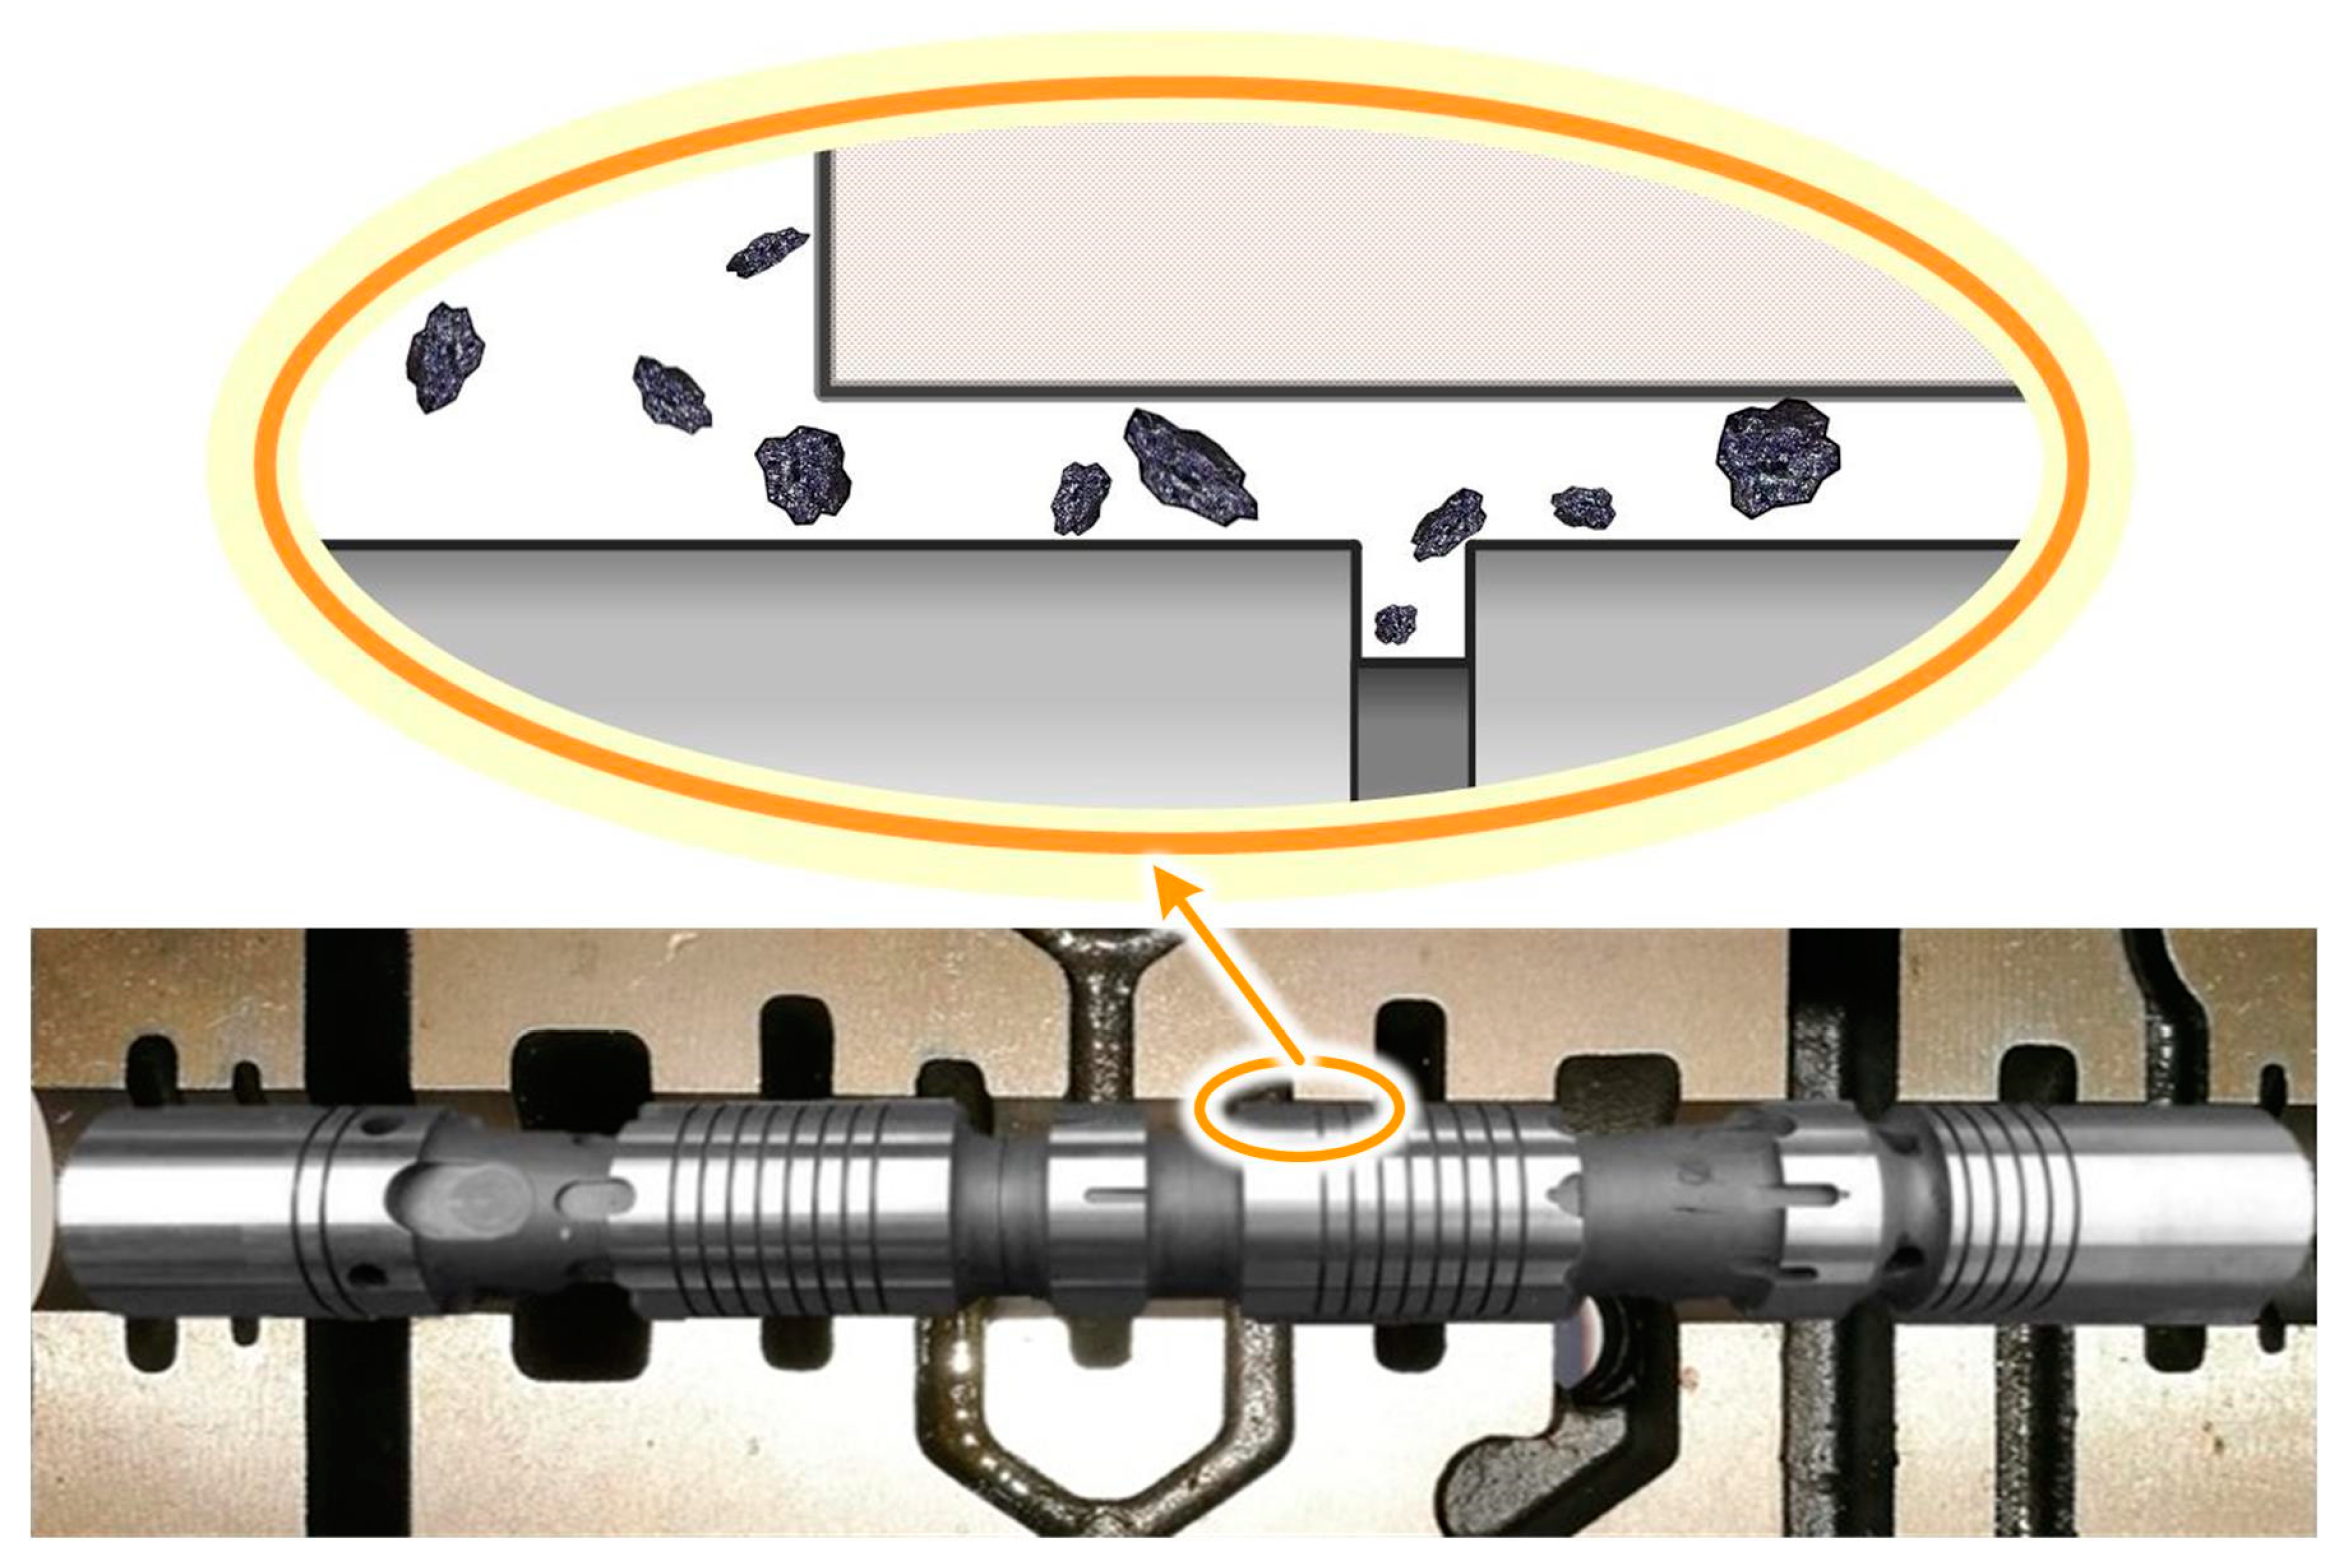
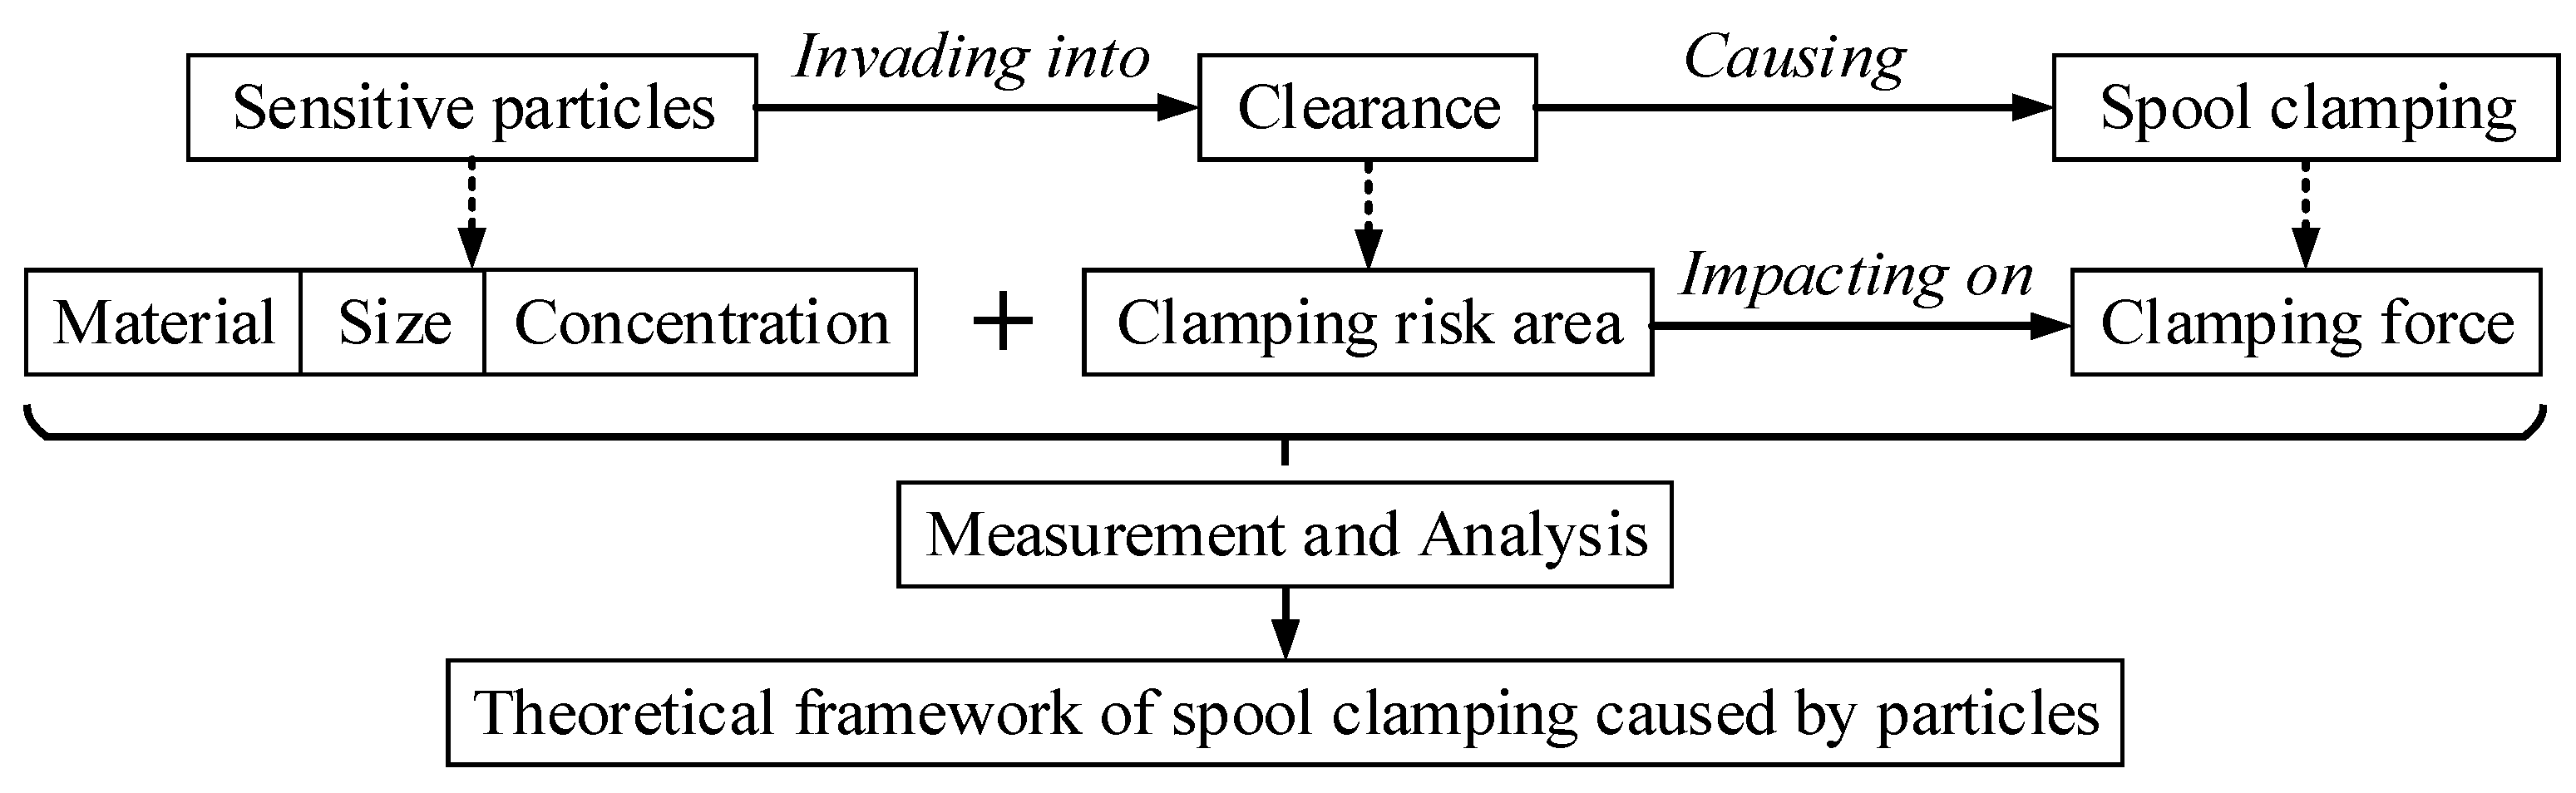
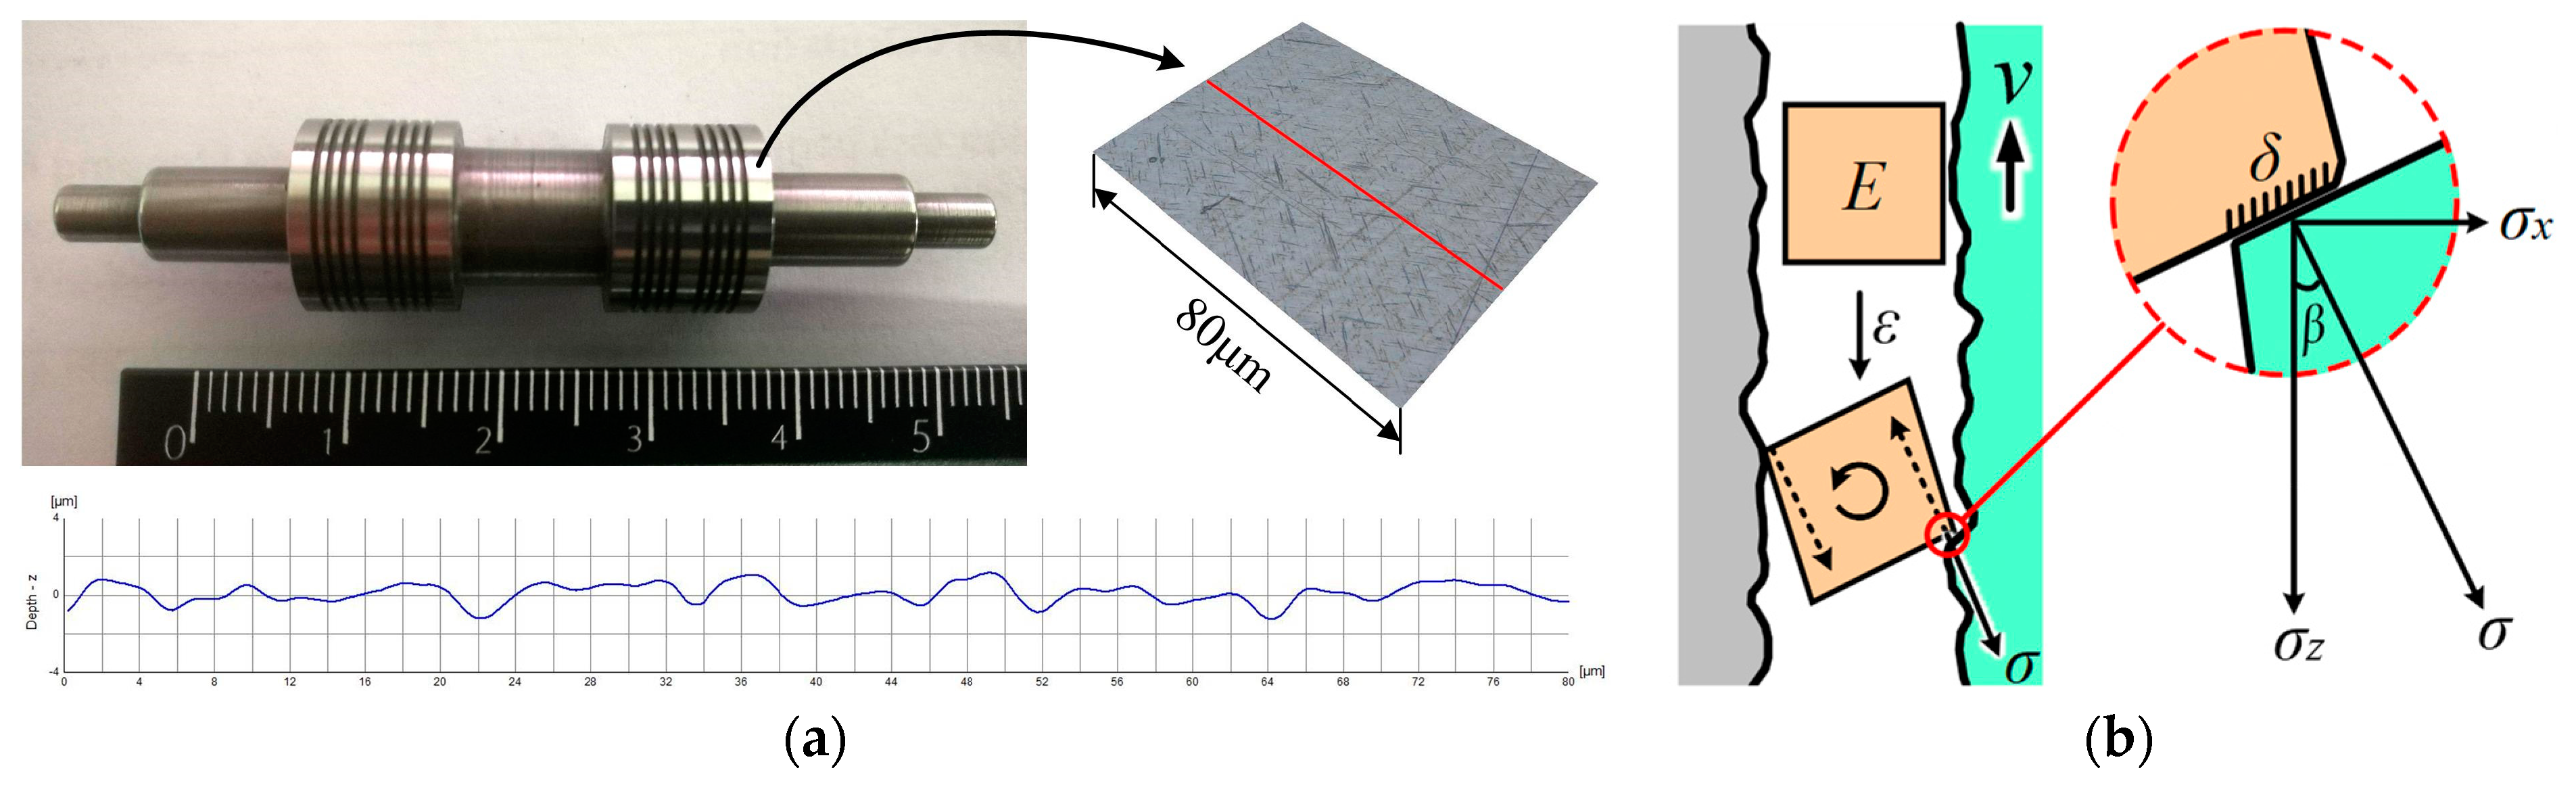
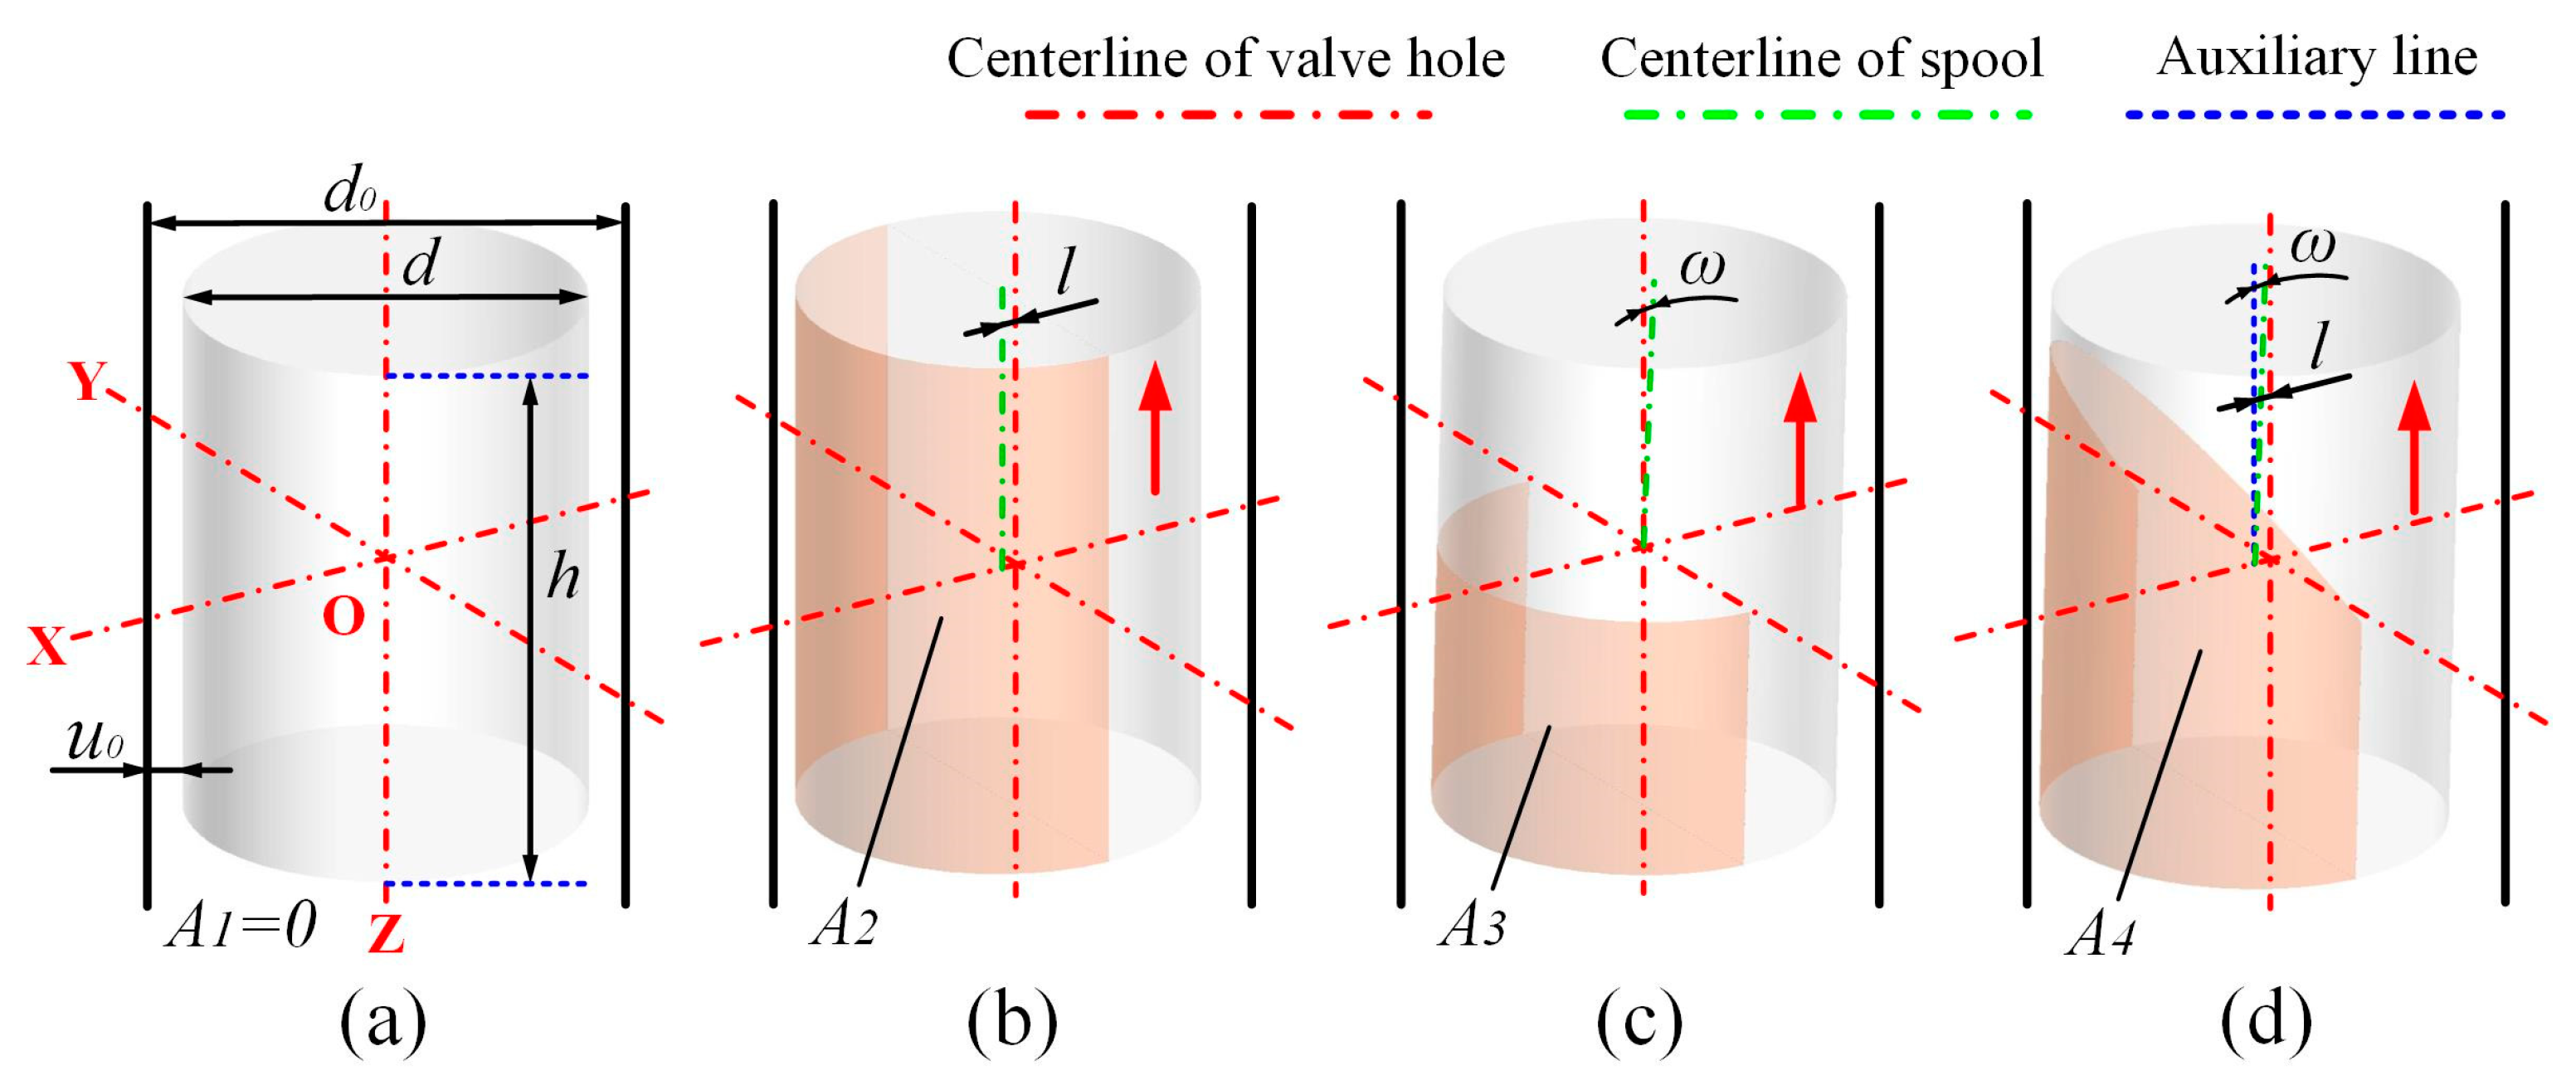
2. Materials and Methods

2.1. Establishment of Mechanical Model

2.1.1. Fundamental Theories

The spool valves, valve clearance, and sensitive particles are three major subjects of this study. The sensitive particles possess such primary characteristics as material, size, and concentration in oils, the clearance clamping risk zone is defined by the particle size, any single factor will affect the performance of spool clamping. By measuring and analyzing the clamping force under particle contamination, a theoretical model was established for the influential factors of clamping force under the action of particles. The theoretical framework of this study is shown in Figure 2.
The action of particles onto the spool clamping was taken as a stacking effect of each tiny particle. The tension characteristics of a single particle were analyzed, and the actions of single particles were superimposed. Then, the basic model of multiple particles acting on the clamping force can be established.
The essential cause for spool clamping by solid particles is the rough morphology of the spool surface at the micro level; a three-dimensional surface topography instrument was used to measure the rough morphology of the surface of a spool (the diameter is 12 mm), as Figure 3a shows, the local contour of the valve core surface was extracted along the red line, and then the rough contour line along the axial direction of the valve core was formed. The profile of the spool clearance is drawn as irregular according to the measurement result, and the solid particle is abstracted as square according to the observation result, as Figure 3b shows. A single particle would produce a turning moment and rotate under the action of spool motion when its two edges are attached to the spool and the valve body concurrently. Moreover, under the yield stress, the particle would deform when being extruded by the spool and the valve body. Let us assume the strain of a particle after being extruded to be ε (unit: mm/mm) and the contact area between the particle and the spool to be δ (unit: mm2). If the elastic modulus of the particle is E (unit: N/mm2), then the clamping force σi that a single particle produces on the spool can be expressed as Equation (1).
σ i = σ z = E ε δ cos β
After the particle material was confirmed to be an elastic modulus Ek, the strain ε of a single particle and the contact area δ between the particle and the spool held a direct correlation with the particle size a (unit: mm). Given the clearance size u0 (unit: mm) in a perfect case, a dimensionless variable e = a/u0 (unit: mm/mm) and the function gi(e) of clamping force changes caused by this variable were introduced and can be expressed as Equation (2):
σ i = E k g i ( e ) ( e 1 )
The dimensionless variable c% (m3/m3) that denotes the volume fraction of particles in oil and the spool clamping risk zone Ai were introduced as parameters for the calculation of the number of sensitive particles. Let us suppose that there are n sensitive particles acting on the spool, then the clamping force Fclamping on the spool is the superimposing effect of these sensitive particles. It can be expressed as Equation (3).
F c l a m p i n g = i = 1 n σ i = E k i = 1 n g i ( e ) = F ( k , c , e )
In Equation (3), k denotes the material kind, which corresponds to the elastic modulus Ek of the material. Besides, both e and c% are inherent attributes of particles in the oil and can be considered known. In the following section, the calculation equation of Ai was deduced to obtain the expressions of n, E k g i ( e ) , and Fclamping.

2.1.2. Mathematical Model of Spool Clamping Risk Zone Ai

The spool posture in the valve hole directly affects the clearance height, shaping the clamping risk zones of different morphologies. The spool posture in the valve hole was categorized into three patterns: off-centered, tilting, and off-centered with tilt. When the spool moves upward, the clamping risk zone can be shown in Figure 4, where the red arrows are the movement direction of valve core.
Let us suppose a cylindric spool with a diameter of d and a height of h, and the superficial area of its side surface is A, as shown in Figure 4a. This spool was assembled with a valve hole with a diameter of d0. Their central axes will coincide in the perfect case, shaping a unilateral clearance of u0 (u0 = (d0d)/2). If the feature size a of sensitive particles is close to u0 and a < u0, then these particles are likely to invade in the clearance. When the spool valve is off-centered or tilting in the valve hole, the clearance of some zones will be made u < u0, then shaping the clamping risk zones of different morphologies. And in this clearance, the sensitive particles will greatly increase the risk of spool clamping.
In Figure 4a–d, the A1, A2, A3, and A4, respectively, represent the clamping risk zones of spools in perfect posture, off-centered posture l, tilting posture ω, and off-centered with tilt posture l + ω. The calculation of the areas of A1 and A2 was relatively simple. A3 and A4 were both made of a 1/4 cylindric surface and part of a spatial fan-shaped surface. Their corresponding spatial fan-shaped surfaces were expressed as Aω and Aωl. The geometric parameters required by the calculation are shown in Figure 5.
It can be seen from Figure 5a that Aω or Aωl are actually planes which pass through the center point of the cylinder’s bottom surface and shape a θ angle with the bottom surface. The planes also shape spatial curved sector surfaces with the sides of the cylinder, and the areas of these curved surfaces are as follows:
S = 0 π d 2 2 tan θ sin α d α θ 0 , π 2
It can be known from Equation (4) that the calculation of θ is the key to calculate Aω and Aωl. As shown in Figure 5b,c, since the zone of u < u0 is defined as a clamping risk zone, the value of θ is determined by the location of u0, and the location of u0 is determined by ω and l. Let us suppose ωmax to be the maximum ω, then the ωmax can be calculated by Equation (5) and θ can be calculated by Equation (6). The areas of spatial sectors Aω and Aωl are expressed as Equations (7) and (8).
According to Figure 5b,c, in fact, u1 < u0 < u2 means A 3 = A / 4 A ω and A 4 = A / 4 A ω l , and u1< u2 < u0, means A 4 = A / 4 + A ω l . To sum up, the area of Ai (i = 1,2,3,4) can be expressed as Equation (9).
In Figure 5b,c, u1 and u2 can be expressed as Equations (10) and (11), respectively, and u0 is the maximal clearance size of a clamping risk zone. The minimal clearance size umin of a clamping risk zone can be calculated by u2, as shown in Equation (12). The u0 relates to the machining accuracy of spool valves, and umin to the spool posture in the valve hole.
ω max = arcsin d 0 l h 2 + d 2 arctan d h ( 0 l < d 0 d 2 )
tan θ = 2 l d 1 sin ω tan ω 2 ( 0 ω < ω max , 0 l < d 0 d 2 )
A ω = π d 2 8 tan θ = π d 2 8 tan ω 2 ( 0 < ω ω max , l = 0 )
A ω l = π d 2 8 tan θ = π d 2 8 2 l d 1 sin ω tan ω 2 ( 0 < ω ω max , 0 < l < d 0 d 2 )
A i = A 1 = 0 ( ω = 0 , l = 0 ) A 2 = 1 2 A = π 8 h d 2 ( ω = 0 , 0 < l d 0 d 2 ) A 3 = 1 4 A A ω = π 16 h d 2 π d 2 8 tan ω 2 ( 0 < ω ω max , l = 0 ) A 4 = 1 4 A + A ω l = π 16 h d 2 + π d 2 8 2 l d 1 sin ω tan ω 2 ( 0 < ω < ω max , 0 < l < d 0 d 2 )
u 1 = d 0 cos ω d 2 cos ω l ( 0 ω < ω max 2 , 0 < l d 0 d 2 )
u 2 = d 0 d cos ω 2 l ( 0 ω < ω max 2 , 0 < l d 0 d 2 )
u min = 1 2 ( d 0 d cos ω l h sin ω ) ( 0 ω < ω max 2 , 0 < l d 0 d 2 )

2.1.3. Calculation of the Number of Sensitive Particles n, and Deduction of the Expressions of Joint Force Fclamping and Single Force σi

Since the irregular shapes of tiny particles, the connection line between the closest two points on the particle surface was taken as the short axis and expressed by a. When au0 and a < u0, some particles may not only invade in the clearance but also bring about spool clamping, and those particles are known as “sensitive particles”. Since the clearance size varies as the spool posture changes, the size of sensitive particles lies in a certain range. Setting the clearance size at u0 = 0.6 mm, a cluster of aluminum particles in the size of a ∈ [0.2, 0.7] (unit: mm) were selected for the size measurement and morphological analysis. Figure 6 shows the micromorphology of some particles after magnification. It can be seen that the shapes of most particles can be abstracted into squares or rectangles, of which the square particles account for 2/3 or so. Therefore, the simplification of the particles into square particles in Figure 3 tallies with the actual situation.
The statistical result histogram is shown below. The probability distribution curves of the particles of different sizes were fitted, and the probability density function φ ( a ) of these particles was obtained. Finally, the expression Φ ( a ) of probability distribution curves of the particles of different sizes was derived inversely.
The particle size distribution histogram was obtained by statistics. Figure 7 shows that the particles in the size within a ∈ [0.4, 0.5] are the most in quantity, accounting for 41.3% of the total samples. The particle sizes are mainly in the range of [0.3, 0.6], accounting for 87% of the total samples. By the statistical results, the probability scatter diagram of the particles smaller than a certain size was obtained, and the probabilities were fitted into a probability density curve Φ ( a ) of particle sizes. Then, Φ ( u 0 ) Φ ( u min ) can be used to denote the particle probability of a ∈ [umin, u0]. The expression of function Φ ( a ) is derived as follows.
In Figure 8, the green solid line denotes the curve d Φ ( a ) / d a obtained by the differentiation of the distribution curves. The curve d Φ ( a ) / d a was fitted by a normal distribution function, and the obtained curve φ ( a ) was denoted by the red dotted line. It can be found that the curves d Φ ( a ) / d a and φ ( a ) are highly coincided. This indicates that the differential form of the function Φ ( a ) can be approximately expressed as the probability density curve φ ( a ) which fulfills the law of normal distribution. The expression of φ ( a ) is shown in Equation (13). In Figure 7, the Φ ( a ) can be expressed as Equation (14) and the Φ ( u 0 ) Φ ( u min ) as Equation (15). In Equations (13)–(15), the μ and σ denote the mean and variance of normal distribution, respectively.
In Equation (15), the [ui, uj] denotes the size range of contaminant particles, which is [0.2, 0.7] in this statistical sample. The u0 and umin, respectively, refer to the maximum and the minimum clearance size in the clamping risk zone; the Φ ( u 0 ) Φ ( u min ) denotes the proportion of sensitive particles in the total particles. If c% denotes the volume concentration of contaminant particles within [ui, uj] in the oil, then the concentration of sensitive particles can be expressed as c0%, as shown in Equation (16). The number of sensitive particles n in the clamping risk zone Ai can be obtained by Equation (17).
Given the pulsation clamping force generated by particle rotation, the spool clamping force was separated into a basic term f ( E k , c , e ) and a pulsation term f ( E k , c , e ) . To sum up, there is the following:
φ ( a ) = 1 2 π σ exp ( a μ ) 2 2 σ 2 σ > 0 , + φ ( a ) d a = 1
Φ ( a ) = a 1 2 π σ exp ( a μ ) 2 2 σ 2 d a ( σ > 0 )
Φ ( u 0 ) Φ ( u min ) = u min u 0 1 2 π σ exp ( a μ ) 2 2 σ 2 d a ( σ > 0 , u min [ u i , u j ] )
c 0 = c × Φ ( u 0 ) Φ ( u min ) = c × u min u 0 1 2 π σ exp ( a μ ) 2 2 σ 2 d a ( σ > 0 , u min [ u i , u j ] )
n = c 0 A i ( u 0 + u min ) / 2 a 3
F c l a m p i n g = E k i = 1 n g i ( e ) = F ( k , c , e ) = f ( k , c , e ) + f ( k , c , e )
F c l a m p i n g = F E k = f E ( k , c ¯ , e ¯ ) + f E ( k , c ¯ , e ¯ ) ( c = c o n s t , e [ e 1 , e 2 ] ) F c ( c ) = f c ( k ¯ , c , e ¯ ) + f c ( k ¯ , c , e ¯ ) ( k = c o n s t , e [ e 1 , e 2 ] ) F e ( e ) = f e ( k ¯ , c ¯ , e ) + f e ( k ¯ , c ¯ , e ) ( k = c o n s t , c = c o n s t )
Since the elastic modulus Ek of the particles of a specific material k is a constant rather than a variable, FEk is a value instead of a function. In particular, after the Expression (19) of function Fclamping was obtained, FEk was combined with Equations (9), (17)–(19). Then, the tension that a single particle of a certain material and a certain size receives in the clamping risk zone can be obtained and expressed as Equation (20). Next, the clamping force Fclamping of the spool in particulate oil was measured by the single variable method, with the material k, volume concentration c%, and particle size a as the variables. Then, empirical equations for Fc(c) and Fe(e) were obtained.
σ i = E k g i ( e ) = F c l a m p i n g / n = f ( k , c , e ) + f ( k , c , e ) A i × c × u 0 + 1 2 ( d 0 d cos ω l h sin ω ) 1 2 ( d 0 d cos ω l h sin ω ) u 0 1 2 π σ exp ( a μ ) 2 2 σ 2 d a / 2 a 3 ( e = a / u 0 , σ > 0 )
The particle-induced friction changes have significant uncertainties, such as the friction curves presenting non-periodic pulsation characteristics, which brings challenges to the robustness of the present mathematical model. However, from the analysis of the experimental results in this study, it can be seen that when the particle material, size, and concentration vary monotonically, the friction mean and peak values also show significant monotonicity, and this law can be fitted by regression analysis again. Therefore, the mathematical model of this study combines the probability density function and linear regression analysis, reflecting the non-periodic pulsation characteristics of friction force and the monotonic variation characteristics of friction force with conditions, and this approach can effectively improve the robustness of the model.

2.2. Experiment Design and Result Analysis

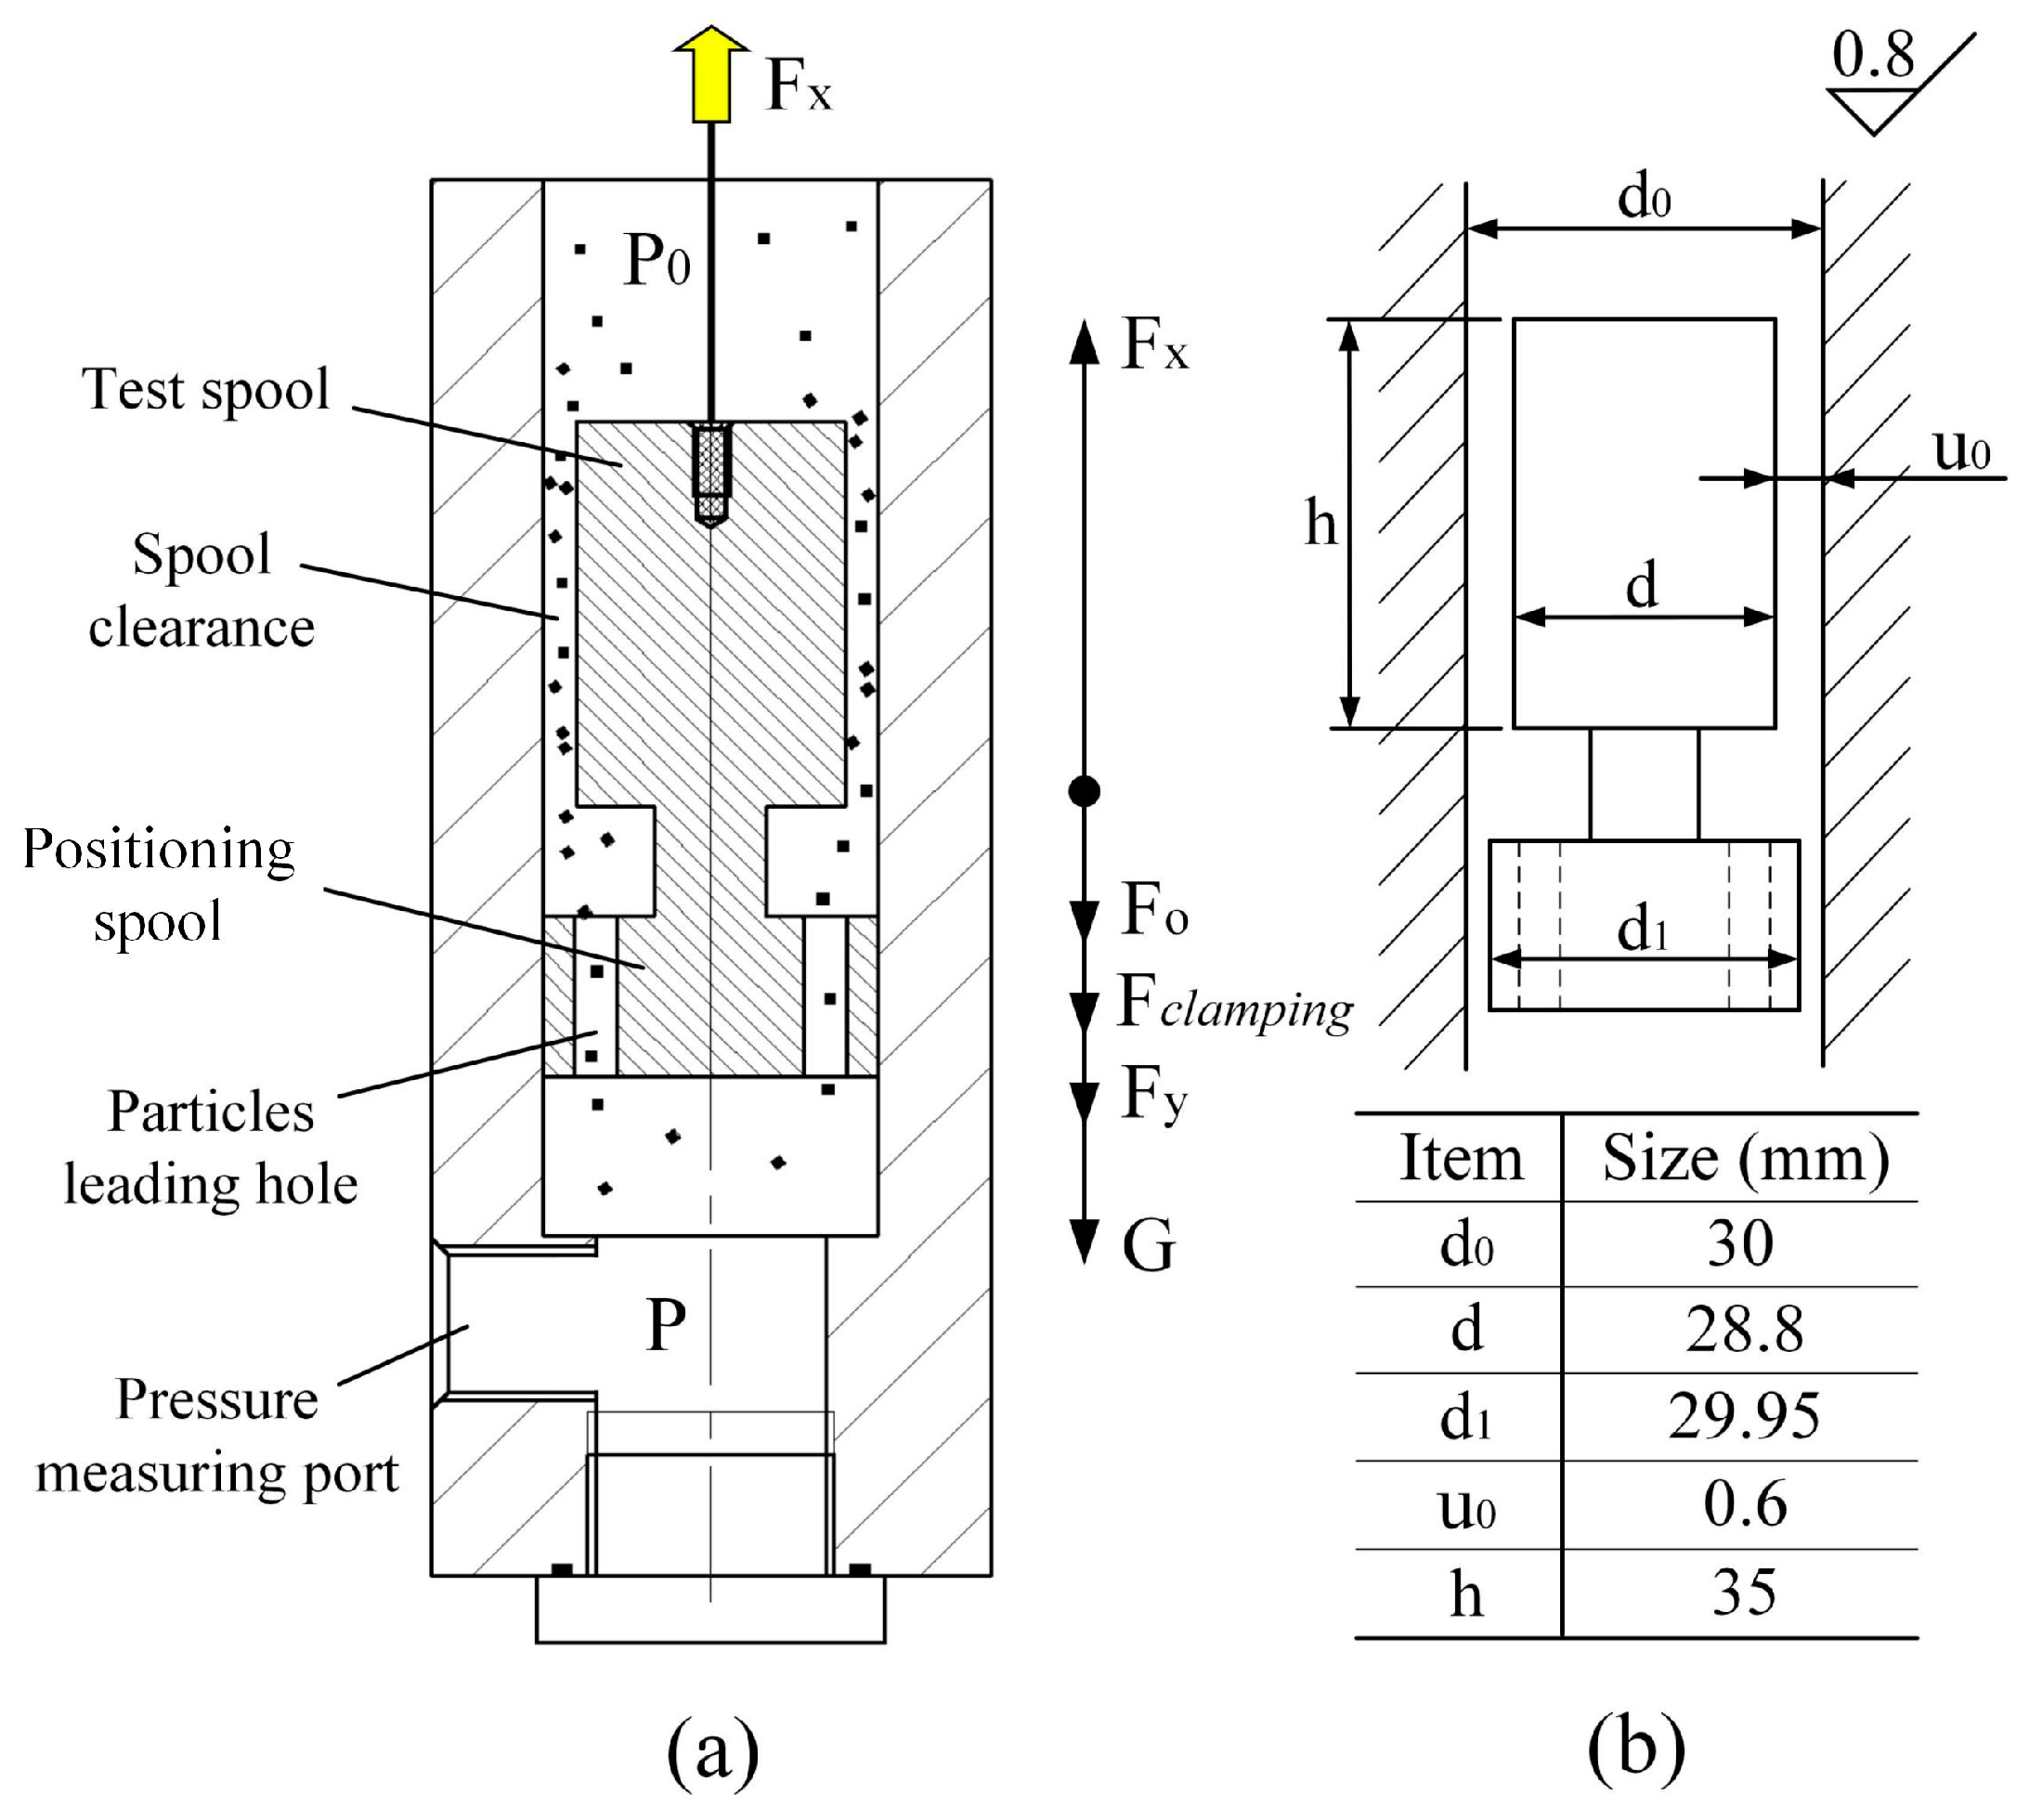
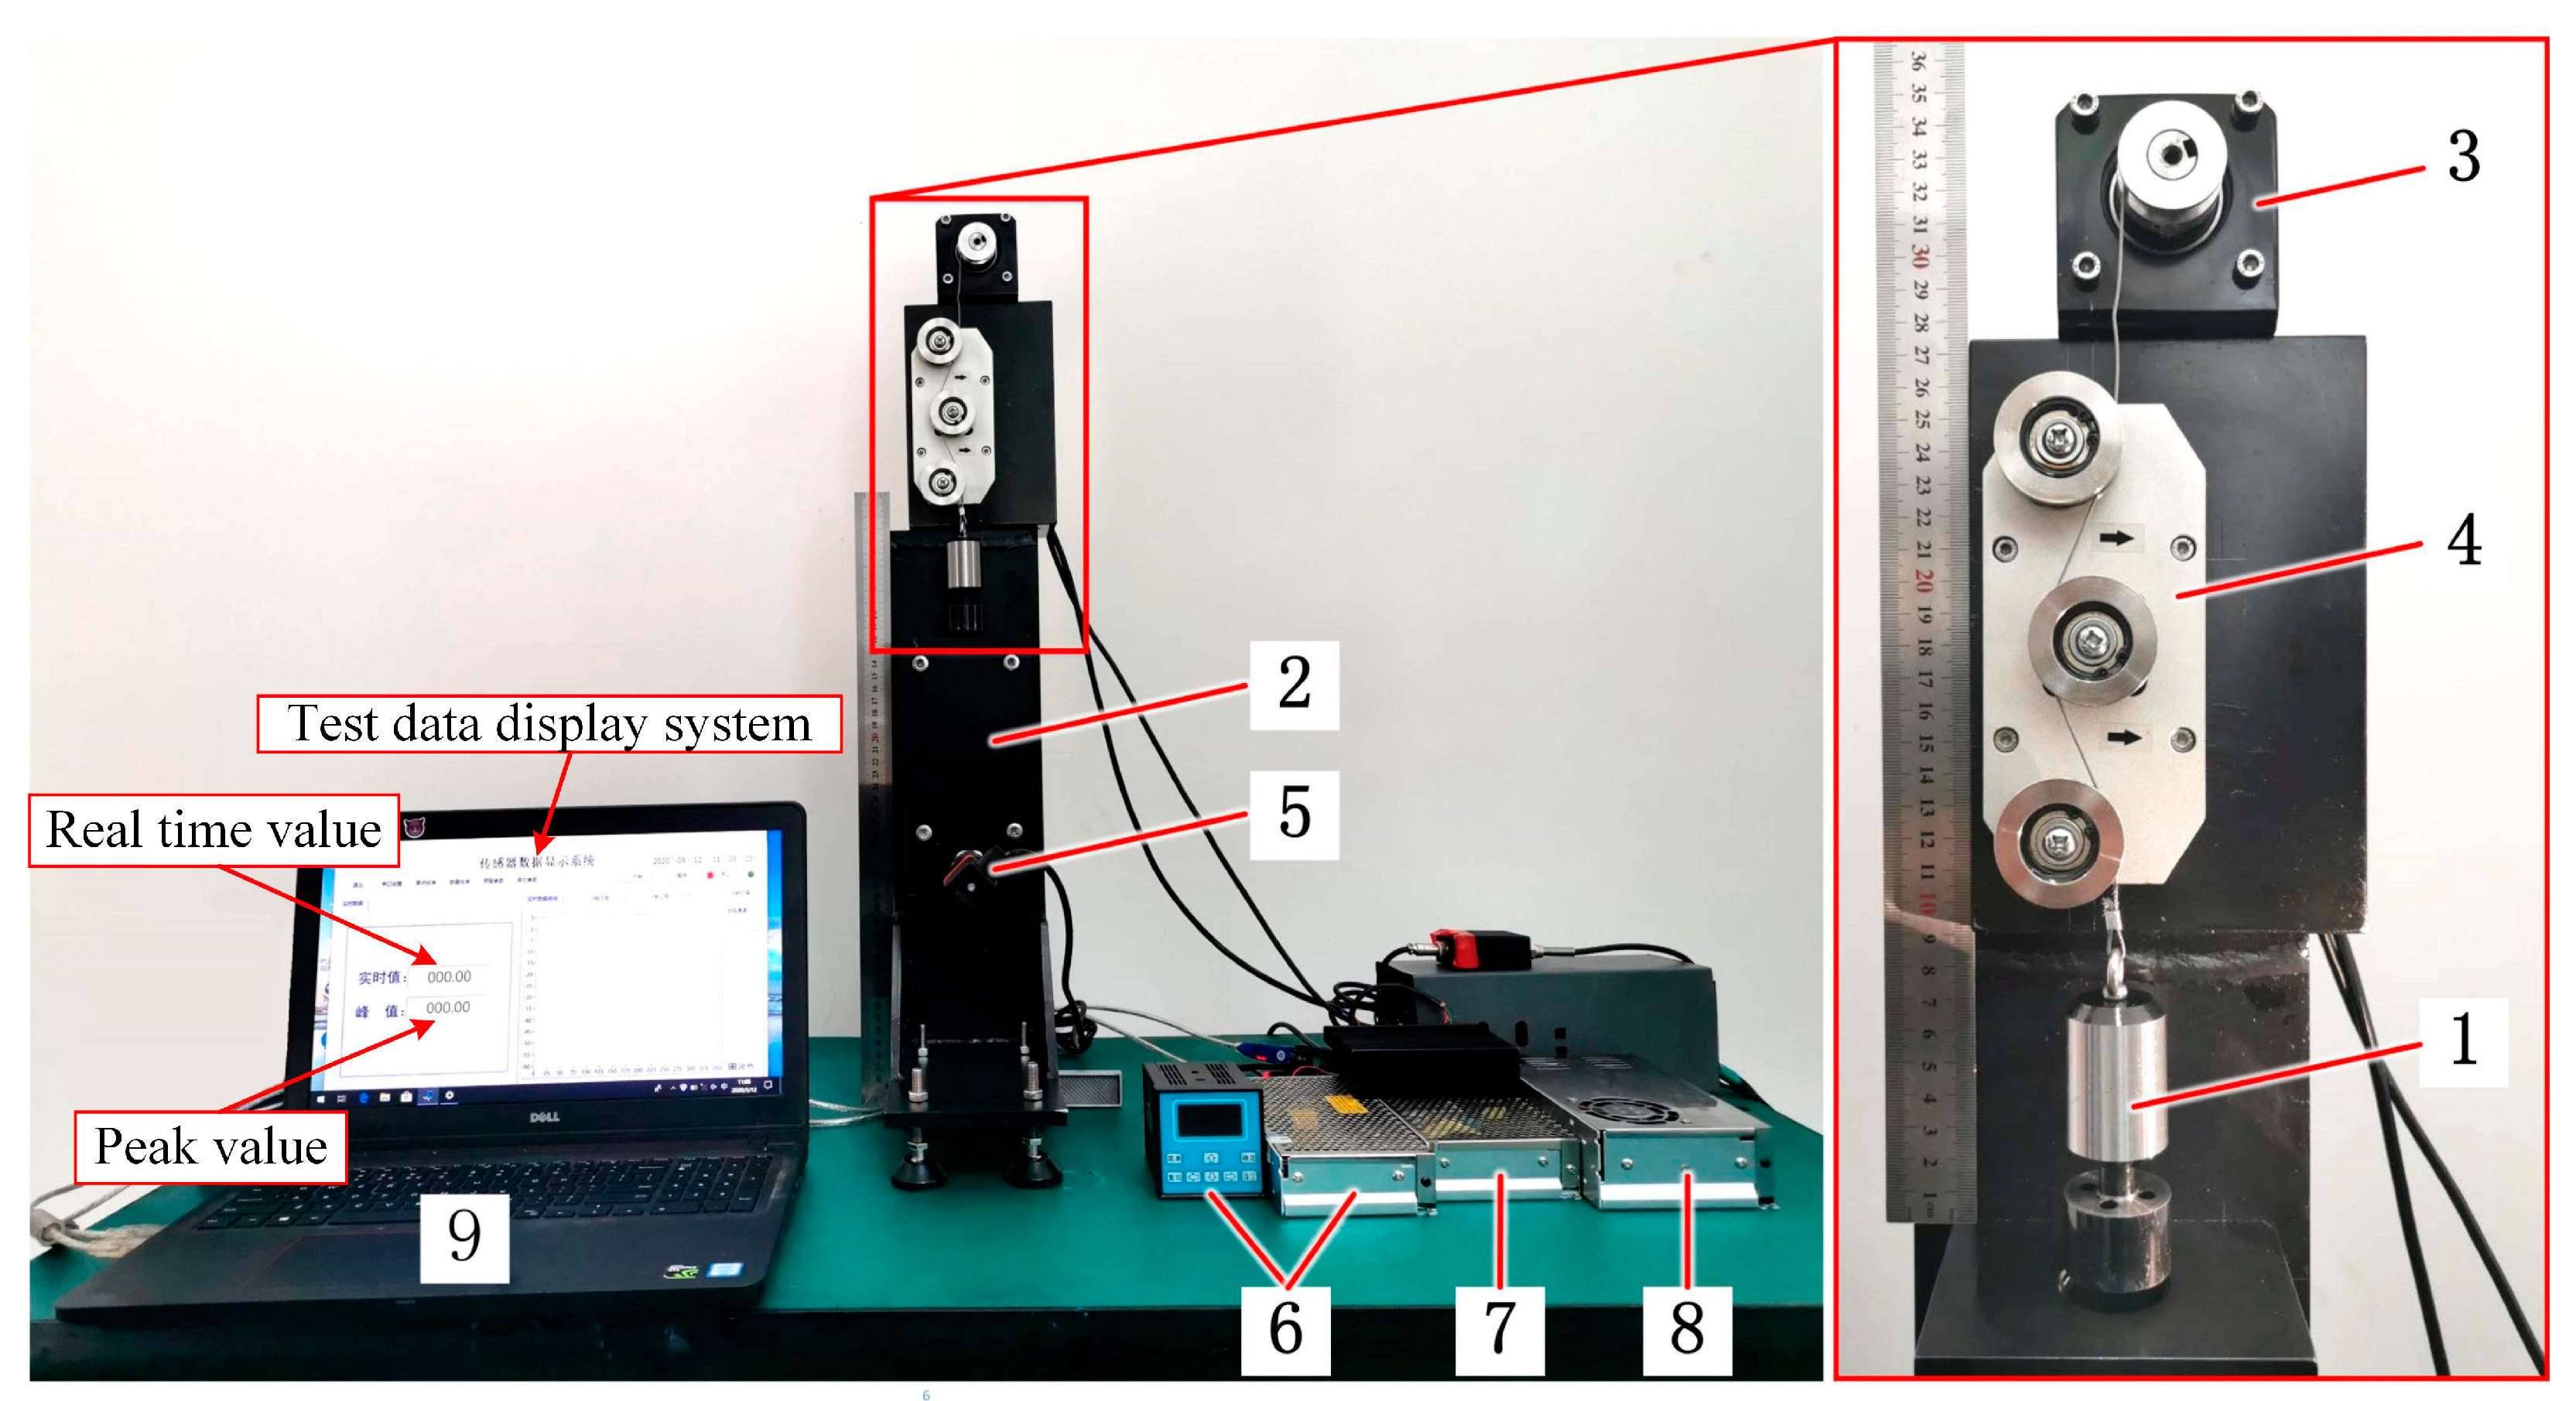
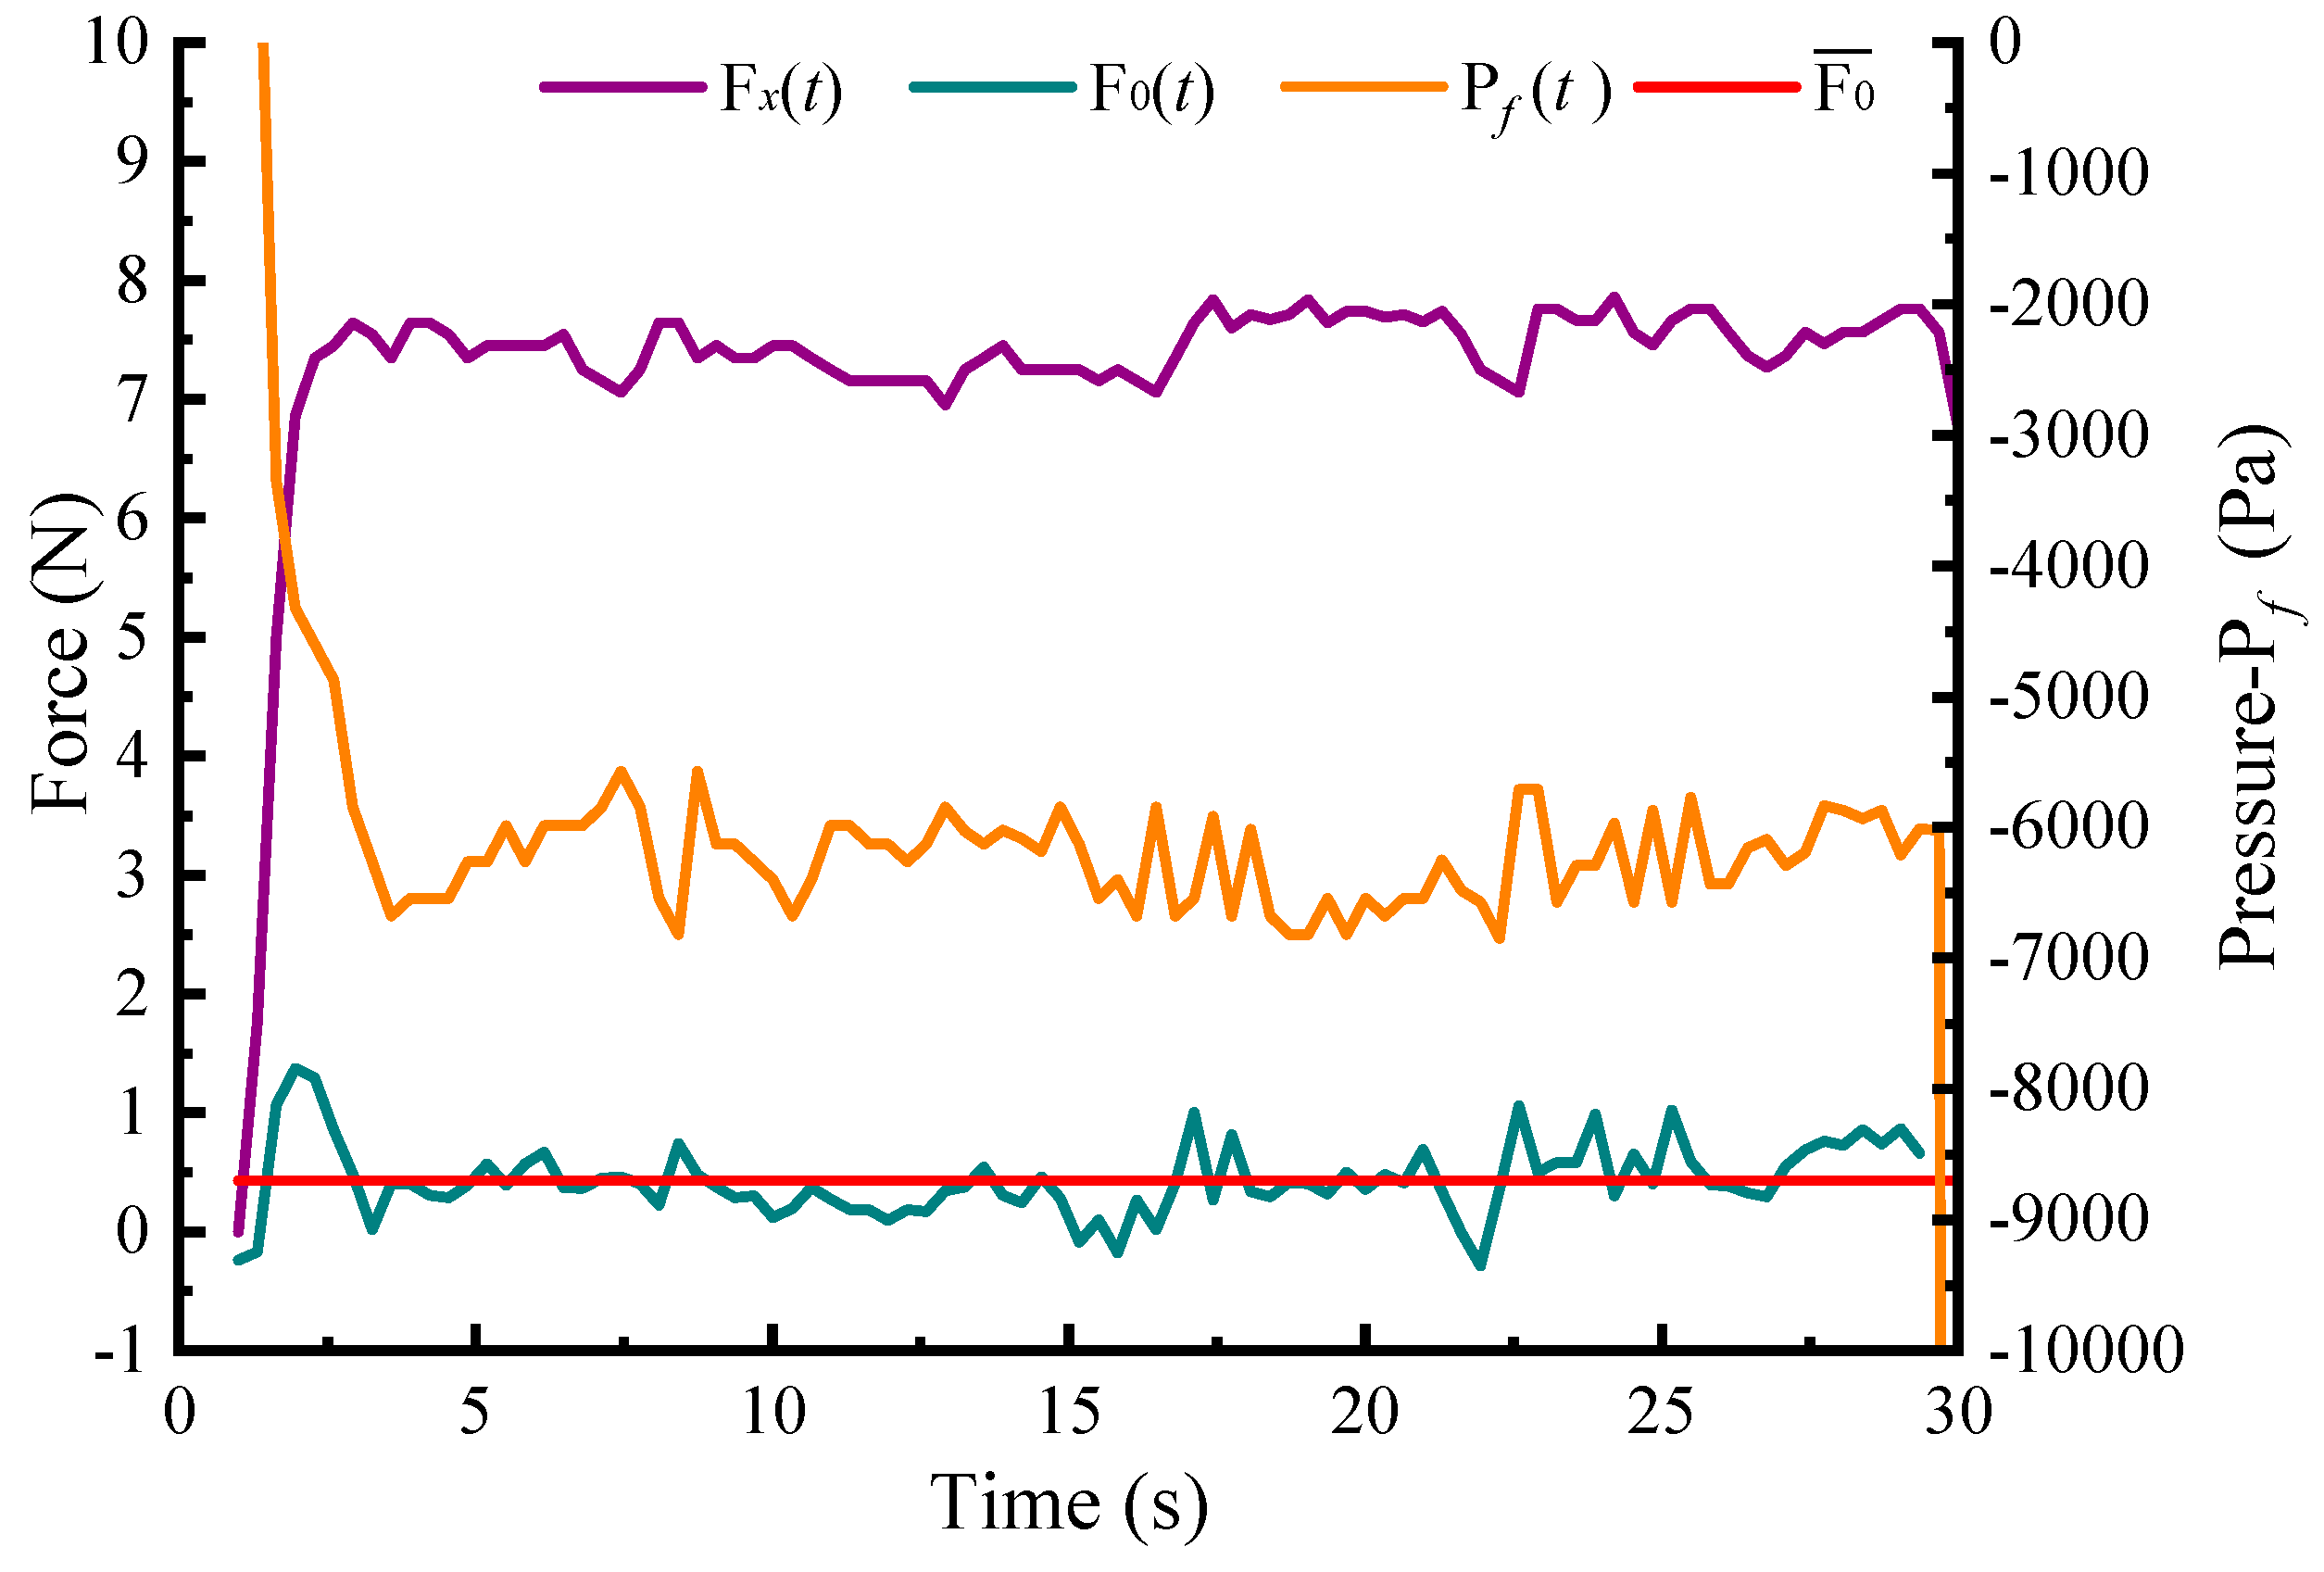
2.2.1. Design of Experimental Device and Method

Hydraulic spool valves function to control the opening of valve orifices by axial motion and then to regulate the flow rate and pressure of fluids. Therefore, clamping might take place in the process of spools sliding along the axis. Based on this characteristic, an experimental valve structure was devised, as shown in Figure 9. A spool mainly consists of a test spool and a positioning spool. The test spool works to simulate the clamping action of particles onto the spool, and the positioning spool prevents the spool from visible tilting in the motion because a large tilt may lead to a measurement error. Since the particle size is smaller than that of the test spool clearance and larger than that of the positioning spool clearance, the particles would flow out with the oil from the export hole of the positioning spool after they pass through the test spool clearance. In light of the principle that objects in uniform motion are in the balance of forces, an inverse calculation was carried out on the clamping force. The experimental model and the force analysis are shown in Figure 9a.
Of the spool, the upper chamber was at an atmospheric pressure P0, and the lower chamber was sealed. A vertically upward force Fx was imposed on the spool, making the spool move upward at a constant speed. In this process, the volume of the lower chamber enlarged, and a relatively negative pressure Pf was produced. This relatively negative pressure Pf served to drive the oil in the valve clearance towards the lower chamber under the pressure difference, thereby bringing the particles into the clearance. The resistance that the negative pressure Pf produced is expressed as Fy. Besides, the spool was subject to gravity G, inherent friction Fo (including the viscous friction in the test spool clearance and the friction on the direction spool wall), as well as the clamping force Fclamping that the particles engendered in the test spool clearance. The forces on the spool are expressed as Equation (21). With no particles added, there is Fclamping = 0 and the time-varying inherent friction Fo(t) is expressed as Equation (22).
In Equation (22), F y ( t ) = P f ( t ) × S , S = π d 2 / 4 , and G = m g , where the spool mass m = 0.2983 kg and g = 10 m/s2, and ‘S’ denotes the area of negative pressure on the lower spool chamber. Let F ¯ denote the mean of inherent friction within a period. By measurement, the curves of Fx(t) and Pf(t) were obtained, and then, the valve of F ¯ o was calculated, as shown in Equation (23). Introducing F ¯ o into Equation (22), the clamping force curve Fclamping(t) of the particles invading the clearance was obtained and expressed as Equation (24).
F x = F c l a m p i n g + F y + F o + G
F o ( t ) = F x ( t ) F y ( t ) G
F ¯ o = t 1 t 2 F o ( t ) d t t = t 1 t 2 ( F x ( t ) F y ( t ) G ) d t t = t 1 t 2 ( F x ( t ) P f ( t ) × π d 2 / 4 m g ) d t t
F c l a m p i n g ( t ) = F x ( t ) F y ( t ) F ¯ o G
Figure 9b shows the basic sizes of the spool and valve body. In the experiment, in order to enable the particles to enter the clearance, the valve clearance u0 was expanded properly to 0.6 mm. The coarseness of the spool and valve body was set at 0.8 in order to highlight the influence of the particulate characteristics on the clamping force and reduce the influence of surface coarseness on the clamping force. In light of the measurement principles and the dimension structure, a clamping force experimental device was devised, as shown in Figure 10.
As Figure 10 illustrates, the rotational motion is converted to a linear motion of the spool which is driven by a stepper motor. The spool tension Fx was measured by a tension sensor, and the negative pressure Fy measured by a negative pressure sensor. Moreover, the spool motion speed was controlled by the controller of the stepper motor, and the data were collected and processed through the tension detection system, the negative pressure monitoring system, and the data acquisition system. The range of the tension sensor is 50 N, the accuracy of the measurement is 0.1 N, and the measurement time is uniformly 30 s. The Fx(t) and Pf(t) without the particles were measured by the established experimental device to calculate Fy(t). Then, according to Equations (2) and (3), the clamping force curve Fo(t) and its mean F ¯ o were obtained, as shown in Figure 11. HM46 hydraulic oil was used as the experimental oil. At last, the inherent friction F ¯ o of the spool valve in purified oil was calculated to be 0.43404 N.
“The tests in this study will measure the friction of the spool under the action of three different materials: aluminum, sand (SiO2), and iron particles; the friction of the spool under the action of aluminum particles of volume concentrations of 1%, 2%, 3%, 4%, 5%, 6%, 7%, 8%, 9%, and 10% (size ranges of 0.2 mm to 0.7 mm); and the friction of the spool under the action of particles of size 0.12 mm, 0.18 mm, 0.24 mm, 0.30 mm, 0.36 mm, 0.42 mm, 0.48 mm and 0.54 mm (particle/clearances size ratios of 20%, 30%, 40%, 50%, 60%, 70%, 80% and 90%). Thus, the effect of particle material, concentration, and size on spool friction was investigated”. We selected as many groups of particle sizes and concentrations as possible under the existing experimental conditions, also in order to obtain more experimental data, thus improving the resolution of the fitted empirical equations. In addition, we did three repetitive tests for each group of tests, and increased the number of tests if the test results differed significantly, and finally selected the group of tests with the highest number of occurrences of similar peaks for analysis. Therefore, the assessment results of this study have a certain degree of reliability and can reflect the actual situation to some extent, and the errors of measurement and calculation are within acceptable limits.

2.2.2. Influences of Particle Kinds on Clamping Force

Aluminum, gravel (SiO2), and iron particles that are commonly found in contaminated oils were selected for the measurement of clamping force. Table 1 presents the physical properties of the three kinds of particles. In terms of material density, there is Al < Gravel < Fe; in terms of Young’s modulus, there is Al < Gravel < Fe; in terms of yield stress, there is Al < Gravel < Fe. Three kinds of particles with a feature size a = 0.48 mm (i.e., e = 0.8) and a volume concentration c = 1% were selected to prepare particulate oils.
The measured clamping force curves of those oils are shown in Figure 12. Figure 12a is a micrograph of the three kinds of particles. It shows that the gravel particles and iron particles have a relatively smooth and glossy surface, while the aluminum particles a relatively coarse surface and irregular shape. This is because aluminum material is more of a plastic material and aluminum particles stretch with their plasticity in the process of formation. According to Figure 12a, the clamping force curves of the three kinds of particles all present aperiodic pulsation but at different amplitudes and frequencies. The mean and maximum clamping forces and their pulsation frequencies in oils containing aluminum, gravel, and iron particles are calculated, respectively.

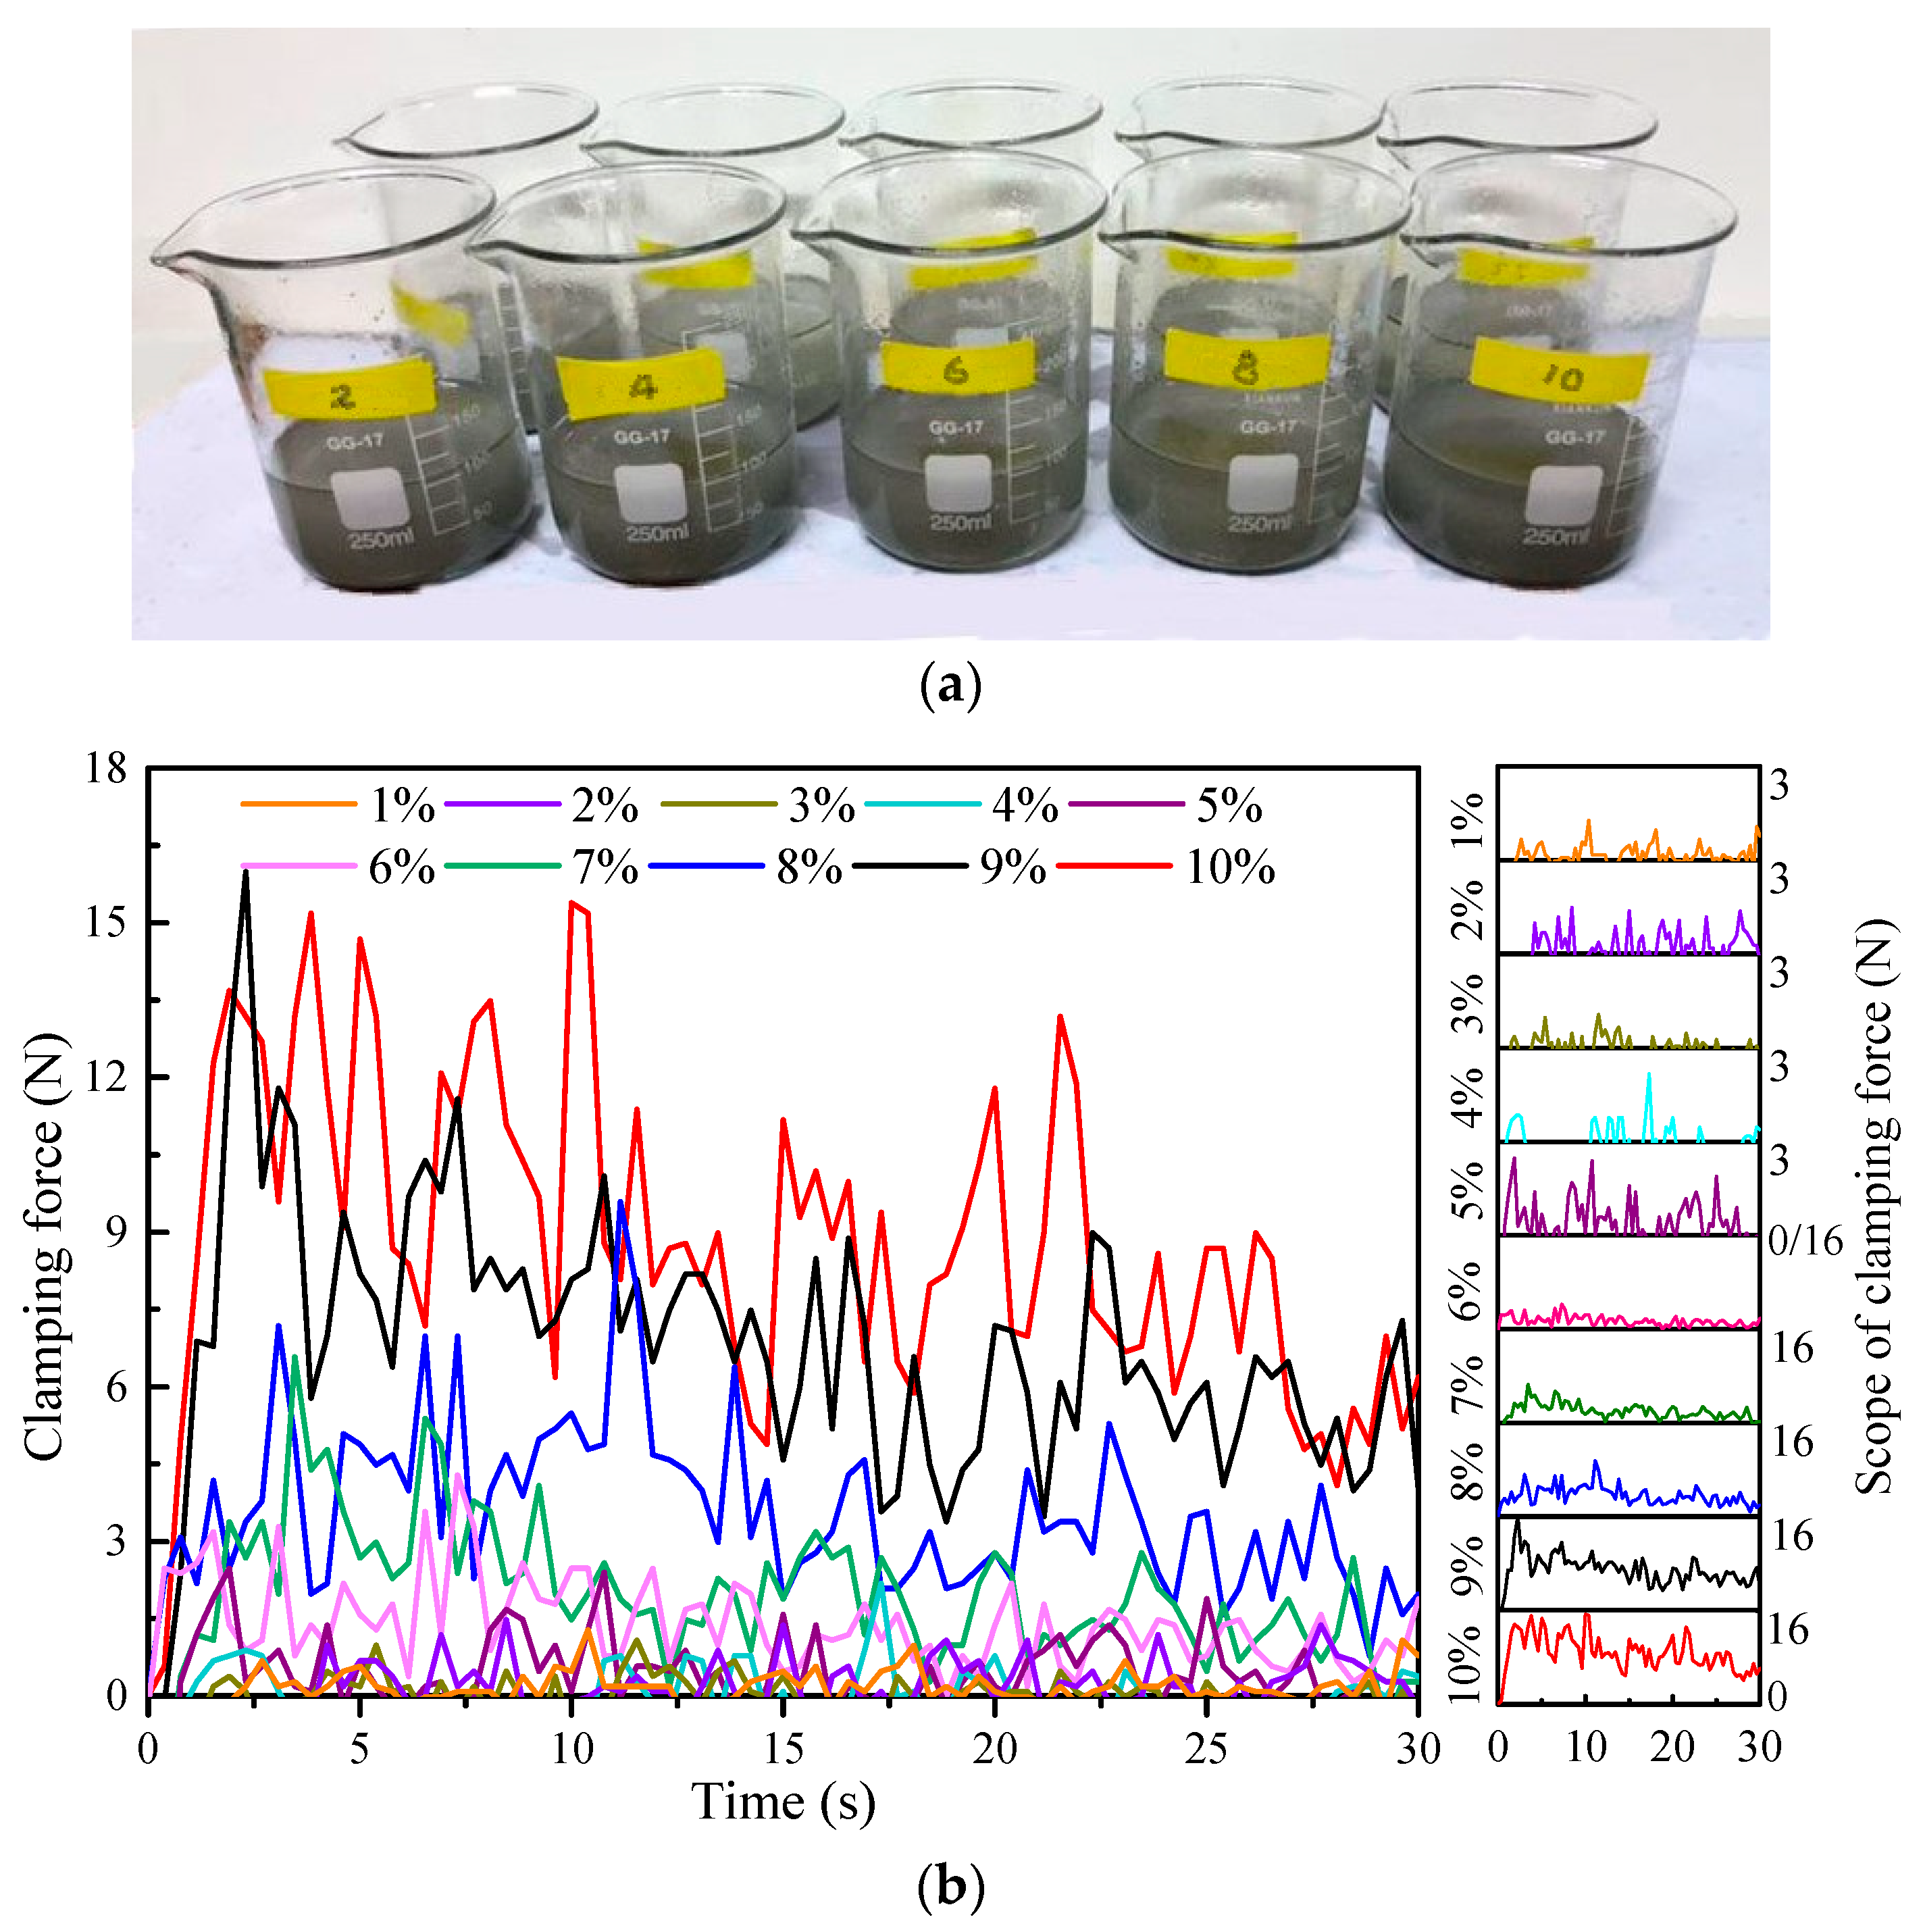
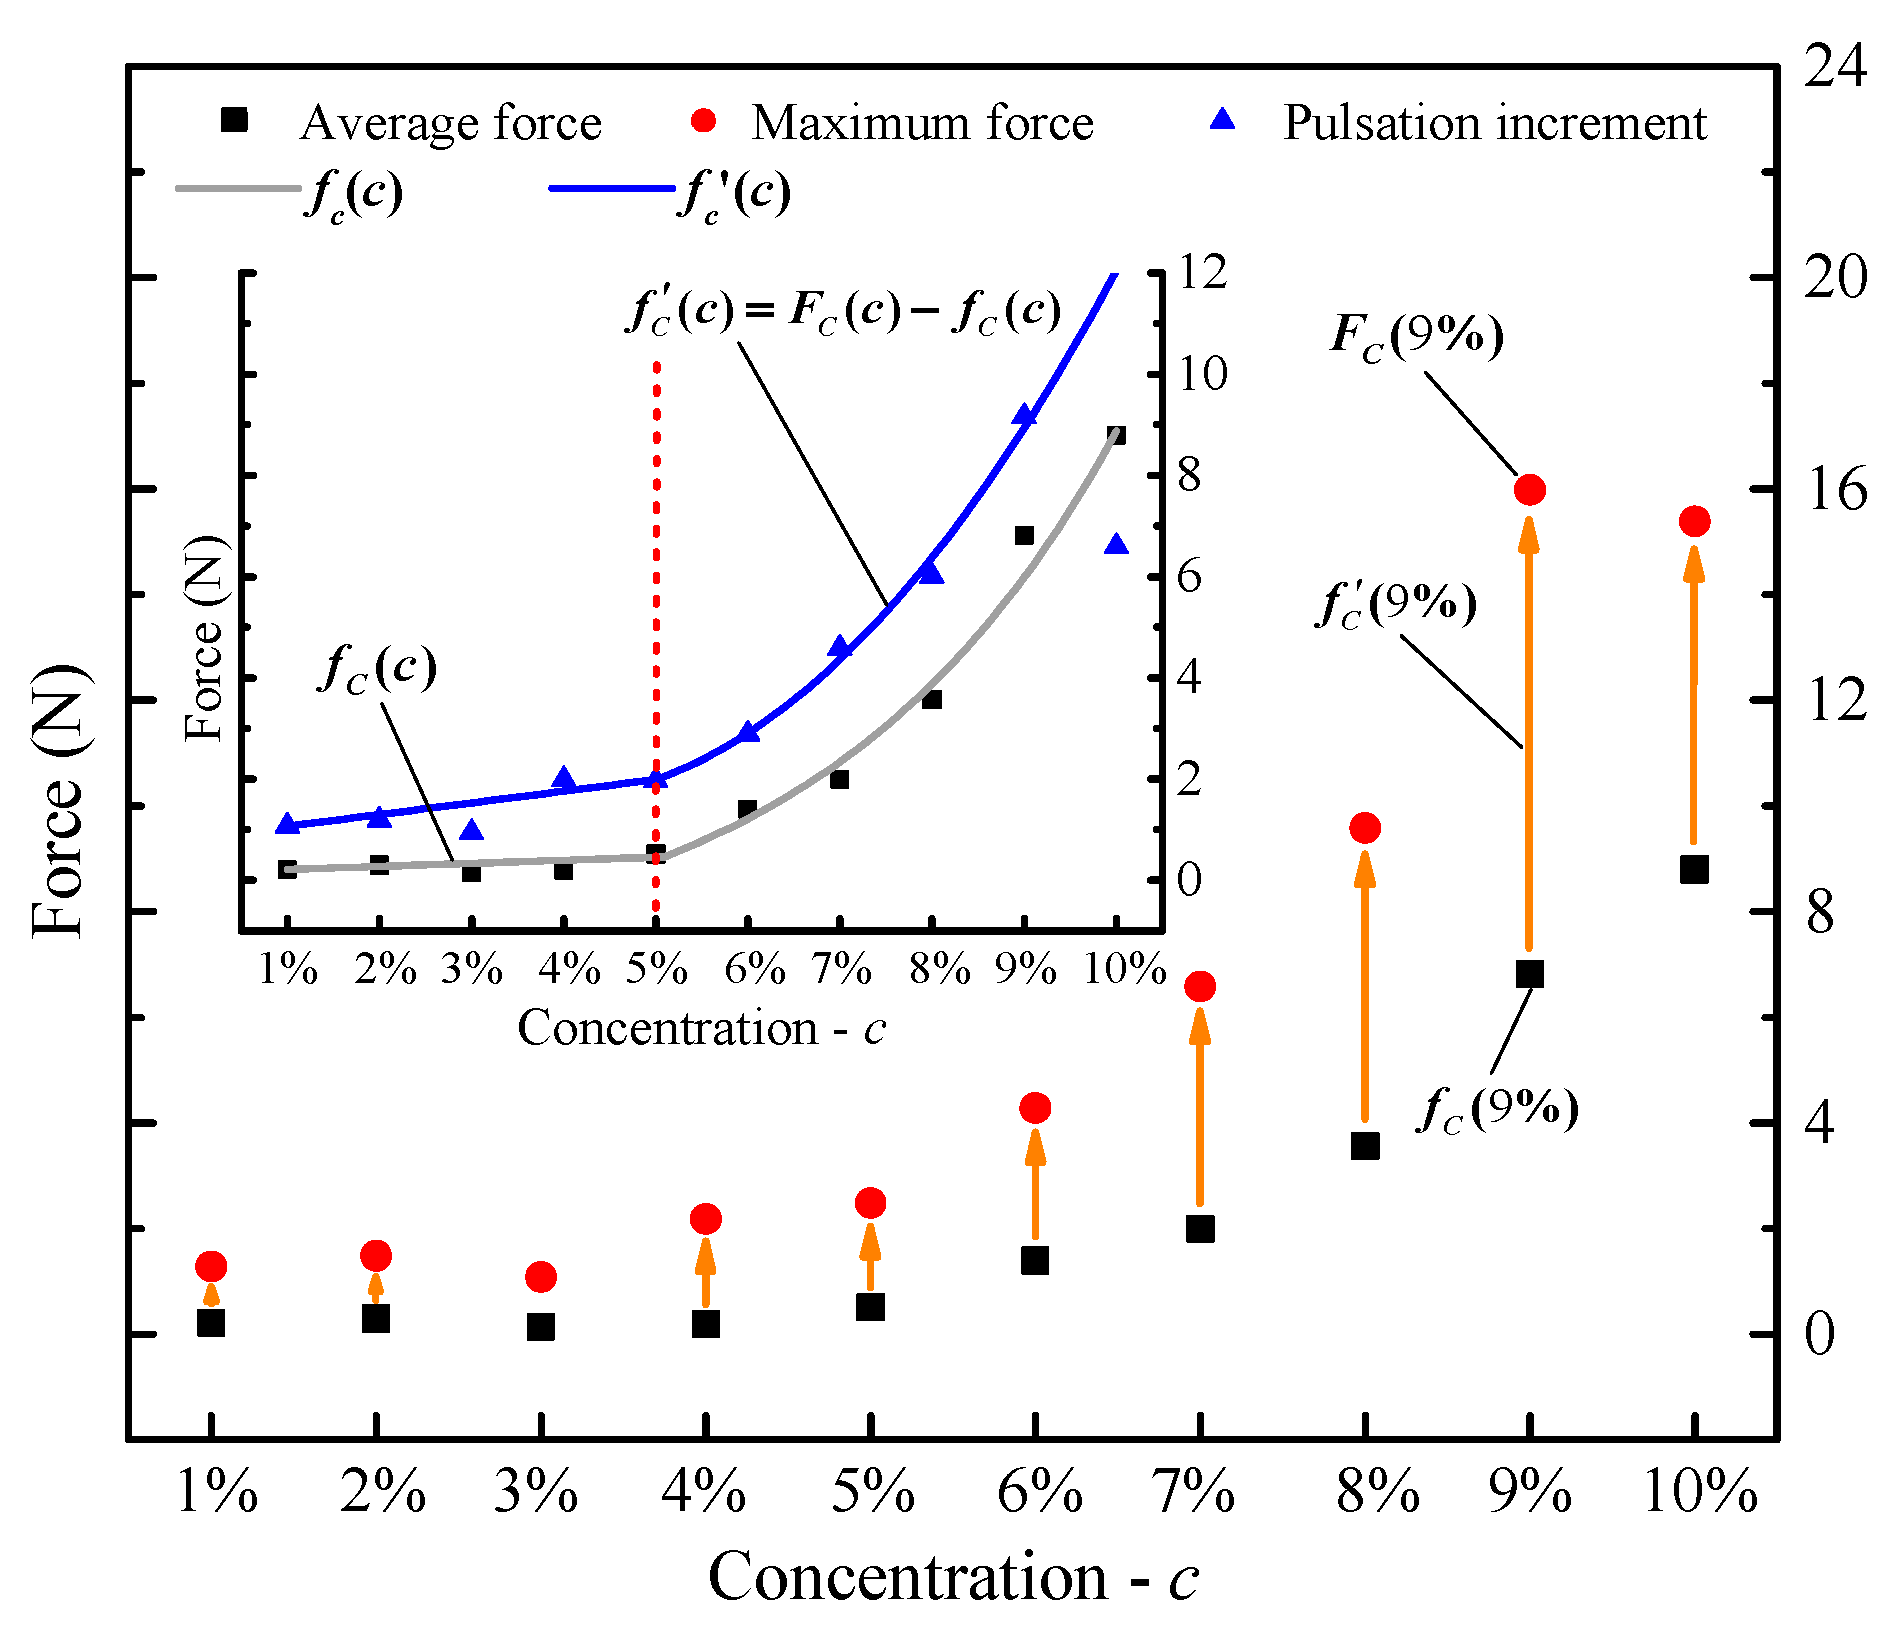
2.2.3. Influences of Particle Concentration on Clamping Force

This section focuses on the influences of particle concentration on the clamping force. Since a good suspension is characteristic in hydraulic oils, aluminum particles neither sink nor float in those oils in a short time, which is favorable for the experiment. According to the previous research (as Figure 7 shows), aluminum particles in size within a ∈ [0.2, 0.7] (unit: mm) were chosen. Based on previous low-resolution predictive experiments, it was found that the sudden increase in friction occurs when the volume concentration is between 1% and 10%. So, the particle volume concentration of 1%, 2%, 3%, 4%, 5%, 6%, 7%, 8%, 9%, and 10% were selected to prepare experimental oils, respectively, as shown in Figure 13a.
Figure 13b shows the spool clamping force curves of aluminum particulate oils at different volume concentrations, measured by a clamping force experimental device. It can be found that the clamping force curves at different concentrations present aperiodic pulsation. The pulsation force is relatively large at the initial moment and then gradually decreases. Such change is particularly evident when the concentration is 9% and 10%, suggesting a relatively large spool clamping force at the starting moment. Moreover, the clamping force F c ( c ) is found to grow gradually as the particle concentration increases, and reaches its peak of 15.98 N when c = 9%.
To further investigate the relationship between concentration and clamping force, the mean and maximal clamping forces at different concentrations were compared. The comparative analysis results are shown in Figure 14. It can be seen from Figure 14 that as the particle volume concentration c% increases from 1% to 10%, both the mean and maximum clamping forces increase, and the pulsation increment of the maximum clamping force rises at an increasing amplitude. Since the clamping pulsation has a certain randomness, the maximum clamping force shows a decrease at the volume concentration of 10%. According to the fitting curve diagram, the mean clamping force is fitted into the curve f c ( c ) , and the clamping pulsation increment F c ( c ) f c ( c ) into the curve f c ( c ) . It can be found that when the particle volume concentration c% < 5%, both the values of the curves f c ( c ) and f c ( c ) are relatively small and increase slowly and linearly with the concentration. When the particle volume concentration c% ≥ 5%, both curves f c ( c ) and f c ( c ) increase rapidly in the manner of a quadratic curve and their increase rates are rather equal. That is because when c% ≥ 5%, the number of particles invading into clearance significantly increases, which will accumulate in clearance. When the valve core slides in the valve hole, the gathered particles extremely easily cause greater friction force. The fitting equations for f c ( c ) and f c ( c ) are shown as (25) and (26).
f c ( c ) = 6.043 c ( c < 5 % ) 2472.7 c 2 202.46 c + 4.4 ( c 5 % )
f c ( c ) = 20.6903 c + 0.8537 ( c < 5 % ) 2747.6 c 2 211 c + 5.67 ( c 5 % )
The appearance of f c ( c ) is a random event with a certain probability. With basic force fc(c) as a reference, then the pulsation increment force f c ( c ) can be expressed as follows:
f c ( c ) ~ 3.42 f c ( c ) + 0.8537 ( c < 5 % ) f c ( c ) + 1.27 ( c 5 % )
The above results suggest that even a small number of sensitive particles can engender a clamping force to a certain but limited degree when the particle concentration is at a low level. Meanwhile, the risk of clamping force increases dramatically when the volume concentration tops a specific level, which is called “sensitive concentration”. Equations (25)–(27) can be taken as empirical equations for the clamping force at different concentrations. The clamping force of a single particle under such conditions can be obtained by introducing the values of the dependent variables f c ( c ) and f c ( c ) into Equation (20).

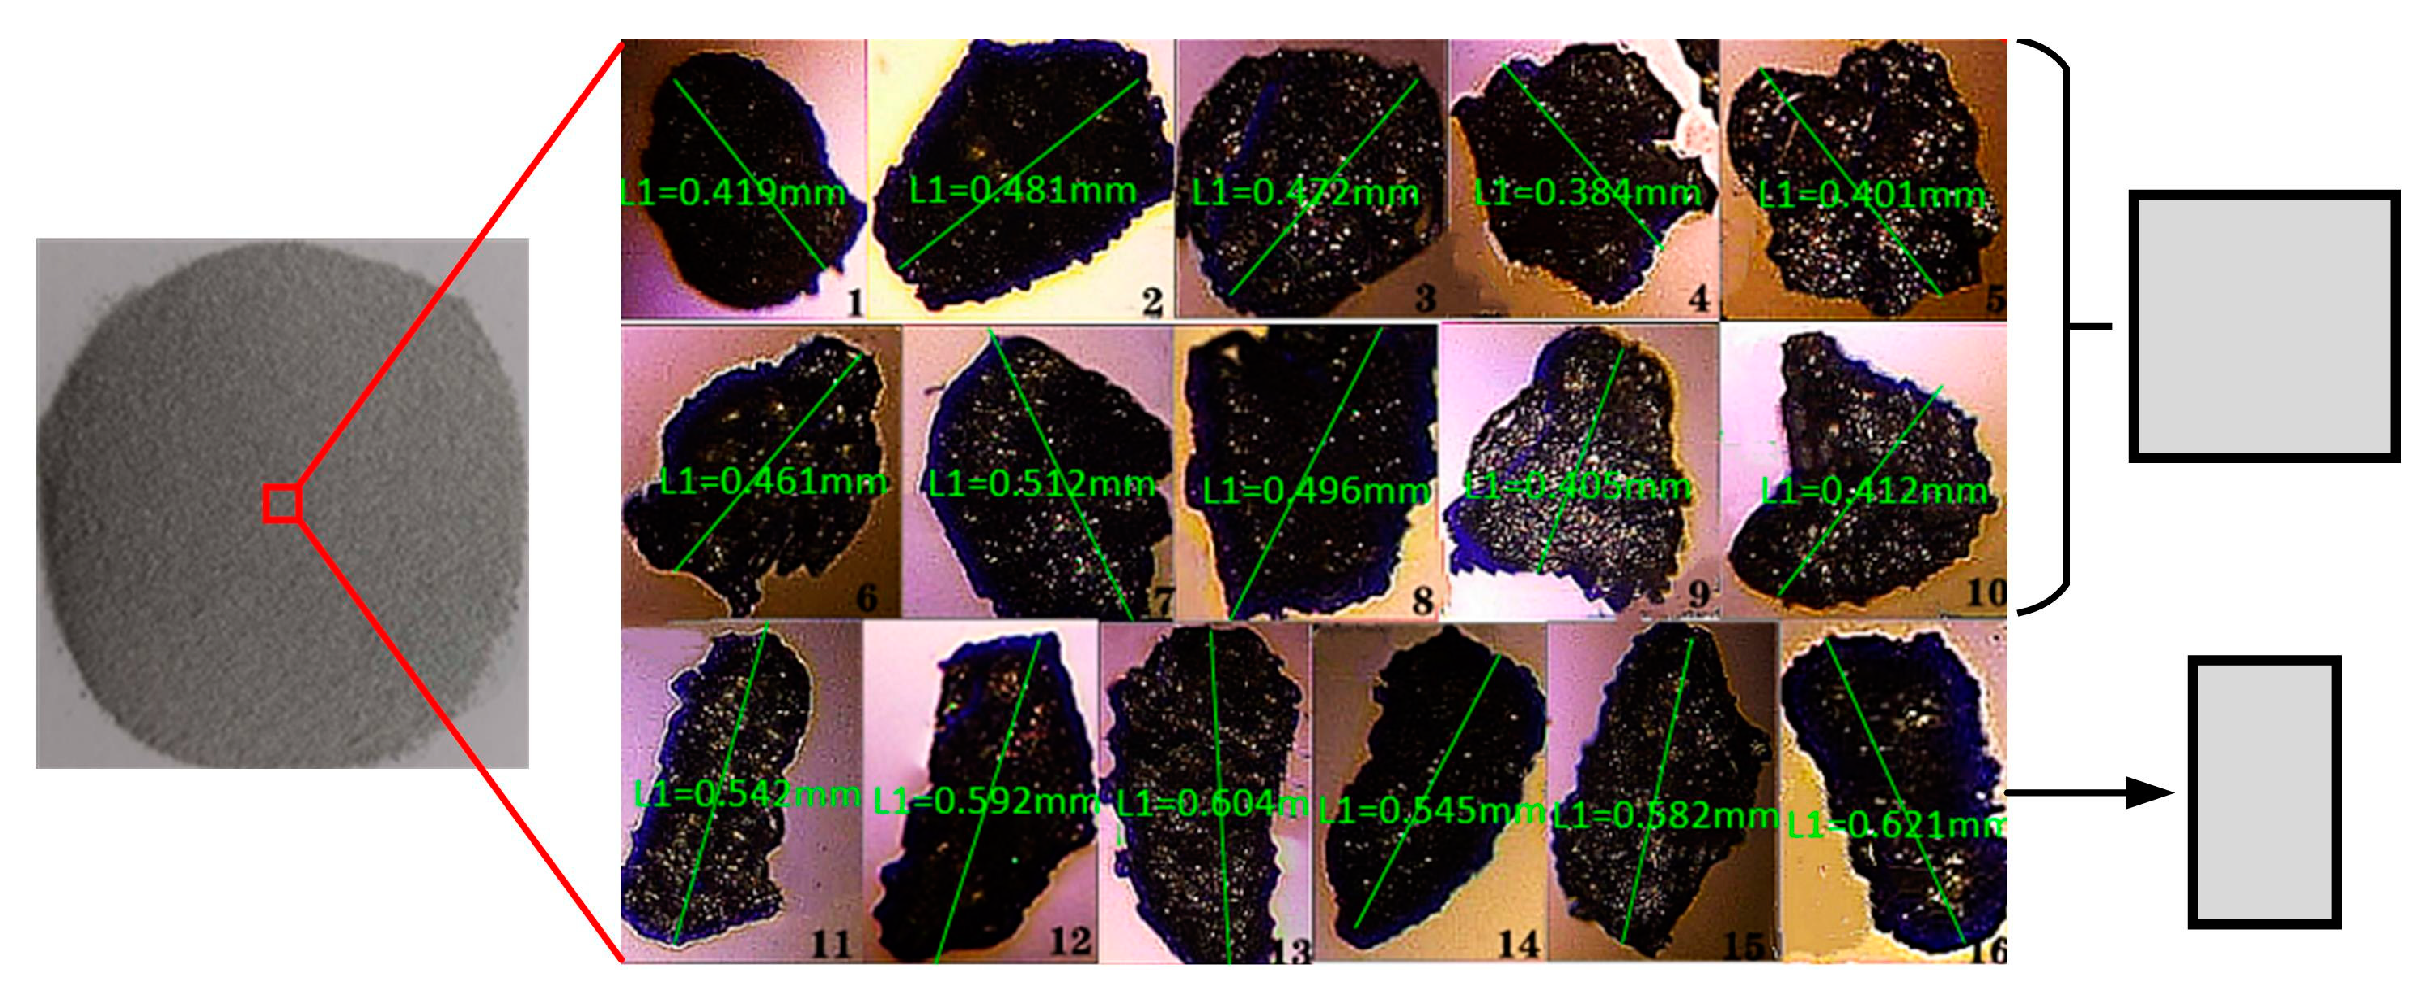
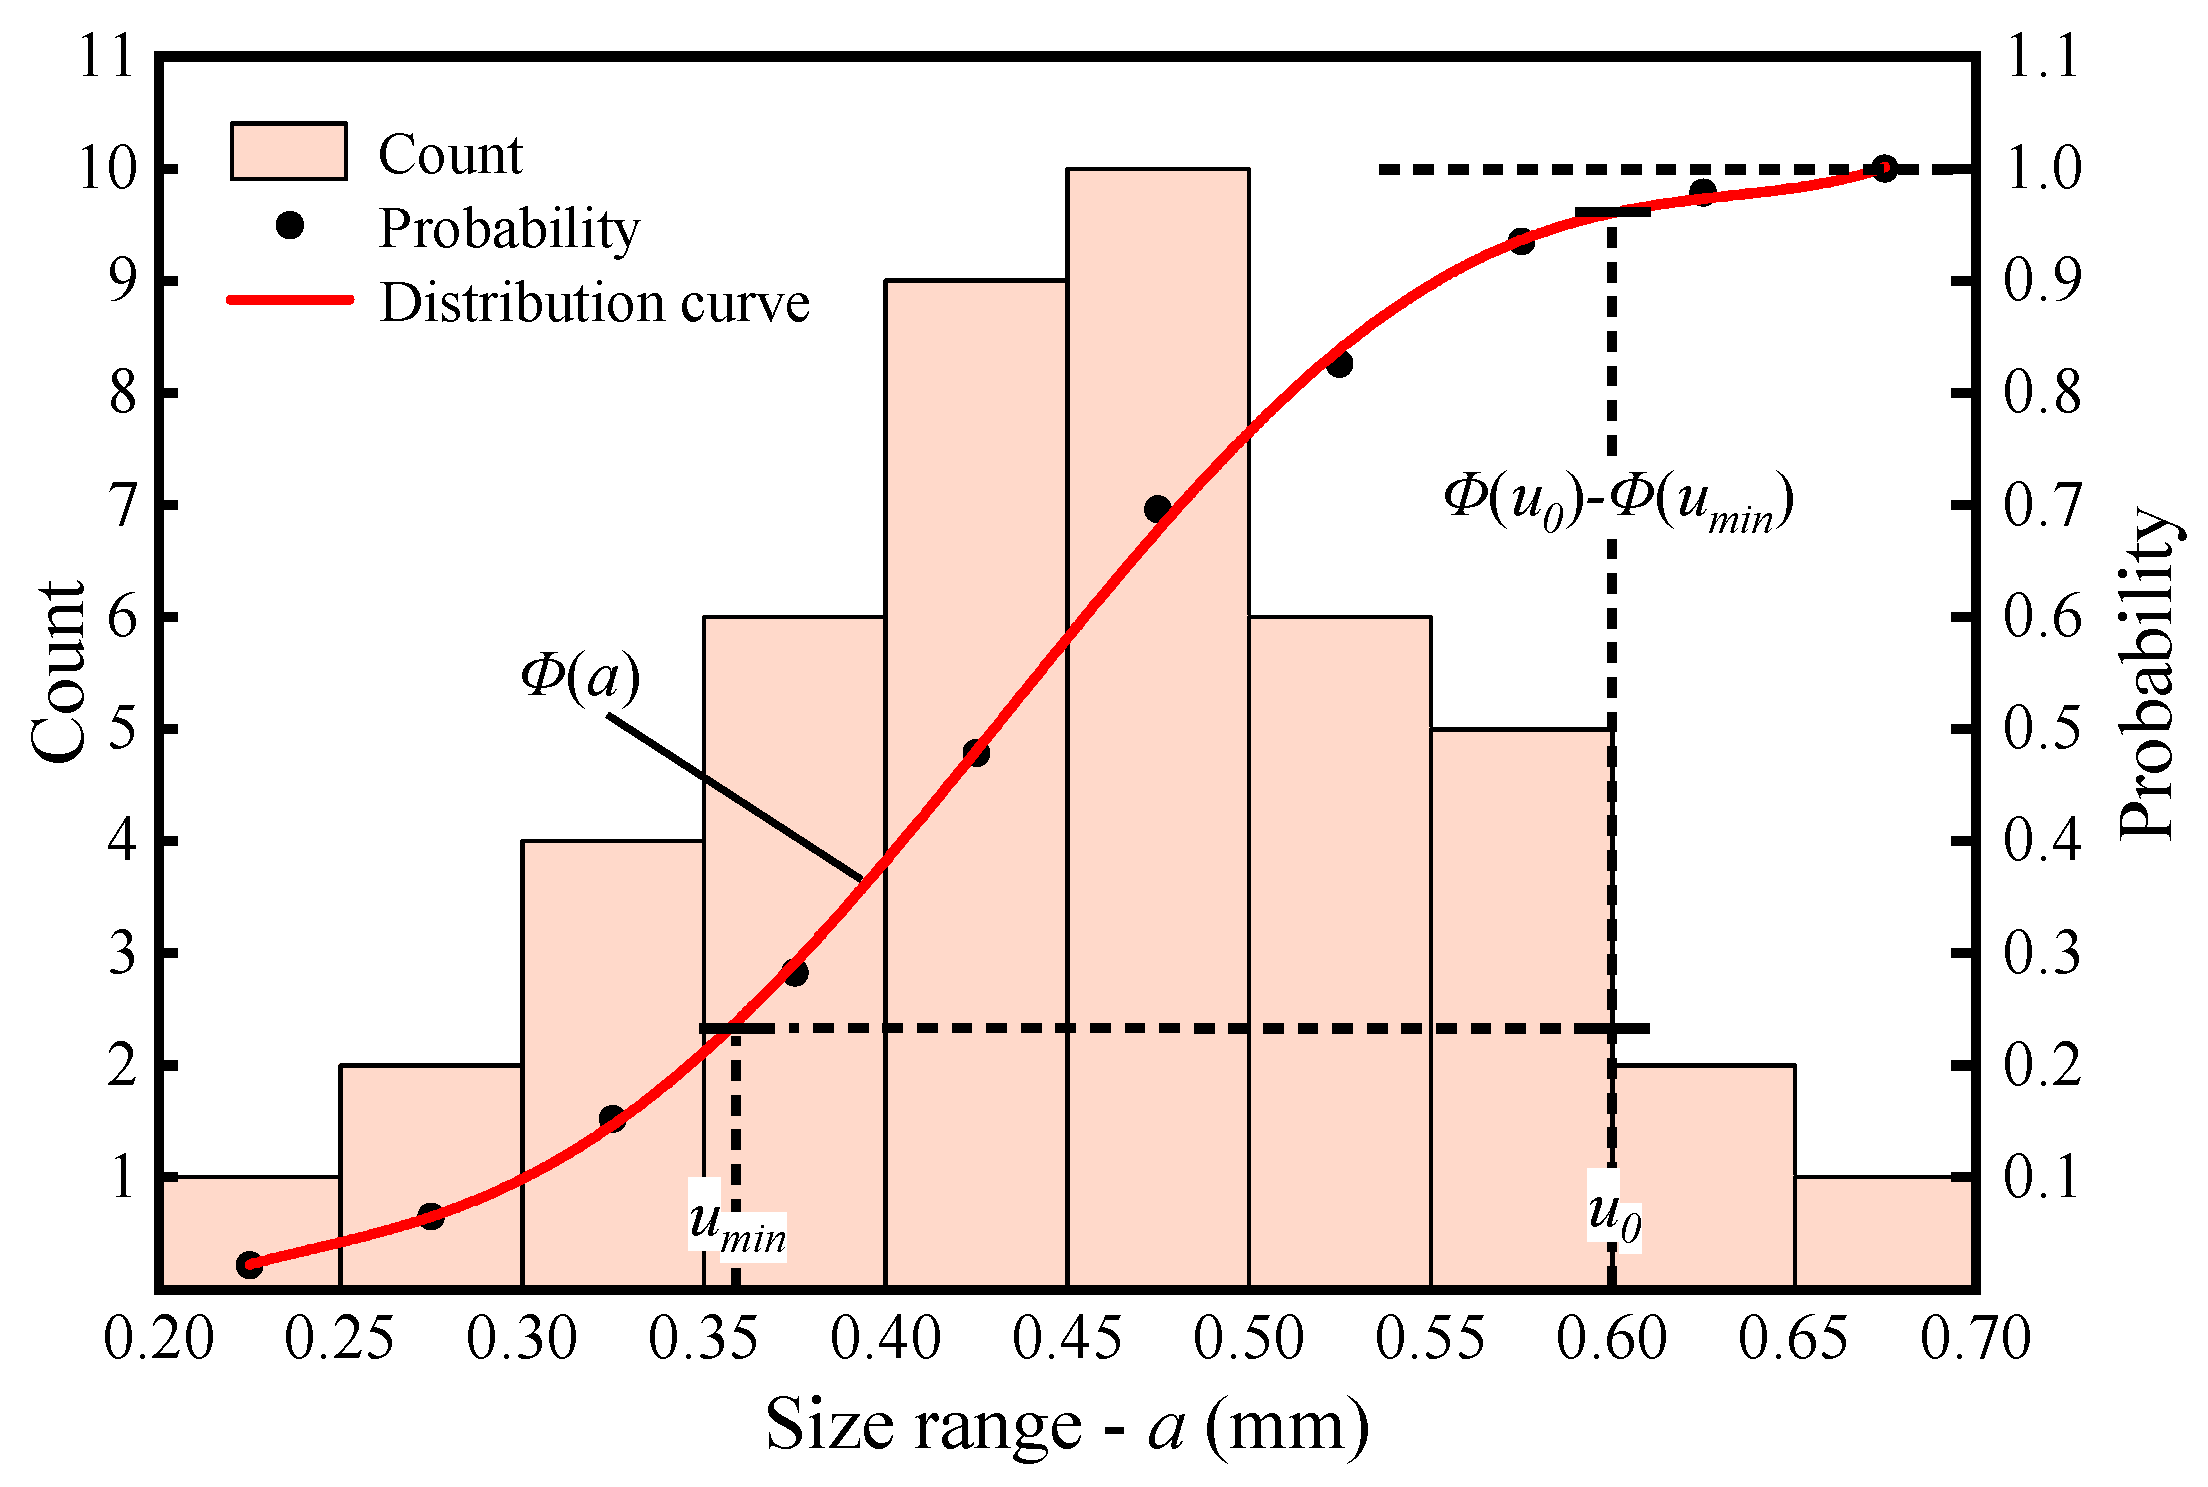
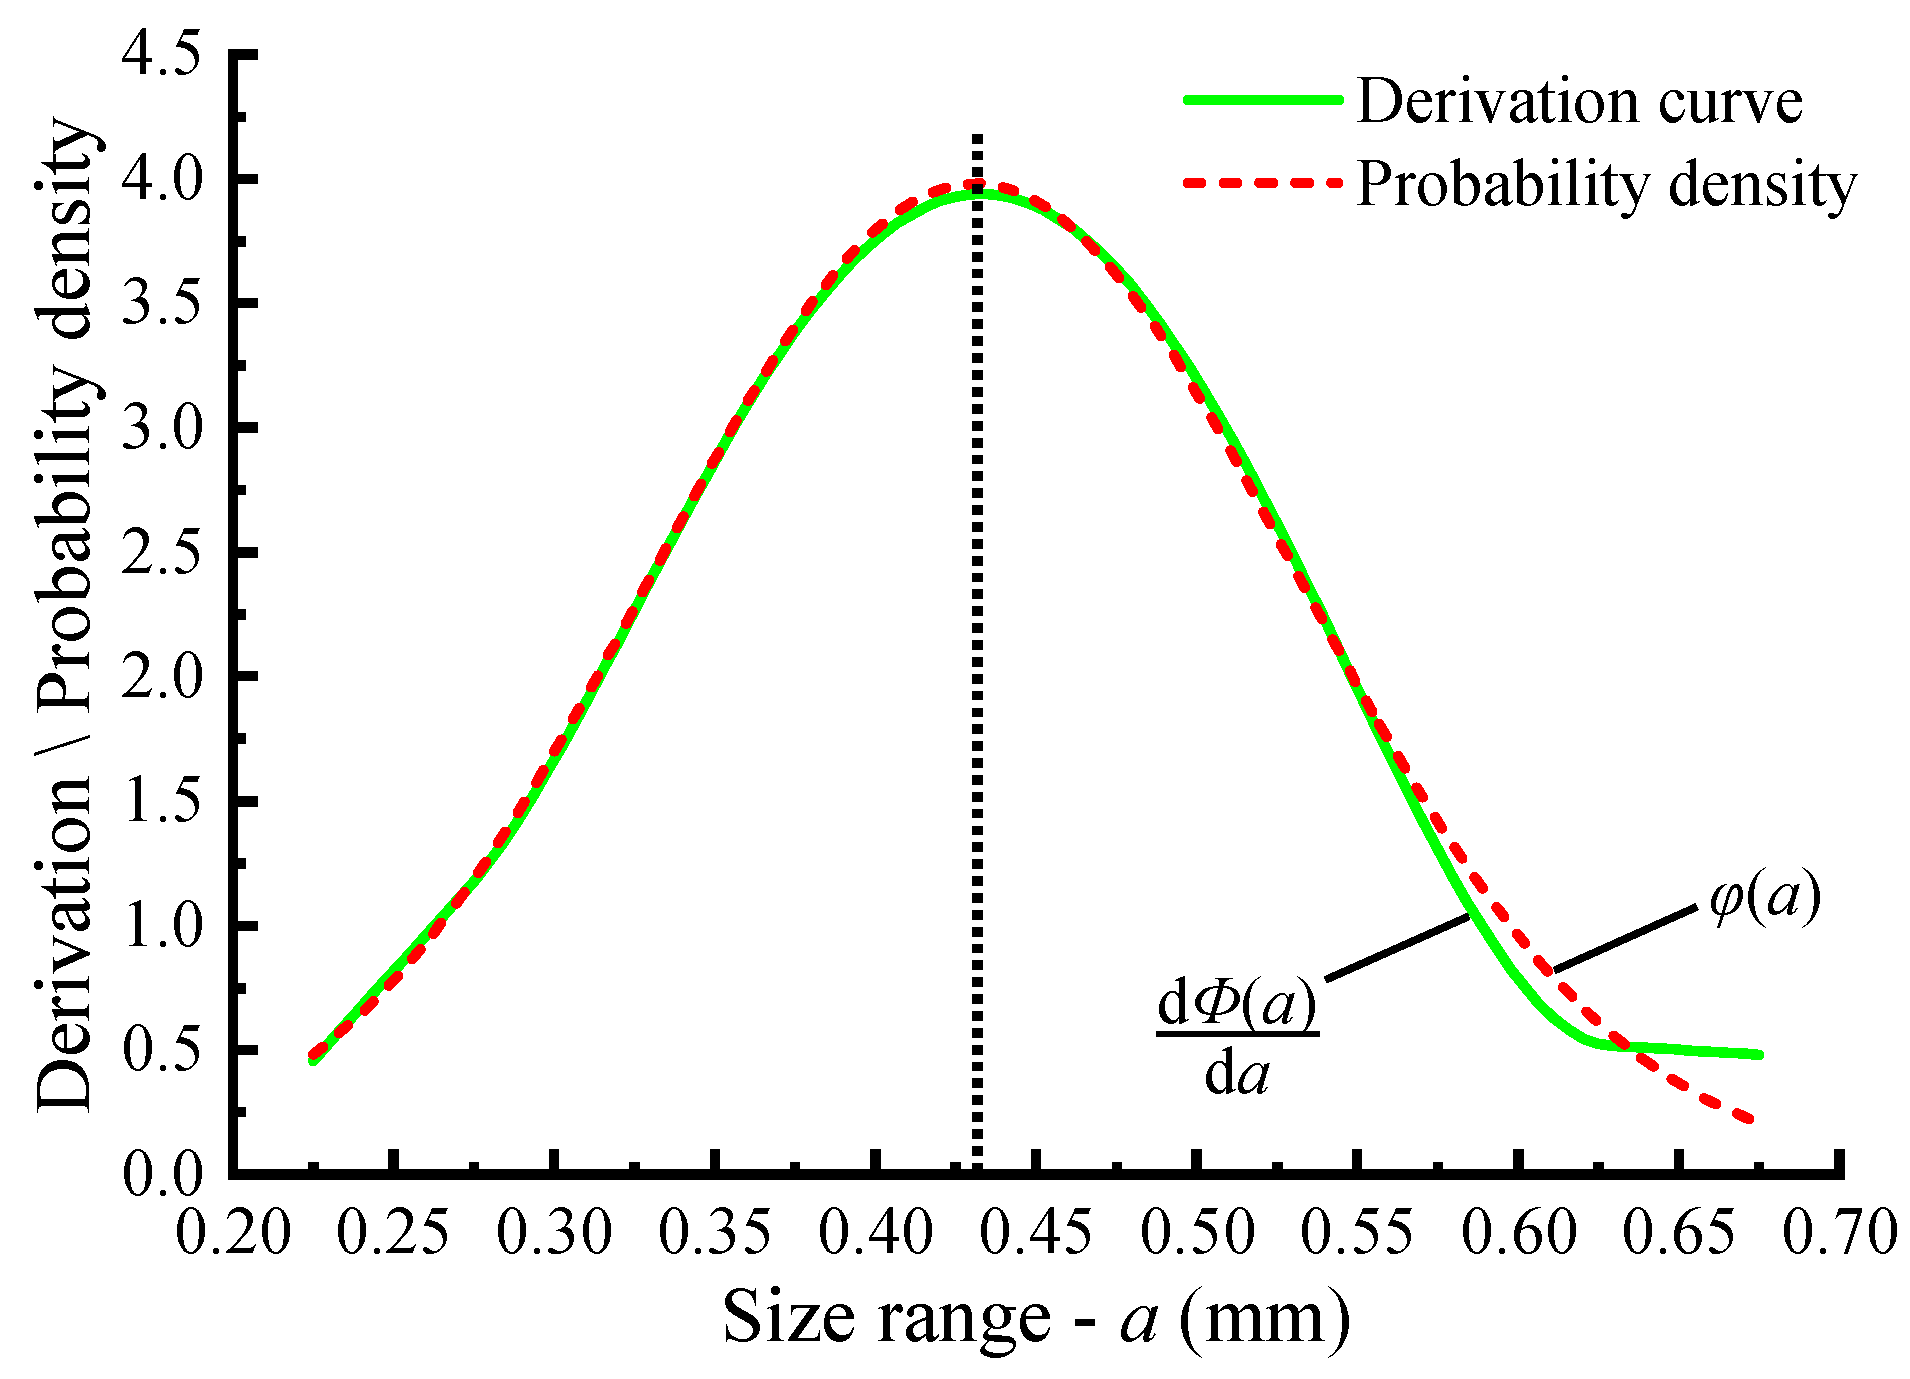
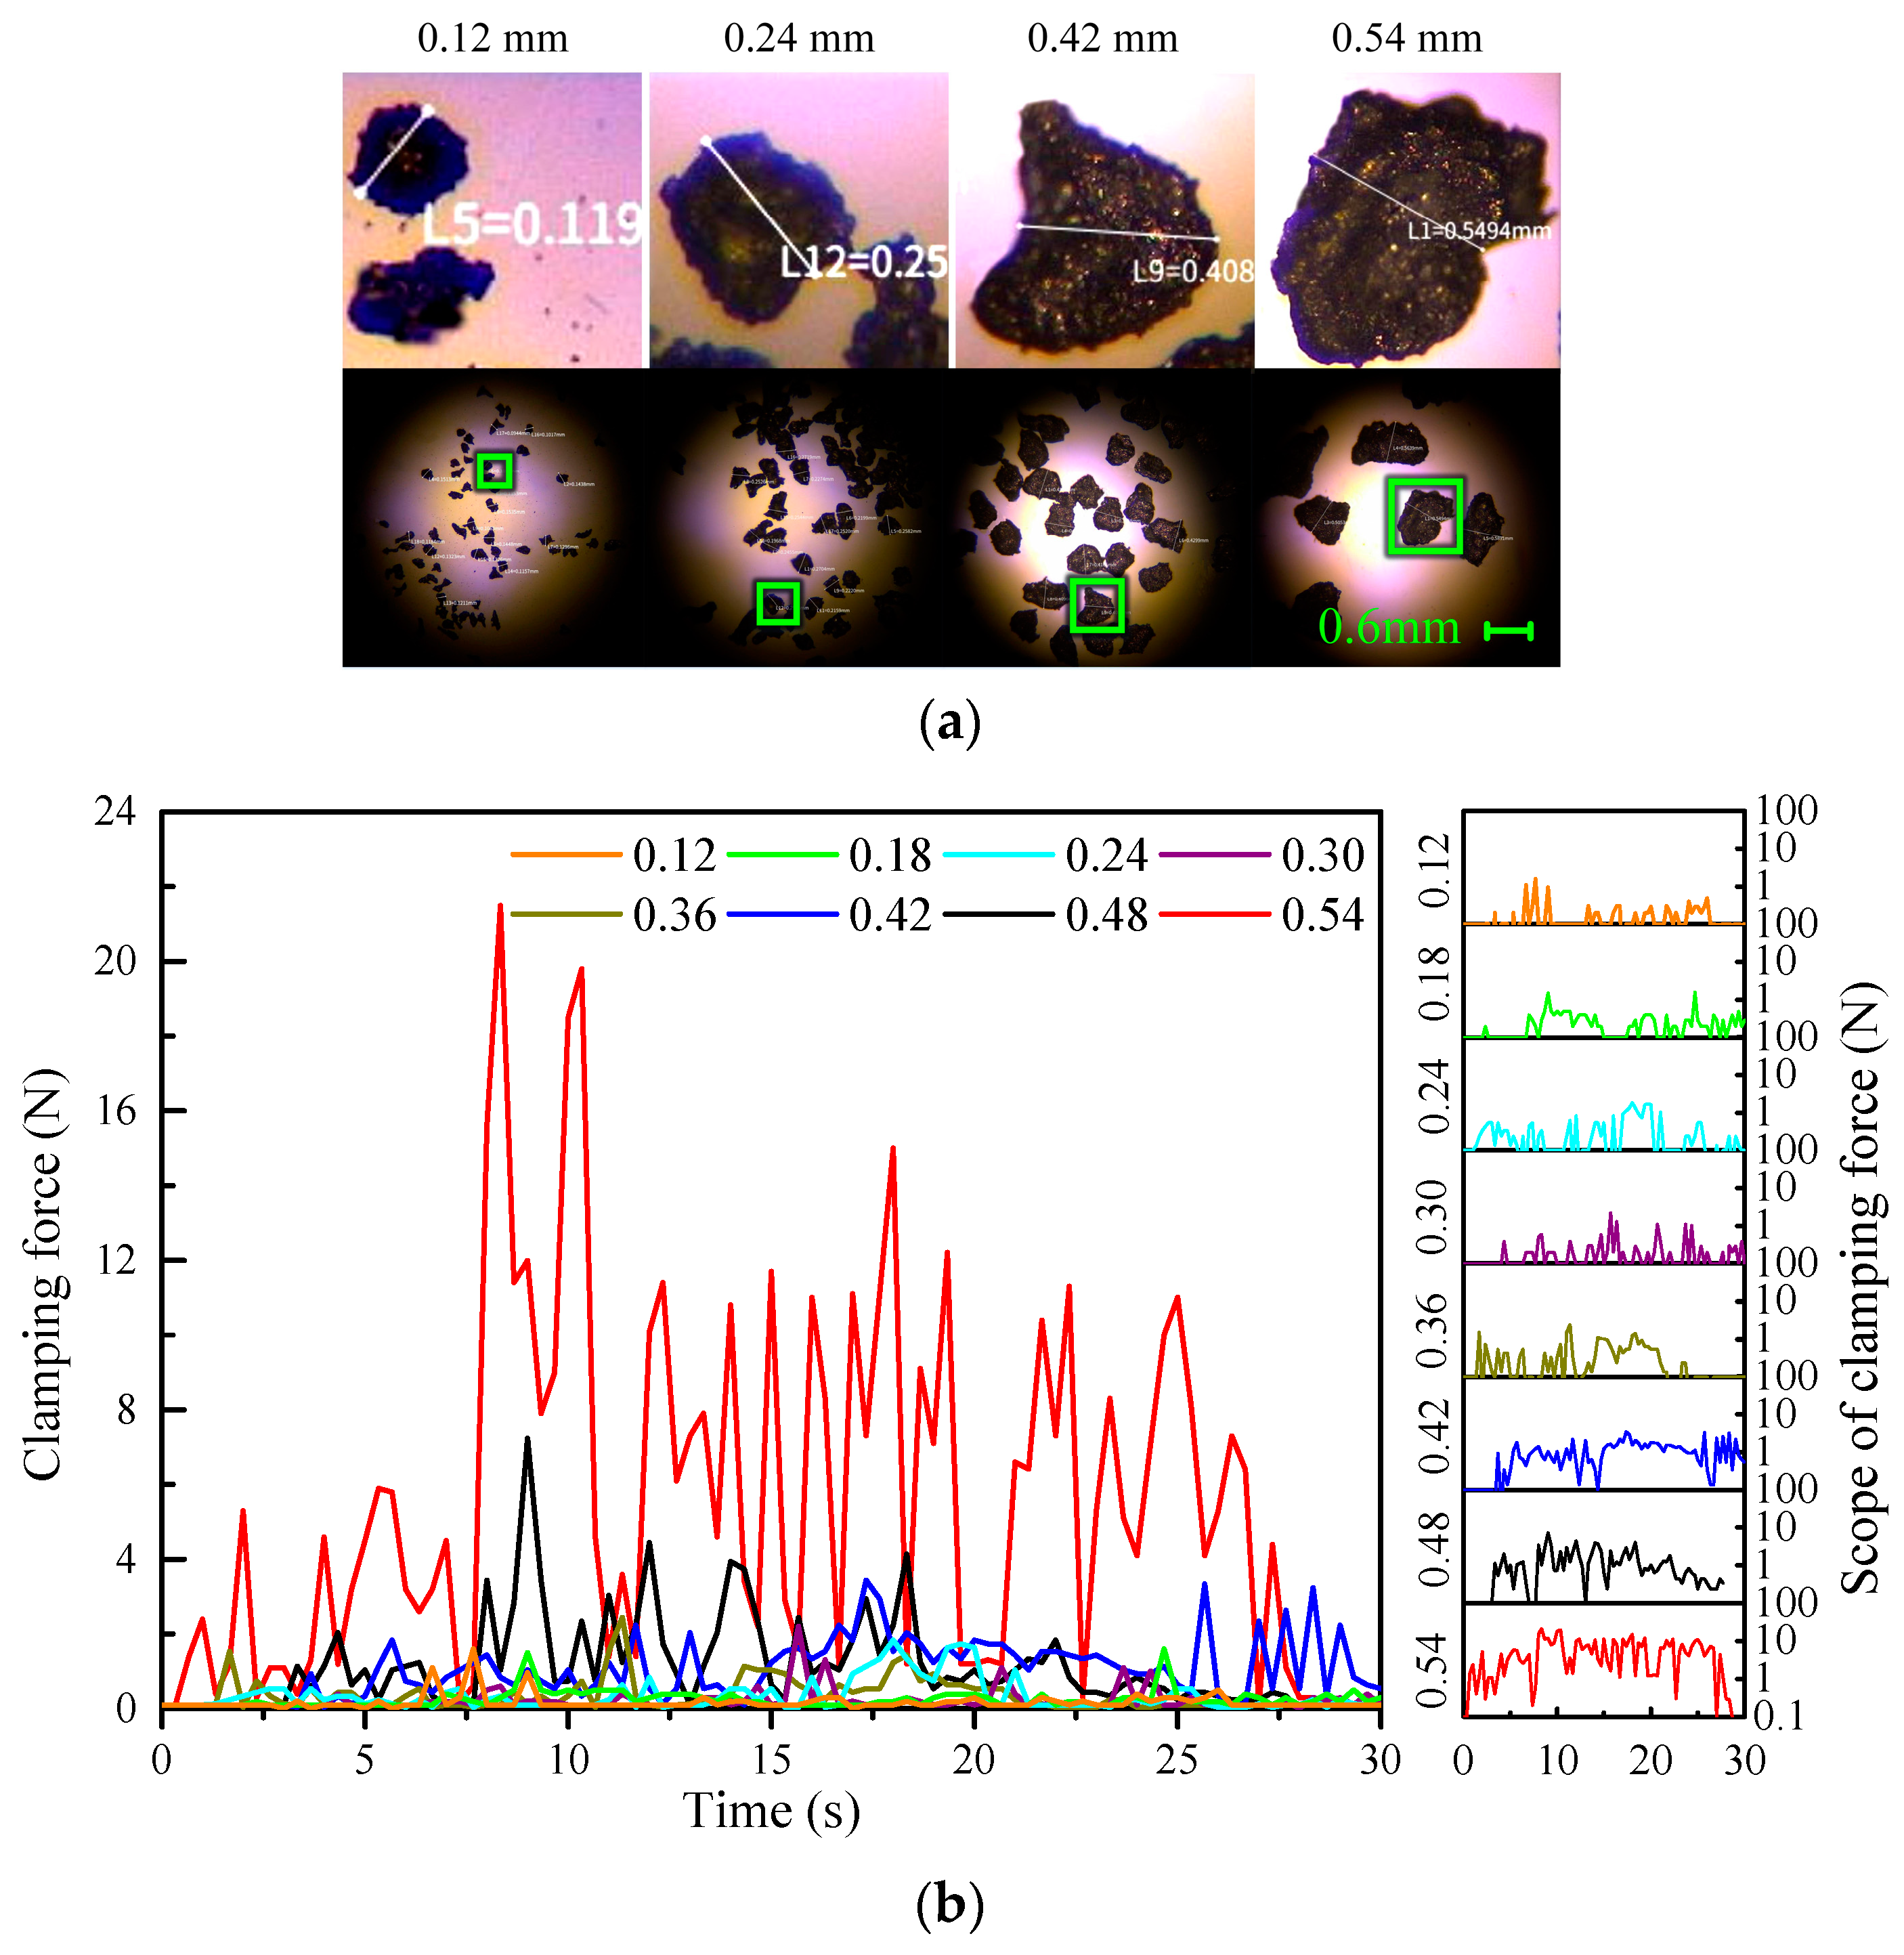
2.2.4. Influences of Particle Size on the Clamping Force

Taking the clearance size of u0 = 0.6 mm as a reference, aluminum particles in feature size a of 0.12 mm, 0.18 mm, 0.24 mm, 0.30 mm, 0.36 mm, 0.42 mm, 0.48 mm, and 0.54 mm were selected, and their corresponding e = a/u0 is 20%, 30%, 40%, 50%, 60%, 70%, 80%, and 90%, respectively, with a particle size error less than 5%. In order to minimize the influence of concentration and to highlight the influence of size change on the clamping force, the particles of different sizes were separately proportioned into hydraulic oil with a volume concentration of c = 1% for the experiment. Figure 15a shows the micrographs of the particles of four different sizes. Figure 15b shows the spool clamping force curve of hydraulic oil containing aluminum particles of different sizes, which was measured by a clamping force experiment device. It can be found that the clamping force curves at different sizes all present aperiodic pulsation. As the particle size enlarges, the clamping force F e ( e ) increases and reaches its peak of 21.5 N when a = 0.54 (e = 0.9).
To further investigate the relationship between particle size and clamping force, the mean and maximum clamping forces at different particle sizes were compared. The comparative analysis result is shown in Figure 16.
According to Figure 16, as the particle size a increases from 0.12 mm (e = 0.2) to 0.54 mm (e = 0.9), both the mean clamping force and the maximum clamping force grow, and so does the pulsation increment of the maximum clamping force. The fitting curve diagram shows that the mean clamping force is fitted into curve f e ( e ) and the pulsation increment force F e ( e ) f e ( e ) into curve f e ( e ) . Both f e ( e ) and f e ( e ) keep a relatively low value within an extensive size range e ∈ [0.2, 0.7]. When e ≥ 0.7, however, f e ( e ) and f e ( e ) increase rapidly in the manner of a quadratic curve, with f e ( e ) increasing obviously faster than f e ( e ) . The fitting equations of f e ( e ) and f e ( e ) are shown as Equations (28) and (29).
f e ( e ) = 1.155 e ( e < 0.7 ) 172.143 e 2 250 e + 91.17 ( e 0.7 )
f e ( e ) = 2.51 e + 0.93 ( e < 0.7 ) 318 e 2 445 e + 158.37 ( e 0.7 )
The appearance of f e ( e ) is a random event with a certain probability. With the datum force fe(e) as a reference, then the pulsation increment force f e ( e ) can be expressed as:
f e ( e ) = 2.173 f e ( e ) + 0.93 ( e < 0.7 ) 1.3567 f e ( e ) + 0.425 2 + 2.12 ( e 0.7 )
The measurement results show that when the ratio of particle size to clearance size is less than 0.7, the risk of spool clamping is relatively low; when the ratio of particle size to clearance size is greater than 0.7, the spool clamping force rises rapidly as the particle size approaches the clearance size. The results further confirm that the particles in the size of 0.7–1 clearance (e ∈ [0.7, 1]) are sensitive. That is because when the ratio reaches 0.7, the size of the particle is close to the clearance size, which will cause contact among the valve core surface, particle, and valve hole surface, named “three-body contact”. This situation will increase friction force sharply. Equations (28)–(30) can be taken as the empirical equations of spool clamping force with varying particle sizes. The clamping force of a single particle can be obtained by introducing the values of dependent variables f e ( e ) and f e ( e ) into Equation (20).
For the spool valves with ideal clearance of u0, when the size of solid particles ranges within [ui, uj] (ui < u0, uj > u0), the number of “sensitive particles” can be presented as Φ ( u 0 ) Φ ( u min ) Φ ( u 0 ) Φ ( 0.7 u 0 ) , where u min 0.7 u 0 . This result can be introduced into Equation (12) to evaluate the spool posture in the valve hole. In terms of the use of the empirical equation, the datum clamping force f ( E k , c , e ) of valves with good robustness like reversing valves can be taken as an indicator to measure the risk of clamping. In contrast, sensitive valves, such as servo valves and variable pump control valves, take the maximum clamping force F ( E k , c , e ) that the pulsation increment force f ( E k , c , e ) generates as a key evaluation standard of spool clamping.

3. Conclusions

Previous studies on particle motion characteristics and causes of spool valve hysteresis provide scientific references and theoretical guidance for this paper. In this study, we established a systematical mechanical model of spool clamping force under the action of particles, and measured the pulsating curve of spool clamping under the action of particles in different materials, sizes, and volume concentrations. By fitting the test data, we worked out the empirical equation of datum clamping force and run out so as to provide a theoretical basis and experimental reference to similar studies. The mathematical model and empirical equations generated in this study can be used to estimate the sudden failure caused by the sudden increase in friction in spool valves under the action of particles, which has positive significance for the study of the predictive maintenance of hydraulic equipment. In this study, we come to several conclusions as below:
  • The clamping force of spool triggered by solid particles can be considered as a stacking effect of each tiny particle, which is mainly correlated with the material, size, and concentration of particles. However, because of the rotation of particles and varying posture of the spool, the clamping force presents a pattern of aperiodic pulsation; the cause of spool pulsation is the rotation of the particles and changes in the spool postures.
  • After the incursion of particles into the valve clearance, the second action of spools will lead to spool clamping as the spool posture has changed. The imperfect posture of a spool in a valve hole is mainly off-centered, tilt, or off-centered + tilt. The different postures bring about clamping risk zones in the valve clearance.
  • The kinds of particles have a certain but limited effect on the spool clamping force. In general, particles with a larger elastic modulus give rise to a stronger spool clamping force, and also give rise to pulsation frequency. This accords with the physical model that we employed in this study.
  • A larger volume fraction of particles in hydraulic oil implies an increasing number of sensitive particles and a stronger spool clamping force thus engendered. Spools bear a considerably increased risk of clamping when the particle volume concentration is higher than the “sensitive concentration” of 5%, and the clamping force increases rapidly in the manner of a quadratic curve with concentration. When the concentration is 9%, the maximum clamping force can reach 21.5 N, which will lead to a higher risk of spool clamping.
  • Within a certain size range, the probability density distribution of particle size conforms to the normal distribution function. The “sensitive particles” are proven to take up 0.7–1 of the valve clearances. When the ratio of particle size to clearance size is larger than 0.7, the clamping force increases rapidly in the manner of a quadratic curve. When the ratio is 0.9, the maximum clamping force can reach 15.98 N, which may lead to a higher risk of spool clamping.

4. Discussion

Test results show that the friction under the action of particles has pulsating characteristics, it can be speculated that the spool in the movement process there must be particles of rotation and spool posture changes; of course, the microscopic roughness of the clearance wall is also a factor that cannot be ignored. Let us analyze the whole process of particles from the invasion of the clearances to producing pulsating friction: the spool is in the original position, the clearance is large, the particles invade, the spool moves in the axial direction, the spool axial friction is small, the spool posture changes, microscopically a side of the clearances size decreases, the reduced clearances will have particles stuck in the rough wall (the “three-body contact”), as shown in Figure 3. The mechanism of clamping of a single square particle.), the spool continues to move, the spool and the wall of the valve body produce relative motion, driving the particles to rotate, and the spool axial friction increases abruptly. This process occurs repeatedly, resulting in a non-periodic pulsation characteristic of the friction force.
In practical work, the material of particles relates to the material of spool valves and the working conditions. The diameter and concentration of particles mainly depend upon the degree of the contamination of the filter and the hydraulic system, while the spool posture upon its processing, assembly process, and service. There are some methods to be chosen to avoid spool clamping triggered by solid particles, such as thorough cleaning in processing and dust-free operation in assembling, and the effective isolation between the hydraulic system and polluted environment in the working process. Furthermore, it is necessary to choose wear-resistant materials to make hydraulic valves, and further research on new valve structures with the function of adsorbing, dredging, and filtering particles will be very valuable. There are some shortcomings in this study, such as the following: in the experimental study, the addition of oil-containing particles can only be carried out by dropping them into the clearance inlet through the test tubes, which cannot be performed automatically, and, therefore, a certain degree of manual error will occur, and in the future, we can increase the automatic particle mixing and adding device to reduce the manual error. In mathematical modeling, due to the limited space of the test sample, the accuracy of the empirical formulas of the base amount of spool valve friction and jumping amount obtained is limited, and it is necessary to improve its accuracy through more test data.

Author Contributions

Conceptualization, H.J.; methodology, Q.C.; validation, M.L.; formal analysis, W.C.; investigation, Q.C.; resources, C.L.; data curation, M.L.; writing—original draft preparation, Q.C.; writing—review and editing, M.L.; visualization, W.C.; supervision, H.J.; project administration, H.J.; funding acquisition, W.C. and C.L. All authors have read and agreed to the published version of the manuscript.

Funding

This study was funded by “The National Natural Science Foundation of China”, with grant number 51575254. Moreover, it also funded by the “Major Training Program of University Research and Innovation Platform of Gansu Provincial Department of Education”, with grant number No. 2024CXPT-09. This study also received support from the project of Guizhou Honglin Aero Engine Control Technology Co., Ltd.—Research on Anti pollution Design Technology for *** System, with grant number “Design [2022]-8”.

Institutional Review Board Statement

Not applicable.

Informed Consent Statement

Not applicable.

Data Availability Statement

The original contributions presented in the study are included in the article, further inquiries can be directed to the corresponding author.

Conflicts of Interest

Authors Wenwei Chai and Changmin Luo were employed by the company Guizhou Honglin Aero Engine Control Technology Co., Ltd. The remaining authors declare that the research was conducted in the absence of any commercial or financial relationships that could be construed as a potential conflict of interest. The funder had no role in the design of the study; in the collection, analysis, or interpretation of data, in the writing of the manuscript, or in the decision to publish the results.

References

  1. Rodríguez-Pérez, A.M.; Rodríguez-González, C.A.; López, R.; Hernández-Torres, J.A.; Caparrós-Mancera, J.J. Water Microturbines for Sustainable Applications: Optimization Analysis and Experimental Validation. Water Resour Manag. 2024, 38, 1011–1025. [Google Scholar] [CrossRef]
  2. Novak, N.; Trajkovski, A.; Kalin, M.; Majdič, F. Degradation of hydraulic system due to wear particles or medium test dust. Appl. Sci. 2023, 13, 7777. [Google Scholar] [CrossRef]
  3. Liu, X.; Ji, H.; Min, W.; Zheng, Z.; Wang, J. Erosion behavior and influence of solid particles in hydraulic spool valve without notches. Eng. Fail. Anal. 2020, 108, 104262. [Google Scholar] [CrossRef]
  4. Frith, R.H.; Scott, W. Control of solids contamination in hydraulic systems—An overview. Wear 1993, 165, 69–74. [Google Scholar] [CrossRef]
  5. Singh, M.; Lathkar, G.S.; Basu, S.K. Failure Prevention of Hydraulic System Based on Oil Contamination. J. Inst. Eng. 2012, 93, 269–274. [Google Scholar] [CrossRef]
  6. Uy, D.; Simko, S.J.; Carter, R.O., III; Jensen, R.K.; Gangopadhyay, A.K. Characterization of anti-wear films formed from fresh and aged engine oils. Wear 2007, 263, 1165–1174. [Google Scholar] [CrossRef]
  7. Edmonds, J.; Resner, M.S.; Shkarlet, K. Detection of precursor wear debris in lubrication systems. In Proceedings of the 2000 IEEE Aerospace Conference. Proceedings (Cat. No.00TH8484), Big Sky, MT, USA, 25 March 2000. [Google Scholar] [CrossRef]
  8. Mitchell, W.H.; Spagnolie, S.E. A generalized traction integral equation for Stokes flow, with applications to near-wall particle mobility and viscous erosion. J. Comput. Phys. 2016, 333, 462–482. [Google Scholar] [CrossRef]
  9. Tavassoli, H.; Kriebitzsch, S.H.L.; van der Hoef, M.A.; Peters, E.A.J.F.; Kuipers, J.A.M. Direct numerical simulation of particulate flow with heat transfer. Int. J. Multiph. Flow 2013, 57, 29–37. [Google Scholar] [CrossRef]
  10. Deen, N.G.; Kriebitzsch, S.H.; van der Hoef, M.A.; Kuipers, J.A.M. Direct numerical simulation of flow and heat transfer in dense fluid–particle systems. Chem. Eng. Sci. 2012, 81, 329–344. [Google Scholar] [CrossRef]
  11. Zhou, Z.; Jin, G.; Tian, B.; Jian, R. Hydrodynamic force and torque models for a particle moving near a wall at finite particle Reynolds numbers. Int. J. Multiph. Flow 2017, 92, 1–19. [Google Scholar] [CrossRef]
  12. Daghooghi, M.; Borazjani, I. The effects of irregular shape on the particle stress of dilute suspensions. J. Fluid Mech. 2018, 839, 663–692. [Google Scholar] [CrossRef]
  13. Choi, C.R.; Kim, C.N. Fluid-particle interaction simulations of the interception of red blood cells in shear flow. J. Mech. Sci. Technol. 2010, 24, 1451–1463. [Google Scholar] [CrossRef]
  14. Terrell, E.J.; Higgs Iii, C.F. A Modeling Approach for Predicting the Abrasive Particle Motion during Chemical Mechanical Polishing. J. Tribol. 2007, 129, 933–941. [Google Scholar] [CrossRef]
  15. Kharoua, N.; Alshehhi, M.; Khezzar, L. Effects of fluid flow split on black powder distribution in pipe junctions. Adv. Powder Technol. 2016, 27, 42–52. [Google Scholar] [CrossRef]
  16. Sung, I.-H.; Han, H.-G.; Kong, H. Nanomechanical characteristics at an ultra-small particle-surface contact interface. J. Mech. Sci. Technol. 2010, 24, 107–110. [Google Scholar] [CrossRef]
  17. Sajjadi, H.; Salmanzadeh, M.; Ahmadi, G.; Jafari, S. Lattice Boltzmann method and RANS approach for simulation of turbulent flows and particle transport and deposition. Particuology 2017, 30, 62–72. [Google Scholar] [CrossRef]
  18. Bian, L.-C.; Guo, J.-M.; Pan, J. Micromechanics analysis for thermal expansion coefficients of three-phase particle composites. Arch. Appl. Mech. 2019, 89, 1641–1654. [Google Scholar] [CrossRef]
  19. Chen, Y.-X.; Gong, W.-J.; Kang, R. Coupling behavior between adhesive and abrasive wear mechanism of aero-hydraulic spool valves. Chin. J. Aeronaut. 2016, 29, 1119–1131. [Google Scholar] [CrossRef]
  20. Chen, Y.-X.; Jing, H.-L.; Liao, X.; Kang, R. Research on the wear mechanism coupling modeling of spool valve. In Proceedings of the 2015 Annual Reliability and Maintainability Symposium (RAMS), Palm Harbor, FL, USA, 26–29 January 2015. [Google Scholar]
  21. Chu, Y.-B.; Yuan, Z.-H.; Chang, W.-C. Research on the Dynamic Erosion Wear Characteristics of a Nozzle Flapper Pressure Servo Valve Used in Aircraft Brake System. Math. Probl. Eng. 2020, 2020, 3136412. [Google Scholar] [CrossRef]
  22. Ren, P.; Chen, J.-H.; Hu, Y.-P.; Yuan, H.-J. Research on typical wear fault diagnosis of electa hydraulic servo valve element. In Proceedings of the 2016 Prognostics and System Health Management Conference (PHM-Chengdu), Chengdu, China, 19–21 October 2016. [Google Scholar] [CrossRef]
  23. Cao, L.-H.; Liu, S.; Hu, P.-F.; Si, H.-Y. The influence of governing valve opening on the erosion characteristics of solid particle in steam turbine. Eng. Fail. Anal. 2020, 118, 104929. [Google Scholar] [CrossRef]
  24. Zhang, K.; Yao, J.-Y.; Jiang, T.-M. Degradation assessment and life prediction of electro-hydraulic servo valve under erosion wear. Eng. Fail. Anal. 2014, 36, 284–300. [Google Scholar] [CrossRef]
  25. Yin, Y.-B.; Yuan, J.-Y.; Guo, S.-R. Numerical study of solid particle erosion in hydraulic spool valves. Wear 2017, 392, 174–189. [Google Scholar] [CrossRef]
  26. Fang, X.; Yao, J.-Y.; Yin, X.-Z.; Chen, X.; Zhang, C.-H. Physics-of-failure models of erosion wear in electrohydraulic servo valve, and erosion wear life prediction method. Mechatronics 2013, 23, 1202–1214. [Google Scholar] [CrossRef]
  27. Sun, F.; Hu, Y.-B.F.Y.; Yang, B.-B. CFD-based Characteristic Analysis of Erosion Wear of Servo Slide Valve. Surf. Technol. 2016, 45, 84–90. (In Chinese) [Google Scholar]
  28. Zhang, J.; Ji, H.; Zhao, W.; Chen, Q.; Liu, X. Numerical investigation of micrometer-sensitive particle intrusion in hydraulic valve clearances and its impact on valve performance. Processes 2024, 12, 864. [Google Scholar] [CrossRef]
  29. Iyengar, S.K.R. Effect of particulate-contaminants on break-out and actuating for forces in spool valves-A case study. BFPR Annu. Rep. 1976, 10, 1–7. [Google Scholar]
  30. Fitch, E.C. Control of hydraulic fluid contamination parts: Component contaminant tolerance. Hydraul. Pneum. 1983, 37, 88–98. [Google Scholar]
  31. Eleftherakis, J.G. Contaminant Sensitivity Assessment of Electrohydraulic Valves. SAE Int. By Univ. Auckl. 1989, 891867. [Google Scholar] [CrossRef]
  32. Reinertz, O.; Schlemmer, K.; Schumacher, J.T.; Murrenhoff, H. Development of an accelerated ageing test for hydraulic spool and poppet valves. In Proceedings of the 7th International Fluid Power Conference (7th IFK), Aachen, Germany, 22–24 March 2010. [Google Scholar]
  33. Ji, H.; Cui, T.-X.; Chen, X.-M.; Wei, M.; Zhen, Z.; Liu, X.-Q. Rotation phenomenon of square micron particles in clearance of spool valve. J. Lanzhou Univ. Technol. 2017, 43, 51–55. (In Chinese) [Google Scholar]
  34. Lu, L.; Xia, F.-Y.; Yin, Y.-B.; Yuan, J.-Y.; Guo, S.-R. Spool stuck mechanism of ball-type rotary direct drive pressure servo valve. J. Zhejiang Univ. (Eng. Sci.) 2019, 53, 1265–1273+1339. (In Chinese) [Google Scholar]
  35. Borghi, M. Hydraulic locking-in spool-type valves: Tapered clearances analysis. Proc. Inst. Mech. Eng.-Part I J. Syst. Control Eng. 2001, 215, 157–168. [Google Scholar] [CrossRef]
  36. Hong, S.H.; Kim, K.W. A new type groove for hydraulic spool valve. Tribol. Int. 2016, 103, 629–640. [Google Scholar] [CrossRef]
  37. Zhang, S.-Z.; Lin, Z.-H.; Chen, S.-J.; Jin, Z.-J.; Qian, J.-Y. Unbalanced force analysis on valve core clamping in hydraulic spool valves. Ann. Nucl. Energy 2024, 203, 110505. [Google Scholar] [CrossRef]
  38. Yang, Y.; Zhang, Z.; Chen, Y.; Gong, Y. Simulation Analysis and Experimental Research on Mechanical Properties of Water-Hydraulic Ball Valve. 2022, preprint. [Google Scholar] [CrossRef]
  39. Zhao, J.-H.; Zhang, B.; Chen, T.; Wang, Q.; Zhou, S.-L.; Gao, D.-R. Research on valve core’s clamping stagnation of double flapper-nozzle servo valve. High Technol. Lett. 2019, 25, 65–73. [Google Scholar] [CrossRef]
  40. Zeng, Q.-L.; Cui, J.; Zhao, W.-M. Simulation Analysis for Hydraulic Clamping Force of Bidirectional Hydraulic Lock’ Valve Spool Based on Fluent. Adv. Mater. Res. 2012, 542–543, 1091–1095. [Google Scholar] [CrossRef]
  41. Jia, W.-H.; Yin, C.-B.; Cao, D.-H.; Yi, Y. The gap seal’s influences on the leakage and clamping of multi-way directional valves. Sens. Transducers 2013, 23, 44–48. [Google Scholar]
  42. Wang, A.-L.; Dong, Y.-L.; Zhou, P.-J.; Wu, X.-F.; Zhou, C.-L. Robust Design Method for the Seizure Problem of Hydraulic Slide Valve. J. Shangh Ai Jiaotong Univ. 2011, 45, 1637–1642+1652. (In Chinese) [Google Scholar]
Figure 1. Diagram of particles invading valve clearance.
Applsci 14 08880 g001
Figure 2. Establishment of spool clamping model under the action of sensitive particles.
Applsci 14 08880 g002
Figure 3. Mechanism of clamping of single square particle. (a) Micromorphology of spool mating surface. (b) Single square particle.
Applsci 14 08880 g003
Figure 4. Diagram of spool postures and clamping risk zones. (a) Ideal posture; (b) Off-centered posture; (c) Tilting posture; (d) Off-centered & Tilt posture.
Applsci 14 08880 g004
Figure 5. Computation of a spatial sector in clamping risk zones resulting from spool tilting and off-center postures. (a) Parameters used in the calculation of ‘S’; (b) Parameters used in the calculation of ‘A3’; (c) Parameters used in the calculation of ‘A4’.
Applsci 14 08880 g005
Figure 6. Morphological statistics of some particles in samples.
Applsci 14 08880 g006
Figure 7. Statistical histogram and probability distribution curve of particle sizes.
Applsci 14 08880 g007
Figure 8. Probability density function of particle distribution.
Applsci 14 08880 g008
Figure 9. Structure, size, and force analysis of experimental spool. (a) Force analysis of experimental spool; (b) Parameter about experimental spool.
Applsci 14 08880 g009
Figure 10. Spool clamping force measurement device. 1—tested spool, 2—valve, 3—stepper motor, 4—tension senor, 5—negative pressure sensor, 6—controller of stepper motor, 7—tension detection system, 8—negative pressure monitoring system, 9—data acquisition system.
Applsci 14 08880 g010
Figure 11. Inherent friction calculated curve of spool.
Applsci 14 08880 g011
Figure 12. Measurement results of spool clamping force in hydraulic oil containing aluminum, gravel, and iron particles. (a) Spool clamping force curve in hydraulic oil containing aluminum, gravel, and iron particles. (b) Average value, maximum value, and pulsation frequency of spool clamping force in hydraulic oil containing aluminum, gravel, and iron particles.
Applsci 14 08880 g012
Figure 13. Measurement results of spool clamping force in hydraulic oil containing aluminum particles at different volume concentrations. (a) Hydraulic oil containing aluminum particles at different volume concentrations. (b) Spool clamping force curves in hydraulic oil containing aluminum particles at different volume concentrations.
Applsci 14 08880 g013
Figure 14. Average value, maximum value, and pulsation comparison of clamping force in oils at different particle concentrations.
Applsci 14 08880 g014
Figure 15. Clamping force curves in hydraulic oil containing aluminum particles of different sizes. (a) Micrographs of aluminum particles of different sizes. (b) Clamping force curves in hydraulic oil containing aluminum particles of different sizes.
Applsci 14 08880 g015
Figure 16. The mean value, maximum value, and pulsation comparison of clamping forces in oils containing different particle sizes.
Applsci 14 08880 g016
Table 1. Physical properties of aluminum, sand, and iron materials.
Physical PropertyAlSand (SiO2)Fe
Density (g/cm3)2.72.5~2.77.87
Elastic modulus (GPa)68.573.1206
Disclaimer/Publisher’s Note: The statements, opinions and data contained in all publications are solely those of the individual author(s) and contributor(s) and not of MDPI and/or the editor(s). MDPI and/or the editor(s) disclaim responsibility for any injury to people or property resulting from any ideas, methods, instructions or products referred to in the content.

