


Evidence-Based Investigation of Coronary Calcium Score in Cardiac Computed Tomography

Abstract
:1. Introduction
2. Materials and Methods
2.1. Patients
2.2. CT Image Acquisition
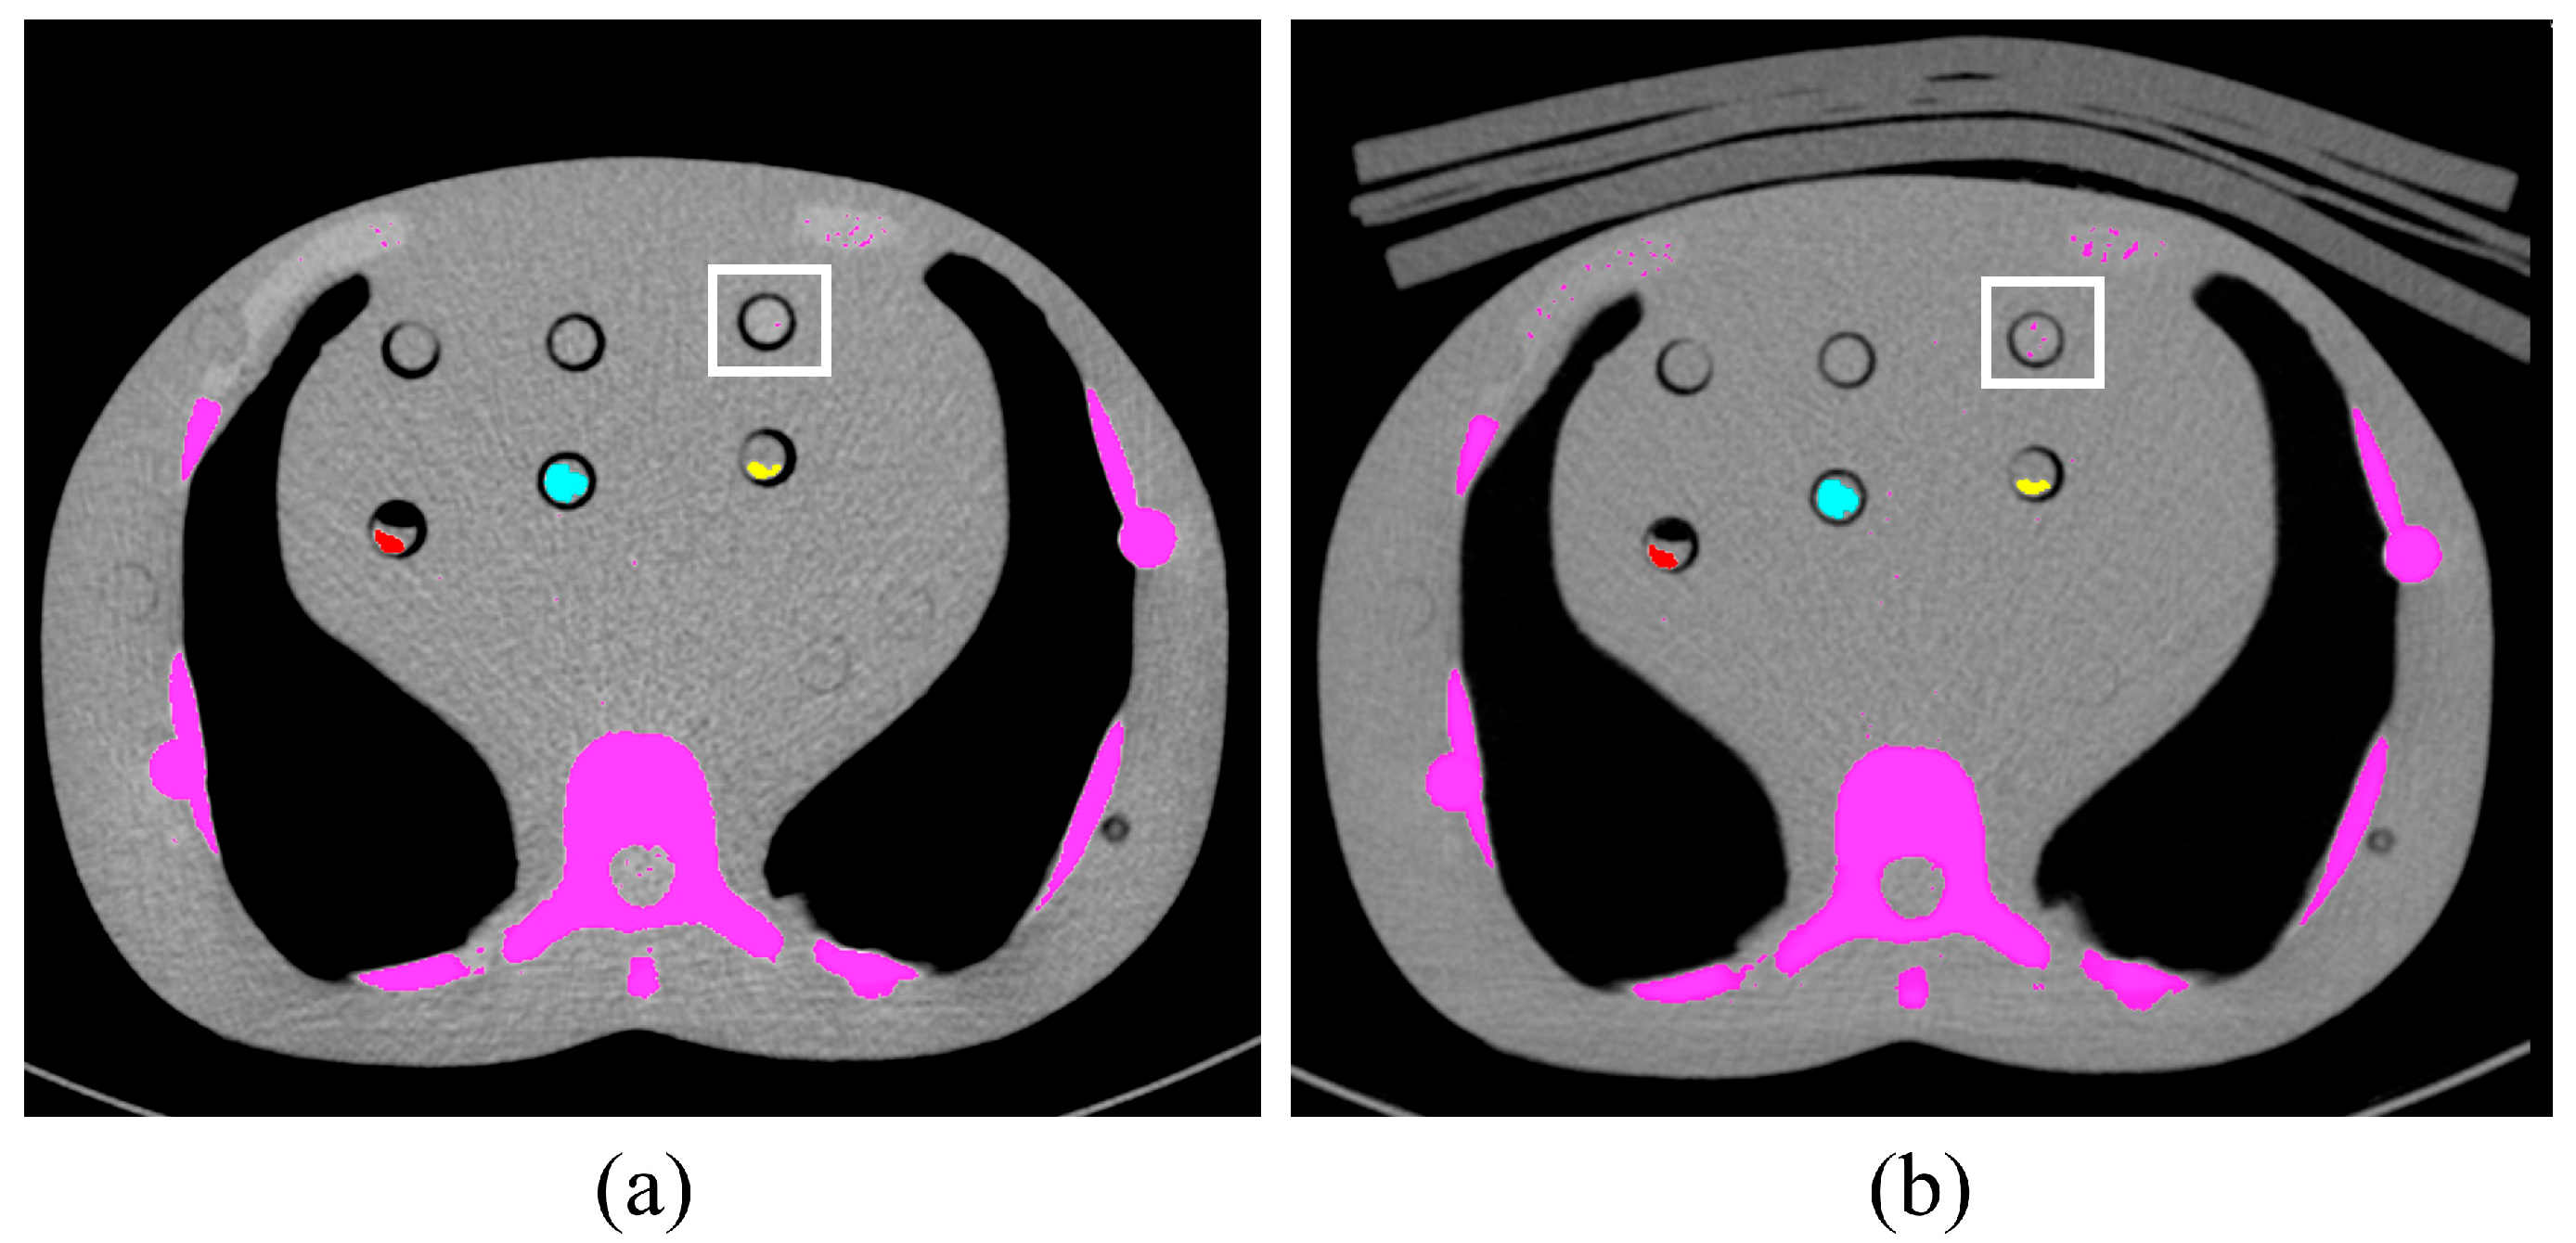
2.3. Image Analysis

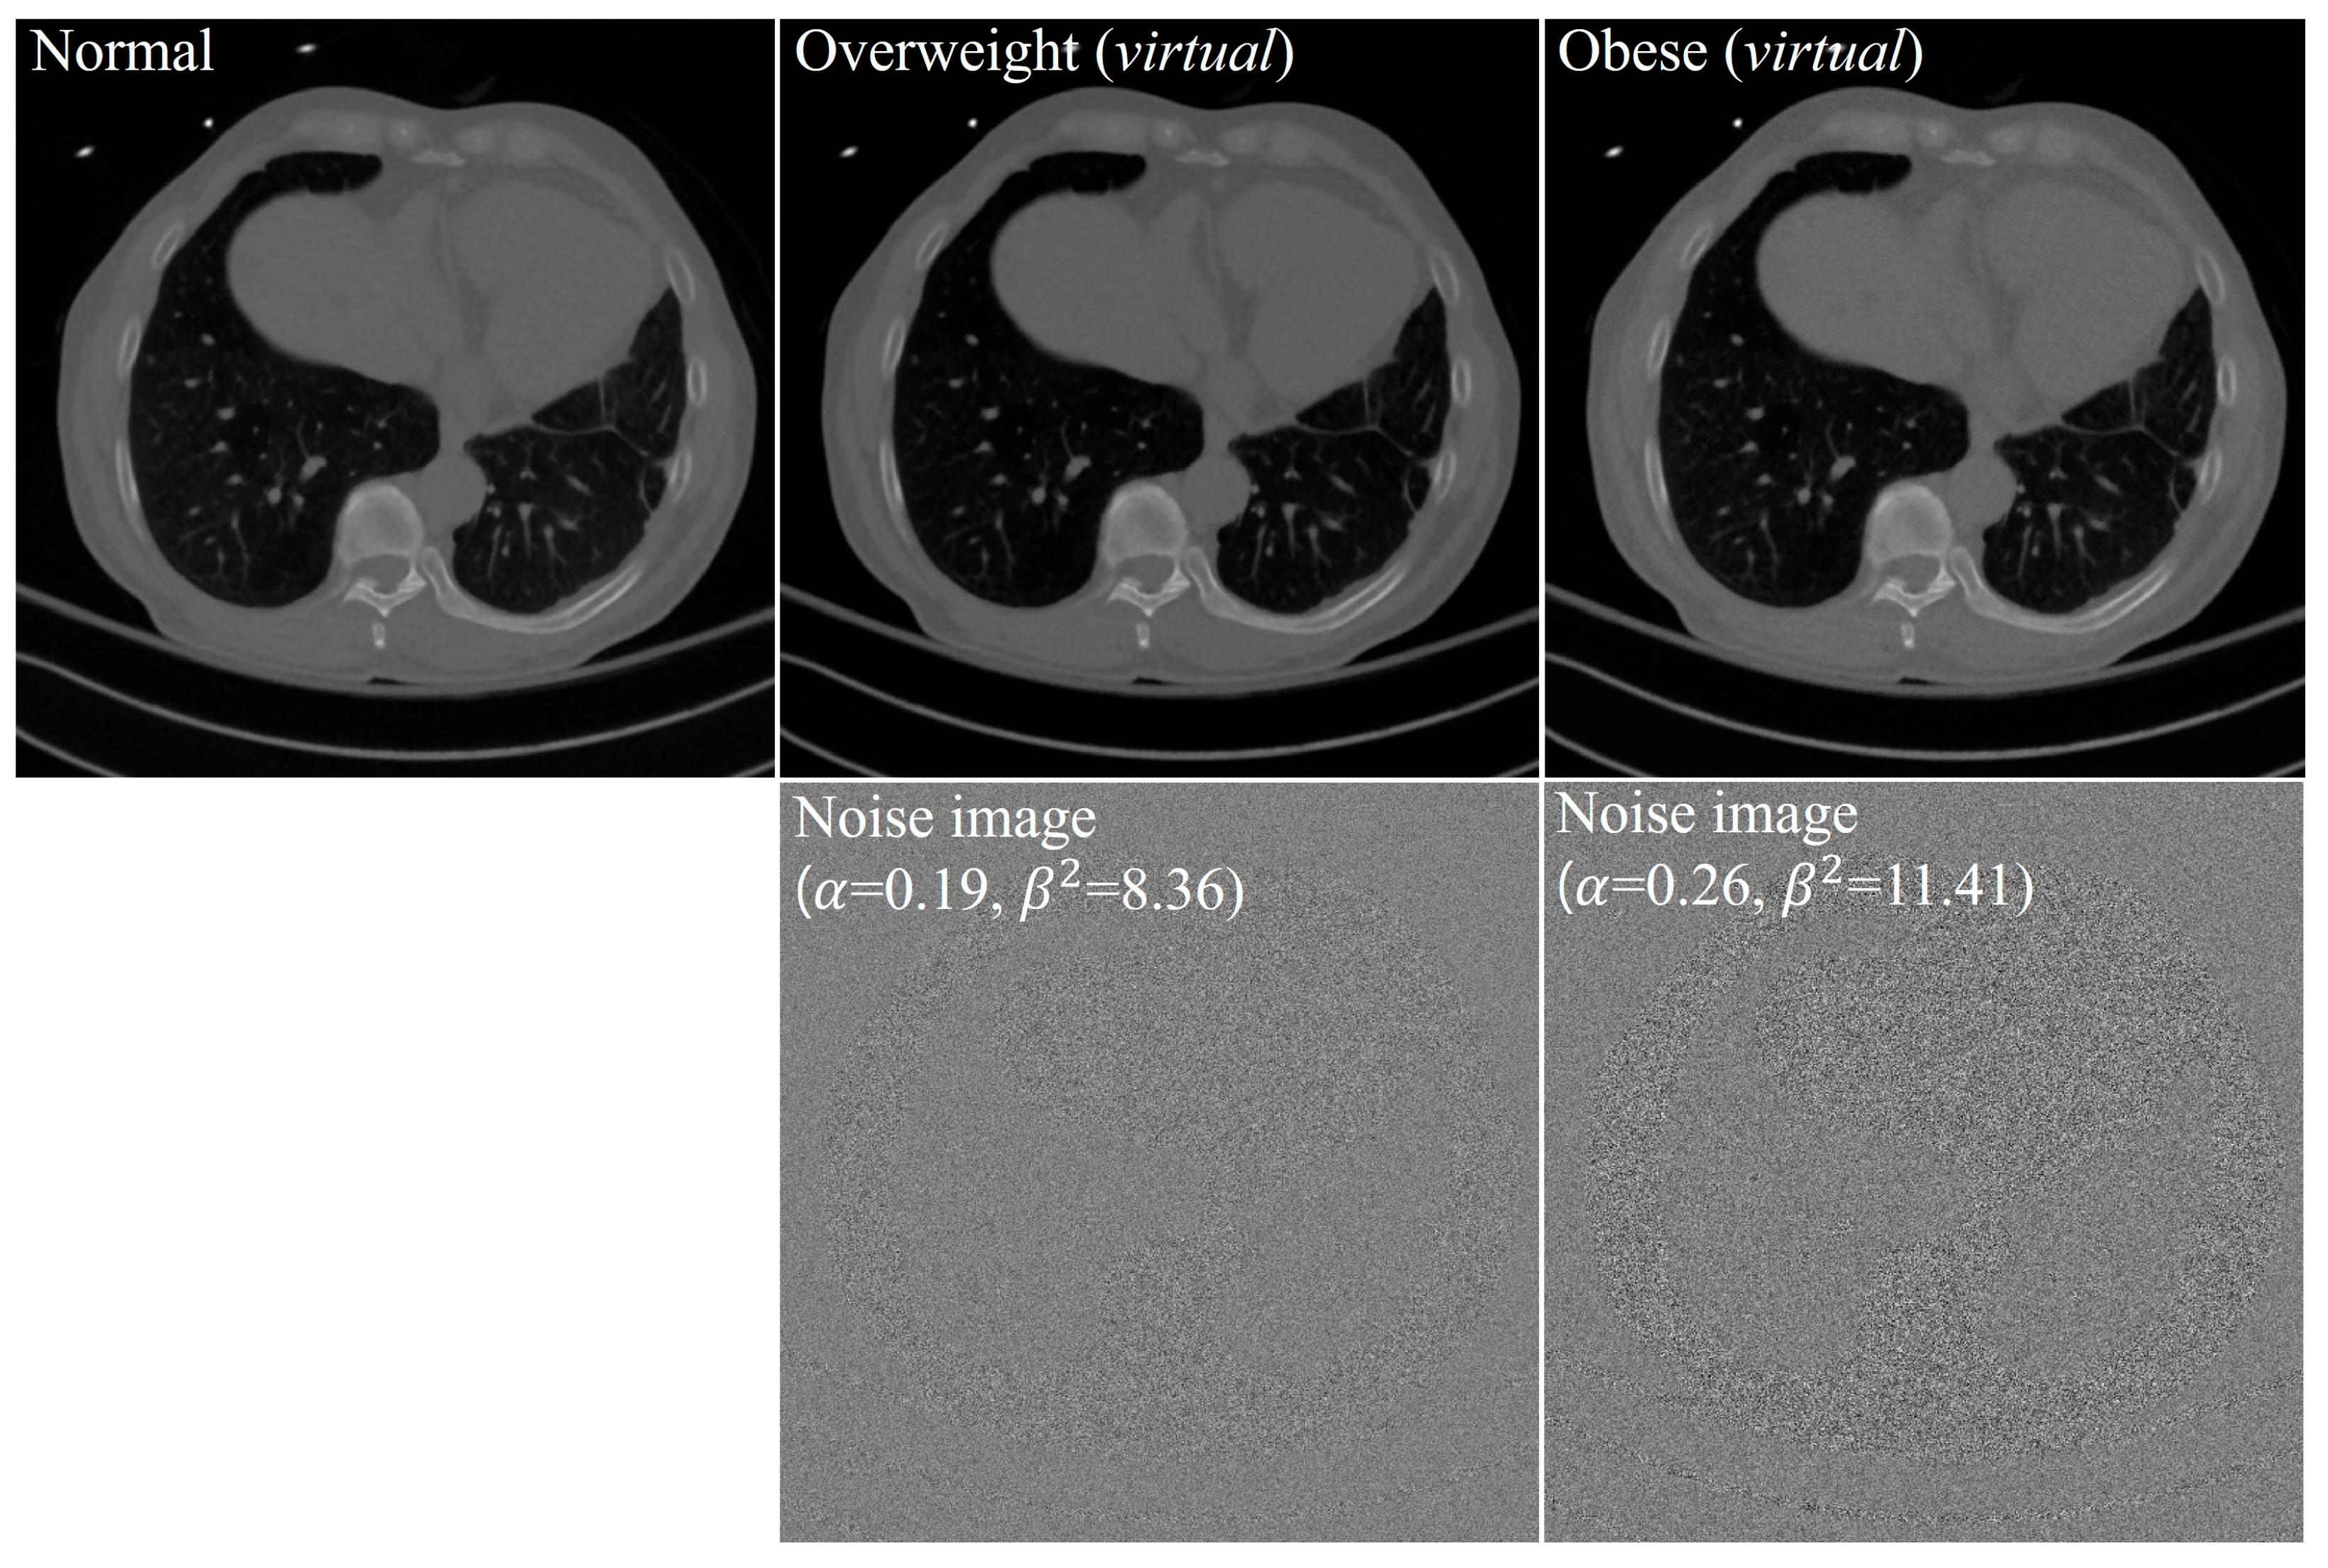
| Overweight | ||
|---|---|---|
| Patient 1 | 0.21 | 8.49 |
| Patient 2 | 0.16 | 8.35 |
| Patient 3 | 0.19 | 8.23 |
| Mean SD | 0.19 0.03 | 8.36 0.13 |
| Median | 0.19 | 8.35 |
| Minimum, maximum | (0.16, 0.21) | (8.23, 8.49) |
| 95% CI | (0.12, 0.25) | (8.03, 8.68) |
| Obese | ||
| Patient 1 | 0.25 | 11.36 |
| Patient 2 | 0.19 | 10.29 |
| Patient 3 | 0.27 | 10.42 |
| Patient 4 | 0.33 | 12.27 |
| Patient 5 | 0.27 | 10.67 |
| Patient 6 | 0.23 | 11.10 |
| Patient 7 | 0.36 | 14.04 |
| Patient 8 | 0.39 | 12.60 |
| Patient 9 | 0.33 | 12.42 |
| Patient 10 | 0.38 | 12.57 |
| Patient 11 | 0.16 | 11.31 |
| Patient 12 | 0.15 | 9.74 |
| Patient 13 | 0.17 | 10.22 |
| Patient 14 | 0.21 | 11.62 |
| Patient 15 | 0.17 | 10.59 |
| Mean SD | 0.26 0.08 | 11.41 1.17 |
| Median | 0.25 | 11.31 |
| minimum, maximum | (0.15, 0.39) | (9.74, 14.04) |
| 95% CI | (0.21, 0.30) | (10.77, 12.06) |
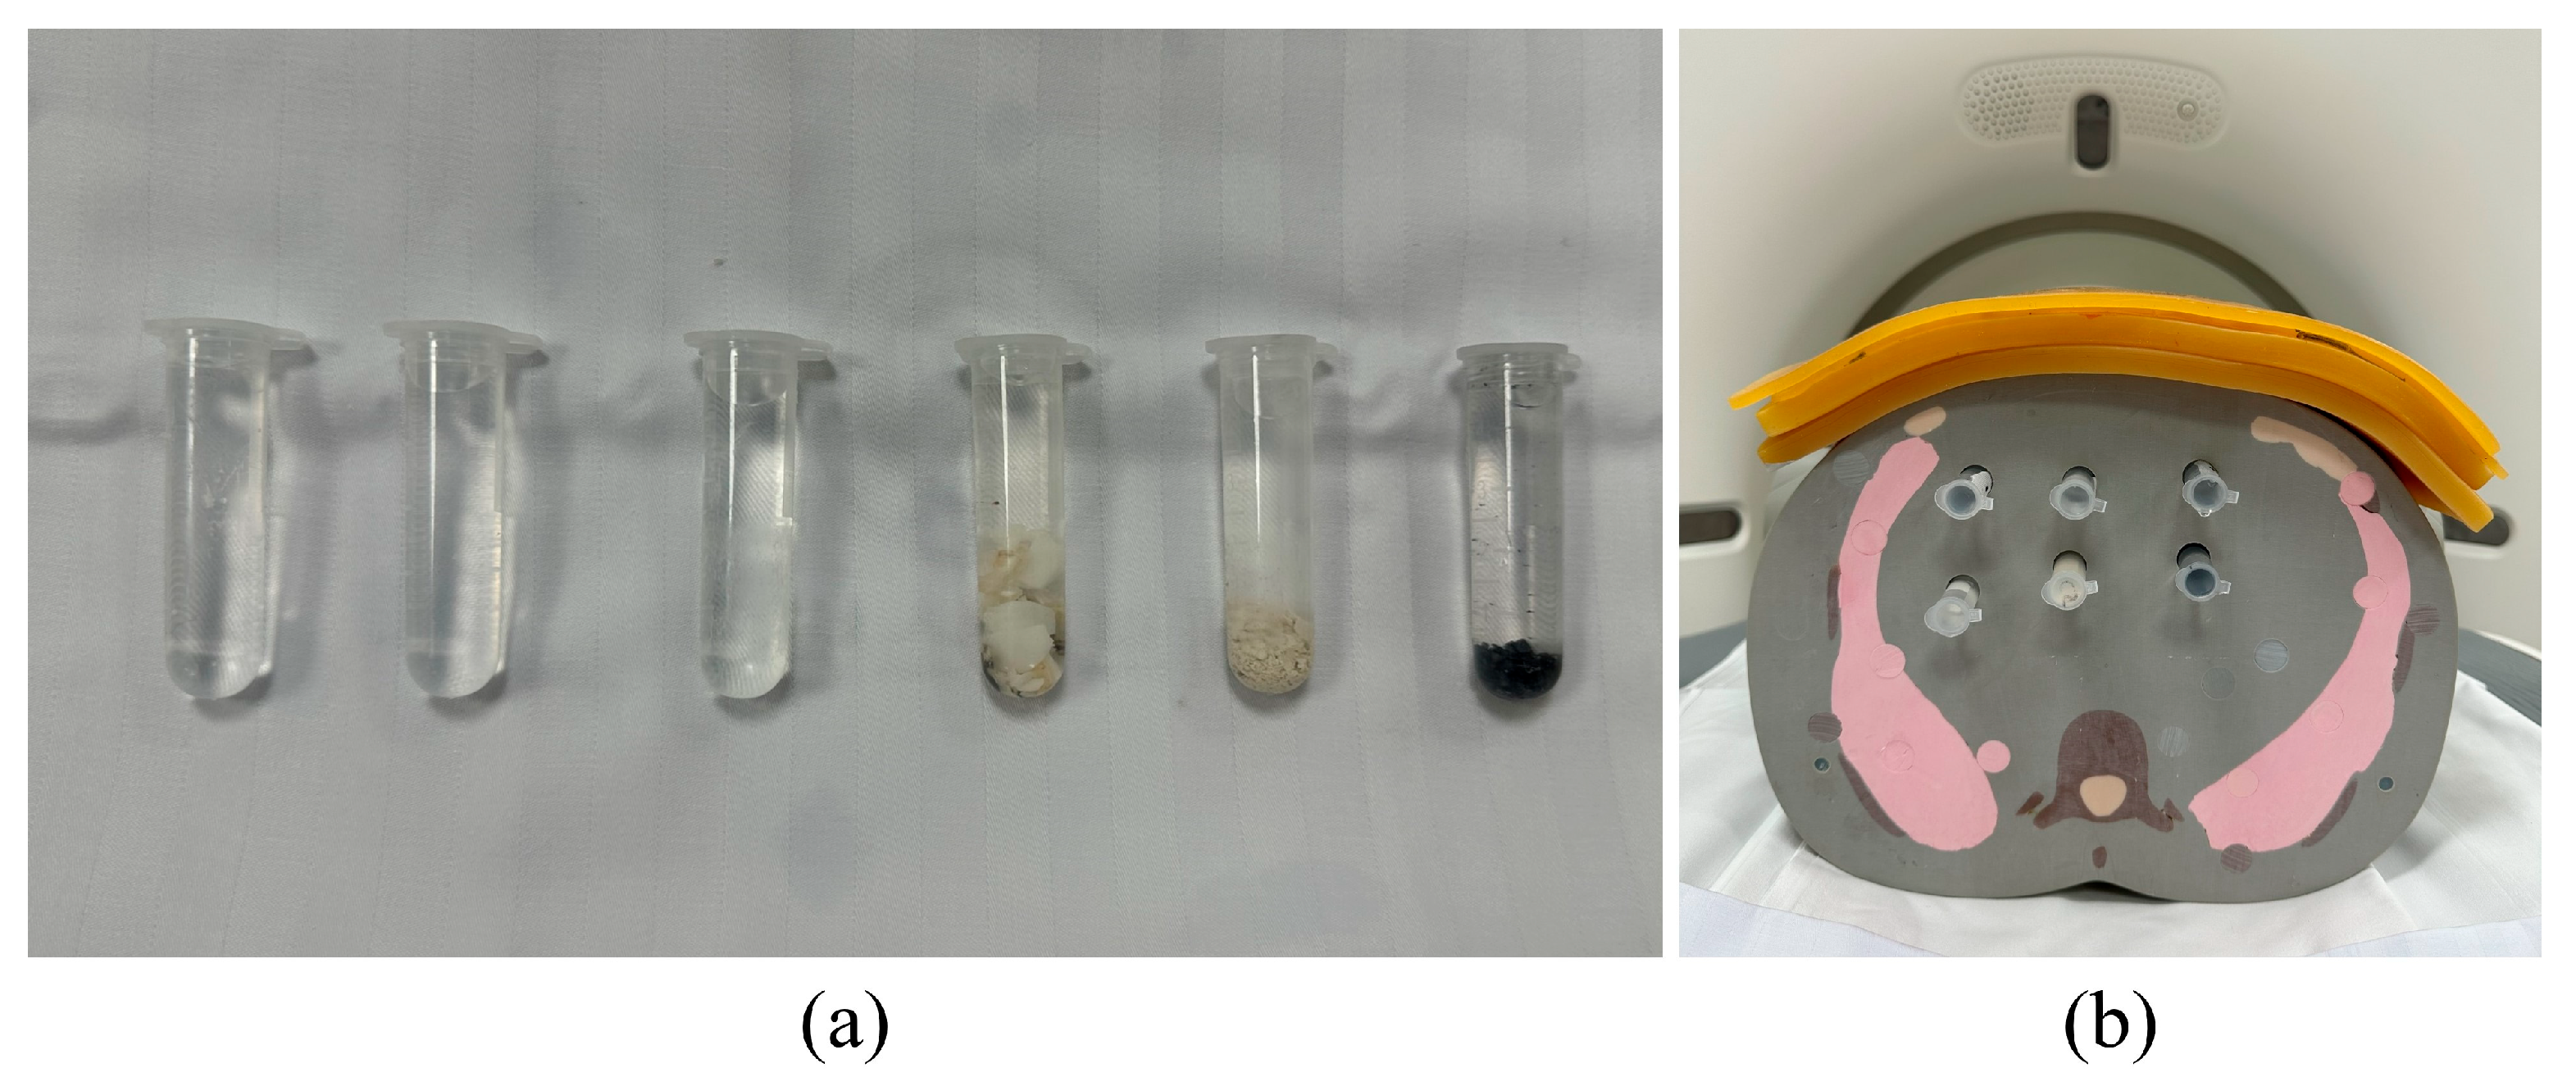
2.4. Phantom Study
2.5. Calcium Scoring
2.6. Study Designs
2.7. Statistical Analysis
3. Results
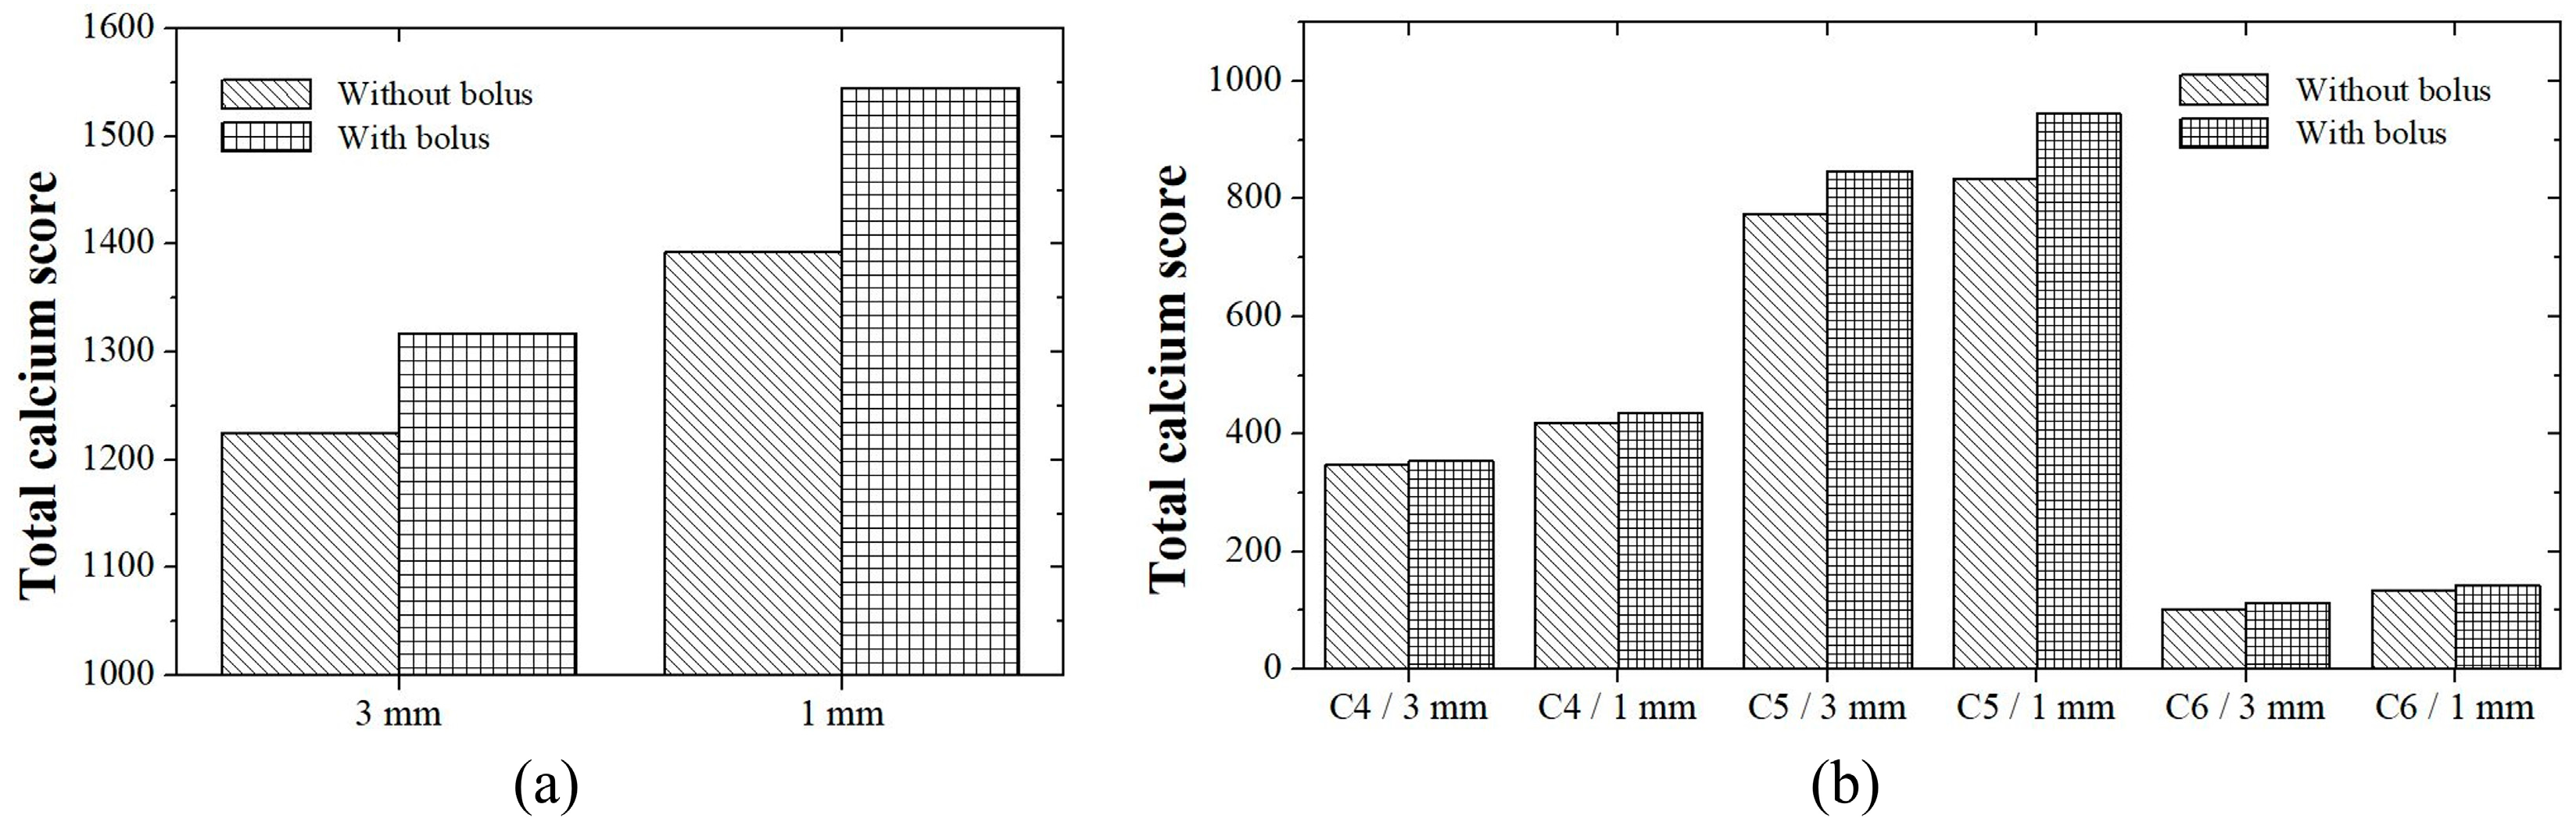
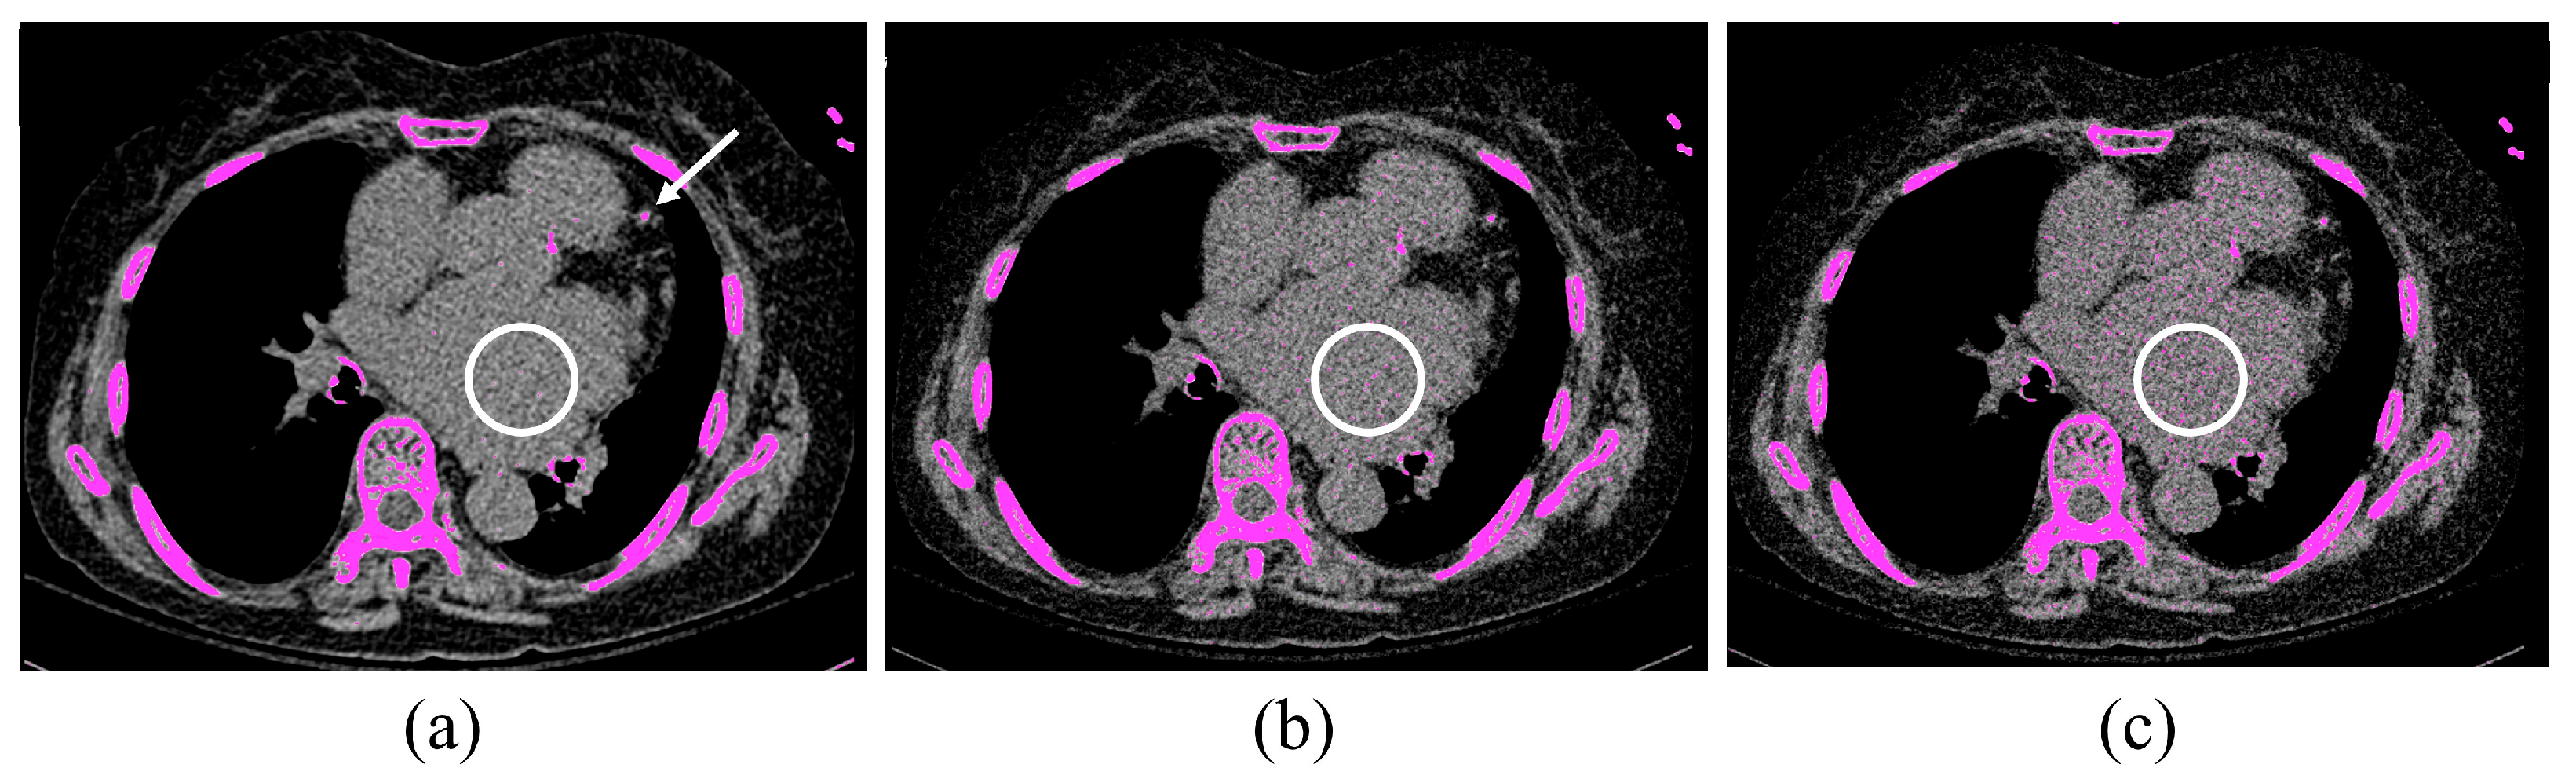
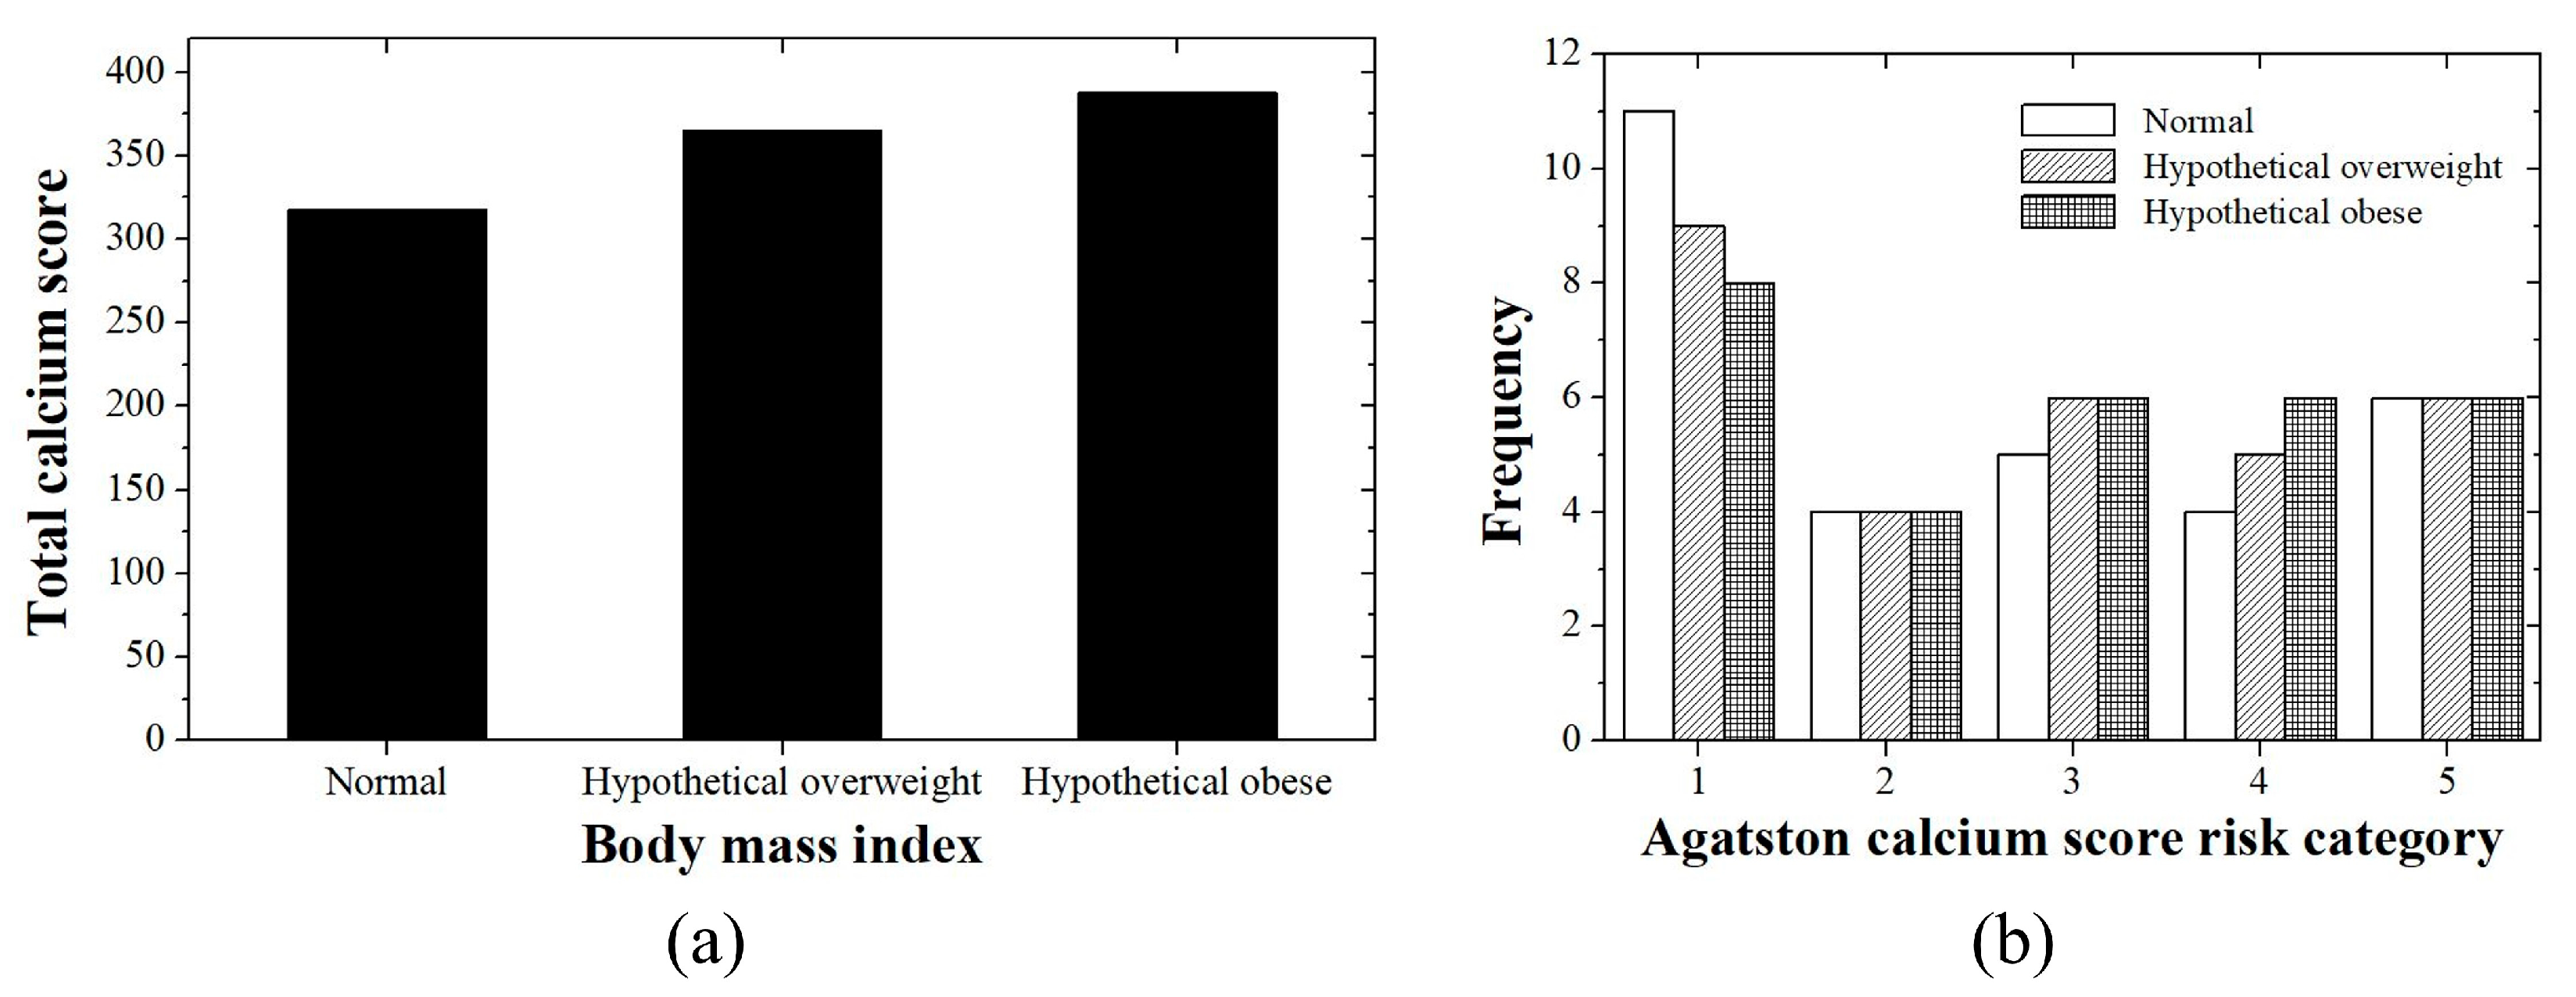
3.1. Patient Study
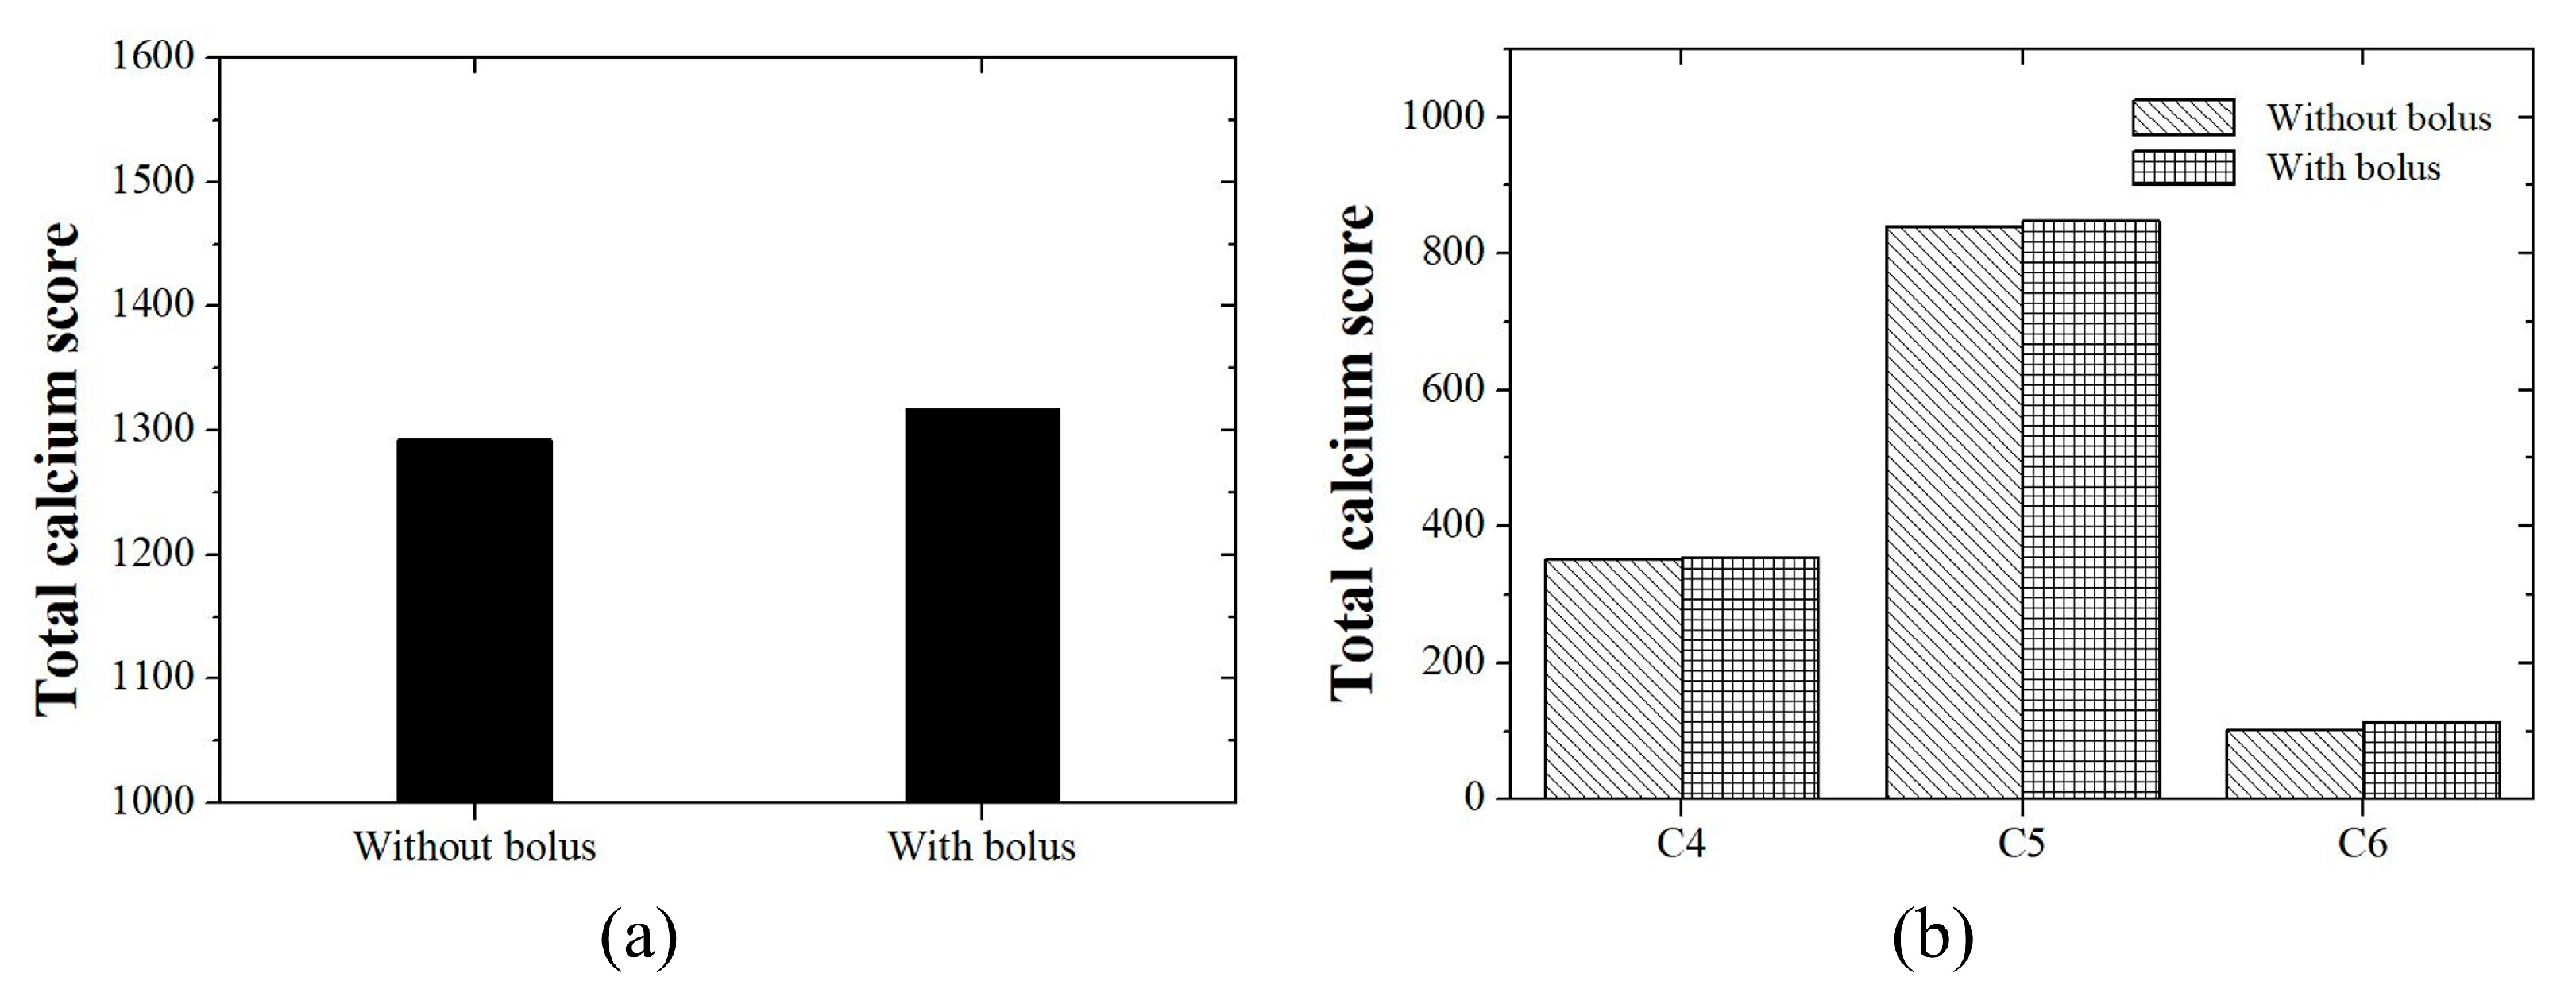
3.2. Phantom Study

4. Discussion
5. Conclusions
Author Contributions
Funding
Institutional Review Board Statement
Informed Consent Statement
Data Availability Statement
Conflicts of Interest
References
- Hu, X.; Zhu, Y.; Qian, Y.; Huang, R.; Yin, S.; Zeng, Z.; Xie, N.; Ma, B.; Yu, Y.; Zhao, Q.; et al. Prediction of subsequent osteoporotic vertebral compression fracture on CT radiography via deep learning. View 2022, 3, 20220012. [Google Scholar] [CrossRef]
- Huang, J.; Bao, H.; Li, X.; Zhang, Z. In vivo CT imaging tracking of stem cells labeled with Au nanoparticles. View 2022, 3, 20200119. [Google Scholar] [CrossRef]
- Nucifora, G.; Bax, J.J.; van Werkhoven, J.M.; Boogers, M.J.; Schuijf, J.D. Coronary artery calcium scoring in cardiovascular risk assessment. Cardiovasc. Ther. 2011, 29, e43–e53. [Google Scholar] [CrossRef]
- Flohr, T.G.; Schaller, S.; Stierstorfer, K.; Bruder, H.; Ohnesorge, B.M.; Schoepf, U.J. Multi-detector row CT systems and image-reconstruction techniques. Radiology 2005, 235, 756–773. [Google Scholar] [CrossRef] [PubMed]
- Johnson, T.R.C.; Nikolaou, K.; Wintersperger, B.J.; Leber, A.W.; von Ziegler, F.; Rist, C.; Buhmann, S.; Knez, A.; Reiser, M.F.; Becker, C.R. Dual-source CT cardiac imaging: Initial experience. Eur. Radiol. 2006, 16, 1409–1415. [Google Scholar] [CrossRef]
- Paul, J.F.; Abada, H.T. Strategies for reduction of radiation dose in cardiac multislice CT. Eur. Radiol. 2007, 17, 2028–2037. [Google Scholar] [CrossRef] [PubMed]
- Schmermund, A.; Möhlenkamp, S.; Erbel, R. Coronary artery calcium and its relationship to coronary artery disease. Cardiol. Clin. 2003, 21, 521–534. [Google Scholar] [CrossRef] [PubMed]
- Bernardini, F.; Gelfusa, M.; Celeski, M.; Coletti, F.; Nusca, A.; De Stefano, D.; Piccirillo, F.; Mangiacapra, F.; Gallo, P.; Cammalleri, V.; et al. Beyond the calcium score: What additional information from a CT scan can assist in cardiovascular risk assessment? Appl. Sci. 2023, 13, 241. [Google Scholar] [CrossRef]
- Orringer, C.E.; Blaha, M.J.; Blankstein, R.; Budoff, M.J.; Goldberg, R.B.; Gill, E.A.; Maki, K.C.; Mehta, L.; Jacobson, T.A. The National Lipid Association scientific statement on coronary artery calcium scoring to guide preventive strategies for ASCVD risk reduction. J. Clin. Lipidol. 2021, 15, 33–60. [Google Scholar] [CrossRef]
- Golub, I.S.; Termeie, O.G.; Kristo, S.; Schroeder, L.P.; Lakshmanan, S.; Shafter, A.M.; Hussein, L.; Verghese, D.; Aldana-Bitar, J.; Manubolu, V.S.; et al. Major global coronary artery calcium guidelines. JACC Cardiovasc. Imaging 2023, 16, 98–117. [Google Scholar] [CrossRef] [PubMed]
- Detrano, R.; Guerci, A.D.; Carr, J.J.; Bild, D.E.; Burke, G.; Folsom, A.R.; Liu, K.; Shea, S.; Szklo, M.; Bluemke, D.A.; et al. Coronary calcium as a predictor of coronary events in four racial or ethnic groups. N. Engl. J. Med. 2008, 358, 1336–1345. [Google Scholar] [CrossRef] [PubMed]
- Shaw, L.J.; Giambrone, A.E.; Blaha, M.J.; Knapper, J.T.; Berman, D.S.; Bellam, N.; Quyyumi, A.; Budoff, M.J.; Callister, T.Q.; Min, J.K. Long-term prognosis after coronary artery calcification testing in asymptomatic patients: A cohort study. Ann. Intern. Med. 2015, 163, 14–21. [Google Scholar] [CrossRef] [PubMed]
- Voros, S.; Rivera, J.J.; Berman, D.S.; Blankstein, R.; Budoff, M.J.; Cury, R.C.; Desai, M.Y.; Dey, D.; Halliburton, S.S.; Hecht, H.S.; et al. Guideline for minimizing radiation exposure during acquisition of coronary artery calcium scans with the use of multidetector computed tomography: A report by the society for atherosclerosis imaging and prevention tomographic imaging and prevention councils in collaboration with the society of cardiovascular computed tomography. J. Cardiovasc. Comput. Tomogr. 2011, 5, 75–83. [Google Scholar] [PubMed]
- Hoori, A.; Al-Kindi, S.; Hu, T.; Song, Y.; Wu, H.; Lee, J.; Tashtish, N.; Fu, P.; Gilkeson, R.; Rajagopalan, S.; et al. Enhancing cardiovascular risk prediction through AI-enabled calcium-omics. Sci. Rep. 2024, 14, 11134. [Google Scholar] [CrossRef] [PubMed]
- Foi, A.; Trimeche, M.; Katkovnik, V.; Egiazarian, K. Practical Poissonian-Gaussian noise modeling and fitting for single-image raw-data. IEEE Trans. Image Process. 2008, 17, 1737–1754. [Google Scholar] [CrossRef] [PubMed]
- Zhu, L.; Wang, J.; Xing, L. Noise suppression in scatter correction for cone-beam CT. Med. Phys. 2009, 36, 741–752. [Google Scholar] [CrossRef]
- Lancaster, J.; Hasegawa, B. Fundamental Mathematics and Physics of Medical Imaging; CRC Press, Taylor & Francis Group: Boca Raton, FL, USA, 2016. [Google Scholar]
- Nguyen, N.T.; Magno, C.P.; Lane, K.T.; Hinojosa, M.W.; Lane, J.S. Association of hypertension, diabetes, dyslipidemia, and metabolic syndrome with obesity: Findings from the National Health and Nutrition Examination Survey, 1999 to 2004. J. Am. Coll. Surg. 2008, 207, 928–934. [Google Scholar] [CrossRef]
- Chang, Y.; Kim, B.K.; Yun, K.E.; Cho, J.; Zhang, Y.; Rampal, S.; Zhao, D.; Jung, H.-S.; Choi, Y.; Ahn, J.; et al. Metabolically-healthy obesity and coronary artery calcification. J. Am. Coll. Cardiol. 2014, 63, 2679–2686. [Google Scholar] [CrossRef]
- Jensen, J.C.; Dardari, Z.A.; Blaha, M.J.; White, S.; Shaw, L.J.; Rumberger, J.; Rozanski, A.; Berman, D.S.; Budoff, M.J.; Nasir, K.; et al. Association of body mass index with coronary artery calcium and subsequent cardiovascular mortality: The Coronary Artery Calcium Consortium. Circ. Cardiovasc. Imaging 2020, 13, e009495. [Google Scholar] [CrossRef] [PubMed]
- Perone, F.; Pingitore, A.; Conte, E.; Halasz, G.; Ambrosetti, M.; Peruzzi, M.; Cavarretta, E. Obesity and cardiovascular risk: Systematic intervention is the key for prevention. Healthcare 2023, 11, 902. [Google Scholar] [CrossRef] [PubMed]
- Mäkitalo, M.; Foi, A. Noise parameter mismatch in variance stabilization, with an application to Poisson-Gaussian noise estimation. IEEE Trans. Image Process. 2014, 23, 5348–5359. [Google Scholar] [CrossRef]
- Liu, X.; Tanaka, M.; Okutomi, M. Single-image noise level estimation for blind denoising. IEEE Trans. Image Process. 2013, 22, 5226–5237. [Google Scholar] [CrossRef] [PubMed]
- Sutour, C.; Deledalle, C.-A.; Aujol, J.-F. Estimation of the noise level function based on a nonparametric detection of homogeneous image regions. SIAM J. Imaging Sci. 2015, 8, 2622–2661. [Google Scholar] [CrossRef]
- Lee, S.; Lee, M.S.; Kang, M.G. Poisson-Gaussian noise analysis and estimation for low-dose x-ray images in the NSCT domain. Sensors 2018, 18, 1019. [Google Scholar] [CrossRef] [PubMed]
- Kendall, M.G. A new measure of rank correlation. Biometrika 1938, 30, 81–93. [Google Scholar] [CrossRef]
- Kendall, M.G. The treatment of ties in ranking problems. Biometrika 1945, 33, 239–251. [Google Scholar] [CrossRef]
- Chambolle, A.; Pock, T. A first-order primal-dual algorithm for convex problems with applications to imaging. J. Math. Imaging Vis. 2011, 40, 120–145. [Google Scholar] [CrossRef]
- Pletcher, M.J.; Tice, J.A.; Pignone, M.; Browner, W.S. Using the coronary artery calcium score to predict coronary heart disease events: A systematic review and meta-analysis. Arch. Intern. Med. 2004, 164, 1285–1292. [Google Scholar] [CrossRef] [PubMed]
- Waltz, J.; Kocher, M.; Kahn, J.; Dirr, M.; Burt, J.R. The future of concurrent automated coronary artery calcium scoring on screening low-dose computed tomography. Cureus 2020, 12, e8574. [Google Scholar] [CrossRef]
- Eng, D.; Chute, C.; Khandwala, N.; Rajpurkar, P.; Long, J.; Shleifer, S.; Khalaf, M.H.; Sandhu, A.T.; Rodriguez, F.; Maron, D.J. Automated coronary calcium scoring using deep learning with multicenter external validation. NPJ Digit. Med. 2021, 4, 88. [Google Scholar] [CrossRef]
- Choi, J.H.; Cha, M.J.; Cho, I.; Kim, W.D.; Ha, Y.; Choi, H.; Lee, S.H.; You, S.C.; Chang, J.S. Validation of deep learning-based fully automated coronary artery calcium scoring using non-ECG-gated chest CT in patients with cancer. Front. Oncol. 2022, 12, 989250. [Google Scholar] [CrossRef] [PubMed]
- Desai, G.S.; Uppot, R.N.; Yu, E.W.; Kambadakone, A.R.; Sahani, D.V. Impact of iterative reconstruction on image quality and radiation dose in multidetector CT of large body size adults. Eur. Radiol. 2012, 22, 1631–1640. [Google Scholar] [CrossRef] [PubMed]
- Layritz, C.; Muschiol, G.; Flohr, T.; Bietau, C.; Marwan, M.; Schuhbaeck, A.; Schmid, J.; Ropers, D.; Achenbach, S.; Pflederer, T. Automated attenuation-based selection of tube voltage and tube current for coronary CT angiography: Reduction of radiation exposure versus a BMI-based strategy with an expert investigator. J. Cardiovasc. Comput. Tomogr. 2013, 7, 303–310. [Google Scholar] [CrossRef] [PubMed]
- Wang, G.; Gao, J.; Zhao, S.; Sun, X.; Chen, X.; Cui, X. Achieving consistent image quality and overall radiation dose reduction for coronary CT angiography with body mass index-dependent tube voltage and tube current selection. Clin. Radiol. 2014, 69, 945–951. [Google Scholar] [PubMed]
- Xie, X.; Zhao, Y.; de Bock, G.H.; de Jong, P.A.; Mali, W.P.; Oudkerk, M.; Vliegenthart, R. Validation and prognosis of coronary artery calcium scoring in nontriggered thoracic computed tomography: Systematic review and meta-analysis. Circ. Cardiovasc. Imaging 2013, 6, 514–521. [Google Scholar]
- Fan, R.; Shi, X.; Qian, Y.; Wang, Y.; Fan, L.; Chen, R.; Xiao, Y.; Liu, S. Optimized categorization algorithm of coronary artery calcification score on non-gated chest low-dose CT screening using iterative model reconstruction technique. Clin. Imaging. 2018, 52, 287–291. [Google Scholar] [CrossRef]
- Kang, H.W.; Ahn, W.J.; Jeong, J.H.; Suh, Y.J.; Yang, D.H.; Choi, H.; Hwang, S.H.; Yong, H.S.; Oh, Y.W.; Kang, E.-Y.; et al. Evaluation of fully automated commercial software for Agatston calcium scoring on non-ECG-gated low-dose chest CT with different slice thickness. Eur. Radiol. 2023, 33, 1973–1981. [Google Scholar] [CrossRef]
| Parameter | Patient Study | Phantom Study |
|---|---|---|
| kVp | 100 | 120, 100 |
| mAs | 80 | 80 |
| Scan time (s) | 0.14 | 0.14 |
| Rotation time (s) | 0.25 | 0.25 |
| Slice thickness/increment (mm) | 3.0/1.5 | 3.0, 1.0/1.5 |
| Field of view (mm) | 300 | 300 |
| Reconstruction kernel | Sa 36 | Sa 36 |
| Scan mode | Sequence | Sequence |
| Direction | Craniocaudal | Craniocaudal |
| Window | Mediastinum | Mediastinum |
Disclaimer/Publisher’s Note: The statements, opinions and data contained in all publications are solely those of the individual author(s) and contributor(s) and not of MDPI and/or the editor(s). MDPI and/or the editor(s) disclaim responsibility for any injury to people or property resulting from any ideas, methods, instructions or products referred to in the content. |
© 2024 by the authors. Licensee MDPI, Basel, Switzerland. This article is an open access article distributed under the terms and conditions of the Creative Commons Attribution (CC BY) license (https://creativecommons.org/licenses/by/4.0/).
Share and Cite
Shim, J.; Kim, K.; Lee, Y. Evidence-Based Investigation of Coronary Calcium Score in Cardiac Computed Tomography. Appl. Sci. 2024, 14, 8906. https://doi.org/10.3390/app14198906
Shim J, Kim K, Lee Y. Evidence-Based Investigation of Coronary Calcium Score in Cardiac Computed Tomography. Applied Sciences. 2024; 14(19):8906. https://doi.org/10.3390/app14198906
Chicago/Turabian StyleShim, Jina, Kyuseok Kim, and Youngjin Lee. 2024. "Evidence-Based Investigation of Coronary Calcium Score in Cardiac Computed Tomography" Applied Sciences 14, no. 19: 8906. https://doi.org/10.3390/app14198906