Abstract
Setting the population, intervention, comparison, and outcome (PICO) elements during a search strategy development stage for a systematic review (SR) defines a research question specifically. In contrast to traditional methods that rely on researcher discretion, we propose a text network analysis (TNA) method using the R language to set the correct basis for the PICO. First, we collected 80 related papers from the PubMed database using ‘Health Impact Assessment of arsenic exposure’ as an example topic. Next, we recorded the keywords of each paper into a dataframe and converted the dataframe into an edge list format to create a network. Finally, we confirmed the connectivity and frequency of each keyword through network visualization and the importance of keywords according to three metrics through centrality analysis. As a result, arsenic could be expected to have detrimental effects on the occurrence of heart- and blood-related diseases or on mothers. By setting important keywords as the PICO elements known through a TNA, the reliability of SRs is improved, and this methodology can be equally applied to various topics.
1. Introduction
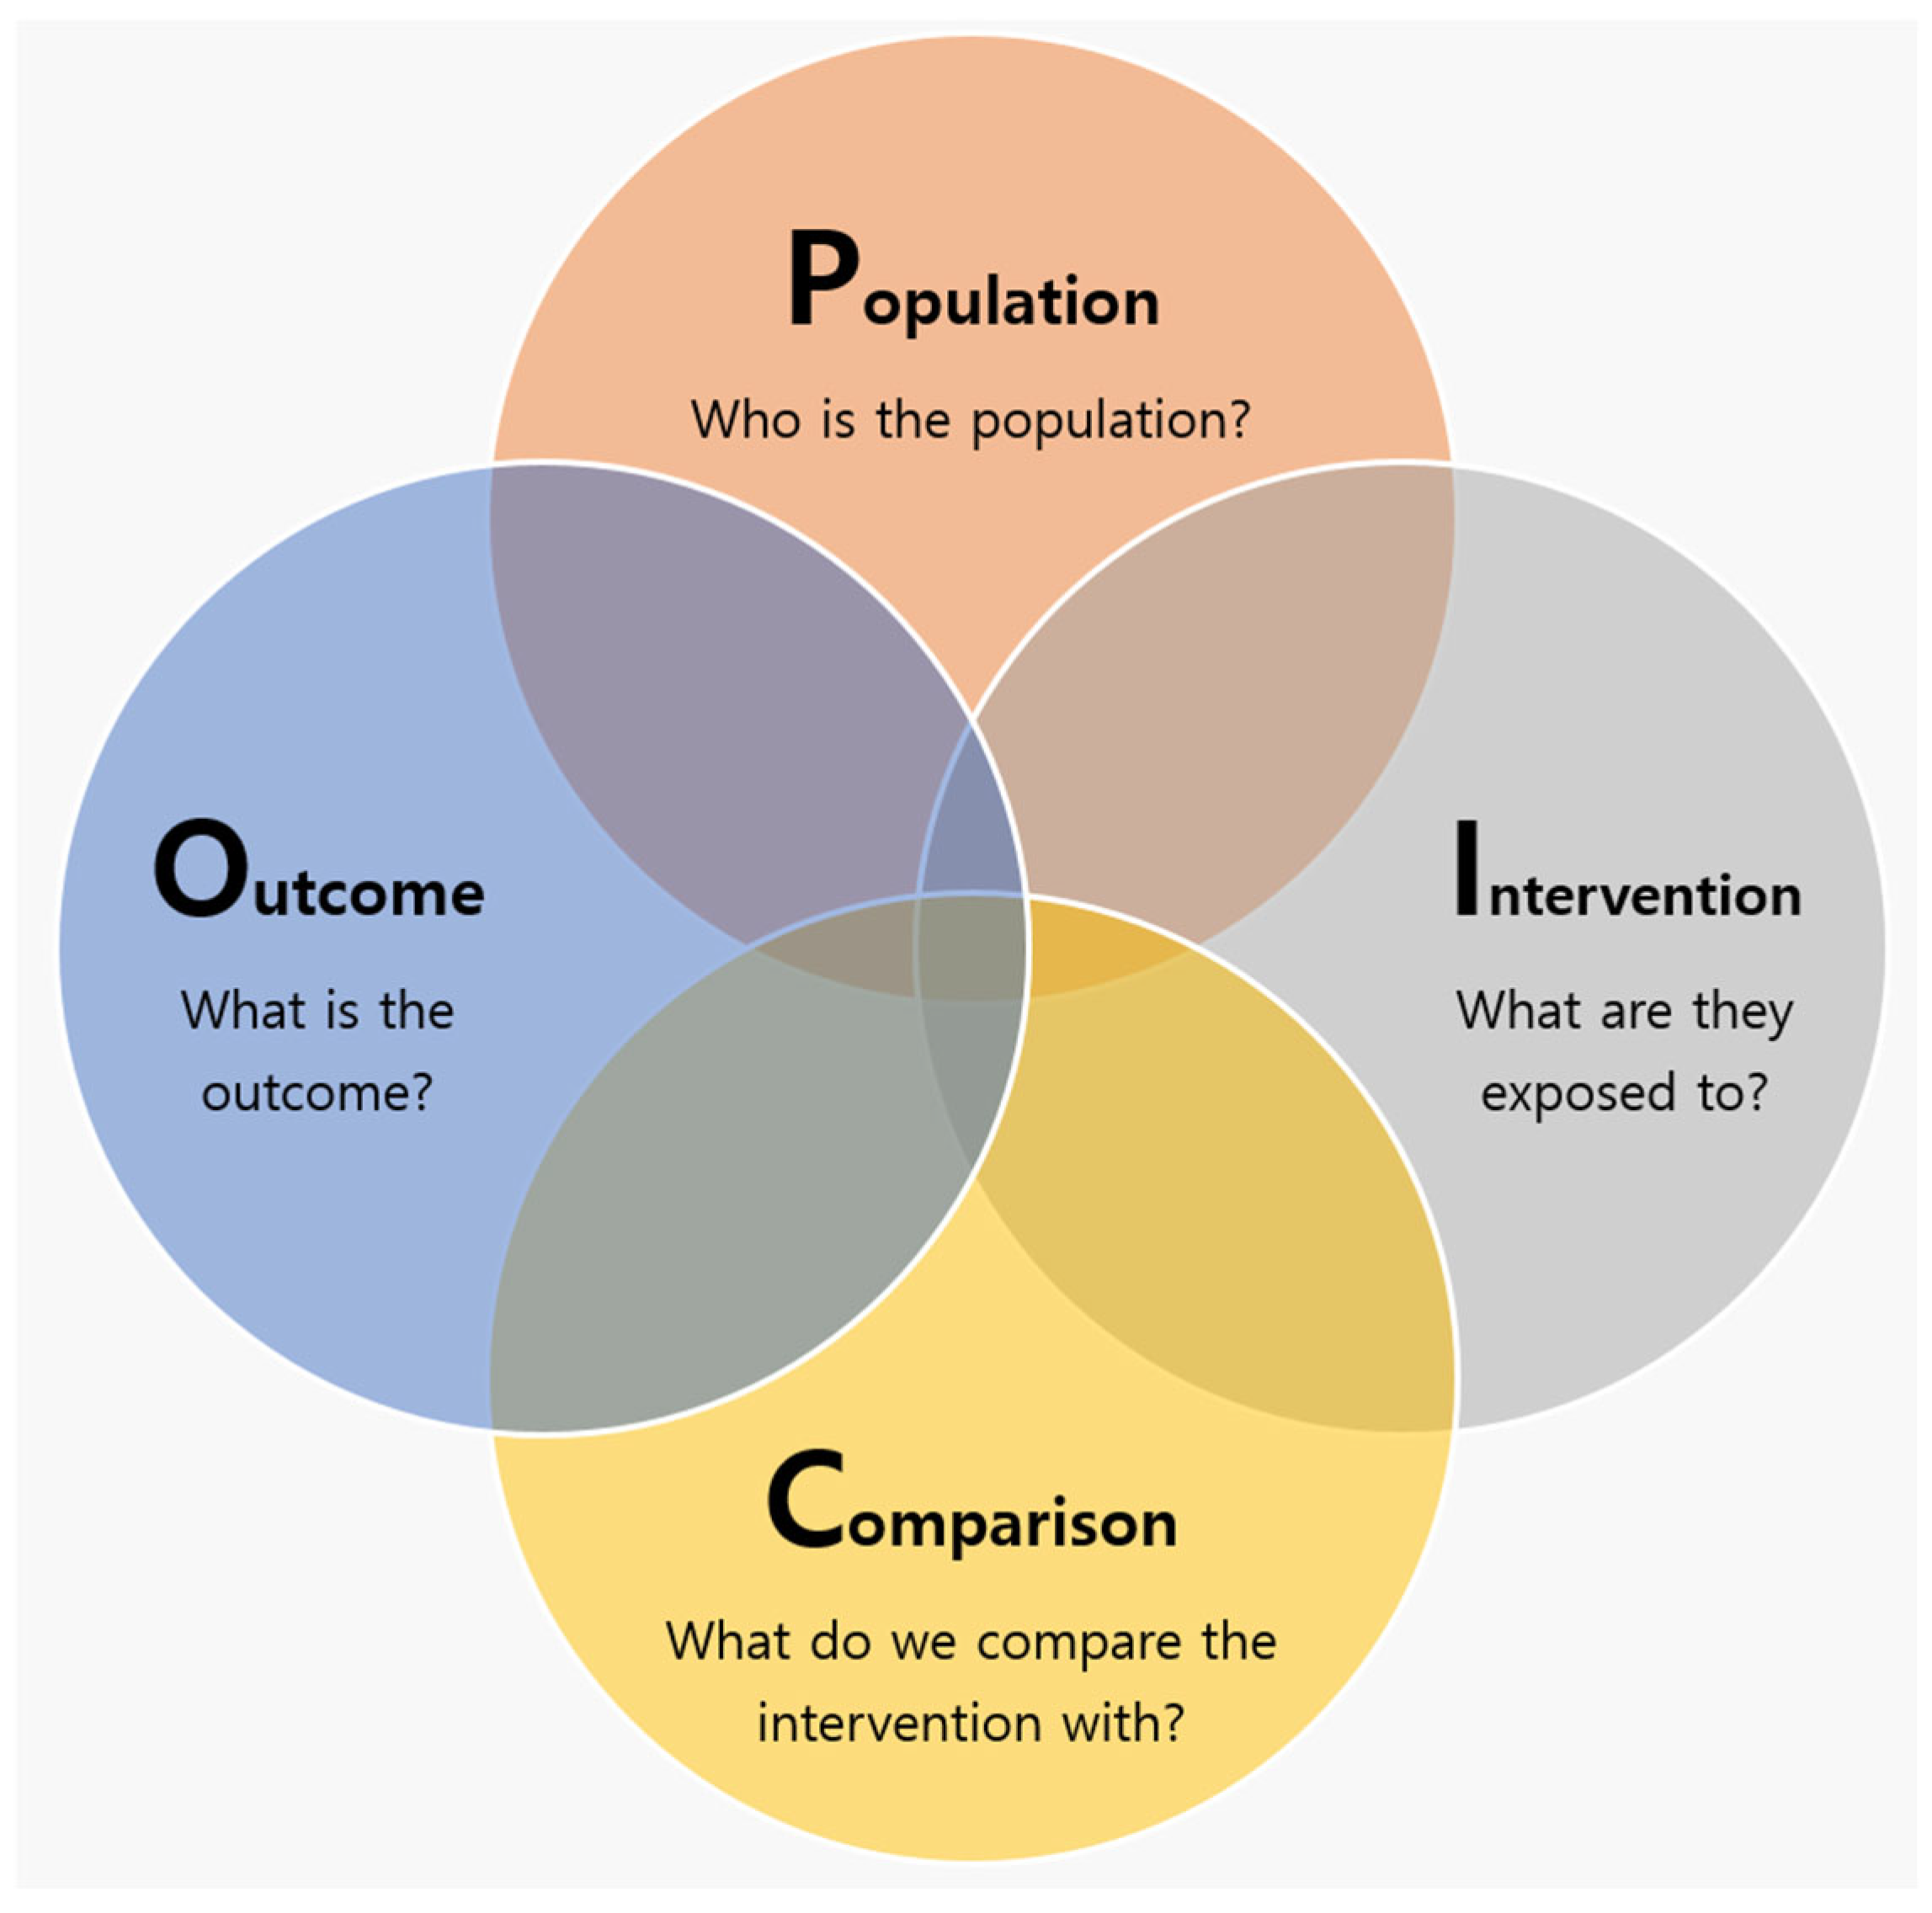
A systematic review (SR) is a powerful research method that systematically evaluates and analyzes all relevant studies on a specific research topic to draw comprehensive conclusions [1]. The SR method is widely used in various fields, including medicine, public health, nursing, and even business decision making, to provide reliable evidence [2]. In particular, it is a research design mainly used when creating treatment guidelines to provide evidence-based medicine (EBM) for comprehensive decision making in the medical field. SRs initially construct the population, intervention, comparison, and outcome (PICO) elements to define a research question and search for literature that matches the research topic (Figure 1). The well-formulated question increases the likelihood that practitioners can approach clinical problems in the right way and find accurate answers [3].

Figure 1.
PICO elements in the systematic review for defining a research question.
However, in a traditional SR, the PICO have relied on researcher expertise discretion. This arbitrary literature search strategy can reduce the clarity of the research question and lead to the loss of research direction. It can also lead to difficulties in interpreting research results and increase the risk of drawing incorrect conclusions. When establishing a literature search strategy in recently published SR studies [4,5] in high-quality scientific journals, there was difficulty in selecting the disease because the PICO were selected arbitrarily based on the researcher’s expertise rather than prior research data. In addition, if the intervention (or exposure) is clearly defined but there are many previous studies on comparison or outcome according to the exposure, the specification may be unclear. At this time, the scope of the research topic is broadened, resulting in errors where the outcomes of the selected studies are mixed. Of course, researchers can manually screen all of these, but this is inefficient and may not be the optimal literature search strategy.
To solve these issues, we conducted a text network analysis (TNA) to analyze the relationships between keywords [6]. By conducting a TNA before an SR, more specific PICO elements can be defined by identifying the keyword frequencies or relationships between keywords related to the research topic. This leads to establishing a systematic literature search strategy, reduces the potential for biased conclusions, and enhances the reliability of research results.
Some studies are using TNAs, but these are SR studies only. The studies of Daraio et al. [7] and Nepomuceno et al. [8] are bibliometric analysis software or bibliometric analysis studies, and Carvalho and Costa [9] have the only SR paper using text mining in public security. Also, Satarova et al. [10] wrote an SR for knowledge organization and modeling human action. Our study is different in that it proposes a methodology for establishing a literature search strategy for SRs.
Commonly used TNA tools include NetMiner [11] and Bibliometrix [12]. NetMiner ver. 4.0 is a commercial software offering a GUI-based approach, and Bibliometrix is the R package providing an interface using R Shiny. These tools are primarily used in social sciences and are useful for beginners in analysis. However, using the R language allows us to define user functions directly and provides much freedom in visualizing desired results in various ways. In healthcare and medical science research, there are cases where a TNA was applied directly using the R language to perform customized analysis and high-level analysis [13,14,15] that fit the research purpose. Due to these advantages, we aim to provide a well-founded basis for establishing a literature search strategy for SRs by directly conducting a TNA through data preprocessing, structuring, and visualization using the R language.
2. Materials and Methods
2.1. Data Collection
2.1.1. Setting a Research Topic
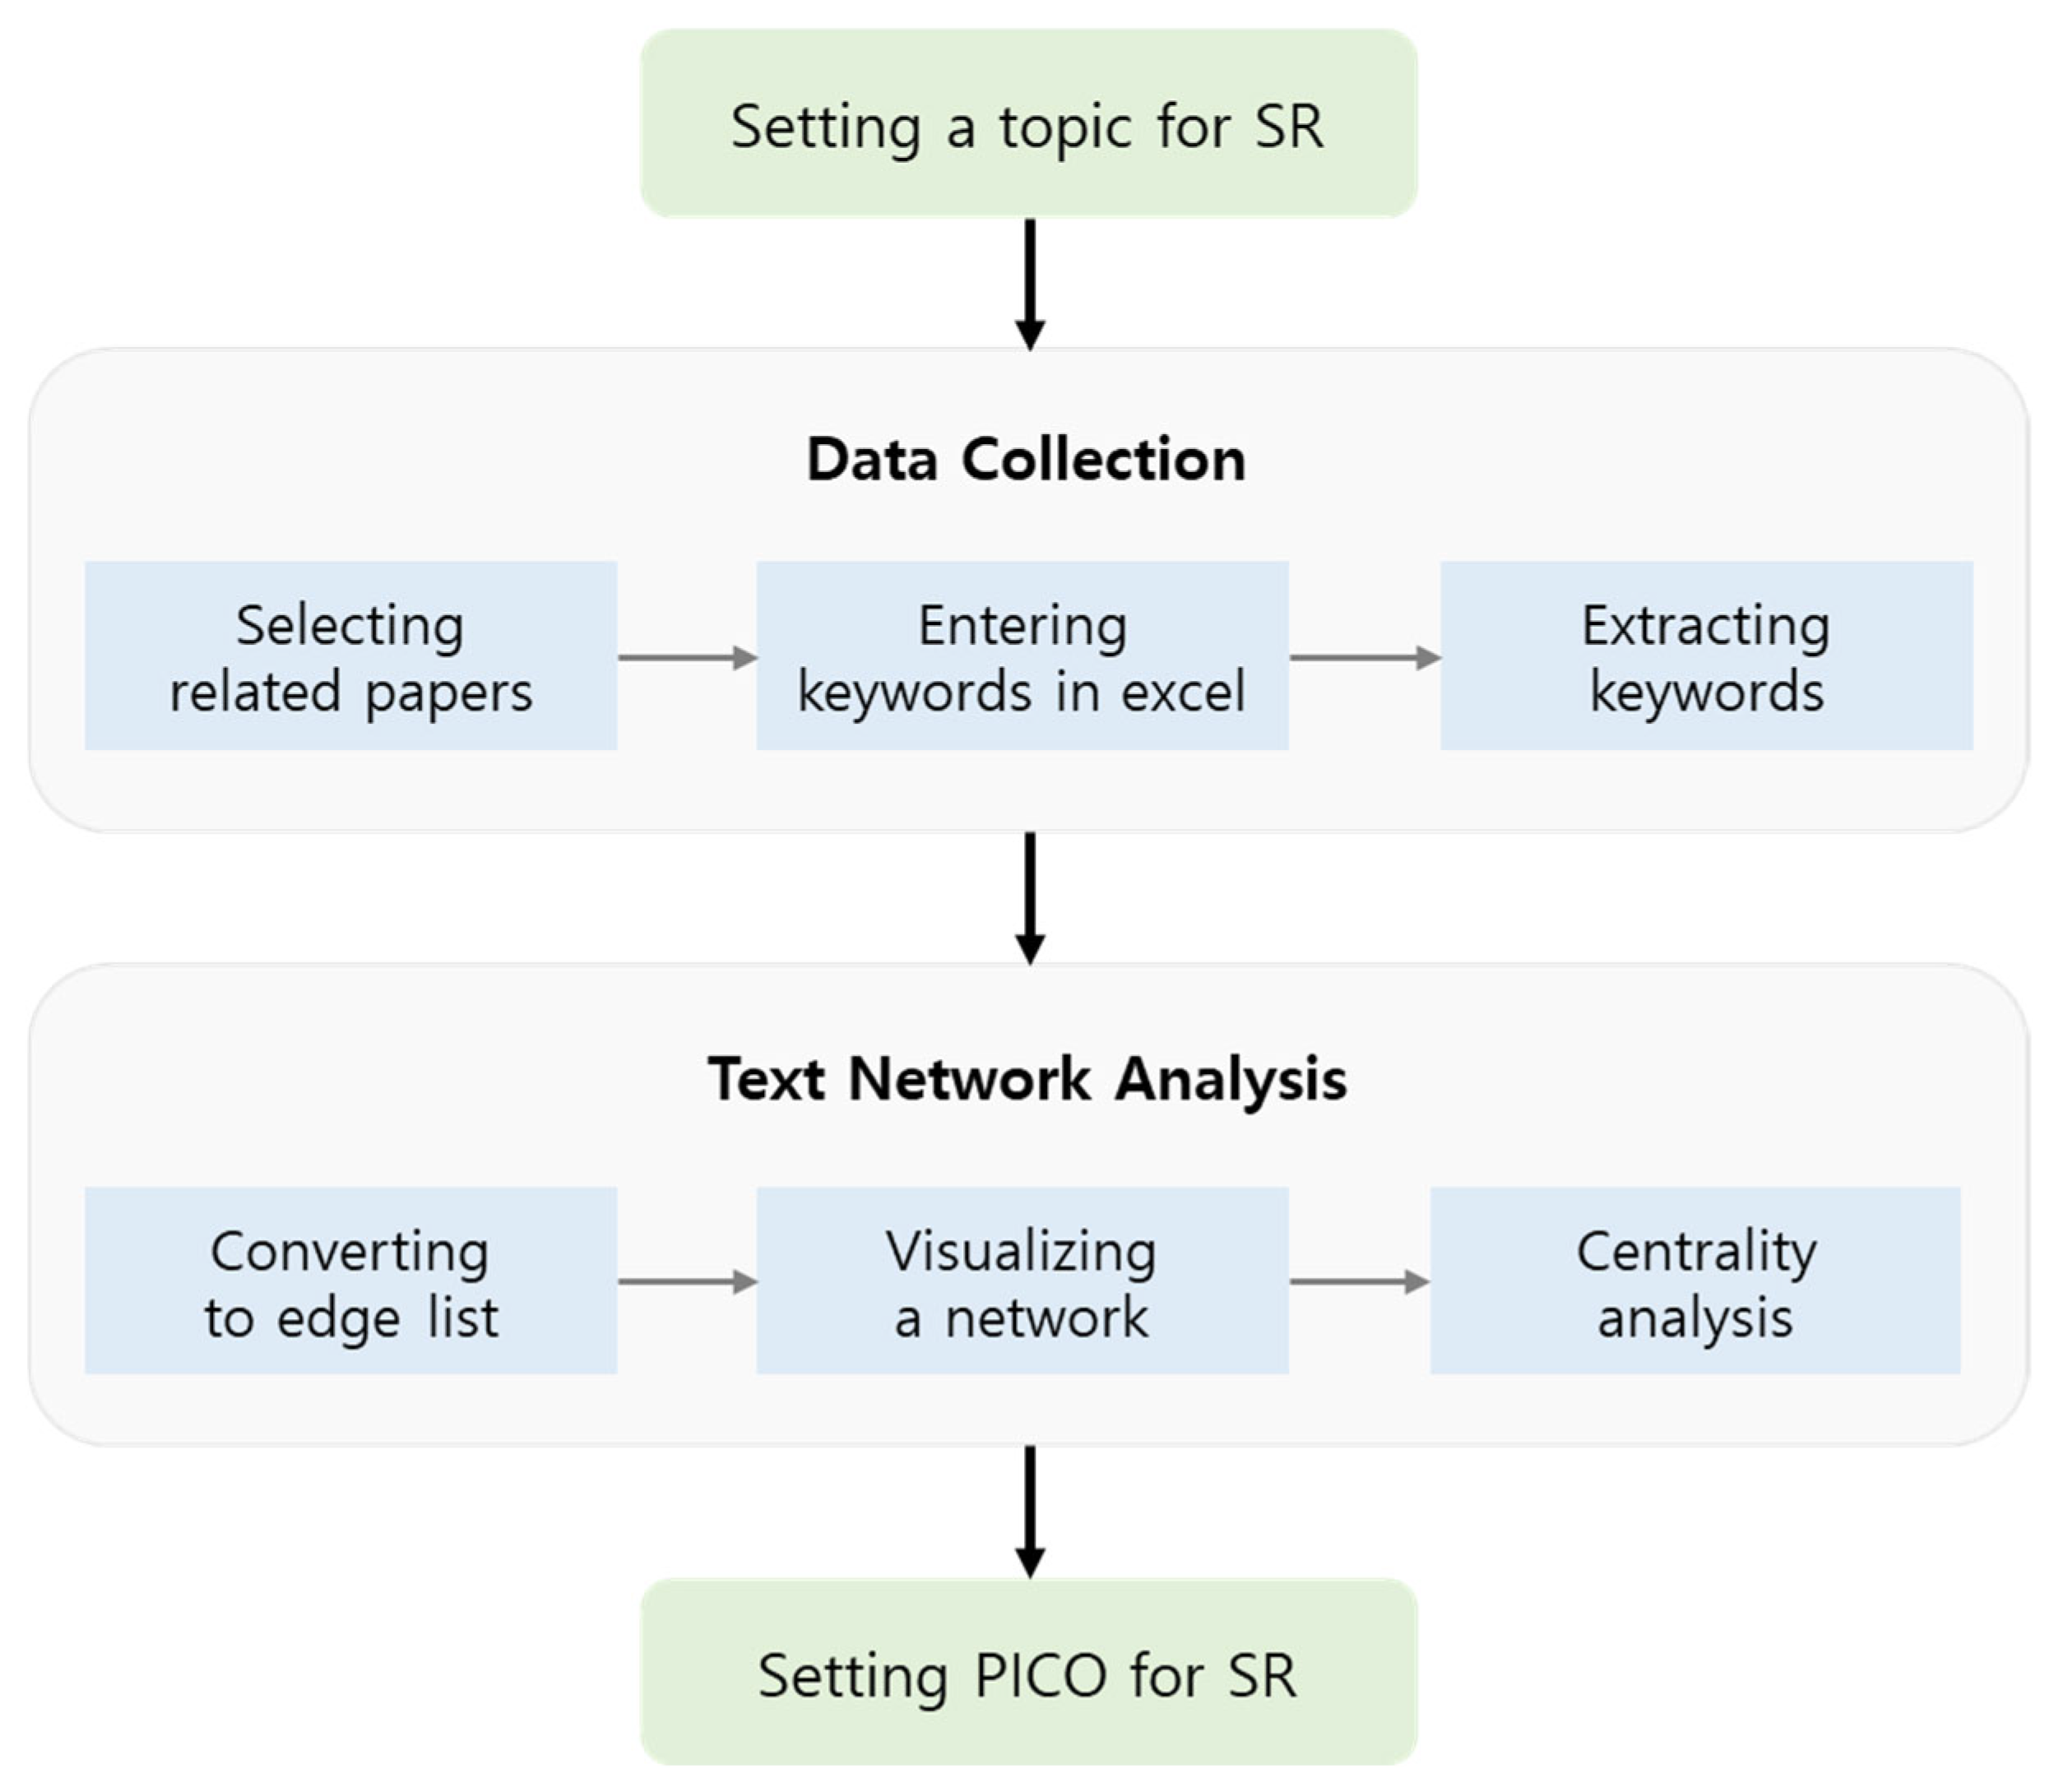
The overall framework of the data-driven literature search strategy is shown in Figure 2. After setting the research topic, a data-driven search strategy for an SR is established through data collection and preprocessing and a TNA. Firstly, we selected ‘Health Impact Assessment of arsenic exposure’ as an example of a TNA for an SR. Arsenic is widely distributed throughout the environment, including air, water, and land. Especially, exposure to inorganic arsenic is known to be highly toxic. The World Health Organization (WHO) estimates that approximately 140 million people worldwide consume drinking water contaminated with arsenic levels exceeding the recommended guideline of 10 micrograms per liter [16]. Long-term exposure to inorganic arsenic through contaminated drinking water can lead to skin hyperpigmentation, skin lesions, and keratosis, which can be precursors to skin cancer [17]. Additionally, numerous studies have demonstrated that arsenic exposure poses risks to maternal or fetal health and can have detrimental effects on cognitive development, intelligence, and memory [18,19,20].
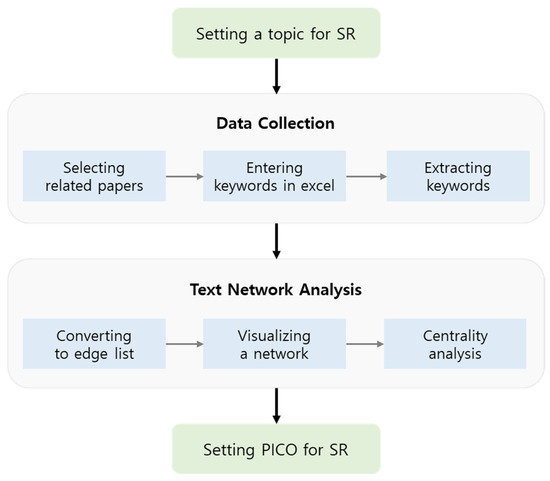
Figure 2.
Data-driven search strategy for systematic review.
2.1.2. Data Sources and Search Strategy
To search for relevant literature, we utilized PubMed, a medical bibliographic information database, the most reputable healthcare and medical science source [21]. PubMed allows users to search papers based on specific topics, authors, publication dates, etc., and quickly find the information they want by filtering the search results in detail. PubMed’s literature search query is constructed using Boolean operators and a combination (OR) of controlled terminology and text words that are commonly used standards. In the medical field, because a single disease is written in a variety of general terms, to avoid such confusion, standard medical terms and free text terms are used at the same time when writing a search query for papers. The standard medical terms used in PubMed are given the ‘[MeSH]’ (Medical Subject Headings) field code, and the general terms are given the ‘[tiab]’ field code. The ‘[tiab]’ code searches for words included in the title and abstract. This is a more correct search method than searching with several non-standardized general terms. For instance, to search for arsenic-related literature, we can combine the controlled term ‘Arsenic [Mesh]’ and the text words ‘Arsenic [tiab]’. In this case, the medical term and general term are the same. In addition, to filter only SR literature for an umbrella review [22], arsenic-related concepts previously written are enclosed in parentheses and then written as the intersection (AND) with ‘systematicreview [Filter]’. As a result of the search using the query, 212 papers were retrieved (Table 1). A total of 80 papers were selected by reading the titles and abstracts of each paper and selecting only those directly related to the topic. In this way, a search strategy can initially be established using keywords composed only of the researcher’s expertise, and in the next step, major keywords are extracted through manual selection.

Table 1.
Relevant information for collecting papers and number of papers searched.
2.1.3. Keywords Extraction
We extracted keywords from the selected papers and entered them row-by-row for each article in Excel. After improving the accuracy of the TNA, the following procedure was used for keywords. First, we removed ‘arsenic’ keywords, as it may be duplicated in all studies since the study aims to investigate the health effects of arsenic exposure. Second, other heavy metals (cadmium, lead, and mercury) were also removed when they were set as duplicates for heavy metal exposure since they are not relevant. Third, research methodologies (clinical trial, systematic review, and meta-analysis) that were not directly related to health effects were removed. Lastly, words used with the same meaning, such as ‘cancer risk’ and ‘cancer,’ were integrated into one word like ‘cancer’. As a result of this process, the number of keywords was reduced to 133 (without duplicates) (Table 2).
Table 2.
Example of data consisting of extracted keywords for each paper.
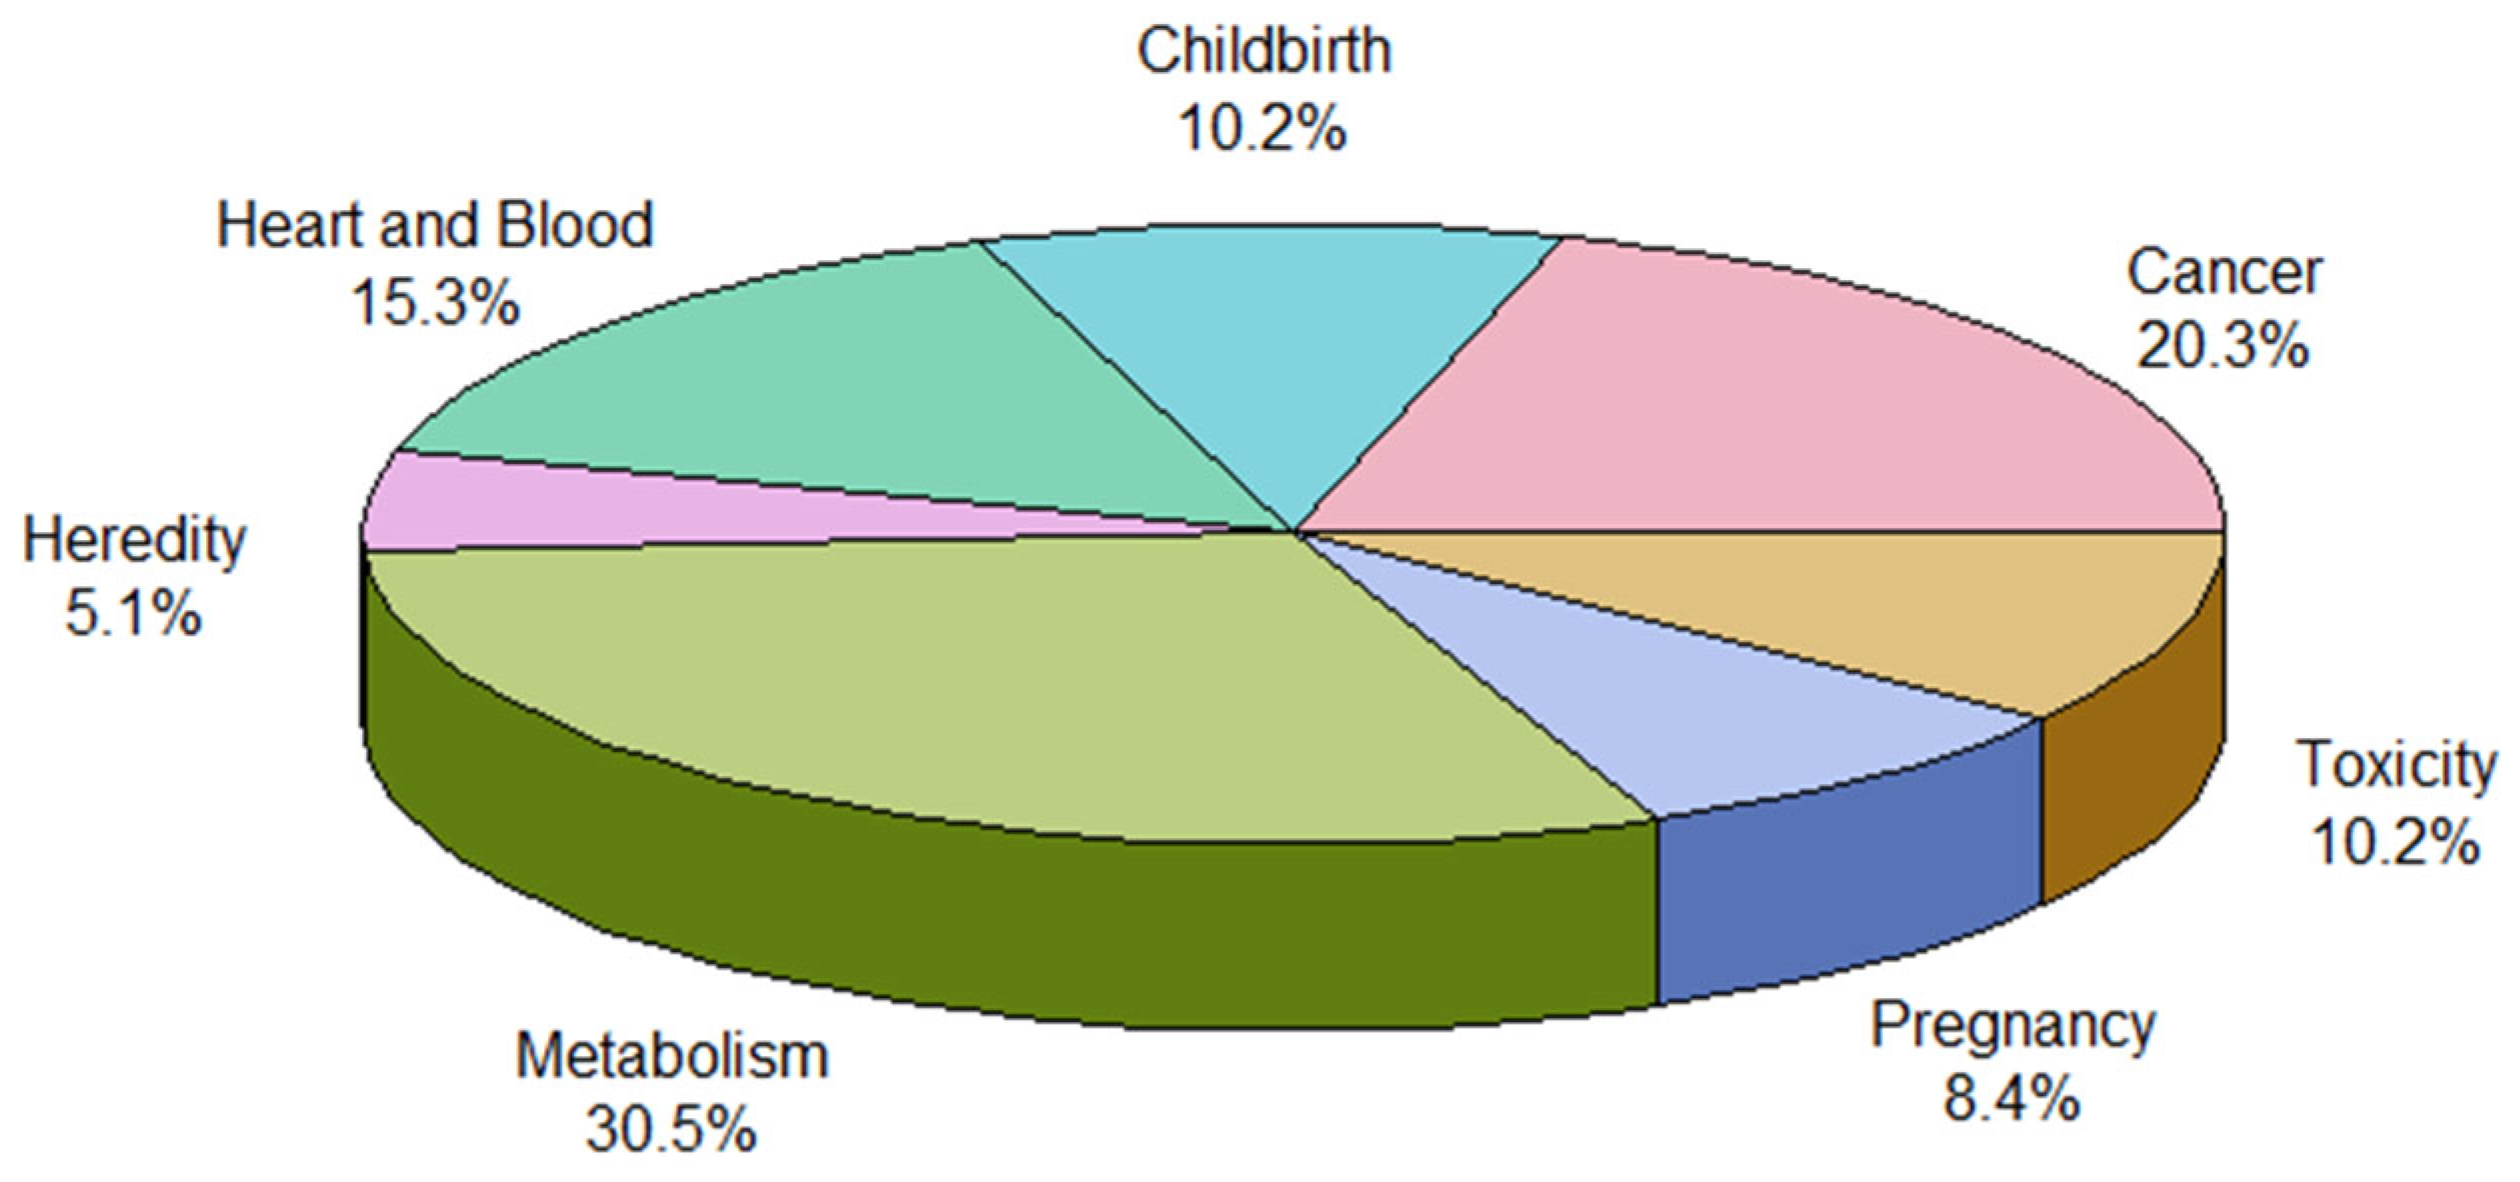
Additionally, there is a need to further structure keywords into disease-oriented groups. We removed minor keywords with relatively low connectivity and not belonging to the disease group category (e.g., country names, rural health, and community). As a result, the total number was reduced to 59 (Table 3). We created a new dataframe with a ‘Keywords’ and a ‘Group’ column to group the disease for each keyword into seven categories: childbirth, pregnancy, heredity, cancer, heart and blood, toxicity, and metabolism. Childbirth-related diseases were defined as those that can occur in the fetus, while Pregnancy-related diseases were defined as those that can occur in the mother. The distribution of frequencies by each disease group is shown in a pie chart (Figure 3). Metabolic diseases account for the largest proportion, approximately 31%, followed by cancer diseases (20%) and heart and blood diseases (15%).
Table 3.
Grouped data into 7 disease categories for each keyword.
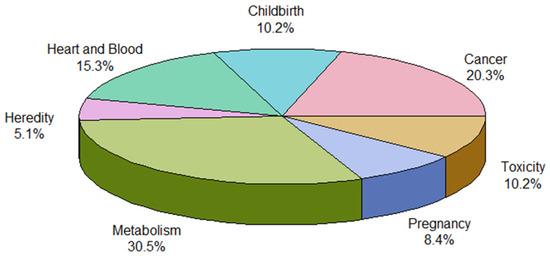
Figure 3.
Pie chart for 7 disease categories.
2.2. Text Network Analysis
2.2.1. Edge List for Network
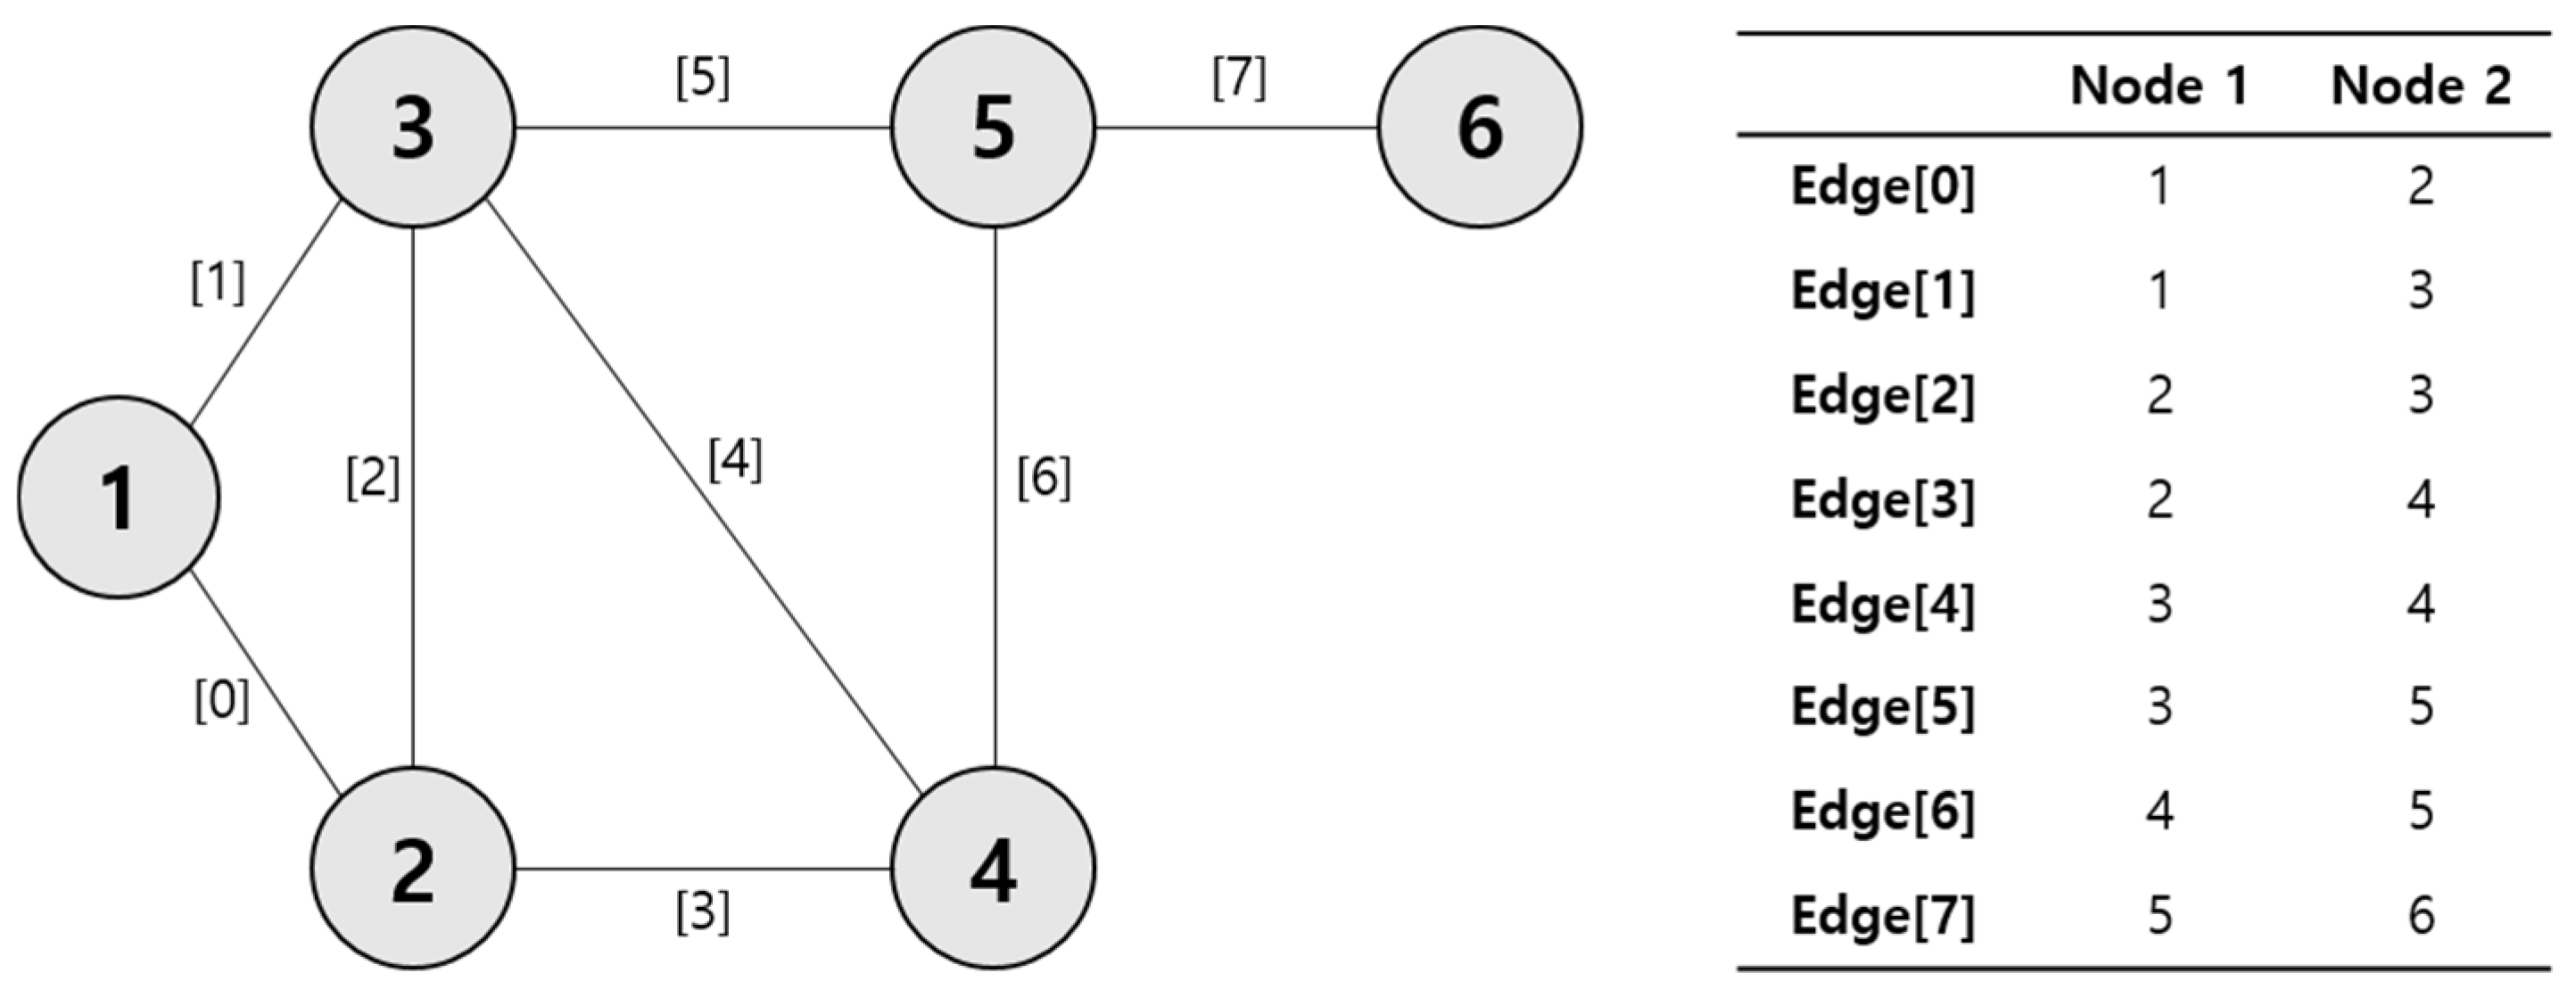
An edge list is one of the data structures used in graph theory [23], and it represents the edges of a graph in list form. Each edge is represented by its endpoints (nodes) and may include information such as weight and direction. Although there are structures for storing network data in the form of adjacency lists and adjacency matrices [24], edge lists are useful when the graph is sparse and have the advantage of it being easy to add and remove edges and requiring less memory usage. Nodes in the network are represented by circles, and edges are represented by lines connecting nodes (Figure 4). The table on the right of Figure 4 shows the node numbers of the two nodes connected by each edge in order. We ignored the order of the nodes because the network did not consider directionality or weight. In this way, we need to create an edge list of the network of the main keywords for the TNA.
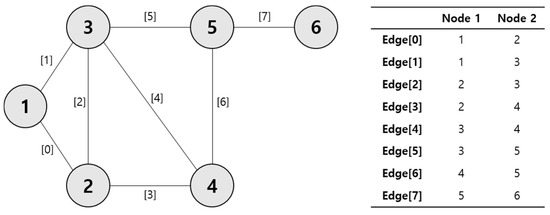
Figure 4.
Example of edge list structure according to network.
2.2.2. Creating and Visualizing a Network
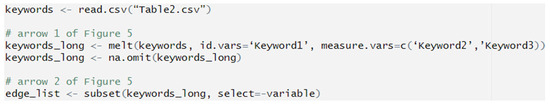
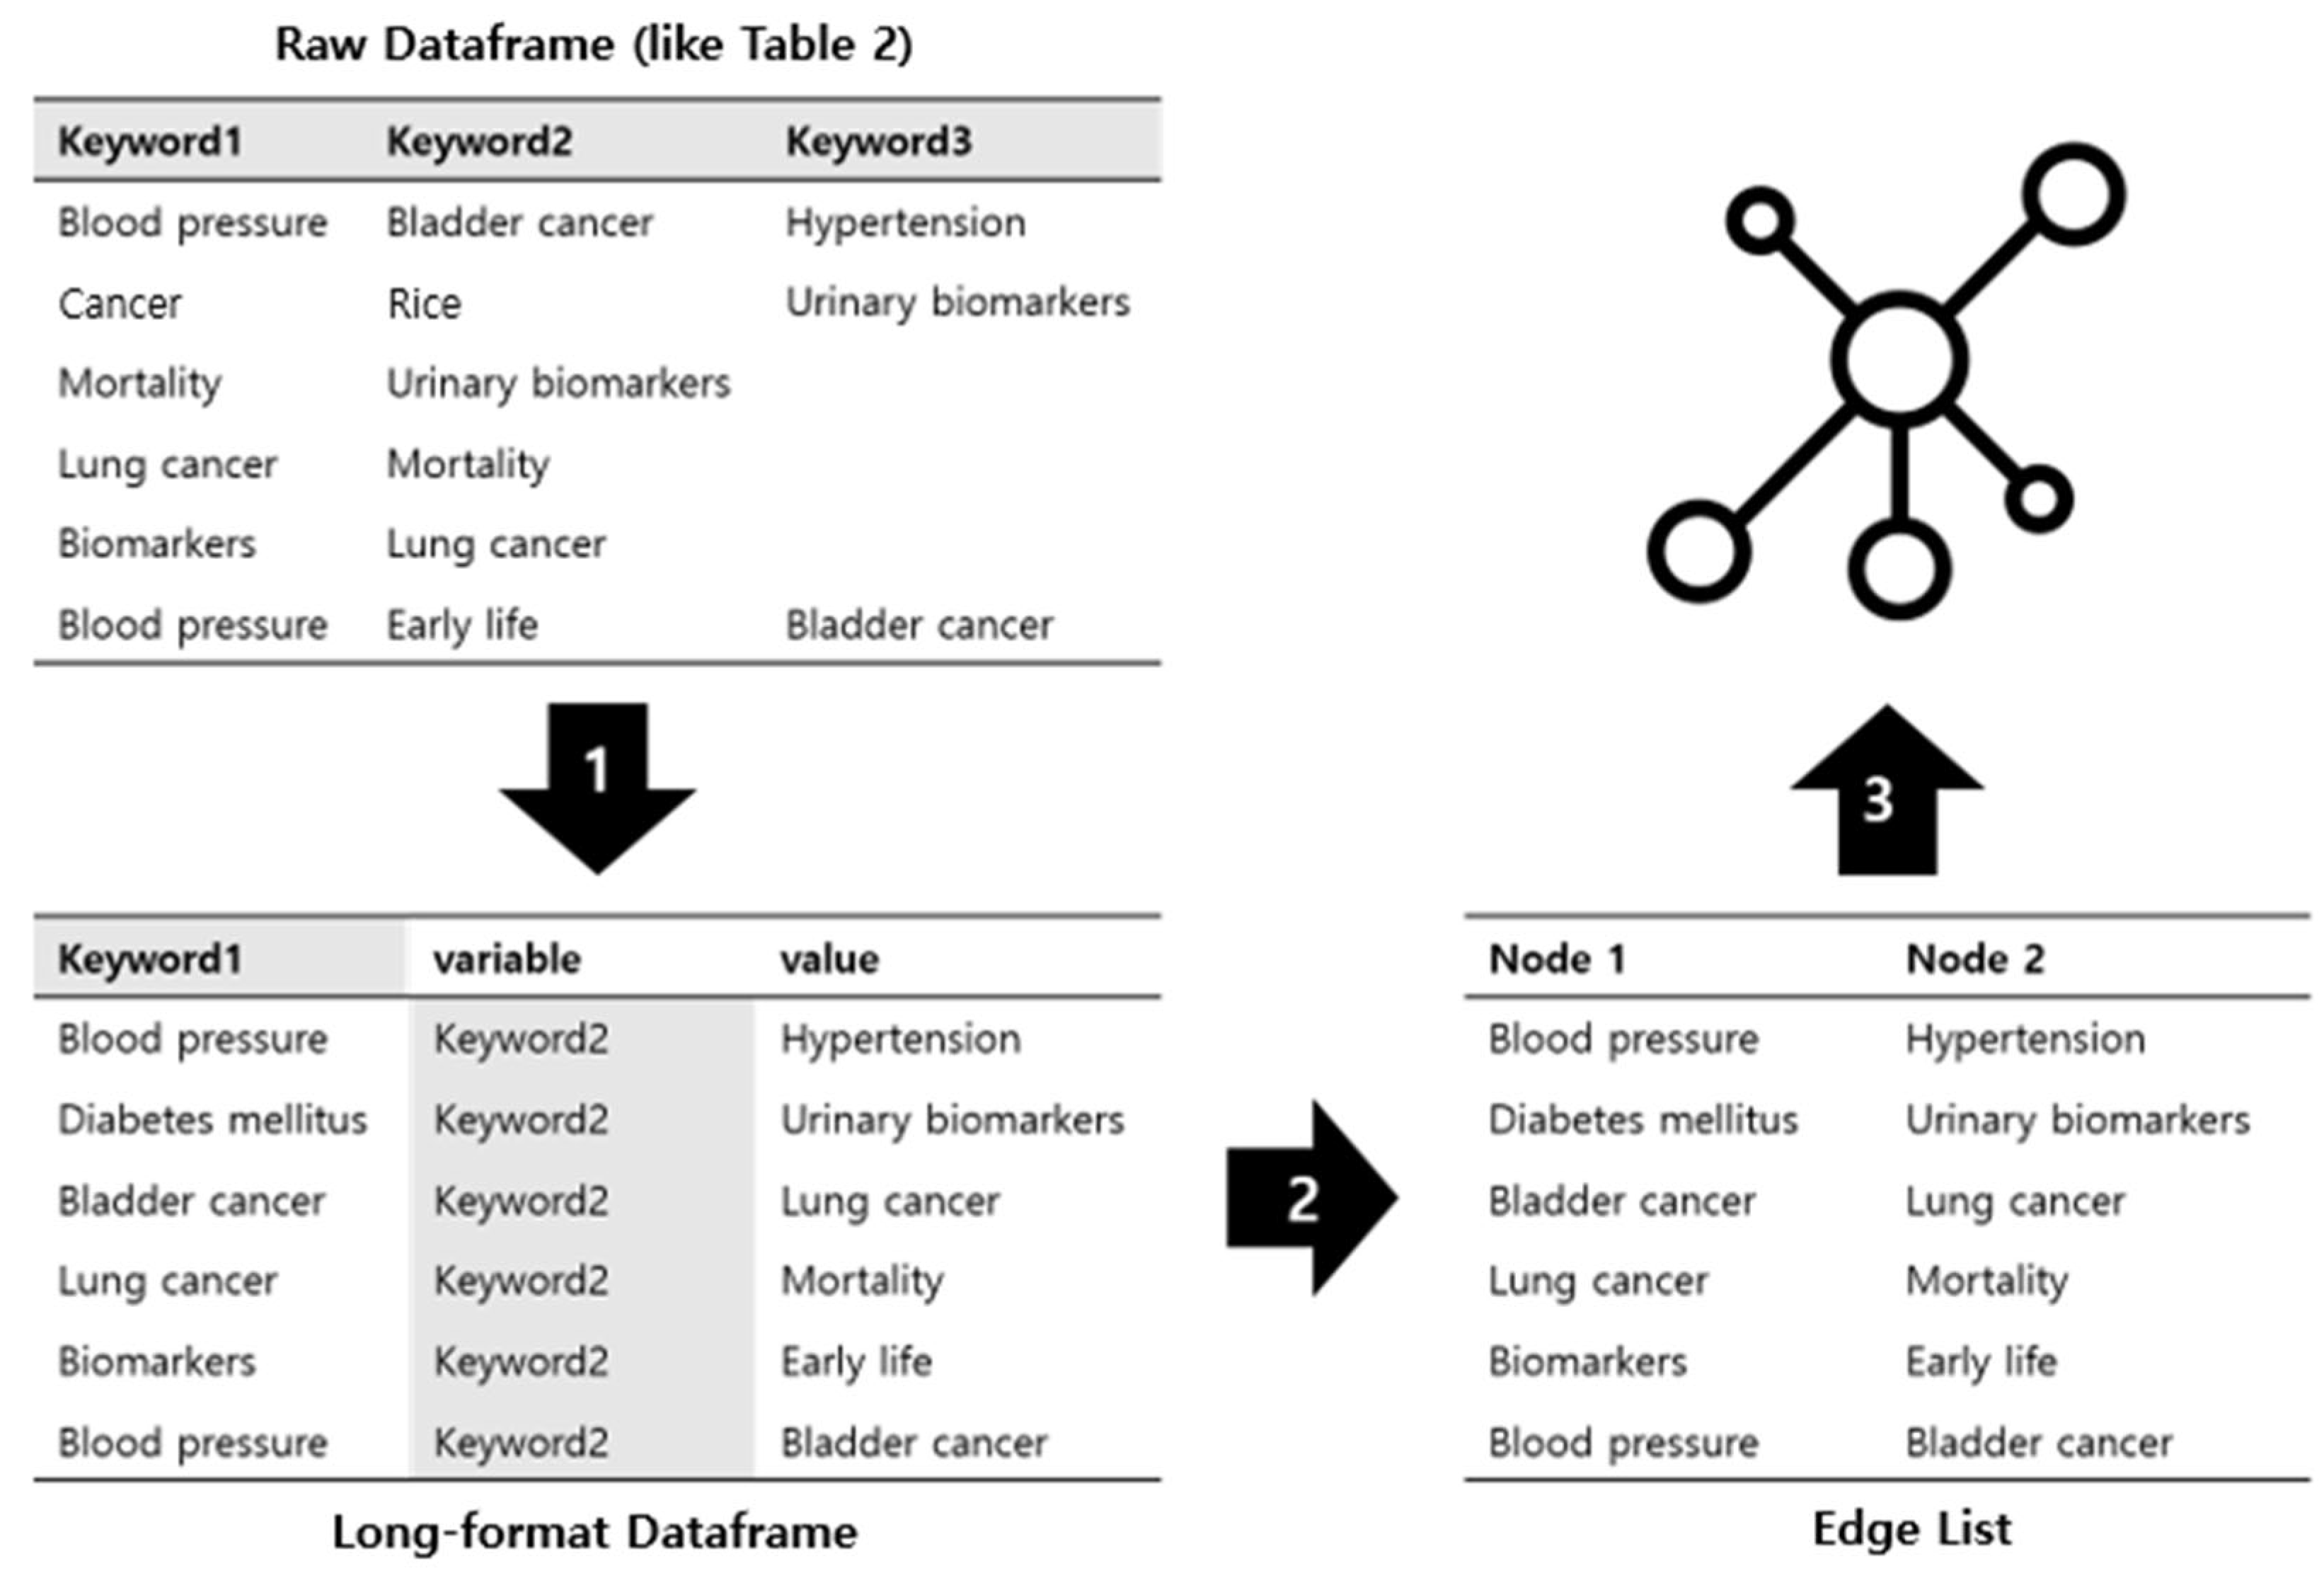
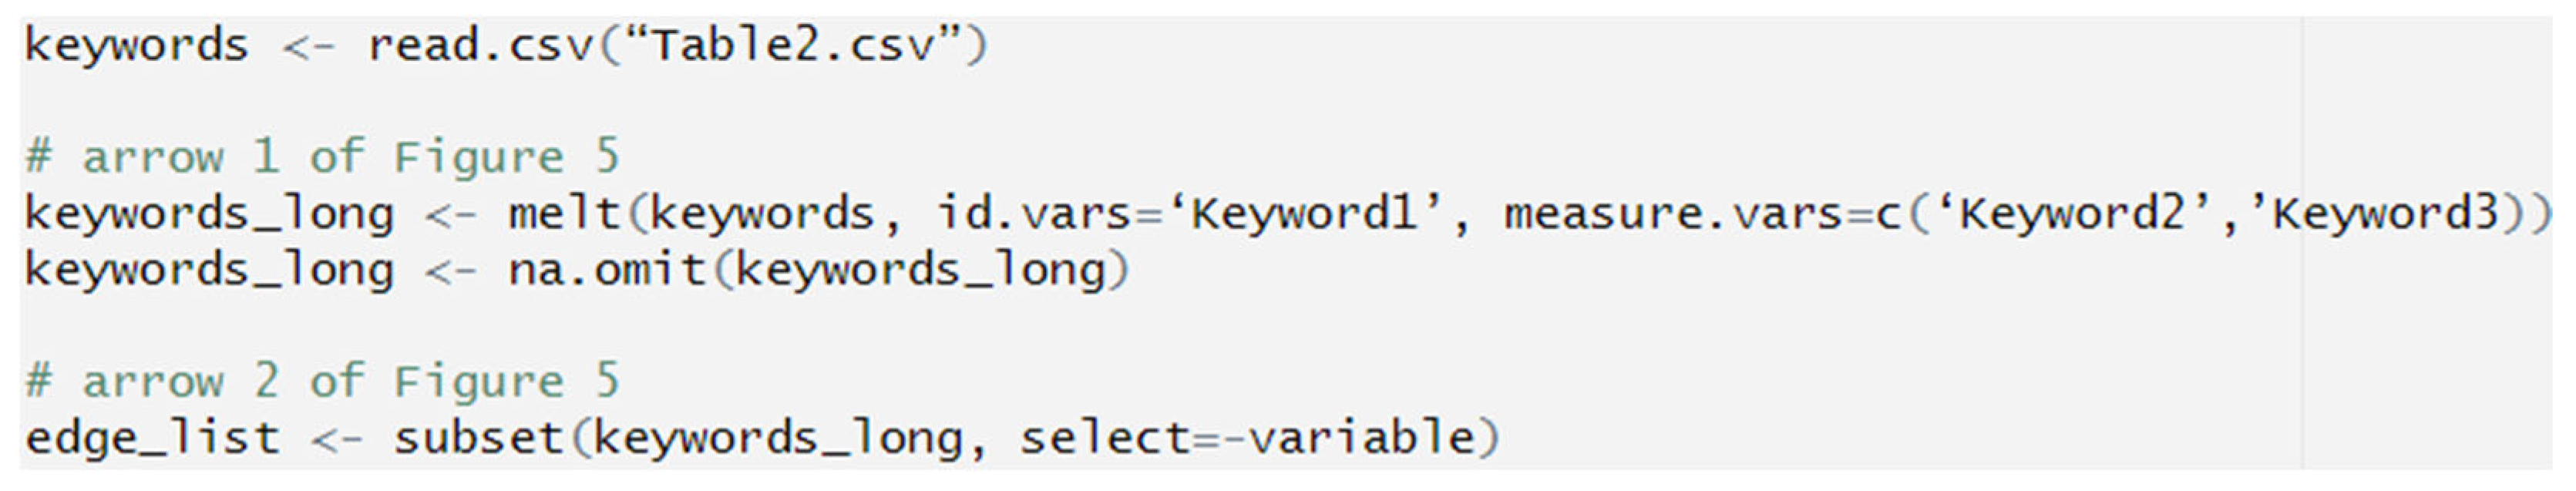
We provide the entire process in Figure 5 as R code in Figure 6 and Figure 7. First, we use the ‘melt’ function from the reshape2 package [25] provided in the R language to generate the edge list. This function is useful for restructuring a dataframe and can convert a dataframe from wide to long format. As a result, we obtain a dataframe where each row is represented as a pair of variables and values. The result of converting the dataframe format from wide to long can be seen in arrow 1 of Figure 5. The ‘id.vars’ argument in the ‘melt’ function specifies the variable to be used as the basis, and the ‘measure.vars’ argument specifies the names of all remaining target variables. We repeat this process for each column of the wide-form dataframe and combine them all. The corresponding row is removed if there is NA in the id or measure. In arrow 2 of Figure 5, the variable column is removed using the ‘subset’ function to create the edge list format (same as the table in Figure 4).

Figure 5.
Framework for converting raw data into structured data to create a network.
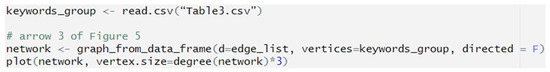
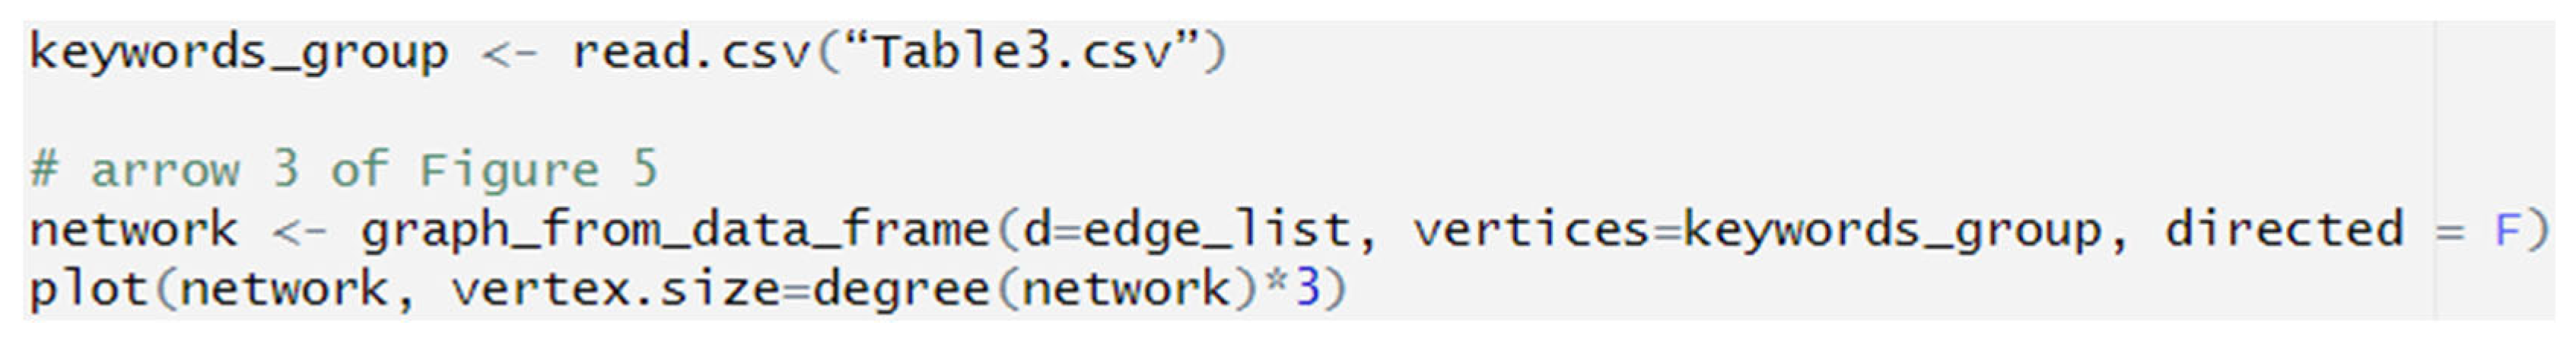
As shown in arrow 3 of Figure 5, after creating the edge list, the dataframe for the network is created. To create a network, we use the ‘graph_from_data_frame’ function within the igraph package in R [26]. Into the first argument ‘d’, we input the edge list created in the previous step, and in the second argument ‘vertices’, we input a dataframe containing vertices (nodes) information. Additionally, there is no directionality; we set the ‘directed’ argument to F (FALSE). The resulting network can be visualized using the ‘plot’ function. The vertex size was set to 3 times that value using the ‘degree’ function, and keywords with high connectivity were expressed as large. This makes it easy to compare the importance of each node. In addition, we can set the edge’s curve degree, width, color, etc., within the ‘plot’ function, and design the network by setting the node’s size, color, label color, etc.
2.2.3. Network Centrality Analysis
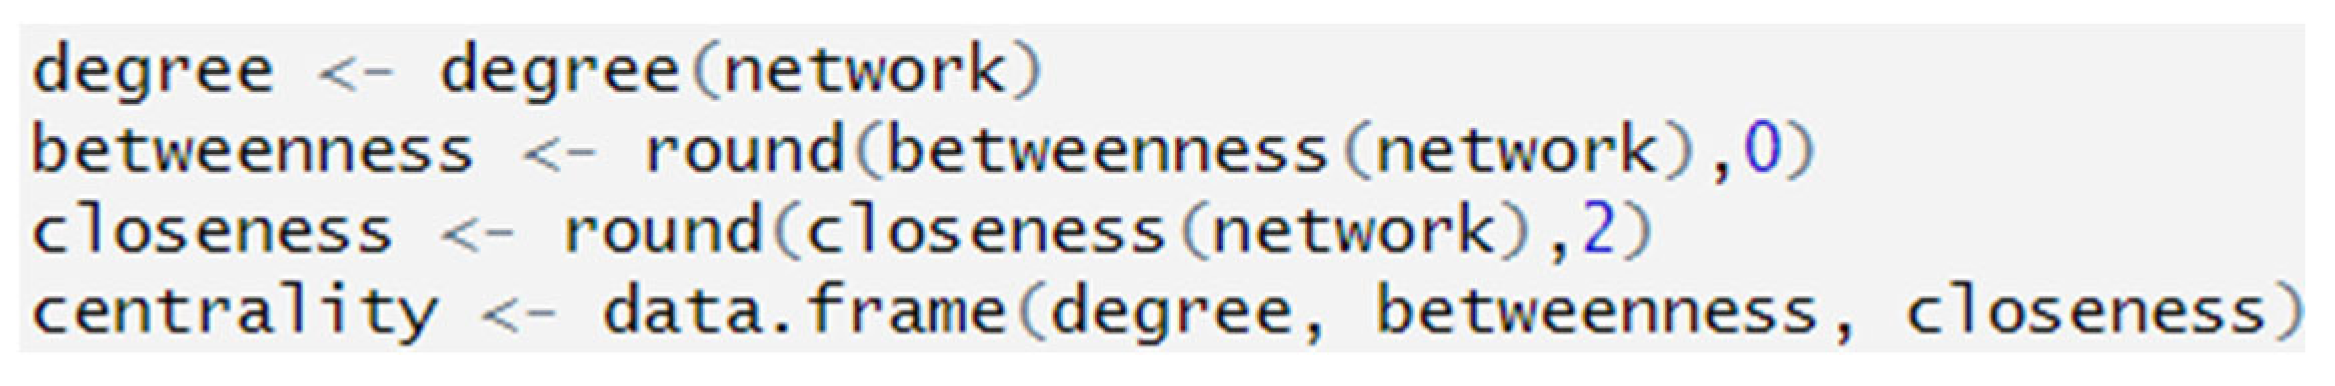
After network visualization, we performed centrality analysis using the R code shown in Figure 8. Degree centrality (DC) is based on the number of edges connected to each node, which is the degree, and indicates how many neighbors a node is directly connected to. Nodes with high DC are likely to play an important role in the network. Betweenness centrality (BC) indicates how often a node is located on the shortest path between other nodes. BC is used to identify the flow of information or the efficiency of communication within the network. The higher the value, the more likely it is to play an important role as an intermediary for information transmission within the network. Closeness centrality (CC) indicates how close a node is to the average shortest distance to all other nodes. CC represents how central a node is within the network. The higher the value, the more likely it is to interact with other nodes frequently or quickly [27]. These metrics can be used to identify important nodes in the network and understand their roles and influence. The following code calculates DC, BC, and CC and stores them in a dataframe. The ‘round’ function is set to consider readability by indicating the number of decimal places.
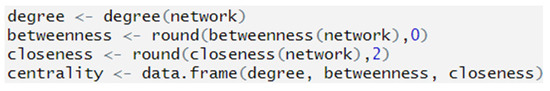
Figure 8.
R code to calculate centrality values through a network.
3. Results
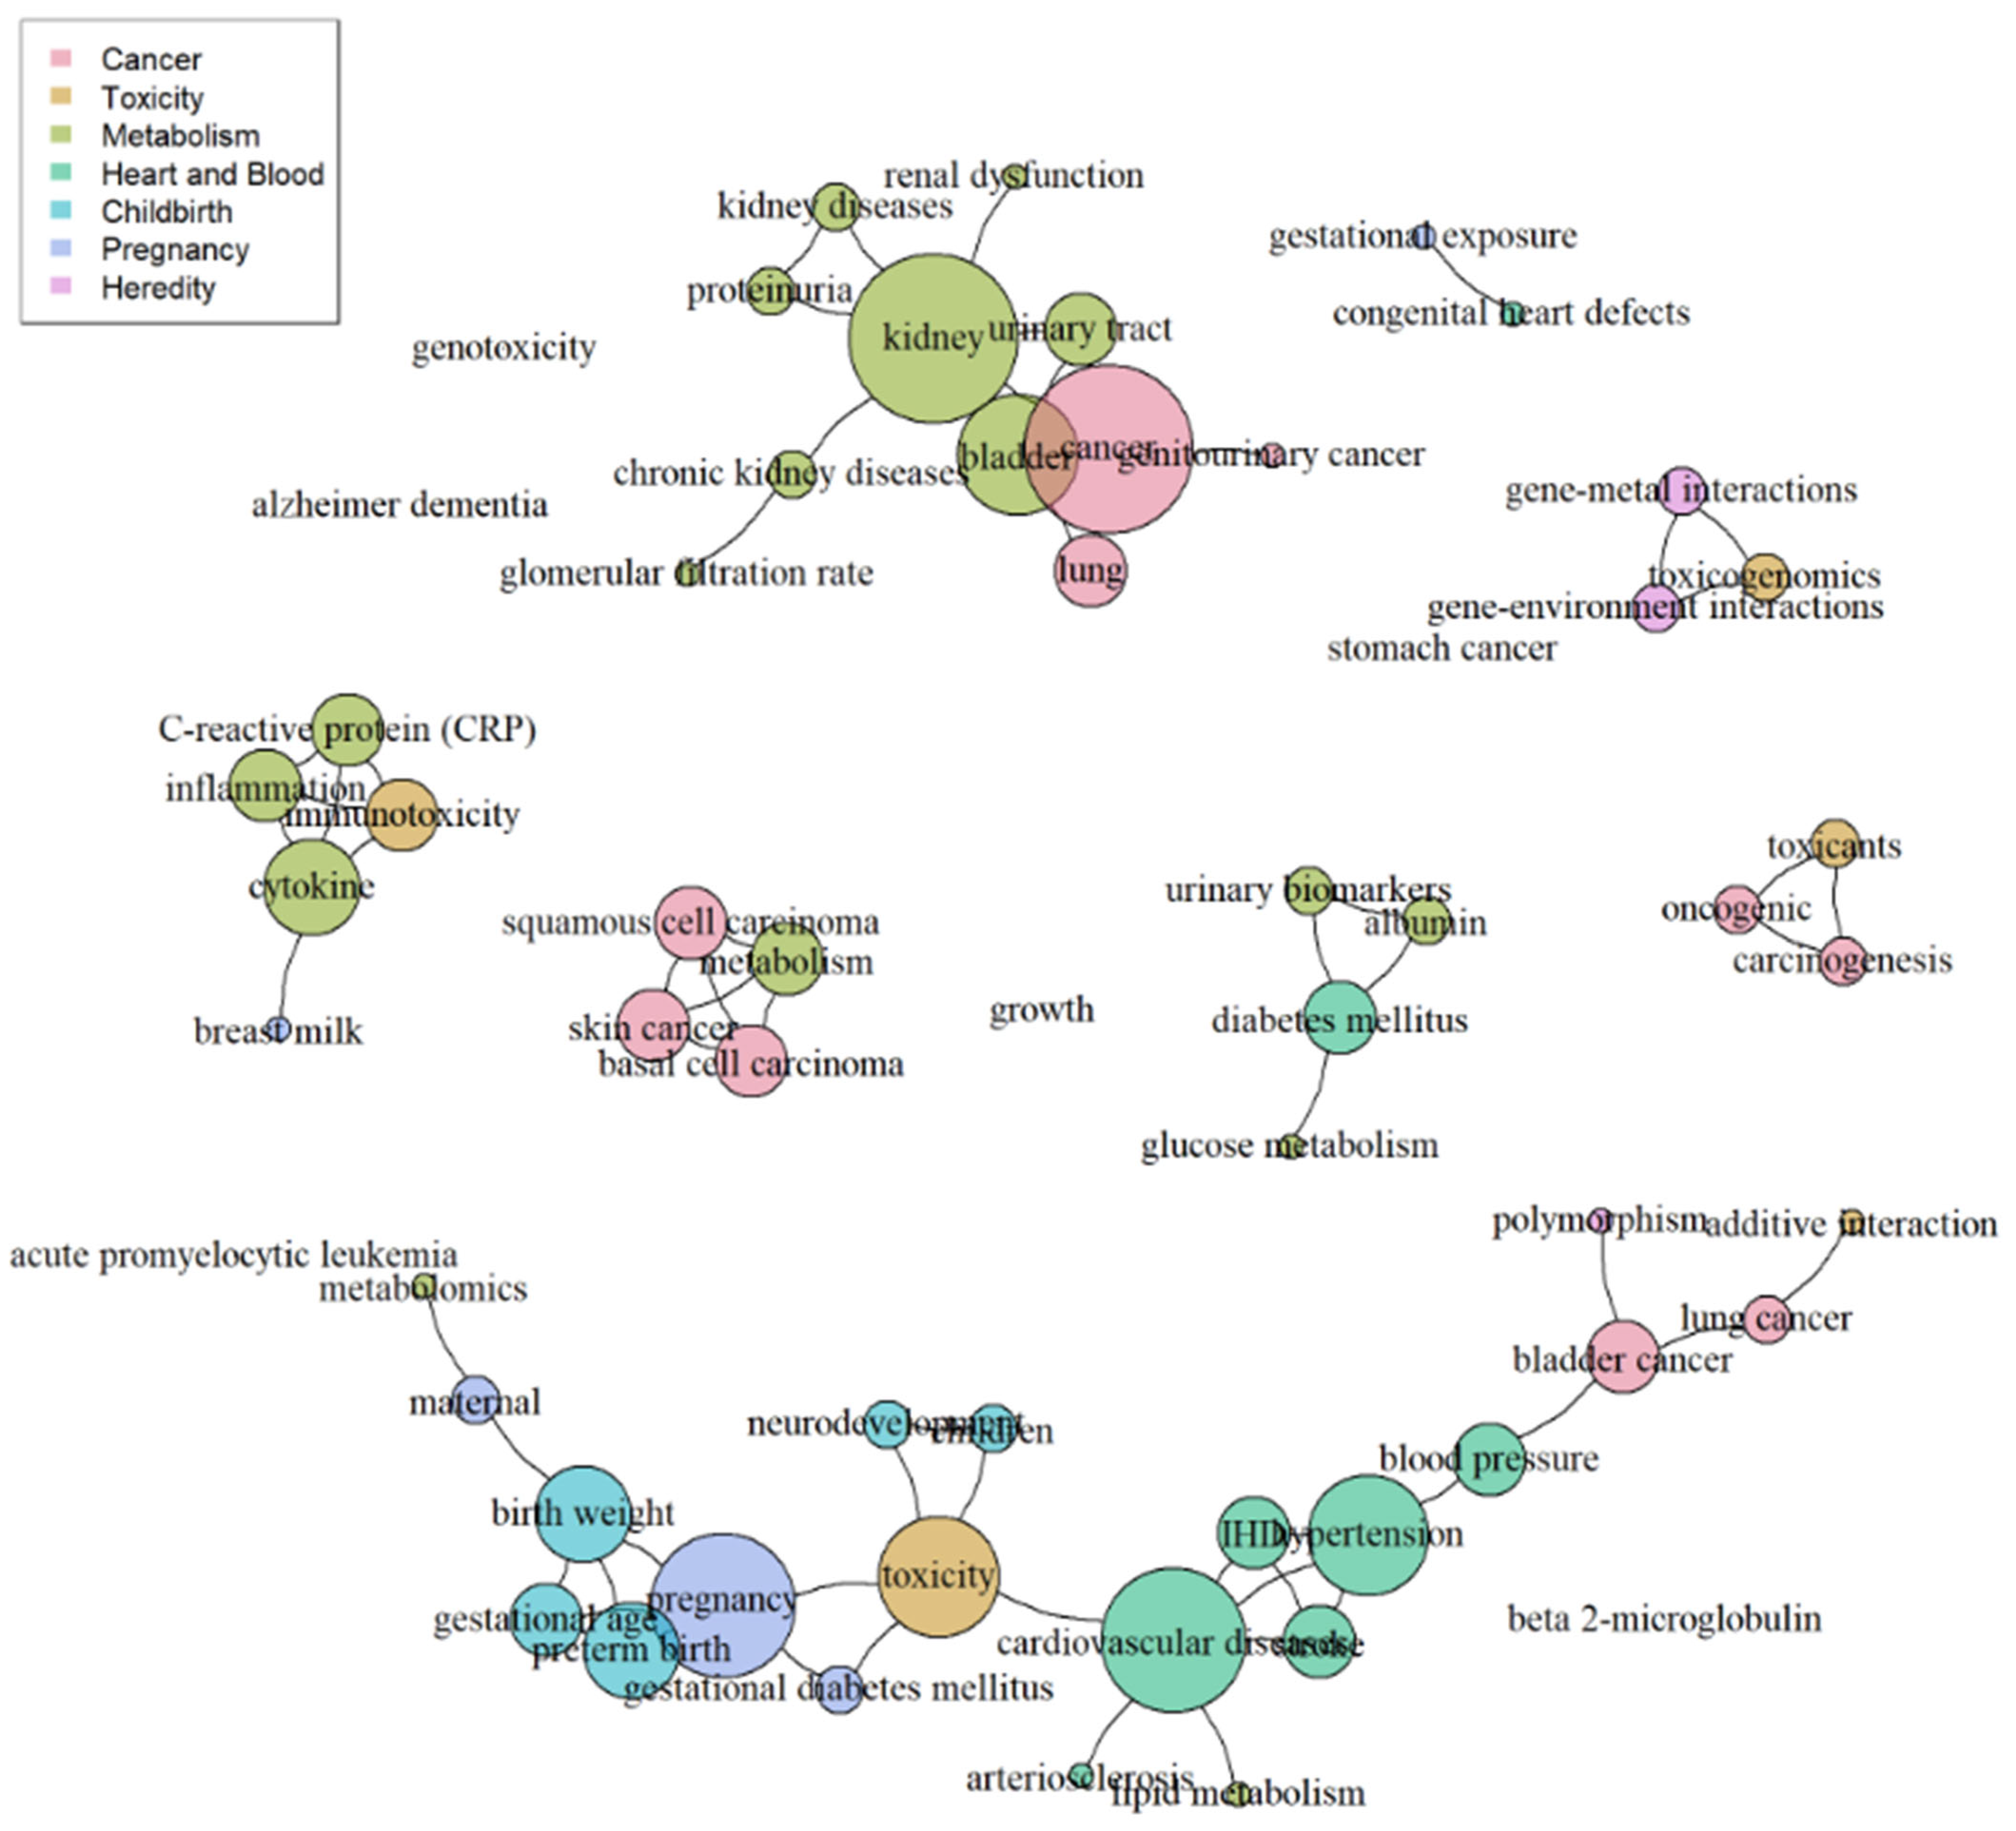
The network created with the disease-oriented group keywords is shown in Figure 9. The features known through network visualization were as follows: In the left, keywords related to ‘Metabolism’ in light green and ‘Cancer’ in pink were expressed as large nodes and connected. At the bottom, most keywords were connected. From the left, they were generally connected in the following order: ‘Cancer’, ‘Heart and Blood’, ‘Toxicity’, ‘Pregnancy’, and ‘Childbirth’.

Figure 9.
Network of keywords grouped into 7 disease categories.
Finally, we derived the values of the metrics in the centrality analysis, namely DC, BC, and CC, and sorted the top 10 keywords for each metric in descending order (Table 4). The maximum value of DC was 7, indicating that keywords such as ‘cancer’ and ‘kidney’ were connected to the largest number of other keywords. In BC, ‘cardiovascular’ appeared most prominently, followed by ‘toxicity’, ‘pregnancy’, and ‘hypertension’. In CC, ‘congenital heart defects’ and ‘gestational exposure’ both had a value of 1, indicating the highest centrality. Considering the top keywords across all metrics, it suggests a significant impact of cardiovascular diseases or pregnancy-related factors. Consequently, by setting diseases related to the outcome component of the PICO as ‘cardiovascular’ or ‘pregnancy’, we can clearly define the research question. The restructured query includes terms related to arsenic and cancer to obtain more accurate results from the database as follows: (“Arsenic” [Mesh] OR “Arsenic Trioxide” [Mesh] OR “Arsenic Poisoning” [Mesh] OR “Arsenicals” [Mesh] OR “Arsenic” [tiab] OR “Arsenic Trioxide” [tiab] OR “Arsenic Poisoning” [tiab] OR “Arsenicals” [tiab]) AND (”Neoplasms” [Mesh] OR “Cancer” [tiab]). Therefore, when establishing the literature search strategy for an SR, our proposed method of using a TNA to prioritize diseases for the PICO’s outcome can be applied. This allows us to establish medical terms for the most studied and representative diseases to date.
Table 4.
Result of the centrality by DC, BC, and CC metrics and top 10 keywords.
4. Conclusions
When establishing a literature search strategy for SRs, we were able to set research questions based on data through a TNA. The TNA allows us to correctly establish the PICO, visualize relationships between keywords, and effectively determine the priorities of research topics. Furthermore, by first establishing a systematic literature search strategy for a comprehensive literature review, we can enhance the overall reliability and validity of the SR. According to the centrality analysis results that quantified the importance of each keyword, it was discovered that various groups of diseases according to DC, BC, and CC are mixed, and it is known that the keywords are not independent but are connected. In this way, opportunities to discover new knowledge can be obtained through the TNA.
However, there were several limitations to consider regarding the TNA as well. First, during the process of preprocessing keywords, researchers relied on their expertise and experience to refine the topics. Although this method based on expert knowledge was not a perfect method based on data, it was inevitable, as it was a researcher’s unique field that computers could not yet judge. Second, the choice of which metric to focus on in centrality analysis to determine the importance of research topics—DC, BC, or CC—can vary. Generally, importance based on DC was chosen in healthcare [28,29], but in individual academic fields, there may be cases where BC and CC are prioritized, leading to the limitation that the final judgment depends on the researcher’s academic field. Nevertheless, this can be said to be diverse across academic fields.
Based on the traditional search strategy for SRs, not using a TNA approach as we suggested, the included literature will be constructed with the researcher’s discretion. For instance, when conducting a study on ‘Health Impact Assessment of arsenic exposure’, if the researcher selects ‘arsenic’ as the intervention and ‘cancer’ as the outcome, the selection of ‘cancer’ is entirely dependent on the researcher’s own expertise. There are many other diseases besides cancer as health effects, but the remaining diseases cannot be ignored. Since there are so many ‘diseases’ as outcomes, problems arise as to which diseases to set first and how far to limit the scope of diseases. When many diseases are caused by a particular exposure, we need to know which diseases are of the highest interest and which diseases have been studied the most to date. This requires an objective and rational approach to disease terminology, which we propose.
SR research questions are set through the TNA proposed in this study, it can be defined more clearly, and the reliability of the entire study can be improved. This not only increases the efficiency in the design and analysis stages of research but also clarifies the interpretation and significance of the results. In this study, we conducted the PICO setting through the TNA to establish the optimal literature search strategy based on data for SRs. If the methodology proposed in this study is applied not only to the specific topic but also to individual research topics of researchers, it will serve as an optimal breakthrough for establishing a search strategy for SRs.
Supplementary Materials
The following supporting information can be downloaded at: https://www.mdpi.com/article/10.3390/app14198909/s1.
Author Contributions
S.R.S. and S.L. conceived and designed the study. S.R.S., J.S. and S.L. screened databases and extracted data, accessed and verified the data, performed the statistical analysis, and wrote the first draft of the manuscript. All authors interpreted the data, provided critical review, provided revision of the text, and approved the final version. S.R.S. and J.-Y.K. had final responsibility for the decision to submit for publication. All authors have read and agreed to the published version of the manuscript.
Funding
This research received no external funding.
Institutional Review Board Statement
Not applicable.
Informed Consent Statement
Not applicable.
Data Availability Statement
The raw codes and full tables corresponding to each table and figure are located in the Supplementary Materials.
Conflicts of Interest
The authors declare no conflicts of interest.
References
- Higgins, J.P.; Green, S. Cochrane Handbook for Systematic Reviews of Interventions. Version 5.1.0. 2011. Available online: http://www.cochrane-handbook.org (accessed on 1 May 2019).
- Shim, S.R.; Kim, S.-J. Intervention meta-analysis: Application and practice using R software. Epidemiol. Health 2019, 41, e2019008. [Google Scholar] [CrossRef]
- Johnston, L.; Fineout-Overholt, E. Teaching EBP: “Getting from zero to one”. Moving from recognizing and admitting uncertainties to asking searchable, answerable questions. Worldviews Evid.-Based Nurs. 2005, 2, 98–102. [Google Scholar] [CrossRef]
- Rhee, T.G.; Shim, S.R.; Forester, B.P.; Nierenberg, A.A.; McIntyre, R.S.; Papakostas, G.I.; Krystal, J.H.; Sanacora, G.; Wilkinson, S.T. Efficacy and safety of ketamine vs electroconvulsive therapy among patients with major depressive episode: A systematic review and meta-analysis. JAMA Psychiatry 2022, 79, 1162–1172. [Google Scholar] [CrossRef] [PubMed]
- Rhee, T.G.; Shim, S.R.; Manning, K.J.; Tennen, H.A.; Kaster, T.S.; d’Andrea, G.; Forester, B.P.; Nierenberg, A.A.; McIntyre, R.S.; Steffens, D.C. Neuropsychological Assessments of Cognitive Impairment in Major Depressive Disorder: A Systematic Review and Meta-Analysis with Meta-Regression. Psychother. Psychosom. 2024, 93, 8–23. [Google Scholar] [CrossRef] [PubMed]
- Popping, R. Computer-Assisted Text Analysis; SAGE Publications: Thousand Oaks, CA, USA, 1999; pp. 1–240. [Google Scholar]
- Daraio, C.; Kerstens, K.H.; Nepomuceno, T.C.C.; Sickles, R. Productivity and efficiency analysis software: An exploratory bibliographical survey of the options. J. Econ. Surv. 2019, 33, 85–100. [Google Scholar] [CrossRef]
- Nepomuceno, T.C.C.; Costa, A.P.C.S.; Daraio, C. Theoretical and Empirical Advances in the Assessment of Productive Efficiency since the introduction of DEA: A Bibliometric Analysis. Int. J. Oper. Res. 2023, 46, 505–549. [Google Scholar] [CrossRef]
- De Carvalho, V.D.H.; Costa, A. Exploring Text Mining and Analytics for Applications in Public Security: An in-depth dive into a systematic literature review. Socioecon. Anal 2023, 1, 5–55. [Google Scholar] [CrossRef]
- Satarova, B.; Siddiqui, T.; Raza, H.; Abbasi, N.; Kydyrkozha, S. A Systematic Review of “The Performance of Knowledge Organizations and Modelling Human Action”. Socioecon. Anal 2023, 1, 56–77. [Google Scholar] [CrossRef]
- NetMiner. Available online: https://www.netminer.com/kr/index.php (accessed on 17 May 2024).
- Bibliometrix. Available online: https://www.bibliometrix.org/home/ (accessed on 17 May 2024).
- Kim, S.; Lee, W.S. Network text analysis of medical tourism in newspapers using text mining: The South Korea case. Tour. Manag. Perspect. 2019, 31, 332–339. [Google Scholar] [CrossRef]
- Kowsar, R.; Rahimi, A.M.; Sroka, M.; Mansouri, A.; Sadeghi, K.; Bonakdar, E.; Kateb, S.F.; Mahdavi, A.H. Risk of mortality in COVID-19 patients: A meta-and network analysis. Sci. Rep. 2023, 13, 2138. [Google Scholar] [CrossRef] [PubMed]
- Loscalzo, J. Molecular interaction networks and drug development: Novel approach to drug target identification and drug repositioning. FASEB J. 2023, 37, e22660. [Google Scholar] [CrossRef]
- UNICEF. Arsenic Primer: Guidance on the Investigation & Mitigation of Arsenic Contamination; UNICEF Water, Sanitation and Hygiene Section and WHO Water, Sanitation and Hygiene and Health Unit; United Nations Children’s Fund (UNICEF): New York, NY, USA, 2018. [Google Scholar]
- Smith, A.H.; Hopenhayn-Rich, C.; Bates, M.N.; Goeden, H.M.; Hertz-Picciotto, I.; Duggan, H.M.; Wood, R.; Kosnett, M.J.; Smith, M.T. Cancer risks from arsenic in drinking water. Environ. Health Perspect 1992, 97, 259–267. [Google Scholar] [CrossRef]
- Abdul, K.S.M.; Jayasinghe, S.S.; Chandana, E.P.; Jayasumana, C.; De Silva, P.M.C. Arsenic and human health effects: A review. Environ. Toxicol. Pharmacol. 2015, 40, 828–846. [Google Scholar] [CrossRef] [PubMed]
- Brinkel, J.; Khan, M.H.; Kraemer, A. A systematic review of arsenic exposure and its social and mental health effects with special reference to Bangladesh. Int. J. Environ. Res. Public Health 2009, 6, 1609–1619. [Google Scholar] [CrossRef] [PubMed]
- Rahman, A.; Granberg, C.; Persson, L.-Å. Early life arsenic exposure, infant and child growth, and morbidity: A systematic review. Arch. Toxicol. 2017, 91, 3459–3467. [Google Scholar] [CrossRef] [PubMed]
- PubMed. Available online: https://pubmed.ncbi.nlm.nih.gov/ (accessed on 17 May 2024).
- Aromataris, E.; Fernandez, R.; Godfrey, C.M.; Holly, C.; Khalil, H.; Tungpunkom, P. Summarizing systematic reviews: Methodological development, conduct and reporting of an umbrella review approach. JBI Evid. Implement. 2015, 13, 132–140. [Google Scholar] [CrossRef]
- West, D.B. Introduction to Graph Theory; Prentice Hall: Upper Saddle River, NJ, USA, 2001; Volume 2. [Google Scholar]
- Singh, H.; Sharma, R. Role of adjacency matrix & adjacency list in graph theory. Int. J. Comput. Technol. 2012, 3, 179–183. [Google Scholar]
- Wickham, H. Reshaping data with the reshape package. J. Stat. Softw. 2007, 21, 1–20. [Google Scholar] [CrossRef]
- Csardi, G.; Csardi, M.G. The iGraph Package. 2007. [Google Scholar]
- Rodrigues, F.A. Network Centrality: An Introduction. A Mathematical Modeling Approach from Nonlinear Dynamics to Complex Systems; Springer: Cham, Switzerland, 2019; pp. 177–196. [Google Scholar]
- Baek, E.C.; Hyon, R.; López, K.; Finn, E.S.; Porter, M.A.; Parkinson, C. In-degree centrality in a social network is linked to coordinated neural activity. Nat. Commun. 2022, 13, 1118. [Google Scholar] [CrossRef] [PubMed]
- Zhang, H.; Fiszman, M.; Shin, D.; Miller, C.M.; Rosemblat, G.; Rindflesch, T.C. Degree centrality for semantic abstraction summarization of therapeutic studies. J. Biomed. Inform. 2011, 44, 830–838. [Google Scholar] [CrossRef] [PubMed]
Disclaimer/Publisher’s Note: The statements, opinions and data contained in all publications are solely those of the individual author(s) and contributor(s) and not of MDPI and/or the editor(s). MDPI and/or the editor(s) disclaim responsibility for any injury to people or property resulting from any ideas, methods, instructions or products referred to in the content. |
© 2024 by the authors. Licensee MDPI, Basel, Switzerland. This article is an open access article distributed under the terms and conditions of the Creative Commons Attribution (CC BY) license (https://creativecommons.org/licenses/by/4.0/).