Article

Effects of Lactic Acid and Ascorbic Acid Mixture on Quality Properties of Wild Red Deer (Cervus elaphus) Meat

1
Doctorial School of Food Sciences, Hungarian University of Agriculture and Life Sciences, 1118 Budapest, Hungary
2
Department of Livestock and Food Preservation Technology, Institute of Food Science and Technology, Hungarian University of Agriculture and Life Sciences, 1118 Budapest, Hungary
3
Department of Postharvest, Supply Chain, Commerce and Sensory Science, Institute of Food Science and Technology, Hungarian University of Agriculture and Life Sciences, 1118 Budapest, Hungary
*
Author to whom correspondence should be addressed.
Appl. Sci. 2024, 14(19), 8915; https://doi.org/10.3390/app14198915
Submission received: 23 August 2024 / Revised: 24 September 2024 / Accepted: 30 September 2024 / Published: 3 October 2024

Abstract

:
This study investigated the effect of a 2% lactic acid and 2% ascorbic acid mixture, applied via a spray method, on the quality of wild red deer (Cervus elaphus) meat stored under vacuum packaging at 4 ± 1 °C for 21 days. A total of 48 semimembranosus muscle steaks were used, divided into two groups: 24 treated with the acid mixture and 24 non-treated controls. Key parameters, including the pH, instrumental color, bacterial counts, texture profile analysis, and protein degradation (sarcoplasmic and myofibrillar proteins) using sodium dodecyl-sulfate polyacrylamide gel electrophoresis, were assessed on different days. Treated samples exhibited significantly lower aerobic plate counts (p < 0.05) compared to controls. No significant differences in pH were found between the groups, except on day one (p < 0.05). Over time, texture analysis revealed a significant reduction in hardness, cohesiveness, and chewiness in both groups, with treated samples showing greater tenderness. Importantly, the lactic acid and ascorbic acid treatment did not adversely affect the color attributes of the meat. This method shows potential for improving the microbiological safety of venison without compromising its quality, making it a promising preservation technique for the meat industry.

1. Introduction

The meat of wild animals has high nutritional value and specific sensory properties. Since ancient times, game meat has been an essential nutritional source for mankind. Due to their natural lifestyle, wild animals have different eating habits and food quality than farm animals. As a result, game meat can be considered “organic” since it does not contain antibiotics or hormones [1,2]. Consumers are becoming more concerned about the environment, and as a result, they are interested in organic products, as well as products made by natural production methods [3]. Red deer (Cervus elaphus) are one of the most important species of game meat, popular in Europe, New Zealand, and Australia [4]. Because of the low intramuscular fat and cholesterol content, as well as the high iron content [5], venison is an excellent dietary product for customers. Furthermore, this meat is high in unsaturated fatty acids, particularly long-chain n-3 polyunsaturated fatty acids, due to the natural diet and lifestyle of wild deer [6]. Wild deer primarily graze on grasses, shrubs, and other vegetation rich in omega-3 fatty acids, and unlike grain-fed domesticated animals, their natural diet and active, free-ranging lifestyle result in lower fat content and higher levels of unsaturated fats, particularly long-chain n-3 polyunsaturated fatty acids [5]. Owing to its nutritional properties, deer meat consumption has been increasing each year. However, one of the challenges is its short shelf life, which is exacerbated by microbial growth [7]. Unlike farm animals processed in controlled environments, deer are hunted in forests and fields. Factors like poor shot placement, delayed or insufficient cooling, and handling practices can compromise the microbiological safety of deer meat, further affecting its shelf life. Common bacterial species found on game meat include Salmonella spp., E. coli, Listeria monocytogenes, and Campylobacter spp., all of which can contribute to spoilage and food safety risks [6]. These issues not only affect consumer safety but also have economic implications for producers and retailers, leading to product losses and reduced marketability.
The production and sale of venison are governed by strict regulations in the European Union (EU), which ensure that wild game meat is safe for consumers. Regulation (EC) No. 853/2004 [8] sets specific hygiene rules for the handling of wild game, requiring that stomachs and intestines be removed promptly after the kill and that a trained person conduct an inspection of the carcass to ensure it poses no health risks. The carcass must then be transported to an approved game-handling establishment for further processing [9]. These legal requirements, along with other food safety regulations (Regulation (EC) No. 178/2002, Regulation (EC) No. 852/2004), [10,11] ensure the traceability and safety of venison in the marketplace. The EU’s regulations are aligned with similar standards worldwide, promoting consumer confidence in venison as a safe and high-quality food product.
Various methods have been employed to inhibit microbial growth and extend meat’s shelf life, including hot water rinses [12], high hydrostatic pressure, irradiation, steam pasteurization, bio preservatives [13], and organic acid spraying [14]. These techniques are effective in prolonging meat’s shelf life by reducing or eliminating pathogenic bacteria and preventing oxidative rancidity [15]. However, discoloration of the meat surface remains an issue, particularly with higher concentrations of organic acids. Consistent color is a significant concern for the meat industry, as it is a primary quality attribute that influences consumer purchasing decisions [16]. Consumers rely heavily on meat color to assess its quality and acceptability [17]. In addition, it is important to note that wild game meat, such as that from red deer, typically exhibits a darker and more intense red color compared to meat from domestic species. This color difference is attributed to higher levels of myoglobin and the composition of muscle fibers, which can influence consumer perceptions of quality and acceptability [18].
Lactic acid (LA) is commonly used as an organic antimicrobial agent for the decontamination of meat and meat products and is generally recognized as safe (GRAS). LA is particularly effective against Gram-negative bacteria [19]. Studies have shown that 2% LA can effectively treat beef carcasses against E. coli [20], and it also has a significant inhibitory effect on Gram-positive bacteria [19]. Lactic acid exhibits antimicrobial activity through several mechanisms. It can lower the cytoplasmic pH of microbial cells by entering in its undissociated form and then dissociating, releasing protons (H+), which disrupts the cell’s internal environment [21]. Additionally, lactic acid physically disrupts microbes, leading to the immediate decontamination of meat surfaces [22]. Under acid stress, free radicals are generated due to interference with the electron transport chain, further contributing to its antimicrobial effects [23]. However, a major drawback of LA decontamination, especially at higher concentrations, is the discoloration of meat cuts [24]. Furthermore, LA treatment can affect the texture of meat by influencing the properties of sarcoplasmic and myofibrillar proteins, which are essential for maintaining meat tenderness and juiciness during storage.
Ascorbic acid (AA) has been widely used as a meat surface treatment, either alone or in combination with other antioxidants, to maintain meat color and improve oxidative stability due to its strong antioxidant properties [25]. Muscle foods naturally contain low amounts of AA [26], but their application to meat can enhance both nutritional value and shelf life by preventing oxidation and discoloration [27]. Since meat color plays a critical role in consumer appeal and purchasing decisions, preventing discoloration is essential. In response to growing concerns about food safety and increasing consumer demand for natural additives, AA has gained attention as a viable alternative to synthetic antioxidants. Its use not only enhances meat quality but also significantly extends shelf life [28].
Although LA and AA have been used in beef at various concentrations [14,24,27,28], there is no research on their combined use on venison. Therefore, the present study was undertaken to evaluate the effect of LA and AA mixture with the spray method on venison surface on meat quality parameters pH, color, bacterial count, and texture analysis. Additionally, gel electrophoresis was used to analyze protein degradation, as it provides insights into the effects of treatment on sarcoplasmic and myofibrillar proteins. The aim of this work was to determine the effectiveness of LA and AA in extending the shelf life of wild venison during retail display under vacuum packaging at 4 ± 1 °C.

2. Materials and Methods

2.1. Preparation of Samples

Wild red deer (Cervus elaphus) meat used in this study was sourced from the local processing plant “VADEX” Mezőföldi Zrt. in Hungary. The wild red deer, which were hunted in Western Hungary, included both males and females and were aged between 4 and 6 years. Fresh meat samples were packed in low-density polyethylene pouches, transported to the laboratory under chilled conditions, and stored at 4 ± 1 °C for one day. Semimembranosus muscles were dissected from 12 individual deer. Each muscle was cut into four steaks of similar sizes (approximately 10 × 5 × 1.5 cm), resulting in a total of 48 steaks. These steaks were randomly divided between two treatment groups: 24 steaks were treated with a 2% lactic acid and 2% ascorbic acid mixture, and 24 steaks were left non-treated as control samples.
Steaks in the control group were vacuum-packed and kept in a refrigerated cabinet at 4 ± 1 °C. For the treatment group, individual meat steaks were placed inside vacuum bags, and a water-based mixture containing 2% lactic acid and 2% ascorbic acid was sprayed inside each bag using a manual sprayer. The applied solution concentration was 1% in relation to the initial meat weight, with 4 g of solution used for every 400 g of meat. After treatment, all samples were vacuum-packed using a C200 vacuum packer (Multivac Ltd., Geprüfte Scherhert, AGW, Wolfertschwenden, Germany) and stored at 4 ± 1 °C for 21 days. The vacuum packaging material used was PA/PE 90, with a moisture vapor permeability of 2.6 g/m2 per day, oxygen permeability of 50 cm3/m2, carbon dioxide permeability of 150 cm3/m2, and nitrogen permeability of 10 cm3/m2. The assessment of quality parameters occurred on days 1, 7, 14, and 21 during the storage period.

2.2. Preparation of Spray Solution

The lactic acid and ascorbic acid mixture solution was prepared by diluting lactic acid (Molar Chemicals Kft., Halásztelek, Hungary) and ascorbic acid (VitalTrend Kft., Budapest, Hungary) in distilled water to make a 2% + 2% (v/v) acid solution. The measured pH of the solution was 2.48 ± 0.04. A total of 500 mL of (v/v) lactic acid and ascorbic acid solution was applied through a manual sprayer to the meat samples. The temperature of the solution was maintained at 20 ± 1 °C during application.

2.3. pH Determination

The pH values of venison samples were measured using a handheld digital pH meter (Testo, Model 206-pH2, Alton, UK). The pH was directly determined from the muscle tissues of the chilled samples at room temperature. Each sample was measured three times. After each measurement, the pH meter was cleaned, and its calibration was verified using buffer solutions with pH values of 4.0 and 7.0, following the manufacturer’s instructions.

2.4. Instrumental Color Measurement

The surface color of the vacuum-packed venison samples was determined using a Chroma Meter CR-400 (Konica Minolta, Tokyo, Japan) with a 4 mm diameter aperture, an illuminant D65, and a 10° standard observer. The instrument was routinely calibrated with a white tile before each measurement session. For each sample, 20 replicate measurements were performed across the entire surface of the meat within the vacuum packaging. The measurements recorded the values for lightness (L*), redness (a*), and yellowness (b*). Additionally, chroma (C*), indicating color vividness, was calculated using the following Formula (1):
C * = a * 2 + b * 2
The hue angle (h), which describes the hue of the color [20], was calculated as Formula (2):
h = a r c t a n ( b * a * )
The color difference (ΔE) was calculated using Formula (3):
E a b * = Δ L * 2 + Δ a * 2 + Δ b * 2
To interpret the ∆E values, the observer criteria outlined by Mokrzycki and Tatol [29] were applied, which categorize color differences as follows:
  • When 0 < ∆E < 1, the observer does not notice the difference;
  • When 1 < ∆E < 2, only an experienced observer may notice the difference;
  • When 2 < ∆E < 3.5, an inexperienced observer also notices the difference;
  • When 3.5 < ∆E < 5, a clear difference in color is noticed;
  • When ∆E > 5, the observer notices two different colors.

2.5. Microbiological Evaluation

Treated and non-treated venison samples were separately vacuum-packed from other measurement samples. The storage temperature before measurement was 4 ± 1 °C. For microbial analysis, 10 g of each meat sample was homogenized with 90 mL of 0.1% sterile peptone water. To prepare for the aerobic plate count (APC), serial dilutions were conducted by mixing one milliliter of the homogenate with nine milliliters of 0.1% peptone water. The APC was determined using the pour plate method with nutrient agar on duplicate plates. These plates were incubated at 30 °C for 48 h. After incubation, colonies were counted to determine the total number of colony-forming units per gram of meat (CFU/g) [30].

2.6. Instrumental Texture Measurement

All instrumental texture measurements were conducted using an SMS TA. XT Plus Texture Analyzer (Stable Micro System Ltd., Godalming, UK) with Texture Exponent 32 software. Venison samples for texture profile analysis (TPA) were shaped into cylinders with a diameter and height of 15 mm. Meat samples were positioned under a cylindrical probe with a diameter of 35 mm. The probe moved downward at a consistent speed of 3.0 mm/s during the pre-test phase, 1.0 mm/s during the test phase, and 3.0 mm/s during the post-test phase. The probe penetrated 75% of the sample height, retracted, paused for 2 s, and then performed a second compression. Resistance (N) was recorded every 0.01 s and plotted on a force-time plot [31,32].

2.7. Analysis of Sarcoplasmic and Myofibrillar Proteins by Sodium Dodecyl-Sulphate Polyacrylamide Gel Electrophoresis

2.7.1. Isolation of Sarcoplasmic and Myofibrillar Proteins

To determine the solubility of the sarcoplasmic and myofibrillar proteins, two extractions were performed. Proteins were extracted using the method described by Csehi, B., et al. [33]. Sarcoplasmic proteins were extracted from 5 g minced deer meat samples with 10 mL of a 0.05 M NaCI solution and homogenized (Ultra-Turrax T25, Ika Werke, Staufen im Breisgau, Germany) at 13,500 rpm for 3 min and 30 s with pauses. To avoid heating samples during homogenization, ice was placed under the tube. The resulting homogeneous suspensions were centrifuged (Beckman J2-21, Beckman Coulter, Inc., Brea, CA, USA) at 10,000 rpm for 15 min. The supernatant containing sarcoplasmic proteins was filtered into test tubes using a filter and funnel and stored in cuvettes in the freezer until use. To extract the myofibrillar proteins, the same homogenization and centrifugation procedures described previously were used. The samples were washed twice with 10 mL of a 0.05 M NaCl solution and then centrifuged for 15 min at 10,000 rpm. After centrifugation, the supernatant was removed, and 10 mL of a 0.7 M NaCI solution was added to the precipitate, which was then homogenized for 1 min. Following 15 min of centrifugation, the supernatant was filtered. The myofibrillar protein extracts were kept frozen (−24 °C) until the start of the measurements.

2.7.2. Sodium Dodecyl-Sulfate Polyacrylamide Gel Electrophoresis Conditions

Proteins extracted from deer meat samples were analyzed by sodium dodecyl-sulfate polyacrylamide gel electrophoresis (SDS-PAGE). Gel composition, electrophoresis running conditions, and treatment of gels post-electrophoresis were conducted as described by Laemmli [34]. For resolution of sarcoplasmic and myofibrillar fractions, the resolving gel contained 15% and the stacking gel 6% acrylamide, as the protein standard commercially available marker mix was used (Precision Plus Protein™ All Blue Prestained Protein Standard, Bio-Rad, Hercules, CA, USA). Each sample was mixed with an equal volume of a sample buffer containing 2% of SDS, 5% of β-mercaptoethanol, 10% of glycerol, 0.05% (w/v) of bromophenol blue (as a front marker) in 0.5 mmol l−1 Tris-HCl pH 6.8 and boiled for 2 min. After cooling 10 μL of samples containing myofibrillar extract and 10 μL of samples containing sarcoplasmic extract were applied into the gels. Electrophoresis was carried out in a Mini-PROTEAN Tetra Cell (Bio-Rad, Hercules, CA, USA) at 200 V until the bromophenol blue marker reached the bottom of the gel approximately 45–60 min. Gels were subsequently stained for 15–20 min in a 0.2% (w/v) Brilliant Blue R in ethanol:acetic acid:distilled water (40:10:50) and then washed 3 times with 10% acetic acid solution. In the end, gels were photographed on a Biorad Gel Doc XR gel imaging system and analyzed with the ImageLab 6.1 gel analysis program.

2.8. Statistical Analysis

The analysis of the generated data was performed using the software IBM SPSS27 (Armonk, NY, USA, 2020) as a statistical evaluation tool. An analysis of variance (ANOVA) and Tukey’s HSD post hoc test were conducted to evaluate the effect of the treated and non-treated methods on the measured quality parameters of wild deer meat samples. Before performing ANOVA, homoscedasticity was checked by Levene’s test, and the normality of unstandardized residuals was checked by Kolmogorov–Smirnov test or Shapiro–Wilk test, depending on the number of samples. Generally, the Shapiro–Wilk test is more suitable for small sample sizes (n < 50), while Kolmogorov–Smirnov might be used for larger samples. The homogeneity of variances, as well as the normality of residuals, was slightly violated in the case of some color attributes and aerobic plate count. The natural distribution of microorganisms in foods does not follow a normal distribution, and the color of biological samples is also more affected by the presence of fat tissues and tendons. Nevertheless, all dependent variables are included in the analysis for completeness. The ANOVA is quite robust to small violations of homoskedasticity. However, it is important to note that the results for these variables can be considered trend-valued. For this reason, ANOVA was carried out in all cases to assess the results statistically in light of the limitations. Fixed effects included treatment (control vs. treated), time (days 1, 7, 14, and 21), and their interaction. The variability of the biological steak samples resulted in an increase in the standard deviation of the measured values, which did not inhibit the observation of significant effects. Results were considered significant at p < 0.05.

3. Results and Discussion

3.1. pH

The pH values of venison at four time points (day 1, 7, 14, and 21) for both treated and non-treated groups are shown in Table 1. The pH did not significantly differ between treated and non-treated samples except on day one. The combination of lactic acid (LA) and ascorbic acid (AA) decreased the pH of meat samples by about 0.08 units by day one. This reduction aligns with prior studies indicating that the application of organic acids to beef can effectively reduce muscle pH post-treatment [35,36,37].
During storage, the pH of treated venison samples displayed significant fluctuations. Initially, the pH decreased and then increased slightly toward the end of the storage period, with a few exceptions. This initial decline can be attributed to the acid treatment, while the subsequent rise may be linked to microbial activity and metabolite accumulation during spoilage. Conversely, the non-treated samples exhibited a continuous decrease in pH throughout the storage period. This decline in pH may be due to the natural fermentation processes occurring as spoilage microorganisms metabolize the meat’s nutrients. As bacteria proliferate, they can produce organic acids as metabolic byproducts, which contribute to a decrease in pH [38]. Additionally, as these microorganisms consume glucose and other energy sources, their activity can lead to a shift in the pH balance, resulting in a more acidic environment [39]. Jose et al. [40] also observed that pH decreases at the onset of spoilage but subsequently increases as spoilage progresses.

3.2. Surface Color

Changes in CIE L*, a*, b*, hue angle, and chroma values throughout the display of deer meat samples are shown in Table 1. The L* values of treated and non-treated meat samples did not show a significant difference from each other except on day 14, when the non-treated sample was significantly higher than the treated one. These results are comparable to the results of Rodríguez-Melcón et al. [24], who reported lactic acid (up to 5%) treated meat had no difference in L* value from control except on day one when 2% LA treated meat was lighter (higher L* value). However, ref. [15] dipped Biceps femoris steaks in 2% lactic acid for 60 s, whereas Kotula and Thelappurate [41] dipped Longissimus dorsi steaks in 0.6% and 1.2% lactic acid for 120 s, and Stivarius et al. [42] tumbled beef trimmings in 5% lactic acid. All these studies showed that lactic-acid-treated meat had higher L* values than non-treated meat. These different results could be due to the fact that these researchers either dipped or tumbled steaks or trimmings into lactic acid solutions, whereas in this study and the one performed by Rodríguez-Melcón et al. [24], lactic acid was only sprayed on the surface of the meat. Therefore, no difference in the L* value was measured.
As shown in Table 1, treated dear meat samples had not significantly different a* values compared to non-treated control samples. The a* values of treated and non-treated meat samples were significantly increased from day 14 of storage, treated and non-treated samples ranged between 9.4 and 9.2, with counts increasing to a range between 11.0 and 11.8 after 21 days in vacuum packaging. Metmyoglobin decrease and brown-to-red color reversion have also been recorded in vacuum-packed meats with increasing storage duration due to the action of endogenous muscle reductants in the absence of oxygen [43]. Although several factors can impact meat color stability, metmyoglobin formation by free radicals is predominant [44].
All the treated samples also had no significant difference in b* values compared to the non-treated ones except on day 14.
The chroma, which indicates the intensity of color, was observed to be not different in treated and non-treated samples. However, in the display period, chroma values increased in all samples. Sahoo and Anjaneyulu [45] similarly found a significant increase in chroma values in ground buffalo meat preblended with 500 ppm of sodium ascorbate for 10-day refrigerated storage.
ΔE was calculated as the magnitude of difference in color space of treated and non-treated deer meat samples during the display period. Only on day 14 was a noticeable difference between treated and non-treated samples.
Our results indicate that the effect of LA and AA mixture on deer meat color was not significantly different from non-treated samples, which is advantageous due to the fact that using acid might have a negative impact on meat color.
The significant interactions between treatment and display time for L*, a*, and ΔE values suggest that the combined effect of LA and AA treatment and display period on meat color is complex. Specifically, the significant difference in L* and ΔE values on day 14 highlights a critical time point where treatment effects are most pronounced.
These findings indicate that while the LA and AA treatments did not consistently alter meat color compared to non-treated samples, specific interactions over time did influence certain color metrics. This nuanced understanding underscores the importance of considering both treatment and display periods in assessing meat quality. By focusing on these interactions, we can better understand the optimal conditions for preserving meat color and quality during storage and display.

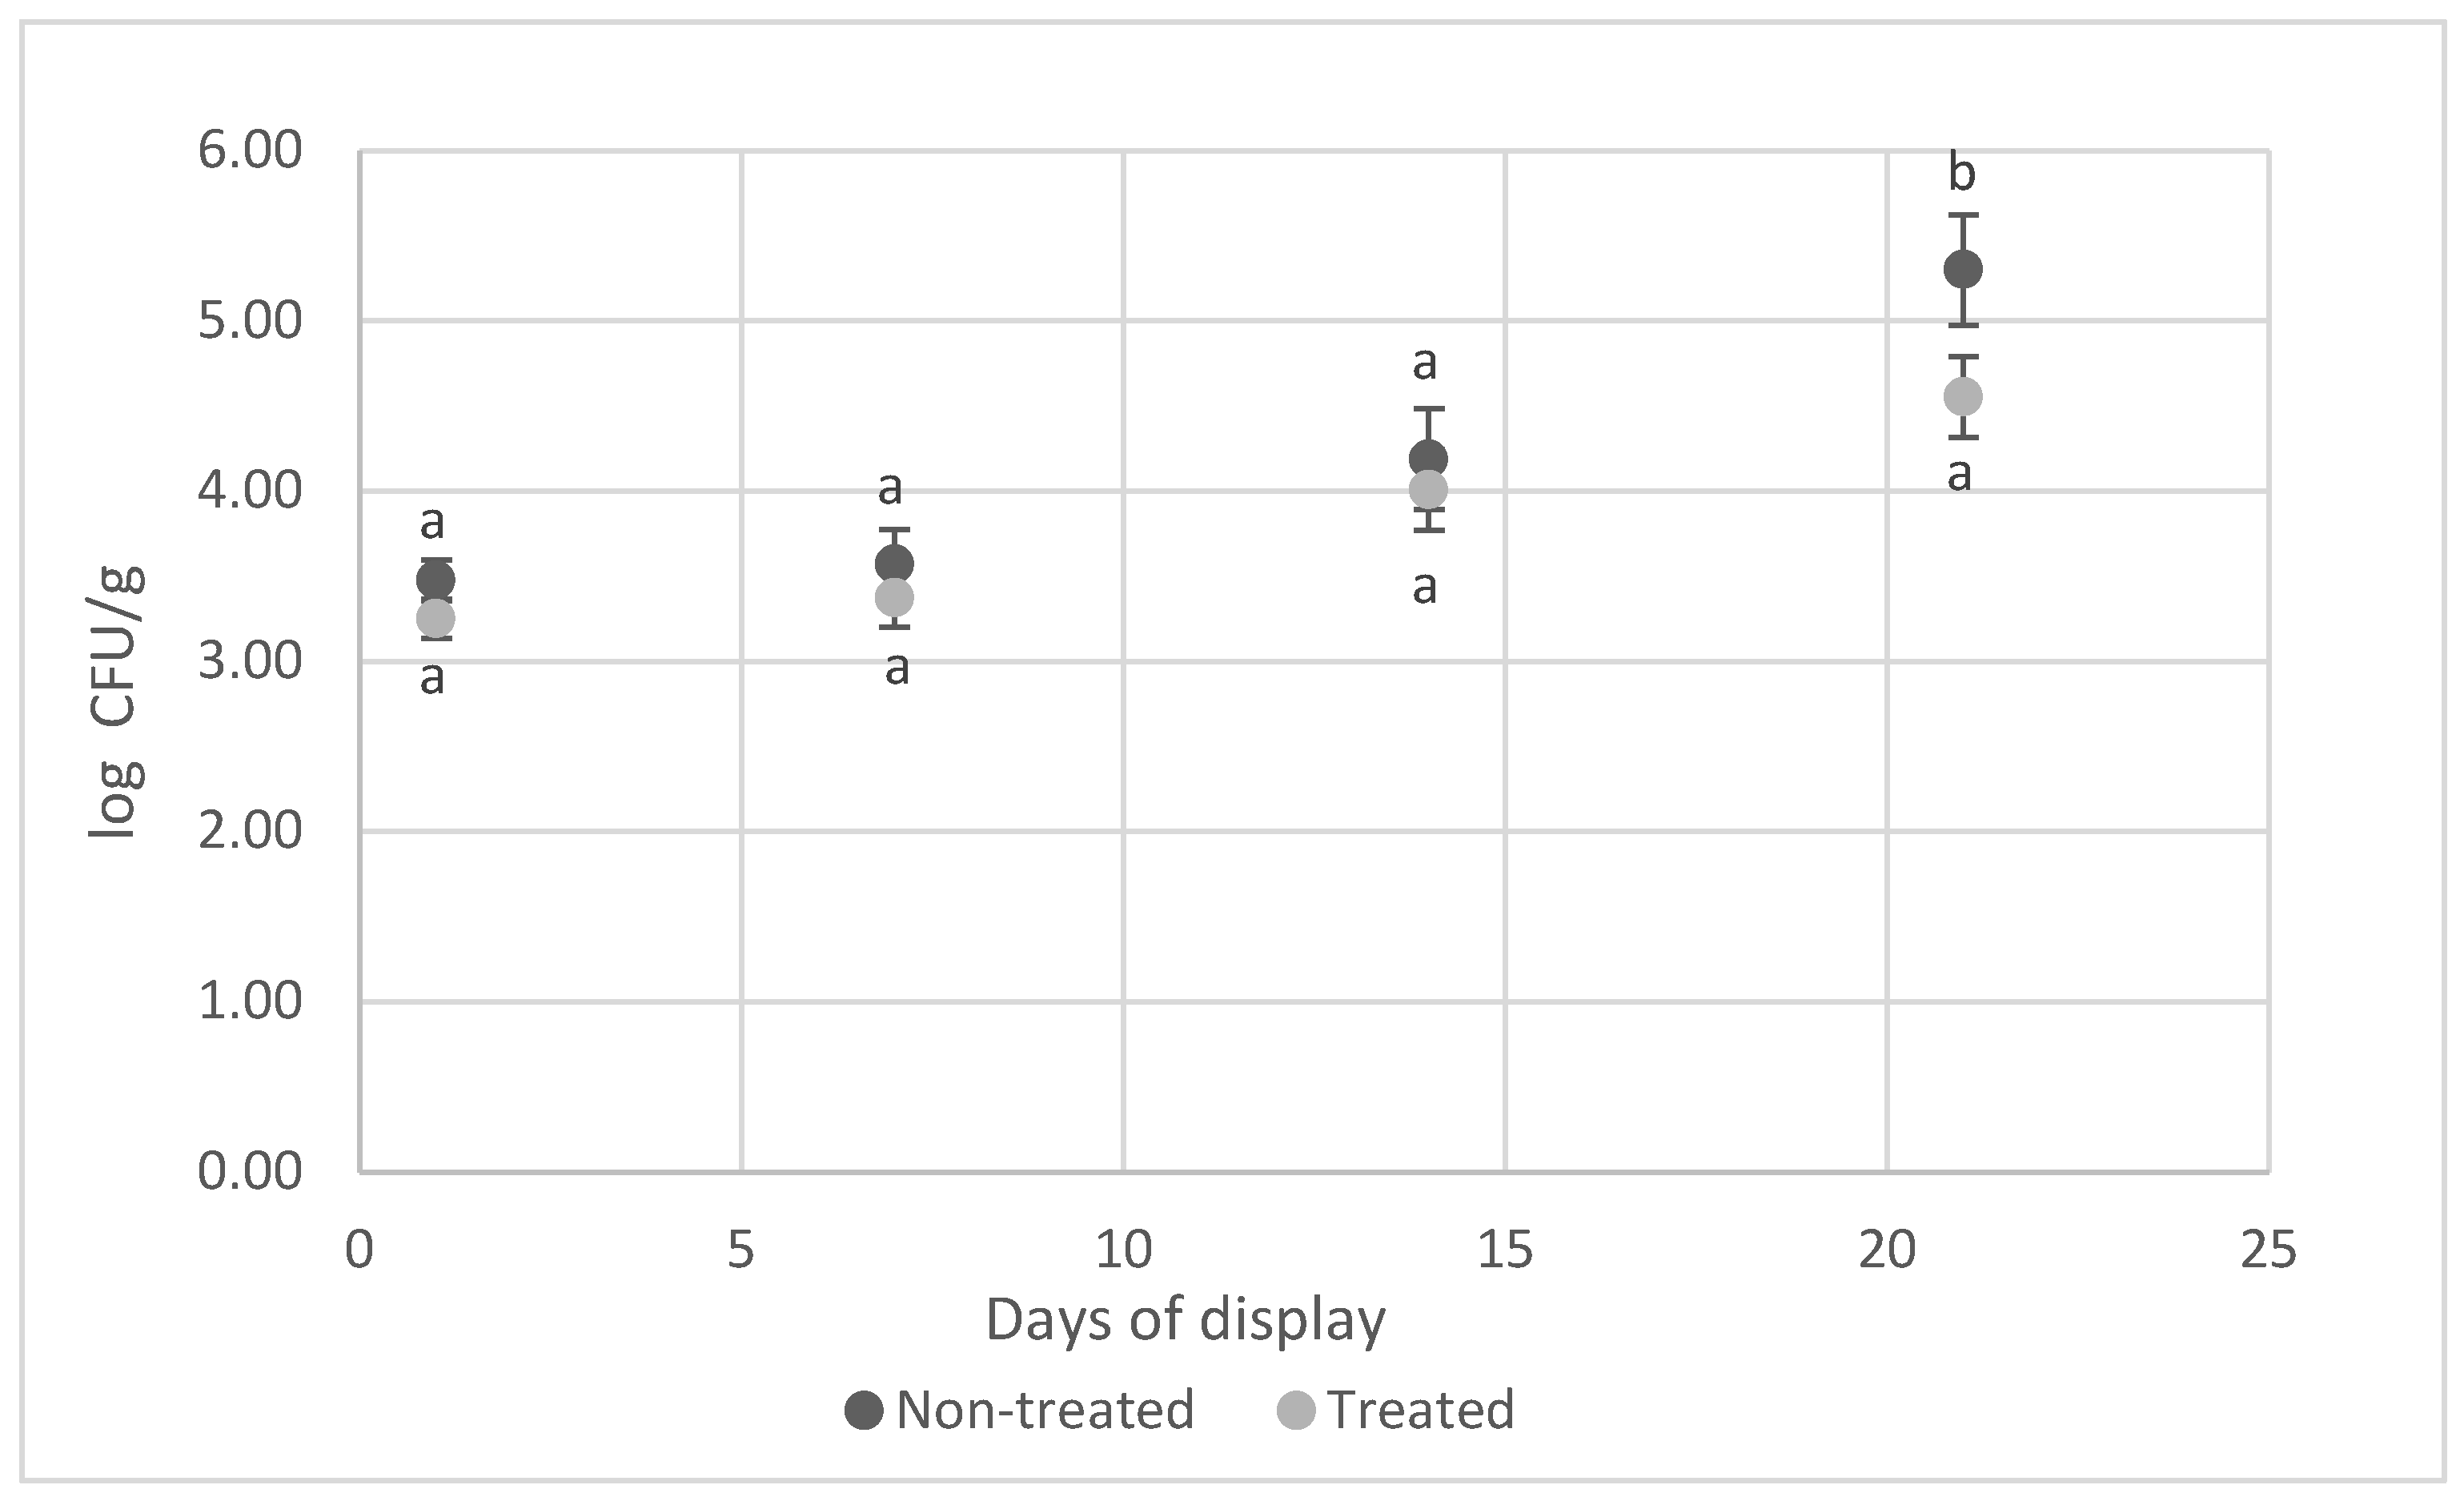
3.3. Microbiological Evaluation

Microbiological loads of treated and non-treated deer meat samples are shown in Figure 1. Initial aerobic plate count of non-treated and treated samples ranged between 3.39 and 3.25 log cfu/g, with counts increasing to a range of 5.30 and 4.55 log cfu/g after 21 days in vacuum packaging. Microbiological limit of shelf-life 7 log cfu/g was not reached in any of the samples.
The vacuum-packed venison samples treated with 2% LA and 2% AA mixture showed significantly lower aerobic plate count as compared to vacuum-packed non-treated samples at day 21, which can lead to increased time on the shelf. However, in treated samples, slightly lower aerobic plate counts were recorded on days 1, 7, and 14 of the display.
The difference in the reductions in the microbial loads in different studies by LA and AA might be due to various factors such as dissimilarities in sampling site, sampling methods, acid concentration, temperature of the solution applied, method and type of application, handling, and initial surface load [46]. Therefore, similar results cannot be achieved from the same decontaminant in different studies. In this study, only aerobic bacteria were counted, but Acuff et al. [47] showed that lactic acid treatment decreased the number of both spoilage and pathogenic bacteria. Another research study, performed by Bosilevac et al. [48], reported that spraying 2% lactic acid on pre-eviscerated carcass decreased Enterobacteriaceae count by 1 log cfu/g, and Listeria by <1 log CFU/g. Shivas et al. [49] showed that microbial populations were not reduced by treatment with ascorbic acid.

3.4. Texture Analysis

The results from TPA (hardness, cohesiveness, springiness, and chewiness) are presented in Table 2. The textural analysis of the treated and non-treated deer meat samples showed a significantly lower hardness on day 21 than on day 1, and the same tendency was observed in cohesiveness and chewiness. Hardness, cohesiveness, and chewiness decreased in the course of the storage period, which is in accordance with several studies [50,51,52]. These results could also be related to the changes in the patterns of myofibrillar degradation between 1 and 21 days, as mentioned by the authors: Buts et al. [53] determined a positive correlation between the concentrations of troponin T and the hardness value.
Additionally, there is no significant difference in all texture analyses between treated and non-treated samples except on day 14. However, all treated sample values were slightly lower than non-treated ones. Multiple researchers have documented enhanced tenderness through a reduction in shear force values in meat following marination with organic acids [37,54,55]. This impact could be due to some solubilization of the collagenous tissue. Stanton and Light [56] and Eilers et al. [57] found that lactic acid injection enhanced connective tissue degeneration.

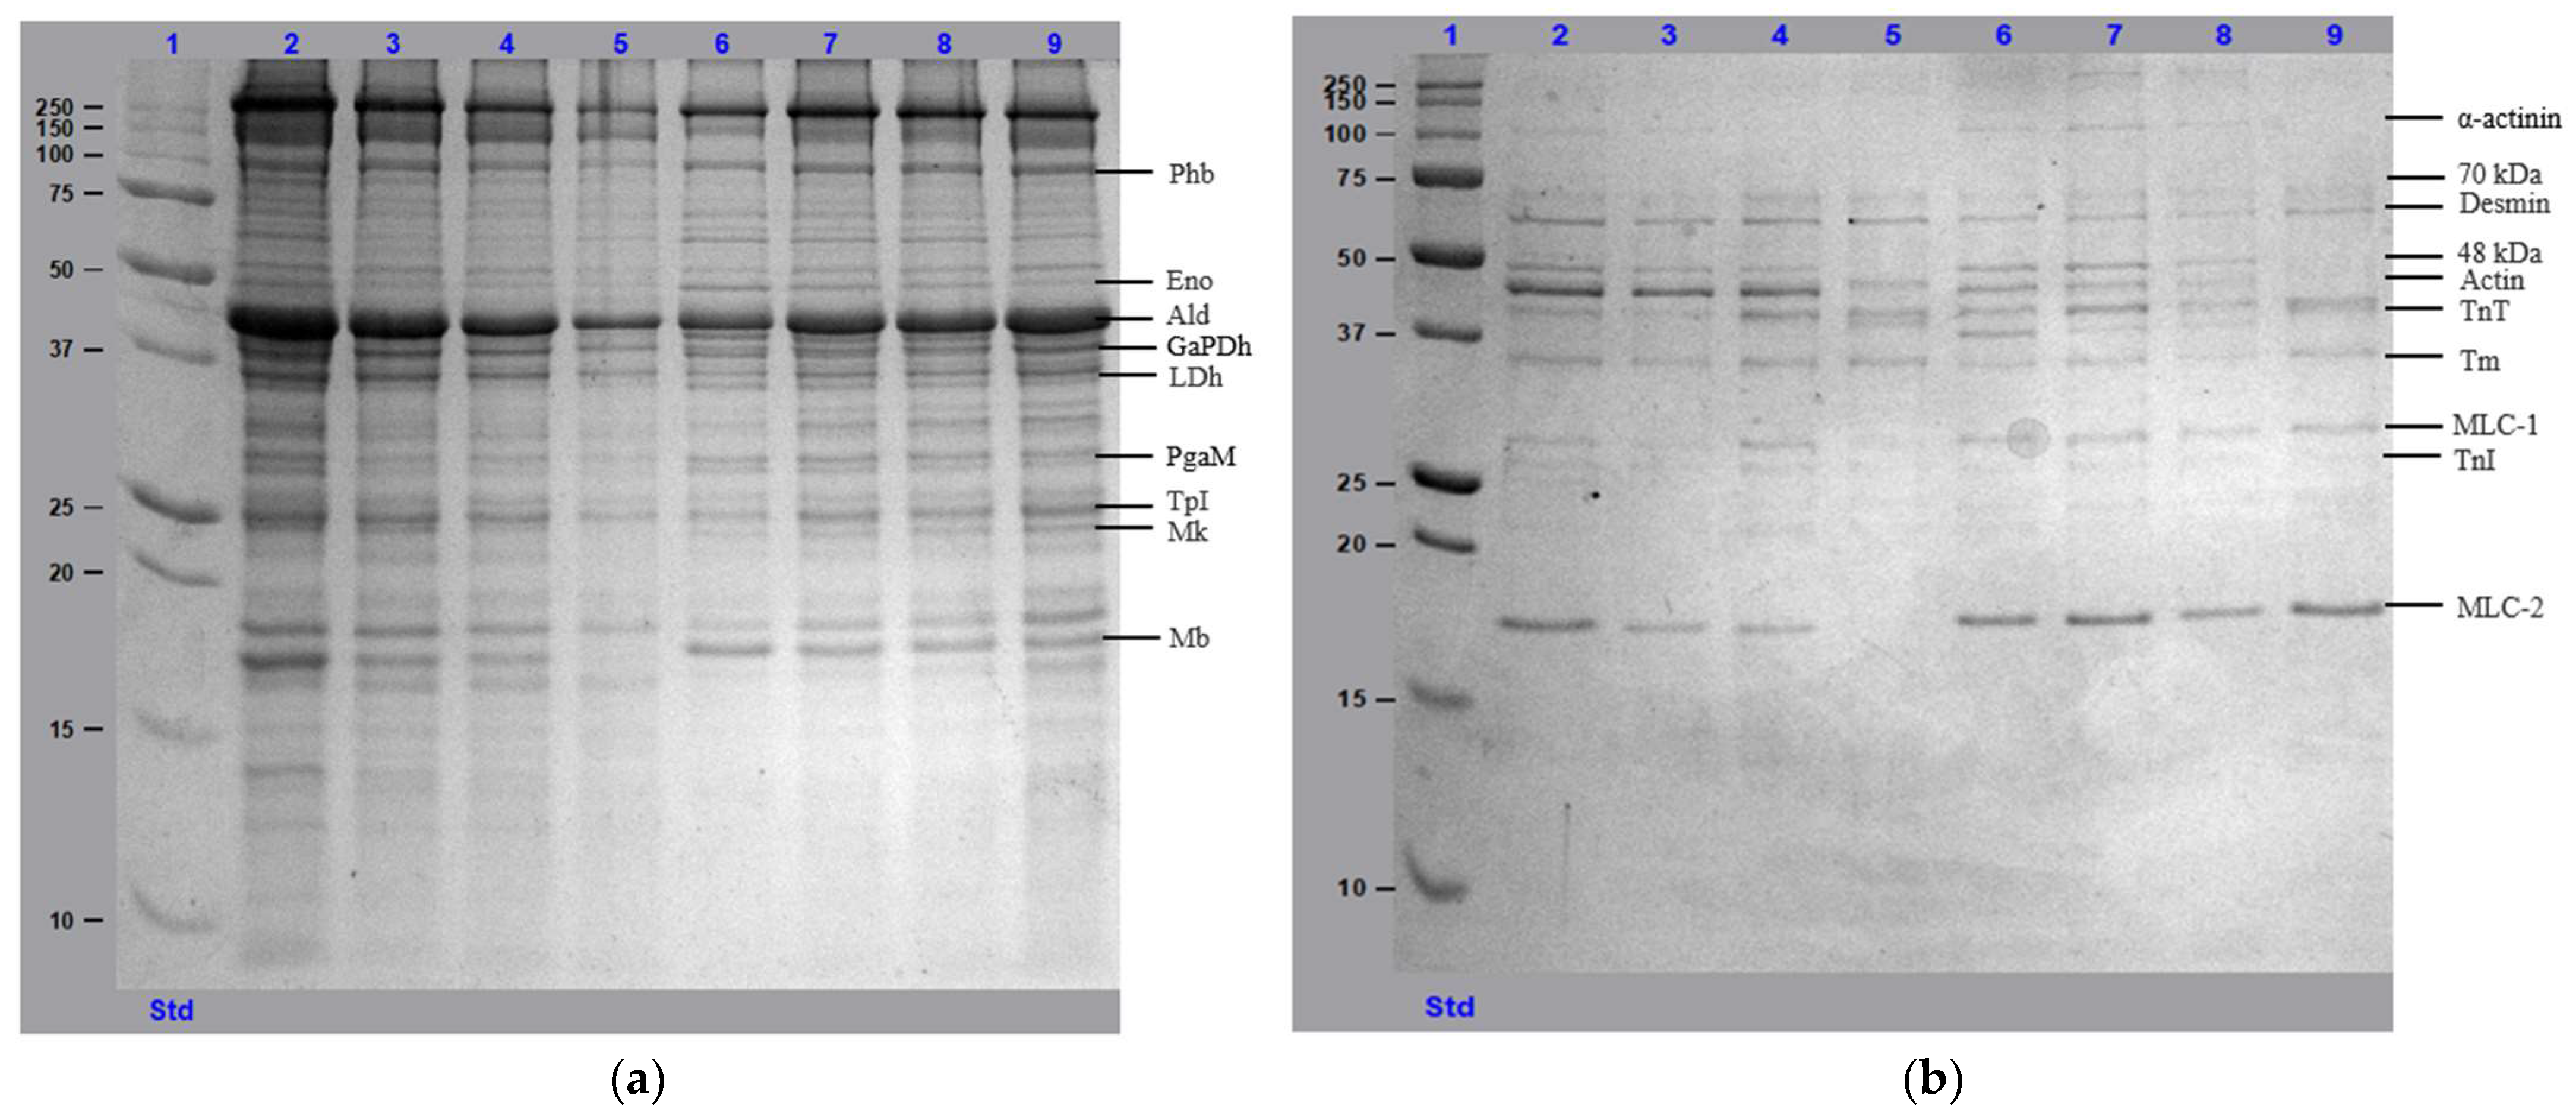
3.5. Protein Profile Analysis Using SDS-PAGE

The SDS-PAGE obtained by separating sarcoplasmic and myofibrillar proteins extracted from the non-treated and treated venison at 1, 7, 14, and 21 days of storage is shown in Figure 2a,b offers insight into the protective effects of the acid treatment on protein stability. The results demonstrate distinct differences in protein degradation between non-treated and treated samples, particularly regarding sarcoplasmic proteins involved in glycolysis and myofibrillar proteins critical for muscle structure.
Results showed that in non-treated samples, the storage period caused a notable reduction in the intensity of several sarcoplasmic protein bands, including phosphorylase b, beta-enolase, aldolase, glyceraldehyde 3-phosphate dehydrogenase (GaPDh), lactate dehydrogenase (LDh), phosphoglycerate mutase, myokinase, and triosephosphate isomerase (TpI). This decline in band intensity was particularly pronounced after 14 days of storage, which aligns with earlier studies indicating that protein degradation in aging meat is due to post-mortem enzymatic activity and the loss of protein solubility [58,59]. The degradation of glycolytic enzymes such as GaPDh, beta-enolase, and TpI, which are integral to the second phase of glycolysis, is also linked to the meat tenderization process, as has been observed in beef [60,61].
In contrast, the sarcoplasmic proteins in the treated samples exhibited greater stability throughout the storage period. Specifically, the intensity of bands corresponding to GaPDh, beta-enolase, and TpI was significantly higher in treated samples compared to non-treated samples, even after 21 days. This suggests that the acid treatment helped mitigate the degradation of these proteins, potentially through the antimicrobial and antioxidative properties of lactic acid and ascorbic acid, which can reduce proteolytic enzyme activity and oxidative stress. The preservation of these glycolytic enzymes could play a role in slowing down the tenderization process, contributing to prolonged meat quality during storage.
Another significant observation was the preservation of myoglobin in treated samples compared to non-treated ones. While myoglobin bands completely disappeared by day 21 in non-treated samples, they remained detectable, albeit at lower intensities, in treated samples. Since myoglobin is crucial for meat color, its preservation in treated samples is particularly important for maintaining a bright red color during storage, which is desirable for consumer acceptance [62].
The analysis of myofibrillar proteins further highlights the differences between non-treated and treated samples. In non-treated samples, aging led to the degradation of several key myofibrillar proteins, including α-actinin, actin, troponin-T (TnT), myosin light chain-1 (MLC-1), troponin-I (TnI), and myosin light chain-2 (MLC-2). These proteins showed a marked decrease in band intensity during the storage period, with many of them disappearing by day 14 or 21. This degradation is consistent with previous studies showing the breakdown of structural proteins such as actin and myosin during aging, contributing to the tenderization process and the breakdown of muscle fiber integrity [63,64,65].
However, the treated samples demonstrated better preservation of these myofibrillar proteins over the 21-day storage period. Proteins such as α-actinin, TnT, and MLC-1 exhibited significantly less degradation in treated samples compared to non-treated ones. In particular, TnT, which is known to degrade into multiple fragments during aging and plays a role in meat tenderization [66], remained more intact in treated samples. The treated group showed fewer degradation products for TnT, suggesting that the acid treatment helped maintain the integrity of myofibrillar proteins, likely by limiting proteolytic activity and protein denaturation.
The preservation of these structural proteins, particularly TnT and α-actinin, in the treated samples is indicative of reduced enzymatic activity, which could lead to improved textural properties in the treated meat over time. The stabilization of myofibrillar proteins may result in less extensive tenderization compared to non-treated samples, potentially contributing to better meat firmness and longer shelf life. The molecular weight bands at 70 kDa and 48 kDa, which increased in intensity after 14 days in non-treated samples, showed less pronounced changes in treated samples, further indicating that the acid mixture helped reduce protein degradation and maintain structural integrity.
The results of the SDS-PAGE analysis suggest that the combination of 2% lactic acid and 2% ascorbic acid effectively preserved both sarcoplasmic and myofibrillar proteins during aging, contributing to the overall stability of red deer meat during storage. The reduction in protein degradation in treated samples likely results from the antimicrobial properties of lactic acid and the antioxidative effects of ascorbic acid, which together help to mitigate both enzymatic proteolysis and oxidative stress. By preserving proteins involved in glycolysis and muscle structure, the acid treatment not only improved the chemical stability of the meat but also likely contributed to better color, texture, and tenderness over time.
In comparison, non-treated samples showed more rapid degradation of both sarcoplasmic and myofibrillar proteins, leading to greater tenderization but also a loss of protein integrity and potential declines in meat quality, such as reduced color stability and textural firmness. These findings highlight the importance of acid treatment in extending the shelf life and maintaining the quality of red deer meat during vacuum-packaged storage.

4. Conclusions

This study evaluated the effects of a 2% lactic acid (LA) and 2% ascorbic acid (AA) mixture on the quality of vacuum-packed wild red deer meat for 21 days at 4 ± 1 °C. The treatment significantly improved microbiological stability and meat tenderness without adversely affecting color or pH stability.
The pH of treated samples decreased initially due to the acidic treatment, but it remained stable compared to non-treated samples. The microbiological analysis revealed that the LA and AA mixture significantly reduced aerobic plate counts, suggesting a potential for extending the shelf life of vacuum-packed venison. Additionally, the treated venison exhibited reduced hardness, cohesiveness, and chewiness during storage, which aligns with improved meat tenderness. While no consistent differences in color were observed between treated and non-treated samples, the treatment’s non-significant impact on color is advantageous, as acids may otherwise negatively affect meat appearance.
Furthermore, the SDS-PAGE protein profile analysis showed that the LA and AA treatments helped preserve both sarcoplasmic and myofibrillar proteins, which are critical to maintaining meat quality during storage. Particularly, treated samples exhibited a slower degradation of key glycolytic enzymes and myoglobin, indicating that the acid treatment offers protective benefits against protein oxidation and degradation, contributing to prolonged quality preservation. Future research should focus on evaluating sensory attributes and the economic feasibility of implementing this treatment on a commercial scale.

Author Contributions

Conceptualization, M.E. (Munkhnasan Enkhbold) and A.V.-T.; methodology, A.L.; software, T.C.; validation, A.L., G.H. and L.F., formal analysis, A.B. (Annamária Barkó); investigation, M.E. (Munkhnasan Enkhbold), A.B. (Anikó Boros) and M.E. (Majd Elayan); resources, A.V.-T.; data curation, T.C.; writing—original draft preparation, M.E. (Munkhnasan Enkhbold); writing—review and editing, A.V.-T.; visualization, M.E.; supervision, A.V.-T.; project administration, G.H.; funding acquisition, L.F. All authors have read and agreed to the published version of the manuscript.

Funding

This research was funded by the ÚNKP-23-4 New National Excellence Program of the Ministry for Culture and Innovation from the source of the National Research, Development and Innovation Fund.

Institutional Review Board Statement

Not applicable.

Informed Consent Statement

Not applicable.

Data Availability Statement

The raw data supporting the conclusions of this article will be made available by the authors on request.

Acknowledgments

This research is supported by the Doctorial School of Food Science and by the Institute of Food Science and Technology, Hungarian University of Agriculture and Life Sciences. We are very thankful.

Conflicts of Interest

The authors declare no conflicts of interest.

References

  1. Soriano, A.; Cruz, B.; Gómez, L.; Mariscal, C.; García Ruiz, A. Proteolysis, physicochemical characteristics and free fatty acid composition of dry sausages made with deer (Cervus elaphus) or wild boar (Sus scrofa) meat: A preliminary study. Food Chem. 2006, 96, 173–184. [Google Scholar] [CrossRef]
  2. Vergara, H.; Gallego, L.; García, A.; Landete-Castillejos, T. Conservation of Cervus elaphus meat in modified atmospheres. Meat Sci. 2003, 65, 779–783. [Google Scholar] [CrossRef] [PubMed]
  3. Dransfield, E. Consumer acceptance—Meat quality aspects. In Consistency of Quality: Abstracts and Proceedings of the 11th International Meat Symposium, Centurion, South Africa, 29–30 January 2003; Agricultural Research Council (ARC): Hatfield, South Africa, 2003; pp. 146–159. [Google Scholar]
  4. Hoffman, L.C.; Wiklund, E. Game and venison—Meat for the modern consumer. Meat Sci. 2006, 74, 197–208. [Google Scholar] [CrossRef]
  5. Polak, T.; Rajar, A.; Gašperlin, L.; Žlender, B. Cholesterol concentration and fatty acid profile of red deer (Cervus elaphus) meat. Meat Sci. 2008, 80, 864–869. [Google Scholar] [CrossRef] [PubMed]
  6. Bureš, D.; Bartoň, L.; Kotrba, R.; Hakl, J. Quality attributes and composition of meat from red deer (Cervus elaphus), fallow deer (Dama dama) and Aberdeen Angus and Holstein cattle (Bos taurus). J. Sci. Food Agric. 2015, 95, 2299–2306. [Google Scholar] [CrossRef]
  7. Milczarek, A.; Janocha, A.; Niedziałek, G.; Zowczak-Romanowicz, M.; Horoszewicz, E.; Piotrowski, S. Health-promoting properties of the wild-harvested meat of roe deer (Capreolus capreolus L.) and red deer (Cervus elaphus L.). Animals 2021, 11, 2108. [Google Scholar] [CrossRef]
  8. Regulation (EC) No 853/2004 of the European Parliament and of the Council of 29 April 2004 Laying Down Specific Hygiene Rules for Food of Animal Origin. Available online: https://eur-lex.europa.eu/eli/reg/2004/853/oj (accessed on 29 September 2024).
  9. European Commission. Commission Regulation (EU) No 150/2011 of 18 February 2011 amending Annex III to Regulation (EC) No 853/2004 of the European Parliament and of the Council as regards farmed and wild game and farmed and wild game meat. Off. J. Eur. Union 2011, 46, 14–16. [Google Scholar]
  10. Regulation (EC) No 178/2002 of the European Parliament and of the Council of 28 January 2002 Laying Down the General Principles and Requirements of Food Law, Establishing the European Food Safety Authority and Laying Down Procedures in Matters of Food Safety. Available online: http://data.europa.eu/eli/reg/2002/178/oj (accessed on 29 September 2024).
  11. Regulation (EC) No 852/2004 of the European Parliament and of the Council of 29 April 2004 on the Hygiene of Foodstuffs. Available online: http://data.europa.eu/eli/reg/2004/852/oj (accessed on 29 September 2024).
  12. Castillo, A.; Lucia, L.M.; Goodson, K.J.; Savell, J.W.; Acuff, G.R. Comparison of Water Wash, Trimming, and Combined Hot Water and Lactic Acid Treatments for Reducing Bacteria of Fecal Origin on Beef Carcasses. J. Food Prot. 1998, 61, 823–828. [Google Scholar] [CrossRef]
  13. Aymerich, T.; Picouet, P.A.; Monfort, J.M. Decontamination technologies for meat products. Meat Sci. 2008, 78, 114–129. [Google Scholar] [CrossRef]
  14. Carpenter, C.E.; Smith, J.V.; Broadbent, J.R. Efficacy of washing meat surfaces with 2% levulinic, acetic, or lactic acid for pathogen decontamination and residual growth inhibition. Meat Sci. 2011, 88, 256–260. [Google Scholar] [CrossRef]
  15. Naveena, B.M.; Muthukumar, M.; Sen, A.R.; Babji, Y.; Murthy, T.R.K. Improvement of shelf-life of buffalo meat using lactic acid, clove oil, and vitamin C during retail display. Meat Sci. 2006, 74, 409–415. [Google Scholar] [CrossRef] [PubMed]
  16. Canto, A.C.V.C.S.; Costa-Lima, B.R.C.; Suman, S.P.; Monteiro, M.L.G.; Viana, F.M.; Salim, A.P.A.A.; Nair, M.N.; Silva, T.J.P.; Freitas, M.Q. Color attributes and oxidative stability of longissimus lumborum and psoas major muscles from Nellore bulls. Meat Sci. 2016, 121, 19–26. [Google Scholar] [CrossRef] [PubMed]
  17. Quilo, S.A.; Pohlman, F.W.; Dias-Morse, P.N.; Brown, A.H., Jr.; Crandall, P.G.; Story, R.P. Microbial, instrumental color and sensory characteristics of inoculated ground beef produced using potassium lactate, sodium metasilicate or peroxyacetic acid as multiple antimicrobial interventions. Meat Sci. 2010, 84, 470–476. [Google Scholar] [CrossRef] [PubMed]
  18. Soriano, A.; Sánchez-García, C. Nutritional composition of game meat from wild species harvested in Europe. Meat Nutr. 2021, 77–100. [Google Scholar] [CrossRef]
  19. Fooks, L.J.; Gibson, G.R. In vitro investigations of the effect of probiotics and prebiotics on selected human intestinal pathogens. FEMS Microbiol. Ecol. 2002, 39, 67–75. [Google Scholar] [CrossRef] [PubMed]
  20. Gill, C.O.; Badoni, M. Effects of peroxyacetic acid, acidified sodium chlorite or lactic acid solutions on the microflora of chilled beef carcasses. Int. J. Food Microbiol. 2004, 91, 43–50. [Google Scholar] [CrossRef]
  21. Makras, L.; De Vuyst, L. The in vitro inhibition of Gram-negative pathogenic bacteria by bifidobacteria is caused by the production of organic acids. Int. Dairy J. 2006, 16, 1049–1057. [Google Scholar] [CrossRef]
  22. Manzoor, A.; Jaspal, M.H.; Yaqub, T.; Haq, A.U.; Nasir, J.; Avais, M.; Asghar, B.; Badar, I.H.; Ahmad, S.; Yar, M.K. Effect of lactic acid spray on microbial and quality parameters of buffalo meat. Meat Sci. 2020, 159, 107923. [Google Scholar] [CrossRef]
  23. Mols, M.; Van Kranenburg, R.; Van Melis, C.; Moezelaar, R.; Abee, T. Analysis of acid-stressed Bacillus cereus reveals a major oxidative response and inactivation-associated radical formation. Environ. Microbiol. 2010, 12, 873–885. [Google Scholar] [CrossRef]
  24. Rodríguez-Melcón, C.; Alonso-Calleja, C.; Capita, R. Lactic acid concentrations that reduce microbial load yet minimally impact colour and sensory characteristics of beef. Meat Sci. 2017, 129, 169–175. [Google Scholar] [CrossRef]
  25. Bendich, A.; Machlin, L.J.; Scandurra, O.; Burton, G.W.; Wayner, D.D.M. The antioxidant role of vitamin C. Adv. Free Radic. Biol. Med. 1986, 2, 419–444. [Google Scholar] [CrossRef]
  26. Gaby, S.K.; Singh, V.N.; Vitamin, C. Vitamin Intake and Health: A Scientific Review; Gaby, S.K., Bendich, A., Eds.; Marcel Dekker: New York, NY, USA, 1991. [Google Scholar]
  27. Friedrich, L.; Siró, I.; Dalmadi, I.; Horváth, K.; Ágoston, R.; Balla, C. Influence of various preservatives on the quality of minced beef under modified atmosphere at chilled storage. Meat Sci. 2008, 79, 332–343. [Google Scholar] [CrossRef] [PubMed]
  28. Yu, H.; Zhang, S.; Liu, X.; Lei, Y.; Bai, Y.; Yang, Y.; Li, H.; Liu, Y.; Xiao, Y.; Xie, P.; et al. Effects of lactic acid and ascorbic acid electrostatic spraying on the physicochemical attributes and microbial diversity of beef aged at mild temperature (10° C). Meat Sci. 2024, 214, 109532. [Google Scholar] [CrossRef] [PubMed]
  29. Mokrzycki, W.S.; Tatol, M. Colour difference∆ EA survey. Mach. Graph. Vis. 2012, 20, 383–411. [Google Scholar]
  30. International Association of Microbiological Societies; International Commission on Microbiological Specifications for Foods; Roberts, T.A. Microorganisms in Foods: Sampling for Microbiological Analysis, Principles and Specific Applications; Blackie Acad. & Professional: London, UK, 1986. [Google Scholar]
  31. De Huidobro, F.R.; Miguel, E.; Blázquez, B.; Onega, E. A comparison between two methods (Warner–Bratzler and texture profile analysis) for testing either raw meat or cooked meat. Meat Sci. 2005, 69, 527–536. [Google Scholar] [CrossRef]
  32. Jonas, G.; Mertens, L.; Verheyen, D.; Crauwels, P.; Michiels, C.; Van Impe, J. Combined effects of high hydrostatic pressure and sodium nitrite on color, water holding capacity and texture of frankfurter. J. Phys. Conf. Ser. 2017, 950, 042006. [Google Scholar] [CrossRef]
  33. Csehi, B.; Szerdahelyi, E.; Pásztor-Huszár, K.; Salamon, B.; Tóth, A.; Zeke, I.; Jónás, G.; Friedrich, L. Changes of protein profiles in pork and beef meat caused by high hydrostatic pressure treatment. Acta Aliment. 2016, 45, 565–571. [Google Scholar] [CrossRef]
  34. Laemmli, U.K. Cleavage of Structural Proteins during the Assembly of the Head of Bacteriophage T4. Nature 1970, 227, 680–685. [Google Scholar] [CrossRef]
  35. Aktaş, N.; Aksu, M.I.; Kaya, M. The effect of organic acid marination on tenderness, cooking loss and bound water content of beef. J. Muscle Foods 2003, 14, 181–194. [Google Scholar] [CrossRef]
  36. Oreskovich, D.C.; Bechtel, P.J.; McKeith, F.K.; Novakofski, J.; Basgall, E.J. Marinade pH affects textural properties of beef. J. Food Sci. 1992, 57, 305–311. [Google Scholar] [CrossRef]
  37. Seuss, I.; Martin, M. The influence of marinating with food acids on the composition and sensory properties of beef. Fleischwirtschaft 1993, 73, 292–295. [Google Scholar]
  38. Goddard, B.L.; Mikel, W.B.; Conner, D.E.; Jones, W.R. Use of organic acids to improve the chemical, physical, and microbial attributes of beef strip loins stored at −1° C for 112 days. J. Food Prot. 1996, 59, 849–853. [Google Scholar] [CrossRef] [PubMed]
  39. Gill, C.O. Meat spoilage and evaluation of the potential storage life of fresh meat. J. Food Prot. 1983, 46, 444–452. [Google Scholar] [CrossRef]
  40. Jose, M.T.; Iyer, P.; Prabhakaran, P. Influence of pH on the keeping quality of beef. Kerala J. Vet. Sci. 1984, 15, 135–139. [Google Scholar]
  41. Kotula, K.L.; Thelappurate, R. Microbiological and sensory attributes of retail cuts of beef treated with acetic and lactic acid solutions. J. Food Prot. 1994, 57, 665–670. [Google Scholar] [CrossRef] [PubMed]
  42. Stivarius, M.R.; Pohlman, F.W.; McElyea, K.S.; Waldroup, A.L. Effects of hot water and lactic acid treatment of beef trimmings prior to grinding on microbial, instrumental color and sensory properties of ground beef during display. Meat Sci. 2002, 60, 327–334. [Google Scholar] [CrossRef]
  43. Pierson, M.D.; Collins-Thompson, D.L.; Ordal, Z.J. Microbiological, sensory, and pigment changes of aerobically and anaerobically packaged beef. Food Technol. 1970, 24, 129–133. [Google Scholar]
  44. Renerre, M.; Labas, R. Biochemical factors influencing metmyoglobin formation in beef muscles. Meat Sci. 1987, 19, 151–165. [Google Scholar] [CrossRef] [PubMed]
  45. Sahoo, J.; Anjaneyulu, A.S.R. Quality improvement of ground buffalo meat by preblending and vacuum packaging. Fleischwirtsch. Int. 1997, 5, 15–19. [Google Scholar]
  46. Capita, R.; Alonso-Calleja, C.; Rodríguez-Pérez, R.; Moreno, B.; García-Fernández, M.D.C. Influence of poultry carcass skin sample site on the effectiveness of trisodium phosphate against Listeria monocytogenes. J. Food Prot. 2002, 65, 853–856. [Google Scholar] [CrossRef]
  47. Acuff, G.R.; Vanderzant, C.; Savell, J.W.; Jones, D.K.; Griffin, D.B.; Ehlers, J.G. Effect of acid decontamination of beef subprimal cuts on the microbiological and sensory characteristics of steaks. Meat Sci. 1987, 19, 217–226. [Google Scholar] [CrossRef] [PubMed]
  48. Bosilevac, J.M.; Nou, X.; Barkocy-Gallagher, G.A.; Arthur, T.M.; Koohmaraie, M. Treatments using hot water instead of lactic acid reduce levels of aerobic bacteria and Enterobacteriaceae and reduce the prevalence of Escherichia coli O157 on preevisceration beef carcasses. J. Food Prot. 2006, 69, 1808–1813. [Google Scholar] [CrossRef] [PubMed]
  49. Shivas, S.D.; Kropf, D.H.; Hunt, M.C.; Kastner, C.L.; Kendall, J.L.A.; Dayton, A.D. Effects of ascorbic acid on display life of ground beef. J. Food Prot. 1984, 47, 11–15. [Google Scholar] [CrossRef] [PubMed]
  50. Bogdanowicz, J.; Cierach, M.; Żmijewski, T. Effects of aging treatment and freezing/thawing methods on the quality attributes of beef from Limousin × Holstein-Friesian and Hereford × Holstein-Friesian crossbreeds. Meat Sci. 2018, 137, 71–76. [Google Scholar] [CrossRef] [PubMed]
  51. Marino, R.; Albenzio, M.; della Malva, A.; Santillo, A.; Loizzo, P.; Sevi, A. Proteolytic pattern of myofibrillar protein and meat tenderness as affected by breed and aging time. Meat Sci. 2013, 95, 281–287. [Google Scholar] [CrossRef]
  52. Silva, L.H.P.; Rodrigues, R.T.S.; Assis, D.E.F.; Benedeti, P.D.B.; Duarte, M.S.; Chizzotti, M.L. The relationship between water-M.L. Explaining meat quality of bulls and steers by differential proteome and phosphoproteome analysis of skeletal muscle. J. Proteom. 2019, 199, 51–66. [Google Scholar] [CrossRef]
  53. Buts, B.; Claeys, E.; Demyer, D. Relation between concentration of troponin-T, 30,000-Dalton, and titin on SDS–PAGE and tenderness of bull longissimus dorsi. In Proceedings of the 32nd European Meeting of Meat Research Workers, Ghent, Belgium, 24–29 August 1986; pp. 24–29. [Google Scholar]
  54. Gault, N.F.S. The relationship between water-holding capacity and cooked meat tenderness in some beef muscles as influenced by acidic conditions below the ultimate pH. Meat Sci. 1985, 15, 15–30. [Google Scholar] [CrossRef]
  55. Wenham, L.M.; Locker, R.H. The effect of marinading on beef. J. Sci. Food Agric. 1976, 27, 1079–1084. [Google Scholar] [CrossRef]
  56. Stanton, C.; Light, N. The effects of conditioning on meat collagen: Part 4—The use of pre-rigor lactic acid injection to accelerate conditioning in bovine meat. Meat Sci. 1990, 27, 141–159. [Google Scholar] [CrossRef]
  57. Eilers, J.D.; Vellve, L.T.; Ma, M.; Baldwin, R.R.; Harris, J.S.; Oltjen, J.W. Evaluation of calcium chloride and lactic acid injection on chemical, microbiological and descriptive attributes of mature cow beef. Meat Sci. 1994, 38, 443–451. [Google Scholar] [CrossRef]
  58. Laville, E.; Savell, J.W.; Reed, R.B.; Meullenet, J.F.; Schilling, D.R.; McKeith, F.K. Proteome changes during meat aging in tough and tender beef suggest the importance of apoptosis and protein solubility for beef aging and tenderization. J. Agric. Food Chem. 2009, 57, 10755–10764. [Google Scholar] [CrossRef] [PubMed]
  59. Marcos, B.; Kerry, J.P.; Mullen, A.M. High pressure induced changes on sarcoplasmic protein fraction and quality indicators. Meat Sci. 2010, 85, 115–120. [Google Scholar] [CrossRef]
  60. Joo, S.T.; Kauffman, R.G.; Kim, B.C.; Park, G.B. The relationship of sarcoplasmic and myofibrillar protein solubility to colour and water-holding capacity in porcine longissimus muscle. Meat Sci. 1999, 52, 291–297. [Google Scholar] [CrossRef]
  61. Marino, R.; Albenzio, M.; della Malva, A.; Caroprese, M.; Santillo, A.; Sevi, A. Changes in meat quality traits and sarcoplasmic proteins during aging in three different cattle breeds. Meat Sci. 2014, 98, 178–186. [Google Scholar] [CrossRef]
  62. Mancini, R.A.; Hunt, M.C. Current research in meat color. Meat Sci. 2005, 71, 100–121. [Google Scholar] [CrossRef] [PubMed]
  63. Muroya, S.; Kitamura, S.; Tanabe, S.; Nishimura, T.; Nakajima, I.; Chikuni, K. N-terminal amino acid sequences of troponin T fragments, including 30 kDa one, produced during postmortem aging of bovine longissimus muscle. Meat Sci. 2004, 67, 19–24. [Google Scholar] [CrossRef]
  64. Bowker, B.C.; Fahrenholz, T.M.; Paroczay, E.W.; Eastridge, J.S.; Solomon, M.B. Effect of hydrodynamic pressure processing and aging on the tenderness and myofibrillar proteins of beef strip loins. J. Muscle Foods 2008, 19, 74–97. [Google Scholar] [CrossRef]
  65. Rowe, L.J.; Maddock, K.R.; Lonergan, S.M.; Huff-Lonergan, E. Influence of early postmortem protein oxidation on beef quality. J. Anim. Sci. 2004, 82, 785–793. [Google Scholar] [CrossRef]
  66. Lonergan, E.H.; Zhang, W.; Lonergan, S.M. Biochemistry of postmortem muscle—Lessons on mechanisms of meat tenderization. Meat Sci. 2010, 86, 184–195. [Google Scholar] [CrossRef]
Figure 1. Means ± standard error for aerobic plate count (log CFU/g) of treated (2% lactic acid and 2% ascorbic acid mixture) and non-treated (control) vacuum-packed venison samples during 21 days of retail display at 4 ± 1 °C. Means with no letters (a and b) in common indicate significant differences in treatment effects (p < 0.05).
Applsci 14 08915 g001
Figure 2. SDS-PAGE patterns of (a) sarcoplasmic and (b) myofibrillar proteins from treated (2% lactic acid and 2% ascorbic acid mixture) and non-treated (control) venison samples after 1, 7, 14, and 21 days in vacuum packaging at 4 ± 1 °C. (Lane 1 molecular weight standard; Lanes from 2 to 5, non-treated samples of day 1, 7, 14, and 21; Lanes from 6 to 9, treated samples of day 1, 7, 14, and 21; Phb = Phosphorylase b; Eno = beta-enolase; Ald = Aldolase; GaPDh = Glyceraldehyde 3-phosphate dehydrogenase; LDh = Lactate dehydrogenase; PgaM = Phosphoglycerate mutase; TpI = Triosephosphate isomerase; Mk = Myokinase; Mb = Myoglobin; TnT = Troponin-T; Tm = Tropomyosin; MLC = Myosin light chain; TnI = Troponin-I).
Applsci 14 08915 g002
Table 1. pH and instrumental color parameters (lightness (L*), redness (a*), yellowness (b*), hue angle, and chroma) of treated (2% lactic acid and 2% ascorbic acid mixture) and non-treated (control) venison steaks at each measurement day at 4 ± 1 °C.
CharacteristicsDay 1Day 7Day 14Day 21SE
pHTreated5.60bx5.57bx5.33ax5.38ax0.06745
Non-treated5.68cy5.56bcx5.38ax5.31ax0.0843
L*Treated30.2bx29.1abx27.5ax28.6abx0.56051
Non-treated30.3ax29.4ax30.0ay29.5ax0.21213
a*Treated9.4ax9.6ax11.1bx11bx0.44977
Non-treated9.2ax10ax11.3bx11.8bx0.59494
b*Treated2.0ax2.4bx2.1ay2.4bx0.10308
Non-treated2.2bx2.2bx1.8ax2.4bx0.12583
Hue angle (°)Treated0.21ax0.24bx0.18ax0.22bx0.0125
Non-treated0.23bx0.21bx0.16ax0.20abx0.01472
ChromaTreated9.6ax9.9ax11.3bx11.1bx0.43842
Non-treated9.4ax10.3ax11.4bx12.0by0.58768
Means in the same row within an attribute with no letters in common (a, b, c; superscript) indicate significant differences across storage periods (p < 0.05); means in the same column with no letters in common (x, y; subscript) indicate significant differences in treatment effects (p < 0.05). Comparisons were made on an individual trait level (pH, L*, a*, b*, hue angle, chroma).
Table 2. Hardness, cohesiveness, springiness, and chewiness of treated (2% lactic acid and 2% ascorbic acid mixture) and non-treated (control) venison steaks at each measurement day at 4 ± 1 °C.
Characteristics Day 1Day 7Day 14Day 21SE
Hardness (N)Treated 22.45bx20.43bx10.22ax10.64ax3.206094
Non-treated 23.76bx22.61bx16.17ay12.52ax2.668772
Cohesiveness (-)Treated 0.37bx0.32ax0.29ax0.29ax0.018875
Non-treated 0.39bx0.34abx0.31ay0.29ax0.021747
Springiness (mm)Treated 0.80ax0.81ax0.80ax0.81ax0.002887
Non-treated 0.89by0.83ax0.89by0.88by0.014361
Chewiness (mJ)Treated 6.69bx5.23bx2.42ax2.56ax0.889616
Non-treated 8.36cx6.36bx4.46aby3.25ax1.356622
Means in the same row within an attribute with no letters in common (a, b, c; superscript) indicate significant differences across storage periods (p < 0.05); means in the same column with no letters in common (x, y; subscript) indicate significant differences in treatment effects (p < 0.05). Comparisons were made on an individual texture parameter level.
Disclaimer/Publisher’s Note: The statements, opinions and data contained in all publications are solely those of the individual author(s) and contributor(s) and not of MDPI and/or the editor(s). MDPI and/or the editor(s) disclaim responsibility for any injury to people or property resulting from any ideas, methods, instructions or products referred to in the content.

