Article

Predicting and Analyzing Electric Bicycle Adoption to Enhance Urban Mobility in Belgrade Using ANN Models

by
Jelica Komarica
*,
Draženko Glavić
and
Snežana Kaplanović
Faculty of Transport and Traffic Engineering, University of Belgrade, 11000 Belgrade, Serbia
*
Author to whom correspondence should be addressed.
Appl. Sci. 2024, 14(19), 8965; https://doi.org/10.3390/app14198965
Submission received: 9 September 2024 / Revised: 2 October 2024 / Accepted: 3 October 2024 / Published: 5 October 2024
(This article belongs to the Special Issue Sustainable Urban Mobility)

Abstract

:
The development of alternative environmentally friendly modes of transportation is becoming an increasingly promising solution in traffic-congested and polluted urban areas. E-bikes, as one of them, are recognized as an ecologically sustainable means of transportation that has significant potential to replace motorized modes of transportation that can improve urban mobility. Relying on artificial intelligence and considering an ecological approach when considering the acceptability of e-bikes by setting a direct question for users influences the development of an innovative way of understanding and evaluating the use of more sustainable modes of transportation. In this regard, this study aims to elucidate the main variables influencing the acceptability of e-bike use using artificial neural network (ANN) models—multilayer perceptron (MLP) and radial basis function (RBF). For training and testing the models, data from a random sample obtained through an online questionnaire, which was answered by 626 residents of Belgrade (Serbia), were used. A multilayer perceptron with nine and seven neurons in two hidden layers, respectively, hyperbolic tangent activation function in the hidden layer and identity function in the output layer, gave better results than the radial basis function model. With an accuracy of 89%, a precision of 83%, a recall of 79%, and an area under the receiver operating characteristic (ROC) curve of 0.927, the multilayer perceptron model recognized the influential variables in predicting acceptability. The results of the model indicate that the mileage traveled, the frequency of motorcycle use, the respondents’ awareness of the pollution in Belgrade, and the age of the respondents have the greatest influence on the acceptability of using e-bikes. In addition to majority acceptability (69.8%), the results obtained by the model can represent a useful basis for decision-makers when defining strategies for the development and application of e-bikes while reducing traffic congestion and environmental pollution in Belgrade.

1. Introduction

The need for the development of alternative modes of transportation arises as a consequence of the increasing use of passenger cars and the appearance of traffic congestion. As the dominant mode of transportation in urban areas, passenger cars not only result in traffic congestion but also increased energy consumption, space occupation, noise, and increased emissions, leading to environmental pollution and the degradation of transportation and other urban services [1,2,3]. This is evidenced by the fact that energy consumption during commute is closely related to the growth of carbon dioxide (CO2) emissions [4,5,6] and numerous negative effects on public health and the environment [7]. According to estimates, by 2050, as much as 68% of the world’s population will be concentrated in urban areas, while transportation requirements will double. Consequently, the need for sustainable urban mobility is becoming more and more important and necessary. The goal of adopting sustainable traffic habits is a priority not only at the local but also at the regional, national, and Europe-wide levels [8]. The creators of transport policies have identified the current need for the improvement in urban transport, as well as for the development of transport services that offer more efficient and sustainable mobility solutions, which are adapted to the needs of users. In this regard, electric mobility, including electric bicycles, applied to both private and public transport, is one of the most promising solutions for reducing air pollution in densely populated areas, as well as for expanding accessibility and inclusiveness [9,10].
An electric bicycle (hereafter e-bike) is a type of electric vehicle based on a traditional bicycle with an electric motor added to help propel it, using a battery as a power source [11,12]. Its production began almost simultaneously with the production of traditional bicycles. The fact that during the 1890s, several patents were granted for electric motors for bicycles also speaks of this [13]. However, their expansion followed only at the beginning of the 21st century due to the increased use of lithium and lithium-ion batteries and thanks to the production of bicycles of lower weight. This is evidenced by the fact that from a global point of view, slightly more than 40 million e-bikes were sold worldwide in 2015, of which more than 90% were in China, 5% in Europe, and only 0.7% in the USA. On the other hand, from the point of view of e-bike performance regulations in the global market, considering the aspect of motor power (W) and maximum speed (km/h) limitations, in the US the power is limited to 750 W and speed to 32 km/h, in the EU from 250 to 100 W and 25 km/h, and in China no engine power limit and 25 km/h, though the e-bike must weigh less than 45 kg [14,15].
In addition to performance and easy handling, the main advantages of e-bikes are its economic benefits and very low impact on the environment. The main economic advantage of e-bikes relates to the total cost per kilometer traveled (including energy, purchase, and maintenance), which is less than 0.007 USD/km, compared to 0.031 USD/km for a gasoline scooter [16] or 0.62 USD/km for trips by passenger car. Also, e-bike batteries can be charged by plugging in or charging while pedaling at certain speeds. In this regard, a typical e-bike takes 6–8 h to charge the battery [17] and can have a travel range of 35 to 50 km at a speed of about 20 km/h (depending on the weight of the rider) [18]. On the other hand, the e-bike as a new mode of private transportation has led to a new approach to mobility, especially in cities, both for countries with large populations and for countries that care about the environment. From an environmental point of view, the use of an electric bicycle as an alternative mode of transportation can prevent environmental pollution, bearing in mind that in urban areas, the emissions generated by gasoline cars include HC of 3.57 g/km, CO of 3.15 g/km, CO2 of 1.82 g/km, and NOX of 2.29 g/km [19,20]. Taking into account CO2 emission rates during the life cycle as well as changes in transport behavior caused by the use of e-bikes, it is estimated that any adoption of this mode of transport will result in a reduction in net CO2 emissions of over 460 kg per year [21]. Also, it is important to point out that e-bikes produce almost no noise [22].
In addition, the e-bike has become a leader in individual mobility, especially in cities with a pronounced problem of traffic congestion, a limited number of parking spaces, and increased emissions [23,24,25]. Compared to similar modes of transportation, such as e-scooters, e-bikes are designed with features that contribute to reducing problems such as small longitudinal length and low carbon emission; they do not oblige users to use helmets, do not require registration or tax payments, and do not require driver’s licenses, which makes them very popular [23,24]. On the other hand, seeing the potential of such vehicles as a replacement for passenger cars, many governments are interested in stimulating the use of electric bicycles in many countries [26,27]. So, there are different types of financial incentives, such as purchase incentives like the free use of electric bicycles, vouchers, cash prizes based on smartphone applications, etc. [19,28,29,30]. Thus, according to the results of the conducted research, users are additionally motivated, and due to the existence of financial incentives for using e-bikes, they increasingly decide to use them both to go to work [31], and from the aspect of a more active lifestyle [32,33].
However, to increase the share of e-bikes in local communities and cities, the perceptions and demands of cyclists play a key role, yet have not been sufficiently explored [34]. This is further contributed to by the lack of awareness of the effects of using e-bikes, both from the perspective of users and the perspective of society. The lack of traffic infrastructure, which results in safety concerns during movement, can also be one of the limiting factors of acceptance of e-bikes in addition to their cost and accessibility. On the other hand, the lack of awareness of environmental pollution caused by road traffic and motorized modes of transport can be an obstacle to improving sustainable urban mobility.
Bearing this in mind, this paper aims to analyze the influence of certain factors and predict the acceptability of the use of e-bikes by the residents of Belgrade (Serbia), who face the problems of traffic congestion and environmental pollution on the daily. Consequently, the focus of this paper is on understanding the attitudes of respondents who currently do not use e-bikes regarding reasons for not using them and environmental pollution in Belgrade caused by vehicles in road traffic. With the help of the data obtained from this research, it is possible to determine how artificial neural network models can contribute in terms of assessing the importance of the mentioned influences as well as the views of respondents regarding the use of e-bikes. Focusing on the attitudes of respondents regarding awareness of environmental pollution not only reflects the importance of that aspect in the form of the acceptability of e-bikes but also affects the improvement in environmental awareness and the promotion of sustainable urban mobility. The general shortcoming of previous research is that the adoption of a mode of transportation was based on a choice between several modes of transportation offered. On the other hand, this research dealt with the acceptability of only one mode of transportation by asking the user a direct question about its use from the considered aspect, which further highlights the importance of this research. Also, accordingly, the novelty provided by this study refers to the application of artificial neural networks that have not yet been applied to such research. In addition to the above, the contribution of this work is reflected in a comprehensive data analysis, which can be a useful basis for decision-making when defining strategies for reducing traffic congestion and environmental pollution.
This work is further organized into six more sections, including a presentation of the relevant literature through related works that indicate the most significant and interesting results of the application of classification algorithms. Then, it delves into the mathematical background of the applied models of artificial neural networks, the work methodology indicating the steps of the conducted research, an overview of the analyzed results, a discussion of the obtained results, and a conclusion.

2. Related Work

2.1. What Does the Use of e-Bikes Depend On?

The choice of the mode of transportation of individuals very often depends on the purpose of the trip (travel to work, shopping, recreation, etc.) and specific attributes of the trip (including distance, location, and time requirements) [35]. Therefore, it is important to understand from what aspect e-bikes are used, such as mileage and purpose of use, in order to understand the contexts in which e-bikes could be incorporated into current transportation systems. In addition to the existence of travel choices, the decision to use e-bikes during travel should be determined by a series of perceptions of individuals and the environment in general [36].
Namely, many studies have found that men are more inclined to use e-bikes compared to women (e.g., [37,38,39]), and that younger users, in addition to being more willing to use e-bikes, cross longer distances than the elderly [40,41]. On the other hand, several studies have noted that e-bike ownership and use are positively related to household income [12,42]. On the other hand, the distance covered when using e-bikes depended on the stated purpose, where users for recreational purposes covered longer distances when traveling compared to those who used e-bikes when traveling to work [43]. However, there are more and more cases in which users use e-bikes more often when traveling to work than for leisure [44,45].
Compared to passenger cars, e-bikes enable more flexible and cheaper transportation in urban areas for shorter journeys with no parking restrictions. This is evidenced by the results of studies in which the percentage of car trips replaced by e-bikes on short trips, after purchasing e-bikes, ranged from 20% to 86% [40,46,47]. In addition, e-bikes have replaced public transportation with a trip replacement proportion of 3% to 45%. However, it is important to highlight the fact that the impact of e-bikes on travel behavior is largely influenced by the primary mode of travel prior to the use of e-bikes [48]. For example, in Denmark, research showed that e-bike users replaced conventional bicycle trips (64%), car trips (49%), and bus trips (48%) [43]. In comparison, research in the United Kingdom found that 43% of the employed users observed reported less car use as drivers, 37% reported less walking, 33% reported less bus travel, and 25% reported less conventional cycling during the examination [49].
Potential users of e-bikes usually have a pro-environmental and technophile attitude. E-bike use is mostly driven by perceived usefulness, which in turn depends on ease of use, appropriate infrastructure, and user norms and attitudes toward the environment and physical activity [41]. Pro-environmental attitudes, along with others such as perceived usefulness and knowledge of sustainable modes of transport, have been found to influence the choice of active and sustainable modes of transport [50]. In particular, the choice to travel by bicycle can be linked to environmental conservation goals, such as reducing the dispersion of particles in the air that result in pollution. On the other hand, the quality and availability of separate cycling infrastructure are often cited as drivers or barriers to the use of e-bikes. Poor cycling infrastructure as an indicator of e-bike use, in a study conducted in the United Kingdom, significantly influenced the use of e-bikes. The main conclusion of the study is that high-quality cycle paths that can accommodate larger bicycles, tricycles, and cargo bikes are particularly important if the potential of e-bikes is to be realized [51]. Similarly, in the context of e-bike use in Austria, 58% of respondents had said they would use an e-bike more if bike lanes were expanded and better maintained [41].
In addition to the above, the most common environmental barrier to e-cycling was safety concerns, especially when riding in motorized traffic or with vulnerable road users (i.e., pedestrians or conventional cyclists) [36]. Among other things, this is preceded by a lack of cycling infrastructure or poorly maintained cycling infrastructure. However, most studies claim that from the perspective of e-bike users, its speed created dangerous situations, which negatively affected the perception of safety [43,45]. On the other hand, for individuals commuting to the city, the lack of charging or parking was a barrier to riding e-bikes [52]. Weather, especially rain, was a common obstacle for e-cycling [53].

2.2. Which Models Should Be Used to Predict Mode Choices?

Traditionally, research related to the change in transport behavior is primarily supported by discrete choice models, like logit models, such as multinomial logit models, nested logit models, and mixed logit models. This is evidenced by numerous studies, such as the one conducted in Xi’an (China), in which the authors Ma et al. [54] used a nested logit model to investigate the behavior of commuters in the joint choice of travel time and mode by considering factors such as socio-demographic and economic characteristics, household characteristics, and travel. The results of the study indicate that transport behavior is most influenced by household income and the distance traveled during the trip. In addition to the above, the authors Al-Salih and Esztergar-Kiss [55] used data obtained through a study conducted in Budapest (Hungary) to apply the multinomial logit model (MNL) and the nested logit model based on the utility function. By analyzing the results, it was found that the most important variables, namely the distance during the trip, then the time of the trip and its purpose, had the greatest influence on the choice of the mode of transportation. On the other hand, the authors Faber et al. [56] found, using a cross-sectional and longitudinal structural equation model, that the use of public transport is most affected by the built environment, while the use of cars and bicycles is hardly affected. However, in recent years, machine learning has become more and more present in many scientific fields, which has also influenced the growth of interest in its application in modeling the behavior of individuals when choosing to travel [57].
Compared to statistical models that are based on a mathematically proven theoretical foundation, machine learning methods are non-parametric, relying on computers to examine data for their structure without any theory about what the underlying structure of the data is. This enables them to form more flexible modeling structures, which can often lead to greater predictive ability, i.e., greater accuracy of model predictions. In this regard, the modeling of travel mode choice can often be viewed as a classification problem, providing an alternative to logit models. In support of this, there are more and more studies that indicate that machine learning classifiers are more effective in modeling the travel behavior of individuals compared to logit models [58,59,60,61,62]. Also, among the machine learning models that were used in studies that dealt with the modeling of behavior when choosing a mode of transport, the models of artificial neural networks can be distinguished by their significant predictive capabilities [63,64,65].
For example, the results of a study conducted in Luxembourg by the authors Omrani et al. [66] indicate that when predicting the way individuals travel in the city, better results were given by the artificial neural network models (MLP) 80.12% and (RBF) 81.0% compared to the multinomial logit model (MNL), whose prediction accuracy was only 62%. The data used contained information on various attributes such as characteristics of individuals, data related to places of residence, and specifications of work and transport modes. Also, a study conducted only a few years later by Omrani et al. [59] confirms the very good results of predicting travel patterns in Luxembourg by artificial neural networks. Namely, with an accuracy of 81.1%, the multilayer perceptron neural network gave far better results compared to the radial basis function (79.2%), a support vector machine (67.7%), and multinomial logistic regression (64.7%). Similar results were obtained by Lee et al. [67] within the framework of the conducted study, which applied four models of artificial neural networks (ANNs) and a multinomial logit model (MNL) to predict transportation behavior in Chicago (USA). The results show that ANN models outperform MNL, with a prediction accuracy around 80% compared to 70% for MNL. The study by Eromietse and Joseph [68] also confirms these previous findings, indicating that the radial basis function (RBF) can better predict the rate of realization of trips in Akura (Nigeria) than the regression model (MLR). Modeling results showed that RBF showed higher accuracy, with an R2 value of 0.947 and RE of 0.391, compared to MLR, with an R2 value of 0.589 and RE of 0.875. Also, the results indicate that the number of household members, the number of employed household members, the number of students in the household, the number of household members over the age of 12, and the number of household members who have a driver’s license represent variables that have a significant impact on trip generation rates.
In addition to the above, the authors Assi et al. [69] applied models such as an extreme learning machine (ELM), support vector machine (SVM), and multilayer perceptron neural network for their research to predict the behavior of students who choose the mode of transportation on the way to school in the cities of Al-Khobar and Dhahran in the Kingdom of Saudi Arabia. Multilayer perceptron stands out with the highest prediction accuracy (98.99%), followed by extreme learning machines (97.30%) and support vector machines (89.53%). Also, the results indicate that the most sensitive variables that influence the choice of travel method are household income, travel time, and parents’ education level. These results are also confirmed by the study by Xie et al. [58] conducted in San Francisco (California), which applied two machine learning models (decision tree (DT) and neural network) and a multinomial logit model to model the choice of travel mode. Like the previously presented results, the artificial neural network gave the best prediction results (88.0% and 78.2%, respectively) in comparison to the decision tree (86.0% and 76.8%, respectively) and the multinomial logit model (86.7% and 72.9%, respectively). Also, the most significant variables for the choice of travel mode include household size, number of vehicles in the household, gender, having a driver’s license, travel time, time of day, and travel costs. In addition to the above, binary logistic regression (BLR) was also used in the study by Komarica et al. [70], and gave worse prediction results compared to a multilayer perceptron neural network. Namely, with an accuracy of 85%, the multilayer perceptron correctly predicted and detected significant variables during the acceptability of electric microvehicles in Belgrade (Serbia). The results indicate that the respondents’ attitude toward current environmental pollution, frequency of using modes of transport such as bicycles and motorcycles, mileage traveled, and personal income have the greatest influence on acceptability. On the other hand, the results of a study conducted in the city of Tongling (China) indicate that artificial neural networks do not always give the best results. Namely, the authors Tang et al. [71] used the extended structure of the naïve Bayesian model to predict the travel mode choice, which achieved better performance for its prediction accuracy of 75.4% compared to the artificial neural network model, whose prediction accuracy was 72.2%.
The previously presented studies show that the prediction accuracy of the logit model is not always a significant and reliable method. This is indicated by the obtained results of the studies, which highlight the limitations of traditional models in terms of complexity, and at the same time, the assumption of linearity, which represents a significant disadvantage when there is a large sample volume. On the other hand, although based on nonlinear relations, models like support vector machines and decision trees face limitations in terms of their need to form a large number of kernel tricks and decision trees, which often require manual adjustments and cannot always cover all nonlinear relations. Algorithms such as the k-nearest neighbor algorithm and the Bayesian classifier are characterized by similar shortcomings, which are contributed by prediction results without prior learning and independence assumptions, which prevent these models from having the enviable power of classifying more complex data. The aforementioned limitations can be replaced by the application of artificial neural network models that provide the possibility of modeling complex nonlinear relationships thanks to layers with nonlinear activation functions, giving better predictive results. This is evidenced by recent studies that show that artificial neural networks are an effective alternative for predicting travel modes (see Table 1). Although the focus of the analyzed studies was on the choice of the mode of travel, what is common to the study conducted in this paper is the analysis of the factors that influence their case choice, and in the present case, the acceptability of e-bikes. Accordingly, finding a more efficient method is very challenging because, in addition to the choice of travel method, the willingness to accept a new mode of transportation is a very complex process.
In this regard, this paper will try to use two different artificial neural network models (multilayer perceptron and radial basis function) to reveal the variables that have the greatest influence on the choice of electric bicycles during trips and indicate their predictive power.

3. Materials and Methods

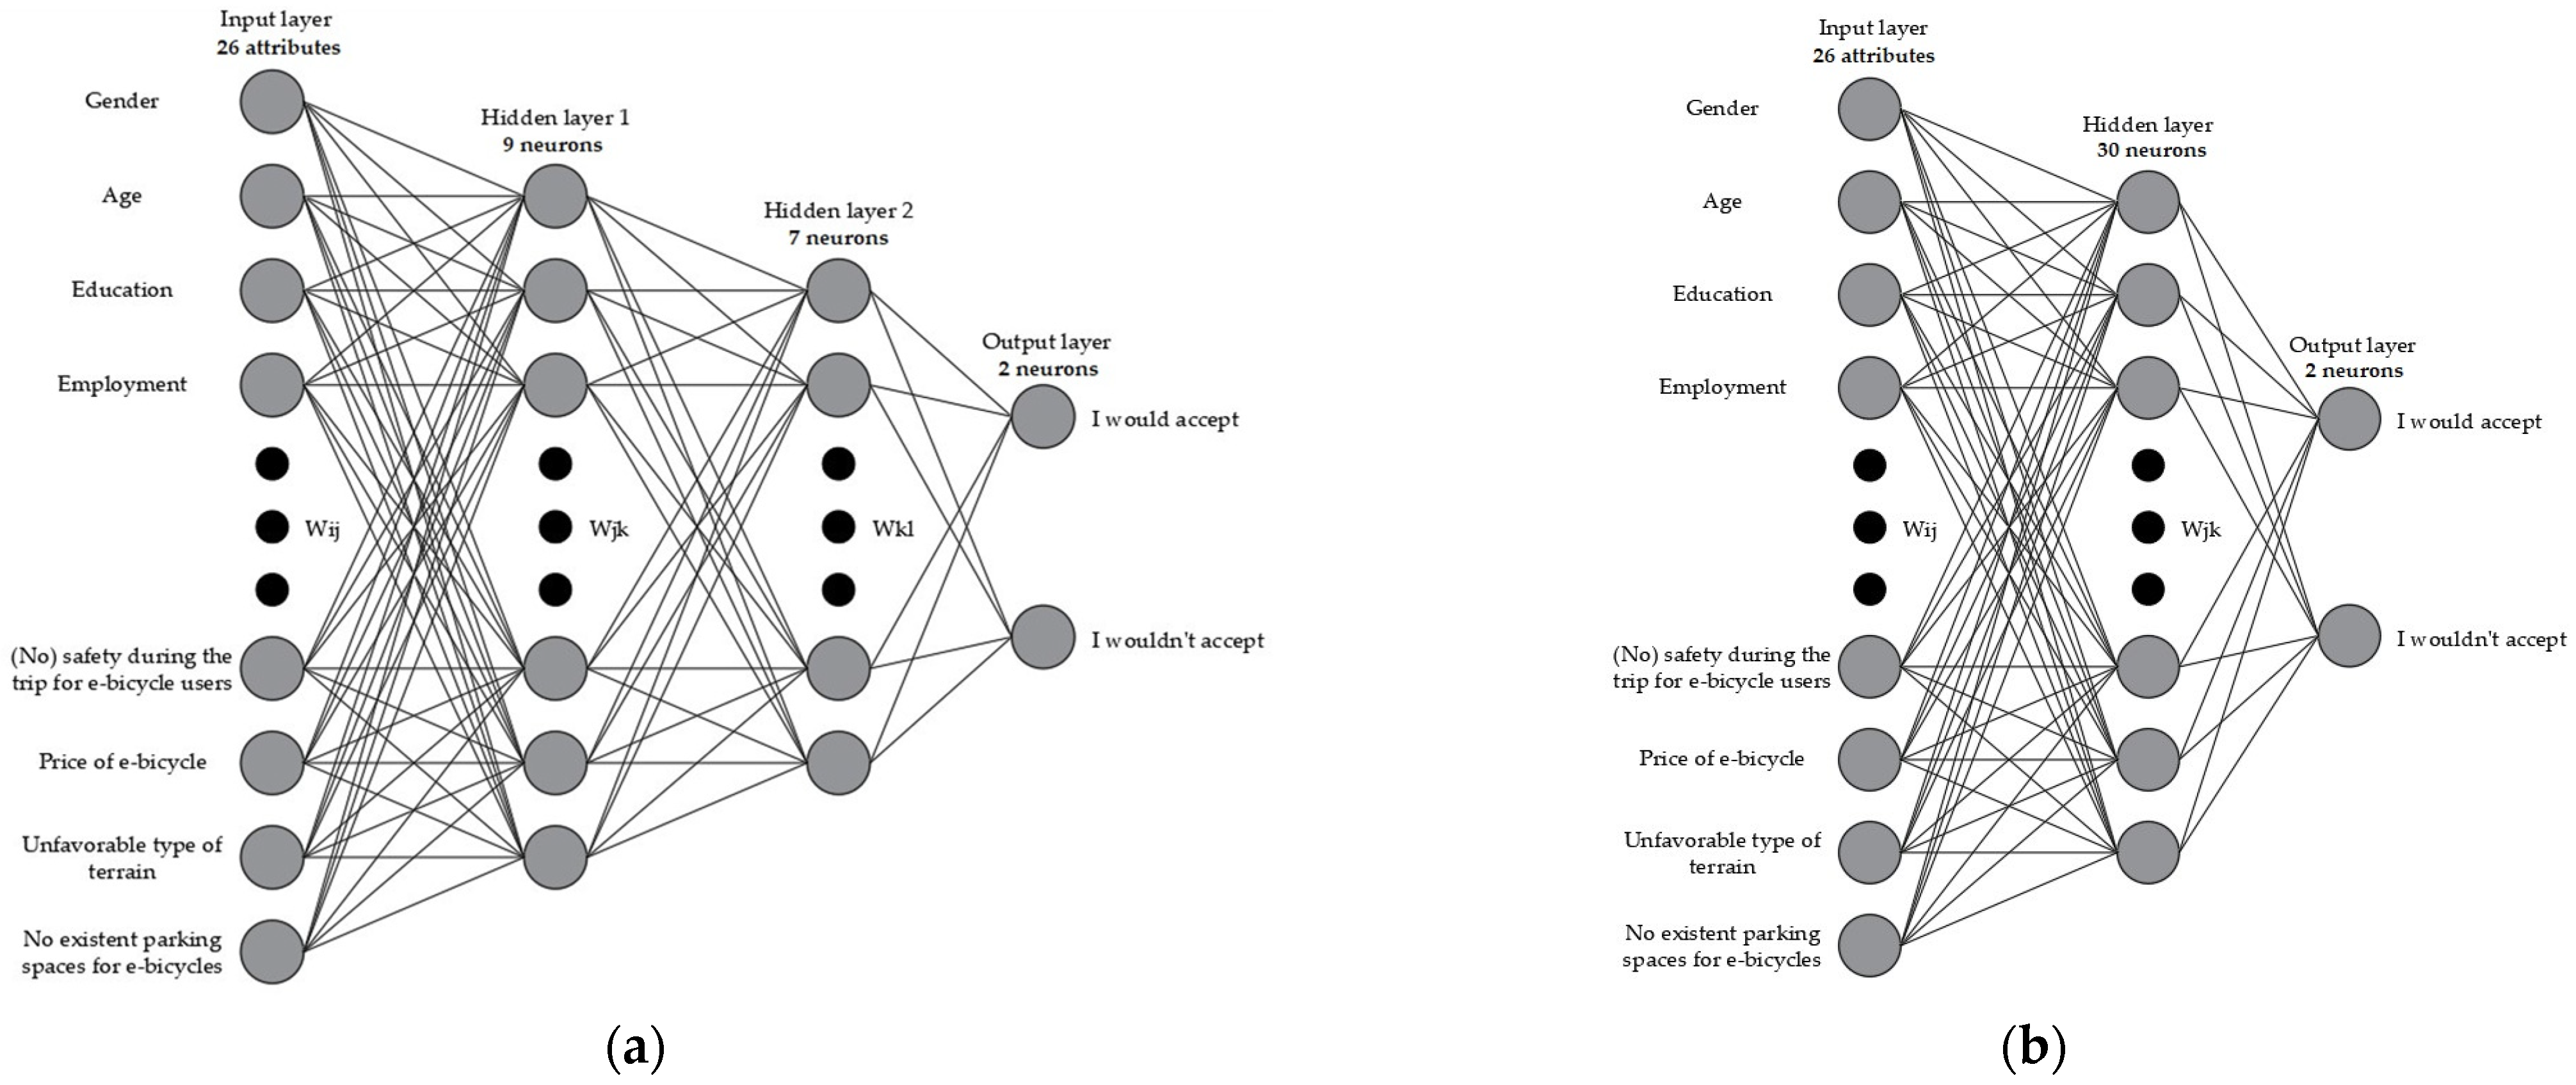
3.1. Development of a Multilayer Perceptron Model (MLP)

In the last two decades, artificial neural networks (ANNs) have proven to be one of the most successful technologies, widely used in a large number of applications in various fields. Often referred to simply as a neural network, an artificial neural network is a mathematical model that is inspired by the structure and function of biological neural networks in the brain. Their architecture implies that ANNs are usually designed as three-layer network models of interconnected artificial neurons (input layer, hidden layer, and output layer). Input nodes (neurons) receive input information, intermediate nodes receive signals from input nodes and manipulate the information to provide results to output nodes, and output nodes provide output signals. In this regard, an ANN model can have multiple intermediate layers containing sets of intermediate nodes, and if there are two or more layers, such a model is called a multilayer perceptron (MLP) [72].
MLP models are created due to the existence of a nonlinear data set, which is why there is a need to extend the ANN model construction to multiple layers. This avoids the limitation of models with one hidden layer, i.e., one perceptron, which is only suitable for linearly identifiable data [73,74]. Such models are based on a supervised procedure, i.e., the network builds a model based on examples in the data with known outputs. MLP must extract this relation exclusively from the presented examples, which together are assumed to implicitly contain the necessary information for this relation. Information flows from the input layer to the output layer through the hidden layer. All neurons from one layer are fully connected to neurons in neighboring layers. These connections are represented in the computing process as weights (connection intensity). Weights play an important role in signal propagation in a network. They contain the neural network’s knowledge of the problem-solving relationship. The number of neurons in the input layer depends on the number of independent variables in the model, while the number of neurons in the output layer is equal to the number of dependent variables.
The MLP is trained to minimize the errors between the desired target values and the values calculated from the model. In the learning procedure, data sets of input and desired target template pairs are sequentially presented to the network.
The net input to the neuron j of the hidden layer for the pattern p   ( N E T p , j ) is calculated as the sum of each output of the input layer ( x p , i ; input value) multiplied by the weight ( v p , j i ). The activation function is applied to calculate the output of neuron j of the hidden layer ( z p , j ) and the output of neuron k of the output layer ( o p , k ) [75] in the manner shown by Equation (1):
f N E T = 1 1 + e x p ( λ N E T )
where λ is the coefficient of the activation function, and N E T is expressed either as z p , j or o p , k [76] in the manner shown by Equations (2) and (3):
z p , j = f i x p , i v p , j i
o p , k = f j z p , j w p , k j
where v p , j i and w p , k j are the connection weights between neuron i in the input layer and neuron j in the hidden layer, and those between neuron j of the hidden layer and neuron k of the output layer for pattern p , respectively. The weights are initialized as small random numbers.
Different activation functions can be used, such as linear functions, threshold functions, and sigmoid functions. The most commonly used function is the unipole (or logistic) sigmoid due to its nonlinearity [77]. The learning algorithm modifies the weights ( v p , j i and w p , k j ) to minimize the error. The sum of the errors ( E p ) in each neuron in pattern p is calculated using Equations (4) and (5):
E p = 1 2 k d p , k o p , k 2
T E = p E p
where d p , k is the target value corresponding to pattern p on neuron k , and T E is the total error during one iteration.
The forward propagation phase continues as the activation level calculations are propagated forward to the output layer through the hidden layers. In each subsequent layer, each neuron sums its inputs and then applies an activation transfer function to calculate its output. The output layer of the network then produces the final answer, i.e., the estimated target value.

3.2. Development of the Radial Basis Function Model (RBF)

A radial basis function (RBF) network is a supervised learning network. Unlike a multilayer perceptron, in an RBF network, there is only one hidden layer and its neurons hold a radial basis activation function [78]. The output of the radial basis function is equal to the weighted sum of the responses of the hidden neurons, which can be expressed by Equation (6):
y j = i = 1 n w i j φ x c i + w 0 j , j = 1,2 , n
where n is the number of nodes in the hidden layer, x is the output vector, c i is the center of the i -th node in the hidden layer, w i j is the weight of the i -th node in the hidden layer, φ i is the radial basis function, and w 0 j is the noise of the i -th node of the output layer. From the input layer to the hidden layer, the mapping is nonlinear, while it is linear from the hidden layer to the output layer. Here, the Gaussian function (Equation (7)) was the radial basis function, and simple Euclidean distance was used to determine the distance from the entrance to the center [79,80].
φ i x = e x c i 2 σ 2
where x is the input vector, c i is the vector center of the i-th hidden node of the RBF, and σ > 0 is the predefined value of the function expansion.
RBF can be interpreted as a neural network consisting of three layers: input layer, hidden layer, and output layer. In the input layer, there is one neuron for each variant based on which prediction is made. The transfer functions of neurons in the shunt layer are nonlinear, and the transfer functions in the output layer of the neurons are linear.
Each neuron j of the skived layer represents a radial basis function that measures the distance between the input vector x i and the center of the basis function c j . In this way, each n -dimensional input vector x i is nonlinearly transformed into an m -dimensional vector φ ( x i ) = [ φ 1 ( x i ) , φ 2 ( x i ) , . . . , φ m ( x i ) ] , where m is the number of radial basis functions (hidden neurons). Each output neuron represents one of the classes. The output values of the network are calculated as a weighted sum of activations in hidden neurons, shown by Equation (8):
y k = j = 1 m φ j ( x i ) w j k
where y k ( x i ) is the activation of output neuron k , and w j k is the connection weight of hidden neuron j and output neuron k .
The training of the RBF network is carried out in two stages. In the first stage, the number of hidden neurons m is automatically determined and the parameters of the radial basis function c j and σ j are determined. A common approach is to apply a clustering algorithm and set the centers c j to the values of the cluster centroids, and fix all widths σ j to the same value proportional to the maximum distance between certain centers. The second phase includes the optimization of the weights on the training set. This can be achieved by minimizing the error sum of the squares. During this phase, the radial basis functions do not change, so the learning is efficient.
Although the RBF network is faster to train and requires less labeled data, compared to the MLP network, the RBF network is less flexible and may underfit complex data sets (see Table 2). In addition, RBF networks are better interpreted than MLPs because the neurons of the hidden layer represent the prototypes or centers of the input data. On the other hand, the MLP network is a more powerful classification algorithm that can handle complex high-dimensional data sets. However, it requires more labeled training data and is more prone to overfitting.

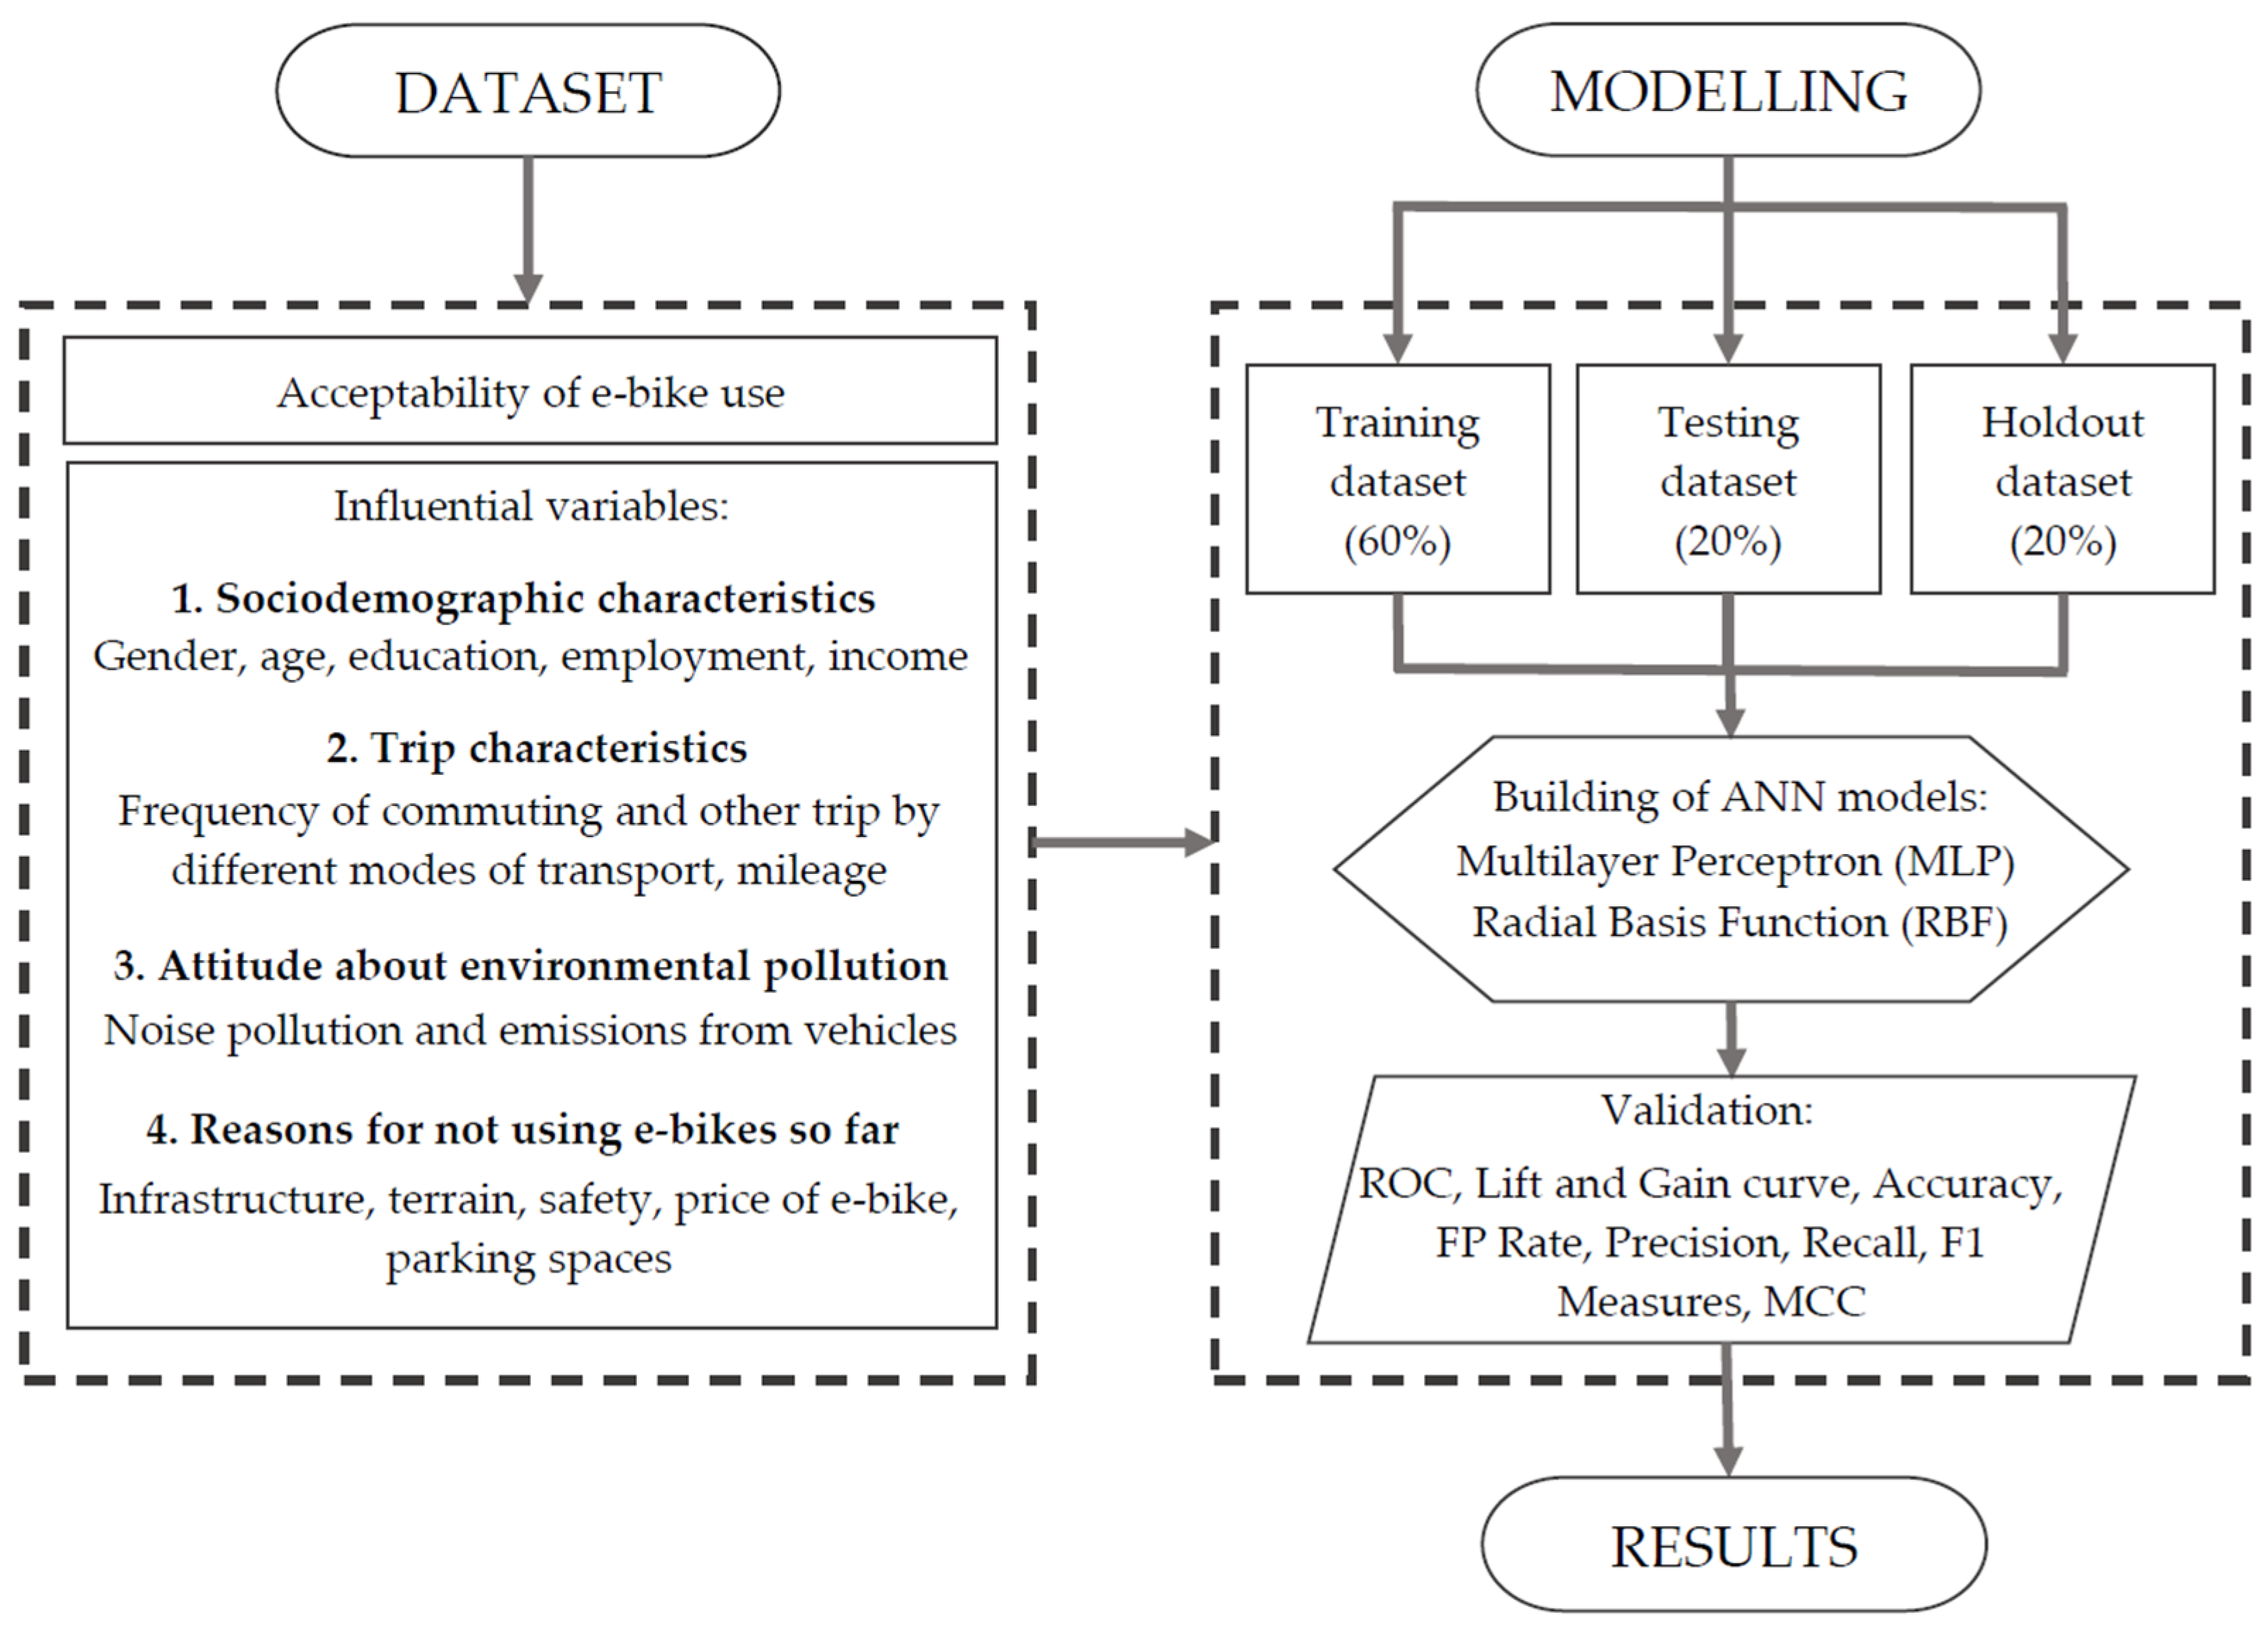
4. Research Methodology

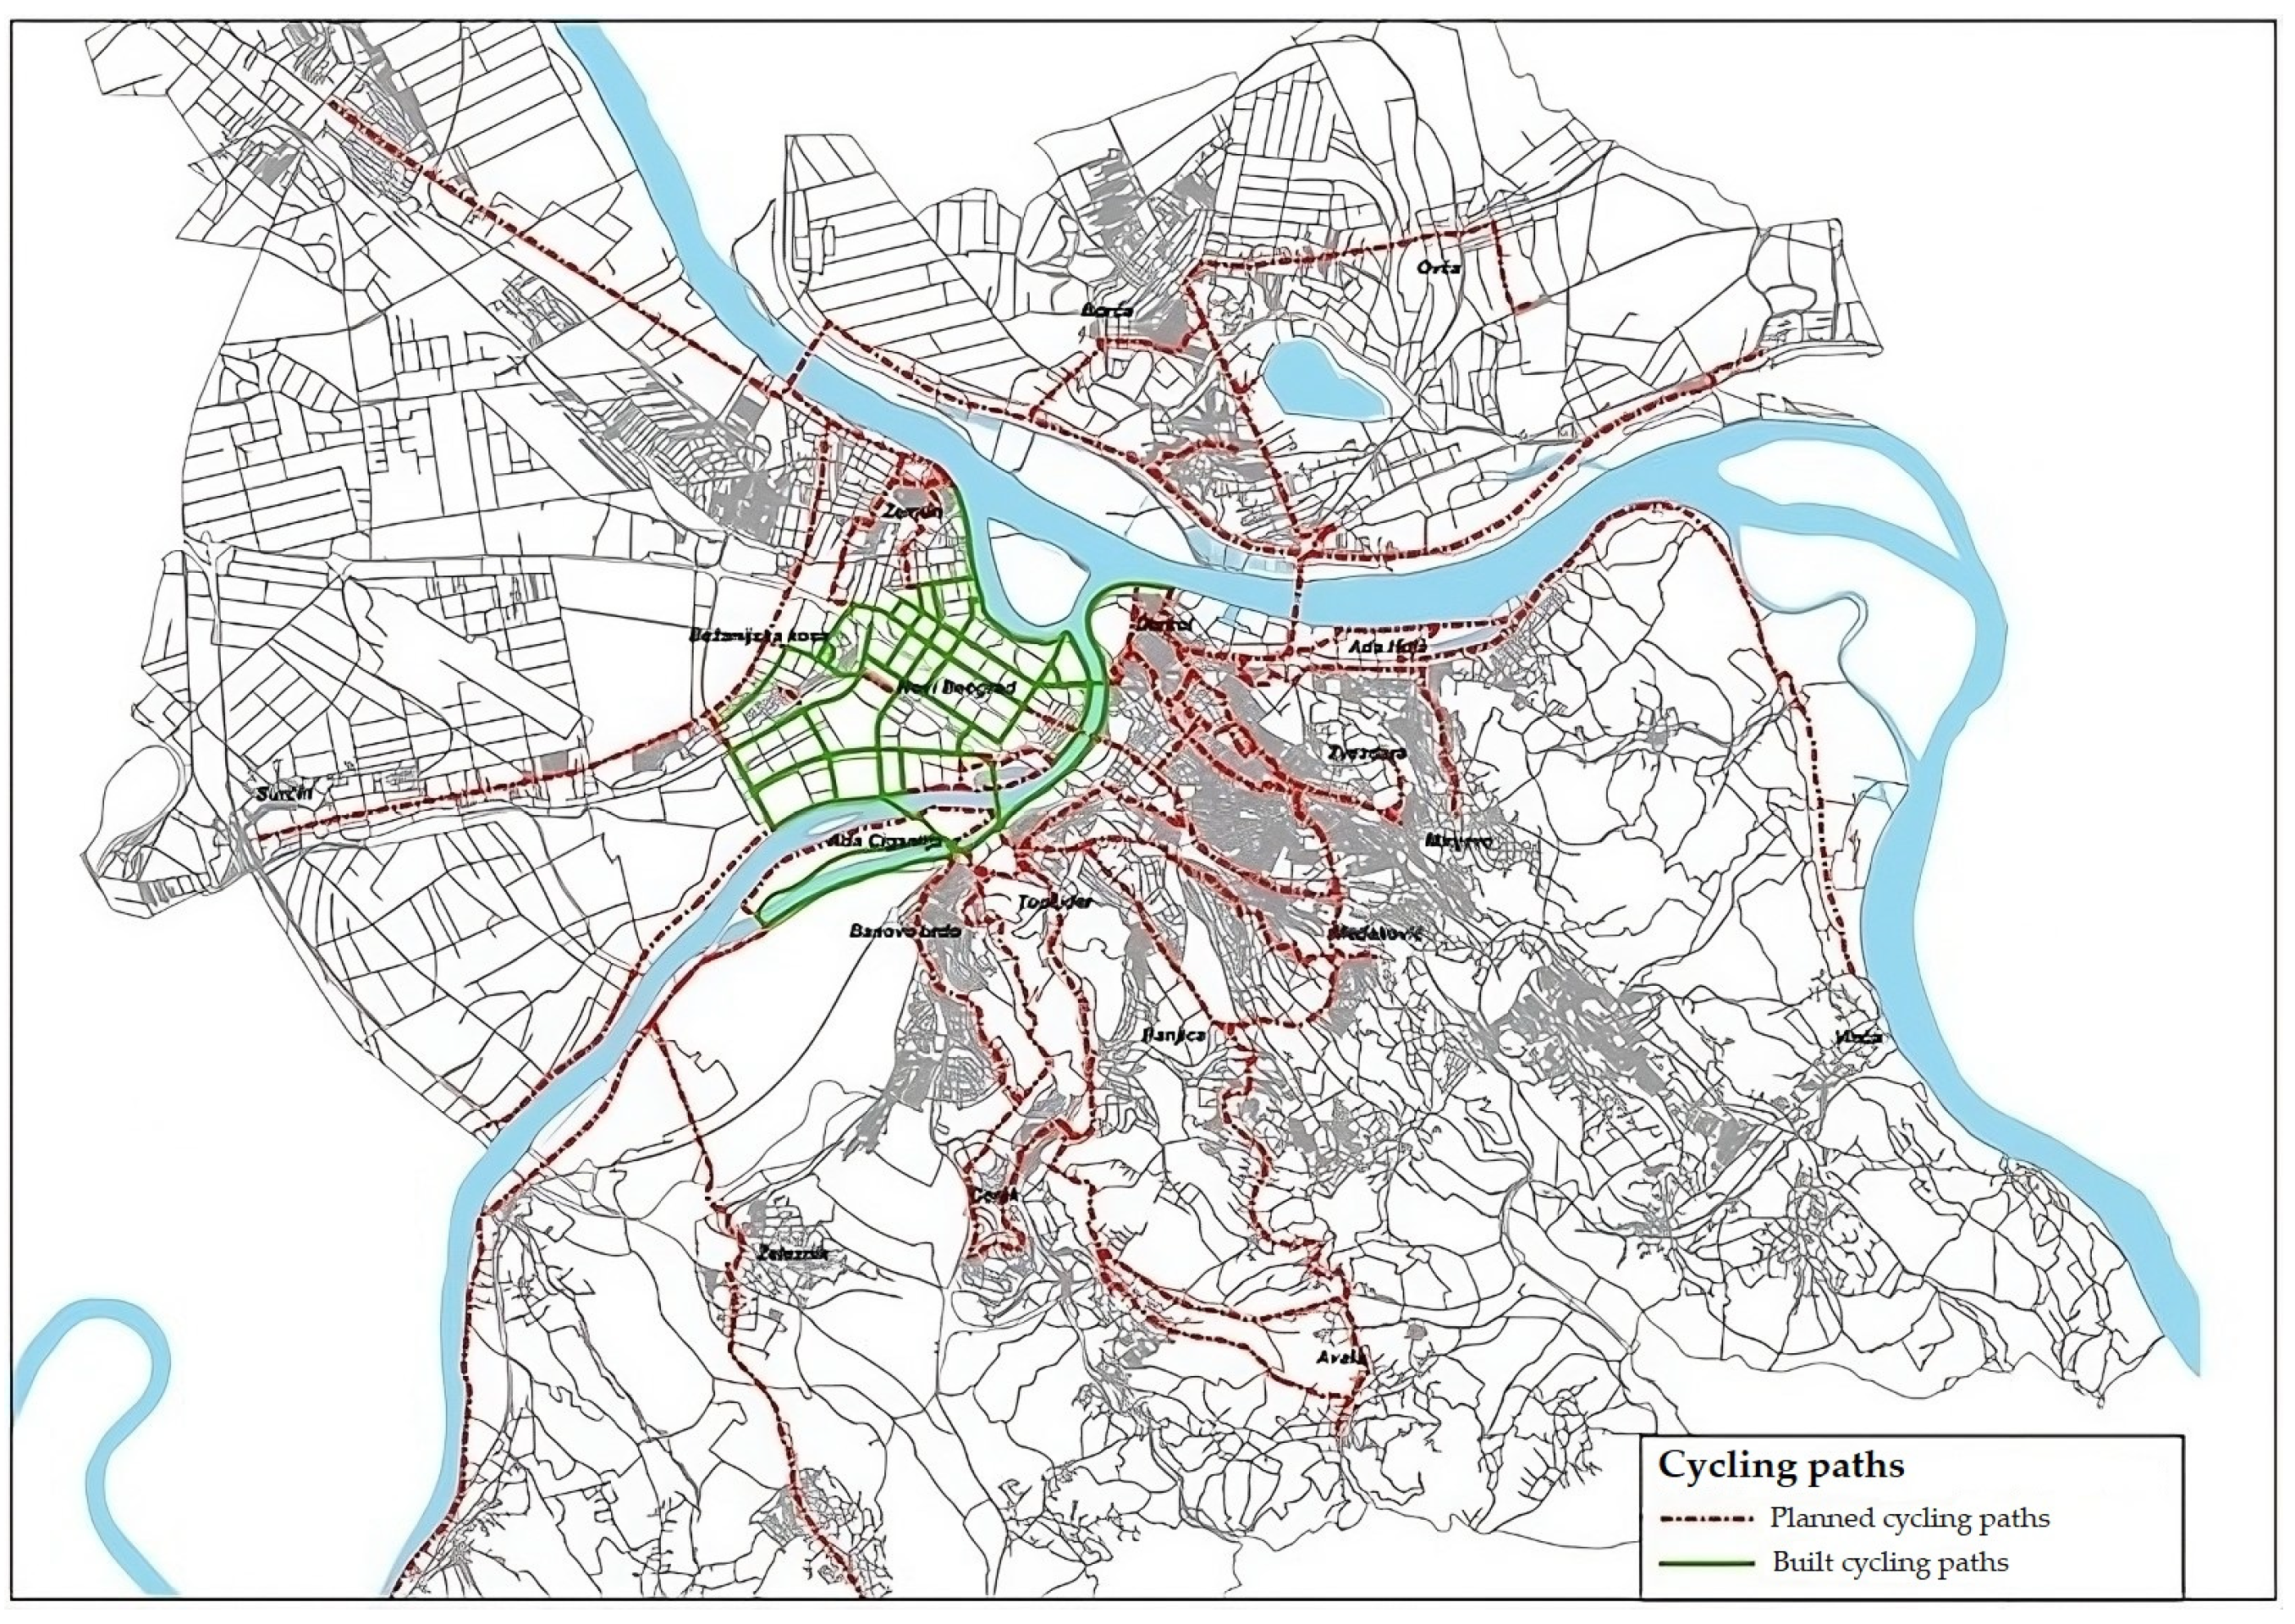
4.1. Study Area Description

Belgrade, the capital of Serbia, faces daily traffic jams due to rapid development and an increasing number of passenger cars, which number about 665,000, or about 400 per 1000 inhabitants [82]. In addition to traffic congestion, road traffic also affects excessively polluted air, which, according to the Annual Report on the State of Air Quality in Serbia [83], accounted for 41% of nitrogen oxide emissions, 10% of PM10 emissions, and 9% of PM2.5 emissions in 2021. Having the greatest impact on such statistics, Belgrade had excessively polluted air in the same period, mainly due to the increased concentration of particles PM10, PM2.5, and NO2 from road traffic.
According to the survey on the types of travel of individuals conducted in 2015 in Belgrade, the most common type of transport is public transport (47.9%), which consists of bus, trolleybus, and tram subsystems. This is followed by trips by private passenger cars (25.7%) and walking (23.8%), while only about 1% of residents travel by bicycle [84]. A small percentage of the use of bicycles in daily trips can be attributed to the bicycle infrastructure, which is not yet sufficiently developed in this city. The total length of bicycle paths is currently only 100 km. The Sustainable Urban Mobility Plan [85] adopted in 2020 considers the goals defined by the General Urban Plan of Belgrade (2016), which envisages the construction of a continuous bicycle network in the central city zone and central municipalities with a total length of more than 300 km, of which 100 km is already built by 2021. In addition to the realization of a continuous network in the central city zone and municipalities, the plan also foresees the construction of suburban bicycle corridors that would enable connection with suburban parts of the city. The development strategy of the city of Belgrade envisages the construction of 120 km of new bicycle paths, the provision of 200 parking spaces for bicycles, and the introduction of a public bicycle system by 2021 [86]. However, to date, those goals have not been fully achieved. The map of existing and planned bicycle paths is shown in Figure 1.
In terms of topography, Belgrade is situated on low-land and hilly terrain. The highest altitude above sea level of the wider area of Belgrade amounts to 628 m, while the highest altitude in the central city area amounts to 303 m. The lowest altitude in the city is 70 m. The absolute altitude of the Meteorological Observatory—132 m—is considered to be the average altitude of Belgrade.
Also, for the purposes of this work, it is important to point out the fact that the current legislation in Serbia recognizes an electric bicycle as a traditional bicycle without an electric drive, with a maximum power not exceeding 250 W, and with a maximum design speed of 25 km. Regarding their participation in traffic, users of e-bikes are obliged to move on the bicycle infrastructure (lanes and paths), as well as on the roadway with a width of at most one meter from the right edge, only if the bicycle infrastructure does not exist. As Belgrade does not have a developed common system of e-bikes, a trip by e-bike is most often achieved with its own resources. Also, the state has so far not provided additional subsidies and incentives for the purchase of these electric vehicles.

4.2. Sample and Data Collection

In this study, the necessary data on user attitudes were determined by surveying in the period from January 2024 to May 2024 using an online questionnaire. To obtain a representative sample, an online questionnaire was sent to individual companies and faculties, students, and pensioners, as well as users of social networks in Belgrade, observing the residents of Belgrade as the target group. Bearing in mind that the biggest problem of traffic congestion and environmental pollution is in the central city zone, the research area included the target narrower central zone, including other populated areas of Belgrade within a radius of 15 km from the center. The given area was considered with the aim of examining attitudes and encouraging users to switch to the use of environmentally friendly and sustainable electric bicycles. After incomplete questionnaires with illogical answers were removed from the total sample of 703 respondents, the valid sample used in further analysis consisted of 680 respondents. However, since users who do not currently use e-bikes during their movements were important for creating the model and for further analysis, the valid sample used for the study of the acceptability of these vehicles was 626. Illogicality was determined by control questions.
To obtain the most authoritative results of the research, the answers of the respondents who had the opportunity to see and face the problems of traffic congestion and environmental pollution in the territory of the city of Belgrade were important. During the research, the respondents were not presented with any additional information regarding the problem of environmental pollution. In this regard, the respondents gave answers to the questions only based on their perceptions of the environmental problems of road vehicles in the territory of Belgrade.
At the very beginning of the questionnaire, the respondents were highlighted the legal regulations, then the characteristics, advantages, and possible disadvantages of using electric bicycles. The given information was intended to present this mode of transportation as a possible solution to traffic congestion and the problem of environmental pollution in the territory of Belgrade. The questionnaire combined questions about Revealed preference, about the actual behavior of users when moving, and questions about Stated preference in order to analyze user preferences regarding the use of electric bicycles. The questionnaire was divided into four parts. The first part contained questions about the socio-demographic and economic characteristics of users, while the second part focused on trip characteristics. The third part was concerned with examining users’ attitudes regarding environmental pollution, while the fourth aimed to determine users’ attitudes regarding the use of electric bicycles, taking into account both respondents who use and respondents who do not use this mode of transportation. Finally, the respondents were asked about the reasons why they use/do not use electric bicycles and whether, in the end, solving the problem mentioned by the reason, they would still accept to use of an e-bike for the sake of reducing traffic congestion and environmental pollution. All questions in the questionnaire were closed. A five-point scale was used for certain questions.

4.3. Data Preparation for ANN Model Development

The preparation of data for predicting the acceptability of the use of electric bicycles from the traffic and environmental aspects was simultaneously carried out to create data sets for two ANN models. Based on their good predictive power indicated by numerous studies, multilayer perceptron (MLP) and radial basis function (RBF) were chosen for the purposes of this work. The considered data related only to the questions and answers of those users who do not currently use an electric bicycle. During the creation of data sets, 26 attributes were defined, which were considered to be important in terms of evaluating the respondents’ attitudes when accepting the use of electric bicycles from the traffic and environmental aspects. All 26 attributes were divided into 4 groups:
  • Socio-demographic and economic characteristics of respondents (5 attributes): gender, age, level of education, employment, and personal income;
  • Trip characteristics (14 attributes): frequency of current use of modes of transport with the purpose of going to work/school/college (commuting trips) and for other travel purposes such as fun/recreation/shopping (trips with other purposes) and average mileage (in one direction) for both stated purposes of trip. The types of transportation that respondents could choose from are passenger cars, public transportation, motorcycles, bicycles, e-bikes, e-scooters, walking, and other types of transportation (taxi, carpool, etc.);
  • Respondents’ views on the pollution of Belgrade by road traffic (2 attributes): views on the level of pollution from the aspect of pollutant emissions and noise level;
  • Reasons for not using e-bikes (5 attributes): lack of infrastructure, insecurity when using electric bikes, price of electric bikes, unfavorable type of terrain, and (non)existence of parking for e-bikes.
Based on the offered answers to the questions (see Table 3), it was possible to conclude what the habits of respondents of different socio-demographic and economic characteristics are regarding the frequency of use of the offered modes of transportation and the average mileage traveled in one direction when moving for different purposes. Then, based on personal perceptions, it was possible to determine the environmental awareness of Belgrade residents regarding environmental pollution from road traffic in terms of emissions and noise levels, and then the significance of the reasons for not using e-bikes.
All 26 attributes were independent variables, i.e., input neurons within the input layer of the artificial neural network models. Such neurons transmit information to neurons in the hidden/hidden layers of artificial neural networks with the aim of using them to give results to the output neurons. Finally, the output neurons represented the dependent variable, i.e., the acceptability of the use of e-bikes, as a possible solution for reducing congestion and environmental pollution. The subjects’ possible answers were “I would accept” and “I wouldn’t accept”, and they represented two neurons in the output layer of the MLP and RBF models.

4.4. Modeling Methodology

The methodology used to assess the acceptability of the use of electric bicycles in order to reduce traffic congestion and environmental pollution in the territory of Belgrade includes five steps (Figure 2): (1) Data collection: The data were collected through the conducted research using an online questionnaire to collect the views of the residents of Belgrade. (2) Preparation of the data set: Data analysis was carried out using the IBM SPSS Statistics 29.0.2.0 software using the standard method of descriptive and analytical statistics and artificial neural network (ANN) modeling. In this study, sampling data from the entire database were used to model the ANN model, randomly divided into three parts: a training data set of 60% for testing 20% and holding 20%. (3) Model configuration and implementation: Two artificial neural network models, namely MLP and RBF models, were constructed using the training data. Both models were constructed on the basis of independent (26 influential variables) and dependent variables (answers “I would accept” and “I wouldn’t accept”) obtained by the questionnaire in order to predict the acceptability of e-bikes. The architecture of both neural network models included three different layers, where the MLP contained an input layer, two hidden layers, and an output layer, while the RBF model contained an input layer, only one hidden layer, and an output layer. The input layer includes attribute values in the form of nodes, i.e., neurons, which refer to independent variables. The hidden layer covers radially symmetric functions and unsupervised learning to describe hidden neurons. Finally, the output layer with the final values of the model classification, in the form of nodes, allows the calculation of a weighted sum from the output of the hidden layer and allows the calculation of the index class for the input pattern. The model formation was based on experimentation with different combinations of nodes in one and/or two hidden layers. (4) Validation of the model: In this step, the validation of the model was carried out using the parameters of ROC, lift and gain curves, accuracy, FP (false positive) rate, precision, recall, F1 measures, and MCC. The specified parameters define a model with better predictive abilities. (5) Defining the final acceptability results: Based on the parameters of the model with better predictive powers, an analysis of the influencing parameters on the acceptability of the use of e-bikes by users was performed.

5. Research Results

5.1. Descriptive Statistics and the Application of the Chi-Square Test of Independence

Of the total sample of 680 residents of Belgrade, 51.5% are women, while 48.5% are men. In terms of the age structure of the respondents, most of them are between 18 and 25 years old (34.1%), followed by 26 to 35 years old (21.5%). According to the acquired level of education, the most numerous respondents are those with a Bachelor of Science degree, which make up 39.9% of the sample, while the largest number of respondents are in permanent employment (56.8%). Also, the largest number of respondents belongs to the group with a personal monthly income of EUR 501 to EUR 750 (28.1%), followed by those with an income of EUR 750 to EUR 1000 (24.0%). Considering the above, it can be concluded that the sample consisted mostly of highly educated and employed young and middle-aged respondents with mostly average incomes, characteristic of Belgrade (see Table 4).
In the most common case, the mileage traveled in one direction of the trip with the purpose of commuting is in the range of 5 km to 8 km (36.9%), and from 2.5 km to 5 km (38.8%) when realizing a trip with other purposes, such as entertainment, recreation, or shopping. During commuting trips, respondents most often opt for a passenger car for daily trips (42.2%), for public transport when traveling several times a week (12.4%), for a passenger car when traveling several times a month (15.9%), and for other types of transportation (such as taxis, car sharing, etc.) for trips several times a year (31.3%). On the other hand, for trips with other purposes, respondents mostly use a passenger car every day (46.8%), several times a week, and several times a month on foot (31.6% and 34.7%, respectively), and several times a year use other modes of transportation (36.9%). Environmentally friendly and sustainable modes of transportation such as electric bicycles and electric scooters are almost never used for commuting or other purposes.
Out of the total number of respondents, 54 of them (7.9%) use electric microvehicles such as electric bicycles (57.4%), electric mopeds (3.7%), and electric scooters (38.9%). The most frequent use of microvehicles is for both purposes, i.e., during commuting trips and trips for other purposes, realized several times a week (55.0% and 47.6%, respectively). As the most important reason for use, respondents cited shorter travel time (29.6%), while environmental benefits were cited as a significant and medium-significant reason (35.2% each).
The remaining respondents (626; 92.1%) do not use these vehicles for their trips, and they were considered in further analysis to predict the acceptability of e-bicycles. In their opinion, road traffic contributes to a very large and large extent to the pollution of the environment in Belgrade by the emission of polluting substances (52.2% and 26.8%, respectively) and the emission of noise pollution (39.0% and 28.8%, respectively). Also, as the most important reason for not using electric bicycles, they state that the lack of infrastructure (41.9%) and (lack of) safety during trips (40.3%) have the greatest influence to a very large extent. On the other hand, as a moderately important reason, they cite the price of an electric bicycle (23.3%), then, as a less-significant reason, they cite the (lack of) existence of a sufficient number of parking spaces for electric bicycles (26.8%), whereas least significant is the unfavorable type of terrain (38.5%). Of the considered 92.1% of respondents who do not use any type of e-microvehicles, 69.8% would change their attitude and, for the sake of reducing congestion and environmental pollution, accept the use of electric bicycles, while the other 30.2% of respondents would not.
In order to determine the relationship between various factors and respondents’ attitudes toward the acceptability of using electric bicycles, a chi-square test of independence was conducted. Starting from the socio-demographic and economic characteristics of the respondents, the chi-square test indicates a significant statistical association of the use of electric bicycles with the age of the respondents (χ2 = 18.468; p = 0.005), employment status (χ2 = 18.142; p = 0.001), and personal monthly income (χ2 = 19.581; p = 0.003). Also, the results indicate that there is a statistically significant relationship between the frequency of using certain types of transport when commuting, such as public transport (χ2 = 10.746; p = 0.030), bicycles (χ2 = 11.023; p = 0.026), and walking (χ2 = 16.590; p = 0.002), and when taking a trip with other purposes, such as a passenger car (χ2 = 37.670; p < 0.001) and other modes of transportation (χ2 = 13.394; p = 0.010). In addition to the above, the respondents pointed out in their answers that the average mileage for both purposes of trips (in one direction) is of great importance to them when accepting the use of electric bicycles. A statistically significant correlation between mileage traveled in one direction when commuting (χ2 = 87.399; p < 0.001) and trips with other purposes (χ2 = 35.370; p < 0.001) proves this.
Respondents’ attitudes about environmental pollution in Belgrade by road vehicles, from the aspect of pollutant emission pollution (χ2 = 18.591; p = 0.001), have a significant statistical relationship with the acceptability of electric bicycles. This is also shown by the largest number of respondents who are ready to accept the use of electric bicycles (55.1%) and believe that Belgrade is highly polluted by pollutant emissions. In the end, the reasons why residents of Belgrade do not use electric bicycles to make trips, such as the lack of infrastructure (χ2 = 11.807; p = 0.019), the price of e-bicycles (χ2 = 23.611; p < 0.001), the unfavorable type of terrain (χ2 = 42.840; p < 0.001), and the lack of a sufficient number of parking spaces for electric bicycles (χ2 = 14.069; p = 0.007), also have a significant statistical association with their acceptability.

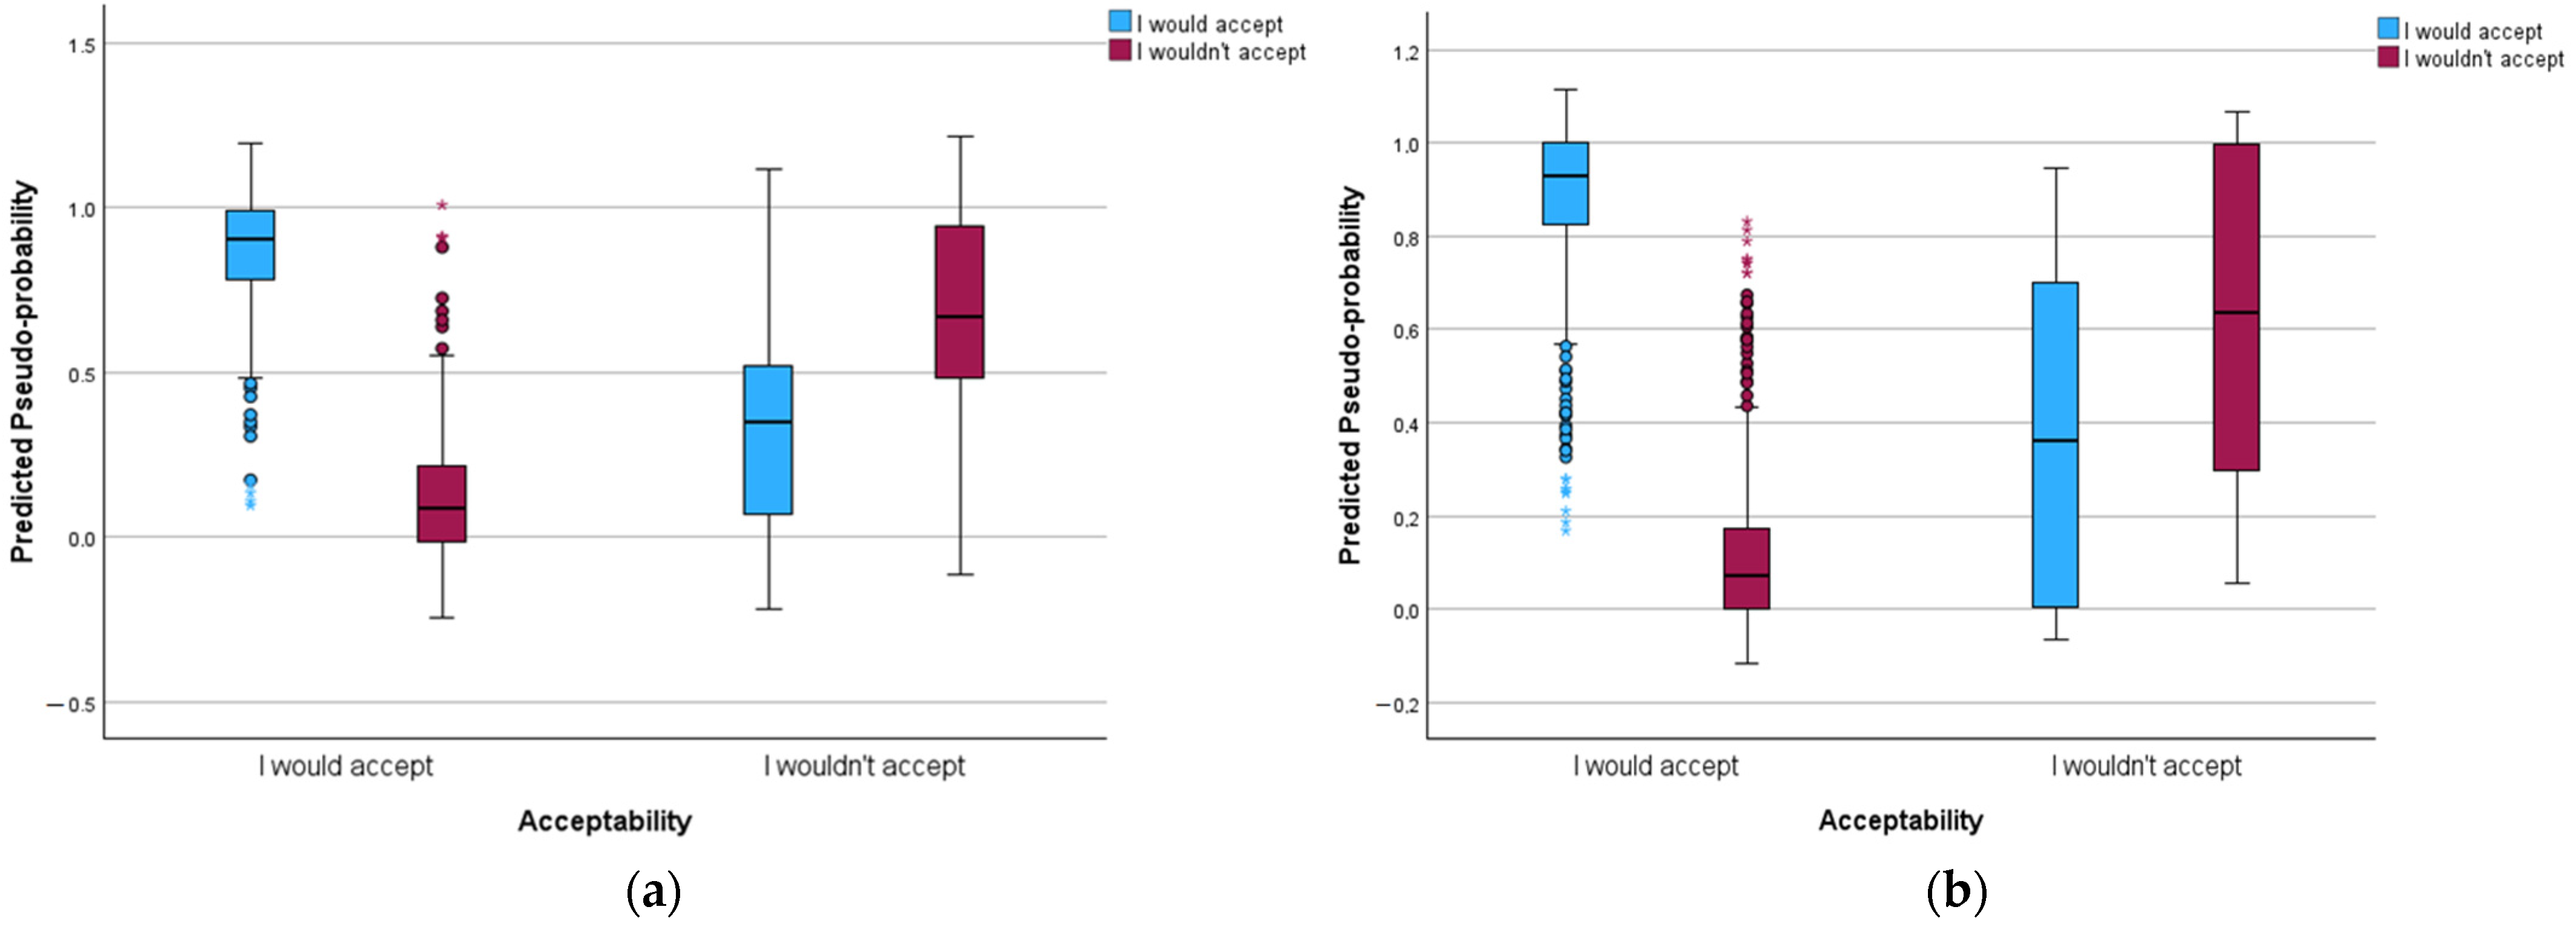
5.2. Prediction Results of Multilayer Perceptron (MLP) and Radial Basis Function (RBF) Models

The maximum time for training both network models was set to a maximum of 15 min, while the time for testing was automatically determined by the software. Manually created architectures of the MLP network with nine neurons in the first and seven neurons in the second hidden layer (Figure 3a) and of the RBF network with thirty neurons in only one hidden layer (Figure 3b) gave the best results. Different activation functions were used for different layers of the MLP and RBF networks, i.e., in the hidden layer, there are the hyperbolic tangent and Softmax functions, respectively, and in the output layer the identity function for both network models.
After determining its basic characteristics, the network was trained and then tested. The time required to train both networks was significantly different, indicating that the MLP network required less training time (0.20 s) compared to the RBF network (3.63 s). The Sum of Squares error function values indicate that the MLP network both during training and testing has lower error values (28.828 and 13.217, respectively) compared to the RBF network (33.999 and 15.439, respectively), which indicates that the MLP model has smaller deviations from the predicted values and during training and testing compared to the real thing.
Considering the large number of attributes and the sample size, the MLP and RBF network models in the training phase give very good results in predicting users who would agree to use e-bikes to reduce congestion and environmental pollution (96.9% and 94.8%, respectively). On the other hand, both networks have poorer accuracy in predicting responses that have a negative attitude compared to users who would use e-bikes. Namely, with an accuracy of 75.6%, the MLP model has slightly better accuracy compared to the RBF model (65.9%), whose accuracy is acceptable.
The confusion matrix shown in Table 5 indicates the final prediction results observed after testing the data. The final results indicate that both models can accurately classify users into two groups, taking into account all the attributes that contributed to the final answer, similar to the results during training. In this regard, the MLP and RBF models predicted a significantly worse number of users who are not willing to use e-bikes (62.5% and 47.8%, respectively), which, in addition to the small sample, may indicate a worse dependence on the attributes (independent variables) and the final answer, which additionally had a negative impact on both training and data testing. On the other hand, the classification accuracy for those users who would use e-bikes is incomparably better with the models (95.0% and 88.9%), indicating the good training of both models, which contributed to the recognition of such responses by users in a larger number. Finally, the comprehensive classification results during testing indicate a high predictive power of the MLP model that performs significantly better than RBF (88.7% and 80.5%, respectively).
In order to further determine the prediction accuracy performance of the MLP and RBF models during data testing, model validation using the accuracy parameter was conducted. Analogous to the prediction accuracy of the entire data set, the accuracy parameter indicates significantly good results for both models (>0.8) (see Table 6). This is indicated by the rate of false-positive events, which represents the ratio between the number of negative events incorrectly classified as positive and the total number of real negative events (regardless of classification). On the other hand, the precision of the RBF model is not so significant when classifying the users who have a negative attitude toward the use of e-bikes (0.524) compared to the MLP model (0.750), which also has a better overall precision. Then, the recall of both models indicates a very good detection of positive responses in users who accept (MLP 0.95 and RBF 0.89) and slightly worse in users who do not accept the use of e-bikes (MLP 0.63 and RBF 0.47). In addition to the above, other performance measures of the model such as F1 indicate a significant predictive power in the form of precision and data memory when it comes to the answer “I would accept”, which is very significant for the MLP model (0.93) and to a slightly lesser extent for the RBF (0.88) model. When classifying users with the answer “I wouldn’t accept”, the MLP model also indicates a higher accuracy of predicting users with this answer (0.68), which is not the case with RBF (0.50). Finally, including all values from the confusion matrix, the MCC value, known as Matthew’s correlation coefficient formula, indicates that the MLP model can better predict the answers “I would accept” and “I wouldn’t accept” due to the existence of higher values (0.618) compared to the RBF model, which gives very poor results (0.380). Also, it indicates equal predictive power of both responses in both models. The last and one of the most significant parameters of the model is the ROC curve, which defines the quality of the classification model. With a value under the curve that can range from 0 (worst value) to 1 (best value), this value indicates the probability that a randomly selected user can be correctly rated or ranked if they are more likely to adopt the use of e-bikes. The measured area under the curve and the best score of 0.927 indicates a very good ability to classify users by the response-dependent MLP model, while this value for the RBF model is 0.897, indicating a very good classification ability.
In addition to the presented analysis, the IBM SPSS Statistics 29.0.2.0 software enables the display of the predicted pseudo-probability of the MLP and RBF models for the two perceived classes (responses) of acceptability of e-bikes as a box plot diagram. This graph specifically illustrates the predictions for two classes of the dependent variable acceptability (the responses “I would accept” and “I wouldn’t accept”). Also, it is important to point out that this graph shows box plots that categorize the predicted pseudo-probabilities based on the entire analyzed data set. As a rule, for each box plot in each different class, values above 0.5 can confirm correct predictions. In this regard, the box plot graph developed on the MLP and RBF models showed the predicted probability of the observed acceptability classes. A detailed analysis of both graphs should be started from the left side, that is, from the answer “I would accept”. The first box plot on the left indicates the answer “I would accept”, while the second box plot shows the probability that “I wouldn’t accept” would be classified as an “I would accept” answer, even though it actually falls under the answer “I wouldn’t accept”. These results indicate that the MLP model (see Figure 4a) better correctly classified the answers in both classes compared to the RBF model, which gave worse results, especially when predicting the “I wouldn’t accept” class (see Figure 4b).
Also, a visual representation of the classification performed by the models relative to the correct classifications that could be random outcomes (i.e., without using the model) is shown in Figure 5. The performance of the multilayer perceptron model on the gain plot (see Figure 5a) illustrates that the “I wouldn’t accept” class, in terms of the first point, was at (10%, 41%), which indicates that the first 10% covers slightly more than 40% of all users who answered that they would not accept the use of e-bikes. This performance is better compared to the performance of the radial basis function where on the gain graph (see Figure 5b), in terms of the first point, the same class was at (10%, 37%). On the other hand, looking at the first point of the “I would accept” class, it can be observed that both models have identical performance (10%, 12%), indicating that the first 10% covers slightly less than 15% of all users who answered that they would accept the use e-bikes.
The lift curve is the basis for evaluating the performance of classification models. However, unlike the confusion matrix, which evaluates the model for the entire population, growth curves evaluate the performance of the model only in a subset of the population. That is, they use a piece of data to give clear insight into the advantages of using a model as opposed to not using a model. The values from the gain charts of the MLP and RBF models (Figure 5a,b) were used to calculate the lift values. In this regard, the increase of 41% for the group of users who responded with “I wouldn’t accept” is 41%/10% = 4.1 for the MLP model (Figure 6a), while the increase of 37% for the group of users who answered with “I wouldn’t accept” is 37%/10% = 3.7 for the RBF model (Figure 6b). Bearing in mind that both models had the same point value on the gain curves, this means that in both cases, an increase of 12% for the group of users who answered with “I would accept” is 12%/10% = 1.2. The slopes shown in Figure 5 decrease steadily because there are fewer records of interesting classes to add and the model has less potential for bias, as seen in the lift graph. This indicates that the model performs well, providing a significant “boost” for a relatively small fraction of the ranked data.
Bearing in mind that in terms of all model performances, the multilayered perceptron gave better prediction and classification results, Table 7 indicates the importance of the assessment of independent variables in the given formed model. This Table includes all the values of independent variables whose importance and normalized importance (NI) are ranked from the highest to the lowest. The conducted analysis indicates that the average mileage for commuting has the highest indication of all observed independent variables (NI = 100.0%). The other variables with the highest values were the frequency of using motorcycles for commuting trips (NI = 97.0%) but also for other purposes (NI = 85.3%), as well as the average mileage for trips with other purposes (NI = 83.2%). Among other things, among the influential variables, the model highlighted the respondents’ attitude about the pollution of Belgrade by emissions from road vehicles (NI = 73.8%). Also, when it came to socio-demographic and economic characteristics, the age of the respondents (NI = 72.6%) and the level of education (NI = 71.7%) were highlighted as significant variables when accepting the use of electric bicycles compared to average monthly personal income (NI = 58.8%) and employment (NI = 45.5%). When it comes to the reasons for not using electric bicycles so far, the model highlighted the unfavorable type of terrain (NI = 70.6%) and the (un)safety of users when moving (NI = 69.5%) compared to the price of e-bikes (NI = 60.7%) and not by the existence of infrastructure (NI = 44.2%). Among the least significant variables that can influence the responses of e-bikes, the model highlights the frequency of walking for commuting (NI = 32.3%), the age of the user (NI = 32.6%), and the lack of a sufficient number of parking spaces for e-bikes (NI = 33.1%).

6. Discussion

The use of nonlinearity in the research of attitudes toward the use of e-bikes in Belgrade helps to answer a complex question related to the factors that influence the acceptability of the use of this sustainable form of trips. Although the choice of travel mode, i.e., the change in transport behavior, has been widely investigated in the scientific literature [58,59,60,61,62], this study sought to predict the extent to which the awareness of sustainable transport is represented among the residents of Belgrade, which has recently been increasingly traffic-congested and environmentally polluted. In particular, the main findings of this study indicate that in addition to daily habits in terms of trip characteristics, awareness of the level of environmental pollution significantly affects the respondents’ final attitude toward the use of e-bikes. Bearing in mind this connection, it is possible to predict that by changing habits when moving, and with the possibility of a less-polluted environment, the increased use of e-bikes could be significantly influenced.
By selecting artificial neural networks as significant predictors [63,64,65] based on previous studies of transport behavior, in this paper, MLP and RBF models are trained using backpropagation algorithms to obtain the main factors that influence the attitude toward the use of e-bikes. In order to develop models based on the performance of neural networks, it was necessary to create and develop numerous ANN models in the MLP and RBF structures. This, in addition to determining the ideal number of neurons, hidden layers, and transfer functions, also affects the reduced complexity of the model, and therefore leads to less overloading [88,89]. In this regard, in addition to the 27 input neurons and 2 output neurons that characterize both network models, the best performance was achieved by the MLP model with 9 neurons in the first and 7 neurons in the second hidden layer and the RBF model with 30 neurons in only one hidden layer. However, the results of the model trained with the hyperbolic tangent function showed smaller sum-of-squares error values in both training and testing (28.828 and 13.217, respectively). This indicated that the MLP model, in which the data were split for training, testing, and retention with 60%–20%–20%, respectively, with the hyperbolic tangent used as the activation function in the hidden layer and the identity function in the output layer, gave a better validation result and proved the high ability of the model to predict the user’s attitude through two possible responses. Moreover, by establishing an acceptable architecture with an appropriate number of hidden layers and neurons, it was important to accurately identify factors for the acceptability of e-bike use. This is also indicated by the parameters of the respondents’ correctly classified answers, which show the significant predictive power of the MLP model (accuracy 88.7%) compared to the RBF model (accuracy 80.5%). Also, such results are confirmed by the parameters used, such as accuracy, precision, FP rate, recall, F1, MCC, and values under the ROC curve, as well as gain and lift graphs, which are constructed on combined training and testing examples and produce the best combination of sensitivity and specifics.
As a model with better predictive ability, MLP also indicates the importance of independent variables on the basis of which the acceptability of using sustainable e-bikes depends primarily on the average mileage traveled when commuting (NI = 100%). This is confirmed by the results of the chi-square test of independence (χ2 = 87.399; p < 0.001). In support of this, respondents who on average travel from 2.5 to 5 km and from 5 km to 8 km in one direction when commuting (27.2% and 25.7%, respectively) would accept to the greatest extent a move to using e-bikes. This also indicates that the distance during trips can significantly affect the attitude of the examinee, so the mileage traveled during trips with other purposes for the MLP model (NI = 83.2%) and the chi-square test of independence was significant (χ2 = 35.370; p < 0.001). Such results are encouraging considering that on shorter distances, instead of motorized transport, respondents opt for sustainable e-bikes and thus influence the reduction in congestion and environmental pollution. Looking at the socio-demographic and economic characteristics of the respondents, age (NI = 72.6%) and level of education (NI = 71.7%) stand out as significant variables from the perspective of the MLP model. In support of this, respondents aged 18 to 25 (51.6%) and having completed basic studies at university (38.9%) are most willing to use e-bikes. These results are in line with the findings of other studies that point out that e-bikes are increasingly attracting a younger, highly educated population [13,45]. On the other hand, employment (NI = 45.5%) and gender (NI = 32.6%) were not significantly significant for making the decision to use e-bikes, which is also confirmed by the study which indicates that instead of gender and differences according to employment status, the health status of the user had a greater importance for the use of e-bikes [51].
On the other hand, the frequency of using motorcycles when commuting (NI = 97%), and then also for other purposes (NI = 85.3%) also has great significance in accepting e-bikes. Namely, such results were expected, considering that even 96.1% and 94.0% of respondents, respectively, who do not use this mode of transportation for any purpose said that they would accept the use of sustainable e-bikes. Also, observing the trip characteristics, the frequency of use of other modes of transportation when commuting can be singled out as significant (NI = 71.0%), which is also confirmed by the chi-square test of independence (χ2 = 13.394; p = 0.010). Such results are very favorable, bearing in mind that respondents who never use this mode of transportation (65.6%) are the most willing to use sustainable e-bikes. In support of this, users who are ready to change their habits when moving, and who mostly never use other modes of transport, such as a motorcycle, primarily use some motorized vehicles. Also, the importance of using bicycles when commuting (NI = 65.1%) and taking trips with other purposes (NI = 53.5%) is very encouraging, bearing in mind that 85.6% of respondents who never go to work by bicycle and 63.2% of respondents who use a bicycle for other purposes are ready to change that habit and use an e-bike to reduce congestion and environmental pollution.
In addition to the above, the attitude about the current pollution of Belgrade with pollutant emissions was recognized as a significant factor for the acceptance of the use of e-bikes by the MLP model (NI = 73.8%). Namely, as many as 55.1% of respondents who believe that Belgrade is highly polluted by pollutant emissions are ready to use e-bikes, which is statistically significant according to the parameters of the chi-square test (χ2 = 18.591; p = 0.001). Bearing the above in mind, campaigns to increase environmental awareness would greatly help the residents of Belgrade to see the ecological benefits of e-bikes and thus direct their attitudes toward more sustainable habits during movement, such as Vienna (Austria), Berlin and Munich (Germany), and Brussels (Belgium).
Finally, among the most significant reasons why respondents have not used e-bikes so far, which affects their acceptability, is the unfavorable type of terrain (NI = 70.6%), which is also confirmed by the parameters χ2 = 42.840 and p < 0.001. Bearing in mind the hilly plain type of terrain in Belgrade, it is not surprising that the results indicate that 37.9% of those for whom the unfavorable type of terrain is a less-significant reason decide to use e-bikes. However, concerns about safety during trips are also important for the acceptability of e-bikes (NI = 69.5%), and this is indicated by 40.5% of respondents, who would agree to use e-bikes if the safety of the users was increased, which is in line with previous studies [51]. In addition to the above, high purchase prices, especially compared to ordinary bicycles, represent an obstacle for the use of e-bikes [32]. In this regard, the price of e-bikes (NI = 60.7%) and the average monthly personal income (NI = 58.8%) of respondents have a significant role in making a decision about the acceptability of e-bikes. The results of statistical significance obtained by the chi-square test (χ2 = 23.611; p < 0.001 and χ2 = 19.581; p = 0.003, respectively) agree with this. The results obtained in this way indicate that the existence of subsidies for the purchase of e-bikes would have the potential to increase the use of a more sustainable mode of transportation and thus improve urban mobility. In this regard, Belgrade (Serbia) could follow cities such as Berlin, Munich (Germany), Flanders (Belgium), and Oslo (Germany) in which subsidies for the purchase of e-bikes contributed to their greater use in the fight against traffic congestion and environmental pollution. On the other hand, the lack of adequate infrastructure (NI = 44.2%) was recognized as moderately important when making a decision. This is expected, considering that 44.4% of respondents would be ready to accept the use of e-bikes if the infrastructure for them were built. Such results, in addition to the chi-square test of independence (χ2 = 11.807; p < 0.019), are also confirmed by research, the findings of which indicate that if there was a built infrastructure in Belgrade, the users of passenger cars, who mostly use it for other purposes, would switch to the use of environmentally sustainable modes of transport to a greater extent [90,91]. These results represent a significant indicator for decision-makers to focus their infrastructure measures on improving existing and building new cycling infrastructure, both paths and additional cycling lanes. Additional confirmation for investments in infrastructure is shown by the example of Amsterdam and Rotterdam, and the whole of the Netherlands, as well as Denmark, where the cycling culture has largely arisen as a consequence of the existence of a rich cycling infrastructure and influences the even greater use of e-bikes.
Although this research provided a significant prediction of the acceptability of e-bikes, it also had several limitations. First, the data were collected using an online questionnaire where the users provided answers independently, so it is difficult to avoid bias in the assessment of situational factors. However, despite this limitation, the information gathered during the survey was important, as sensitive questions were not asked in a face-to-face interview. Second, the small sample size significantly affected the training and testing processes with a large number of input variables. However, despite this limitation, the networks managed to produce significant results, thus indicating their ability to learn.

7. Conclusions

With the aim of finding a solution for traffic congestion and environmental pollution in Belgrade, this study dealt with the understanding of the factors that influence the change in travel habits and the prediction of users’ attitudes regarding the use of e-bikes. The key findings of this study show that the highest accuracy is achieved using a multilayer perceptron (MLP) neural network with a 6-2-2 partition, which has 26 neurons in the input layer, 9 and 7 neurons in the two hidden layers, respectively, the hyperbolic tangent used as the activation function in the hidden layer, and the identity function in the output layer. The better ANN model was identified with a smaller sum-of-squares error value of 13.217, a correct classification rate of 88.7%, and an area under the ROC curve for each category with predicted pseudo-probability (I would accept = 0.927 and I wouldn’t accept = 0.927). In addition, based on the results, it seemed that the MNL model was the most acceptable for both stated attitudes. Moreover, according to the neural network analysis, the most powerful predictors for making the final decision to use e-bikes were the mileage traveled when commuting (NI = 100.0%), the frequency of using motorcycles, and when commuting (NI = 97.0%) and for other purposes (NI = 85.3%). Following these were the average mileage for trips for other purposes (NI = 83.2%), the opinion of the respondents on the pollution of Belgrade from the aspect of pollutant emissions from road vehicles (NI = 73.8%), and the age of the inhabitants (NI = 72.6%).
The obtained results can play a key role when adopting strategies to reduce traffic congestion and environmental pollution in Belgrade. Namely, in addition to the fact that 69.8% of respondents are willing to use e-bikes and that the MLP model has a high ability to predict attitudes, understanding the influencing factors in this study can be of great importance to decision-makers. Future studies on the acceptability of new concepts of ways of transportation could deal with the analysis of the acceptability of the use of shared e-bike systems as an incentive to change habits during trips. Although, despite the small sample size, the MLP model gave very good prediction results, it is suggested that future studies be based on increasing the sample, as well as conducting field research in order to obtain more precise answers. The role of an interviewer would greatly help to resolve doubts during the survey and give more accurate answers, which, in addition to influencing a better sample, would have significant advantages in the formation, and later the training and testing, of the model. In addition, future studies could be extended to other classifiers, such as support vector machines, and be used for testing other kernels different from Gaussians. Also, thoughts on further research can go in the direction of combining artificial neural network models and traditional transport system models in order to define a new approach to promoting sustainable modes of transport [92].

Author Contributions

Conceptualization, J.K., S.K. and D.G.; methodology, J.K.; validation, S.K. and D.G.; writing—original draft preparation, J.K.; writing—review and editing, S.K. and D.G.; visualization, J.K., S.K. and D.G. All authors have read and agreed to the published version of the manuscript.

Funding

This research received no external funding.

Institutional Review Board Statement

Not applicable.

Informed Consent Statement

Not applicable.

Data Availability Statement

Data are contained within the article.

Conflicts of Interest

The authors declare no conflicts of interest.

References

  1. Milakis, D.; Athanasopoulos, K.; Vafeiadis, E.; Vasileiadis, K.; Vlastos, T. Planning of the Athens Metropolitan Cycle Network using Participative Multicriteria Gis Analysis. Procedia Soc. Behav. Sci. 2012, 48, 816–826. [Google Scholar] [CrossRef]
  2. Marquart, H.; Schuppan, J.; Köckler, H.; Eboli, L.; Marquart, H.; Schuppan, J. Promoting Sustainable Mobility: To What Extent Is ‘Health’ Considered by Mobility App Studies? A Review and a Conceptual Framework. Sustainability 2022, 14, 47. [Google Scholar] [CrossRef]
  3. Milenković, M.; Glavić, D.; Maričić, M. Determining factors affecting congestion pricing acceptability. Transp. Policy (Oxf.) 2019, 82, 58–74. [Google Scholar] [CrossRef]
  4. Zhang, W.; Jiang, L.; Cui, Y.; Xu, Y.; Wang, C.; Yu, J.; Streets, D.G.; Lin, B. Effects of urbanization on airport CO2 emissions: A geographically weighted approach using nighttime light data in China. Resour. Conserv. Recycl. 2019, 150, 104454. [Google Scholar] [CrossRef]
  5. Zhang, W.; Cui, Y.; Wang, J.; Wang, C.; Streets, D.G. How does urbanization affect CO2 emissions of central heating systems in China? An assessment of natural gas transition policy based on nighttime light data. J. Clean. Prod. 2020, 276, 123188. [Google Scholar] [CrossRef]
  6. Milenković, M.; Stepanović, N.; Glavić, D.; Tubić, V.; Ivković, I.; Trifunović, A. Methodology for determining ecological benefits of advanced tolling systems. J. Environ. Manag. 2020, 258, 110007. [Google Scholar] [CrossRef]
  7. Zhang, W.; Lu, Z.; Xu, Y.; Wang, C.; Gu, Y.; Xu, H.; Streets, D.G. Black carbon emissions from biomass and coal in rural China. Atmos. Environ. 2018, 176, 158–170. [Google Scholar] [CrossRef]
  8. Chondrogianni, D.; Stephanedes, Y.J.; Fatourou, P. Assessing Cycling Accessibility in Urban Areas through the Implementation of a New Cycling Scheme. Sustainability 2023, 15, 14472. [Google Scholar] [CrossRef]
  9. Liberto, C.; Valenti, G.; Orchi, S.; Lelli, M.; Nigro, M.; Ferrara, M. The impact of electric mobility scenarios in large urban areas: The Rome case study. IEEE Trans. Intell. Transp. Syst. 2018, 19, 3540–3549. [Google Scholar] [CrossRef]
  10. Komarica, J. The impact of micromobility on environmental pollution. J. Road Traffic Eng. 2023, 69, 45–52. [Google Scholar] [CrossRef]
  11. Timić, T.; Glavic, D.; Milenković, M. Micromobility—Vehicles, multimodality, infrastructure. J. Road Traffic Eng. 2020, 66, 59–64. [Google Scholar] [CrossRef]
  12. MacArthur, J.; Dill, J.; Person, M. Electric Bikes in North America: Results of an online survey. Transp. Res. Rec. 2014, 2468, 123–130. [Google Scholar] [CrossRef]
  13. Peine, A.; van Cooten, V.; Neven, L. Rejuvenating Design. Sci. Technol. Hum. Values 2016, 42, 429–459. [Google Scholar] [CrossRef]
  14. Nordback, K.; Sellinger, M.; Phillips, T. Regulations of E-Bikes in North America. TREC Final Reports. August 2014. Available online: https://pdxscholar.library.pdx.edu/trec_reports/128/ (accessed on 2 August 2024). [CrossRef]
  15. Salmeron-Manzano, E.; Manzano-Agugliaro, F. The electric bicycle: Worldwide research trends. Energies 2018, 11, 1894. [Google Scholar] [CrossRef]
  16. Weinert, J.X.; Chaktan, M.; Yang, X.; Cherry, C.R. Electric Two-Wheelers in China: Effect on travel behavior, mode shift, and user safety perceptions in a medium-sized city. Transp. Res. Rec. 2007, 2038, 62–68. [Google Scholar] [CrossRef]
  17. Hatwar, N.; Bisen, A.; Dodke, H.; Junghare, A.; Khanapurkar, M. Design approach for electric bikes using battery and super capacitor for performance improvement. In Proceedings of the IEEE Conference on Intelligent Transportation Systems, Proceedings, ITSC, Hague, The Netherlands, 6–9 October 2013; pp. 1959–1964. [Google Scholar] [CrossRef]
  18. Thomas, D.; Klonari, V.; Vallee, F.; Ioakimidis, C.S. Implementation of an e-bike sharing system: The effect on low voltage network using pv and smart charging stations. In Proceedings of the 2015 International Conference on Renewable Energy Research and Applications, ICRERA 2015, Palermo, Italy, 22–25 November 2015; pp. 572–577. [Google Scholar] [CrossRef]
  19. Djokic, N.; Milicevic, N.; Kalas, B.; Djokic, I.; Mirovic, V. E-Bicycle as a Green and Physically Active Mode of Transport from the Aspect of Students: TPB and Financial Incentives. Int. J. Environ. Res. Public Health 2023, 20, 2495. [Google Scholar] [CrossRef]
  20. Joumard, R.; Jost, P.; Hickman, J.; Hassel, D. Hot passenger car emissions modelling as a function of instantaneous speed and acceleration. Sci. Total Environ. 1995, 169, 167–174. [Google Scholar] [CrossRef]
  21. Berjisian, E.; Bigazzi, A. Summarizing the Impacts of Electric Bicycle Adoption on Vehicle Travel, Emissions, and Physical Activity; University of British Columbia: Vancouver, BC, Canada, 2019. [Google Scholar]
  22. Mira, M.T.; Maruyama, N.; Okamoto, M.; Hirota, M. Environmental Evaluation and Effectiveness of Electric-Assist Bicycle for a Local Transportation. April 2016. Available online: https://riunet.upv.es/handle/10251/62642 (accessed on 23 July 2024).
  23. Abagnale, C.; Cardone, M.; Iodice, P.; Marialto, R.; Strano, S.; Terzo, M.; Vorraro, G. Design and Development of an Innovative E-Bike. Energy Procedia 2016, 101, 774–781. [Google Scholar] [CrossRef]
  24. Greyson, K.A.; Gerutu, G.B.; Mohamed, C.H.; Chombo, P.V. Exploring the adoption of e-bicycle for student mobility in rural and urban areas of Tanzania. Sustain. Energy Technol. Assess. 2021, 45, 101206. [Google Scholar] [CrossRef]
  25. Boccaletti, C.; Duni, G.; Petrucci, P.; Santini, E. Design of an electrical drive for motorized bicycles. Renew. Energy Power Qual. J. 2008, 1, 349–353. [Google Scholar] [CrossRef]
  26. Bigazzi, A.; Berjisian, E. Modeling the impacts of electric bicycle purchase incentive program designs. Transp. Plan. Technol. 2021, 44, 679–694. [Google Scholar] [CrossRef]
  27. Ivković, I.; Kaplanović, S.; Sekulić, D. Analysis of external costs of CO2 emissions for CNG buses in intercity bus service. Transport 2019, 34, 529–538. [Google Scholar] [CrossRef]
  28. Baeli, V.; Hichy, Z.; Sciacca, F.; De Pasquale, C. Comparing the Relative Importance of Predictors of Intention to Use Bicycles. Front. Psychol. 2022, 13, 840132. [Google Scholar] [CrossRef] [PubMed]
  29. Kaplanović, S.; Živojinović, T. Financial incentives for electric vehicles adoption: Experiences and evidences from Europeancountries. Int. J. Traffic Transp. Eng. 2022, 12, 491–500. [Google Scholar] [CrossRef]
  30. Kaplanović, S.; Manojlović, A.; Živojinović, T. The role and importance of local incentive measures in the development of electromobility. Ecologica 2023, 30, 549–556. [Google Scholar] [CrossRef]
  31. de Kruijf, J.; Ettema, D.; Kamphuis, C.B.M.; Dijst, M. Evaluation of an incentive program to stimulate the shift from car commuting to e-cycling in the Netherlands. J. Transp. Health 2018, 10, 74–83. [Google Scholar] [CrossRef]
  32. Sundfør, H.B.; Fyhri, A. The effects of a subvention scheme for e-bikes on mode share and active mobility. J. Transp. Health 2022, 26, 101403. [Google Scholar] [CrossRef]
  33. Ciccone, A.; Fyhri, A.; Sundfør, H.B. Using behavioral insights to incentivize cycling: Results from a field experiment. J. Econ. Behav. Organ. 2021, 188, 1035–1058. [Google Scholar] [CrossRef]
  34. Blitz, A.; Busch-Geertsema, A.; Lanzendorf, M. More cycling, less driving? Findings of a cycle street intervention study in the Rhine-Main metropolitan region, Germany. Sustainability 2020, 12, 805. [Google Scholar] [CrossRef]
  35. Götschi, T.; de Nazelle, A.; Brand, C.; Gerike, R. Towards a Comprehensive Conceptual Framework of Active Travel Behavior: A Review and Synthesis of Published Frameworks. Curr. Environ. Health Rep. 2017, 4, 286–295. [Google Scholar] [CrossRef]
  36. Bourne, J.E.; Cooper, A.R.; Kelly, P.; Kinnear, F.J.; England, C.; Leary, S.; Page, A. The impact of e-cycling on travel behaviour: A scoping review. J. Transp. Health 2020, 19, 100910. [Google Scholar] [CrossRef] [PubMed]
  37. Cooper, A.R.; Tibbitts, B.; England, C.; Procter, D.; Searle, A.; Sebire, S.J.; Ranger, E.; Page, A.S. Potential of electric bicycles to improve the health of people with Type 2 diabetes: A feasibility study. Diabet. Med. 2018, 35, 1279–1282. [Google Scholar] [CrossRef] [PubMed]
  38. Van Cauwenberg, J.; De Bourdeaudhuij, I.; Clarys, P.; de Geus, B.; Deforche, B. Do Electric Bicycles Contribute to Active Ageing? J. Transp. Health 2018, 9, S3–S4. [Google Scholar] [CrossRef]
  39. Jahre, A.B.; Bere, E.; Nordengen, S.; Solbraa, A.; Andersen, L.B.; Riiser, A.; Bjørnarå, H.B. Public employees in South-Western Norway using an e-bike or a regular bike for commuting—A cross-sectional comparison on sociodemographic factors, commuting frequency and commuting distance. Prev. Med. Rep. 2019, 14, 100881. [Google Scholar] [CrossRef]
  40. Kroesen, M. To what extent do e-bikes substitute travel by other modes? Evidence from the Netherlands. Transp. Res. D Transp. Environ. 2017, 53, 377–387. [Google Scholar] [CrossRef]
  41. Wolf, A.; Seebauer, S. Technology adoption of electric bicycles: A survey among early adopters. Transp. Res. Part. A Policy Pract. 2014, 69, 196–211. [Google Scholar] [CrossRef]
  42. Simsekoglu, Ö.; Klöckner, C. Factors related to the intention to buy an e-bike: A survey study from Norway. Transp. Res. Part. F Traffic Psychol. Behav. 2019, 60, 573–581. [Google Scholar] [CrossRef]
  43. Haustein, S.; Møller, M. E-bike safety: Individual-level factors and incident characteristics. J. Transp. Health 2016, 3, 386–394. [Google Scholar] [CrossRef]
  44. Hiselius, L.W.; Svensson, Å. E-bike use in Sweden—CO2 effects due to modal change and municipal promotion strategies. J. Clean. Prod. 2017, 141, 818–824. [Google Scholar] [CrossRef]
  45. Plazier, P.A.; Weitkamp, G.; Den Berg, A.E.V. Exploring the adoption of e-bikes by different user groups. Front. Built Environ. 2018, 4, 364092. [Google Scholar] [CrossRef]
  46. Lee, A.; Molin, E.; Maat, K.; Sierzchula, W. Electric Bicycle Use and Mode Choice in the Netherlands. Transp. Res. Rec. 2015, 2520, 1–7. [Google Scholar] [CrossRef]
  47. Edge, S.; Dean, J.; Cuomo, M.; Keshav, S. Exploring e-bikes as a mode of sustainable transport: A temporal qualitative study of the perspectives of a sample of novice riders in a Canadian city. Can. Geogr./Le. Géographe Can. 2018, 62, 384–397. [Google Scholar] [CrossRef]
  48. Castro, A.; Gaupp-Berghausen, M.; Dons, E.; Standaert, A.; Laeremans, M.; Clark, A.; Anaya-Boig, E.; Cole-Hunter, T.; Avila-Palencia, I.; Rojas-Rueda, D.; et al. Physical activity of electric bicycle users compared to conventional bicycle users and non-cyclists: Insights based on health and transport data from an online survey in seven European cities. Transp. Res. Interdiscip. Perspect. 2019, 1, 100017. [Google Scholar] [CrossRef]
  49. Cairns, S.; Behrendt, F.; Raffo, D.; Beaumont, C.; Kiefer, C. Electrically-assisted bikes: Potential impacts on travel behaviour. Transp. Res. Part. A Policy Pract. 2017, 103, 327–342. [Google Scholar] [CrossRef]
  50. Biassoni, F.; Carmine, C.L.; Perego, P.; Gnerre, M. Choosing the Bicycle as a Mode of Transportation, the Influence of Infrastructure Perception, Travel Satisfaction and Pro-Environmental Attitude, the Case of Milan. Sustainability 2023, 15, 12117. [Google Scholar] [CrossRef]
  51. Melia, S.; Bartle, C. Who uses e-bikes in the UK and why? Int. J. Sustain. Transp. 2021, 16, 965–977. [Google Scholar] [CrossRef]
  52. Jones, T.; Harms, L.; Heinen, E. Motives, perceptions and experiences of electric bicycle owners and implications for health, wellbeing and mobility. J. Transp. Geogr. 2016, 53, 41–49. [Google Scholar] [CrossRef]
  53. Shaheen, S.; Guzman, S.; Zhang, H. Bikesharing in Europe, the Americas, and Asia. Transp. Res. Rec. 2010, 2143, 159–167. [Google Scholar] [CrossRef]
  54. Ma, S.; Yu, Z.; Liu, C. Nested Logit Joint Model of Travel Mode and Travel Time Choice for Urban Commuting Trips in Xi’an, China. J. Urban. Plan. Dev. 2020, 146, 04020020. [Google Scholar] [CrossRef]
  55. Al-Salih, W.Q.; Esztergár-Kiss, D. Linking Mode Choice with Travel Behavior by Using Logit Model Based on Utility Function. Sustainability 2021, 13, 4332. [Google Scholar] [CrossRef]
  56. Faber, R.; Merkies, R.; Damen, W.; Oirbans, L.; Massa, D.; Kroesen, M.; Molin, E. The role of travel-related reasons for location choice in residential self-selection. Travel. Behav. Soc. 2021, 25, 120–132. [Google Scholar] [CrossRef]
  57. Zhao, X.; Yan, X.; Yu, A.; Van Hentenryck, P. Prediction and behavioral analysis of travel mode choice: A comparison of machine learning and logit models. Travel. Behav. Soc. 2020, 20, 22–35. [Google Scholar] [CrossRef]
  58. Xie, C.; Lu, J.; Parkany, E. Work Travel Mode Choice Modeling with Data Mining: Decision Trees and Neural Networks. Transp. Res. Rec. 2003, 1854, 50–61. [Google Scholar] [CrossRef]
  59. Omrani, H. Predicting Travel Mode of Individuals by Machine Learning. Transp. Res. Procedia 2015, 10, 840–849. [Google Scholar] [CrossRef]
  60. Hagenauer, J.; Helbich, M. A comparative study of machine learning classifiers for modeling travel mode choice. Expert. Syst. Appl. 2017, 78, 273–282. [Google Scholar] [CrossRef]
  61. Wang, F.; Ross, C.L. Machine Learning Travel Mode Choices: Comparing the Performance of an Extreme Gradient Boosting Model with a Multinomial Logit Model. Transp. Res. Rec. 2018, 2672, 35–45. [Google Scholar] [CrossRef]
  62. Lindner, A.; Pitombo, C.S.; Cunha, A.L. Estimating motorized travel mode choice using classifiers: An application for high-dimensional multicollinear data. Travel. Behav. Soc. 2017, 6, 100–109. [Google Scholar] [CrossRef]
  63. Mohammadian, A.; Miller, E.J. Nested Logit Models and Artificial Neural Networks for Predicting Household Automobile Choices: Comparison of Performance. Transp. Res. Rec. 2002, 1807, 92–100. [Google Scholar] [CrossRef]
  64. Hensher, D.A.; Ton, T.T. A comparison of the predictive potential of artificial neural networks and nested logit models for commuter mode choice. Transp. Res. E Logist. Transp. Rev. 2000, 36, 155–172. [Google Scholar] [CrossRef]
  65. Sayed, T.; Razavi, A. Comparison of Neural and Conventional Approaches to Mode Choice Analysis. J. Comput. Civil. Eng. 2000, 14, 23–30. [Google Scholar] [CrossRef]
  66. Omrani, H.; Charif, O.; Gerber, P.; Awasthi, A.; Trigano, P. Prediction of individual travel mode with evidential neural network model. Transp. Res. Rec. 2013, 2399, 1–8. [Google Scholar] [CrossRef]
  67. Lee, D.; Derrible, S.; Pereira, F.C. Comparison of Four Types of Artificial Neural Network and a Multinomial Logit Model for Travel Mode Choice Modeling. Transp. Res. Rec. 2018, 2672, 101–112. [Google Scholar] [CrossRef]
  68. Eromietse, E.J.; Joseph, O.O. Comparative assessment of radial basis function neural network and multiple linear regression application to trip generation modelling in Akure, Nigeria. Int. J. Traffic Transp. Eng. 2019, 9, 163–176. [Google Scholar] [CrossRef]
  69. Assi, K.J.; Shafiullah, M.; Nahiduzzaman, K.M.; Mansoor, U. Travel-To-School Mode Choice Modelling Employing Artificial Intelligence Techniques: A Comparative Study. Sustainability 2019, 11, 4484. [Google Scholar] [CrossRef]
  70. Komarica, J.; Glavić, D.; Kaplanović, S. Comparative Analysis of the Predictive Performance of an ANN and Logistic Regression for the Acceptability of Eco-Mobility Using the Belgrade Data Set. Data 2024, 9, 73. [Google Scholar] [CrossRef]
  71. Tang, D.; Yang, M.; Zhang, M. Travel Mode Choice Modeling: A Comparison of Bayesian Networks and Neural Networks. Appl. Mech. Mater. 2012, 209–211, 717–723. [Google Scholar] [CrossRef]
  72. Nam, D.; Kim, H.; Cho, J.; Jayakrishnan, R. A Model Based on Deep Learning for Predicting Travel Mode Choice. 2017. Available online: https://www.researchgate.net/publication/317913178 (accessed on 27 July 2024).
  73. Mohan, Y.; Chee, S.S.; Xin, D.K.P.; Foong, L.P. Artificial neural network for classification of depressive and normal in EEG. In Proceedings of the IECBES 2016—IEEE-EMBS Conference on Biomedical Engineering and Sciences, Kuala Lumpur, Malaysia, 4–8 December 2016; pp. 286–290. [Google Scholar] [CrossRef]
  74. Lewis, F.L.; Huang, J.; Parisini, T.; Prokhorov, D.V.; Wunsch, D.C. Guest editorial: Special issue on neural networks for feedback control systems. IEEE Trans. Neural Netw. 2007, 18, 969–972. [Google Scholar] [CrossRef]
  75. Park, Y.S.; Lek, S. Artificial Neural Networks: Multilayer Perceptron for Ecological Modeling. Dev. Environ. Model. 2016, 28, 123–140. [Google Scholar] [CrossRef]
  76. Chon, T.-S.; Park, Y.-S.; Kim, J.-M.; Lee, B.-Y.; Chung, Y.-J.; Kim, Y. Use of an Artificial Neural Network to Predict Population Dynamics of the Forest–Pest Pine Needle Gall Midge (Diptera: Cecidomyiida). Environ. Entomol 2000, 29, 1208–1215. [Google Scholar] [CrossRef]
  77. Popescu, M.C.; Balas, V.E. Multilayer perceptron and neural networks. WSEAS Trans. Circuits Syst. 2009, 8, 579–588. [Google Scholar]
  78. Hossain, M.S.; Ong, Z.C.; Ismail, Z.; Khoo, S.Y. A comparative study of vibrational response based impact force localization and quantification using radial basis function network and multilayer perceptron. Expert. Syst. Appl. 2017, 85, 87–98. [Google Scholar] [CrossRef]
  79. Wu, Y.; Wang, H.; Zhang, B.; Du, K.-L. Using Radial Basis Function Networks for Function Approximation and Classification. ISRN Appl. Math. 2012, 2012, 1–34. [Google Scholar] [CrossRef]
  80. Montazer, G.A.; Giveki, D.; Karami, M.; Rastegar, H. Radial Basis Function Neural Networks: A Review. 2018. Available online: http://purkh.com/index.php/tocomp (accessed on 20 July 2024).
  81. Bozkurt, A.; Şeker, F. Harmonizing Heritage and Artificial Neural Networks: The Role of Sustainable Tourism in UNESCO World Heritage Sites. Sustainability 2023, 15, 13031. [Google Scholar] [CrossRef]
  82. “Republic Institute for Statistics of Serbia. Available online: https://www.stat.gov.rs/sr-latn/publikacije/publication/?p=15527 (accessed on 2 August 2024).
  83. Ministry of Environmental Protection (Environmental Protection Agency) SEPA Republic of Serbia. Annual Report on the State of Air Quality in the Republic of Serbia in 2021. Available online: https://sepa.gov.rs/publikacije/ (accessed on 12 July 2024).
  84. Belgrade Traffic Infrastructure Master Plan—Smart Plan 2021/2027/2033| City of Belgrade. Available online: https://www.beograd.rs/lat/gradske-aktuelnosti/1737205-master-plan-saobracajne-infrastrukture-beograda---smart-plan-2021-2027-2033/ (accessed on 2 August 2024).
  85. Cirianni, F.; Monterosso, C.; Panuccio, P.; Rindone, C. A Review Methodology of Sustainable Urban Mobility Plans: Objectives and Actions to Promote Cycling and Pedestrian Mobility. Green. Energy Technol. 2018, 685–697. [Google Scholar] [CrossRef]
  86. Development strategy of the city of Belgrade. Available online: https://www.sllistbeograd.rs/lat/arhiva/broj/466/ (accessed on 2 August 2024).
  87. GUP Belgrade—Directorate for Building Land and Construction of Belgrade J.P. Available online: https://www.beoland.com/planovi/gup-beograda/ (accessed on 2 August 2024).
  88. Bekesiene, S.; Smaliukiene, R.; Vaicaitiene, R. Using artificial neural networks in predicting the level of stress among military conscripts. Mathematics 2021, 9, 626. [Google Scholar] [CrossRef]
  89. Bekesiene, S.; Meidute-Kavaliauskiene, I.; Vasiliauskiene, V. Accurate Prediction of Concentration Changes in Ozone as an Air Pollutant by Multiple Linear Regression and Artificial Neural Networks. Mathematics 2021, 9, 356. [Google Scholar] [CrossRef]
  90. Milenković, M.; Glavić, D.; Trifunović, A.; Komarica, J. User’s willingness to accept the shared dockless e-scooter system: Belgrade case study. Transp. Res. Procedia 2023, 72, 279–286. [Google Scholar] [CrossRef]
  91. Glavić, D.; Milenković, M.; Trifunović, A.; Jokanović, I.; Komarica, J. Influence of Dockless Shared E-Scooters on Urban Mobility: WTP and Modal Shift. Sustainability 2023, 15, 9570. [Google Scholar] [CrossRef]
  92. Rindone, C.; Vitetta, A. Measuring Potential People’s Acceptance of Mobility as a Service: Evidence from Pilot Surveys. Information 2024, 15, 333. [Google Scholar] [CrossRef]
Figure 1. Map of the existing and planned bike paths [87].
Applsci 14 08965 g001
Figure 2. Methodological flow chart of this study.
Applsci 14 08965 g002
Figure 3. Schematic representation of the structure of artificial neural networks (ANNs): (a) multilayer perceptron model; (b) radial basis function model.
Applsci 14 08965 g003
Figure 4. Predicted pseudo-probability presented for responses to the e-bicycle acceptability question: (a) box plot diagram of MLP model; (b) box plot diagram of RBF model.
Applsci 14 08965 g004
Figure 5. Presentation of the correct classifications obtained by the model in relation to classifications without the use of the model: (a) gain curves of multilayer perceptron model and (b) gain curves of radial basis function model.
Applsci 14 08965 g005
Figure 6. Presentation of the correct classifications obtained by the model and measurement of its classification performance on part of the population: (a) lift curve of multilayer perceptron model and (b) lift curve of radial basis function model.
Applsci 14 08965 g006
Table 1. Summary of the selected literature on the application of different models for predicting the choice of travel mode.
AuthorsClassification Algorithm *Data SourcesTransport ModesModel Prediction AccuracyImportant Variables
Xie et al. [58]DT, NN, MNLn = 34,680 observationsSingle-occupancy vehicle, DT = 76.8%;
NN = 78.2%;
MNL = 72.9%
Socio-demographic and economic attributes, number of vehicles in the household and license ownership, service level attributes, and travel time and costs.
Carpool, transit, bicycle, walkDT = 86.0%;
NN = 88.0%;
MNL = 86.7%
Omrani et al. [66]MLP, RBF, Bayes, DT, ENN, KNN, MNL, SVMn = 3673 householdsPrivate car, bus, train, cycling, walking MLP = 80.12%;
RBF = 81%;
Bayes = 67%;
DT = 78%;
ENN = 83%;
KNN = 77%;
MNL = 62%;
SVM = 79%
Costs, social and demographic variables, availability of transportation, and geographic information.
Omrani et al. [59]MLP, RBF, MLN, SVMn = 3670 observationsCar, public transport, cycling, walkingMLP = 81.1%;
RBF = 79.2%;
MNL = 67.7%;
SVM = 64.7%
Costs, places of work and residence, and social and demographic variables.
Lee et al. [67]BPN, RBF, PNN, CPN, MNLn = 10,500 householdsWalk, bike, transitBPN = 79.4%;
RBF = 78.4%;
PNN = 82.9%;
CPN = 83.3%;
MNL = 70.5%
The cost of the car and transit cost were the sensitive variables, notably for MNL and BPN models.
Assi et al. [69]ELM, SVM, MLPn = 2747 observationsPassenger car, walkELM = 97.30%;
SVM = 89.53%;
MLP = 98.99%
Family income, travel time, and parents’ education level.
Komarica et al. [70]BLR, MLPn = 503 observationsElectric microvehiclesBLR = 84.7%;
MLP = 85%
Attitudes about pollution, use of bicycles and motorcycles, mileage, and income.
Tang et al. [71]BPN, TANn = 2000 observationsWalk, bike, private car, busBPN = 72.2%;
TAN = 75.4%
Traveler characteristic, household characteristic, and trip characteristic.
* Classification Algorithm: NN—neural network; MLP—multilayer perceptron; RBF—radial basis function; Bayes—Bayes classifier; DT—decision tree; ENN—evidential neural network; KNN—k-nearest neighbor algorithm; MNL—multinomial logit; SVM—support vector machine; ELM—extreme learning machine; BPN—backpropagation neural network; PNN—probabilistic neural network; CPN—clustered probabilistic neural network; BLR—binary logistic regression; MLR—Multiple Linear Regression Model; TAN—Tree Augmented Naïve Bayes.
Table 2. A comparison table for MLP and RBF networks [81].
CriterionMultilayer Perceptron (MLP)Radial Basis Function (RBF)
Network StructureMultilayer and feedforward neural networkOne hidden layer, radial basis function net
Learning ApproachGradient-based backpropagation algorithmCompetitive learning algorithm followed by least-squares regression
Activation FunctionNonlinear functions like sigmoid, ReLU, tanh, etc.Gaussian radial basis functions
Training SpeedSlow to moderateFast
Training DataRequires a large amount of labeled dataRequires fewer labeled data
InterpretabilityLess interpretable than RBFMore interpretable than MLP
PerformanceGood for complex classification tasksGood for simple to moderately complex tasks
OverfittingMore prone to overfittingLess prone to overfitting
AdvantagesCan learn complex, nonlinear relationsFast training, good for simple tasks
DisadvantagesSlow to train, requires more dataLess flexible, may underfit complex tasks
Table 3. Attributes for developing ANN models.
Input Attributes for Developing MLP and RBF Models
Socio-Demographic and Economic Characteristics of Respondents (5 Attributes)
GenderFemale; Male
Age<18; 18–25; 26–35; 36–45; 46–55; 56–65; >65
EducationPrimary education; High school education; Higher education; Bachelor of Science degree; Master of Science degree; Doctor of Philosophy degree
EmploymentStudent; Unemployed; Occasionally employed; Permanently employed; Retiree
Monthly personal incomeEUR <250; EUR 250–500; EUR 501–750; EUR 751–1000; EUR 1001–1250; EUR 1251–1500; EUR >1500
Trip characteristics (14 attributes)
Using a mode of transport with a purposeFrequency
Commuting tripsPassenger car; Motorcycle; Public transport; Bicycle; Walking; Other modes of transportDaily; Several times a week; Several times a month; Several times a year; Never
Trips with other purposes
Average mileage (in one direction) for commuting trips<0.5 km; 0.5–2.5 km; 2.5–5.0 km; 5.0–8.0 km; 8.0–12 km; 12–20 km; 20–30 km; >30 km
Average mileage (in one direction) for trips with other purposes
Respondents’ views on the pollution of Belgrade by road traffic (2 attributes)
Pollution of Belgrade by pollutant emissions
from road vehicles
1—very large extent; 2—large extent; 3—medium extent; 4—small extent; 5—very small extent
Pollution of Belgrade by noise from road vehicles
Reasons for not using e-bikes (5 attributes)
Non-existent infrastructure; (No) safety during the trip for e-bicycle users; Price of e-bicycle; Unfavorable type of terrain; No existent parking spaces for e-bicycles1—the most important; 2—significant; 3—moderately significant; 4—less significant; 5—the least significant
Table 4. Socio-demographic and economic characteristics of the users.
Sample Characteristicsn%Sample Characteristicsn%
Gender Education
Female35051.5%Primary education71%
Male33048.5%High school education16724.6%
Age Higher education9614.1%
<1860.9%Bachelor of Science degree27139.9%
18–2523234.1%Master of Science degree12518.4%
26–3514621.5%Doctor of Philosophy degree142.1%
36–4512217.9%Average monthly personal income
46–5512117.8%EUR <25015322.5%
56–65395.7%EUR 250–500 659.6%
>65142.1%EUR 501–750 19128.1%
Employment status EUR 751–1000 16324%
Student15723.1%EUR 1001–1250 507.4%
Unemployed213.2%EUR 1251–1500 253.7%
Occasionally employed9514.0%EUR >1500334.9%
Permanently employed38656.8%
Retiree213.1%
Table 5. Prediction of e-bikes acceptability using ANN models.
Multilayer Perceptron (MLP)Radial Basis Function (RBF)
Existing ValuesCorrectly Classified Instances (%)Existing ValuesCorrectly Classified Instances (%)
Data SetEstimated ValuesI Would AcceptI Wouldn’t AcceptI Would AcceptI Wouldn’t Accept
TrainingI would accept278996.9%2721594.8%
I wouldn’t accept216575.6%316065.9%
Overall (%)80.2%19.8%92.0%80.2%19.8%87.8%
TestingI would accept95595.0%801088.9%
I wouldn’t accept91562.5%121147.8%
Overall (%)83.9%16.1%88.7%81.4%18.6%80.5%
HoldoutI would accept841584.8%981189.9%
I wouldn’t accept141653.3%17934.6%
Overall (%)76.0%24.0%77.5%85.2%14.8%79.3%
Table 6. Accuracy of e-bike acceptability classification.
ModelAccuracyFP RatePrecisionRecallF1MCCROCClass
Multilayer Perceptron (MLP)0.8870.3750.9130.9500.9310.6180.927I would accept
0.8870.0500.7500.6250.6820.6180.927I wouldn’t accept
0.8870.2130.8320.7880.8070.6180.927Avg.
Radial Basis Function (RBF)0.8050.5220.8700.8890.8790.3800.897I would accept
0.8050.1110.5240.4780.5000.3800.897I wouldn’t accept
0.8050.3160.6970.6840.6900.3800.897Avg.
Table 7. Independent variables’ importance in the MLP model.
VariablesImportanceNormalized Importance
Mileage when commuting0.064100.0%
Frequency of motorcycle for commuting trips0.06297.0%
Frequency of motorcycles for trips with other purposes0.05485.3%
Mileage for trips with other purposes0.05383.2%
Pollution of Belgrade by pollutant emissions from road vehicles0.04773.8%
Age0.04672.6%
Education0.04671.7%
Frequency of other modes of transport for commuting trips0.04571.0%
Unfavorable type of terrain 0.04570.6%
(No) safety during the trip for e-bicycle users0.04469.5%
Frequency of bicycle for commuting trips0.04265.1%
Price of e-bicycle0.03960.7%
Monthly personal income0.03858.8%
Frequency of walking for trips with other purposes0.03757.7%
Frequency of bicycle for trips for other purposes0.03453.5%
Pollution of Belgrade by noise from road vehicles0.03453.3%
Frequency of use of other transport modes for trips with other purposes0.03351.9%
Frequency of public transport for commuting trips0.03351.2%
Frequency of passenger car use for trips with other purposes0.03148.8%
Employment0.02945.5%
Non-existent infrastructure0.02844.2%
Frequency of passenger car use for commuting trips0.02742.6%
Frequency of public transport for trips with other purposes0.02641.2%
No existent parking spaces for e-bicycles0.02133.1%
Gender0.02132.6%
Frequency of walking for commuting trips0.02132.3%
Disclaimer/Publisher’s Note: The statements, opinions and data contained in all publications are solely those of the individual author(s) and contributor(s) and not of MDPI and/or the editor(s). MDPI and/or the editor(s) disclaim responsibility for any injury to people or property resulting from any ideas, methods, instructions or products referred to in the content.

