Article

Microstructure Evolution and Forming Characteristics of Post-Weld Composite Treatment of 6061 Aluminum Alloy Tailor Welded Blanks

School of Materials Science and Engineering, Dalian University of Technology, Dalian 116024, China
*
Author to whom correspondence should be addressed.
Appl. Sci. 2024, 14(19), 8998; https://doi.org/10.3390/app14198998
Submission received: 26 August 2024 / Revised: 2 October 2024 / Accepted: 4 October 2024 / Published: 6 October 2024
(This article belongs to the Special Issue Advanced Manufacturing Processes: Technologies and Applications)

Abstract

:

Featured Application

This paper develops an innovative post-weld composite treatment process, which can significantly improve the formability of aluminum alloy tailor welded blanks compared with the traditional single post-weld treatment method.

Abstract

The mechanical properties and cross-sectional geometric dimensions of the fusion zone (FZ), heat affected zone (HAZ), and base metal (BM) of 6xxx series aluminum alloys are inconsistent after filler wire welding, which reduces the formability of aluminum alloy tailor welded blanks (TWBs). This paper proposes a post-weld cold rolling-solution heat treatment (PWCR-SHT) composite process, and the effects of weld excess metal, plastic deformation, and SHT on the formability of aluminum alloy TWBs are studied. The results show that the PWCR-SHT composite process eliminates the weld excess metal and internal pores, reduces the stress concentration at the weld toe, eliminates the local strain hardening behavior, and causes recrystallization in the FZ region. The cupping value of aluminum alloy TWBs using SHT is 105% of BM, in comparison, the cupping value of aluminum alloy TWBs using the PWCR-SHT composite process is 119% of BM, which is the result of the combined effect of geometric dimensions consistency and mechanical properties consistency.

1. Introduction

Lightweight materials and a reduction in their manufacturing costs have been topics pursued in the automotive, aerospace, marine, and other fields [1,2,3]. Lightweight materials replace steel and iron materials with light metals or non-metals without compromising the product’s strength. These materials can be joined together by gluing [4] or riveting [5]. Still, when it comes to complex assembly situations such as the formation of multiple presses [6], these joining methods are challenging to meet their requirements, and the TWBs have successfully solved this problem. The TWBs are preformed parts made of two or more alloy plates welded together to achieve the comprehensive performance of joining between different plates (dissimilar alloys or different thicknesses). Then, cold or hot stamping techniques are used to form the final net-formed parts. With the increasing emphasis on automotive lightweight materials, the Al-Al TWBs have been well applied in the automotive field, and Lutsey et al. [7] reported that the use of aluminum body materials could save 5–7% of the fuel and reduce the deadweight by about 10% compared with steel body materials. Unequal-thickness aluminum alloy [8] and dissimilar aluminum alloy [9] TWBs were studied, and it was found that the increase in the thickness ratio of the TWBs during stamping leads to the offset of the FZ. In contrast, the differences in alloy compositions and mechanical properties affect the failure location of the dissimilar TWBs.
The 6000 series aluminum alloys are renowned for their high specific strength, exceptional specific stiffness, excellent corrosion resistance, and notable plasticity [10]. These qualities impart machinability to thin-sheet aluminum alloys, making them preferred for various automotive parts and components, including hoods, trunk lids, inner and outer door panels, and door-side frames [11]. However, the aluminum alloy TWBs’ formability is constrained compared to the BM. This limitation primarily stems from the inherent disparities in the microstructure and the properties between the FZ and the BM [12], prompting further investigation into the post-weld heat treatment process. Babu et al. [13] suggested that the formability of the AA6061 and the AA2014 TWBs, which have undergone solution heat treatment, surpasses that of untreated counterparts, surpassing that of the BM. Liuwei’s research [14] indicated that adopting an appropriate preheating temperature for the AA2219 TWBs enhances formability while preserving FZ strength and preventing abnormal grain growth. Notably, the forming ability of the TWBs improved significantly when the preheating temperature was raised from 300 °C to 350 °C. Dae-Hoon Ko et al. [15] employed a novel approach to enhance formability by conducting a simultaneous quenching and forming treatment for the aluminum alloy TWBs within the forming die. The introduction of controlled plastic deformation after welding has proven effective in bolstering the strength of welded joints. Cheng et al. [16] applied rolling to the weld excess metal of an aluminum alloy to ameliorate softening phenomena, subsequently developing a post-weld composite treatment process [17] encompassing solution heat treatment, artificial aging treatment, and cold rolling. This method achieved synergistic strengthening involving second-phase strengthening and dislocation strengthening. Nevertheless, it is crucial to note that this type of strengthening can lead to over-strengthening (resulting in joint hardness exceeding that of the BM) and uneven plastic deformation in different regions, potentially diminishing the forming capabilities of the TWBs.
Previous studies that aimed at enhancing the formability of aluminum alloy TWBs have mainly focused on the forming process itself and a single pre-weld or post-weld heat treatment process [14,18,19,20], with limited exploration of alternative post-treatment methods. Consequently, this paper introduces a novel approach to further augment the formability of the aluminum alloy TWBs by incorporating a cold-rolling (CR) process before the post-weld solution heat treatment (PWSHT) process, herein referred to as the post-weld cold-rolling-solution heat treatment (PWCR-SHT) composite treatment process. The CR procedure reduces weld excess metal, ensuring uniform dimensions across the welded joints. At the same time, PWSHT eliminates the strain-hardening effects resulting from CR, thereby homogenizing the overall mechanical properties of the TWBs. This paper comprehensively elucidates the evolution in microstructure and mechanical properties within the PWCR-SHT, considering the synergistic influence of heat and mechanical force. Moreover, it unveils the underlying mechanism through which the PWCR-SHT enhances the formability of the TWBs.

2. Materials and Methods

The experiments utilized 6061-T6 aluminum alloy sheets measuring 100 mm × 50 mm × 2 mm. Figure 1 shows the fiber-like morphology of the aluminum alloy, while the mechanical properties of 6061-T6 were characterized by ultimate tensile strength (UTS): σb = 308 MPa, elongation (EL): 16.7%, and microhardness (HV0.5): 113 (the above data are measured by a universal testing machine and a hardness tester, and the specific experimental details are provided in the following text). The ER5356 aluminum-magnesium welding wire with a diameter of 1.2 mm was employed, and Table 1 presents the elemental composition of 6061-T6 and ER5356.
Before welding, the sheets were meticulously polished with a stainless steel brush to eliminate surface oxides and cleaned with acetone. The chosen welding method was DC double-pulse MIG (DP-MIG) butt welding (electric welding machine, DP500, DAIHEN Corporation, Osaka, Japan), wherein the current waveform comprised two components, i.e., a low-frequency pulse and a high-frequency pulse, supplemented by varying current amplitudes. This approach facilitated the agitation of the molten pool within the FZ, reducing porosity and refining grain size. The welding parameters included a current of 80 A, as detailed in Table 2, wire feed speed adjusted to match the welding current, welding speed of 800 mm/min, and the use of 99.99% Ar shielding gas at a flow rate of 16 L/min, with a 13 mm wire extension.
Using a rolling machine, the TWBs with weld excess metal underwent CR experiments at room temperature. The rolling direction aligned with the welding direction, and the roll gap was set at 2.0 mm, equivalent to the thickness of the BM, controlled via an operating platform. For the SHT, the temperature was maintained at 520 ± 5 °C for 1.5 h, with a quenching transfer time reduced to less than 10 s to prevent decomposition of the supersaturated solid solution (SSSS) during quenching. The SHT is the same as the solution heat treatment in the T6 treatment of the original BM. The four post-weld treatment processes are shown in Table 3.
The polarized optical microscope (POM, Zeiss HAL-100, Carl Zeiss AG, Jena, Germany) examined grain morphology. Metallographic samples underwent mechanical polishing using 400#-2400# SiC sandpaper sequentially. Subsequently, electrochemical polishing was performed with a solution of HClO4:C2H5OH in a 1:9 ratio for 10 s. Anodic oxidation was then carried out for 100 s, utilizing a solution comprising HBF4:H2O in a 1:40 ratio. The final POM metallographic samples were prepared for analysis. The scanning electron microscope (SEM, ZEISS-SUPRA55, Carl Zeiss AG, Jena, Germany) with an energy-dispersive spectrometer (EDS, Oxford Instruments, Abingdon-on-Thames, UK) was utilized for elemental and second-phase distribution analysis. Uniaxial tensile tests were conducted on specimens using the electronic universal tensile testing machine (Instron 5982, Instron Corporation, Boston, MA, USA) at room temperature, with a 2 mm/min displacement rate. The results represent the average of three tests on specimens subjected to identical process parameters. Tensile fracture surfaces were examined using the ZEISS-SUPRA55 SEM. The Touch HV-1000A touch screen microhardness tester was employed to evaluate microhardness distribution across various joint regions. The measurement was conducted under a 500 g load, with a holding time of 10 s and a spacing of 400 μm [21]. The dimensions of the tensile samples and the locations of hardness measurements are shown in Figure 2.
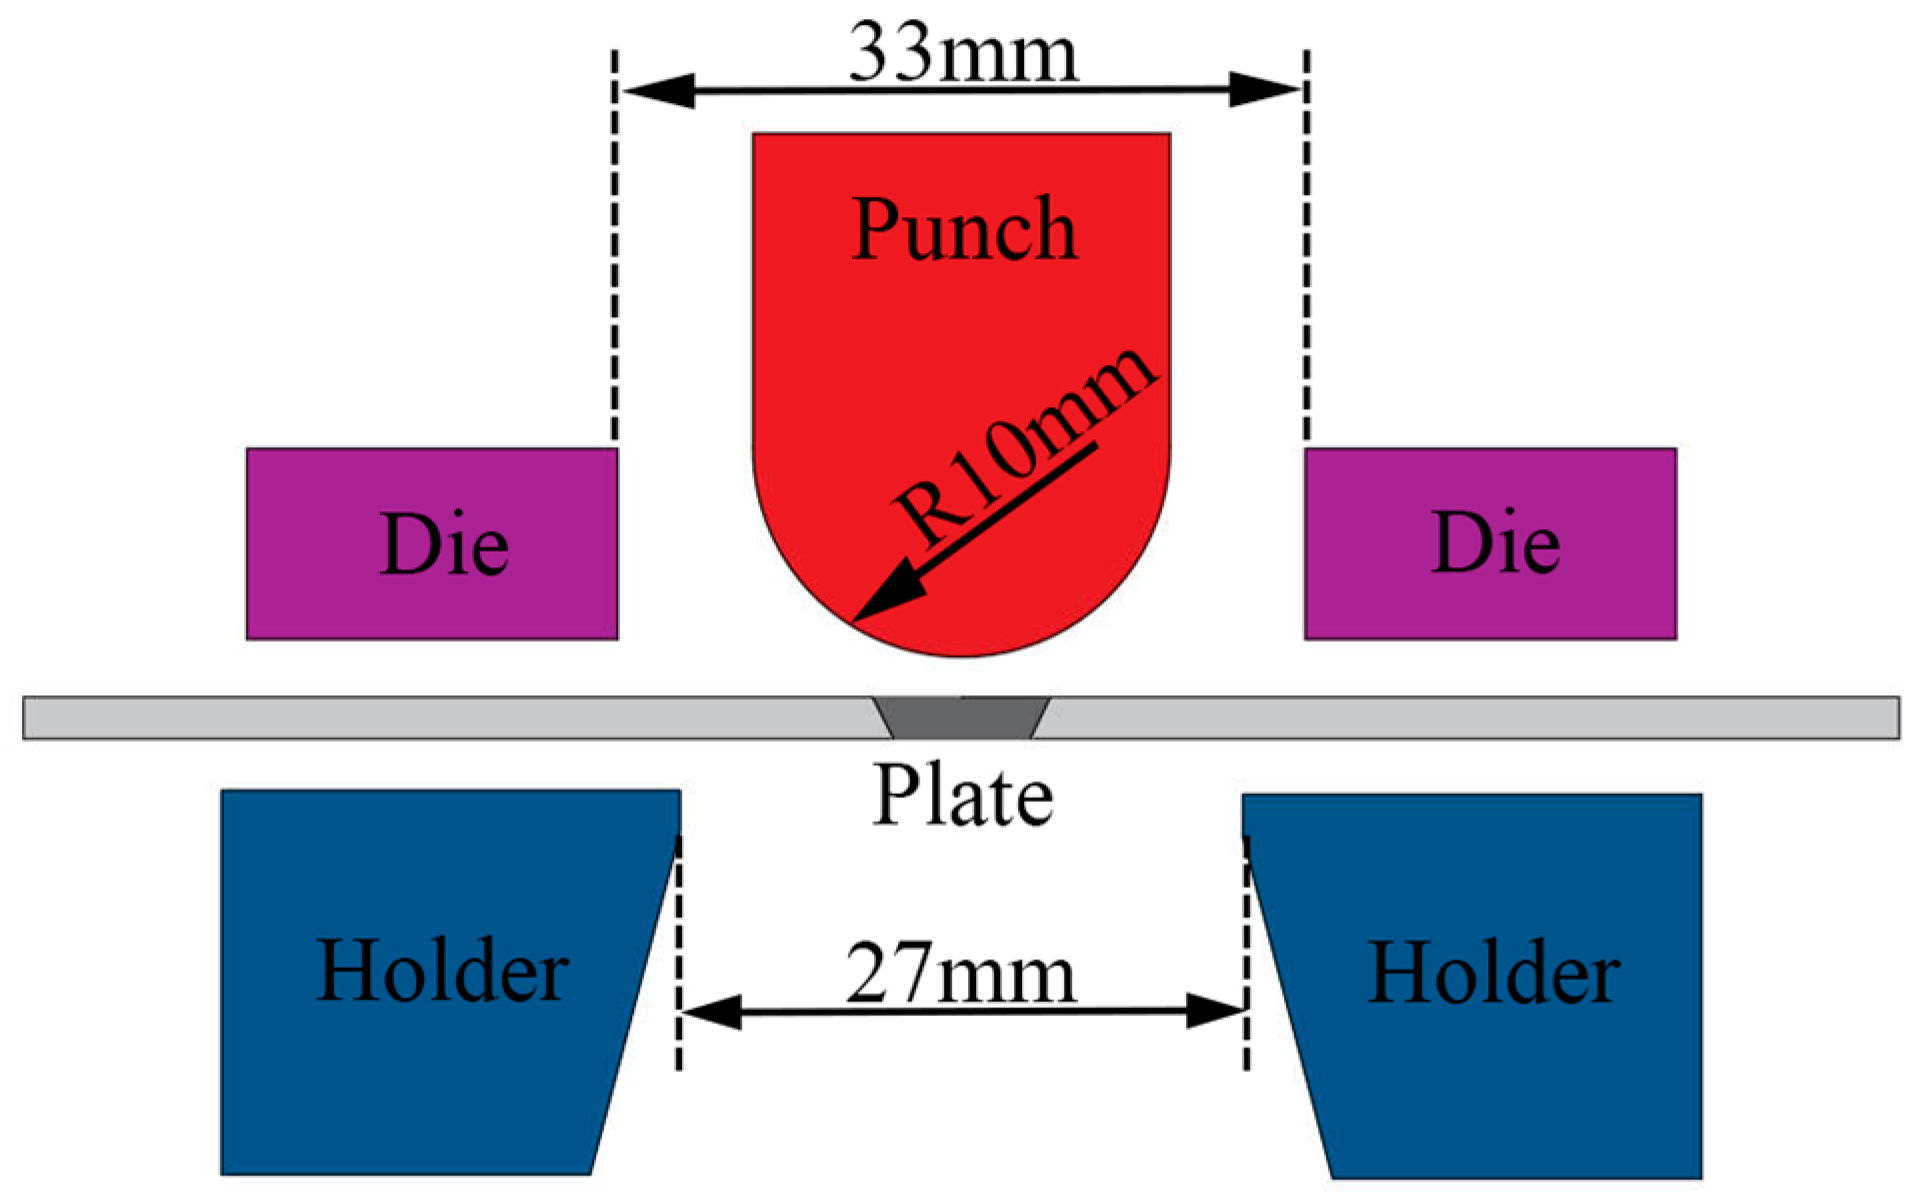
The Erichsen cupping test [22] was employed, and the mold’s operational principle is shown in Figure 3. The TWBs were cut into square plates measuring 70 mm × 70 mm, with the FZ’s centerline aligning precisely with the centerline of the square container. The plate’s center was securely affixed to the die, and the punch descended at a rate of 5 mm/min until the plate ruptured, and the final calculation of the Erichsen cupping depth and the ratio of it to the BM cupping depth (formability ratio) was performed, thereby assessing the formability of the TWBs.

3. Results

3.1. Microstructure

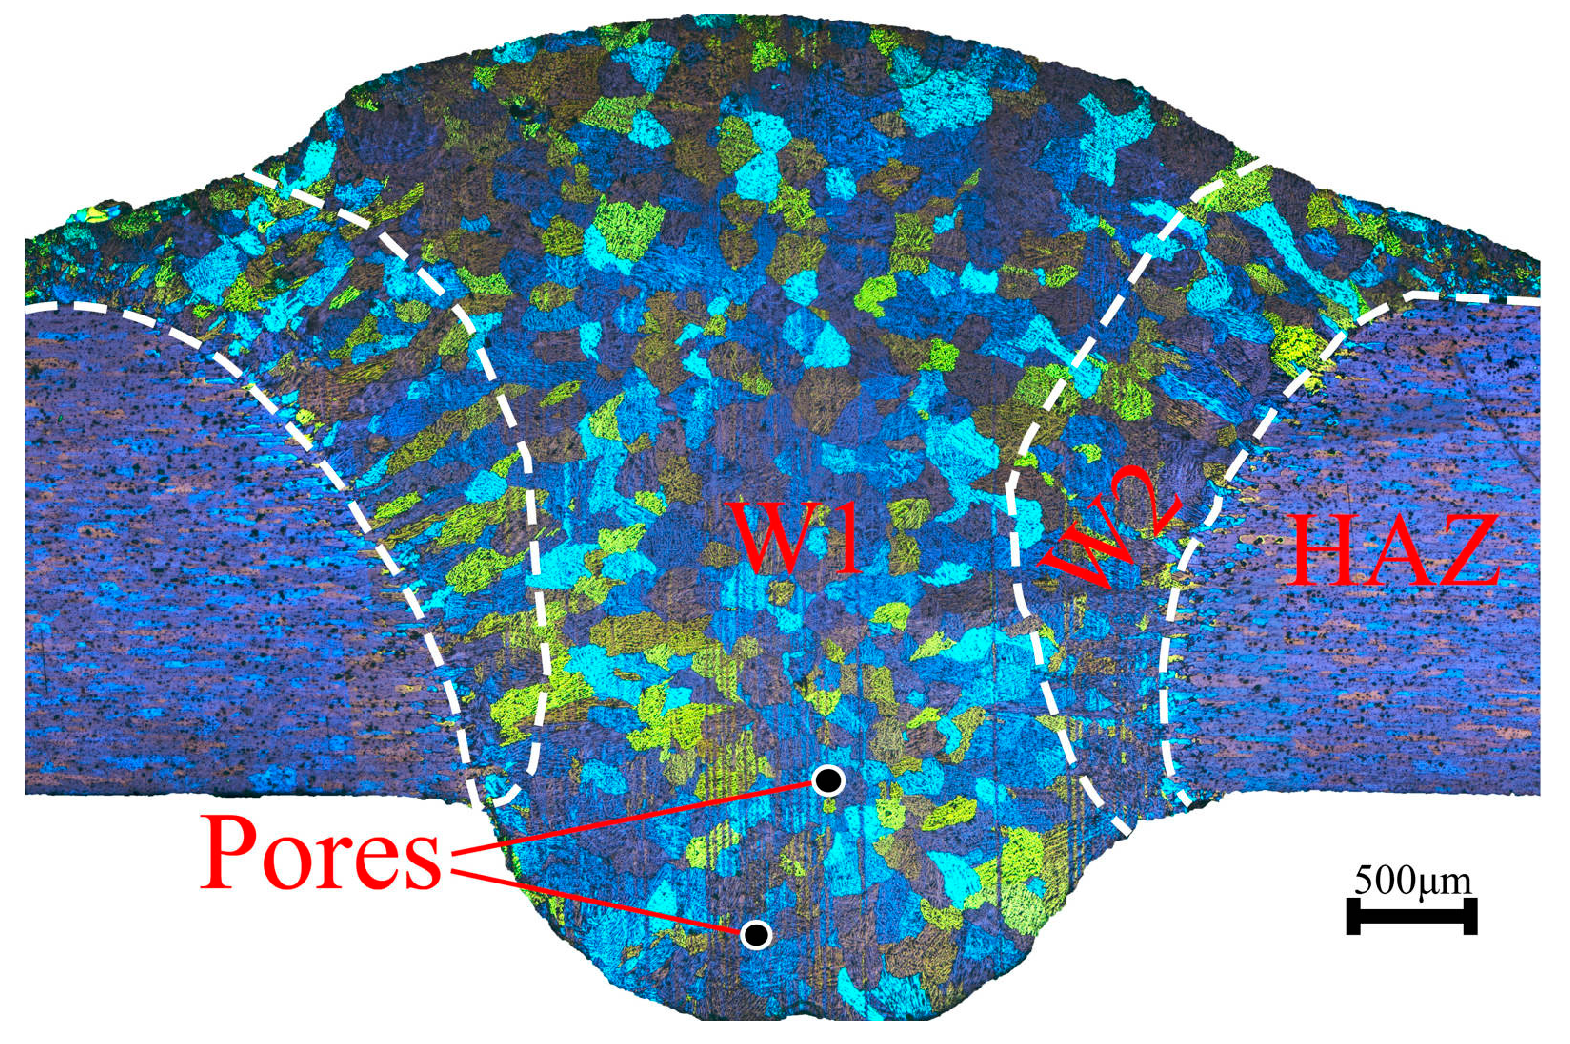
Figure 4 shows the microstructure of the FZ of the as-weld (AW) joints. Single-sided welding results in uneven melting across the upper and lower surfaces of the plate, leading to more considerable weld excess metal on the upper side than that on the lower side. Numerous nucleation points initiate dendrite growth during the cooling phase of the FZ’s central molten pool, and a few pores are present at the base of the FZ. These dendrites subsequently merge and form closely interconnected equiaxed dendrite grains, as observed in the W1 region. The molten pools on either side of the FZ grow in opposing directions relative to heat dissipation, forming columnar grains in the W2 region [23].
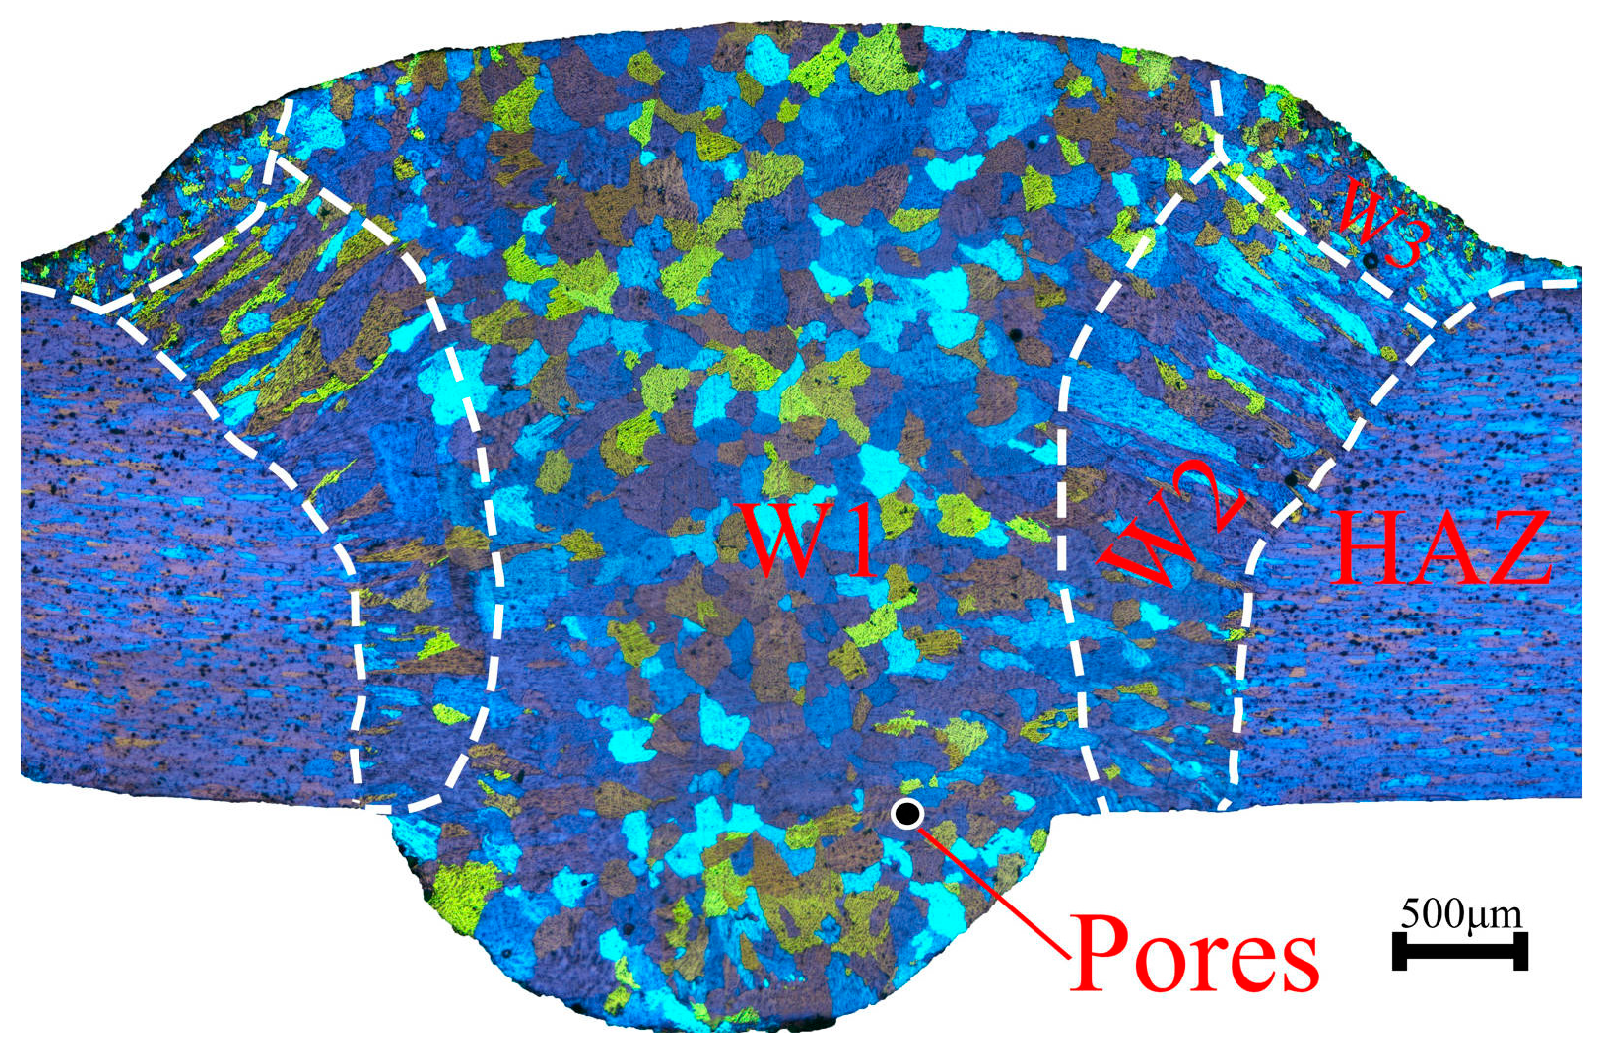
Figure 5 shows the microstructure of the FZ of the PWCR joints. Notably, both the upper and lower weld excess metals have vanished, resulting in an increased width of the FZ and the elimination of pores. Under the rolling force, the FZ grains have become flattened and elongated. The equiaxed grains at the center of the FZ (W1, W3, W4) have transformed into deformed grains along the parallel direction. The W3 and W4 regions represent the weld excess metal. In the upper and lower excess metal areas, the FZ grains are influenced by a unidirectional rolling force, causing them to move in the direction of the applied force. However, the extent of deformation is relatively minimal in these regions. Conversely, in the W1 region, grains experience the combined effects of upward and downward rolling forces, making it challenging to move solely along the thickness direction. Consequently, the degree of deformation in the W1 region surpasses that observed in the W3 and W4 regions. Furthermore, the columnar grains (W2) on both sides of the FZ have shifted laterally, becoming slenderer. Their orientation aligns with the fibrous grains observed in the HAZ due to the rolling process.
Figure 6 shows the macro-and microstructure of the FZ of the PWSHT joints. Compared to the FZ of the AW joints, there is no discernible difference in the macroscopic size or grain morphology. The columnar grains in the W2 region exhibit slight indications of growth, and refined equiaxed grains are present in the W3 region. Overall, the PWSHT process has minimal impact on the morphology of the FZ grains.
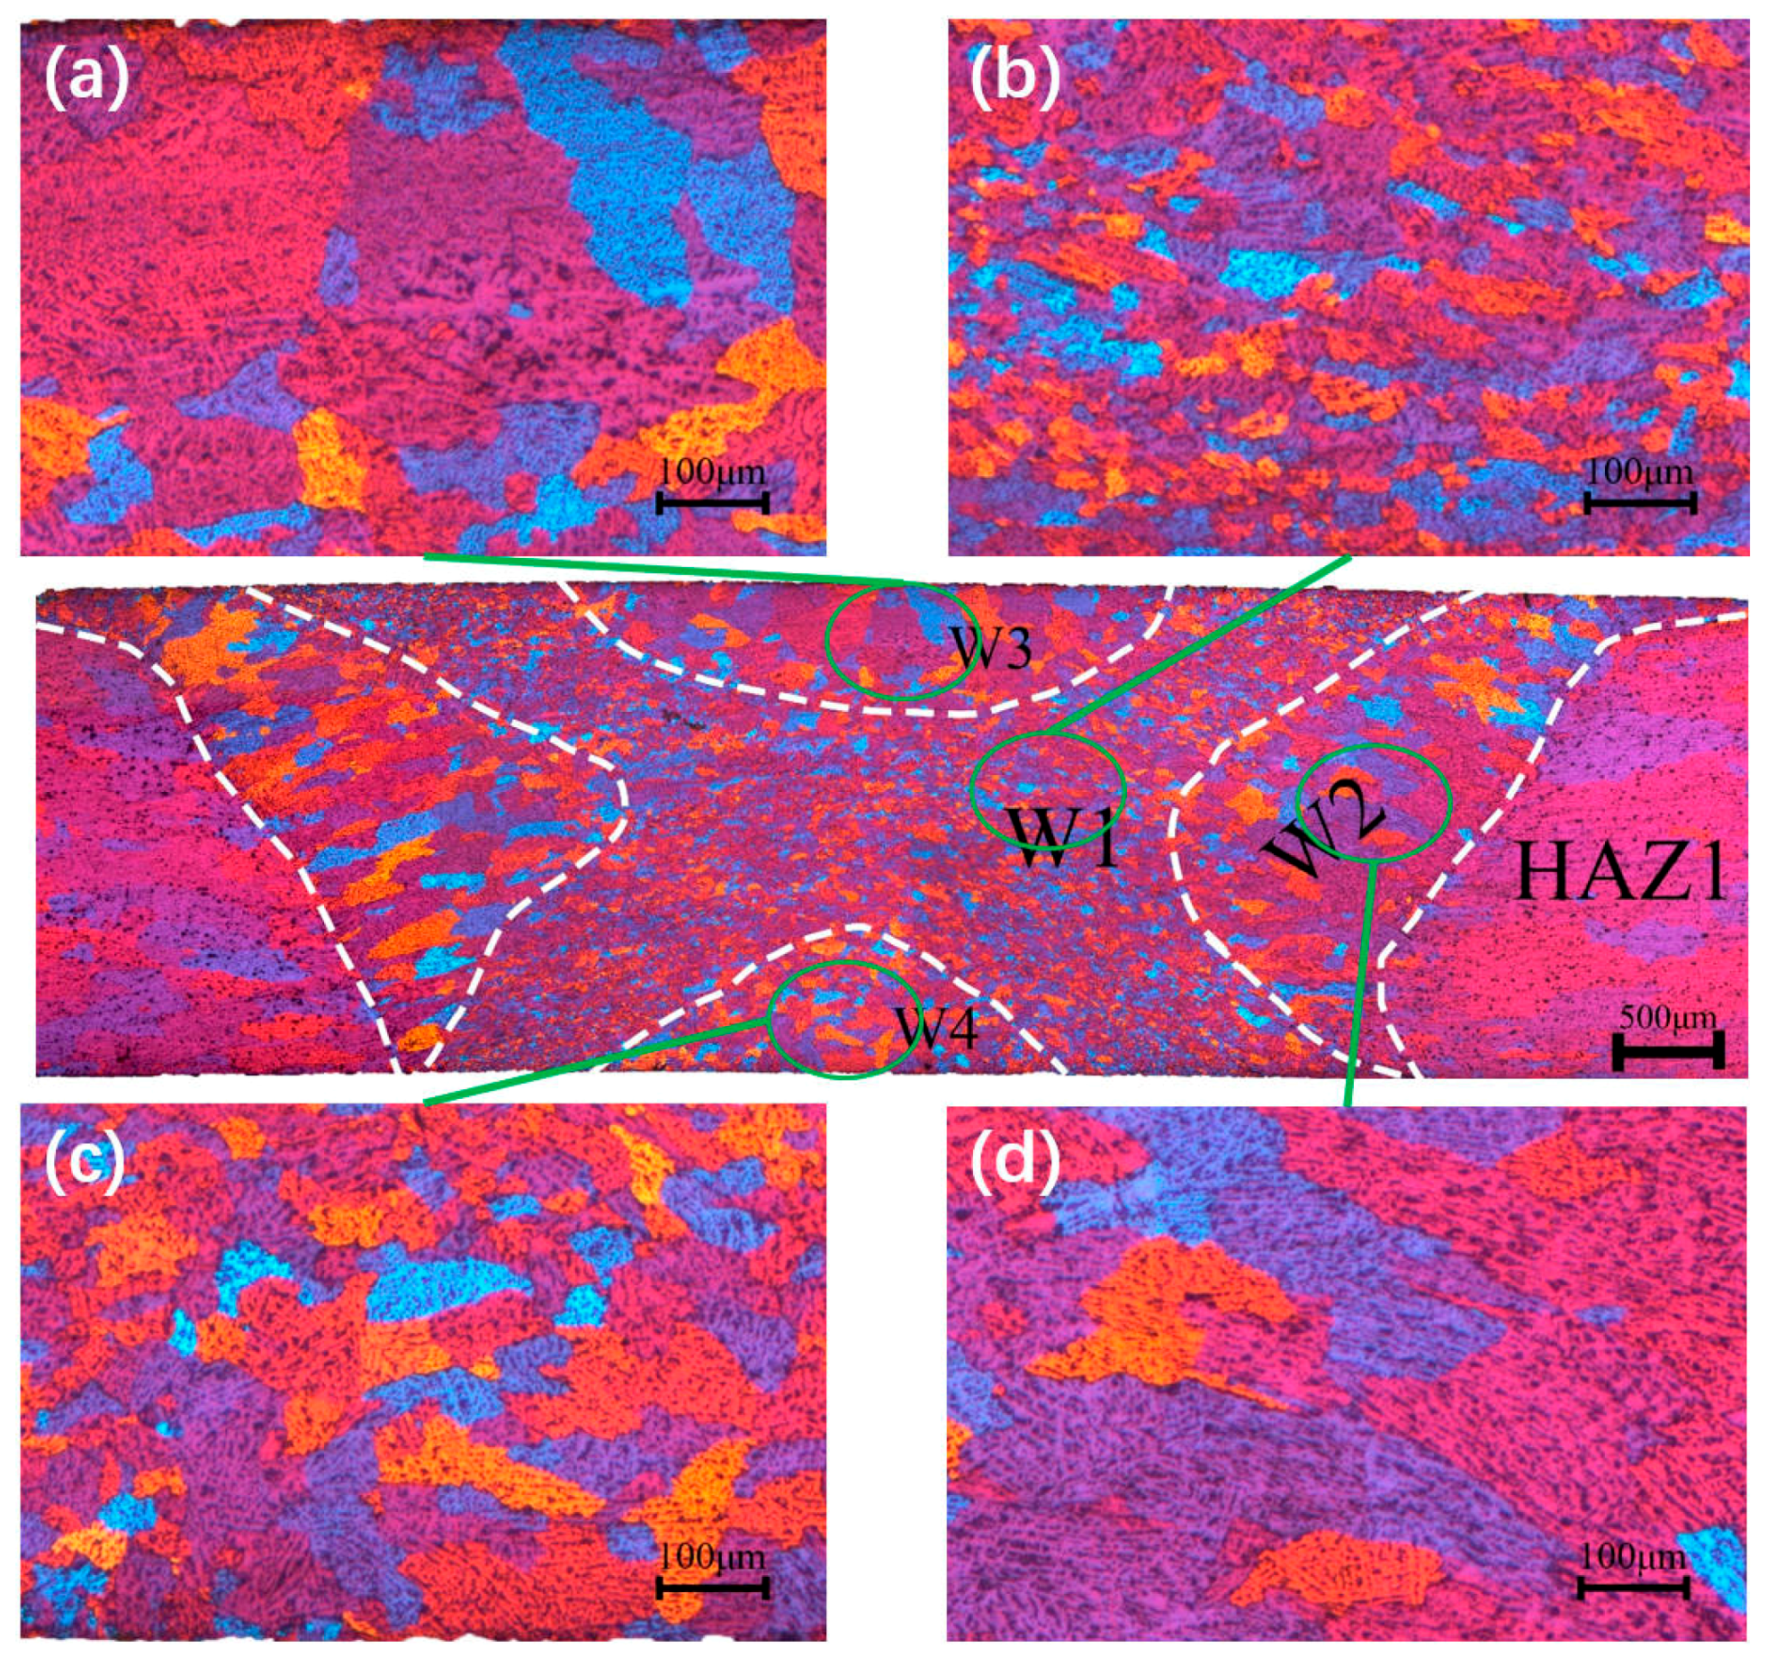
Figure 7 shows the macro and microstructure of the FZ of the PWCR-SHT joints—various regions within the FZ exhibit distinct grain sizes and morphologies. The W1 region exhibits an X-shaped pattern, with grains transitioning into finer equiaxed grains. In the W3 region, there is an increase in grain size, while in the W4 region, there is a decrease in grain size. Notably, the W3 and W4 regions’ grain morphology has significantly changed compared to the FZ of the AW joints. Conversely, the W2 region maintains its columnar grain morphology but with a noticeable coarsening of columnar grains. The PWCR-SHT process has a pronounced impact on the FZ grain morphology.
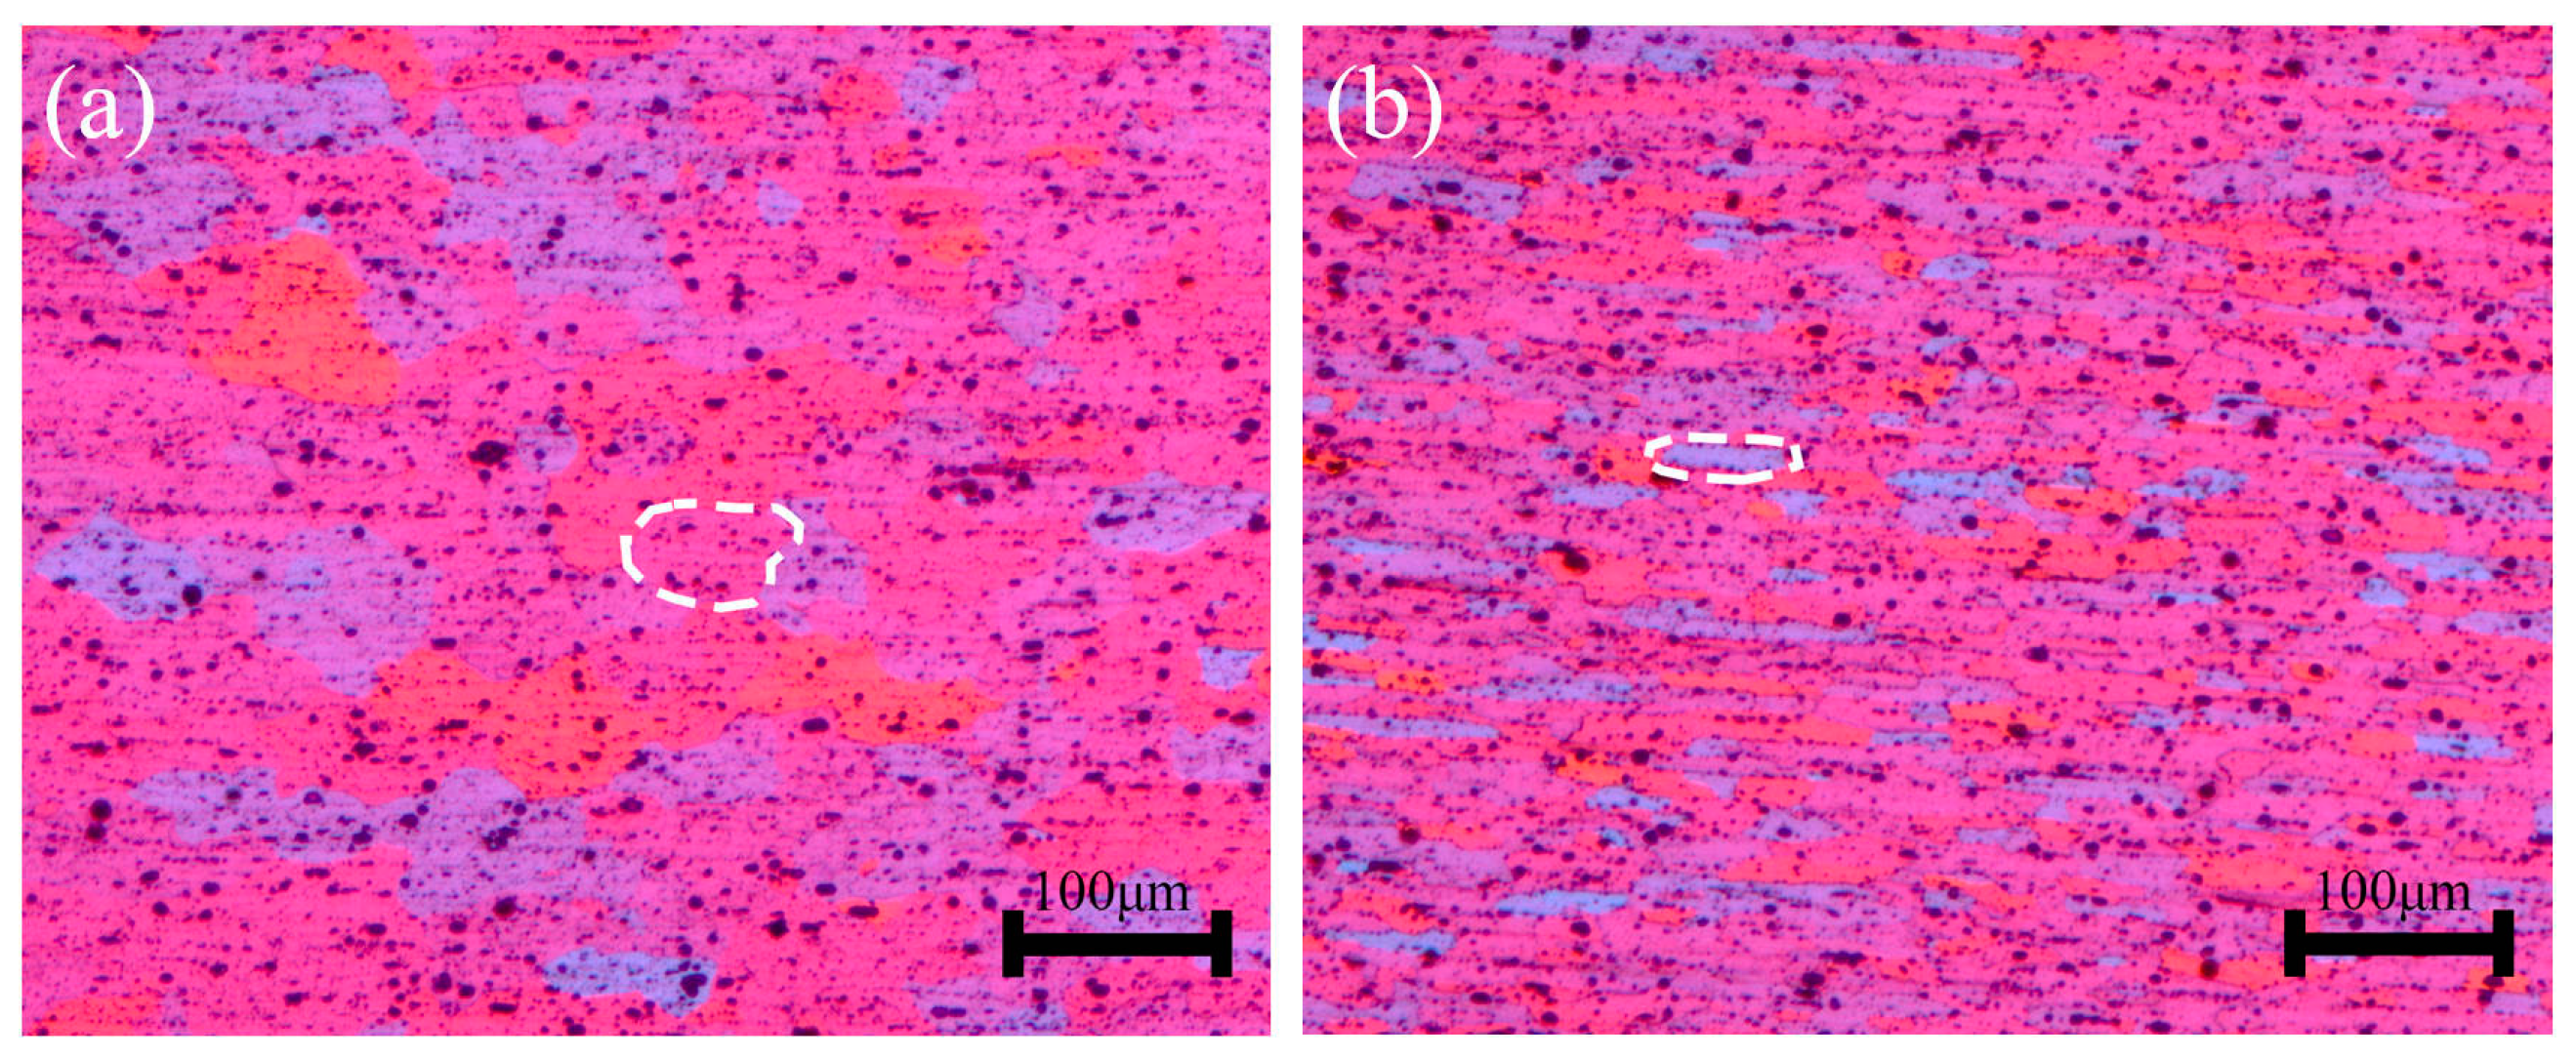
Figure 8a,b show the HAZ microstructure of the PWCR-SHT joints at varying distances from the center of the FZ. Figure 8a represents HAZ1, which is located proximate to the FZ, while Figure 8b represents HAZ2, which is far from the FZ. These two regions exhibit notable differences in both grain size and morphologies. In HAZ1, grain size is substantially increased, accompanied by a transition to equiaxed grains, making it challenging to discern the previously observed rolled fibrous morphology. Conversely, HAZ2 exhibits only a minor alteration in grain size while maintaining the rolled fibrous morphology like the BM. However, HAZ2 grains are more rounded than the BM, and there is some degree of melting at the grain boundaries.

3.2. Hardness Distribution

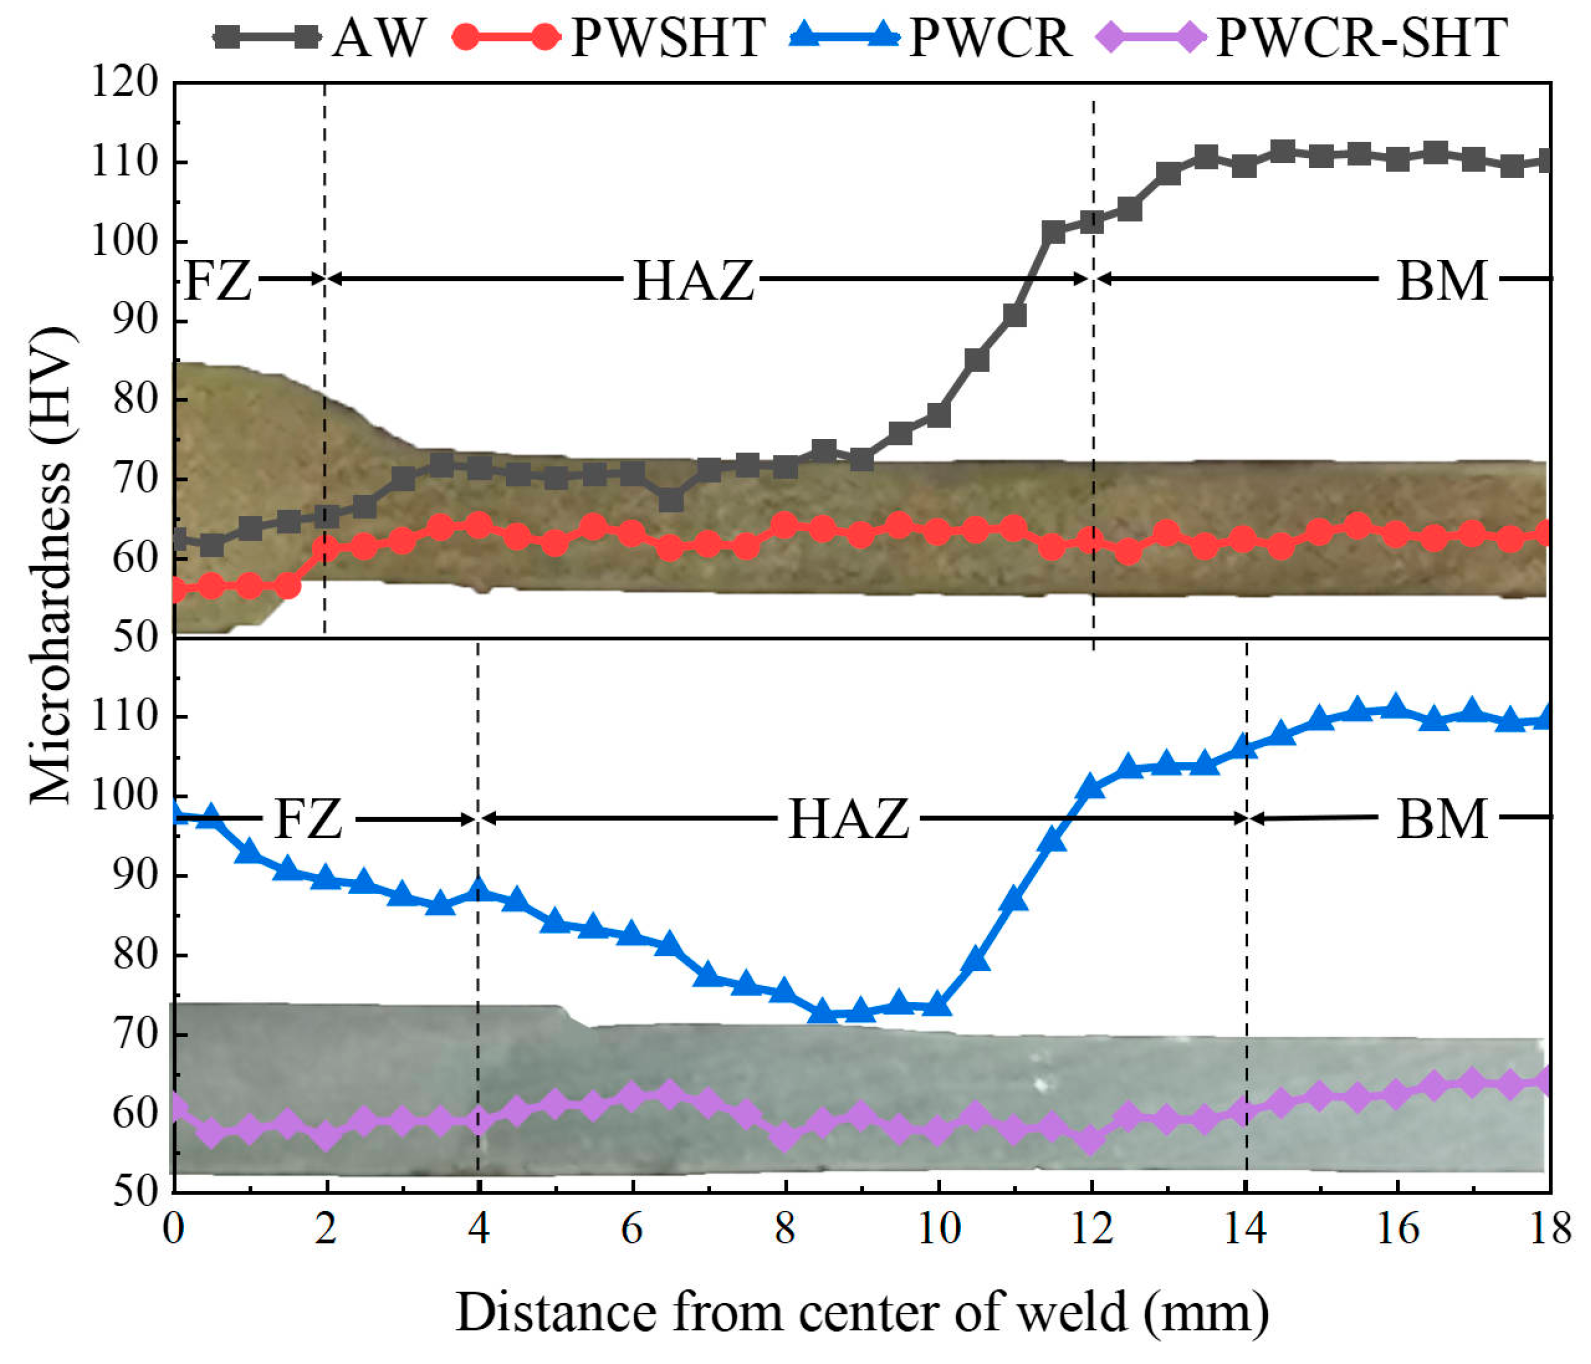
Hardness measurements were conducted on the AW joints, the PWCR joints, the PWSHT joints, and the PWCR-SHT joints, spanning from the FZ center to the BM, as shown in Figure 9. For the AW joints, both the FZ and the HAZ exhibit lower hardness values than the BM, with the most insufficient hardness recorded within the FZ, ranging from 61.7 HV to 65.3 HV. A significant increase in hardness occurs from the FZ to the HAZ, marked by an “inflection point” in the hardness distribution, signifying softening within the HAZ [24]. Subsequently, as the distance from the FZ center increases, hardness gradually approaches that of the BM, resulting in inconsistent mechanical properties across the FZ, the HAZ, and the BM regions. Comparatively, the PWCR joints exhibit a noteworthy enhancement in hardness, with a 42.67% increase in the FZ hardness attributed to the strain-hardening effect induced by the CR. As one moves away from the FZ center, hardness gradually decreases. The softened zone within the HAZ remains the lowest point in the overall joint hardness, followed by a gradual approach to the BM hardness, resulting in uneven mechanical properties. The PWSHT joints, on the other hand, experience a notable reduction in overall hardness. The HAZ exhibits a hardness range of 61.3 HV to 64.2 HV, while the BM demonstrates a range of 60.8 HV to 64.1 HV. Consequently, the mechanical properties of the HAZ and the BM tend to converge, but the FZ maintains the lowest hardness range, ranging from 56 HV to 61.5 HV. In contrast, the PWCR-SHT joints exhibit hardness levels ranging from 56.9 HV to 62.3 HV across the FZ, the HAZ, and the BM, showcasing a more consistent overall mechanical performance within the joints.

3.3. Tensile Performance

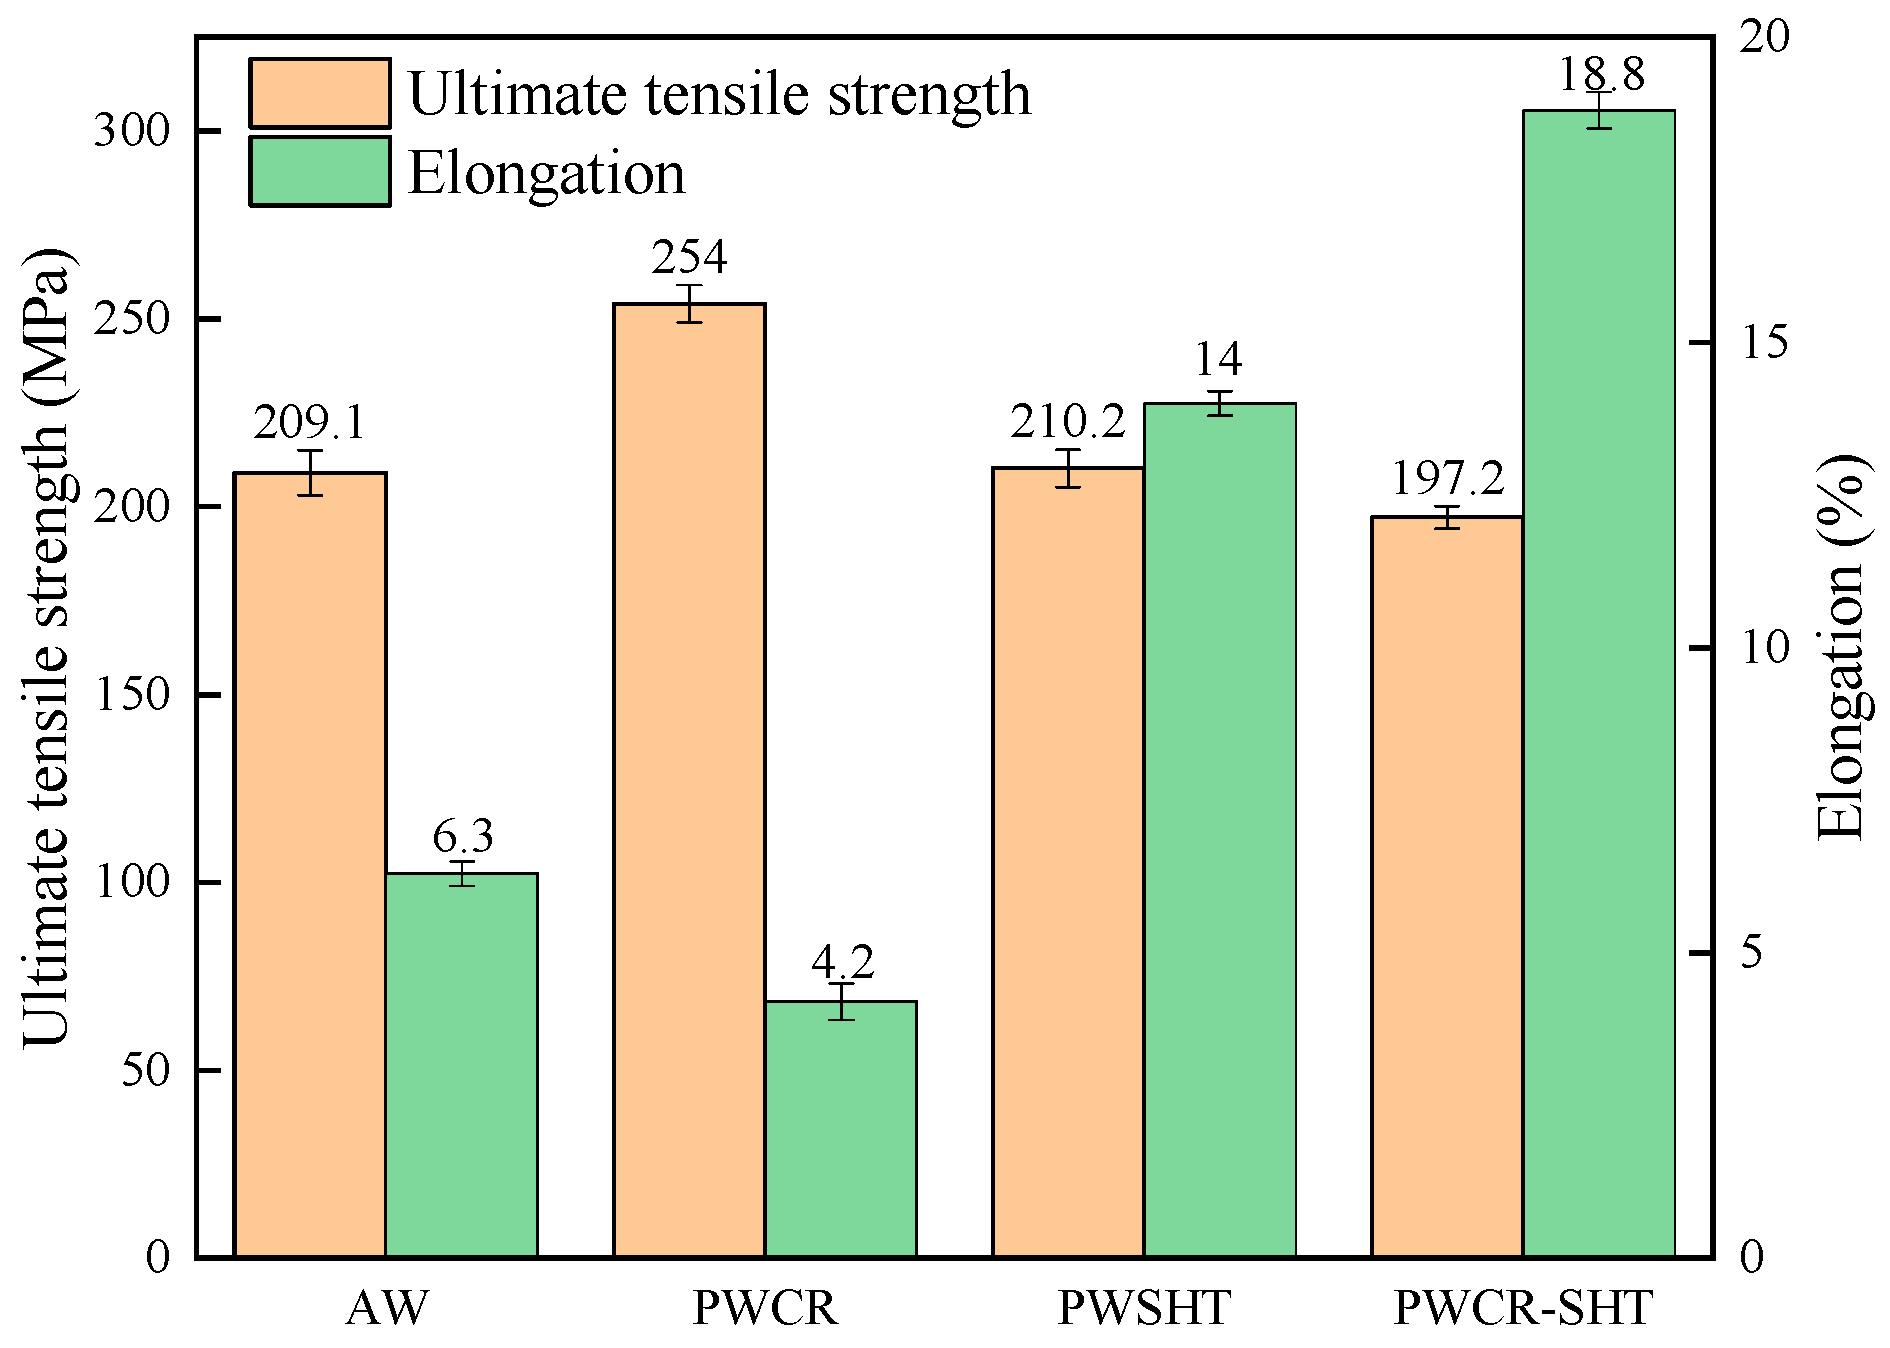
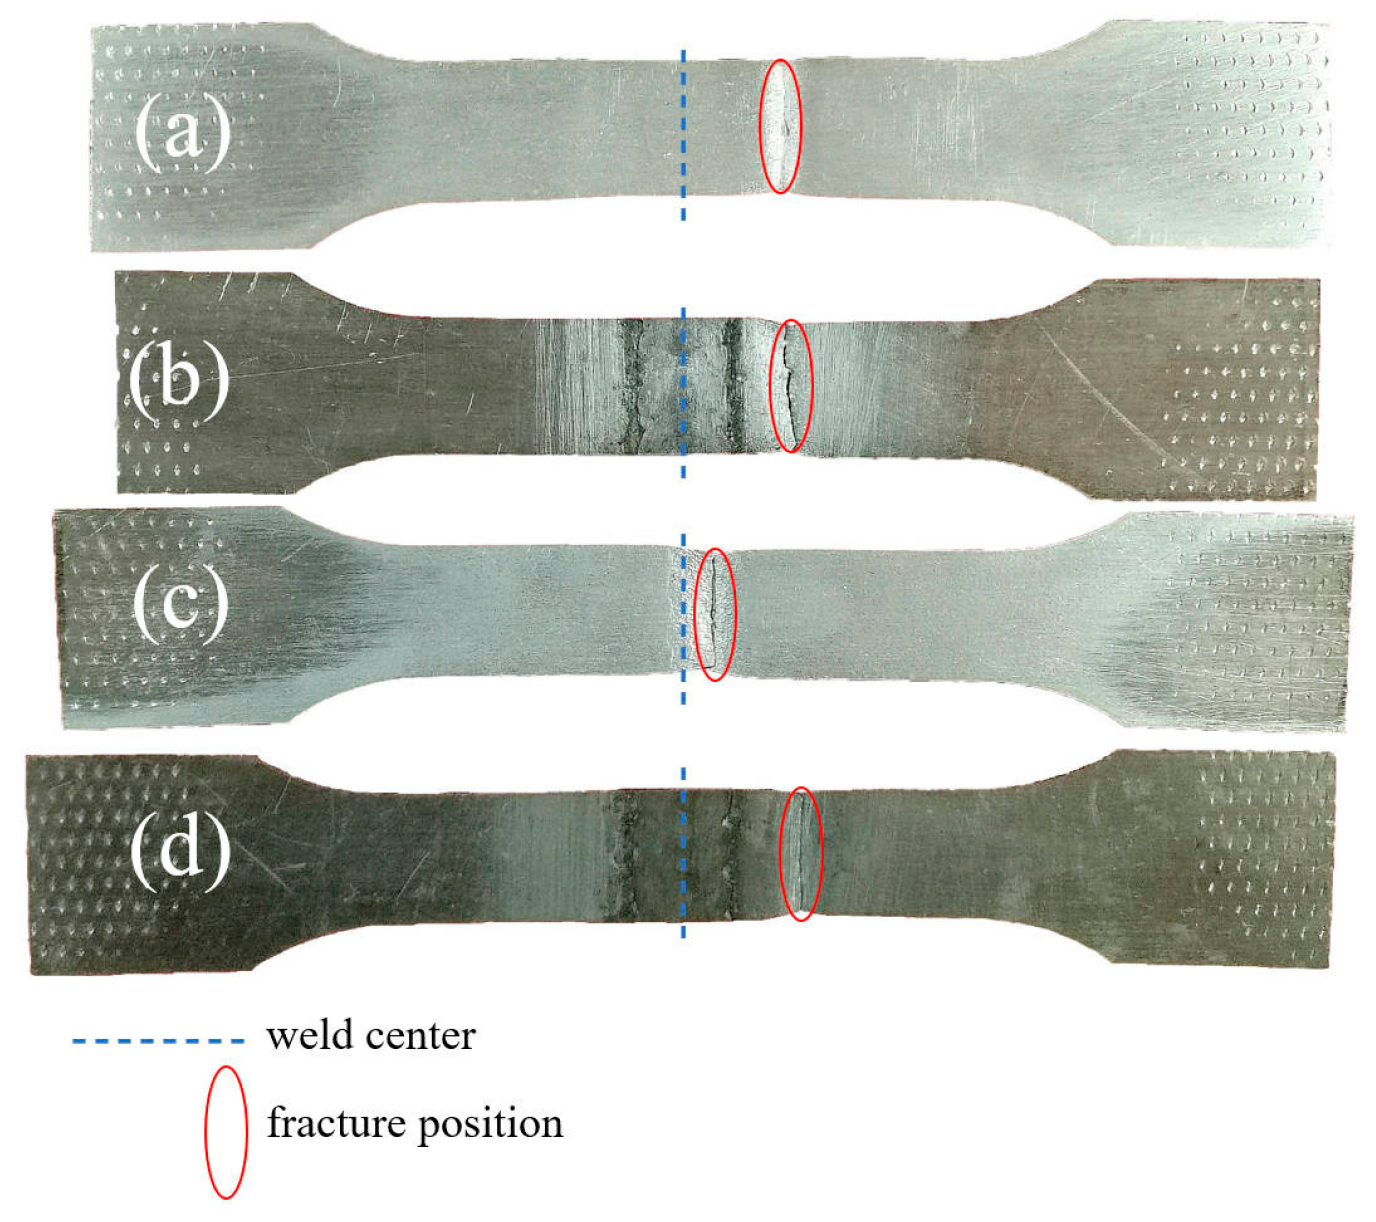
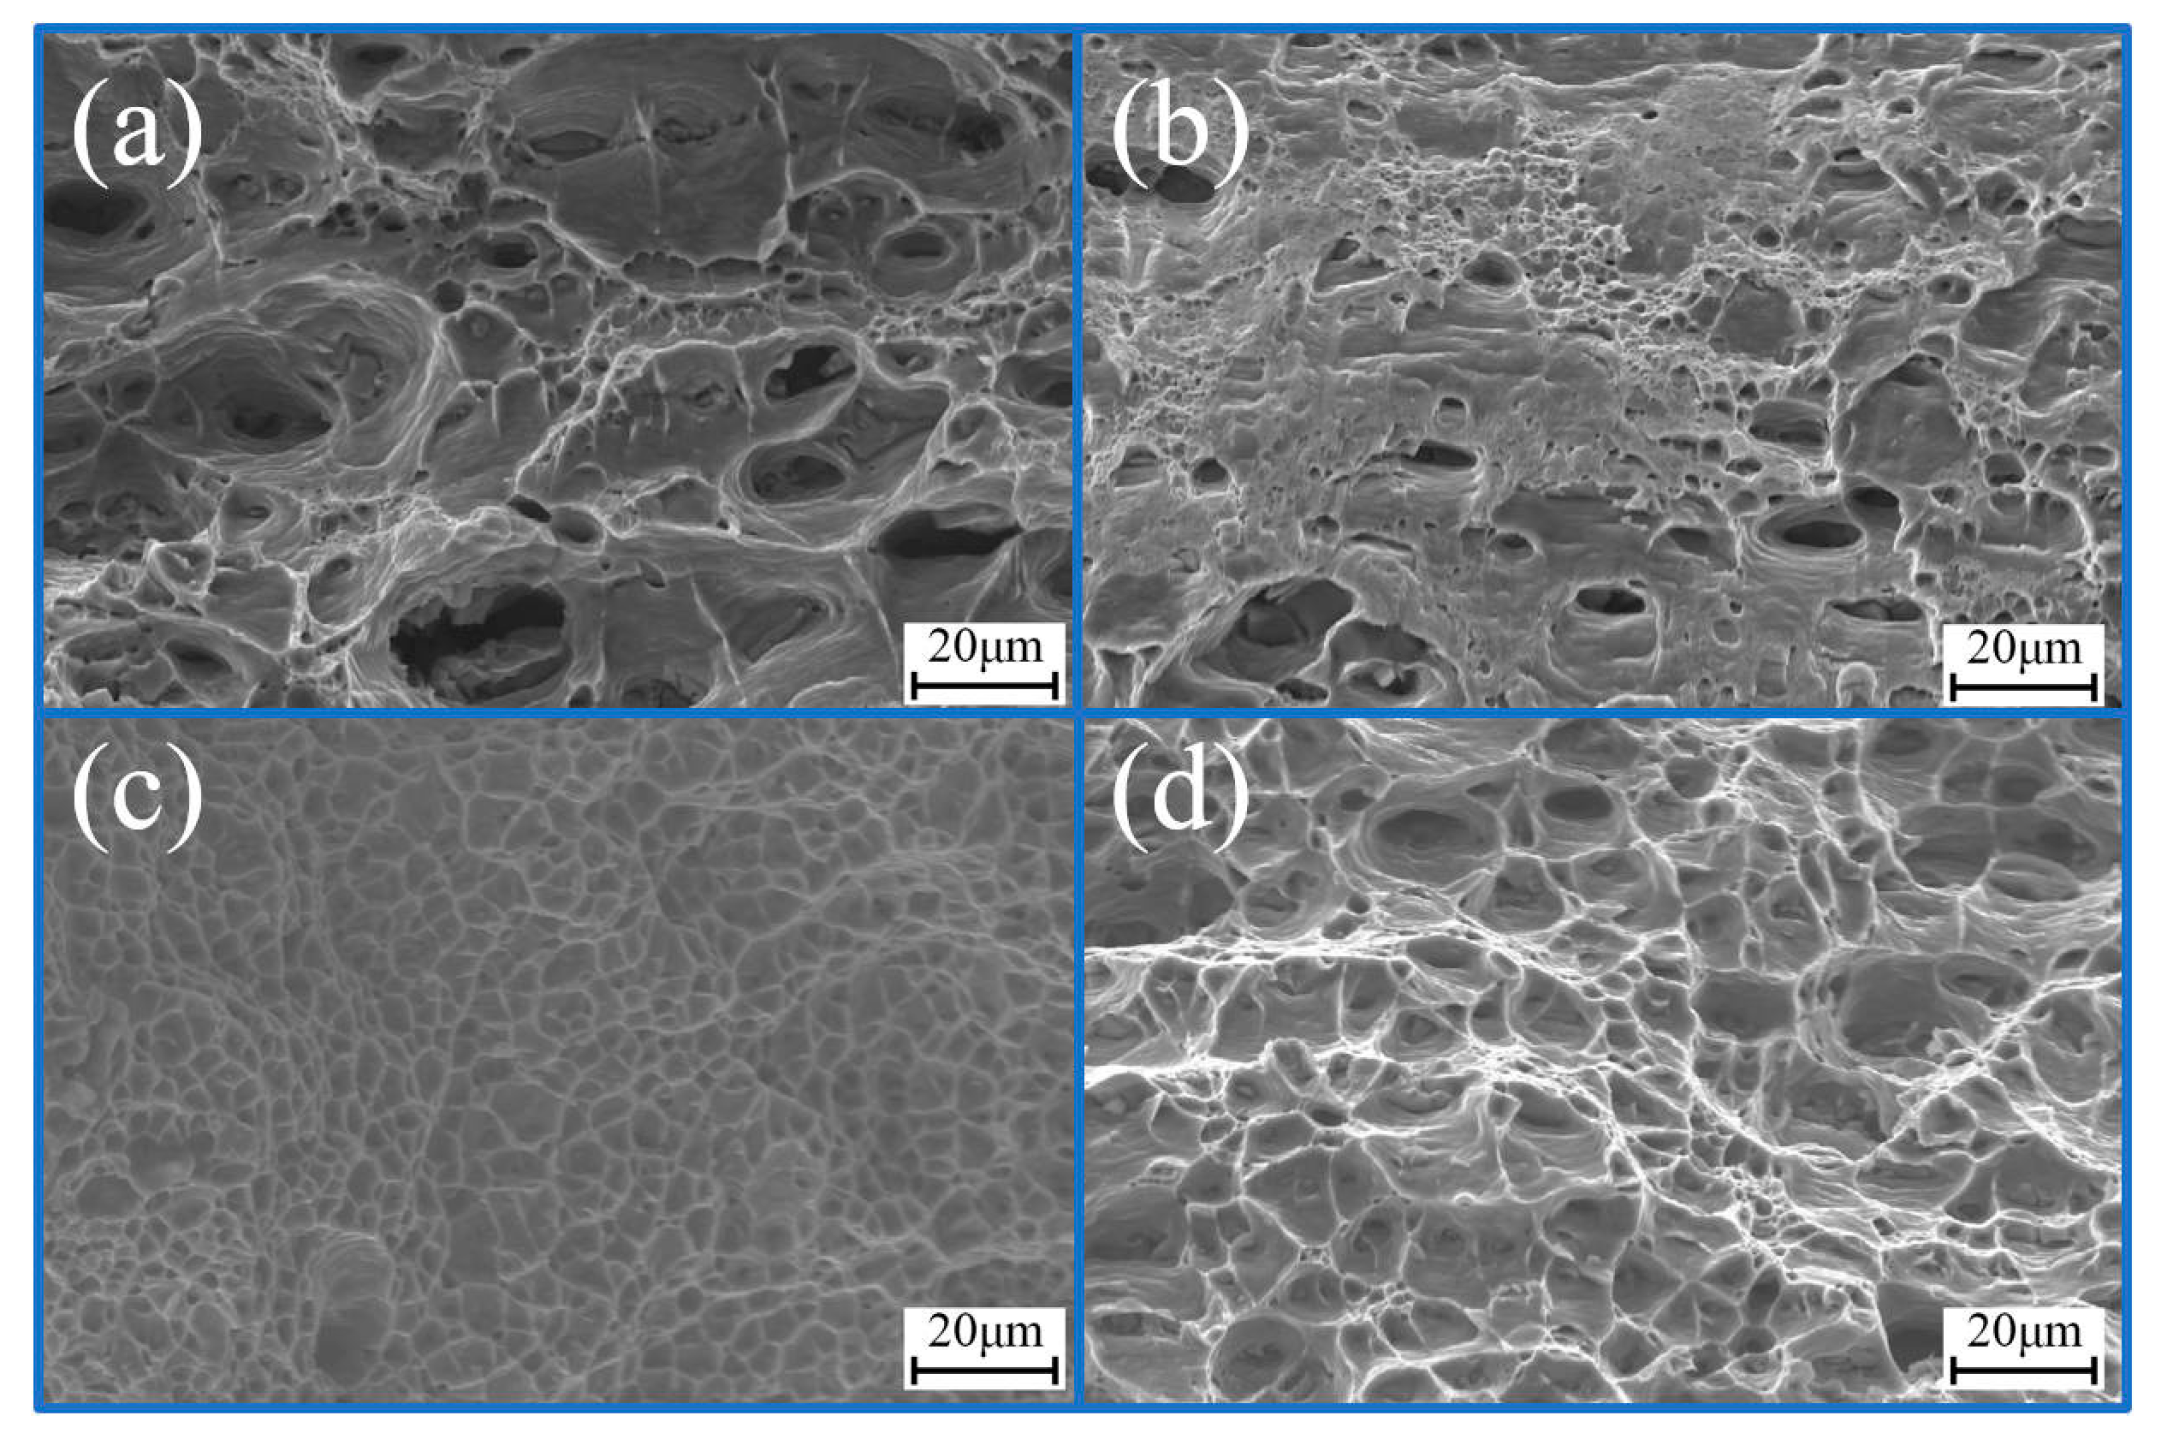
Tensile test results for the AW joints, the PWCR joints, the PWSHT joints, and the PWCR-SHT joints are shown in Figure 10, Figure 11 and Figure 12. The UTS of the AW joints measures 209.1 MPa, which is 61.8% of the BM, with an EL of 6.3%. The fracture location is within the HAZ, a distance from the FZ. This region is characterized as a “softened” zone based on the hardness distribution. The fracture morphology within this “softened” zone, as shown in Figure 12a, exhibits equiaxed dimples of varying sizes with traces resembling “chain waves” inside the dimples. Some dimples contain granular particles and a small amount of smooth surface, indicative of ductile fracture. The UTS of the PWCR joints is 254 MPa, equivalent to 82.4% of the BM and an EL of 4.2%. The increase in tensile strength and decrease in elongation align with the strain-hardening effect induced by the CR. The fracture still occurs within the HAZ softened zone, as shown in Figure 12b. This region exhibits limited small equiaxed dimples, indicating ductile fracture characteristics. However, numerous smooth platform surfaces suggest brittle fracture traits, leading to a judgment of mixed ductile–brittle fracture. For the PWSHT joints, the UTS of 210.2 MPa is achieved, representing 68.2% of the BM and an EL of 14.0%. Consequently, the PWSHT process minimally impacts the tensile strength of the aluminum alloy joints but significantly enhances its ductility. The fracture occurs within the FZ, as shown in Figure 12c, revealing numerous closely spaced equiaxed dimples with consistent sizes. These dimples lack granular particles, indicating simultaneous and uniform growth during stretching, resulting in improved ductility. However, the dimples are smaller and shallower, which correlate with reduced strength. Finally, the PWCR-SHT joints exhibit a UTS of 197.2 MPa, equivalent to 63.9% of the BM, with the highest EL of 18.8%, surpassing the BM. The fracture occurs within the HAZ, as shown in Figure 12d, displaying numerous dimples with minimal particle content. These dimples are distinct and vary in depth, lacking smooth platform surfaces, signifying a ductile fracture. The PWCR-SHT process imparts superior ductility to the joints, surpassing that of the PWSHT joints.

3.4. Forming Performance

In practical manufacturing, thin aluminum alloys are typically subjected to integrated welding, drawing, and bulging to achieve formed parts that meet specific requirements. For the TWBs to be suitable, they must exhibit high ductility within a two-dimensional plane, ensuring a relatively uniform material flow [25]. However, traditional tensile tests only assess material ductility in a one-dimensional direction. The Erichsen cupping test is employed to evaluate the forming performance of the TWBs. Figure 13 shows the force–displacement curves during the cupping test for the BM, the AW TWBs, the PWCR TWBs, the PWSHT TWBs, and the PWCR-SHT TWBs. Additionally, it includes data on cupping depth and forming ratios. Figure 14 shows the surface condition of the TWBs post-cupping test. The peak punch load for the BM measures 20.56 kN, resulting in a cupping depth of 8.1 mm, signifying successful forming. Figure 14e shows the cupping surface of the BM. During the initial stages of the cupping test, substantial friction between the punch’s top and the plate concentrates deformation near the 45° region relative to the punch’s top. The structure and mechanical properties across the BM’s two-dimensional plane are consistent, leading to circular cup surface fractures. The AW TWBs exhibit a significantly lower peak punch load than the BM, along with a forming rate of 91% of the BM; due to the structural and performance discrepancies between the FZ, the HAZ, and the BM, the AW TWBs experience reduced forming performance. Figure 14a displays the cupping surface of AW TWBs, with cracks perpendicular to the FZ surface near the top of the punch at 45°. The PWCR TWBs exhibit the lowest peak punch load among all the TWBs, with a forming rate of 73% for the AW TWBs and only 66% for the BM. The CR induces strain-hardening behavior in the FZ and parts of the HAZ, limiting further deformation; strain-hardening predominantly occurs in the centerline area of the TWBs. Consequently, the deformation degree in this central area differs from other regions, ultimately reducing the TWBs’ formability. Figure 14b shows the cupping surface of the PWCR TWBs, with fracture originating at the weld toe and rapidly extending to the opposite side, consistent with brittle fracture characteristics. The PWSHT TWBs yield a peak punch load of 14.99 kN, comparable to the AW TWBs. The forming rate is 115% for the AW TWBs and 105% for the BM. The PWSHT TWBs exhibit a microstructure similar to the AW TWBs but with more uniform mechanical properties across all areas, improving formability. Figure 14c shows the cupping surface of the PWSHT TWBs, with fracture perpendicular to the welding direction near the punch’s top at 45°. Finally, the PWCR-SHT TWBs attain a peak punch load of 20.47 kN, closely mirroring the BM. The forming rate reaches 119% of the BM, attributed to the recrystallization phenomenon in the FZ, discussed in the subsequent Section 4.1.

4. Discussion

Based on the test results presented above, the PWCR-SHT process effectively enhances the formability of the aluminum alloy TWBs. Formability hinges on the relative consistency of the FZ, the HAZ, and the BM, encompassing both the mechanical properties and the geometric dimensions. Consequently, this paper will delve into the influence mechanism of the PWCR-SHT on the aluminum alloy TWBs formability from these dual perspectives.

4.1. Mechanical Property Consistency

As shown in Figure 9, the PWCR process enables the FZ to achieve higher hardness through strain hardening caused by the CR. According to the formula [26],
σ = αGbρ1/2,
σ is the critical stress required for dislocations to escape from the pinning point and “bow out”; α is a constant; G is the shear modulus; b is the Burgers vector; and ρ is the dislocation density. When external forces deform the weld excess metal, internal dislocations become mobilized and entangled, activating dislocation sources and promoting dislocation propagation, that is, the dislocation density ρ increases. This, in turn, enhances the pinning capability between dislocations, that is, the critical stress σ increases, resulting in a strengthening effect. According to the formula [27],
H = CρGb2Vr,
H is strain storage energy (SE); C is a material parameter; and Vr is the molar volume.
The high-density dislocations induced by the CR are transformed into a high SE. In the subsequent PWCR-SHT process, the SHT temperature is set at 520 °C, which exceeds the critical recrystallization temperature. SE serves as the driving force for recrystallization. When SE surpasses the critical SE threshold, it triggers static recrystallization (SRX) behavior. With a greater SE and a smaller initial grain size, the resulting recrystallization size becomes smaller.
For example, as shown in Figure 7, the W1 region of the FZ experiences a higher rolling force, resulting in a higher SE. The original grains in this region are equiaxed and smaller, leading to smaller recrystallized grains than the original ones. In the W3 region, the rolling force is lower, resulting in a lower SE. Despite the smaller original grain size, the extended SHT duration leads to larger recrystallized grains than the original ones. In the W2 region, the original grains are larger columnar grains, and the rolling force is more evenly distributed, resulting in a smaller SE. Consequently, the recrystallized grain size in the W2 region is larger, retaining some of the original grain morphology. When SE falls within the critical SE range, recrystallization does not occur, and the original grains grow directly. For example, as shown in Figure 8a, for HAZ1, this area experiences only lateral extrusion force from the FZ, resulting in a relatively small SE. The original grains coalesce and grow above the recrystallization temperature, and the newly formed grains do not retain the original grain shape. When SE is smaller than the critical SE range, there is no significant change in the original grains, as shown in Figure 8a for HAZ2.
During the welding process, the gas trapped within the molten pool cannot be promptly released, resulting in the formation of macroscopic pores within the FZ. The subsequent CR process is crucial in eliminating these pores by extruding and reshaping the FZ. In the solidification phase of the molten pool, microcracks often develop at the grain boundaries. However, the recrystallization process leads to the regeneration of new grains based on the original ones, effectively eliminating these grain boundary microcracks [28]. Hence, the PWCR-SHT process offers a dual benefit by concurrently addressing macroscopic defects (pores) and microscopic defects (microcracks) within the FZ. Throughout the part’s loading cycle, pores and microcracks can act as potential sources of cracks. Therefore, the PWCR-SHT process enhances its overall ductility by delaying the occurrence of the FZ cracks.
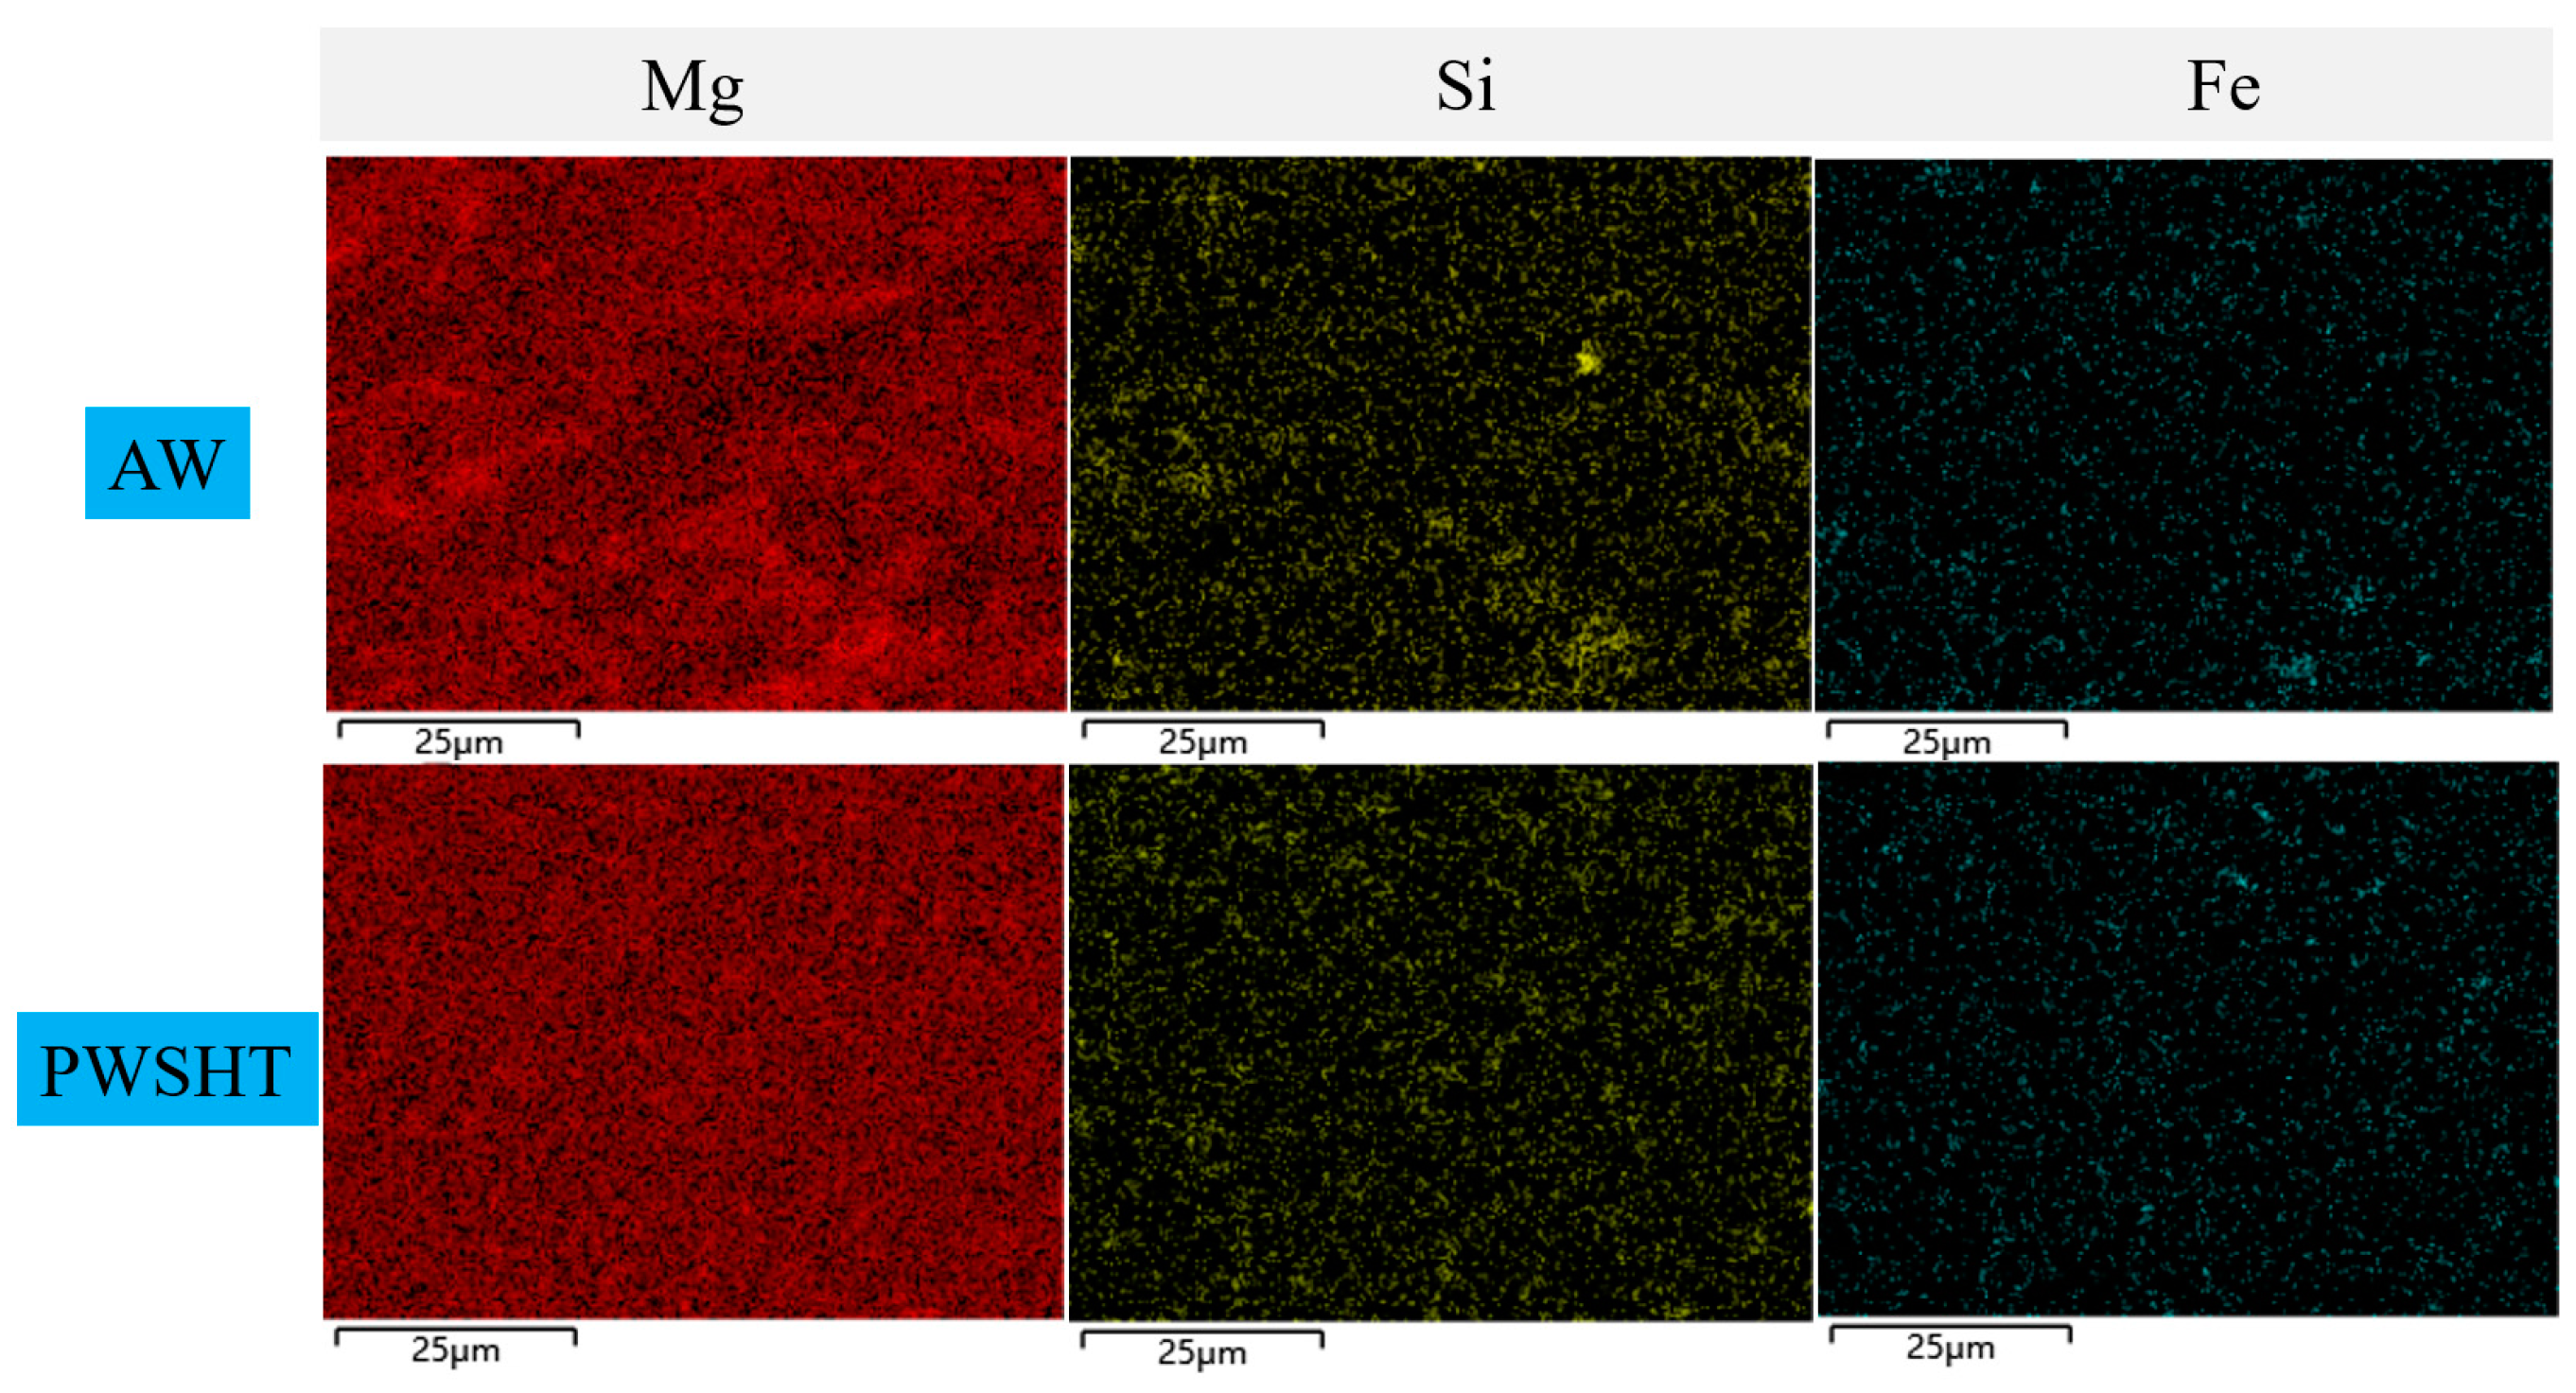
The PWSHT and the PWCR-SHT process exhibit similarities in changes in the composition and content of precipitated phases. Therefore, an investigation was conducted into the impact of the precipitated phases resulting from the PWSHT process on the mechanical properties within the FZ and the HAZ. Figure 15 shows the distribution of Mg, Si, and Fe elements within the FZ using the backscattering mode in the SEM. The upper part displays the element distribution in the FZ of the AW joints. The surface scan element diagrams for Mg and Si reveal an even distribution for most Mg and Si solute atoms. Some aggregation of Mg and Si solute atoms indicates the formation of a significant amount of Al-Mg eutectic compounds and a smaller quantity of Mg-Si precipitated phases. The lower part displays the FZ element distribution in the PWSHT joints. In this case, Mg and Si solute atoms are uniformly distributed with reduced element aggregation. Following an extended period of the SHT, most Mg and Si atoms dissolve into the Al SSSS and subsequently precipitate in clusters and the Gunier–Preston zone [29]. The type and quantity of the Mg-Si precipitated phase significantly impact the FZ strength [30]. Since the FZ filler metal mainly consists of Al and Mg elements, the Mg-Si precipitated phase content in the FZ is relatively tiny. As a result, the difference in mechanical properties is minimal, as shown in Figure 9. Regarding the Fe element, the surface scan element diagram on the right side of this figure indicates that the Fe content within the FZ is significantly lower than that of Mg and Si elements.
Figure 16 shows the SEM images of the HAZ softening zone. Point analysis revealed that the white region corresponds to the Al-Fe-Si precipitated phase, while the black region represents the Mg-Si precipitated phase [31]. Figure 16a displays the SEM image of the AW joints. There is a considerable presence of massive Al-Fe-Si phases and point-like or flake-like Mg-Si phases distributed on the surface of the α-Al matrix. Among these, the point-like or flake-like precipitated phase exhibits a Mg:Si ratio ranging between 6:5 and 2:1. Based on the existing literature [32], the precipitate phase consists of a small quantity of unstable β′ and a significant amount of stable β phases. These over-aging precipitate phases contribute to the HAZ softening, reducing mechanical properties in the joints. Figure 16b presents the SEM image of the PWSHT joints. The presence of black precipitated phases has notably decreased, indicating that the SHT has caused some of the Mg-Si precipitated phase to dissolve in the SSSS. The remaining precipitated phase is primarily identified as having a ratio close to between 5:6 and 6:5, corresponding to the unstable β′′ phase [33] and β′ phase. The ratio and content of the Al-Fe-Si precipitated phase remain largely unchanged, signifying that the SHT has minimal impact on the Al-Fe-Si precipitated phase. The SHT generally leads to re-solubilizing a significant portion of precipitated phases into α-Al. This reduces the precipitation–strengthening effect and lowers the likelihood of crack nucleation [34]. Consequently, the SHT enhances the HAZ’s ductility, as shown in Figure 10.
In summary, the PWCR-SHT process leverages recrystallization behavior to enhance the ductility of the FZ and improves the HAZ ductility by reducing the content of precipitated phases. The hardness levels in the two regions, as shown in Figure 9, tend to align. Therefore, the PWCR-SHT process promotes greater uniformity in the mechanical properties of the FZ and the HAZ.

4.2. Geometric Dimension Consistency

The consistency of the geometric dimensions of the TWBs serves as a criterion for assessing their forming performance. Hao conducted numerical simulations and experimental verifications involving pre-deformation rolling (PDR) on the TWBs before deep drawing, effectively enhancing the uniformity of wall thickness in the TWBs post-deep drawing [35]. The AW TWBs exhibit weld excess metals on their upper and lower surfaces, leading to sudden changes in the dimension of the FZ and the BM cross-section thickness direction, thereby impacting the formability of the TWBs. Consequently, the Erichsen cupping test was conducted on the TWBs with retained weld excess metals, and their performance was compared with that of the TWBs without excess metal. Simultaneously, ABAQUS finite analysis was carried out on the TWBs models both with and without excess metal, utilizing the coupling Euler–Lagrangian method (CEL) to simulate the surface stress distribution of the TWBs during the cupping process. Relevant parameters for the BM and the FZ materials were provided in the literature [36]. Model plate thickness and the FZ size are consistent with actual dimensions, along with an outer diameter matching the inner diameter of the upper half of the die and employing encastre conditions; the punch model size corresponds to actual dimensions, defined as a rigid body. For a more intuitive analysis of the impact of weld excess metal on stress distribution during the TWBs forming, the model was simplified, neglecting thermal stresses generated during welding and aligning relevant parameters of the HAZ and the BM materials.
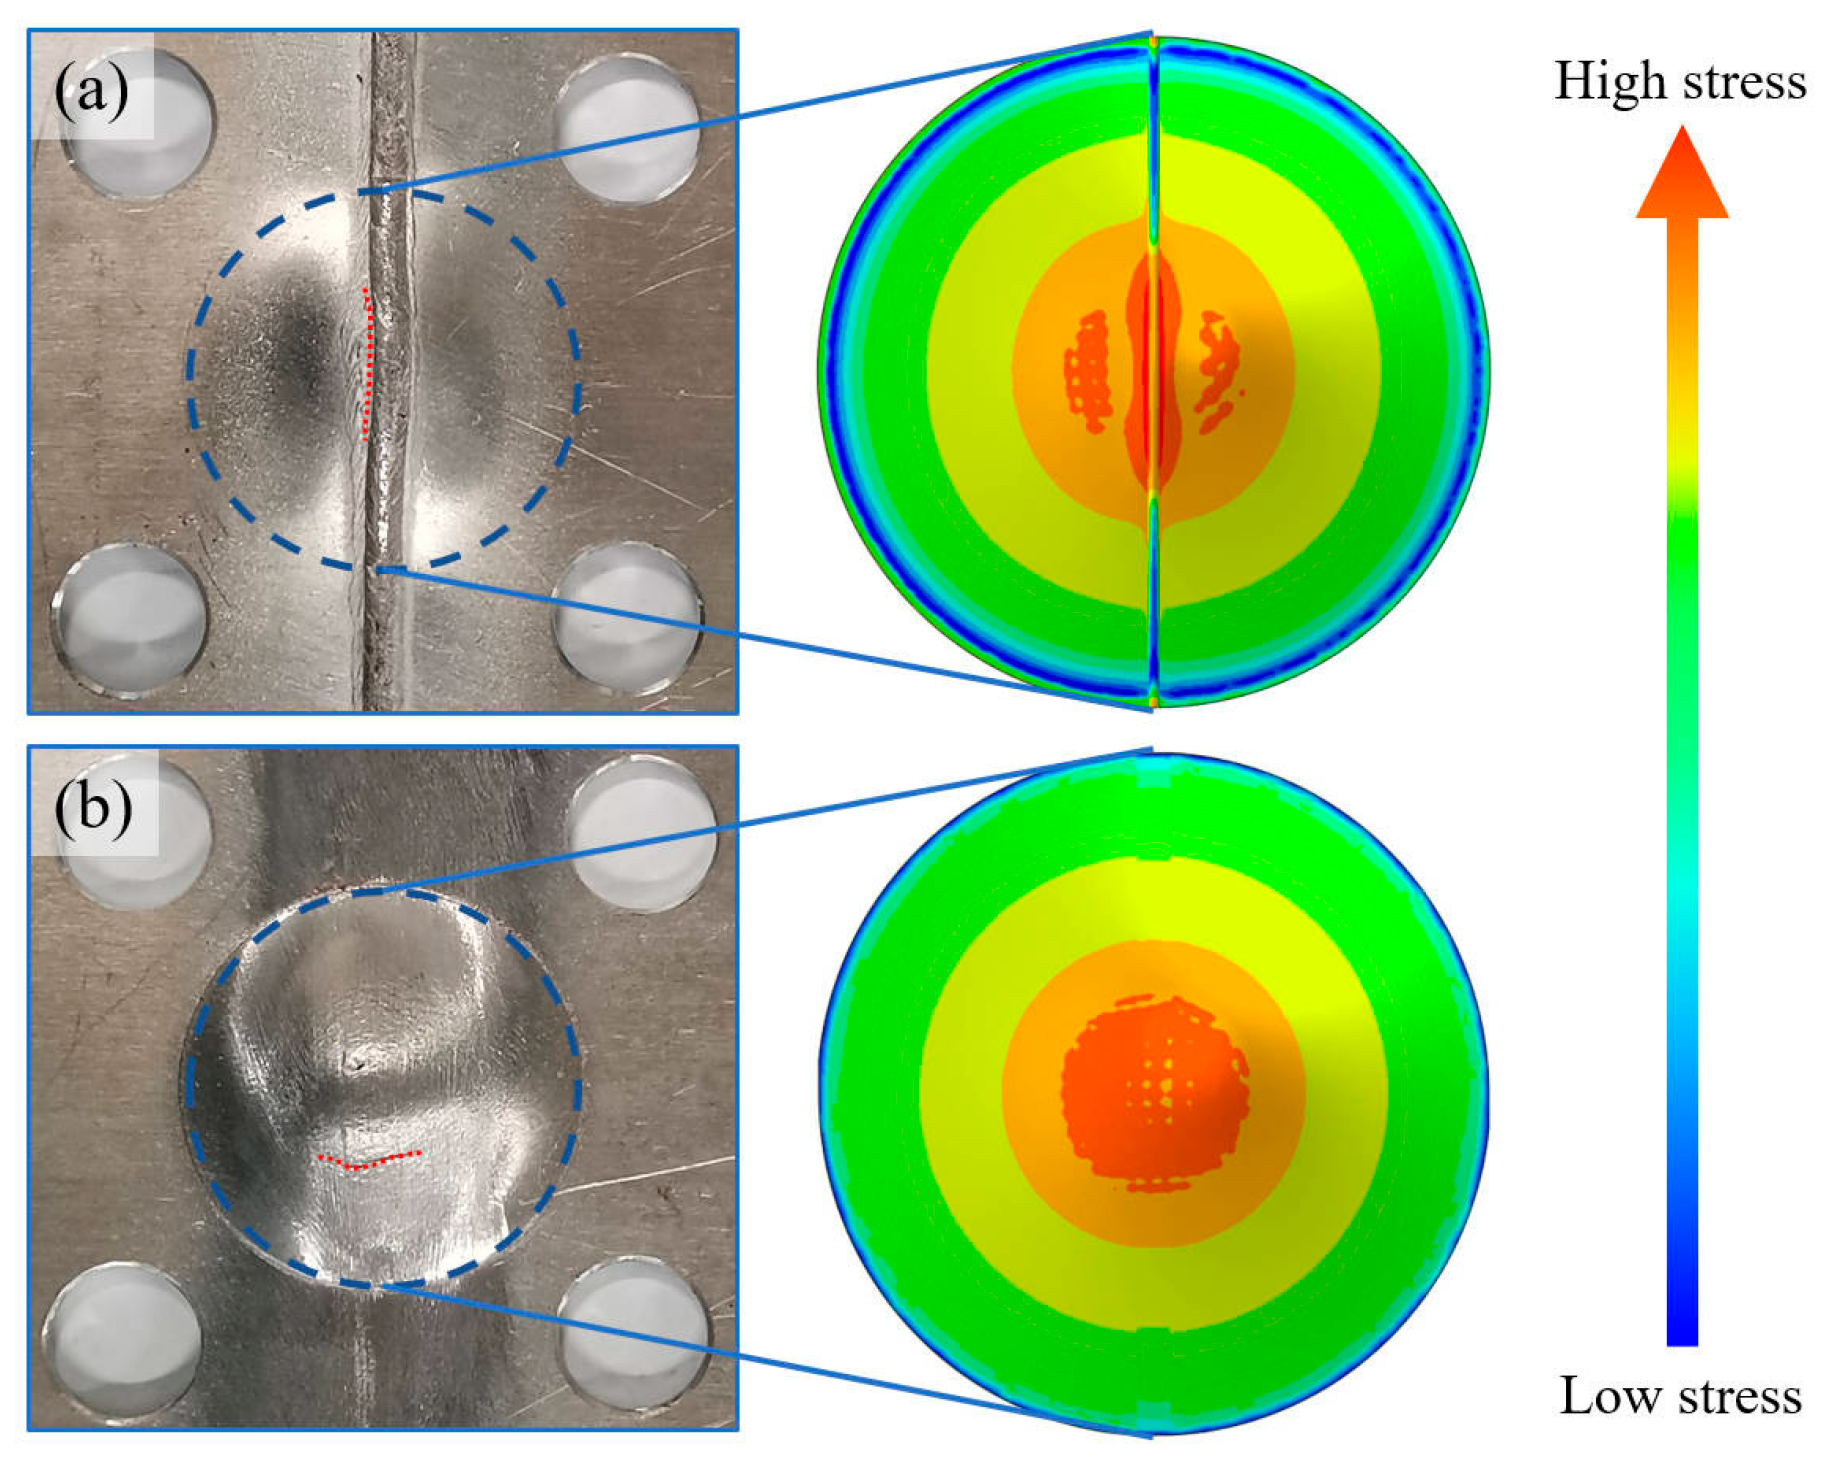
Figure 17a shows the surface after the cupping test of the AW TWBs with retained excess metal. The rupture position is at the weld toe and runs parallel to the welding direction. The corresponding figure on the right illustrates the simulation results of the surface stress state, with the highest stress concentration centered at the weld toe. Figure 17b shows the surface after the cupping test of the AW TWBs without excess metal. The corresponding figure on the right shows that the highest stress is uniformly distributed across the central area of the TWBs. When both the TWBs reach the same forming depth, the uniformly distributed stress is lower than the stress concentrated at the weld toe.
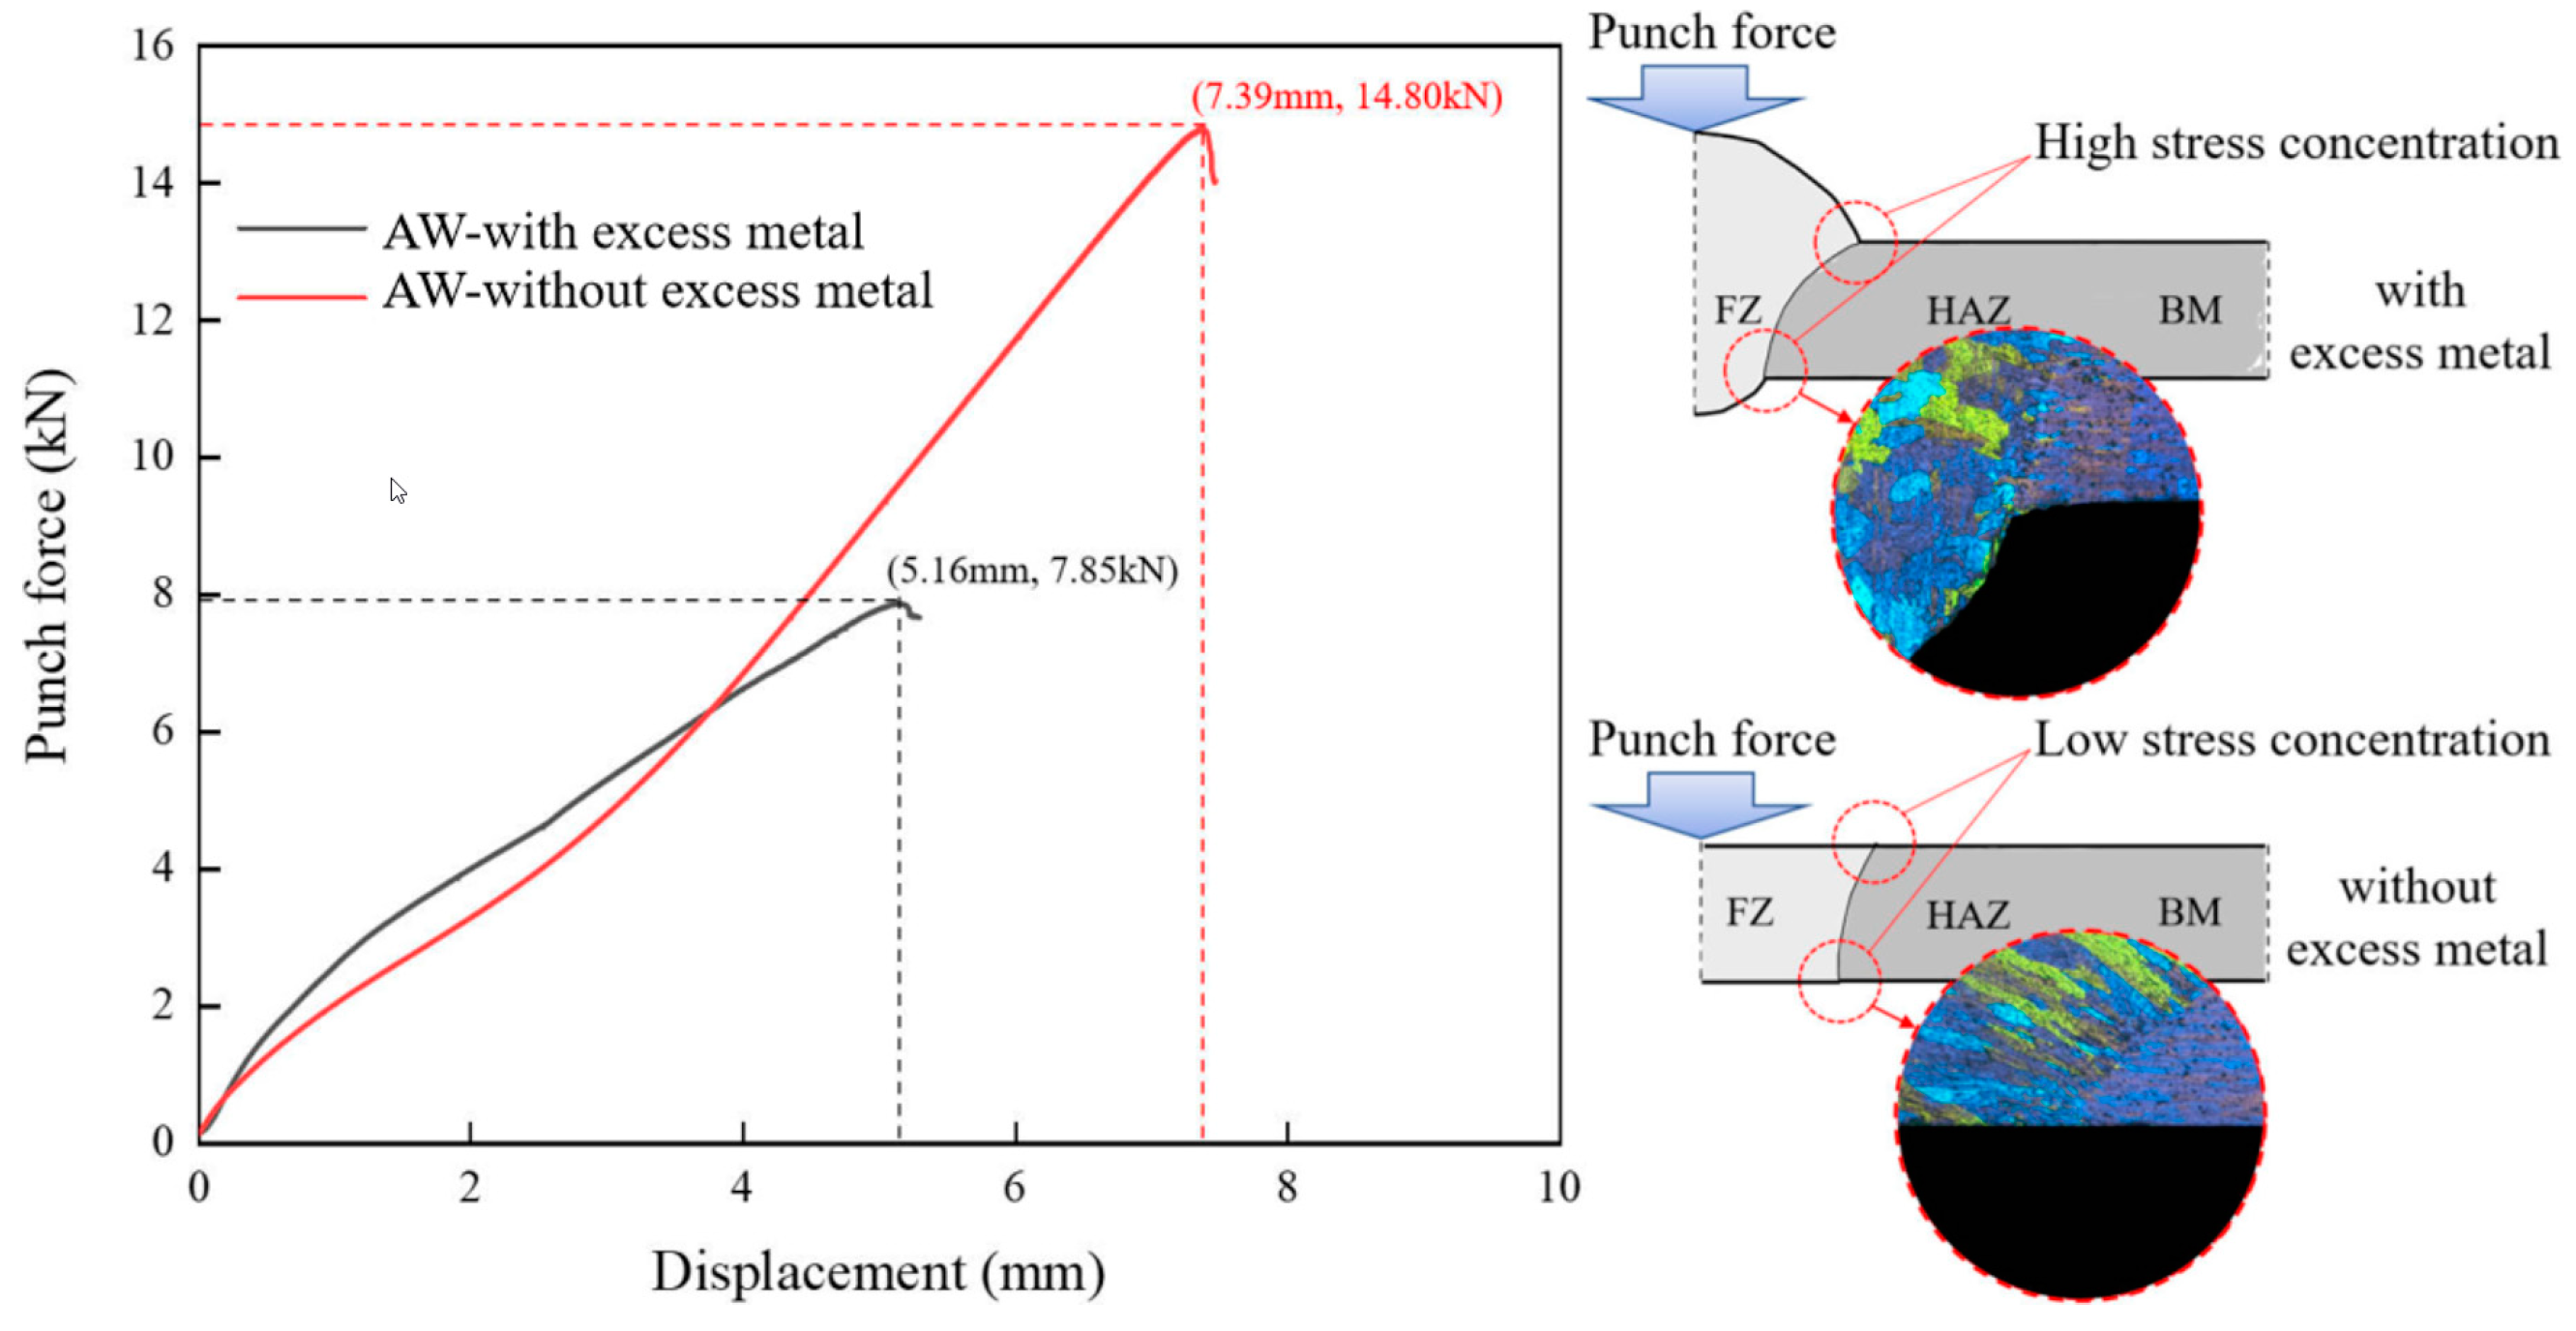
Figure 18 shows the force–displacement curves of the AW TWBs with and without excess metal and the stress concentration locations at the cross-section. The TWBs with retained excess metal exhibit an ultimate punch load of 7.85 kN and a cupping value of 5.16 mm, notably lower than that of the TWBs without excess metal. Compared to the TWBs without excess metal, those with retained excess metal experience advanced stress concentration at the weld toe during the cupping test. This premature stress concentration can result in early cracking and reduce the formability of the TWBs. Therefore, the CR process diminishes the non-uniformity of the cross-sectional geometric dimensions of the FZ and the BM, and the subsequent SHT eliminates the local strain-hardening induced by the CR. Consequently, the PWCR-SHT process enhances the uniformity of mechanical properties and geometric dimensions, facilitating uniform plastic deformation in each area during the force process, thereby improving the formability of the aluminum alloy TWBs.

5. Conclusions

This paper proposes a post-weld composite treatment process (PWCR-SHT) to enhance the formability of the 6061 aluminum alloy TWBs. The specific conclusions are as follows:
(a)
The CR process induces work hardening in the FZ and the HAZ. This leads to inconsistent mechanical properties within aluminum alloy joints. However, the CR process eliminates the DP-MIG weld excess metal and promotes overall geometric uniformity in the aluminum alloy TWBs.
(b)
The PWCR-SHT process enhances the ductility of the joints, and the hardness and tensile strength of the joint are lower than those of the original BM.
(c)
The PWCR-SHT process employs high-density dislocations as the SE, triggering recrystallization behavior in the FZ of the PWCR joints and grain growth in the part of the HAZ.
(d)
The forming rate of the PWCR-SHT TWBs is 119% of the BM, resulting from the combined effects of the geometric dimension and the mechanical property consistency.

6. Limitations and Future Works

The hardness and the tensile strength of aluminum alloy joints subjected to the PWCR-SHT are lower than those with the original BM. Consequently, in future research, an artificial aging (AT) process can be applied to the PWCR-SHT TWBs or formed parts to restore them to having BM-level mechanical properties.

Author Contributions

Conceptualization, X.D. and G.S.; methodology, X.D.; software, X.D.; validation, X.D. and G.S.; investigation, G.S.; writing—original draft preparation, X.D.; writing—review and editing, G.S. and L.L.; supervision, L.L.; funding acquisition, G.S. All authors have read and agreed to the published version of the manuscript.

Funding

This research was funded by the National Natural Science Foundation of China (Grant Number: 52375309).

Institutional Review Board Statement

Not applicable.

Informed Consent Statement

Not applicable.

Data Availability Statement

The raw data supporting the conclusions of this article will be made available by the authors on request.

Acknowledgments

The authors would like to thank the anonymous reviewers and the editor for their constructive comments and suggestions to improve the quality of this paper.

Conflicts of Interest

The authors declare no conflicts of interest.

References

  1. Kim, K.J.; Lee, J.W. Computational evaluation of automotive camber component for light-weight design. Mater. Werkst. 2023, 54, 423–428. [Google Scholar] [CrossRef]
  2. Zhang, X.; Dong, P.; Yang, M.; Ma, J.; He, Y.; Zhang, R.; Li, W. Effects of interphase, CNT waviness and temperature on the Young’s modulus of CNT/metal composites. Compos. Struct. 2023, 320, 117182. [Google Scholar] [CrossRef]
  3. Suvorov, V.; Vasilyev, R.; Melnikov, B.; Kuznetsov, I.; Bahrami, M.R. Weight Reduction of a Ship Crane Truss Structure Made of Composites. Appl. Sci. 2023, 13, 8916. [Google Scholar] [CrossRef]
  4. Burnett, M.; Kahlmeyer, M.; Koch, C.; Winkel, A.; Böhm, S. Potential of adhesive bonding technology for joining thermo-mechanically modified wood composites in automotive application. Proc. Inst. Mech. Eng. Part D J. Automob. Eng. 2023, 237, 2999–3006. [Google Scholar] [CrossRef]
  5. Chen, C.; Ouyang, X. Research on the joining of three-layer sheets by flat bottom riveting process. Int. J. Adv. Manuf. Tech. 2023, 127, 459–469. [Google Scholar] [CrossRef]
  6. Luo, S.; Yang, G.; Lou, Y.; Xu, Y. Prediction of strain path changing effect on forming limits of AA 6111-T4 based on a shear ductile fracture criterion. Metals 2021, 11, 546. [Google Scholar] [CrossRef]
  7. Czerwinski, F. Current trends in automotive lightweighting strategies and materials. Materials 2021, 14, 6631. [Google Scholar] [CrossRef] [PubMed]
  8. Bagheri, B.; Abbasi, M.; Hamzeloo, R. Comparison of different welding methods on mechanical properties and formability behaviors of tailor welded blanks (TWB) made from AA6061 alloys. Proc. Inst. Mech. Eng. Part C J. Mech. Eng. Sci. 2021, 235, 2225–2237. [Google Scholar] [CrossRef]
  9. Parente, M.; Safdarian, R.; Santos, A.D. A study on the formability of aluminum tailor welded blanks produced by friction stir welding. Int. J. Adv. Manuf. Tech. 2016, 83, 2129–2141. [Google Scholar] [CrossRef]
  10. Xu, X.; Liu, Z.; Zhang, B.; Chen, H.; Zhang, J.; Wang, T.; Zhang, K.; Zhang, J.; Huang, P. Effect of Mn content on microstructure and properties of 6000 series aluminum alloy. Appl. Phys. A-Mater 2019, 125, 490. [Google Scholar] [CrossRef]
  11. Lalvani, H.; Mandal, P. Cold forming of Al-5251 and Al-6082 tailored welded blanks manufactured by laser and electron beam welding. J. Manuf. Process. 2021, 68, 1615–1636. [Google Scholar] [CrossRef]
  12. Hu, Y.N.; Wu, S.C.; Chen, L. Review on failure behaviors of fusion welded high-strength Al alloys due to fine equiaxed zone. Eng. Fract. Mech. 2019, 208, 45–71. [Google Scholar] [CrossRef]
  13. Babu, N.B.K.; Davidson, M.J.; Rao, A.N.; Balasubramanian, K.; Govindaraju, M. Effect of differential heat treatment on the formability of aluminium tailor welded blanks. Mater. Des. 2014, 55, 35–42. [Google Scholar] [CrossRef]
  14. Liu, W.; Cheng, W.; Xu, Y.; Yuan, S. Enhancing Formability of AA2219 Aluminum Alloy Friction Stir Welded Blanks with Preheating Treatment. J. Mater. Eng. Perform. 2018, 27, 4819–4828. [Google Scholar] [CrossRef]
  15. Ko, D.H.; Kim, J.H.; Ko, D.C.; Kim, B.M. Improvement of Weldment Properties by Hot Forming Quenching of Friction Stir Welded TWB Sheet. Adv. Mech. Eng. 2014, 6, 257510. [Google Scholar] [CrossRef]
  16. Cheng, J.; Song, G.; Zhang, Z.; Khan, M.S.; Liu, Z.; Liu, L. Improving heat-affected zone softening of aluminum alloys by in-situ cooling and post-weld rolling. J. Mater. Process. Technol. 2022, 306, 117639. [Google Scholar] [CrossRef]
  17. Cheng, J.; Zhang, Z.; Dong, X.; Song, G.; Liu, L. A novel post-weld composite treatment process for improving the mechanical properties of AA 6061-T6 aluminum alloy welded joints. J. Manuf. Process. 2022, 82, 15–22. [Google Scholar] [CrossRef]
  18. Huang, K.; Huang, S.; Yi, Y.; Dong, F.; He, H. Flow behavior and forming characteristics of 2A14 aluminum alloy at cryogenic temperatures. J. Alloys Compd. 2022, 902, 163821. [Google Scholar] [CrossRef]
  19. Köklü, U. Investigation into the formability of Al-1050 tailor-welded blanks with antilock braking system. Int. J. Adv. Manuf. Technol. 2013, 66, 221–229. [Google Scholar] [CrossRef]
  20. Kim, J.H.; Lee, C.J.; Lee, S.B.; Ko, D.C.; Kim, B.M. Integrated hot forming and heat treatment process on Al6061 tailor rolled blank. Int. J. Precis. Eng. Manuf. 2017, 18, 127–132. [Google Scholar] [CrossRef]
  21. Jung, H.; Friedl, K.H.; Hiller, K.A.; Furch, H.; Bernhart, S.; Schmalz, G. Polymerization efficiency of different photocuring units through ceramic discs. Oper. Dent. 2006, 31, 68–77. [Google Scholar] [CrossRef] [PubMed]
  22. Jasiński, C.; Świłło, S.; Kocańda, A. Application of Two Advanced Vision Methods Based on Structural and Surface Analyses to Detect Defects in the Erichsen Cupping Test. Arch. Metall. Mater. 2019, 64, 1041–1049. [Google Scholar] [CrossRef]
  23. Wei, H.L.; Elmer, J.W.; DebRoy, T. Origin of grain orientation during solidification of an aluminum alloy. Acta Mater. 2016, 115, 123–131. [Google Scholar] [CrossRef]
  24. Hadadzadeh, A.; Ghaznavi, M.M.; Kokabi, A.H. HAZ softening behavior of strain-hardened Al-6.7 Mg alloy welded by GMAW and pulsed GMAW processes. Int. J. Adv. Manuf. Technol. 2017, 92, 2255–2265. [Google Scholar] [CrossRef]
  25. Gnibl, T.; Merklein, M. Material flow control in tailor welded blanks by a combination of heat treatment and warm forming. Cirp Ann.-Manuf. Tech. 2016, 65, 305–308. [Google Scholar] [CrossRef]
  26. Wang, S.C.; Zhu, Z.; Starink, M.J. Estimation of dislocation densities in cold rolled Al-Mg-Cu-Mn alloys by combination of yield strength data, EBSD and strength models. J. Microsc. 2005, 217, 174–178. [Google Scholar] [CrossRef]
  27. Hore, S.; Das, S.K.; Banerjee, S.; Mukherjee, S. A multiscale coupled Monte Carlo model to characterize microstructure evolution during hot rolling of Mo-TRIP steel. Acta Mater. 2013, 61, 7251–7259. [Google Scholar] [CrossRef]
  28. Yadav, P.C.; Sharma, N.K.; Sahu, S.; Shekhar, S. Influence of short heat-treatment on microstructural and mechanical inhomogeneity of constrained groove pressed Cu-Zn alloy. Mater. Chem. Phys. 2019, 238, 121912. [Google Scholar] [CrossRef]
  29. Edwards, G.A.; Stiller, K.; Dunlop, G.L.; Couper, M.J. The precipitation sequence in Al–Mg–Si alloys. Acta Mater. 1998, 46, 3893–3904. [Google Scholar] [CrossRef]
  30. Ding, L.; Weng, Y.; Jia, Z.; Zang, R.; Xiang, K.; Liu, Q.; Nagaum, H. Interactive transformation mechanisms of multiple metastable precipitates in a Si-rich Al-Mg-Si alloy. Philos. Mag. 2022, 102, 1602–1627. [Google Scholar] [CrossRef]
  31. Ramaswamy, A.; Malarvizhi, S.; Balasubramanian, V. Influence of post weld heat treatment on tensile properties of cold metal transfer (CMT) arc welded AA6061-T6 aluminium alloy joints. J. Mech. Behav. Mater. 2019, 28, 135–145. [Google Scholar] [CrossRef]
  32. Vissers, R.; van Huis, M.V.; Jansen, J.; Zandbergen, H.W.; Marioara, C.D.; Andersen, S.J. The crystal structure of the β′ phase in Al–Mg–Si alloys. Acta Mater. 2007, 55, 3815–3823. [Google Scholar] [CrossRef]
  33. Andersen, S.J.; Zandbergen, H.W.; Jansen, J.; TrÆholt, C.; Tundal, U.; Reiso, O. The crystal structure of the β″phase in Al–Mg–Si alloys. Acta Mater. 1998, 46, 3283–3298. [Google Scholar] [CrossRef]
  34. Tang, Z.C.; Xu, W.; Zhao, D.Y.; Zhang, B. Improving the strength and SCC resistance of an Al-5Mg-3Zn alloy with low-angle grain boundary structure. J. Mater. Sci. Technol. 2023, 161, 63–73. [Google Scholar] [CrossRef]
  35. Hao, Z.; Luo, J.; Jin, Y.; Meng, D.; Zhang, C. Application of pre-deformation rolling in the welding heat-affected zone of tailor-welded blanks formed by deep-drawing process. J. Manuf. Process. 2020, 51, 151–160. [Google Scholar] [CrossRef]
  36. Bagheri, B.; Sharifi, F.; Abbasi, M.; Abdollahzadeh, A. On the role of input welding parameters on the microstructure and mechanical properties of Al6061-T6 alloy during the friction stir welding: Experimental and numerical investigation. Proc. Inst. Mech. Eng. Part L J. Mater. Des. Appl. 2022, 236, 299–318. [Google Scholar] [CrossRef]
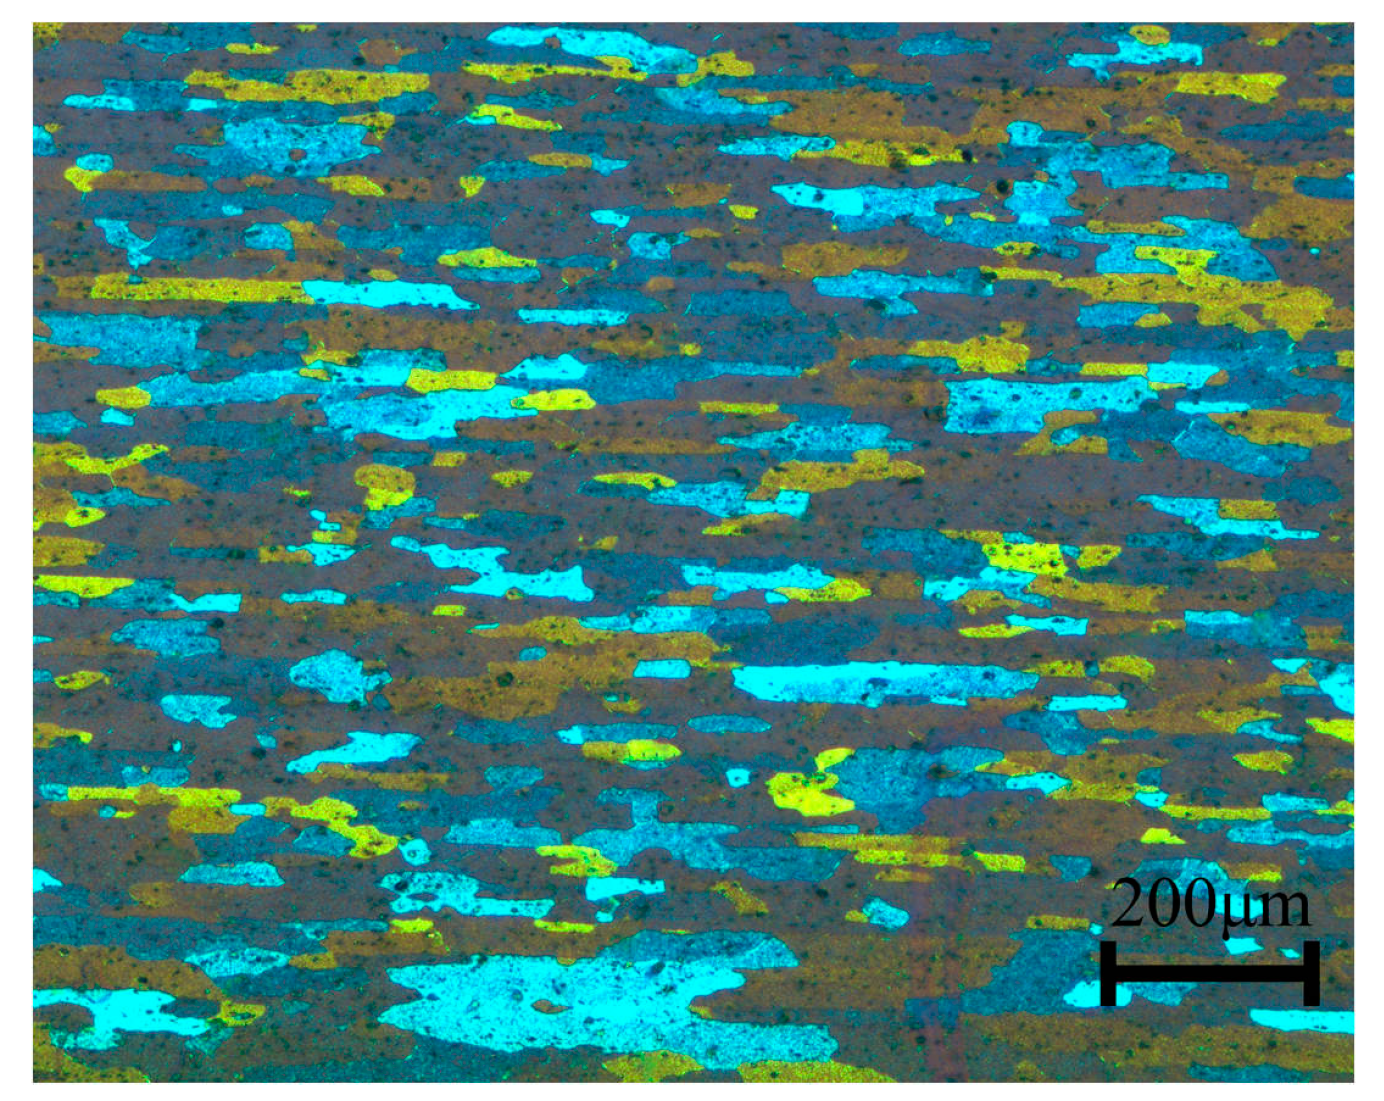
Figure 1. The microstructure of 6061-T6.
Applsci 14 08998 g001
Figure 2. (a) Tensile sample dimensions and (b) hardness measurement locations (indentation image).
Applsci 14 08998 g002
Figure 3. Schematic diagram of Erichsen cupping test.
Applsci 14 08998 g003
Figure 4. The microstructure of the FZ of the AW joints.
Applsci 14 08998 g004
Figure 5. The macro-and microstructure of the FZ of the PWCR joints.
Applsci 14 08998 g005
Figure 6. The macro-and microstructure of the FZ of the PWSHT joints.
Applsci 14 08998 g006
Figure 7. The macro-and microstructure of the FZ of the PWCR-SHT joints; (a) enlarged local W3 region; (b) enlarged local W1 region; (c) enlarged local W4 region; and (d) enlarged local W2 region.
Applsci 14 08998 g007
Figure 8. The HAZ microstructure of the PWCR-SHT joints: (a) close to the FZ (HAZ1) and (b) away from the FZ (HAZ2).
Applsci 14 08998 g008
Figure 9. Hardness test results of the joints.
Applsci 14 08998 g009
Figure 10. The tensile properties of the joints.
Applsci 14 08998 g010
Figure 11. The tensile fracture position of joints: (a) the AW joint; (b) the PWCR joint; (c) the PWSHT joint; and (d) the PWCR-SHT joint.
Applsci 14 08998 g011
Figure 12. The fracture surface of joints: (a) the AW joint; (b) the PWCR joint; (c) the PWSHT joint; and (d) the PWCR-SHT joint.
Applsci 14 08998 g012
Figure 13. (a) Force–displacement curve during cupping test and (b) cupping depth and formability ratio.
Applsci 14 08998 g013
Figure 14. The surface of TWBs after cupping test (a) the AW TWBs; (b) the PWCR TWBs; (c) the PWSHT TWBs; (d) the PWCR-SHT TWBs; and (e) the BM.
Applsci 14 08998 g014
Figure 15. The distribution of Mg, Si, and Fe elements within the FZ using the backscattering mode in the SEM.
Applsci 14 08998 g015
Figure 16. The SEM images of the HAZ softening zone: (a) the AW joint and (b) the PWSHT joint.
Applsci 14 08998 g016
Figure 17. The AW-TWBs cupping surface failure mode and stress distribution simulation results: (a) with retained excess metal and (b) without excess metal.
Applsci 14 08998 g017
Figure 18. The force–displacement curves of TWBs with and without excess metal and stress concentration locations at the cross-section.
Applsci 14 08998 g018
Table 1. Elemental composition of materials (%wt).
MaterialsMgSiFeCuCrMnZnAl
6061-T61.100.620.420.260.190.080.01Bal
ER53564.900.050.120.010.120.120.01Bal
Table 2. Current waveform parameters.
Welding Current (I/A)Base Current (Ib/A)Peak Current (Ip/A)Base Time (tb/ms)Peak Time (tp/ms)
Low PulseHigh PulseLow PulseHigh PulseLow PulseHigh Pulse
80283103360.81.61.00.8
Table 3. Description of the post-weld processing treatments for samples used in this experiment.
SampleDescription
AWAs-welded samples with no additional post-weld treatment process.
PWCRAs-welded samples were processed by performing one rolling pass over the weld excess metal at room temperature
PWSHTAs-welded samples were solution-treated at 520 °C for 1.5 h and water-quenched.
PWCR-SHTPWCR samples were solution-treated at 520 °C for 1.5 h and water-quenched.
Disclaimer/Publisher’s Note: The statements, opinions and data contained in all publications are solely those of the individual author(s) and contributor(s) and not of MDPI and/or the editor(s). MDPI and/or the editor(s) disclaim responsibility for any injury to people or property resulting from any ideas, methods, instructions or products referred to in the content.