


Microstructure Evolution and Forming Characteristics of Post-Weld Composite Treatment of 6061 Aluminum Alloy Tailor Welded Blanks

Abstract
:Featured Application
Abstract
1. Introduction
2. Materials and Methods
3. Results
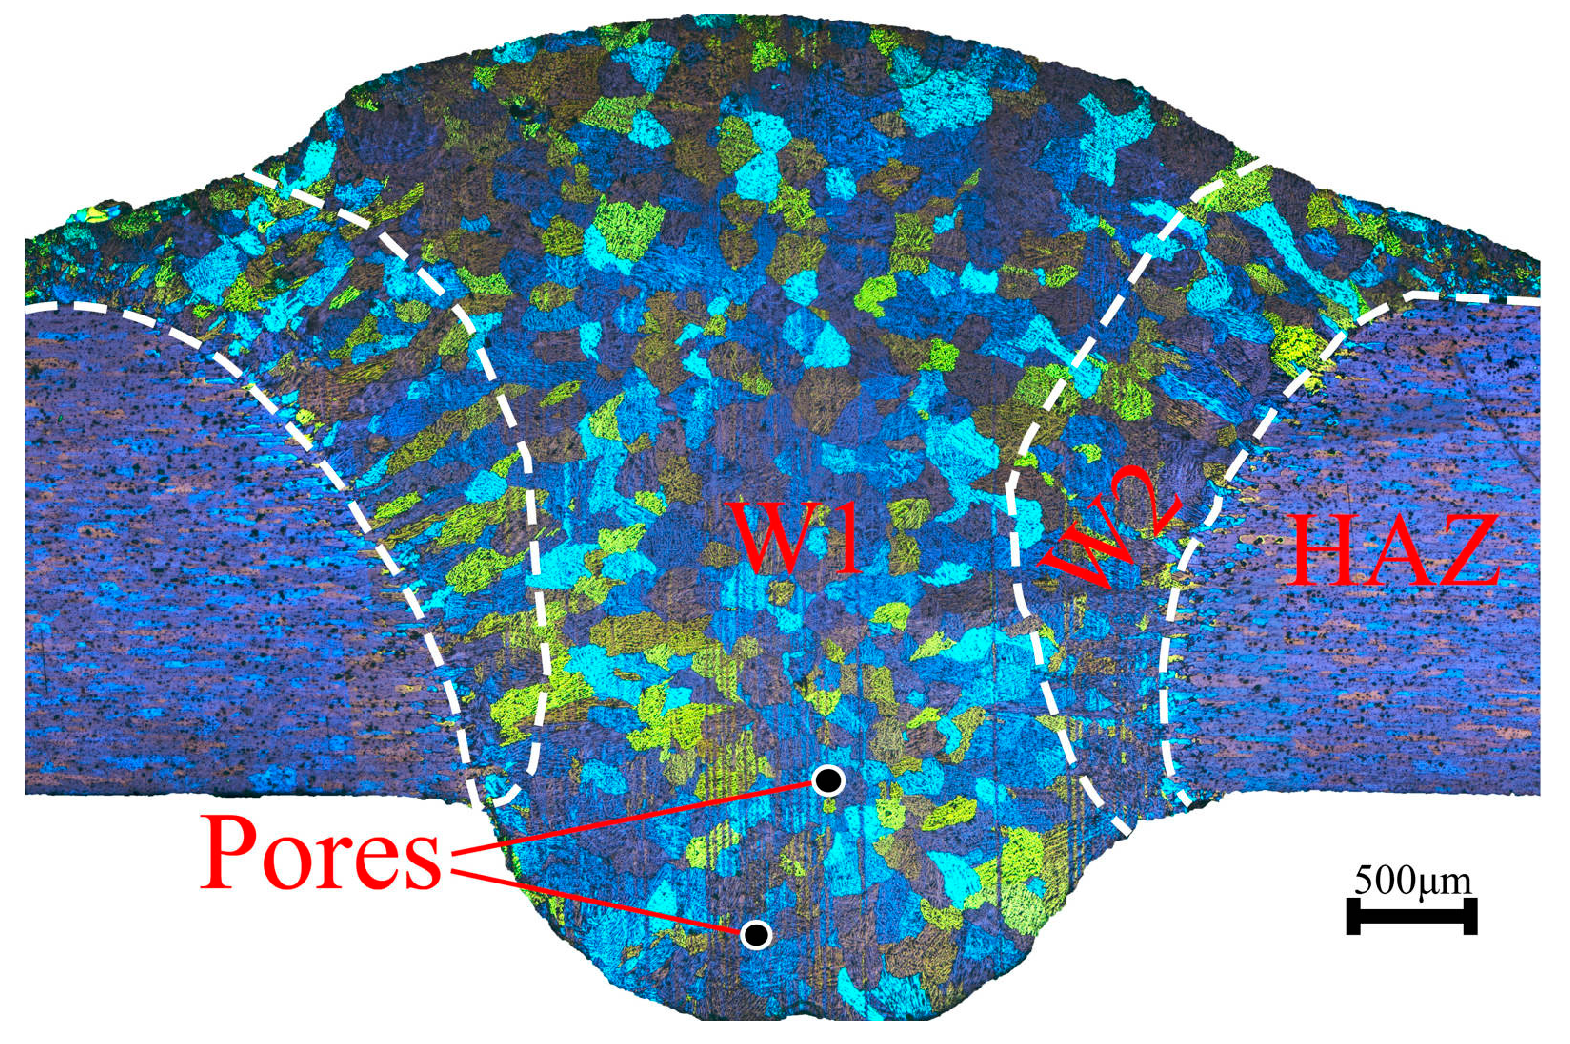
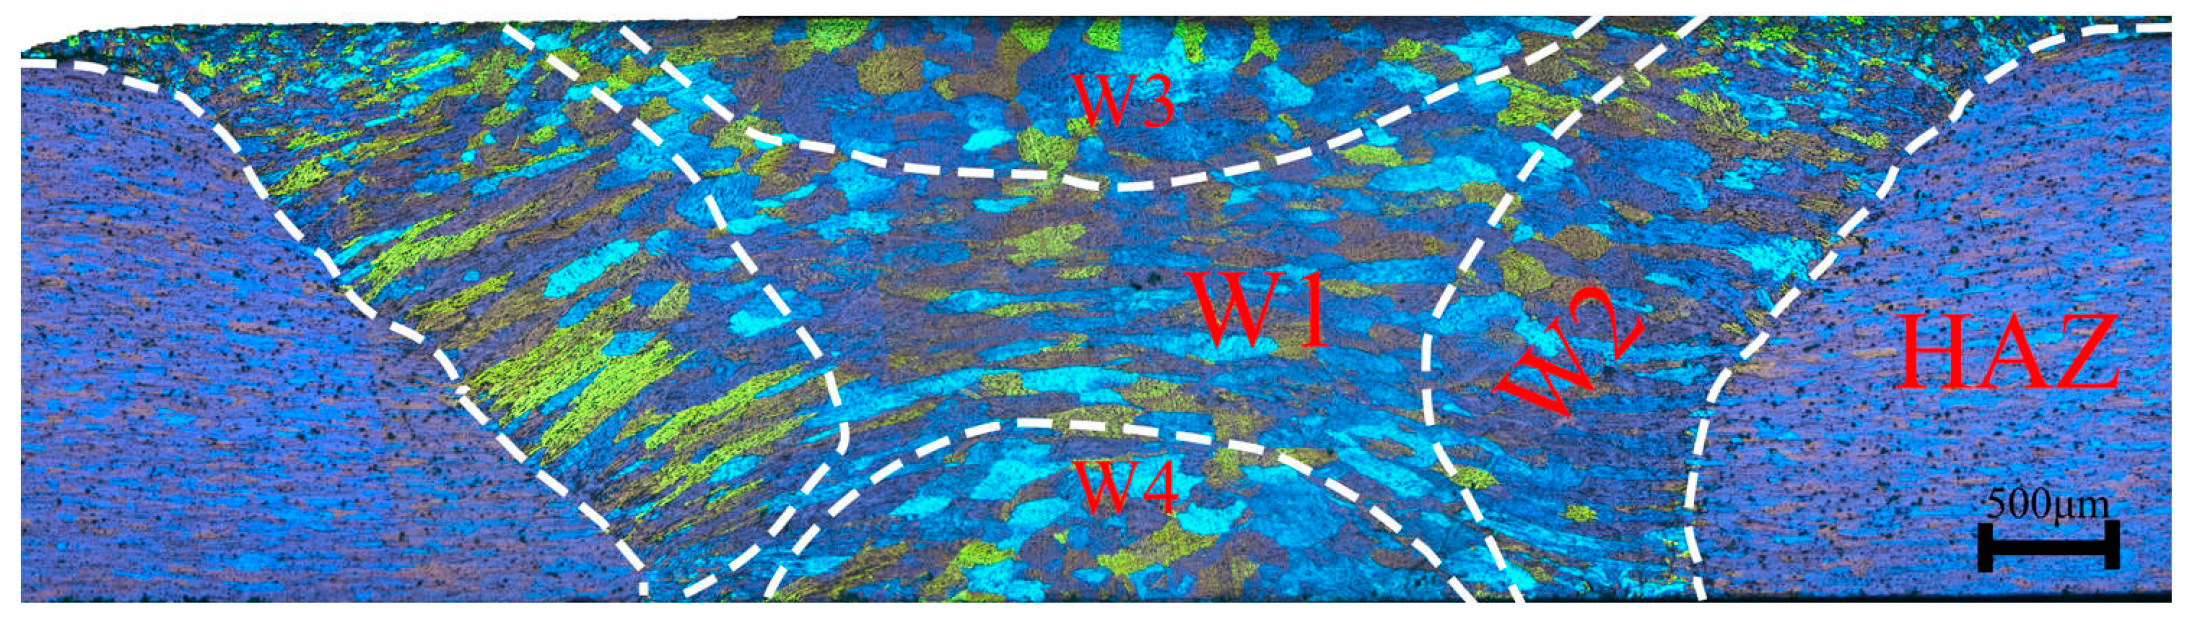
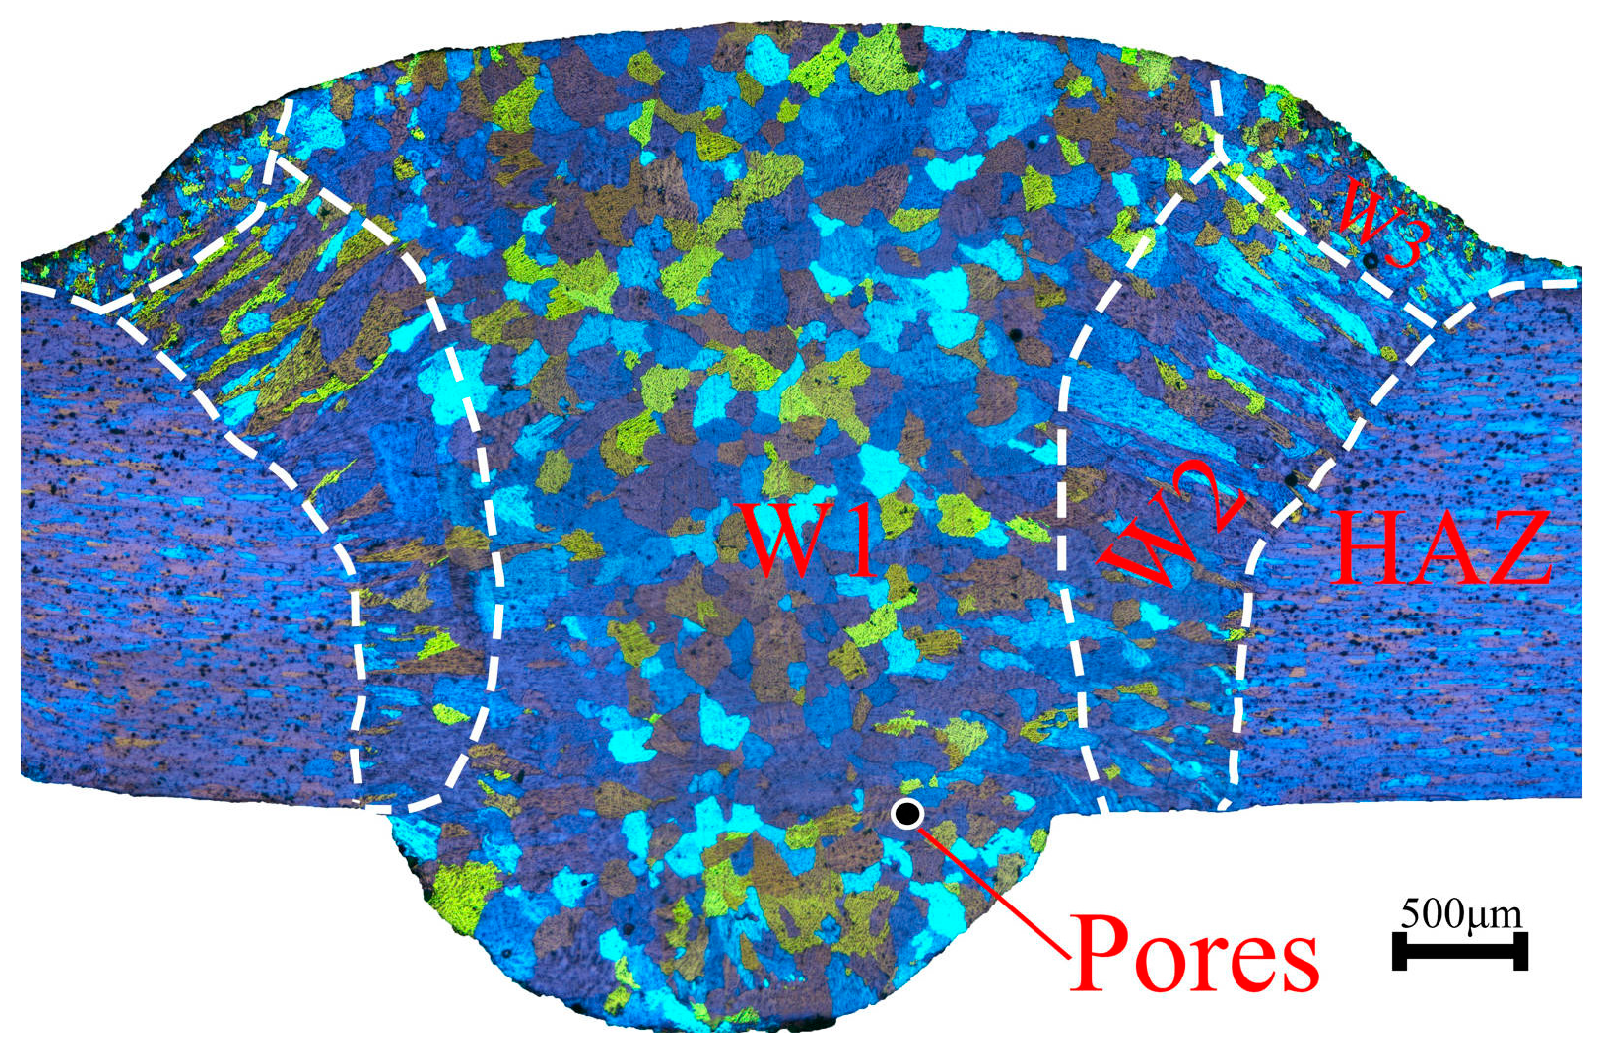
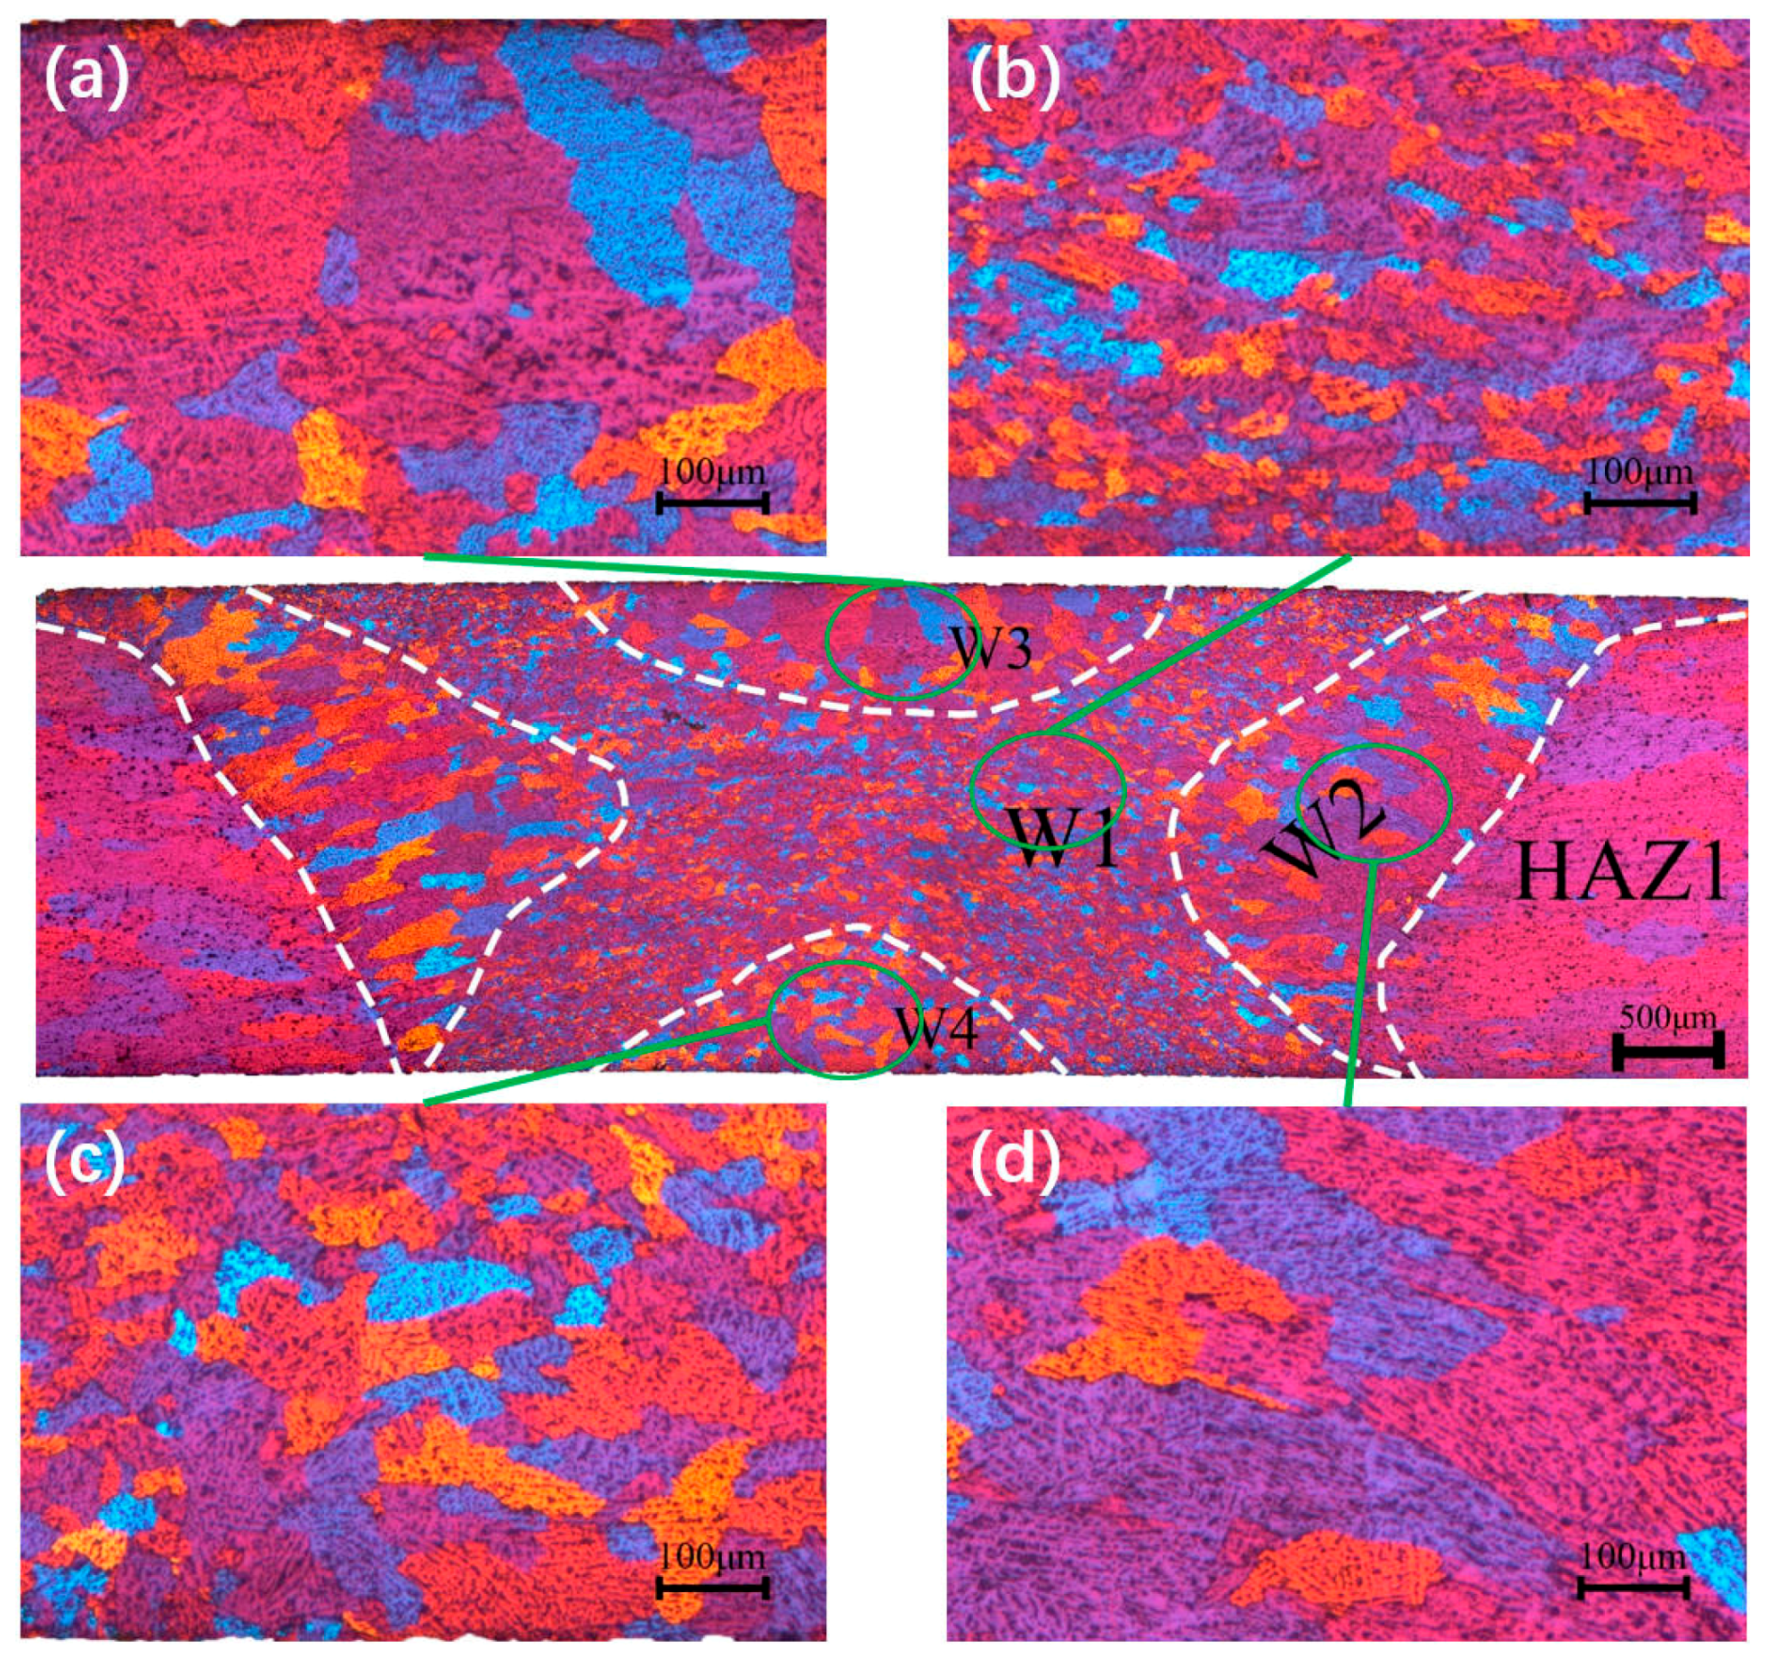
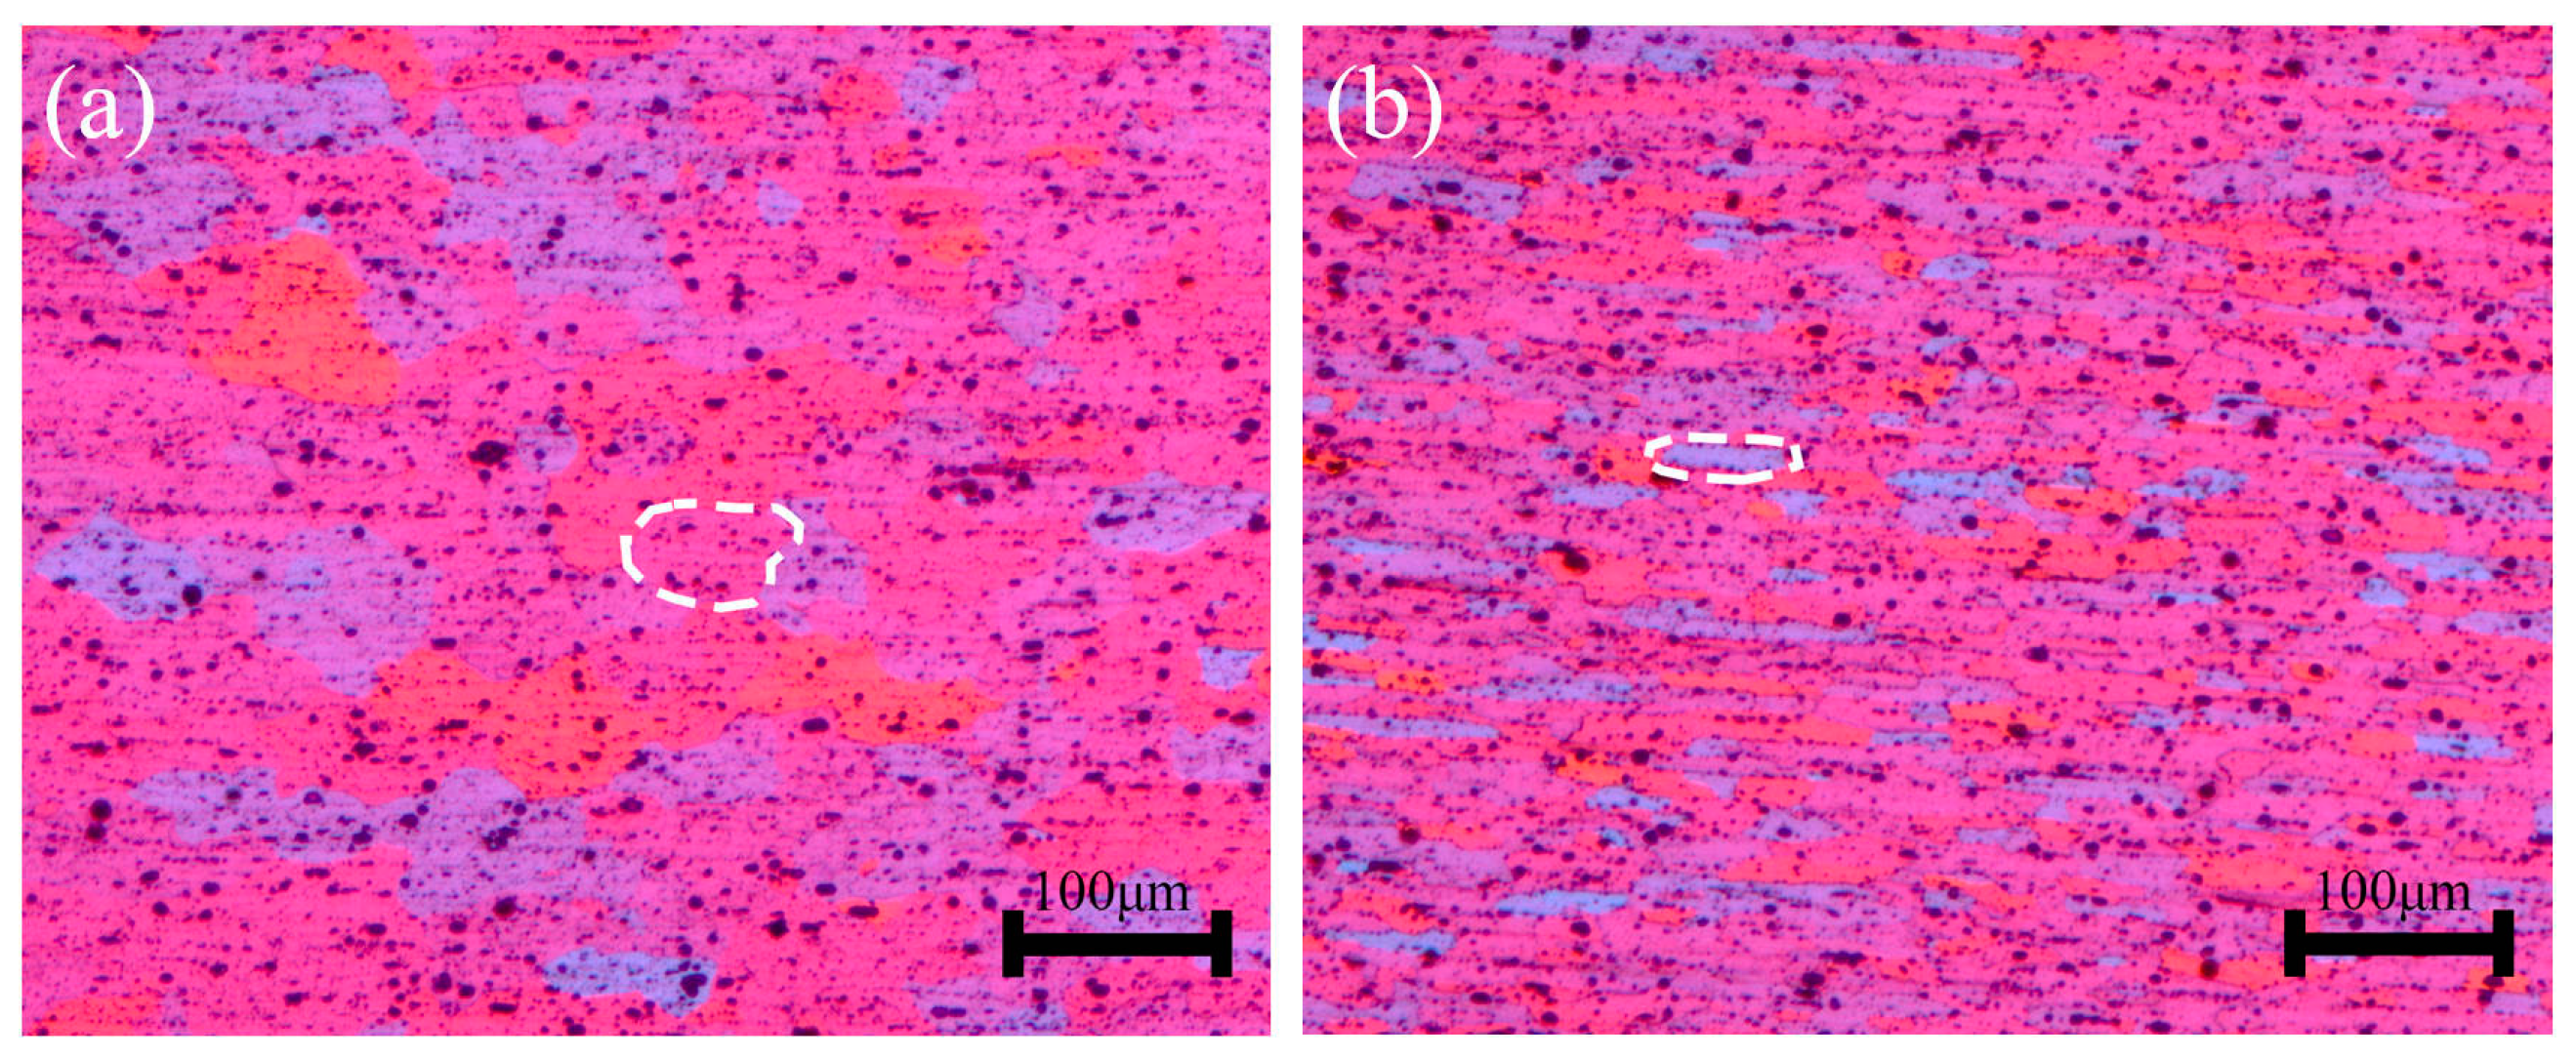
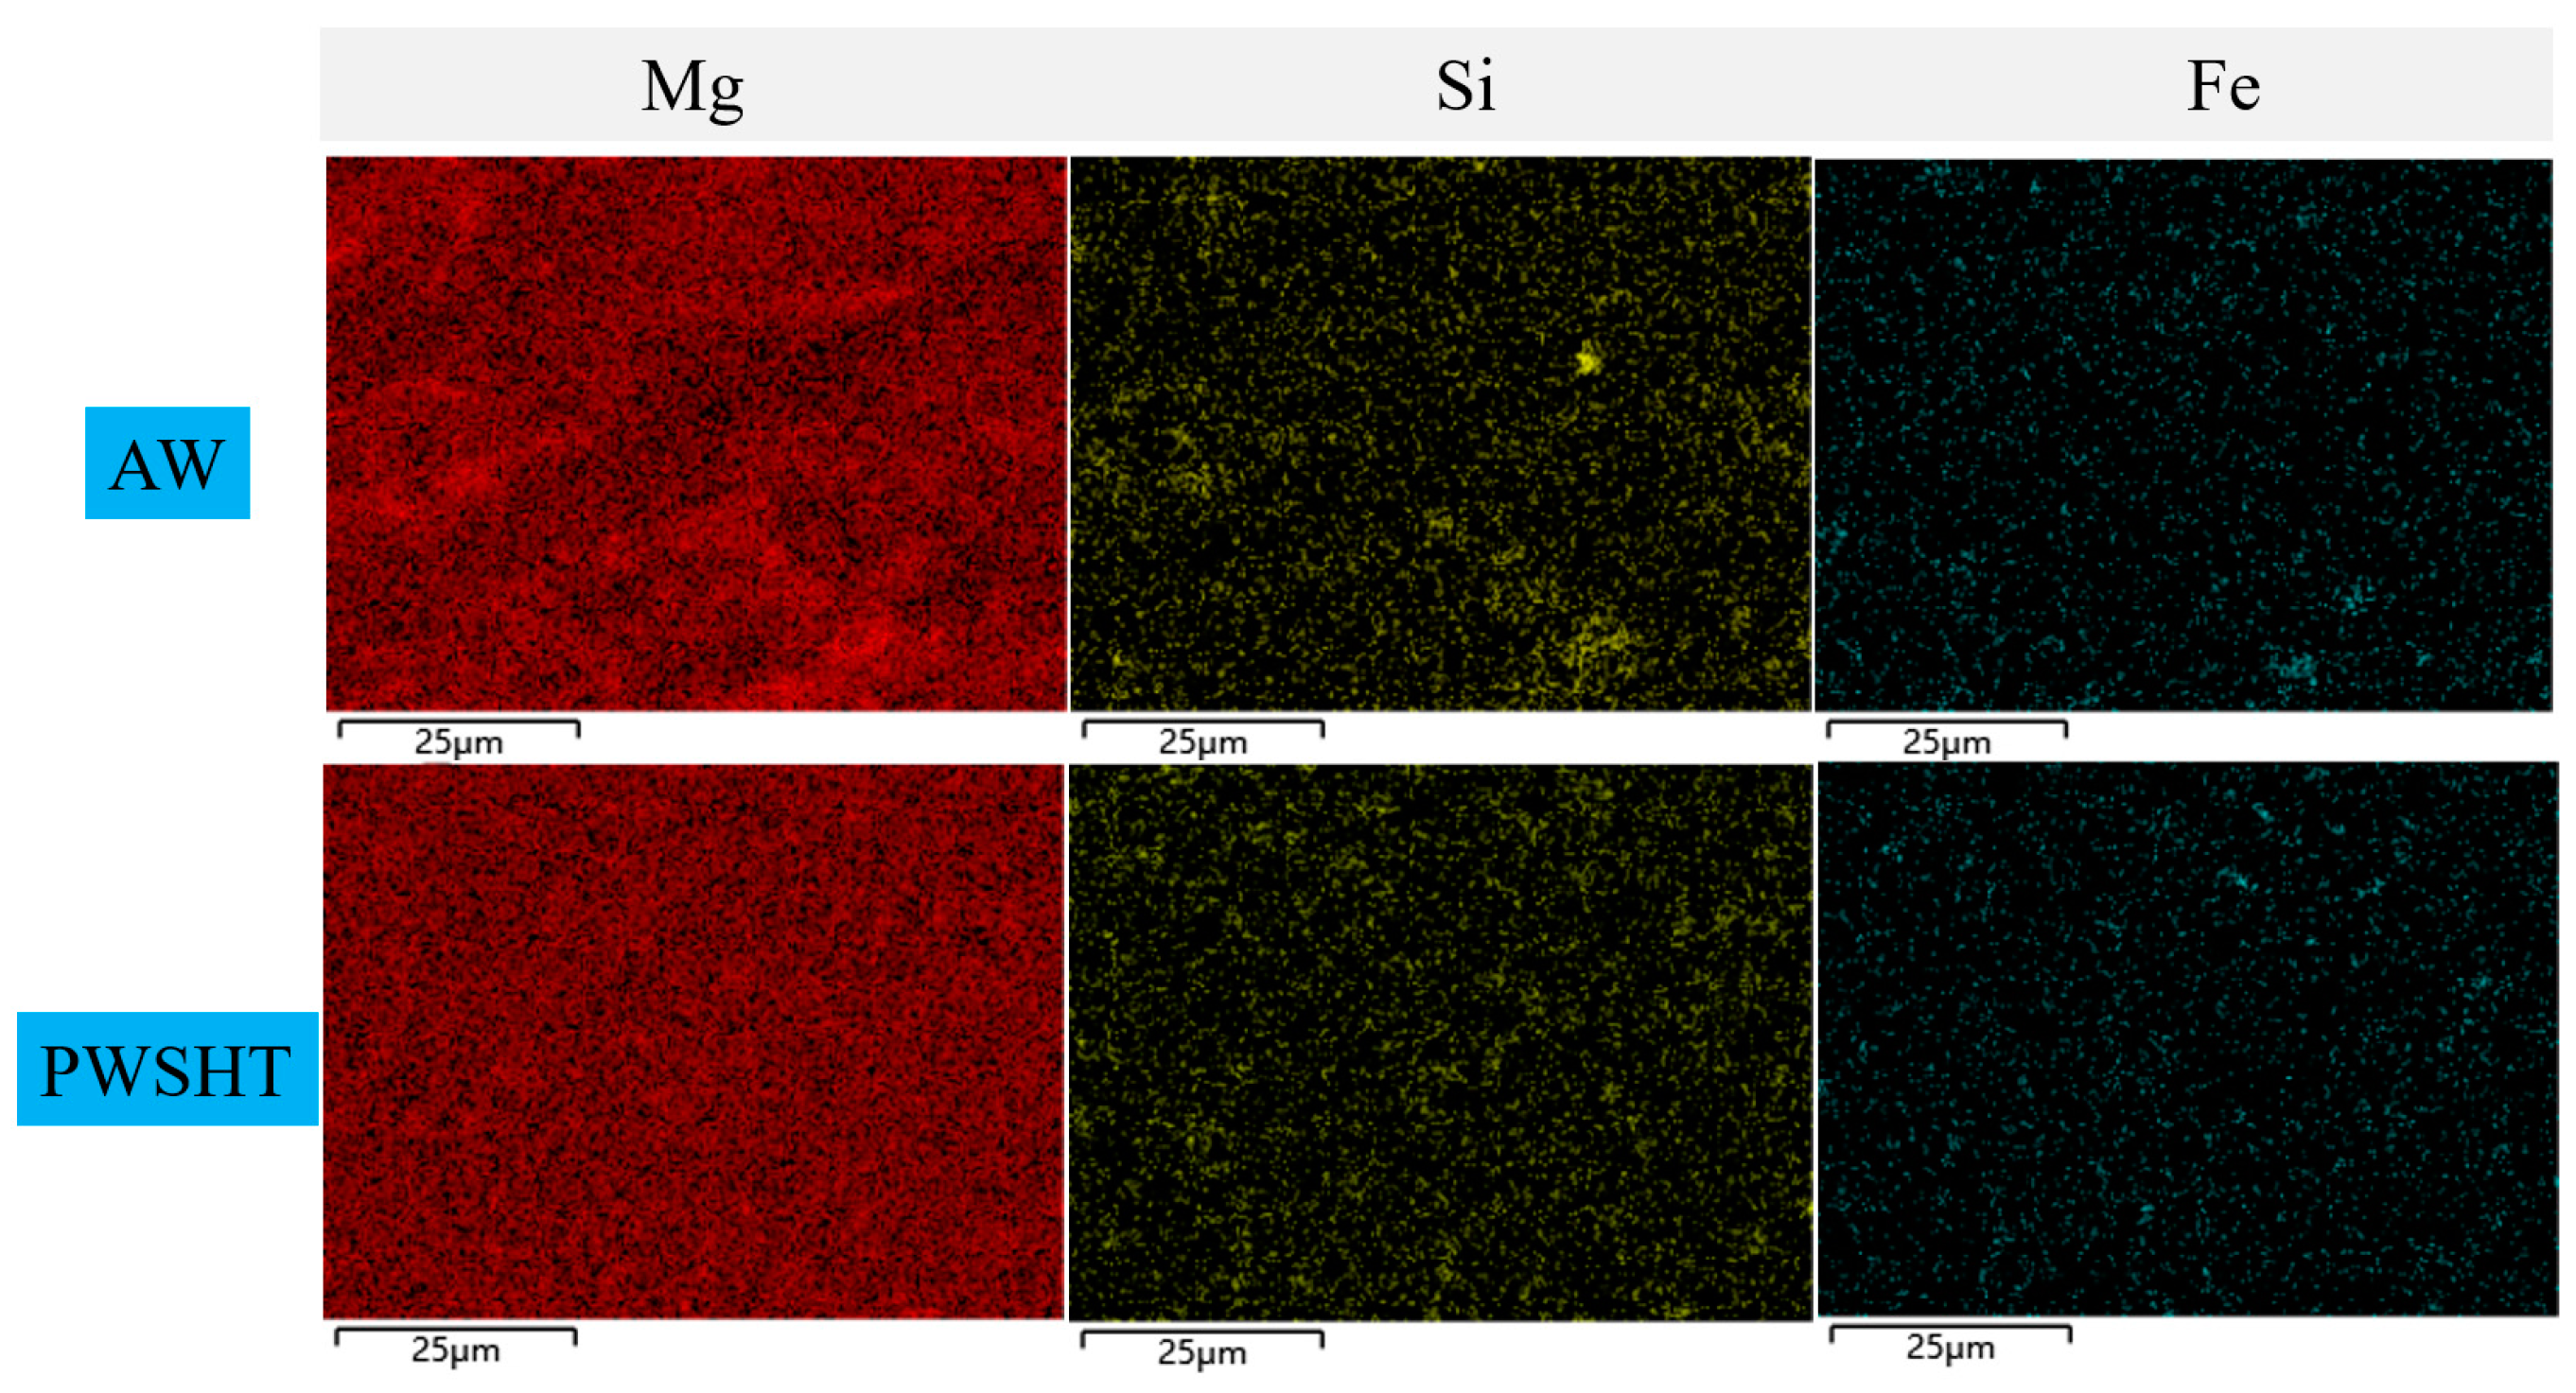
3.1. Microstructure
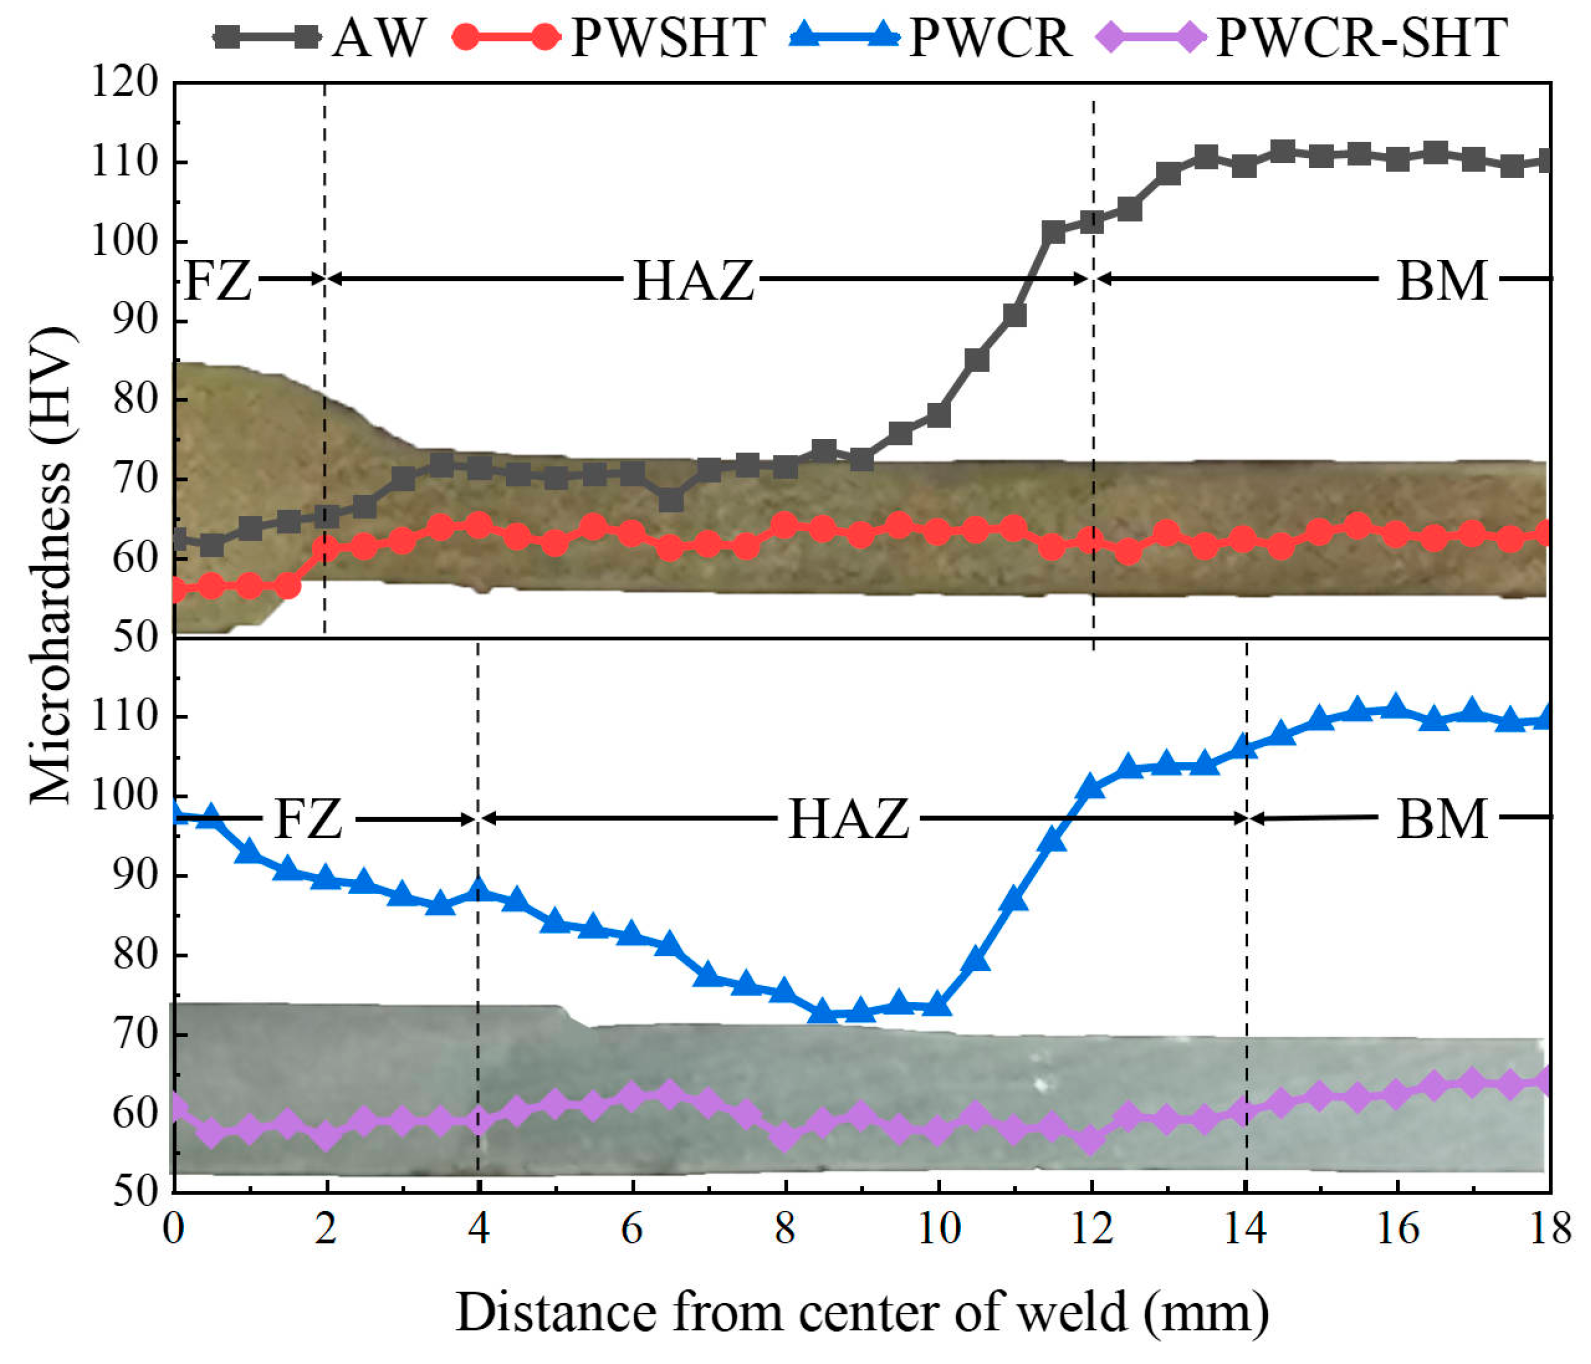
3.2. Hardness Distribution
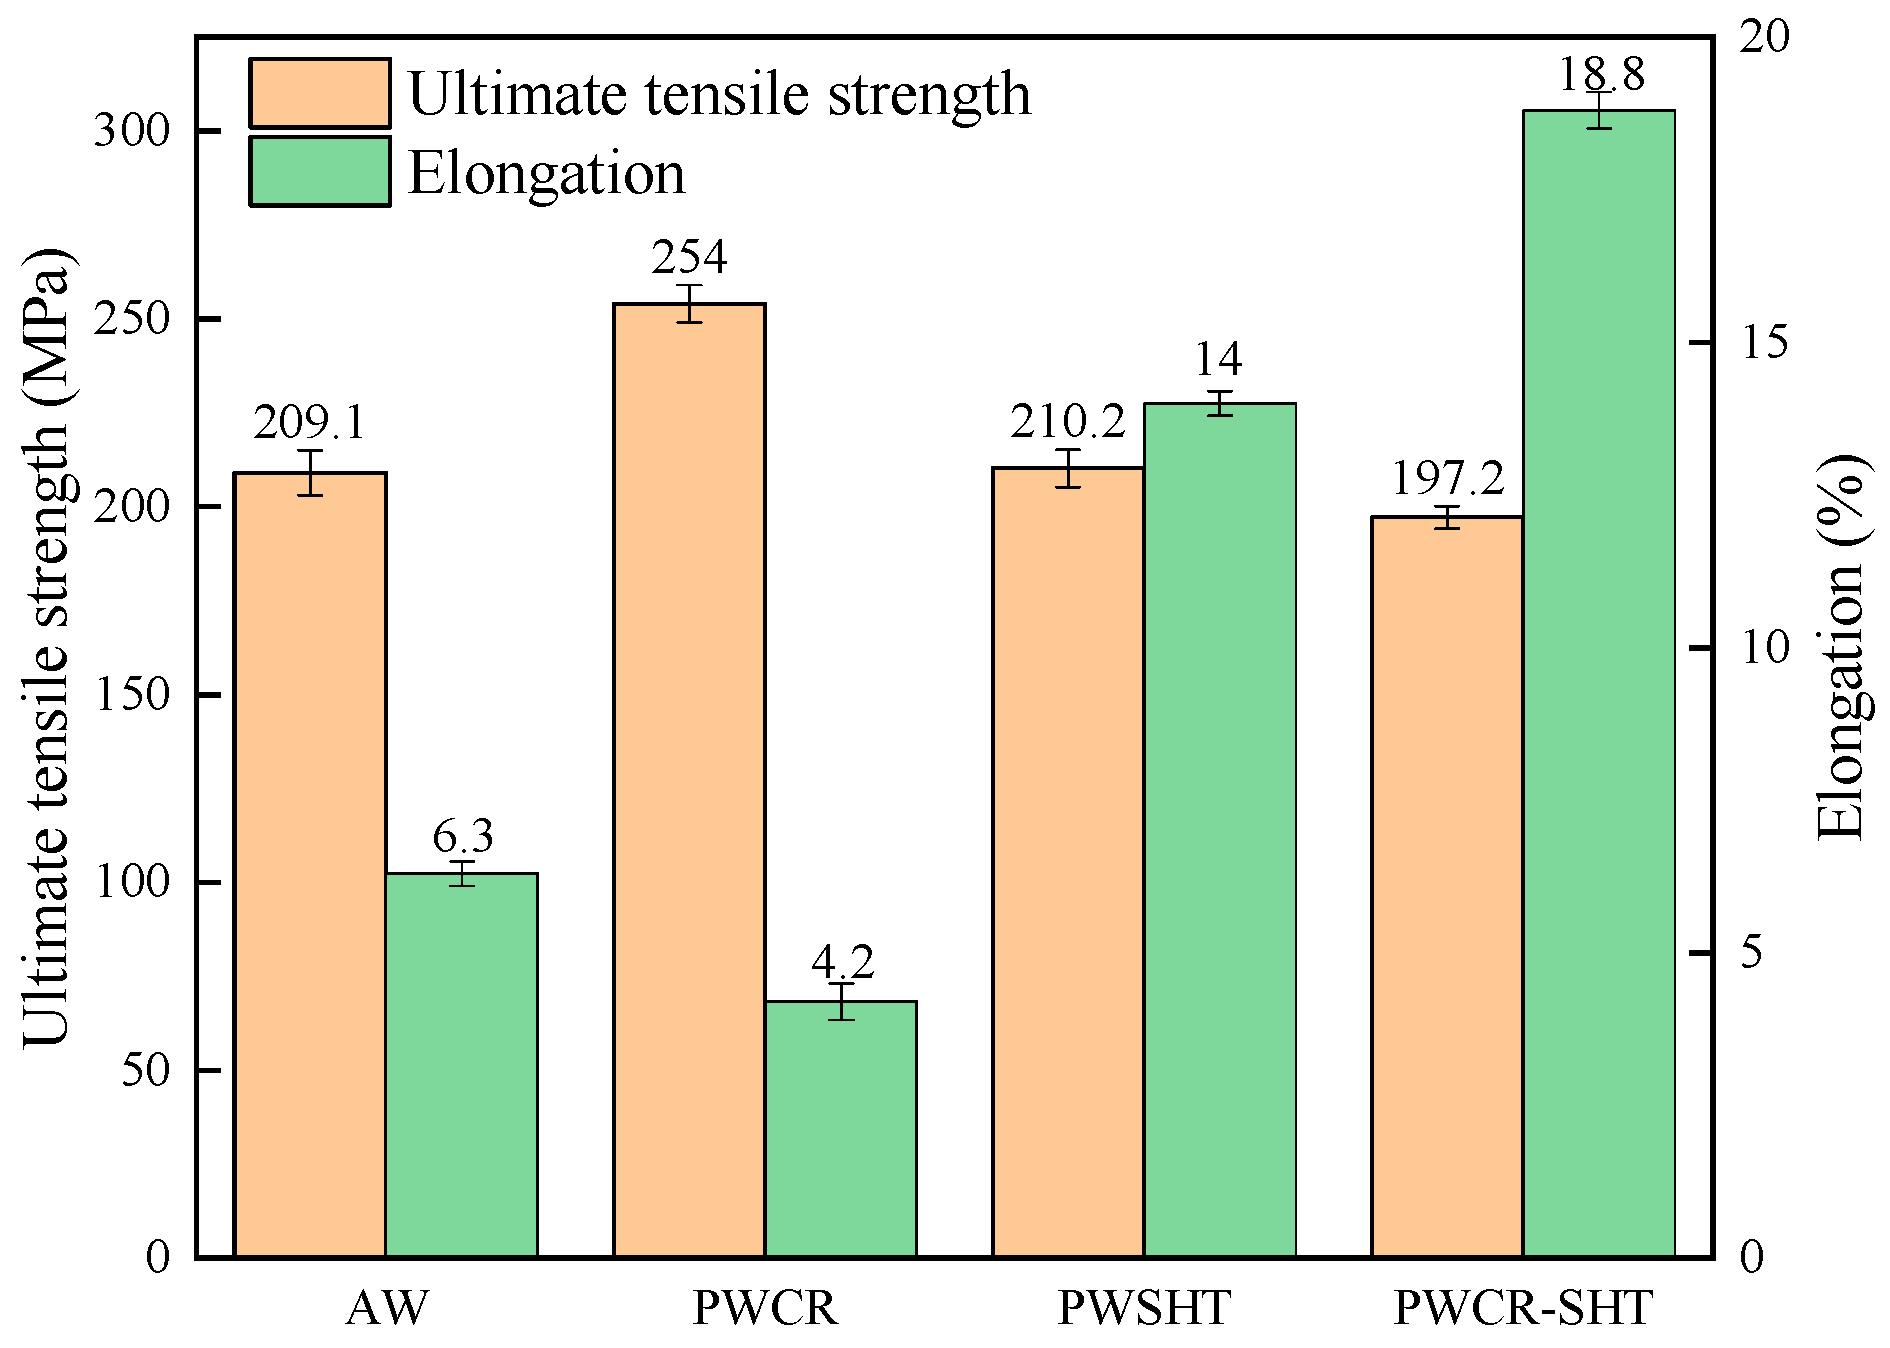
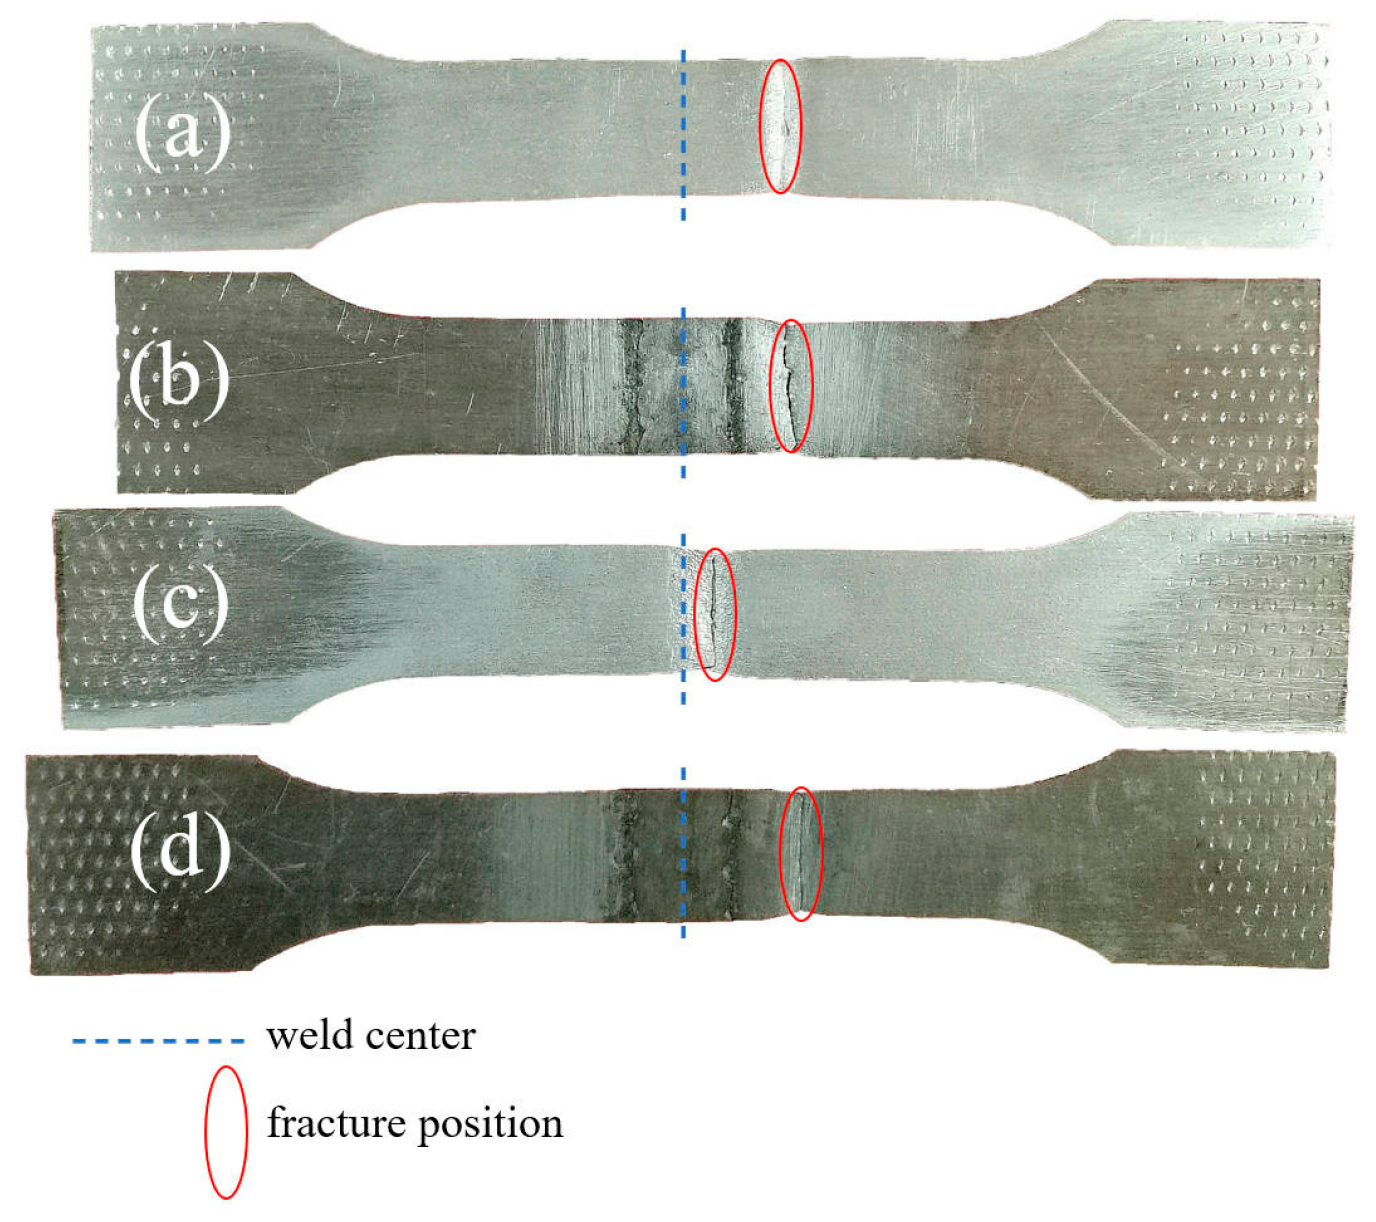
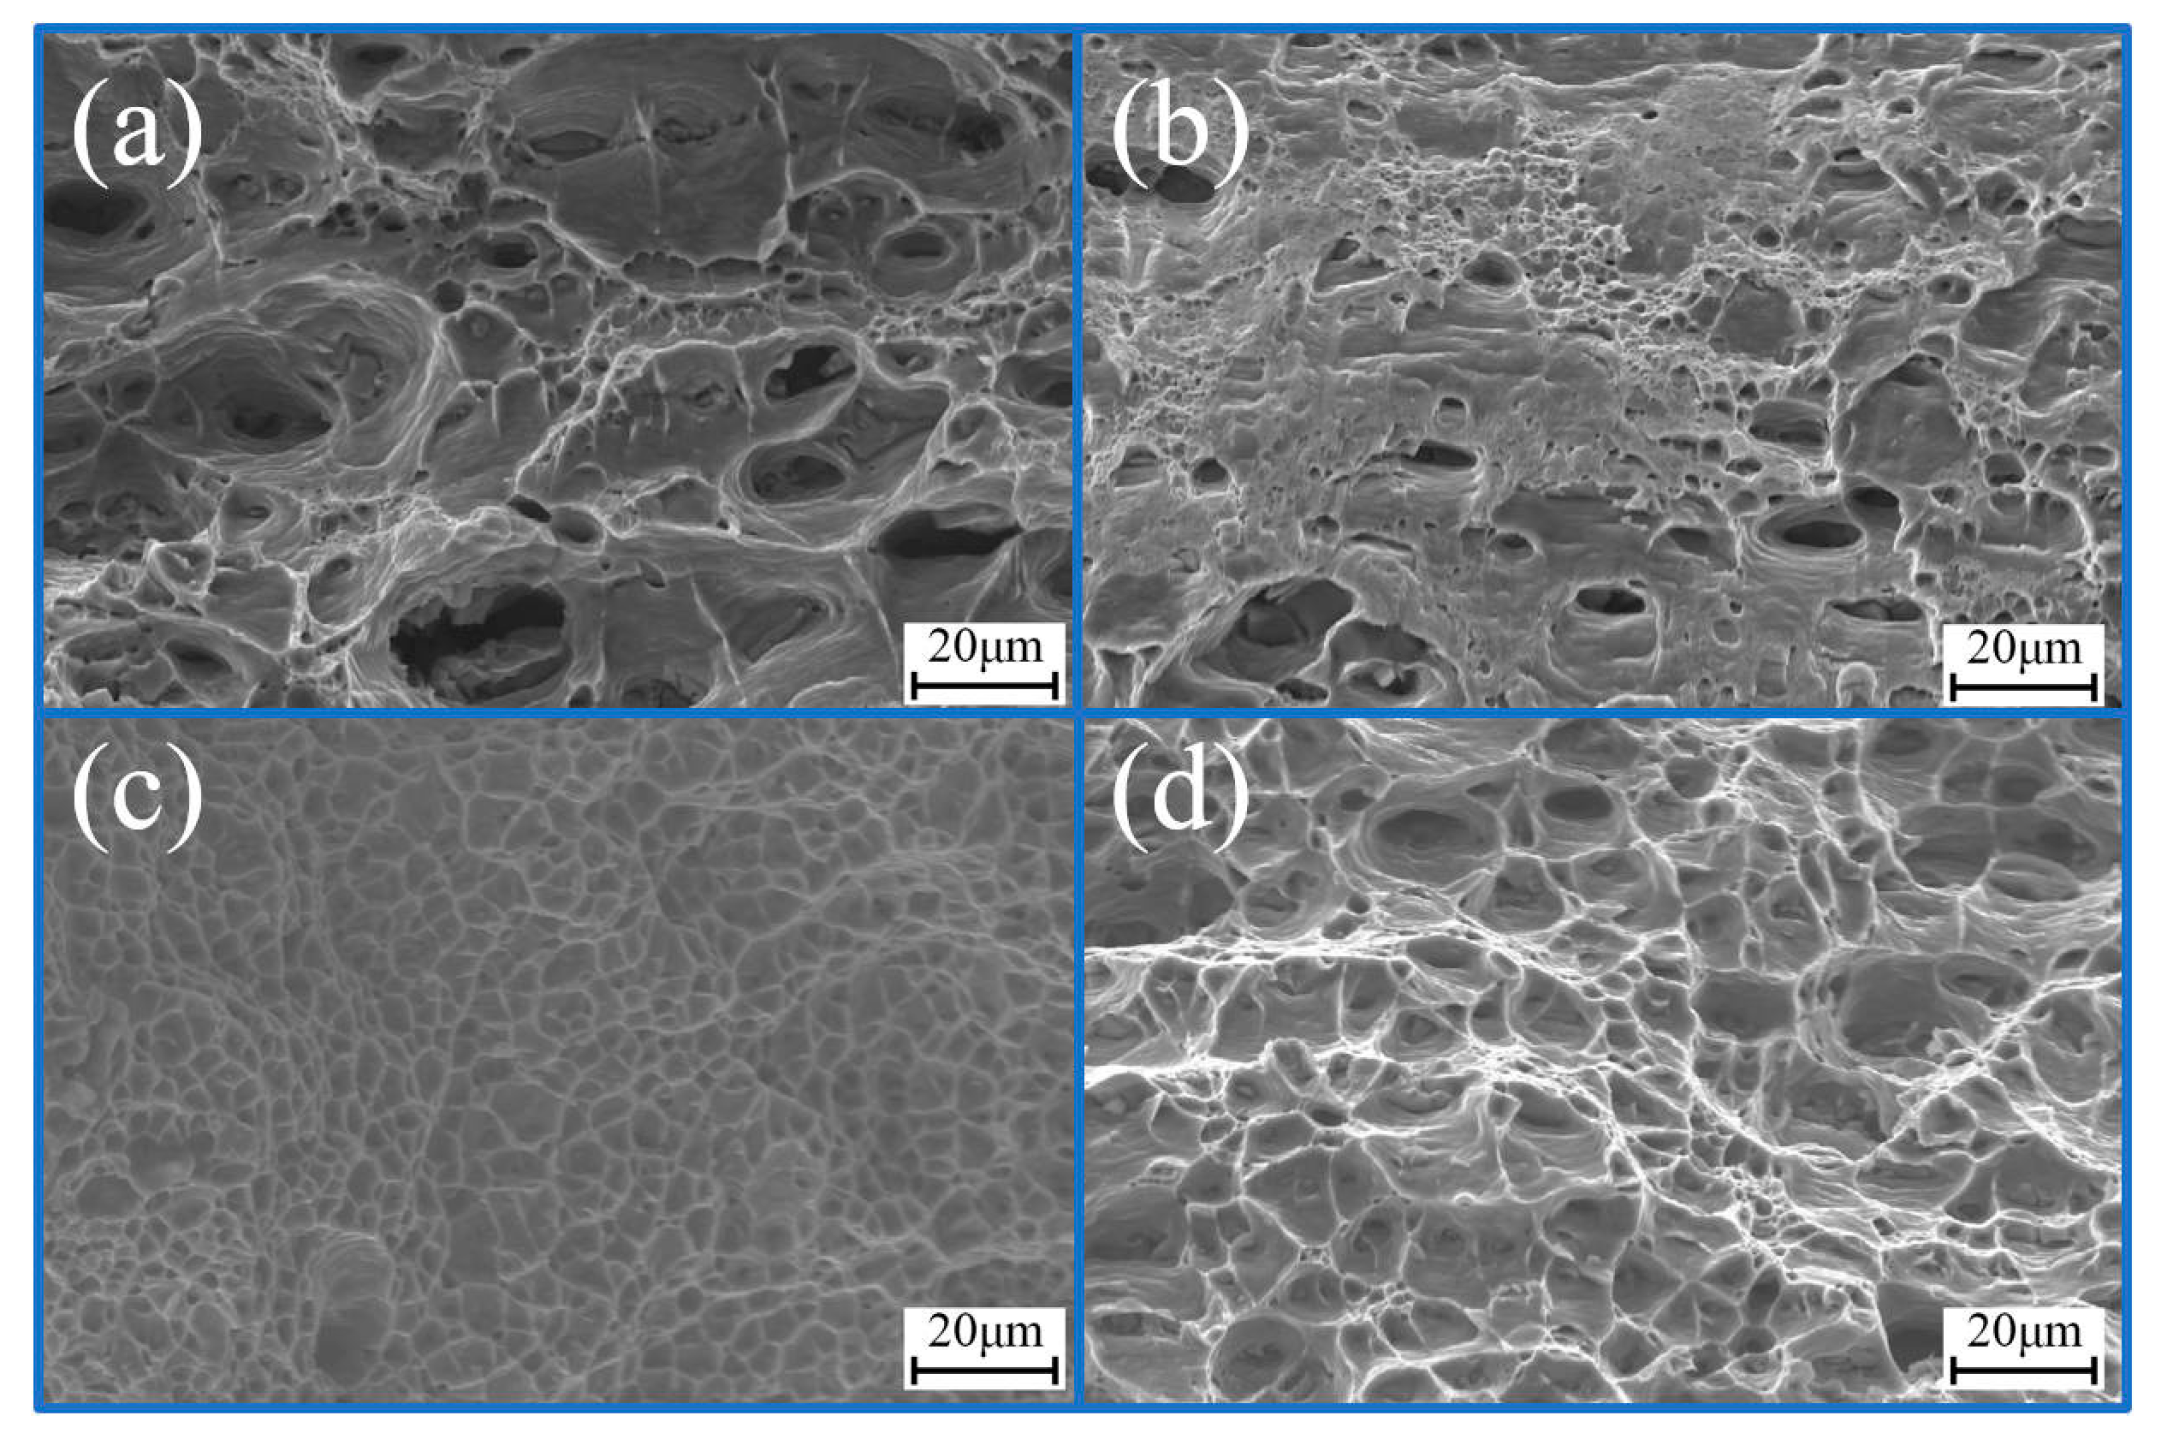
3.3. Tensile Performance
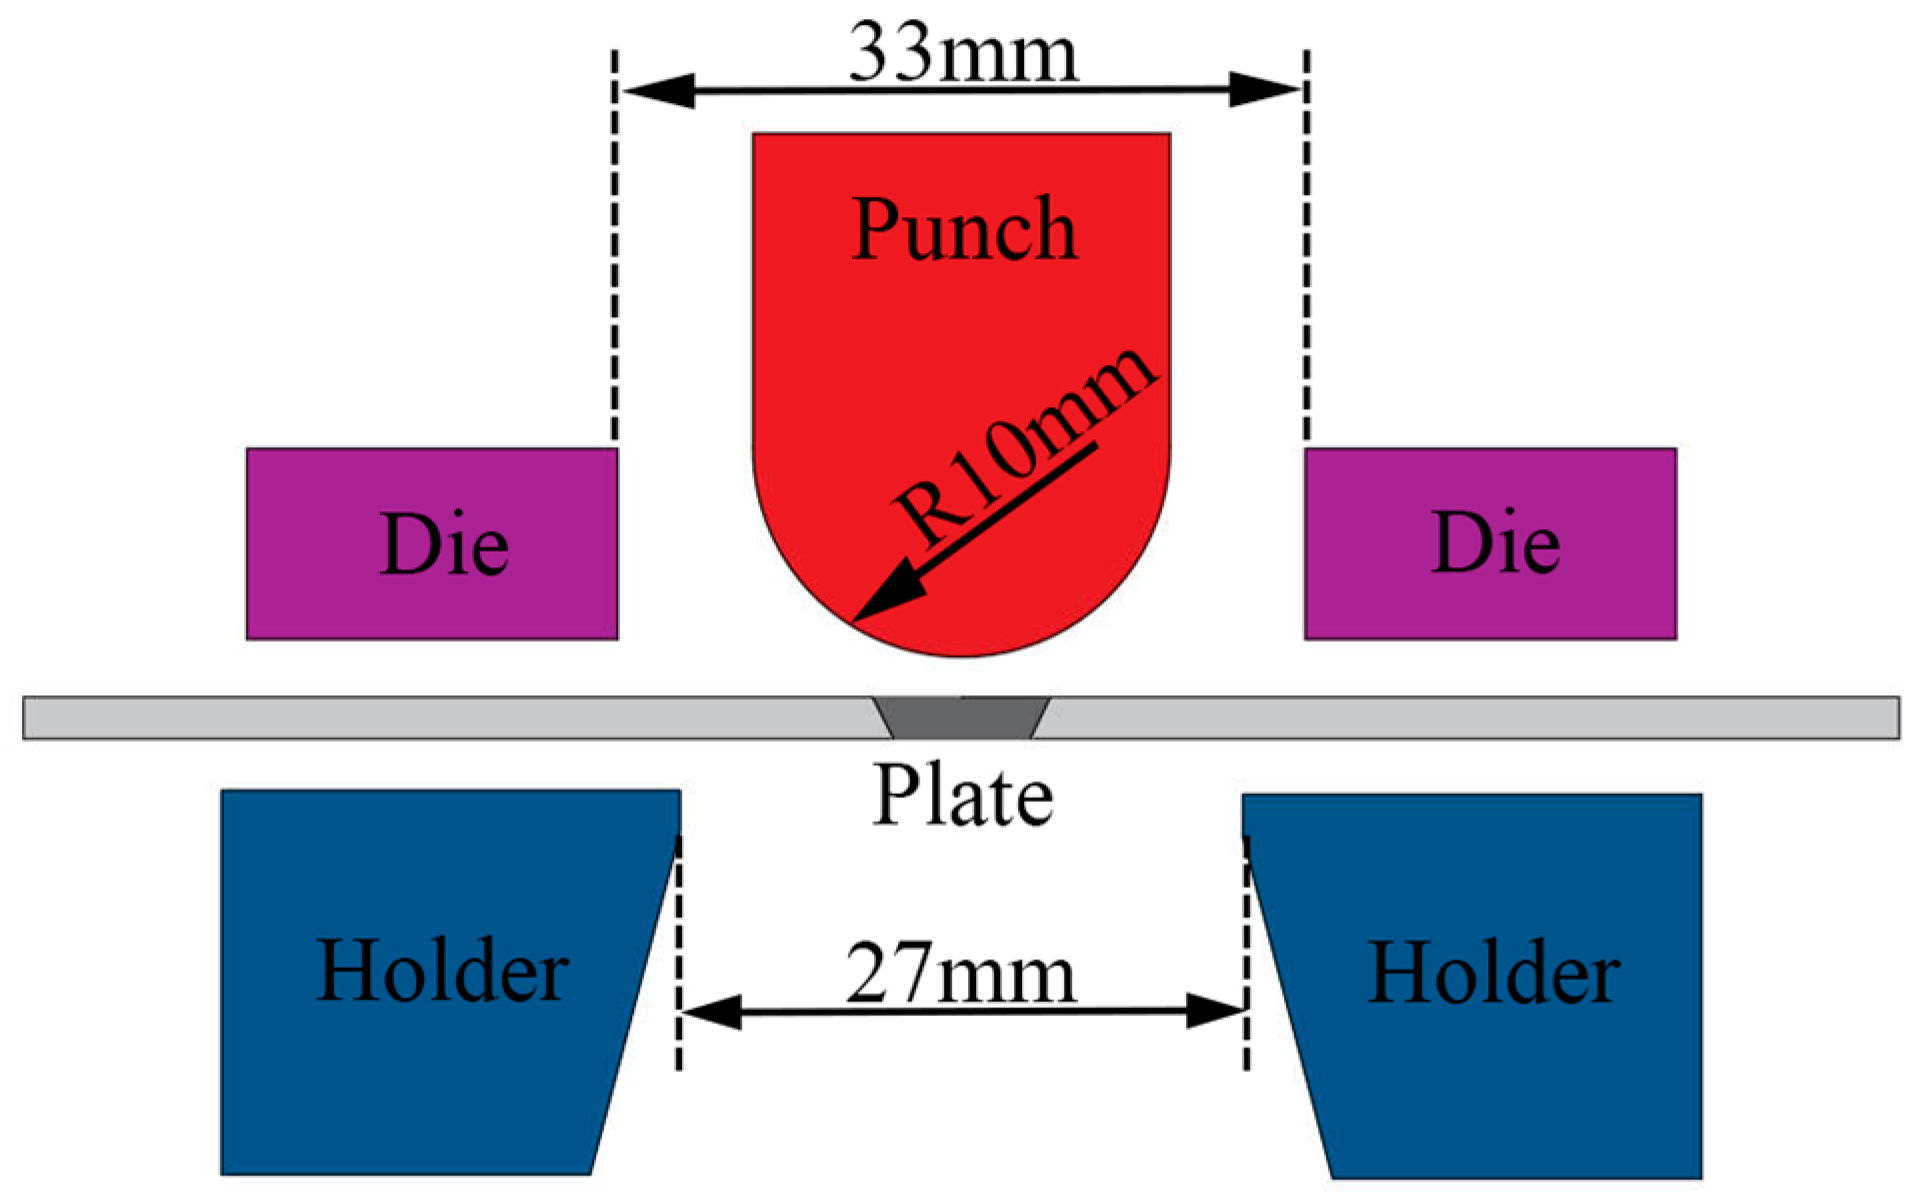
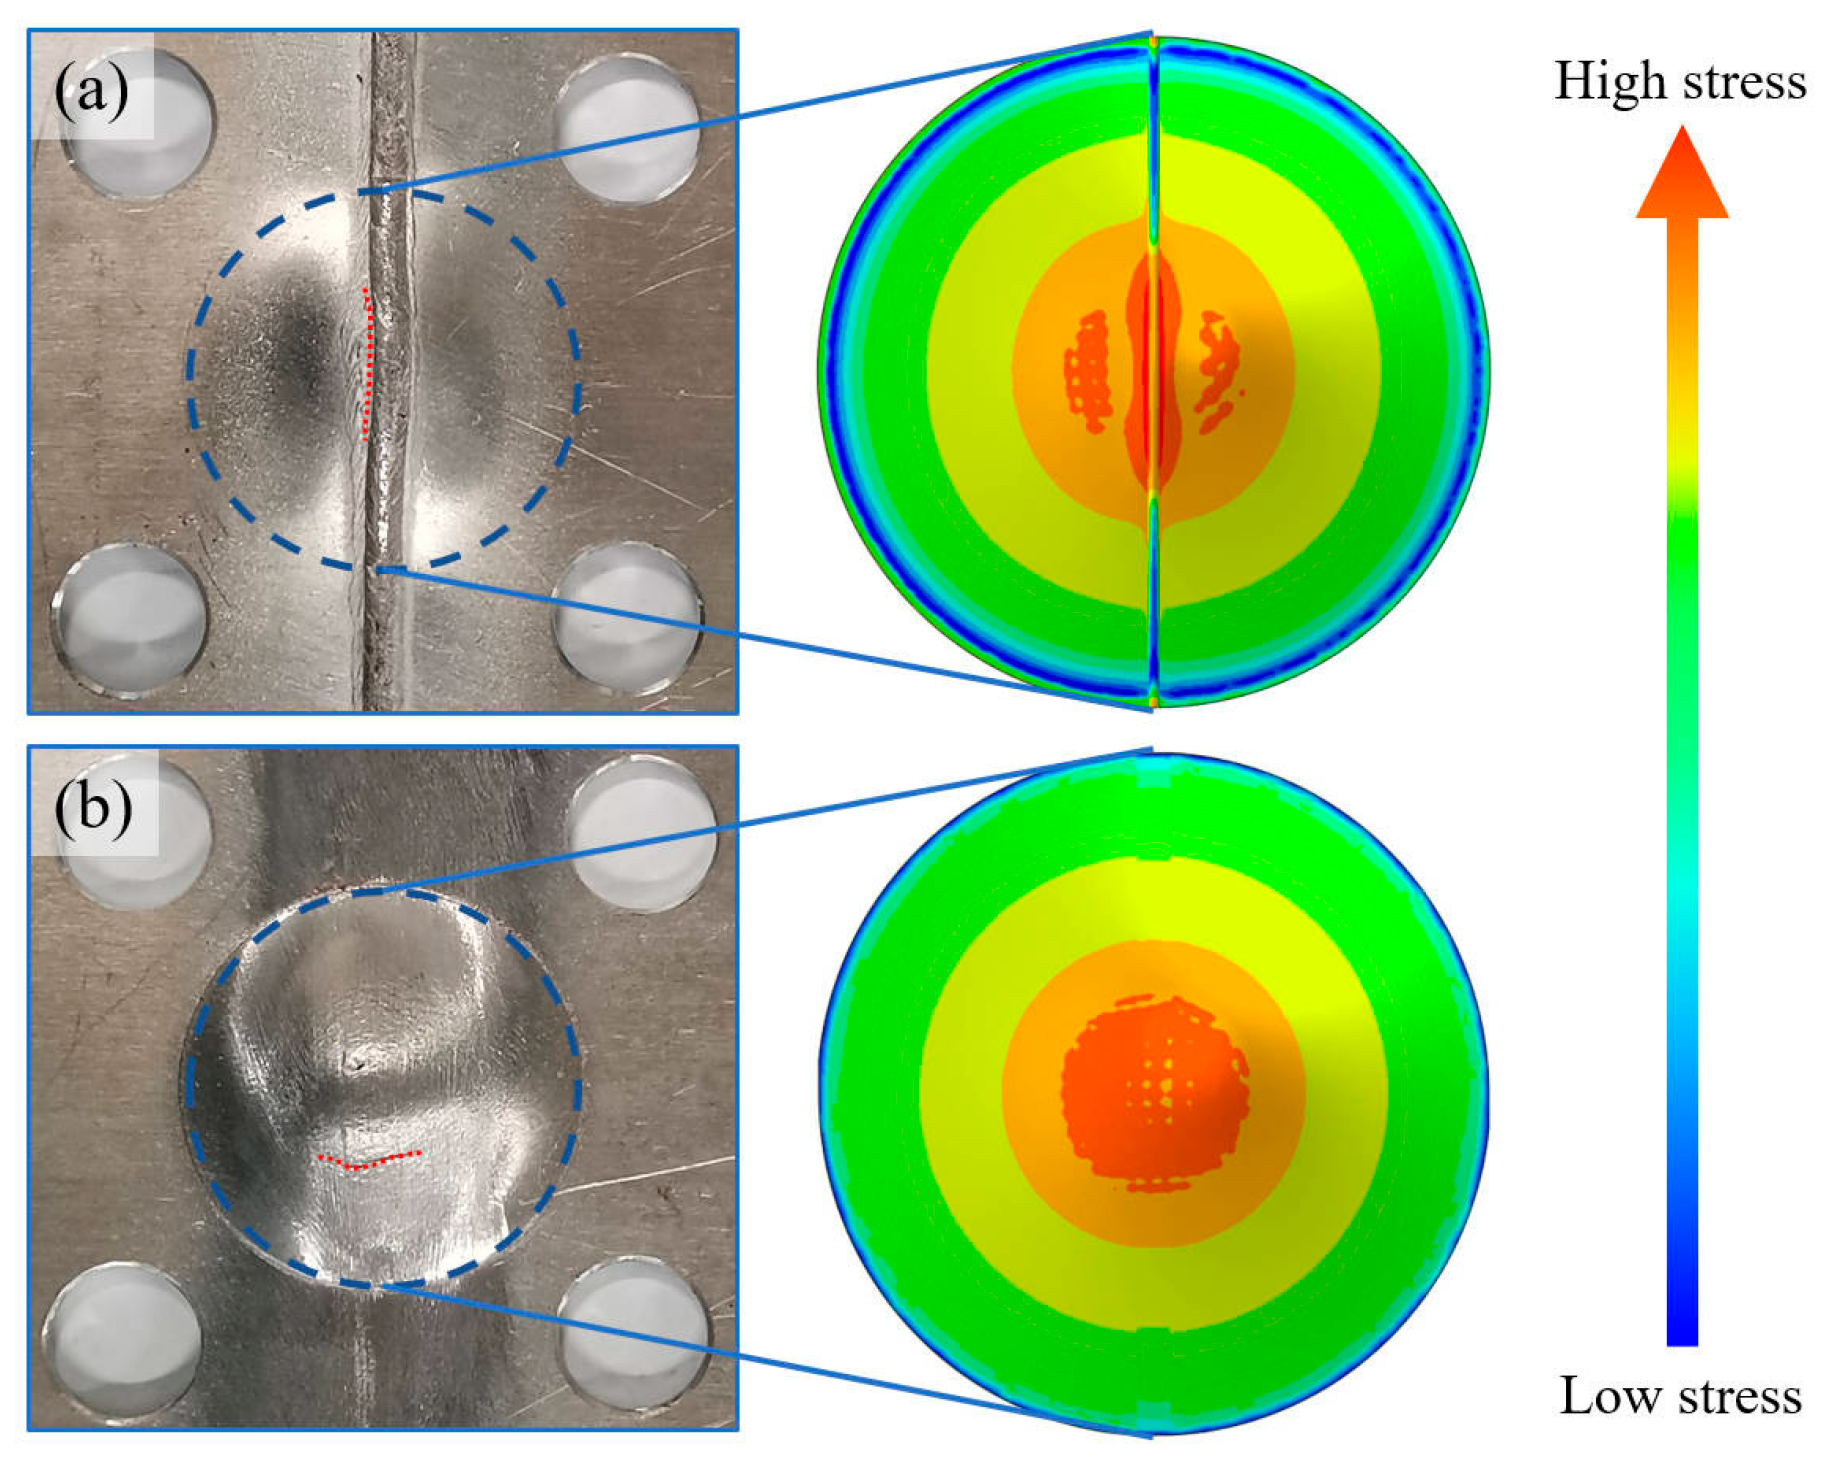
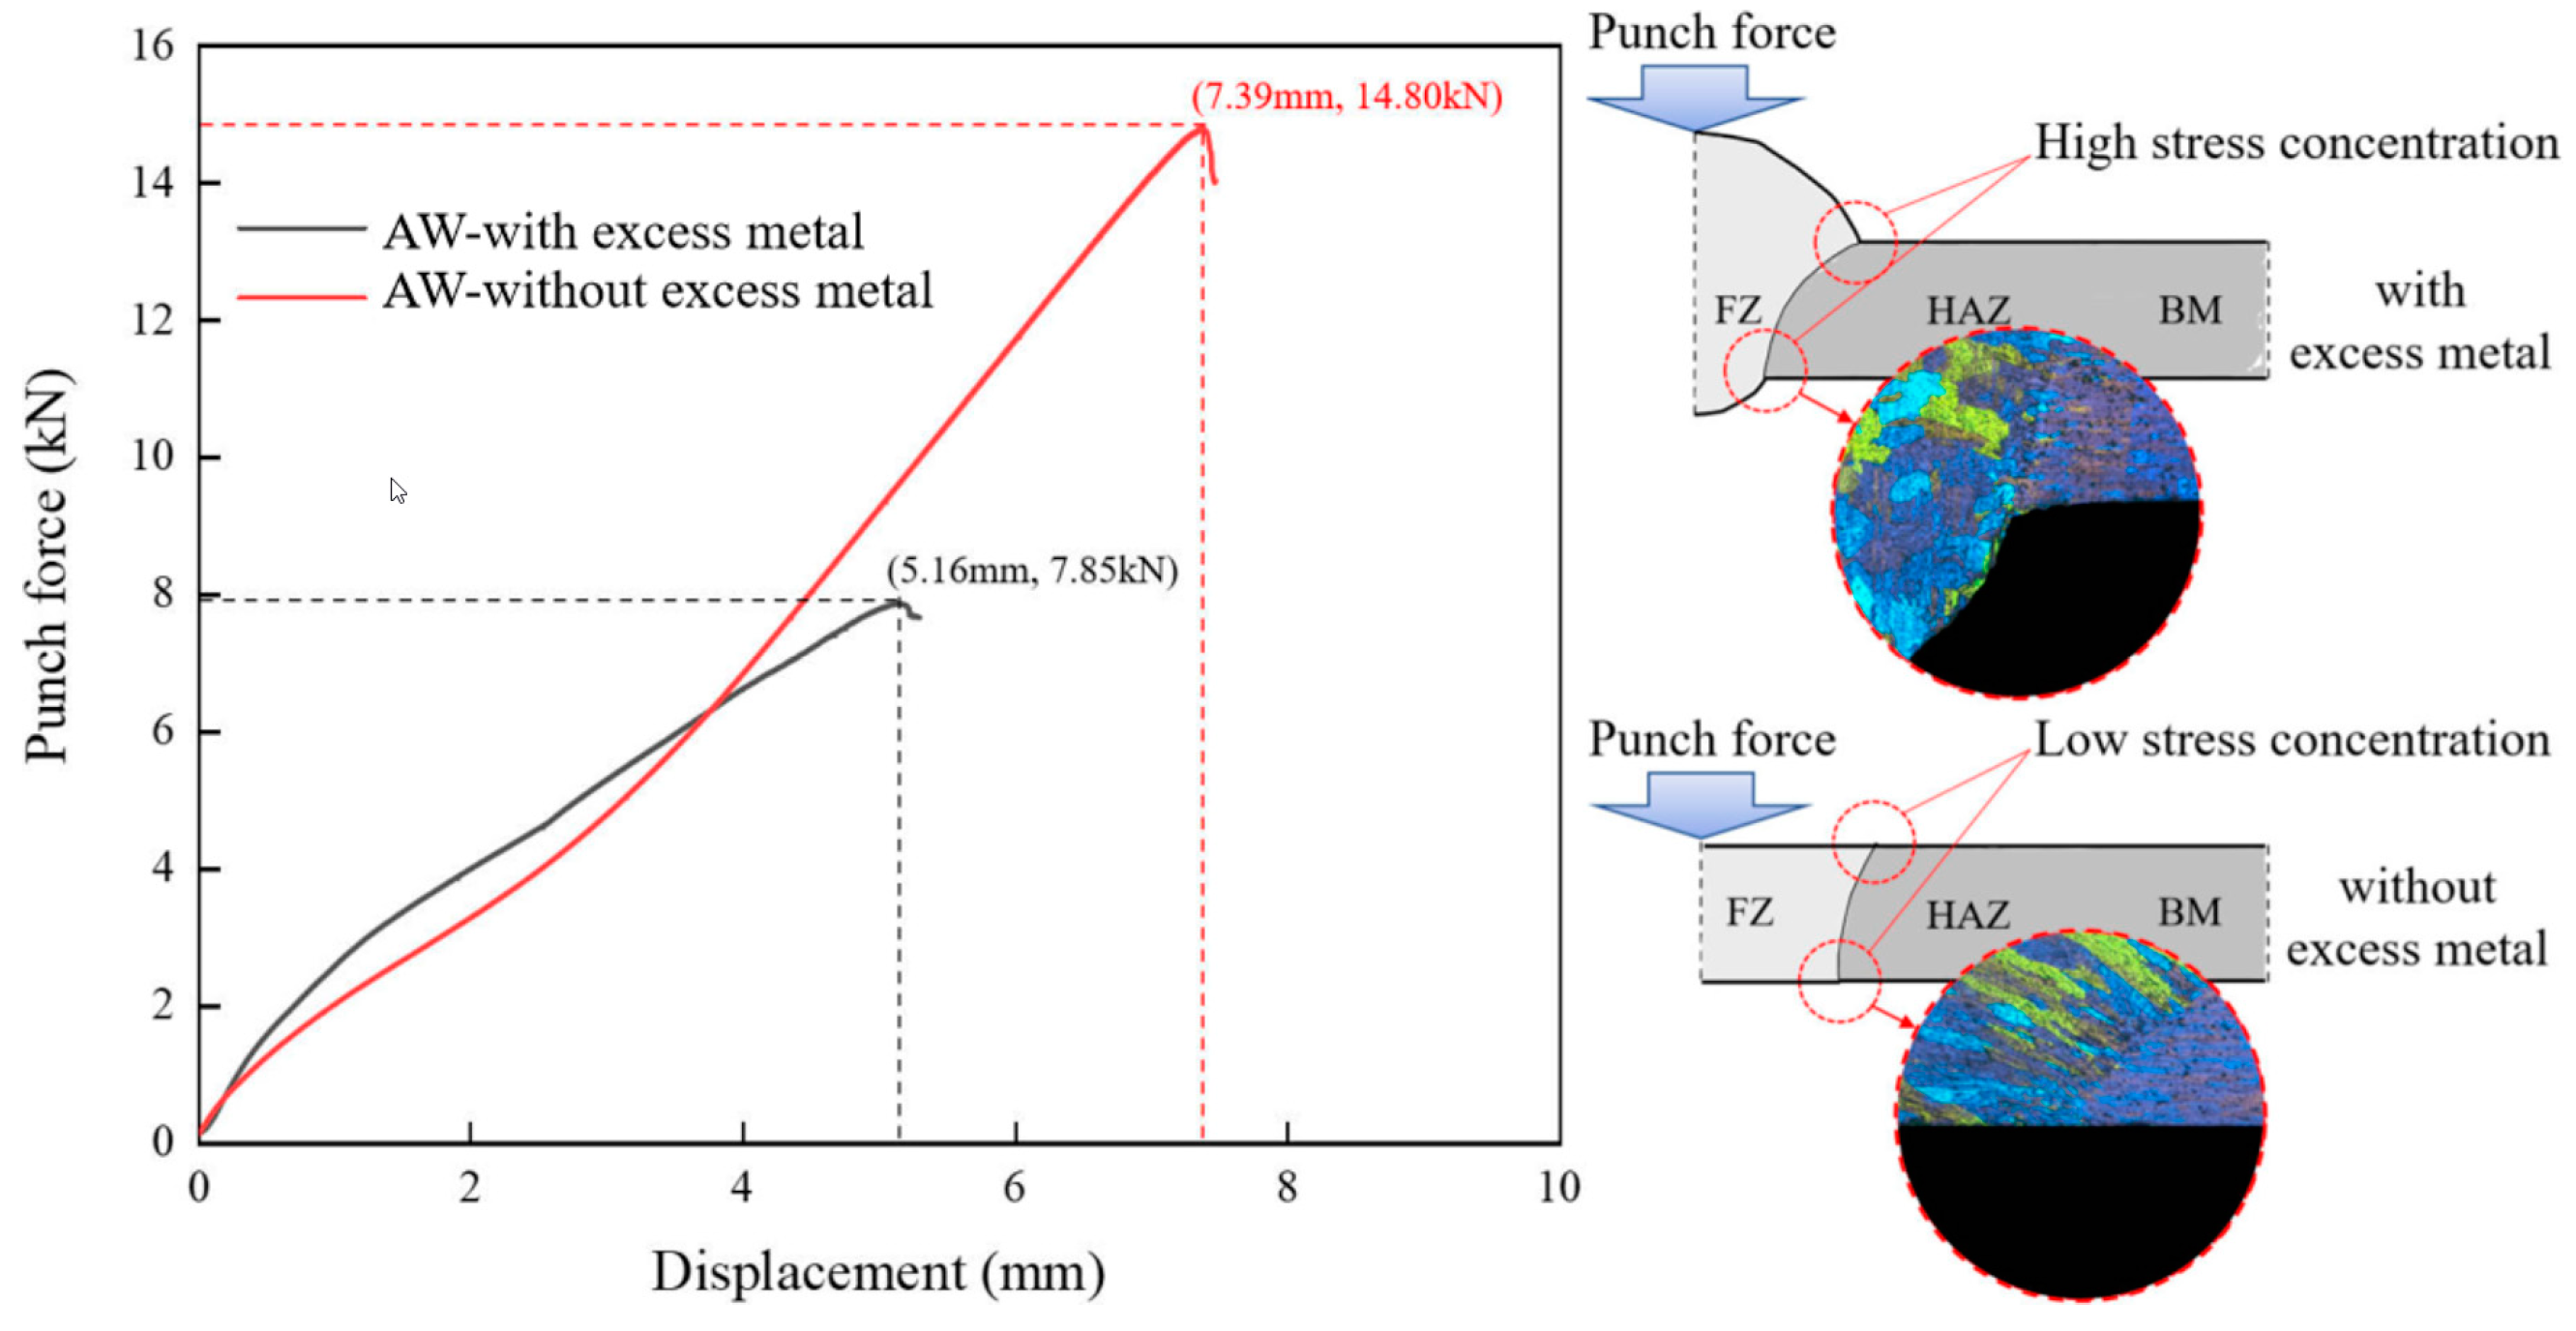
3.4. Forming Performance
4. Discussion
4.1. Mechanical Property Consistency
4.2. Geometric Dimension Consistency
5. Conclusions
- (a)
- The CR process induces work hardening in the FZ and the HAZ. This leads to inconsistent mechanical properties within aluminum alloy joints. However, the CR process eliminates the DP-MIG weld excess metal and promotes overall geometric uniformity in the aluminum alloy TWBs.
- (b)
- The PWCR-SHT process enhances the ductility of the joints, and the hardness and tensile strength of the joint are lower than those of the original BM.
- (c)
- The PWCR-SHT process employs high-density dislocations as the SE, triggering recrystallization behavior in the FZ of the PWCR joints and grain growth in the part of the HAZ.
- (d)
- The forming rate of the PWCR-SHT TWBs is 119% of the BM, resulting from the combined effects of the geometric dimension and the mechanical property consistency.
6. Limitations and Future Works
Author Contributions
Funding
Institutional Review Board Statement
Informed Consent Statement
Data Availability Statement
Acknowledgments
Conflicts of Interest
References
- Kim, K.J.; Lee, J.W. Computational evaluation of automotive camber component for light-weight design. Mater. Werkst. 2023, 54, 423–428. [Google Scholar] [CrossRef]
- Zhang, X.; Dong, P.; Yang, M.; Ma, J.; He, Y.; Zhang, R.; Li, W. Effects of interphase, CNT waviness and temperature on the Young’s modulus of CNT/metal composites. Compos. Struct. 2023, 320, 117182. [Google Scholar] [CrossRef]
- Suvorov, V.; Vasilyev, R.; Melnikov, B.; Kuznetsov, I.; Bahrami, M.R. Weight Reduction of a Ship Crane Truss Structure Made of Composites. Appl. Sci. 2023, 13, 8916. [Google Scholar] [CrossRef]
- Burnett, M.; Kahlmeyer, M.; Koch, C.; Winkel, A.; Böhm, S. Potential of adhesive bonding technology for joining thermo-mechanically modified wood composites in automotive application. Proc. Inst. Mech. Eng. Part D J. Automob. Eng. 2023, 237, 2999–3006. [Google Scholar] [CrossRef]
- Chen, C.; Ouyang, X. Research on the joining of three-layer sheets by flat bottom riveting process. Int. J. Adv. Manuf. Tech. 2023, 127, 459–469. [Google Scholar] [CrossRef]
- Luo, S.; Yang, G.; Lou, Y.; Xu, Y. Prediction of strain path changing effect on forming limits of AA 6111-T4 based on a shear ductile fracture criterion. Metals 2021, 11, 546. [Google Scholar] [CrossRef]
- Czerwinski, F. Current trends in automotive lightweighting strategies and materials. Materials 2021, 14, 6631. [Google Scholar] [CrossRef] [PubMed]
- Bagheri, B.; Abbasi, M.; Hamzeloo, R. Comparison of different welding methods on mechanical properties and formability behaviors of tailor welded blanks (TWB) made from AA6061 alloys. Proc. Inst. Mech. Eng. Part C J. Mech. Eng. Sci. 2021, 235, 2225–2237. [Google Scholar] [CrossRef]
- Parente, M.; Safdarian, R.; Santos, A.D. A study on the formability of aluminum tailor welded blanks produced by friction stir welding. Int. J. Adv. Manuf. Tech. 2016, 83, 2129–2141. [Google Scholar] [CrossRef]
- Xu, X.; Liu, Z.; Zhang, B.; Chen, H.; Zhang, J.; Wang, T.; Zhang, K.; Zhang, J.; Huang, P. Effect of Mn content on microstructure and properties of 6000 series aluminum alloy. Appl. Phys. A-Mater 2019, 125, 490. [Google Scholar] [CrossRef]
- Lalvani, H.; Mandal, P. Cold forming of Al-5251 and Al-6082 tailored welded blanks manufactured by laser and electron beam welding. J. Manuf. Process. 2021, 68, 1615–1636. [Google Scholar] [CrossRef]
- Hu, Y.N.; Wu, S.C.; Chen, L. Review on failure behaviors of fusion welded high-strength Al alloys due to fine equiaxed zone. Eng. Fract. Mech. 2019, 208, 45–71. [Google Scholar] [CrossRef]
- Babu, N.B.K.; Davidson, M.J.; Rao, A.N.; Balasubramanian, K.; Govindaraju, M. Effect of differential heat treatment on the formability of aluminium tailor welded blanks. Mater. Des. 2014, 55, 35–42. [Google Scholar] [CrossRef]
- Liu, W.; Cheng, W.; Xu, Y.; Yuan, S. Enhancing Formability of AA2219 Aluminum Alloy Friction Stir Welded Blanks with Preheating Treatment. J. Mater. Eng. Perform. 2018, 27, 4819–4828. [Google Scholar] [CrossRef]
- Ko, D.H.; Kim, J.H.; Ko, D.C.; Kim, B.M. Improvement of Weldment Properties by Hot Forming Quenching of Friction Stir Welded TWB Sheet. Adv. Mech. Eng. 2014, 6, 257510. [Google Scholar] [CrossRef]
- Cheng, J.; Song, G.; Zhang, Z.; Khan, M.S.; Liu, Z.; Liu, L. Improving heat-affected zone softening of aluminum alloys by in-situ cooling and post-weld rolling. J. Mater. Process. Technol. 2022, 306, 117639. [Google Scholar] [CrossRef]
- Cheng, J.; Zhang, Z.; Dong, X.; Song, G.; Liu, L. A novel post-weld composite treatment process for improving the mechanical properties of AA 6061-T6 aluminum alloy welded joints. J. Manuf. Process. 2022, 82, 15–22. [Google Scholar] [CrossRef]
- Huang, K.; Huang, S.; Yi, Y.; Dong, F.; He, H. Flow behavior and forming characteristics of 2A14 aluminum alloy at cryogenic temperatures. J. Alloys Compd. 2022, 902, 163821. [Google Scholar] [CrossRef]
- Köklü, U. Investigation into the formability of Al-1050 tailor-welded blanks with antilock braking system. Int. J. Adv. Manuf. Technol. 2013, 66, 221–229. [Google Scholar] [CrossRef]
- Kim, J.H.; Lee, C.J.; Lee, S.B.; Ko, D.C.; Kim, B.M. Integrated hot forming and heat treatment process on Al6061 tailor rolled blank. Int. J. Precis. Eng. Manuf. 2017, 18, 127–132. [Google Scholar] [CrossRef]
- Jung, H.; Friedl, K.H.; Hiller, K.A.; Furch, H.; Bernhart, S.; Schmalz, G. Polymerization efficiency of different photocuring units through ceramic discs. Oper. Dent. 2006, 31, 68–77. [Google Scholar] [CrossRef] [PubMed]
- Jasiński, C.; Świłło, S.; Kocańda, A. Application of Two Advanced Vision Methods Based on Structural and Surface Analyses to Detect Defects in the Erichsen Cupping Test. Arch. Metall. Mater. 2019, 64, 1041–1049. [Google Scholar] [CrossRef]
- Wei, H.L.; Elmer, J.W.; DebRoy, T. Origin of grain orientation during solidification of an aluminum alloy. Acta Mater. 2016, 115, 123–131. [Google Scholar] [CrossRef]
- Hadadzadeh, A.; Ghaznavi, M.M.; Kokabi, A.H. HAZ softening behavior of strain-hardened Al-6.7 Mg alloy welded by GMAW and pulsed GMAW processes. Int. J. Adv. Manuf. Technol. 2017, 92, 2255–2265. [Google Scholar] [CrossRef]
- Gnibl, T.; Merklein, M. Material flow control in tailor welded blanks by a combination of heat treatment and warm forming. Cirp Ann.-Manuf. Tech. 2016, 65, 305–308. [Google Scholar] [CrossRef]
- Wang, S.C.; Zhu, Z.; Starink, M.J. Estimation of dislocation densities in cold rolled Al-Mg-Cu-Mn alloys by combination of yield strength data, EBSD and strength models. J. Microsc. 2005, 217, 174–178. [Google Scholar] [CrossRef]
- Hore, S.; Das, S.K.; Banerjee, S.; Mukherjee, S. A multiscale coupled Monte Carlo model to characterize microstructure evolution during hot rolling of Mo-TRIP steel. Acta Mater. 2013, 61, 7251–7259. [Google Scholar] [CrossRef]
- Yadav, P.C.; Sharma, N.K.; Sahu, S.; Shekhar, S. Influence of short heat-treatment on microstructural and mechanical inhomogeneity of constrained groove pressed Cu-Zn alloy. Mater. Chem. Phys. 2019, 238, 121912. [Google Scholar] [CrossRef]
- Edwards, G.A.; Stiller, K.; Dunlop, G.L.; Couper, M.J. The precipitation sequence in Al–Mg–Si alloys. Acta Mater. 1998, 46, 3893–3904. [Google Scholar] [CrossRef]
- Ding, L.; Weng, Y.; Jia, Z.; Zang, R.; Xiang, K.; Liu, Q.; Nagaum, H. Interactive transformation mechanisms of multiple metastable precipitates in a Si-rich Al-Mg-Si alloy. Philos. Mag. 2022, 102, 1602–1627. [Google Scholar] [CrossRef]
- Ramaswamy, A.; Malarvizhi, S.; Balasubramanian, V. Influence of post weld heat treatment on tensile properties of cold metal transfer (CMT) arc welded AA6061-T6 aluminium alloy joints. J. Mech. Behav. Mater. 2019, 28, 135–145. [Google Scholar] [CrossRef]
- Vissers, R.; van Huis, M.V.; Jansen, J.; Zandbergen, H.W.; Marioara, C.D.; Andersen, S.J. The crystal structure of the β′ phase in Al–Mg–Si alloys. Acta Mater. 2007, 55, 3815–3823. [Google Scholar] [CrossRef]
- Andersen, S.J.; Zandbergen, H.W.; Jansen, J.; TrÆholt, C.; Tundal, U.; Reiso, O. The crystal structure of the β″phase in Al–Mg–Si alloys. Acta Mater. 1998, 46, 3283–3298. [Google Scholar] [CrossRef]
- Tang, Z.C.; Xu, W.; Zhao, D.Y.; Zhang, B. Improving the strength and SCC resistance of an Al-5Mg-3Zn alloy with low-angle grain boundary structure. J. Mater. Sci. Technol. 2023, 161, 63–73. [Google Scholar] [CrossRef]
- Hao, Z.; Luo, J.; Jin, Y.; Meng, D.; Zhang, C. Application of pre-deformation rolling in the welding heat-affected zone of tailor-welded blanks formed by deep-drawing process. J. Manuf. Process. 2020, 51, 151–160. [Google Scholar] [CrossRef]
- Bagheri, B.; Sharifi, F.; Abbasi, M.; Abdollahzadeh, A. On the role of input welding parameters on the microstructure and mechanical properties of Al6061-T6 alloy during the friction stir welding: Experimental and numerical investigation. Proc. Inst. Mech. Eng. Part L J. Mater. Des. Appl. 2022, 236, 299–318. [Google Scholar] [CrossRef]


| Materials | Mg | Si | Fe | Cu | Cr | Mn | Zn | Al |
|---|---|---|---|---|---|---|---|---|
| 6061-T6 | 1.10 | 0.62 | 0.42 | 0.26 | 0.19 | 0.08 | 0.01 | Bal |
| ER5356 | 4.90 | 0.05 | 0.12 | 0.01 | 0.12 | 0.12 | 0.01 | Bal |
| Welding Current (I/A) | Base Current (Ib/A) | Peak Current (Ip/A) | Base Time (tb/ms) | Peak Time (tp/ms) | |||
|---|---|---|---|---|---|---|---|
| Low Pulse | High Pulse | Low Pulse | High Pulse | Low Pulse | High Pulse | ||
| 80 | 28 | 310 | 336 | 0.8 | 1.6 | 1.0 | 0.8 |
| Sample | Description |
|---|---|
| AW | As-welded samples with no additional post-weld treatment process. |
| PWCR | As-welded samples were processed by performing one rolling pass over the weld excess metal at room temperature |
| PWSHT | As-welded samples were solution-treated at 520 °C for 1.5 h and water-quenched. |
| PWCR-SHT | PWCR samples were solution-treated at 520 °C for 1.5 h and water-quenched. |
Disclaimer/Publisher’s Note: The statements, opinions and data contained in all publications are solely those of the individual author(s) and contributor(s) and not of MDPI and/or the editor(s). MDPI and/or the editor(s) disclaim responsibility for any injury to people or property resulting from any ideas, methods, instructions or products referred to in the content. |
© 2024 by the authors. Licensee MDPI, Basel, Switzerland. This article is an open access article distributed under the terms and conditions of the Creative Commons Attribution (CC BY) license (https://creativecommons.org/licenses/by/4.0/).
Share and Cite
Dong, X.; Song, G.; Liu, L. Microstructure Evolution and Forming Characteristics of Post-Weld Composite Treatment of 6061 Aluminum Alloy Tailor Welded Blanks. Appl. Sci. 2024, 14, 8998. https://doi.org/10.3390/app14198998
Dong X, Song G, Liu L. Microstructure Evolution and Forming Characteristics of Post-Weld Composite Treatment of 6061 Aluminum Alloy Tailor Welded Blanks. Applied Sciences. 2024; 14(19):8998. https://doi.org/10.3390/app14198998
Chicago/Turabian StyleDong, Xiaonan, Gang Song, and Liming Liu. 2024. "Microstructure Evolution and Forming Characteristics of Post-Weld Composite Treatment of 6061 Aluminum Alloy Tailor Welded Blanks" Applied Sciences 14, no. 19: 8998. https://doi.org/10.3390/app14198998