Abstract
To ensure the operational safety of the automatic couplers of a rolling stock subjected to cyclic loading, reliability and residual service life must be determined. This paper involved the prediction of the durability of the automatic coupler SA3 by analytical summation of cyclic damage. During the investigation, the cyclic characteristics and damage modes of the automatic coupler material that influence the accumulation of damage are determined. The stress and strain state assessment model was developed using a 3D finite element method for the automatic coupler housing as a geometrically complex component. A methodology was used to assess damage per load cycle that is applicable to any sequence of automatic coupler load cycles. For this purpose, the authors used low-cycle stationary load dependencies that account for quasi-static and low-cycle fatigue damage. The investigation showed that a coupler may develop a crack due to accumulated quasi-static and fatigue damage. For damage summation, the dependences of low-cycle stationary stress-controlled load accounting for low-cycle, quasi-static fatigue damage are proposed in view of the variation of the load on the automatic coupler during operation depending on the weight of the rolling stock, velocity, and railway relief. The proposed methodology is applicable to the calculation of other housings under similar loading conditions.
1. Introduction
Railways are one of the modes of transport for critical freight and passengers. Wagons and locomotives are connected using specially designed traction devices that maintain a fixed distance between the former and transmit and mitigate the effects of longitudinal (tensile and compressive) forces. Until 1934, screw couplings were used to connect wagons and locomotives. However, screw couplings were associated with multiple risks, including insufficient strength and a hazard to the railway worker who had to crawl between the wagons when coupling and uncoupling them. The coupling process was also slowed down by maneuvering due to the need for precise alignment of the axles of devices. Automatic couplers have eliminated the disadvantages of screw couplings. Since 1935, the Russian-type automatic coupler was adopted across Eastern Europe. Automatic couplers have provided less time-intensive coupling and uncoupling operations and increased freight and passenger train safety (Figure 1) [1,2].
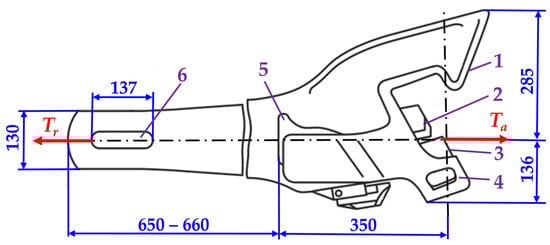
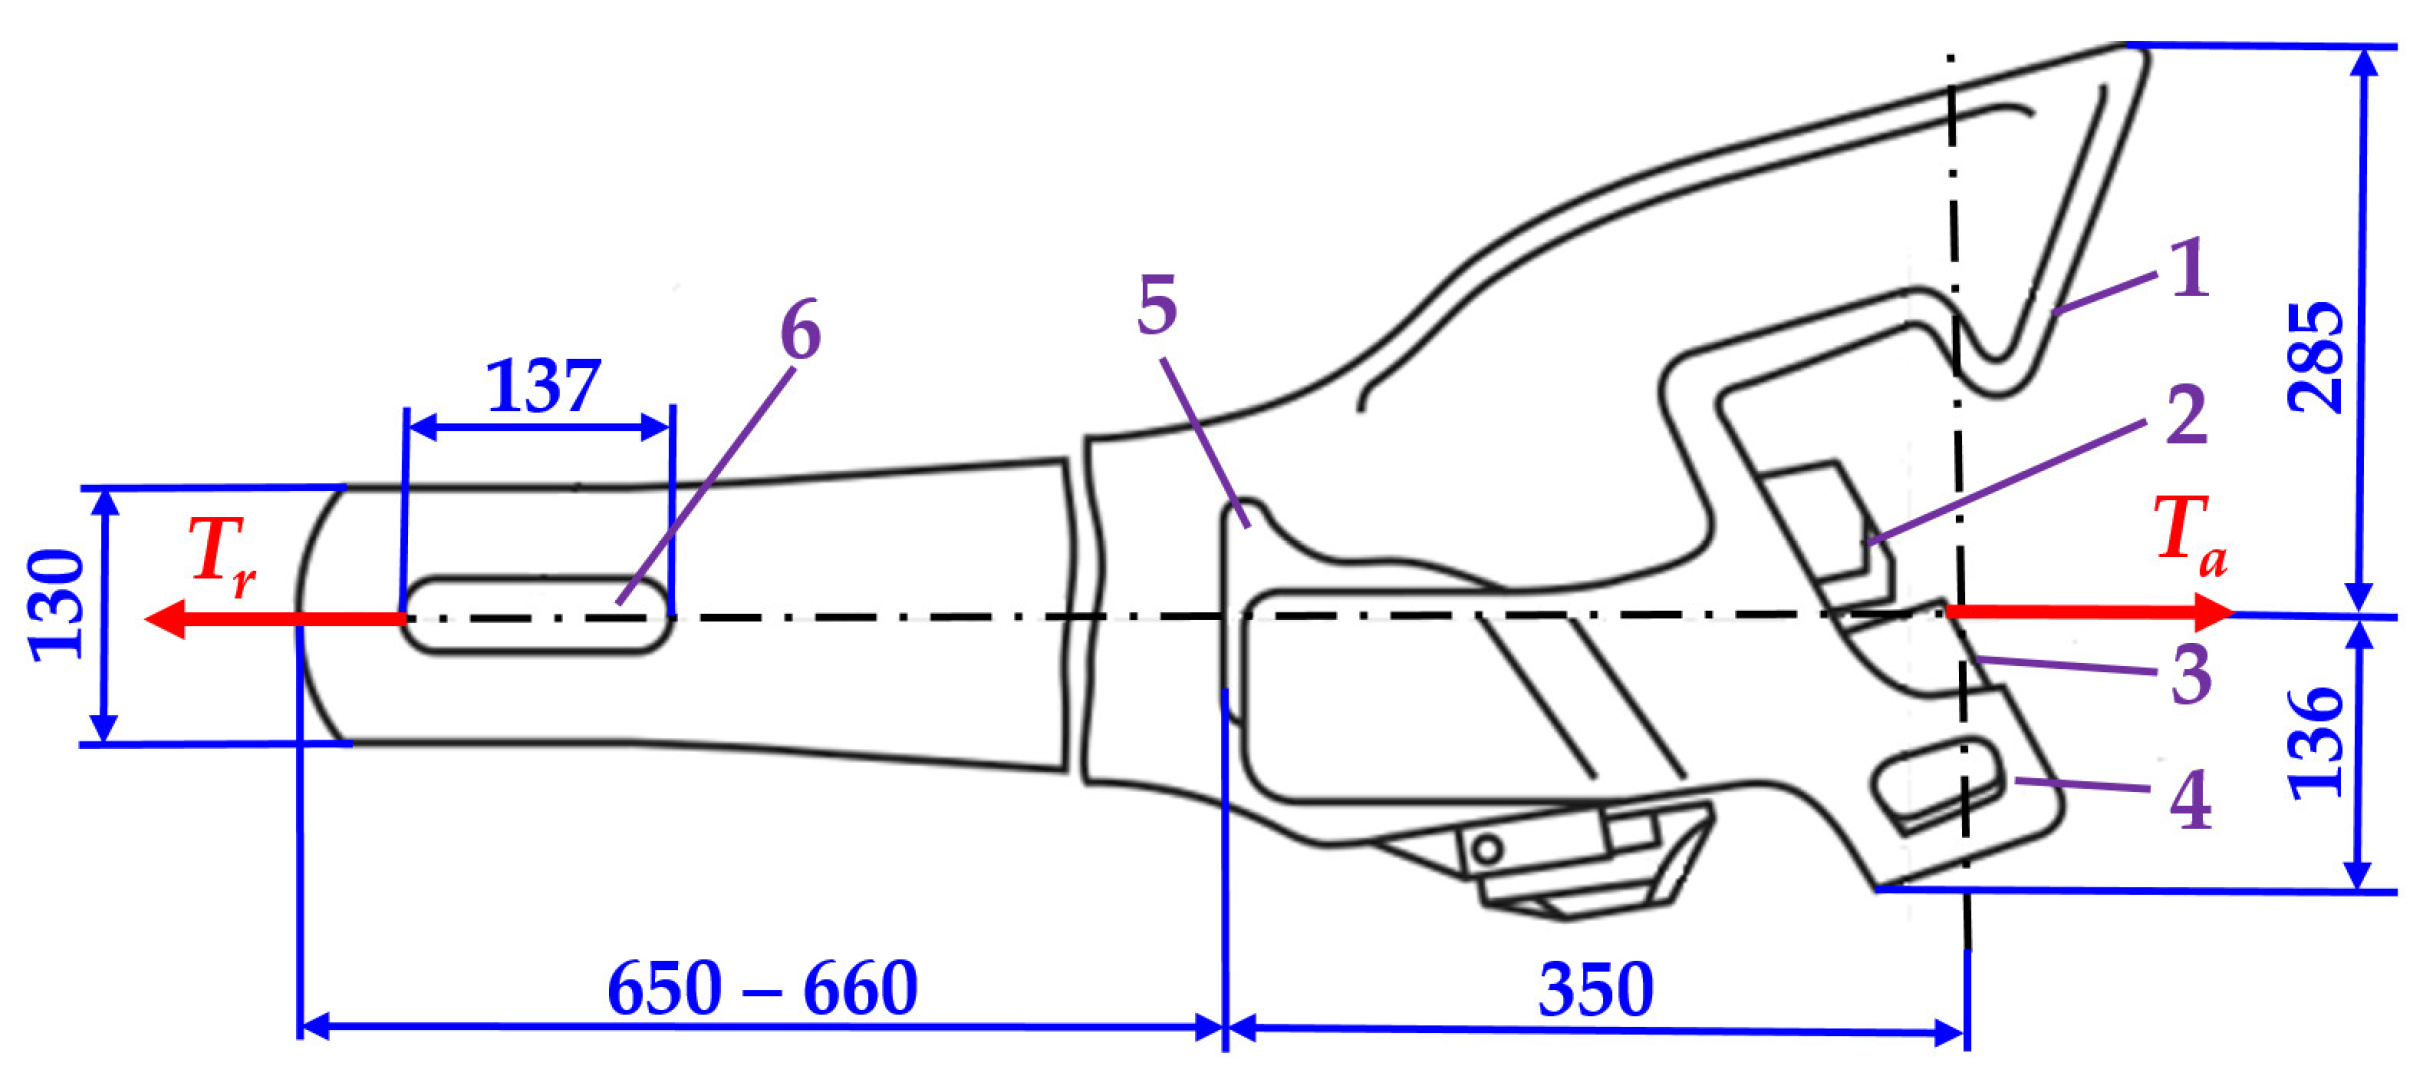
Figure 1.
General view of an automatic coupler type SA3: main parts, dimensions (units in mm), and action–reaction forces T (the housing is a hollow casting consisting of a head subjected by tensile force and fixed tail 6. The head has big tooth 1 and little tooth 4, which come together to form the gills. The lock mechanism part 3 and the lock holder 2 extend from the gills. The front part of the housing has a support 5 for transmitting compression forces to the wagon body frame in the event of deformation of the fully damping apparatus and coupling device).
However, with increasing rolling stock power and speed, loads may reach levels where stress values may exceed the proportionality limit of the material in the event of improper operation. This is acceptable if it happens only a few times during the service life. However, in the case of elastic–plastic strain, frequent overloading may cause low cycle fatigue [3,4,5].
With increasing equipment power and speed, the actual stress values occasionally exceed the proportionality limit of the material. Under the action of random intensive loads, equipment elements and structures fail due to fatigue damage of various types. The accumulated damage develops as a result of high-cycle and low-cycle fatigue associated with cyclic overload, which causes plastic strain [6,7].
Usually, the stress and strain fields are distributed unevenly in the parts. In the concentration zones, the stresses exceed the proportionality limit of the material. Only an approximate prediction of stress distribution of the unique structures that make up a spatial body is possible using analytical methods. However, inaccuracies of this kind related to responsible parts may lead to accidents, while excessive safety factors increase the weight of the structure and consumption of the material. It is therefore reasonable to use more accurate numerical methods to determine the stress and strain distribution in complex structures [8].
An automatic coupler of a rolling stock is a typical example of such a loading case. The automatic coupler of a rolling stock is a crucial part of determining passenger, freight, and environmental safety. Material is an important factor in the calculation of the durability of the coupler. Prior to the investigation of the remaining service life of the coupler before the macro-crack initiation, the stress–strain state must be calculated. However, stresses are calculated using analytical formulae, where changes to the geometric shape are evaluated using stress concentration factors. Given the complexity of the design of an automatic coupler, certain calculation errors may be assumed [9,10].
The failure statistics for automatic couplers on the railway rolling stock have suggested that the failure of automatic couplers usually tends to occur at the transition between the head and the tail [11,12]. The authors of the papers referred to above propose increasing the low-cycle fatigue resistance of the automatic coupler by selecting materials with higher yield strength or with higher plasticity (by increasing ). This method involves an alteration in the chemical composition of the material, i.e., it is based on the choice of steel grade and heat treatment. One work [11] proposes a damage accumulation model for an automatic coupler tail using the damage linear summation hypothesis for low-cycle fatigue. For practical damage summation, an equation treating elastic and plastic damage separately is proposed:
Under the respective conditions (heavy cargo, frequent shunting, track unevenness, etc.), the automatic coupler housing develops stresses that exceed the proportionality limit of the material. This is usually caused by random overloading [13].
It is imperative that historical load data for the automatic coupler is available for the identification of the possible damage to the automatic coupler and determination of the remaining service life. In ref. [1], researchers use statistical data available for the rolling stock fleets to determine the load levels and frequencies. The force acting on the automatic coupler was measured during the operation. Further calculations are carried out in the studies above for the full range of operating forces developing during the operation of the automatic coupler over a year, as shown in Table 1 [1].

Table 1.
Traction force T.
In an American-type automatic coupler, the strain is measured at respective points during the carriage of coal on a defined railway section [14]. Measurements were made for full versus empty rolling stocks. The distribution of stress levels and cycles obtained was generalized as a linear summation was used, not accounting for the effects of history and consistency. Tensile test results for steels used for automatic couplers have already been presented in other works. The mechanical characteristics obtained are yield strength MPa and strength limit MPa. Steel properties are determined based on the set of chemical elements, and Table 2 summarizes the results of the chemical analysis of an automatic coupler [14].
Table 2.
Chemical composition of the steel of an automatic coupler.
In ref. [14], fatigue curves were obtained in the experiment referring to the cycle asymmetry coefficient and the constant load amplitude. The fatigue damage was calculated using Miner’s linear dependence:
where Nri was determined using the Goodman diagram [15] for the corresponding loading case. The Goodman diagram was used to recalculate conditional stresses using an experimental curve with the coefficient of asymmetry .
The high density of micropores in the material of the automatic coupler housing is considered an important factor. Micropores are mainly distributed at the edges of the cuts, particularly in the defect areas. This microporosity may be a key factor in lower fatigue resistance. In ref. [16], the defects were quantified using a computer technique. As the pores of the casting are very irregular in shape, it was simplified for the modeling. The aim was to affect the location and size of the pair so that, despite the irregularity of their shape, the pair was idealized into a sphere with an appropriate diameter. The computational results showed that the closer the pair is to the surface of the body, the higher the stress concentration. If the pair crosses the outer surface, it produces the highest stress concentrations. The results also show that the size of the pore has a significant effect on the stress concentration, regardless of how close the pore is to the surface [16].
Researchers [17] have demonstrated the influence of the mechanical and cyclic characteristics of different steels on the durability of automatic couplers. The parameters (see Section 3) for damage summation were obtained from experimental diagrams of elastic–plastic cyclic deformation (Table 3). Alteration of the mechanical characteristics of the material is viewed as the key factor for increasing the durability of an automatic coupler. Structural modifications that could reduce stress concentration are not employed in the literature reviewed.
Table 3.
Low-cycle loading diagram parameters for steels.
All the steels investigated were found to belong to the class of cyclically stable materials with weakly anisotropic properties in the normal state and to the class of cyclically softening anisotropic materials after quenching and tempering. A comparison of the low-cycle fatigue curves has demonstrated that an increase in the mechanical strength characteristics of steel results in a significant enhancement in durability. The durability of heat-treated (20GL—quenched and tempered) steel specimens increases almost tenfold compared to normalization alone.
One paper [18] describes a method for assessing the service life of automatic couplers according to the vulnerability deformation criteria of metal structures. The proposed method is based on a combination of software packages for the simulation of longitudinal dynamics and the assessment of static and dynamic stresses—in this case, those occurring in the couplings. The analysis of the coupling life, based on the results of these study phases, was carried out by means of methods and programs for the assessment of fatigue vulnerability and the determination of the safe life.
The study presented in ref. [19] evaluates the remaining service life of cast steel heavy-duty railway truck couplings with initial defects. A test program was carried out to determine high-cycle fatigue strength, fatigue crack growth rate, threshold, and fracture toughness. A numerical model of the damaged heavy-duty tractor coupling was developed, taking full account of the assembly gap and the complex non-linear contact. The remaining life was then determined using fracture mechanics methods for the actual load spectrum.
In many research papers, the strength and reliability of automatic couplers have been addressed by stress–strain state computations using the finite element method. However, the strength of the automatic coupler is assessed by calculation using a linear damage summation according to the fatigue curve, without distinguishing between the low-cycle quasi-static fatigue as well as high-cycle damage. This kind of calculation fails to account for changes in the stress and strain state or offer a quantitative evaluation of different types of damage. In addition, the investigations reviewed used the Goodman diagram for durability assessment, while the former is only applicable to the high-cycle fatigue region. Hence, the application of the Goodman diagram to the low-cycle fatigue region is questionable, particularly in the presence of quasi-static damage.
The contributions of this paper are presented as follows:
(1) The cyclic properties of the automatic coupling material and the damage behavior that has an effect on the accumulation of damage were determined; (2) a method for automatic coupling damage summation is proposed, using the stationary load dependencies, taking into account quasi-static and low-cycle fatigue damage; (3) the automatic coupler damage to fatigue crack initiation is calculated; (4) a methodology for assessing a single load cycle to assess damage to any sequence of automatic coupling load cycles is proposed.
To carry out this work, the following tasks were performed:
- Section 2 describes the methodology for static and low-cycle fatigue experiments and presents the results of these investigations;
- Section 3 examines the methodology for the summation of the damage accumulated in the automatic coupler. The low-cycle fatigue and quasi-static damage caused by a single loading cycle are determined in view of the loading level.
- The results obtained and conclusions presented are discussed in Section 4.
2. Materials and Methods
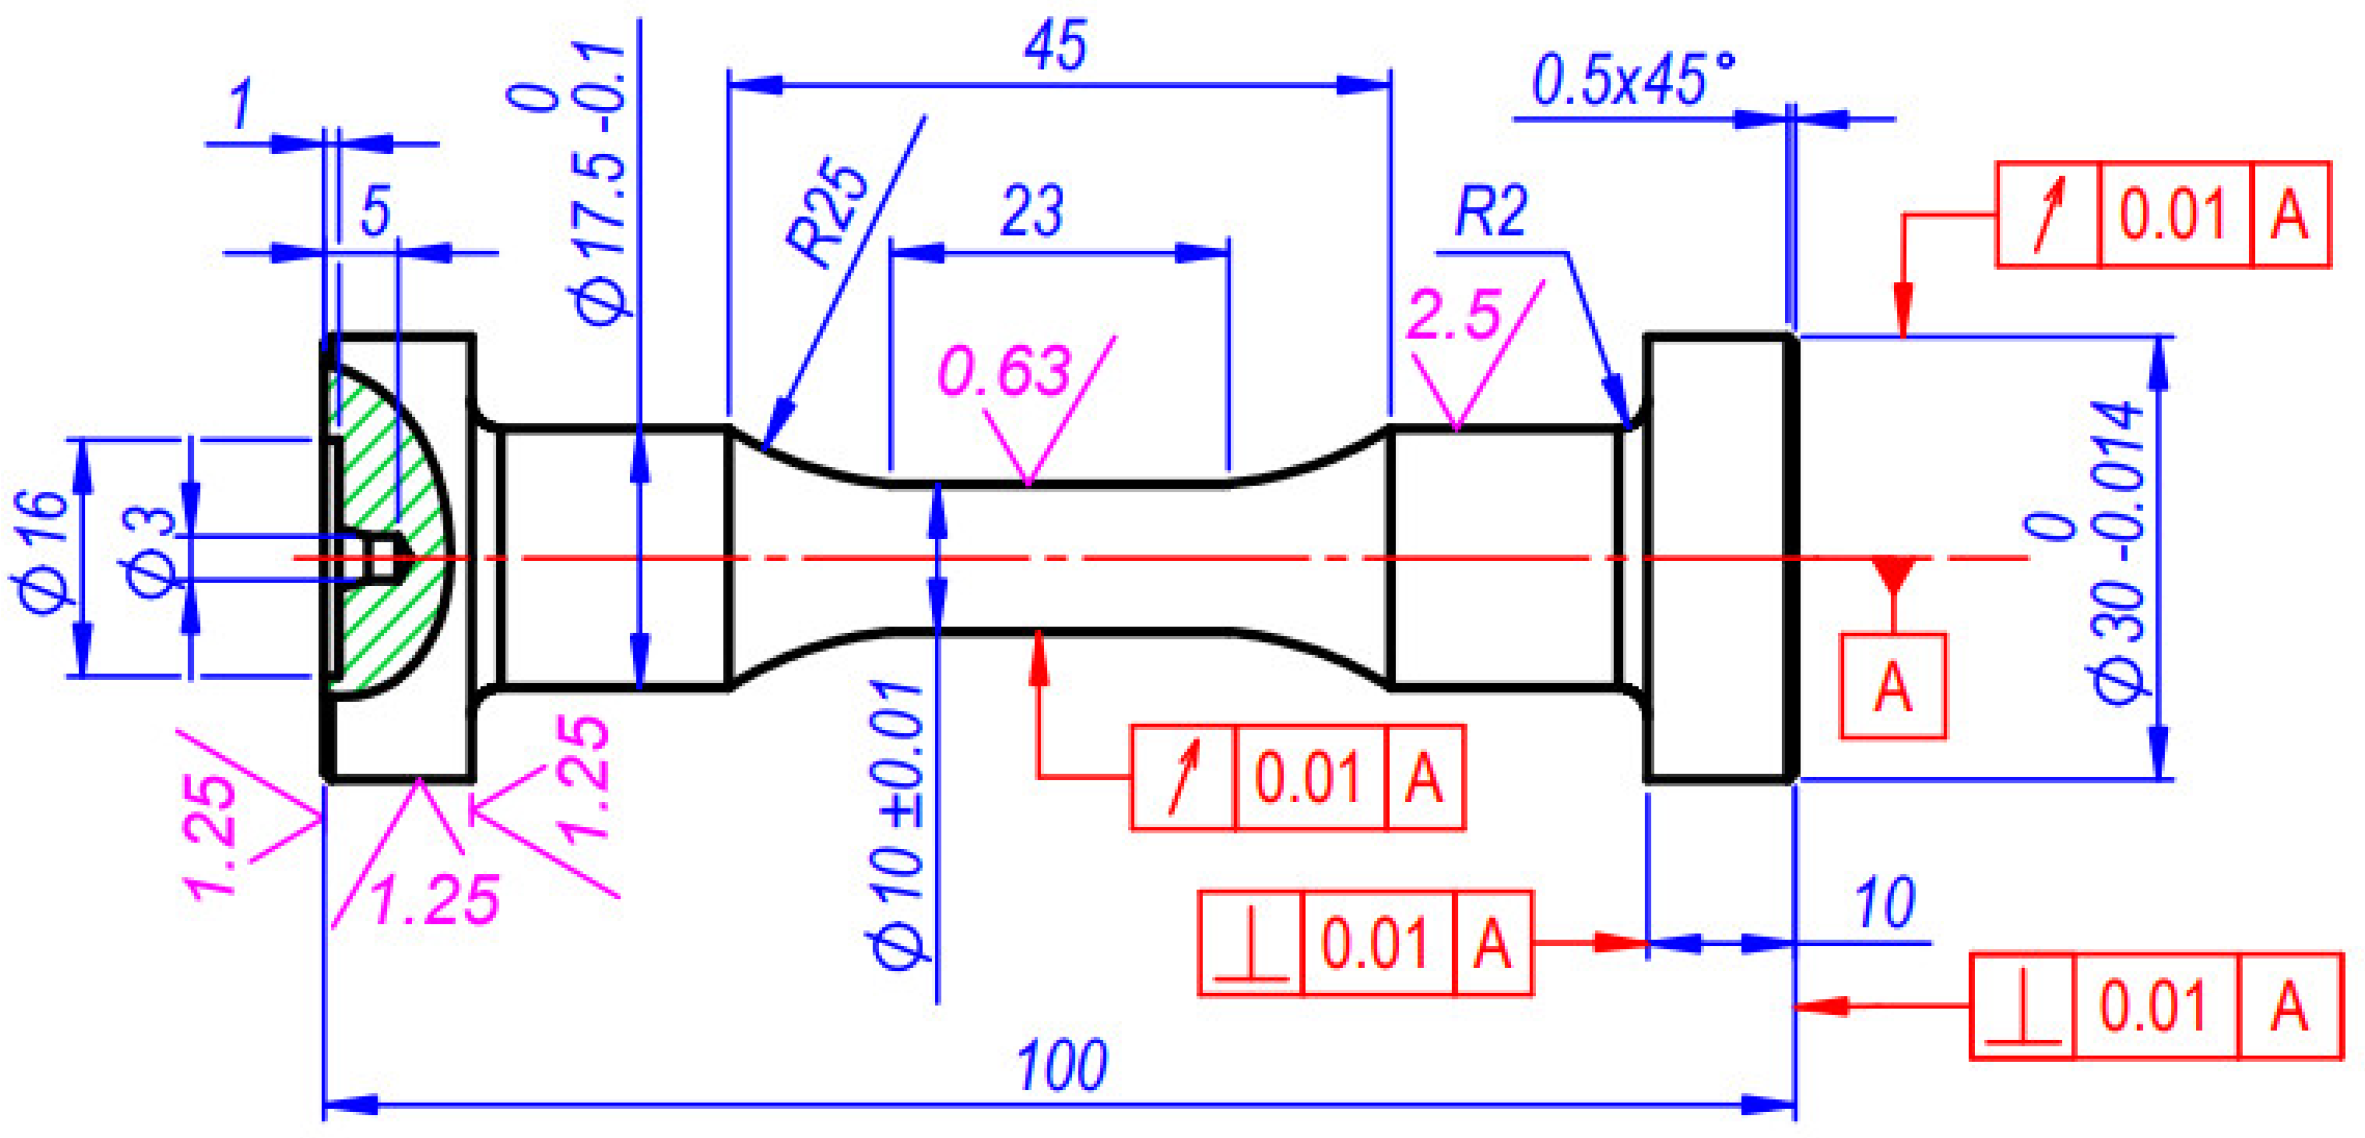
The experimental test rig included a 50 kN UMM 5T low-cycle tension–compression test machine (Kaunas University of Technology, Kaunas, Lithuania). The standard used for fatigue tests was ref. [20], and the statistical characteristics were calculated according to ref. [21]. Static and cyclic experiments used cylindrical deformable samples with a length of 23 mm and a diameter of 10 mm. Figure 2 presents a detailed drawing.
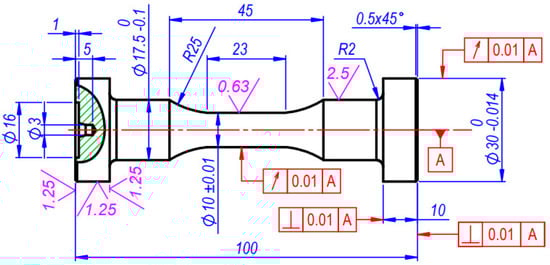
Figure 2.
Test specimens for experiments (units in mm).
In this work, a low-cycle tensile–compressive load was applied. This loading method differs from other loading methods (torsion, bending), as the first is characterized by the homogeneity of the strain across the entire cross-section of the working part. The results of the properties of the tests fully reflect the material despite the stringent requirements with respect to the centering of the precision of the clamps of the specimen in the loading machine to prevent the specimen from buckling under compression. Furthermore, static tensile loading tests were performed, allowing for an easy comparison of the data provided by these tests with the data obtained from low-cycle fatigue tests. Restraining stresses (stress-controlled loading) lead to the accumulation of strain. Furthermore, the following cyclic properties of the material become evident under load: softening, hardening, or stability.
Low-cycle load charts were recorded for stress-controlled () and strain-controlled () types of load. The elastic–plastic cyclic strain in the half-cycle is generally characterized by cyclic stress , loop width , and accumulated unilateral plastic strain . The variation of the accumulated unilateral plastic strain was recorded during the stress-controlled low-cycle load. During strain-controlled loading, strain was restrained and the variation of cyclic stress was recorded. Its value fell within and the registration technique was carried out within the same half-cycles k as in the case of stress-controlled loading (Figure A1).
For strain-controlled loading, where the constant value is strain amplitude , the values of cyclic stress change with the increase in the number of half-cycles k. The above values were recorded in the following half-cycles: k = 0, 2, 4, 6, 8, 10, 20, 40, 60, 80, 100, 200, 400, 600, 800, 1000, 2000, 4000, 6000, 8000, 10,000, etc. During the elastic plastic loading, the material is subjected to deformation above the limit of proportionality ; i.e., as the plastic strain increases, the low-cycle deformation diagram changes during the loading as well. It is therefore important to have a diagram of the elastic–plastic strain for each half-cycle of the material and to establish a low-cycle fatigue curve.
In the case of stress-controlled loading, the stresses defined by values and were restrained. The variation of the strain loop width influencing the accumulated unilateral plastic strain was registered. The loading in the initial (k = 0) half-cycle is characterized by stress and strain . Loading in the first half-cycle at a compressive stress exceeding the cyclic limit of proportionality enables plastic strain. Loading in the second and subsequent half-cycles is accompanied by the formation of elastic–plastic hysteresis loops with varying values [6,7,22].
Static and Low-Cycle Results for the Automatic Coupler Steel
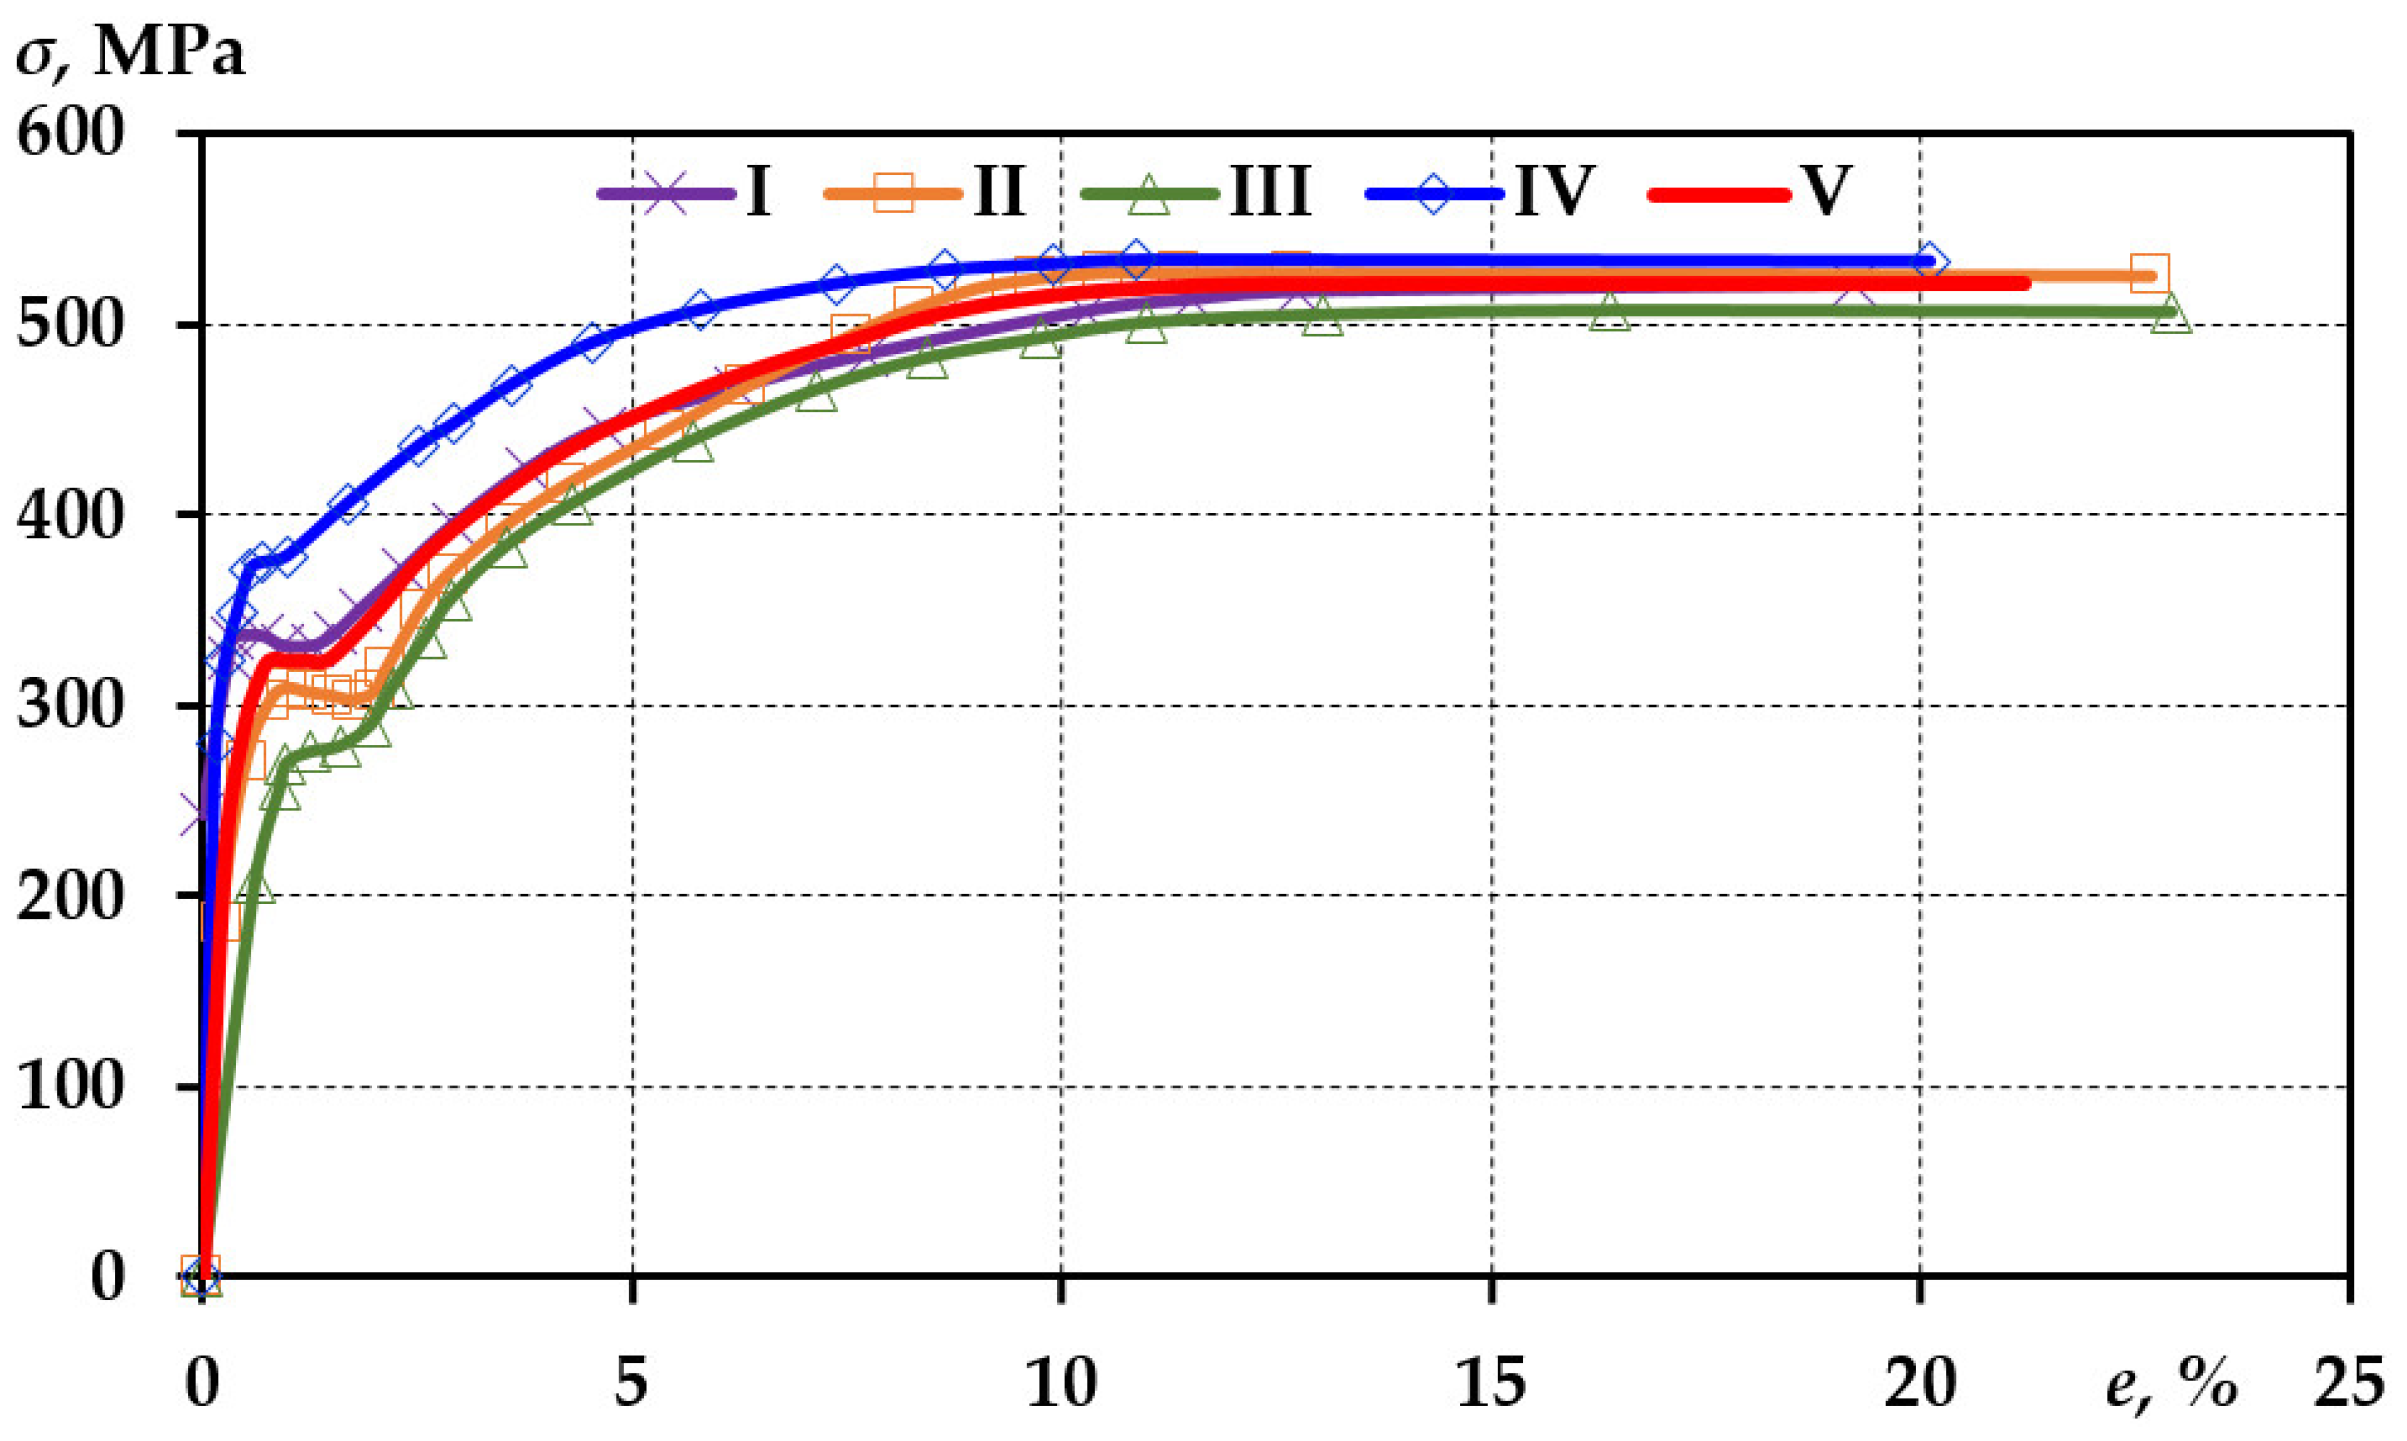
The recorded static tension curve was used for reference to produce the static strain (tensile) diagram (Figure 3). The diagram shall be produced considering both the strain e () and stress σ ( scales.
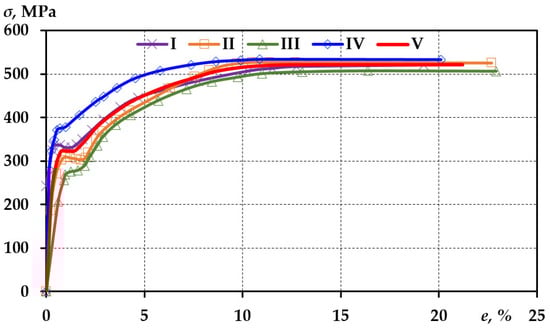
Figure 3.
Tensile diagram of steel 20GL; I—first specimen, II—second specimen, III—third specimen, IV—fourth specimen, V—mean value.
The mean arithmetic value , statistical distribution standard deviation , and coefficient of variation were calculated for the normal distribution law using the equation below [21]:
The obtained mechanical characteristics of steel 20GL and the results of the calculations are shown in Table 4.
Table 4.
Mechanical characteristics of steel 20GL.
Failure is influenced by various metallographic or geometric defects in the structure. The main internal defects and heterogeneities in the microstructure of metals occur during the metallurgical and heat treatment processes. Surface defects (surface roughness, hardening), which occur during the production of the specimens and are of a statistical nature, are also highly important. Some errors are due to non-uniform test conditions. All of the above errors are specific to a single batch of metal. For a metal of the same grade but different batches, the dispersion of properties between batches will be even greater due to the dispersion of the chemical composition and metallurgical process conditions of the different batches. All factors discussed above influence the dispersion of both static and cyclic material characteristics.
The automatic coupler of a rolling stock is subjected to cyclic loading, that is, when the stresses in the cross-section of the part vary periodically from to . Therefore, material tests were also carried out on the specimen under symmetric and asymmetric loads. The low-cycle loading was chosen for the investigation of the cyclic properties of the material since the automatic couplers of a rolling stock are subjected to variable forces and, as shown above, produce stresses that exceed the proportionality limit.
Two types of load cycles were chosen for the low-cycle fatigue study, asymmetric (pulsating cycle, ) and symmetric (reversed cycle ), because the automatic coupler operates under asymmetric load, while the symmetrical load cycle gives a better indication of the cyclic strain parameters of the material, which is needed for the calculation of the damage caused by low-cycle strain.
In this investigation, the strain scale and the stress scale were determined for the low-cycle stress-controlled load. For strain-controlled loading, the strain scale and the stress scale . Under stress-controlled loading, the strain is unconstrained and free to develop; therefore, the mode of failure depends on the level of loading. The fatigue curves (Figure 4) show that there were three failure zones.
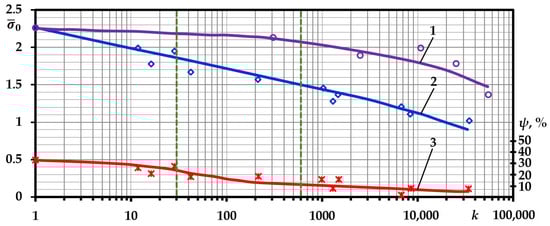
Figure 4.
Stress-controlled loading low-cycle fatigue curves for steel 20GL (1—, symmetric cycle; 2—, asymmetric cycle; 3—, symmetric cycle).
The quasi-static failure zone is characteristic of high stress levels. The quasi-static failure zone extends up to , where an intense accumulation of unilateral plastic strain takes place and the specimen failure occurs at the neck. The location of the zones is seen more clearly by looking at the variation of reduction of area ψ. The fatigue fracture zone starts with , since the accumulation of unilateral plastic strain is lower in this zone. The transient zone extends from to . Here, the failure is due both to the formation of the neck and to fatigue.
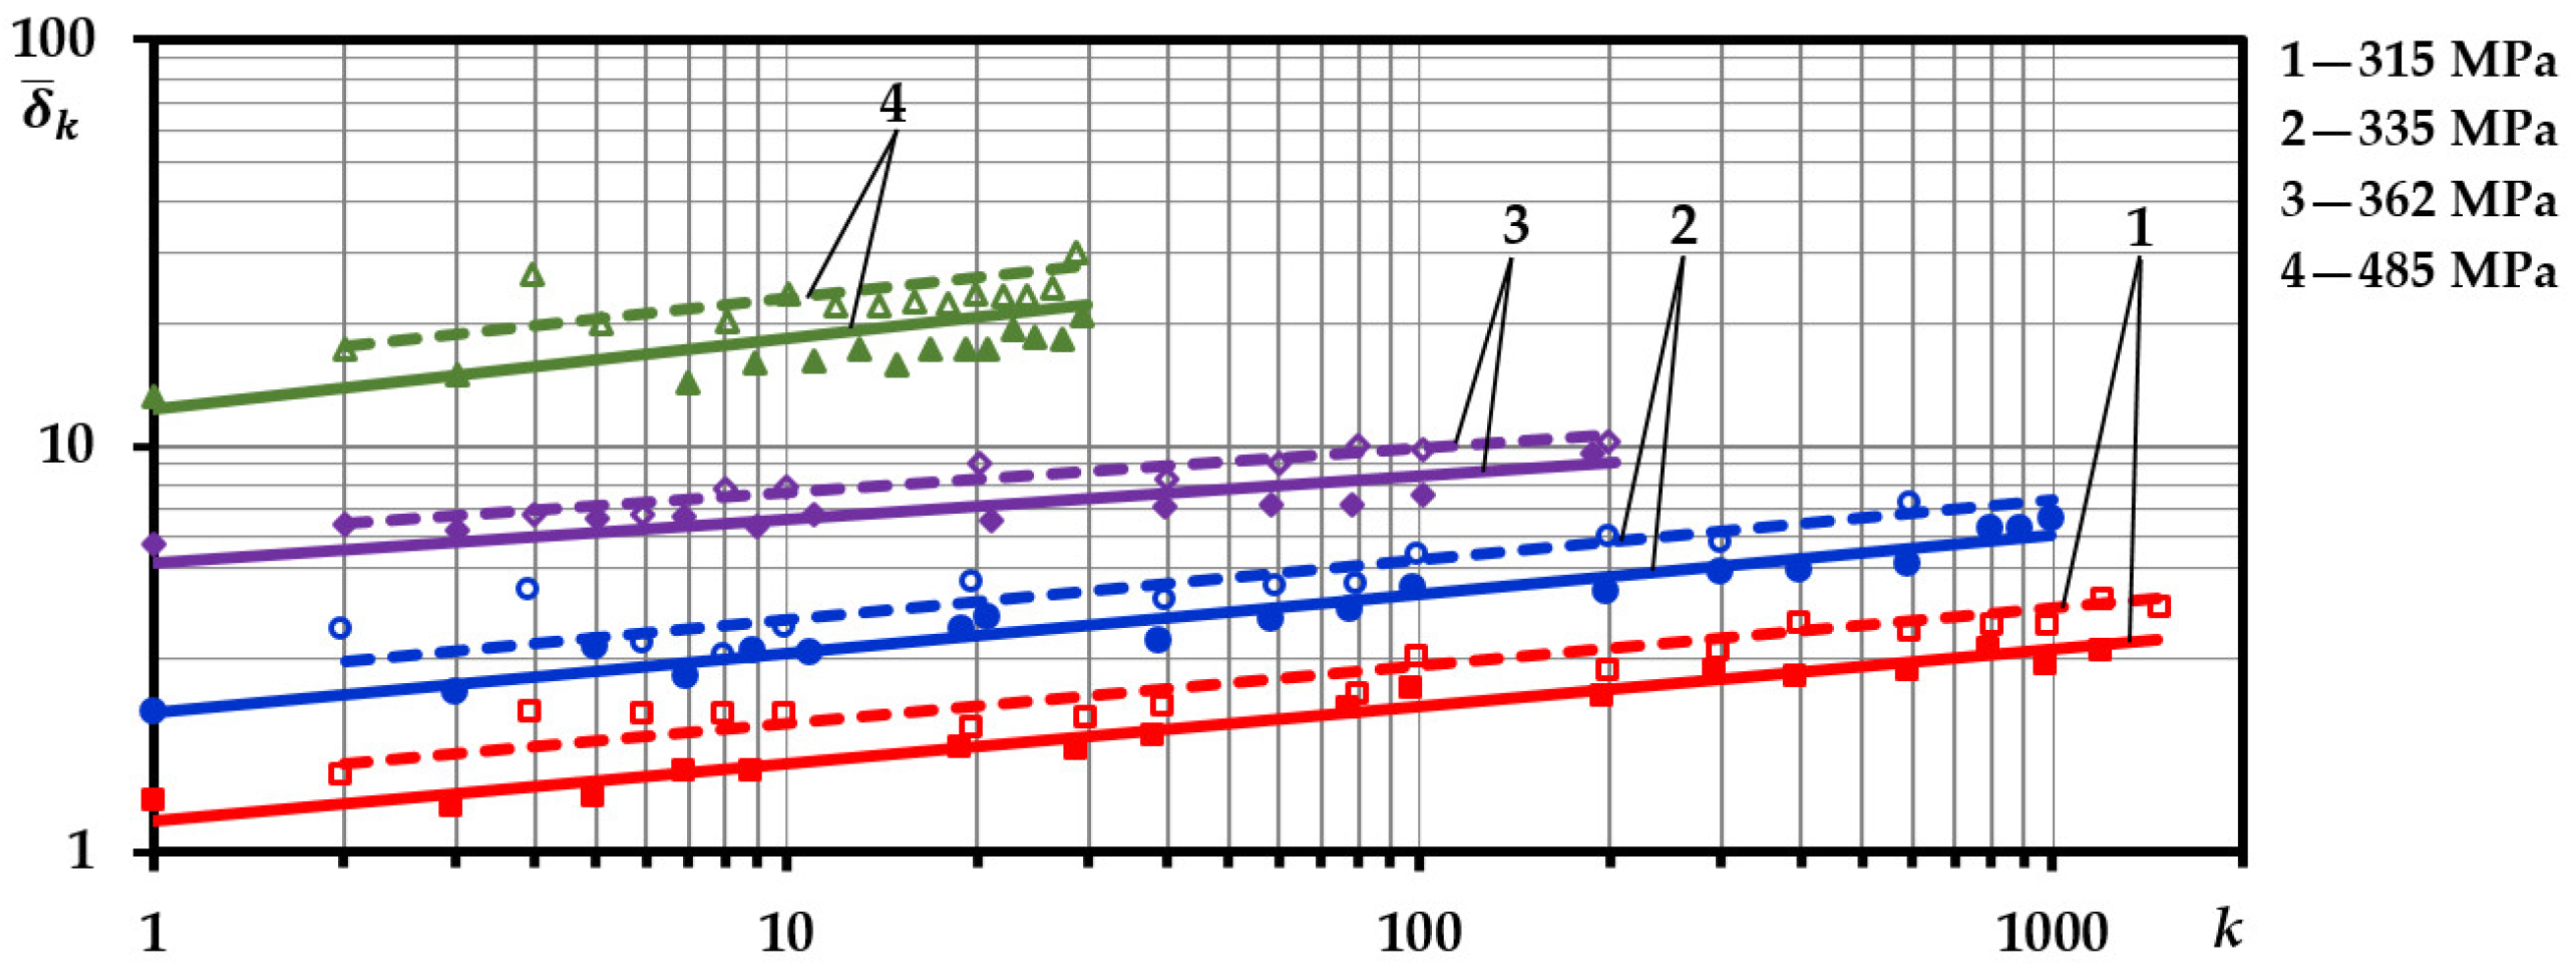
Figure 5 shows that the material tested is cyclically softening, i.e., the loop width is increasing under stress-controlled loading. This is typical for low-carbon alloy steel. The dependence was used to analytically describe the cyclic strain diagrams [22,23,24]:

Figure 5.
Dependence of hysteresis loop width on the number of half-cycles and load level (dashed lines for corresponding levels of even half-cycles , continuous lines for corresponding levels of odd half-cycles ).
The cyclic material characteristics are considered in relative coordinates, which are obtained by dividing the stresses by and strain by .
The investigations have shown that the cyclic limit of proportionality and the cyclic strain parameters, characterizing the widths of the plastic strain hysteresis loops of the first and second half-cycles are and , respectively, and the coefficient of cyclic softening, showing the variation of the hysteresis loop depending on the number of loading half-cycles, , is .
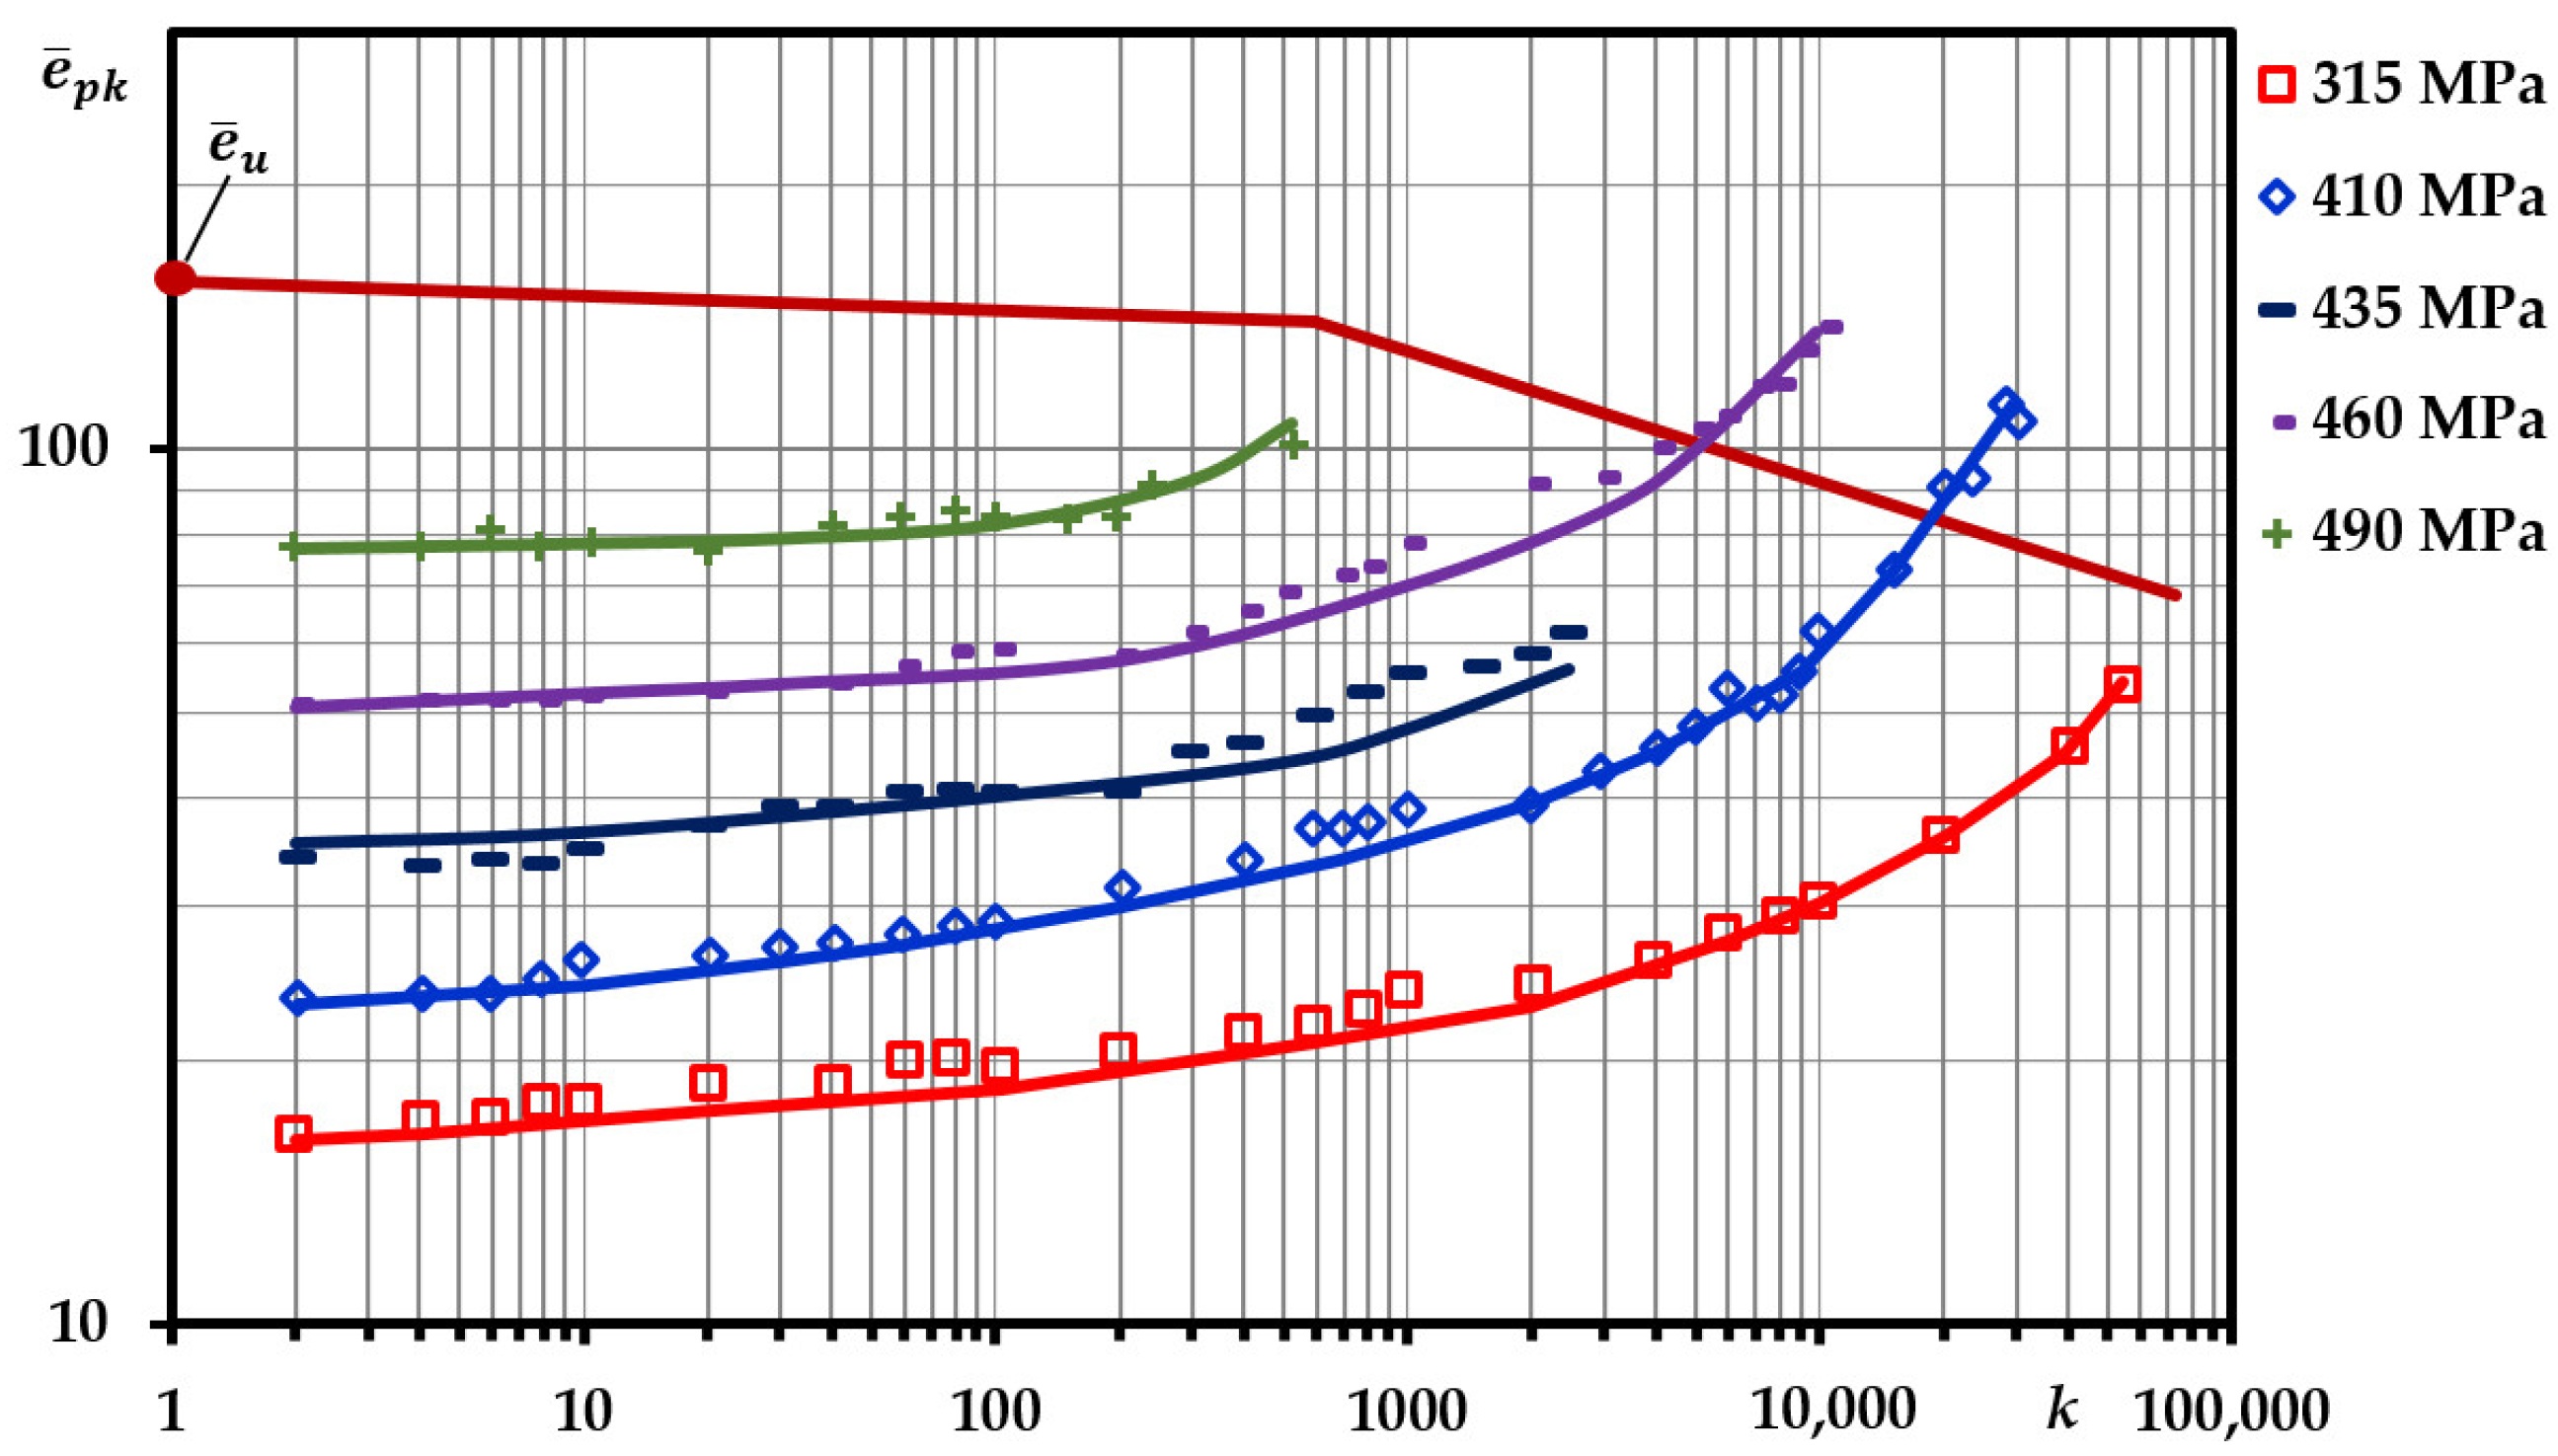
The material accumulates residual plastic strain in the direction of initial loading (tension) (Figure 6) because the hysteresis loop width of the paired half-cycles is greater than the loop width of the adjacent unpaired half-cycles. The theoretical accumulated unilateral plastic strain can then be presented as follows:
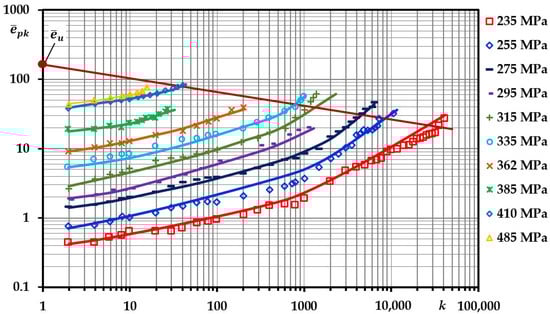
Figure 6.
Accumulated unilateral plastic strain during the symmetric cycle.
Figure 6 shows the calculated curves and the experimental values of the accumulated unilateral plastic strain . The low-cycle strain test data shown in Figure 4, Figure 5, Figure 6, Figure 7 and Figure 8 suggest that the material of the automatic coupler is cyclically softening and accumulates unilateral plastic strain. Therefore, it is clearly undergoing an accumulation of cyclic and quasi-static damage. For this reason, the investigation of durability under strain-controlled loading s with the strain restrictions applied has also been carried out (Figure 6 and Figure 7).
Figure 7.
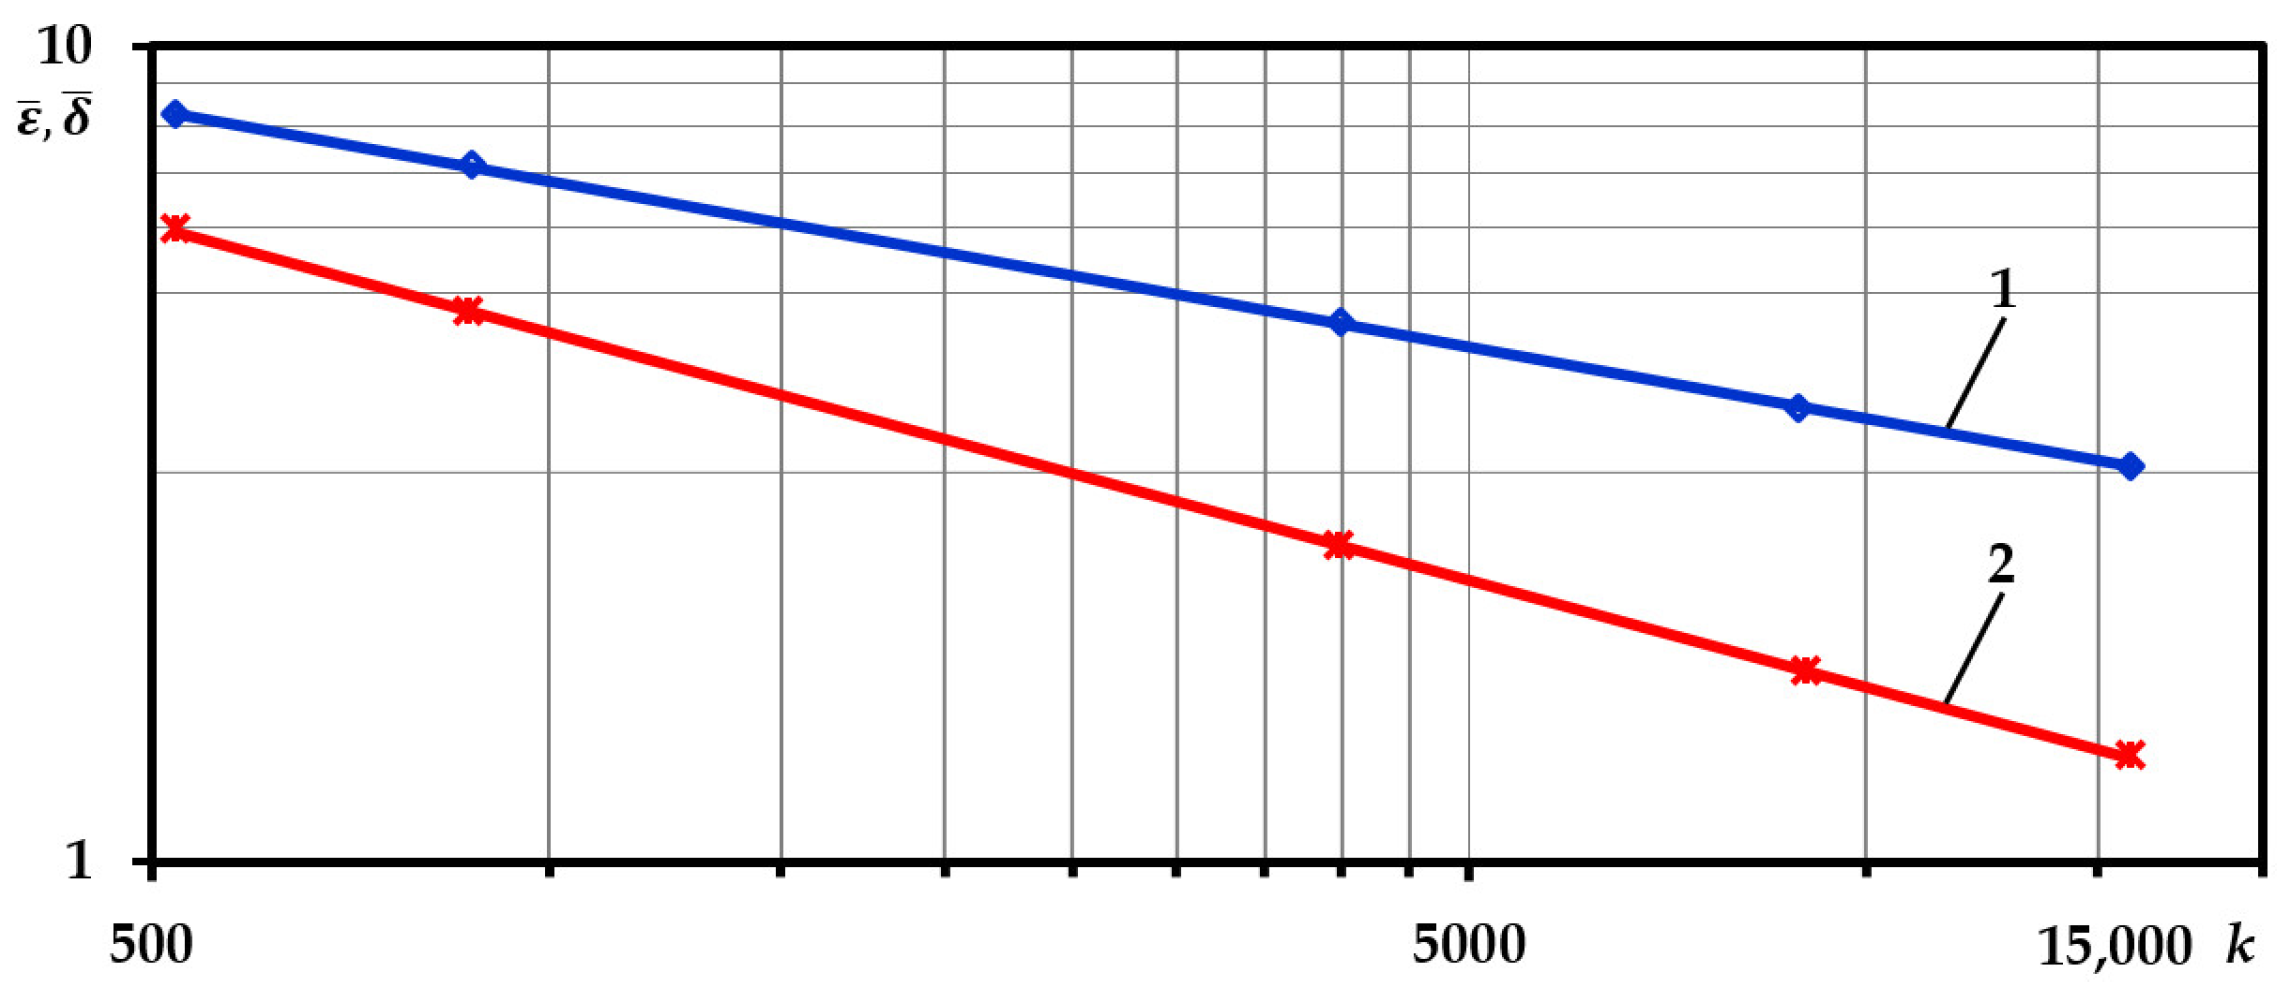
Low-cycle fatigue curves under the strain-controlled loading (1— 2—).
Figure 8.
Accumulated unilateral plastic strain during the asymmetric cycle.
Figure 8 shows the calculated curves for the asymmetric cycle and the experimental values. Investigations have shown that the cyclic strain parameters of the asymmetric cycle characterizing the hysteresis loop widths of the plastic strain of the first and second half-cycles are and . In the case of strain-controlled loading, quasi-static damage is eliminated. The shares of damage caused by fatigue and quasi-static damage can be determined by using the strain-controlled and stress-controlled loading durability curves. This is very important for calculating the total low-cycle damage [22].
The specimens were made from the body of an automatic coupler and were therefore limited in number. Under strain-controlled low-cycle loading, the strain is restrained; hence, no unilateral accumulation and no quasi-static damage have been identified. In this case, the specimen is damaged only by cyclic plastic strain. The linear dependence of the plastic strain on the number of loading cycles to failure is known to be present under strain-controlled loading in logarithmic coordinates (Coffin’s equation [24,25,26]); therefore, five specimens were allocated for the tests.
3. Results
3.1. Finite Element Modeling of an Automatic Coupler and Estimation of Stress and Strain
The forces acting on the housing are distributed in the front loop of the automatic coupling. The maximum force (2500 kN) corresponds to the movement of the train. The remaining forces correspond to a certain level of loading of the wagons at the maximum permissible train speed. Typical operational forces (950 kN, 1550 kN, 2350 kN, 2500 kN) have been used in the calculations, and even higher forces (3150 kN) may occur in the event of overloading or incorrect operation [1,11].
The FE model is based on the technical drawings of an automatic coupler SA3. To reduce the complexity of the calculations, the body of the automatic coupler has been divided into two parts in the horizontal plane of symmetry. Although the body is not perfectly symmetrical, the geometric differences are limited to the lock mechanism and do not affect the stress–strain behavior of the automatic coupling. Therefore, by adopting a conditional plane of symmetry and describing the necessary boundary conditions, it is sufficient to study half of the automatic coupler.
During its operation, the automatic coupler housing is subjected to forces T of different magnitudes, depending on the mass of the wagons, as already mentioned. To study the automatic coupler using the Ansys Classic FEM model, the load is distributed on the front surface of the automatic coupler housing head (see Figure 1, parts 1–4) and six degrees of freedom were constrained in the tail bore (see Figure 1, part 6). The FEM mesh was generated automatically. The selected finite element is a second-order tetrahedral element with 10 nodes (SOLID 187 Ansys element). The finite element model used consists of 66,358 tetrahedral elements and 113,907 nodes. At sufficiently high loads, stresses and strains exceed the limit of proportionality, and elastic–plastic deformation begins. In this case, the stress–strain relationship is non-linear. Therefore, a five-part polygonal approximation of the stress–strain diagram was used in the calculation. For this purpose, a multilinear material deformation curve was used.
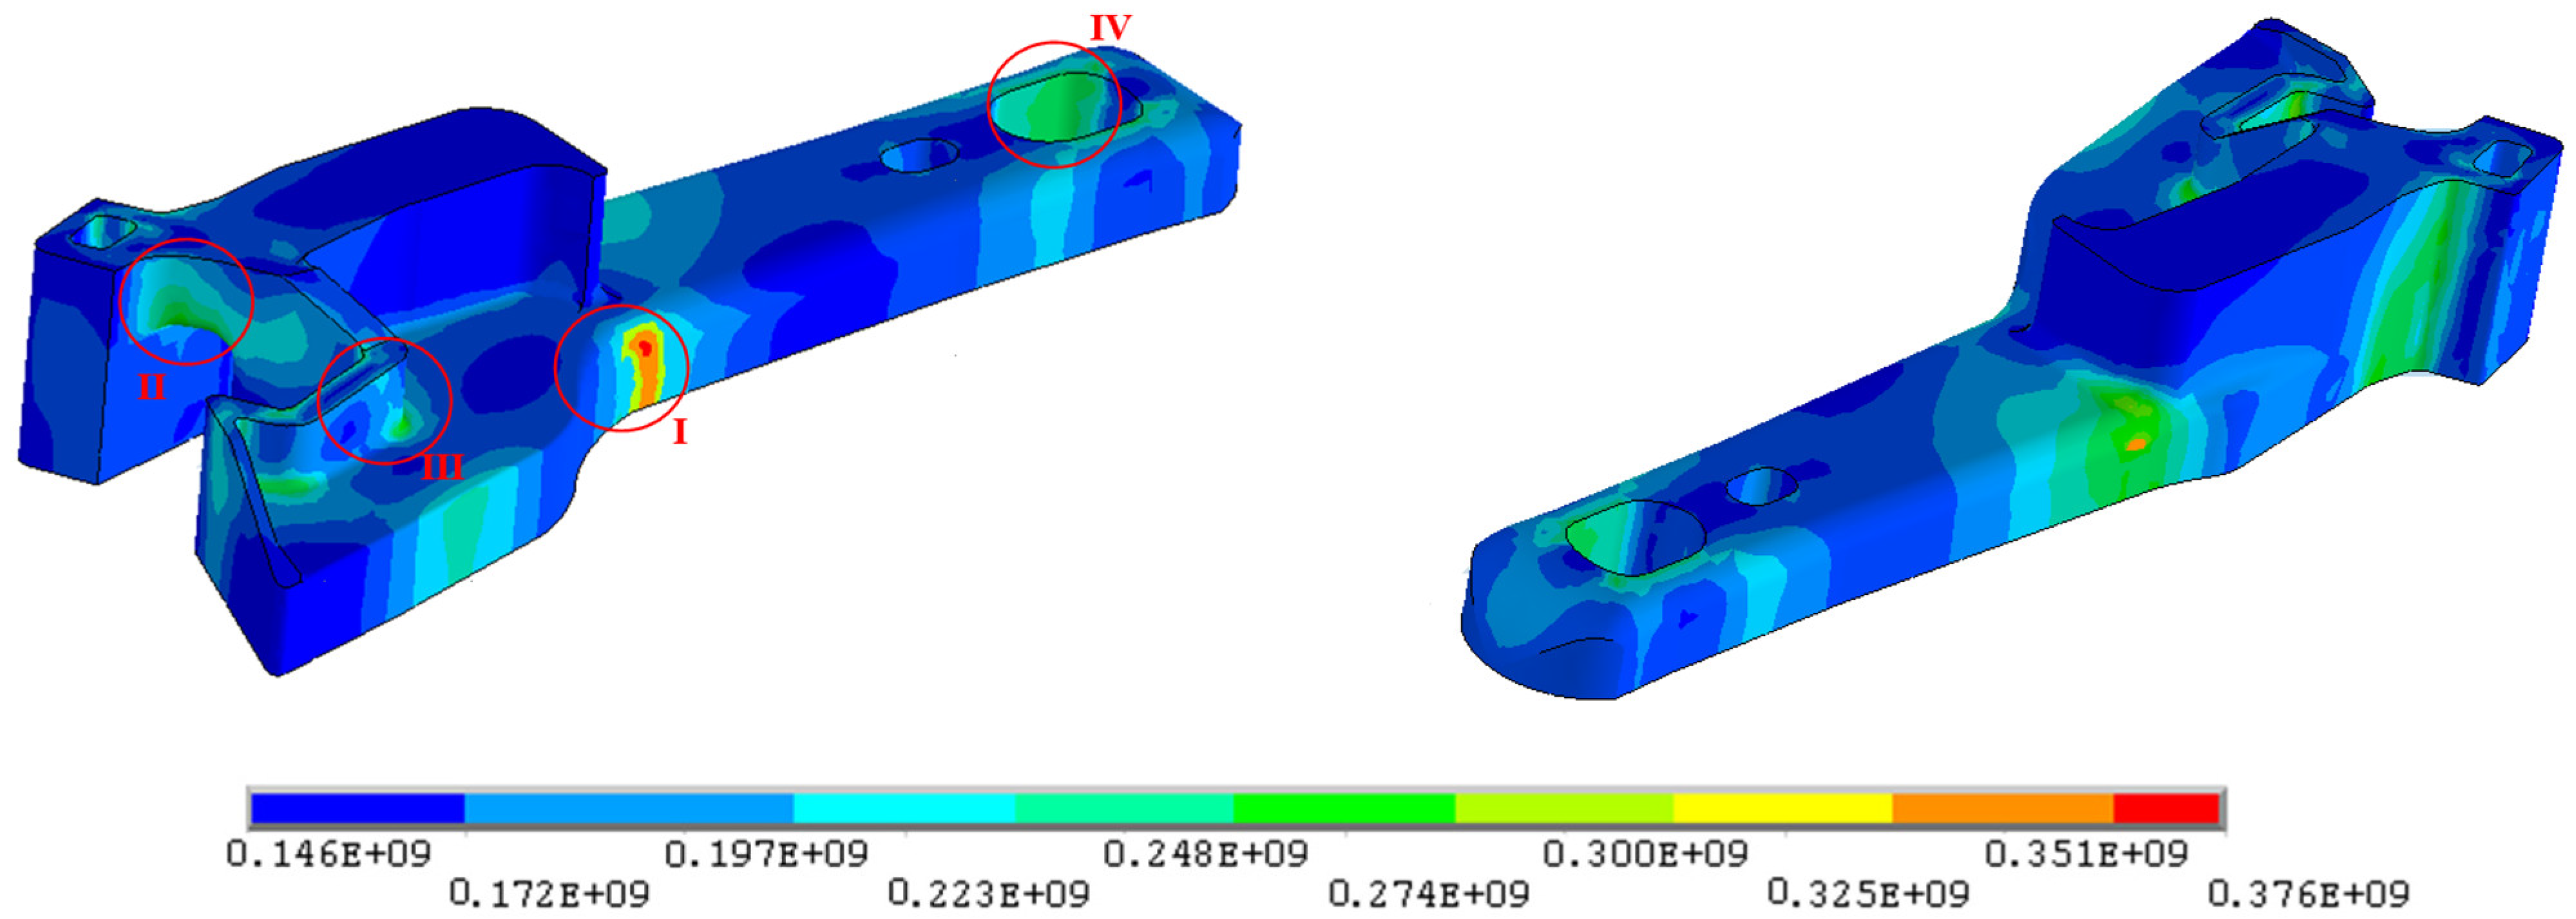
The most dangerous zones of the automatic coupler (Figure 9) and the intensities of the stresses and strains have been identified through the application of a finite element model of the automatic coupler (Table 5). The automatic coupler housing was evaluated taking into account longitudinal force . It can be seen from Table 5 that the maximum force induces stresses that exceed the proportionality limit of steel 20GL
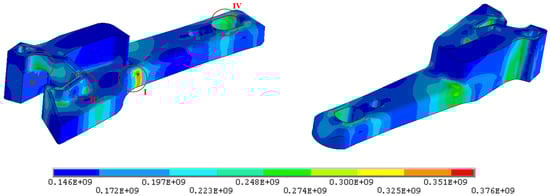
Figure 9.
Stress intensity distribution in an automatic coupler housing under longitudinal force (I–IV—stress concentration zones).
Table 5.
Stresses and deformations in the automatic coupler housing.
As can be seen in Table 5, at a load of , the stress intensity at the transition between the head and the tail (zone 2) is not only higher than the material’s proportionality limit but also higher than the yield strength . Thus, this zone is subject to low-cycle deformation. For other loads in the operating range, the stress intensity in the automatic coupler housing is below the material proportionality limit and, therefore, is less dangerous. The stress intensity distribution at for the automatic coupler housing is shown in Figure 9. The figure shows that the stress intensity is highest in the transition between the head and tail. There is also a significant increase in the stress intensity of the small tooth, big tooth, and tail zones.
Only the numerical values of the results change as a function of the load level, and the nature of the results remains the same. The highest stress intensities were obtained in all cases in the transition between the head and tail. This is due to the high stress concentration at the dimensional change locations where the dimensions change in two planes.
3.2. Damage Summation under Stationary Load
Low-cycle failure is caused by the accumulation of fatigue damage characterized by an elastic–plastic hysteresis loop and the quasi-static damage characterized by the accumulation of unilateral plastic deformation. In the automatic coupler of a rolling stock, the forces are restricted, resulting in stress-controlled low-cycle loading where strain is unrestrained, develops freely, and quasi-static and fatigue damage accumulates.
When the amplitude stresses of the cycle are close to the limit of proportionality of the material, fatigue failure occurs without visible signs of plastic deformation. At moderate amplitude stresses, the so-called intermediate or transient failure occurs, where the failure also produces a small neck and clearly visible fatigue cracks.
In an automatic coupler, the stresses vary during operation over a wide range, depending on the weight, velocity of the rolling stock, and the track relief. They range from a few tenths of the limit of proportionality of the material to the stresses exceeding the limit of proportionality and yield strength of the material. In addition, the stresses vary irregularly, i.e., in a non-stationary manner. Their variation characteristics can be determined on a case-by-case basis by directly measuring the forces acting on the automatic coupler. With such a wide range of variations, the material of the automatic coupler is subject to both low and high-cycle fatigue damage. Since the tests have shown that, under stress-controlled low-cycle loading, steel 20GL accumulates unilateral plastic strain; hence, low-cycle, quasi-static fatigue damage will accumulate where the stresses are above the limit of proportionality, and high-cycle fatigue damage will accumulate where the stresses are below the limit of proportionality. Therefore, the overall damage in the automatic coupler material can be determined by dependency [22,23]:
Fatigue damage from cyclic plastic strain:
where is the fatigue damage accumulated over half-cycles of loading, and is the fatigue damage accumulated to failure when the quasi-static damage , and .
Quasi-static damage:
where is the accumulated unilateral plastic strain over k half-cycles of loading and is the continuous strain under static loading:
Intermediate failure covers a relatively large range of cycles with significant fatigue and quasi-static damage. In this case, Equations (7)–(9) can be used to express the failure condition as follows:
To calculate the fatigue damage under stress-controlled loading, theoretical low-cycle fatigue curves are required, which only consider fatigue damage. To determine these curves, the stress-controlled loading is considered a non-stationary strain-controlled loading, with the accumulated damage per half-cycle expressed by the equation:
When the material accumulates the unilateral plastic strain, difficulties arise in the determination of low-cycle fatigue damage since, in this case, it is necessary to calculate the theoretical fatigue curve corresponding only to fatigue damage.
In the case of stress-controlled loading, the number of cycles of the calculated low-cycle fatigue curve is required to estimate the damage , which reflects only fatigue failure. For the purpose of determination of this curve, the stress-controlled loading is further analyzed as a non-stationary strain–controlled loading, with the value of fatigue damage per half-cycle expressed by Equation (12). Then, for the whole strain process to crack initiation, the following could be written [22]:
—the accumulated fatigue damage to crack initiation at the loading level corresponding to loop width ; —the accumulated fatigue damage to crack initiation at the loading level corresponding to loop width , etc.
Following the series of mathematical actions, the following equation was obtained:
Or
where , , are the material constants [22,23].
Table 6 shows the fatigue , quasi-static , and total damage for symmetric loading. It could be noted that the quasi-static damage is higher at higher load levels, while the fatigue damage is higher at lower load levels. The mean damage for symmetric load .
Table 6.
Damage accumulation in case of symmetric loading.
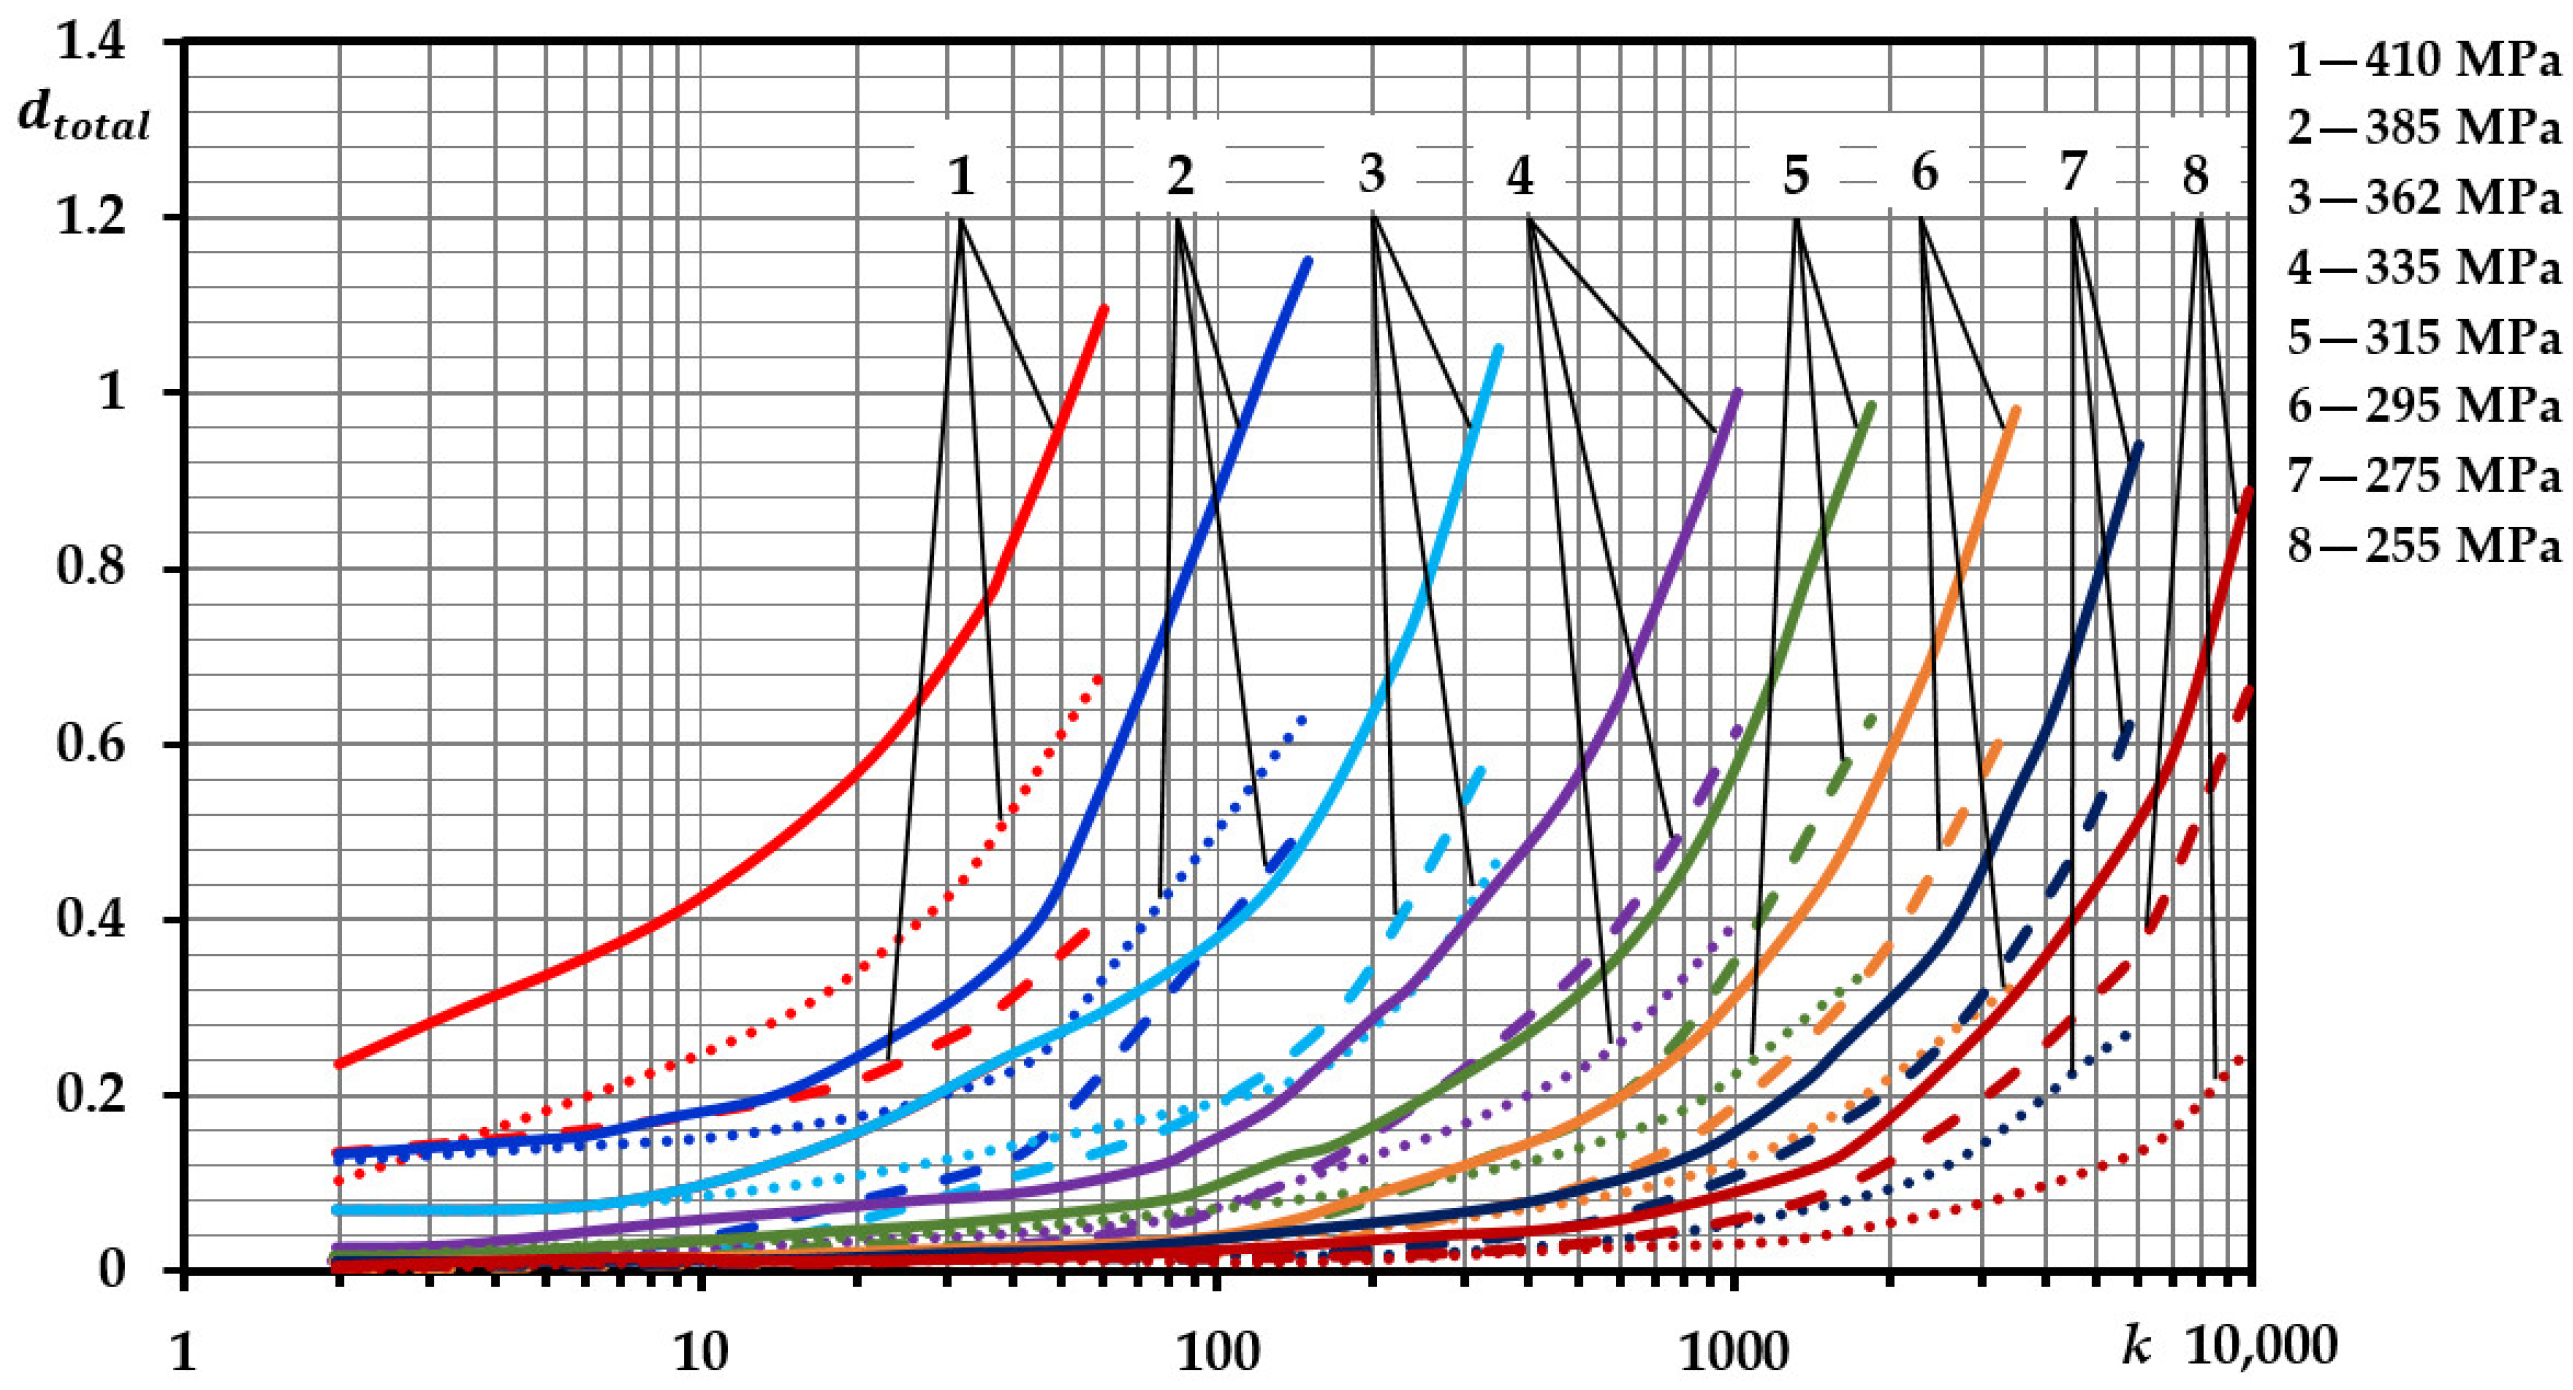
Figure 10 illustrates the variation of the fatigue damage , quasi-static damage , and total damage of the symmetric cycle depending on the number of half-cycles from 1 to failure half-cycle .
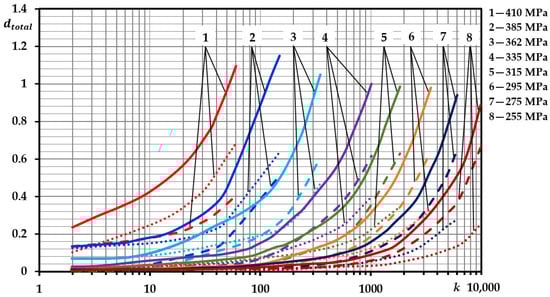
Figure 10.
Symmetric cycle damage (continuous lines—total damage, dotted lines—fatigue damage, dashed lines—quasi-static damage).
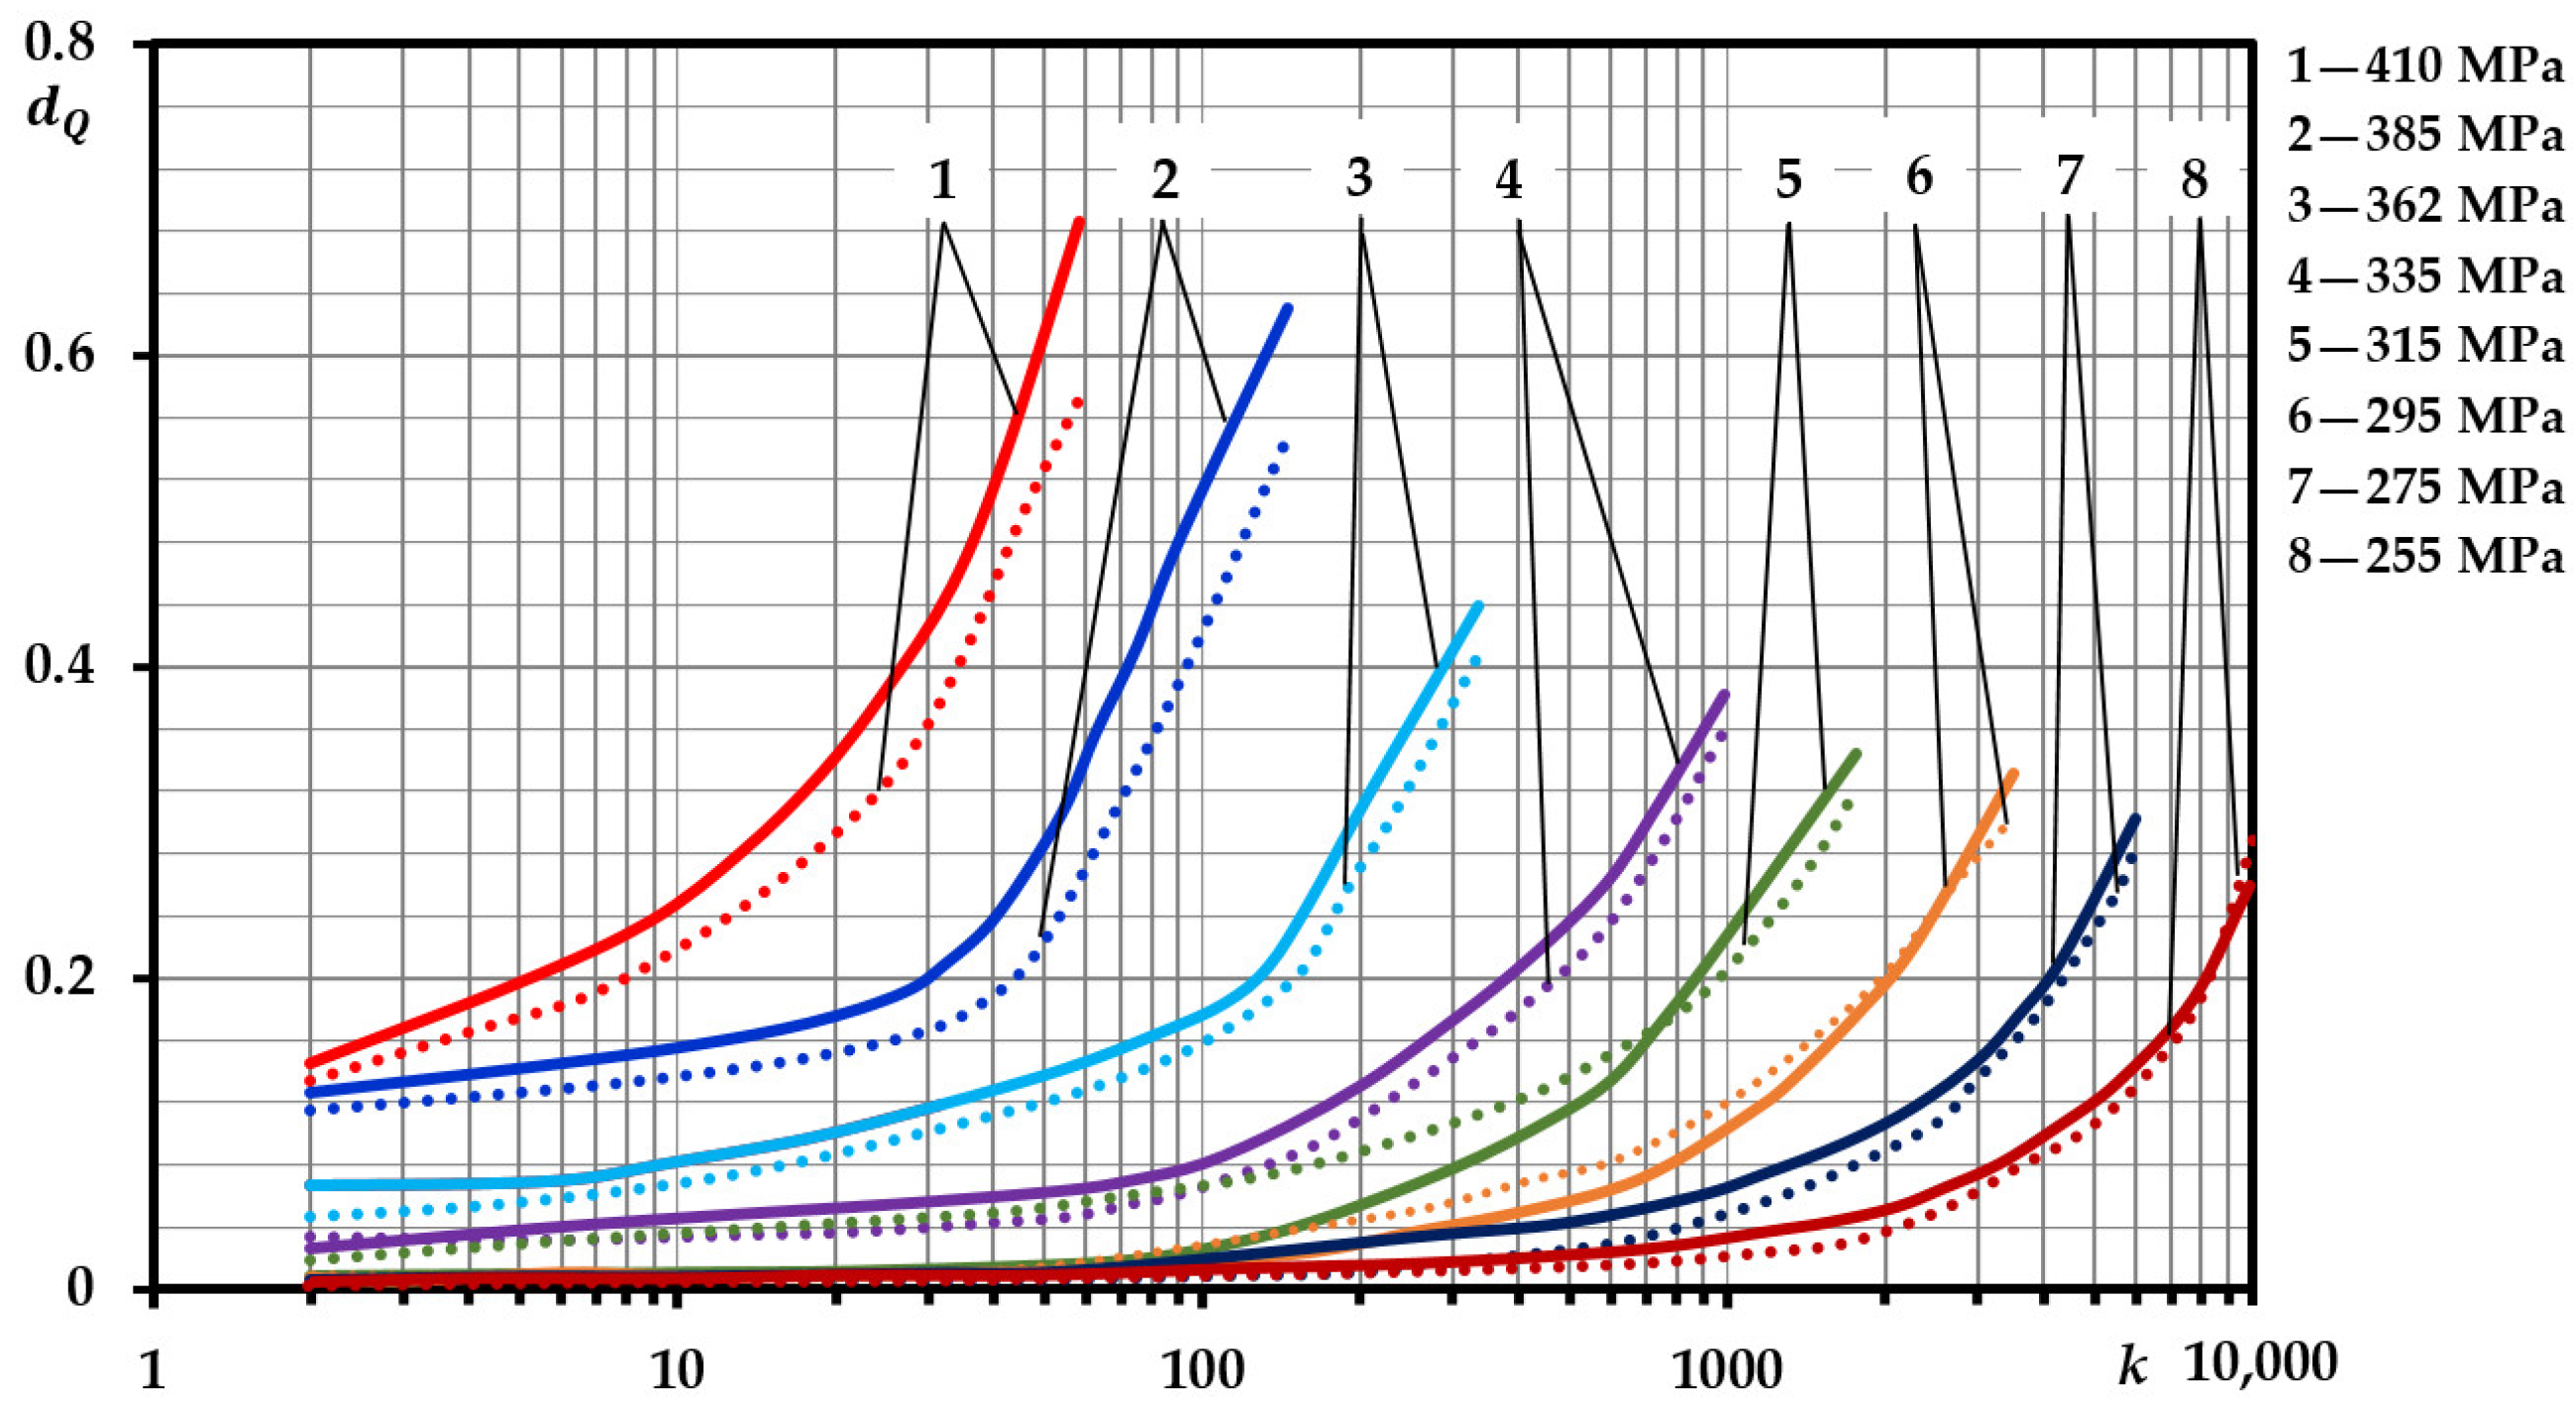
Figure 11 provides the quasi-static damage for the symmetric cycle calculated according to the actual loop width (dotted curve) and the mean loop width (dashed curve).
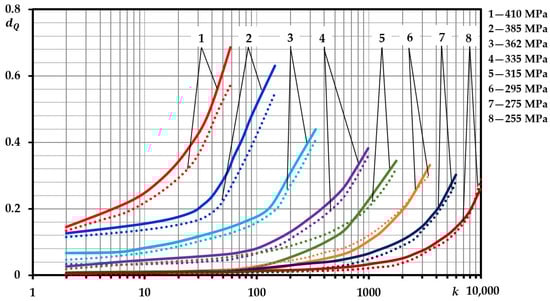
Figure 11.
Quasi-static damages of the symmetric cycle (continuous lines—calculated according to the actual loop width; dotted lines—calculated according to the mean loop width).
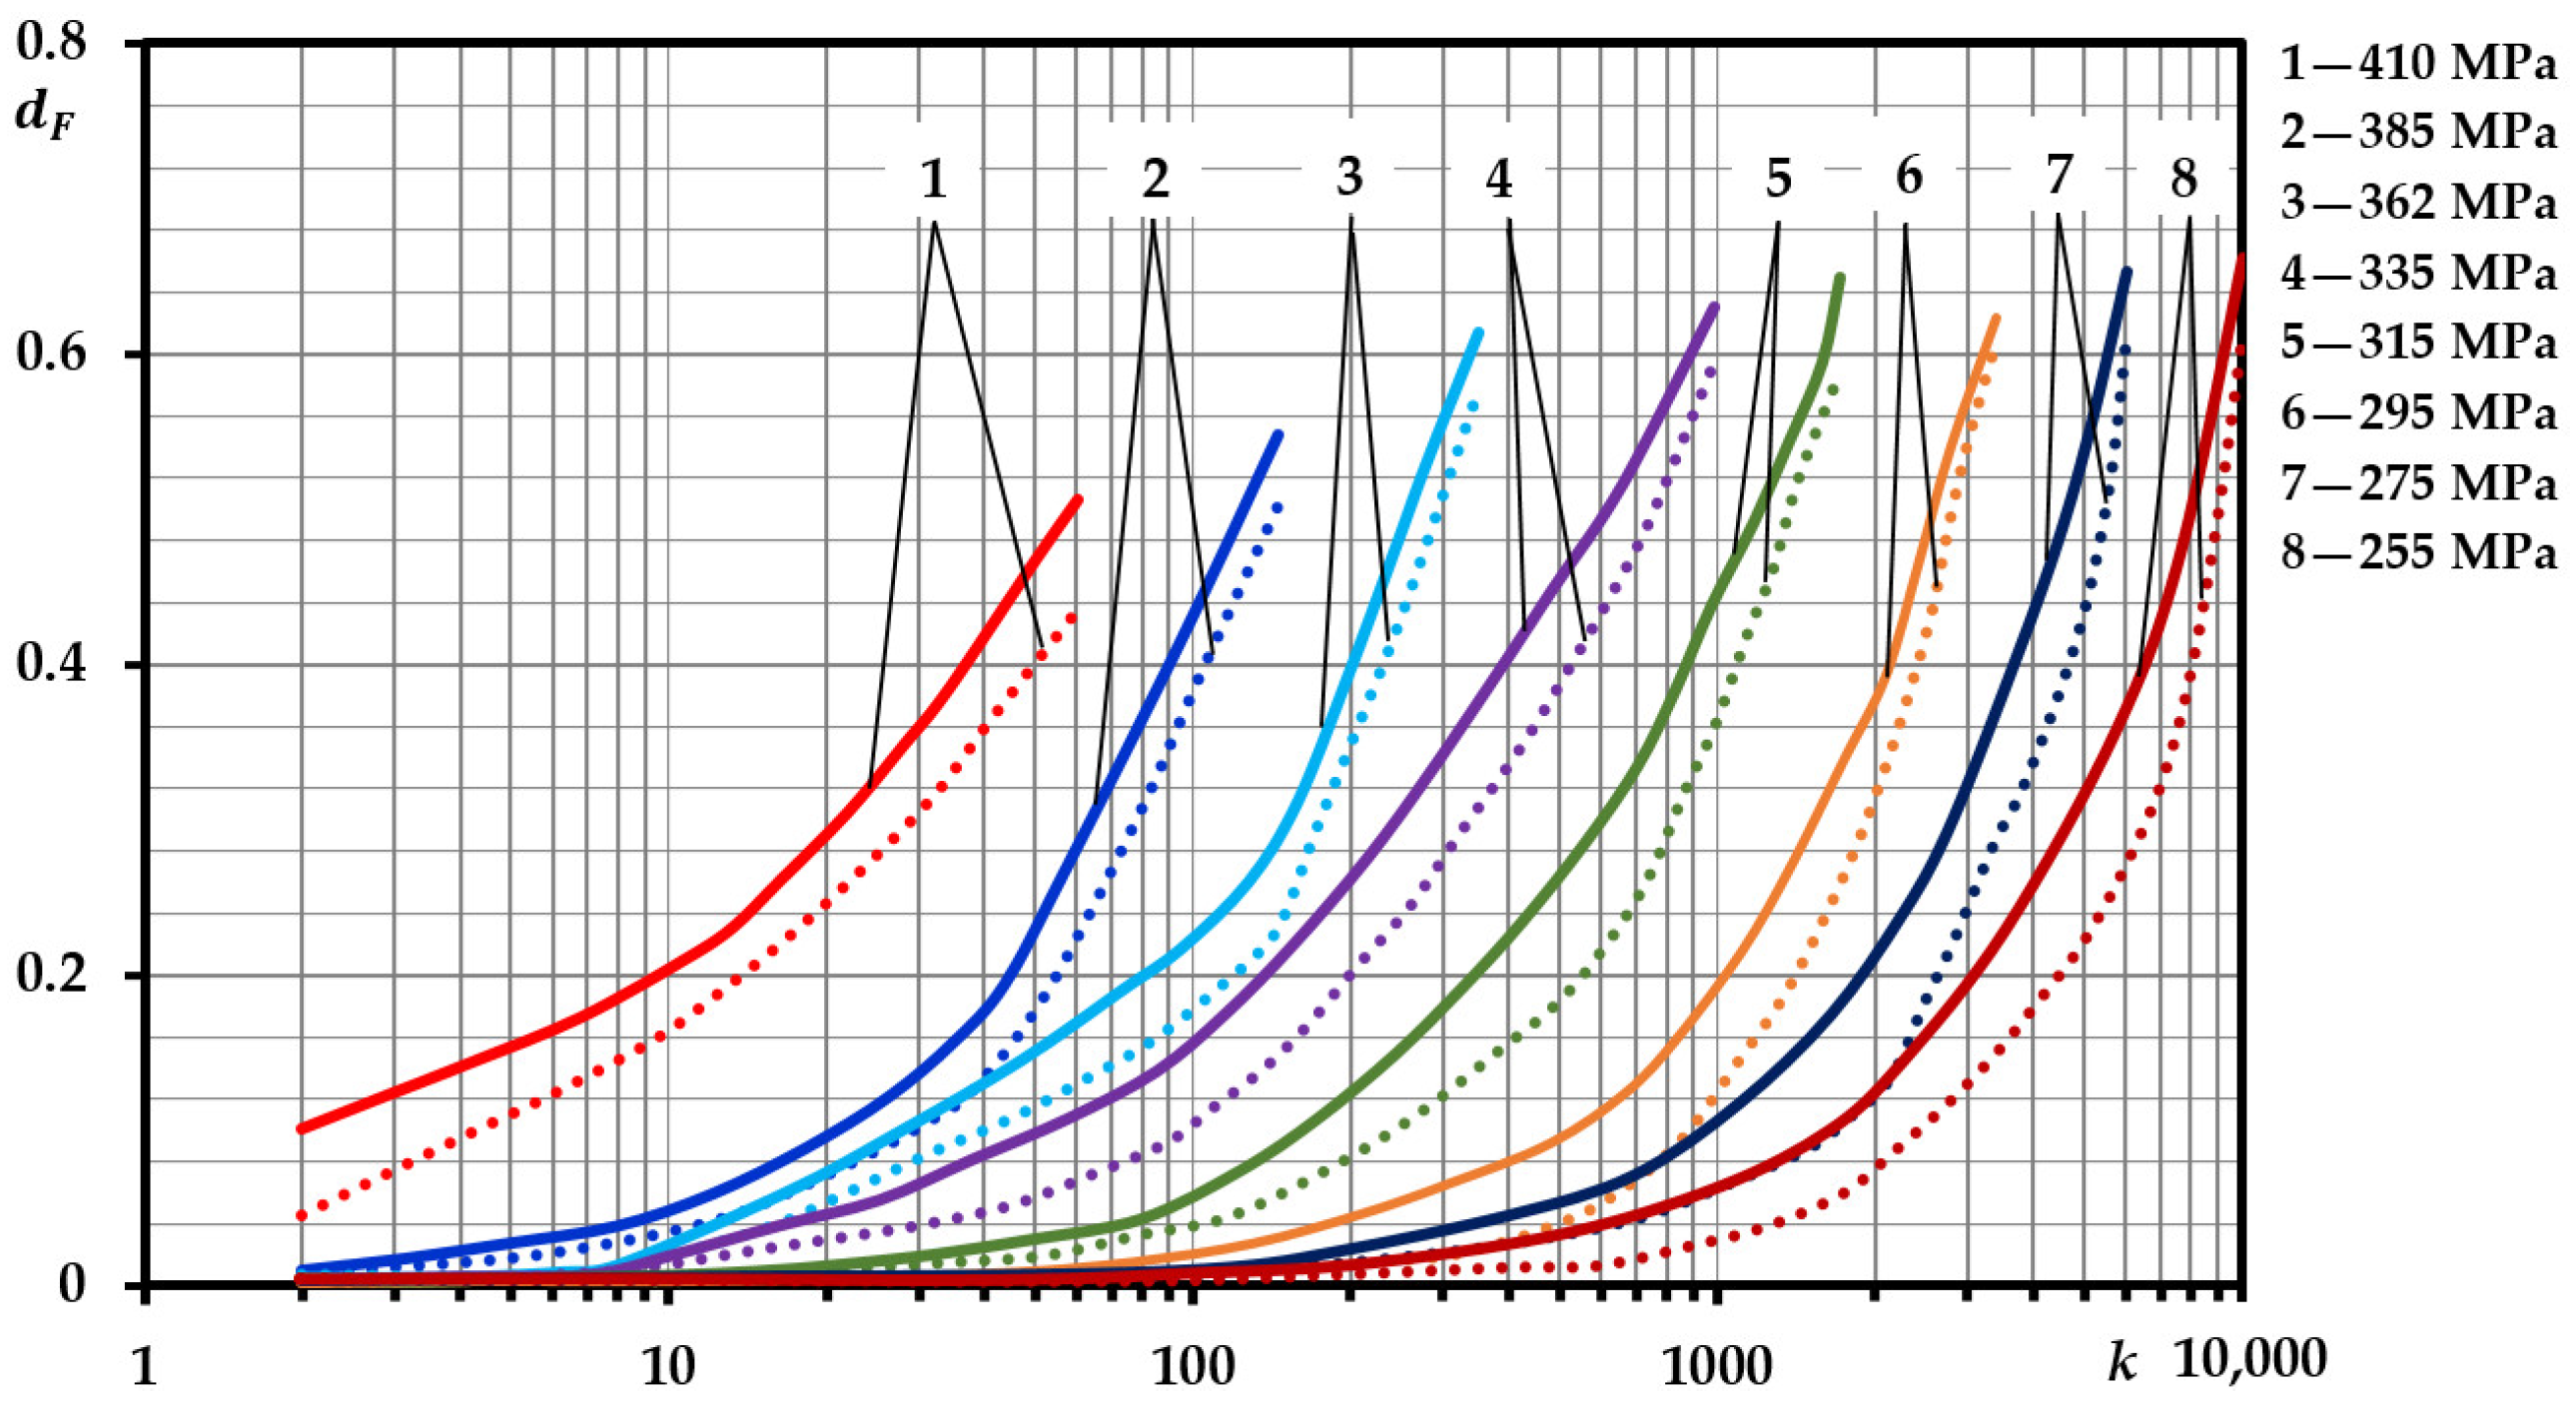
Figure 11 proposes that the discrepancy between the curves is larger in the case of small numbers of half-cycles, and the final damage is almost identical. The total quasi-static damage calculated according to the actual loop width is , and according to the mean loop width—. Figure 12 represents the fatigue damage for the symmetric cycle calculated according to the actual loop width (dotted curve) and the mean loop width (dashed curve). The total fatigue damage calculated on the basis of the actual loop width is , and on the basis of the mean loop width—. As can be seen from Figure 11 and Figure 12, the discrepancy is greater for fatigue damage than for quasi-static damage.

Figure 12.
Fatigue damages of the symmetric cycle (continuous lines—calculated according to the actual loop width; dotted lines—calculated according to the mean loop width).
Table 7 presented the fatigue , quasi-static , and total damage for asymmetric loading. It could be noted that the quasi-static damage is higher at higher load levels, while the fatigue damage is higher at lower load levels. The mean damage for asymmetric load .
Table 7.
Damage accumulation in case of asymmetric loading.
Figure 13 shows the variation of the asymmetric cycle fatigue , quasi-static , and total damage depending on the number of half-cycles from 1 to a failure half-cycle kf.

Figure 13.
Asymmetric cycle damage (continuous lines—total damage, dotted lines—fatigue damage, dashed lines—quasi-static damage).
In the case of asymmetric loading, quasi-static damage predominates due to the very small hysteresis loop width. The damage values corresponding to the failure half-cycle are shown in Table 7.
Figure 14 shows the quasi-static damage for the asymmetric cycle calculated according to the actual loop width (dotted curve) and the mean loop width (dashed curve). It suggests that the discrepancy between the curves is larger in the case of small numbers of half-cycles, and the final damage is almost identical. The total quasi-static damage calculated according to the actual loop width is and according to the mean loop width .
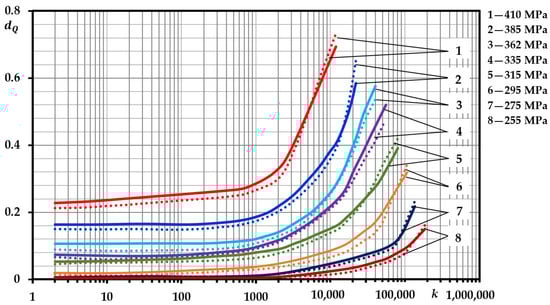
Figure 14.
Quasi-static damage of the asymmetric cycle (continuous lines—calculated according to the actual loop width; dotted lines—calculated according to the mean loop width).
Figure 15 shows the fatigue damages of the asymmetric cycle calculated according to the actual loop width (continuous curve) and according to the mean loop width (dotted curve). The total quasi-static damage calculated according to the actual loop width is , and according to the mean loop width—. Figure 14 and Figure 15 show that the non-correspondence for fatigue damage is greater than for quasi-static damage.
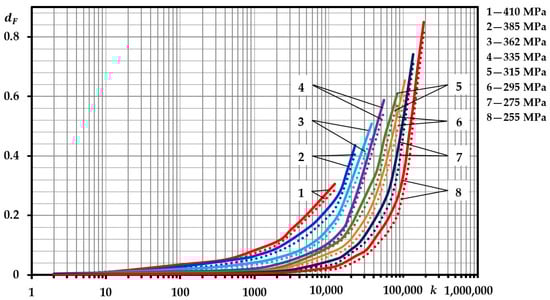
Figure 15.
Fatigue damage of the asymmetric cycle (continuous lines—calculated according to the actual loop width; dotted lines—calculated according to the mean loop width).
4. Discussion and Conclusions
The material of the analyzed automatic coupler is the insignificantly (α = 0.123) cyclically softening steel 20GL. Hence, the variation of the accumulated fatigue and quasi-static damage depending on the number of loading half-cycles has shown that, in the calculation of these types of damage, the cyclic softening of the material can be ignored and the calculations can be performed by using the hysteresis loop width in the durability half-cycle.
The automatic coupling was found to be subject to static, low-cycle, and quasi-static fatigue damage. Furthermore, the load on the automatic coupler varied over time, depending on the weight, the velocity of the rolling stock, and the railway relief. Therefore, low-cycle stationary stress-limited loading dependencies, accounting for low-cycle quasi-static and fatigue damage, were proposed for the calculation of the durability of an automatic coupler. The linear law of summation of the number of loading cycles was proposed for the assessment of low-cycle fatigue damage. The calculation of an automatic coupler required the determination of its load history in each case and the calculation of its duration using the dependencies shown above.
In order to accurately estimate the duration of the initiation phase in an automatic coupling, it is necessary to know the exact loading history of the coupler, i.e., the sequence of loading levels and the number of cycles for each level. These data can be obtained only by recording the variation of forces or strain in the automatic coupler during the specific trip. Hence, the authors of this paper propose conducting the general calculations by using specific levels and the number of cycles within the levels, i.e., the data provided in the literature, by statistically processing the given operational data, not taking into account the historical load data.
The presented calculation results show that static overload of the automatic coupler is highly dangerous as it causes considerable quasi-static damage. Hence, after train accidents, i.e., wagon rollover or derailment, the automatic couplers must be inspected very thoroughly (i.e., the automatic coupler must be checked for any residual strain and cracks).
The methodology proposed in this paper for the calculation of low-cycle damage is applicable to the durability assessment of different parts of the housing under complex loading conditions both in view of loading cycles and forces.
Based on the results obtained in this work, further research may be carried out with the purpose of suggesting the method for automatic coupler damage summation using low-cycle non-stationary load dependencies considering static, low-cycle, quasi-static, and high-cycle fatigue damage.
Author Contributions
Conceptualization, V.L., Ž.B., D.P. and E.B.; methodology, V.L., Ž.B. and D.P.; software, V.L., Ž.B. and D.P.; validation, V.L., Ž.B. and D.P.; formal analysis, V.L., Ž.B. and D.P.; investigation, V.L., Ž.B. and D.P.; resources, V.L., Ž.B., D.P. and E.B.; data curation, V.L., Ž.B., D.P. and E.B.; writing—original draft preparation, V.L., Ž.B., D.P. and E.B.; writing—review and editing, V.L., Ž.B., D.P. and E.B.; visualization, V.L., Ž.B. and D.P.; supervision, V.L., Ž.B. and D.P.; project administration, V.L., Ž.B., D.P. and E.B. All authors have read and agreed to the published version of the manuscript.
Funding
This research received no external funding.
Institutional Review Board Statement
Not applicable.
Informed Consent Statement
Not applicable.
Data Availability Statement
Data are contained within the article.
Conflicts of Interest
The authors declare no conflicts of interest.
Nomenclature
| Latin symbols | |
| low-cycle fatigue curves constants describing the first and second half–cycles, respectively [24,25]; | |
| low-cycle fatigue curves constants describing strain-controlled loading [24,25]; | |
| total damage; | |
| fatigue damage due to elastic strain; | |
| fatigue damage due to plastic strain; | |
| cumulated low-cycle quasi-static damage; | |
| cumulated low-cycle fatigue damage; | |
| modulus of elasticity (MPa); | |
| strain (%); | |
| strain intensity (%); | |
| strain intensity of initial loading (%); | |
| initial loading strain normalized to proportional limit strain: (%); | |
| amplitude of the strain (%); | |
| proportional limit strain (%); | |
| accumulated unilateral plastic strain (%); | |
| accumulated unilateral plastic strain over half–cycles of loading (%); | |
| accumulated unilateral plastic strain at half–cycles of loading (%); | |
| continuous strain under static loading (%); | |
| samples number in the rank order; | |
| , , | number of loading half–cycles; |
| number of loading half–cycles to crack initiation; | |
| strain scale (mm/mm); | |
| stress scale (MPa/mm); | |
| number of of measurements; | |
| number of load cycles determined using the Goodman diagram [15] | |
| number of high-cycle fatigue load cycles; | |
| degree indicator equal to 1; | |
| coefficient of asymmetry; | |
| statistical distribution standard deviation; | |
| cyclic stress for the half–cycle of loading (MPa); | |
| cyclic proportional limit stress calculated from the beginning of the unloading (MPa); | |
| , | cyclic stress normalized respectively to proportional limit stress: , (MPa); |
| traction force, (N); | |
| coefficient of variation; | |
| statistical mean; | |
| independent variables; | |
| Greek symbols | |
| low-cycle fatigue curves constants describing the materials softening or hardening [22,23,24]; | |
| constants of degree equations of low-cycle fatigue curves by the number of cycles (half–cycles) before crack initiations [22]; | |
| elasto–plastic deformation hysteresis loop width; | |
| elasto–plastic cyclic strain intensity (%); | |
| cyclic strain for the half–cycle of loading (%); | |
| cyclic proportional limit strain calculated from the beginning of the unloading (%); | |
| , , | cyclic strain normalized respectively to proportional limit stress: , , (%); |
| monotonous, maximum and minimum stress, respectively (MPa); | |
| initial loading stress intensity (MPa); | |
| stress intensity (MPa); | |
| proportional limit stress (MPa); | |
| yield stress (MPa); | |
| ultimate stress (MPa); | |
| normalized to proportional limit stress: , (MPa); | |
| reduction of area (%); | |
| continuous reduction of area (%). | |
Appendix A
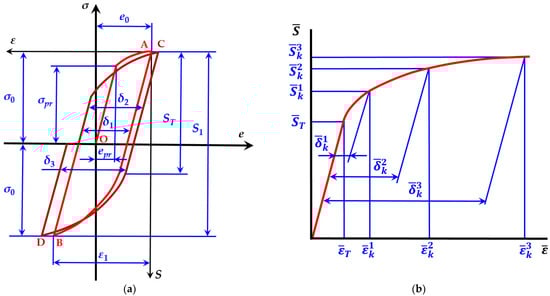
Figure A1.
Stress-limited loading low cycle diagram (a); deformation diagram for relative k half–cycle (b).
Figure A1.
Stress-limited loading low cycle diagram (a); deformation diagram for relative k half–cycle (b).
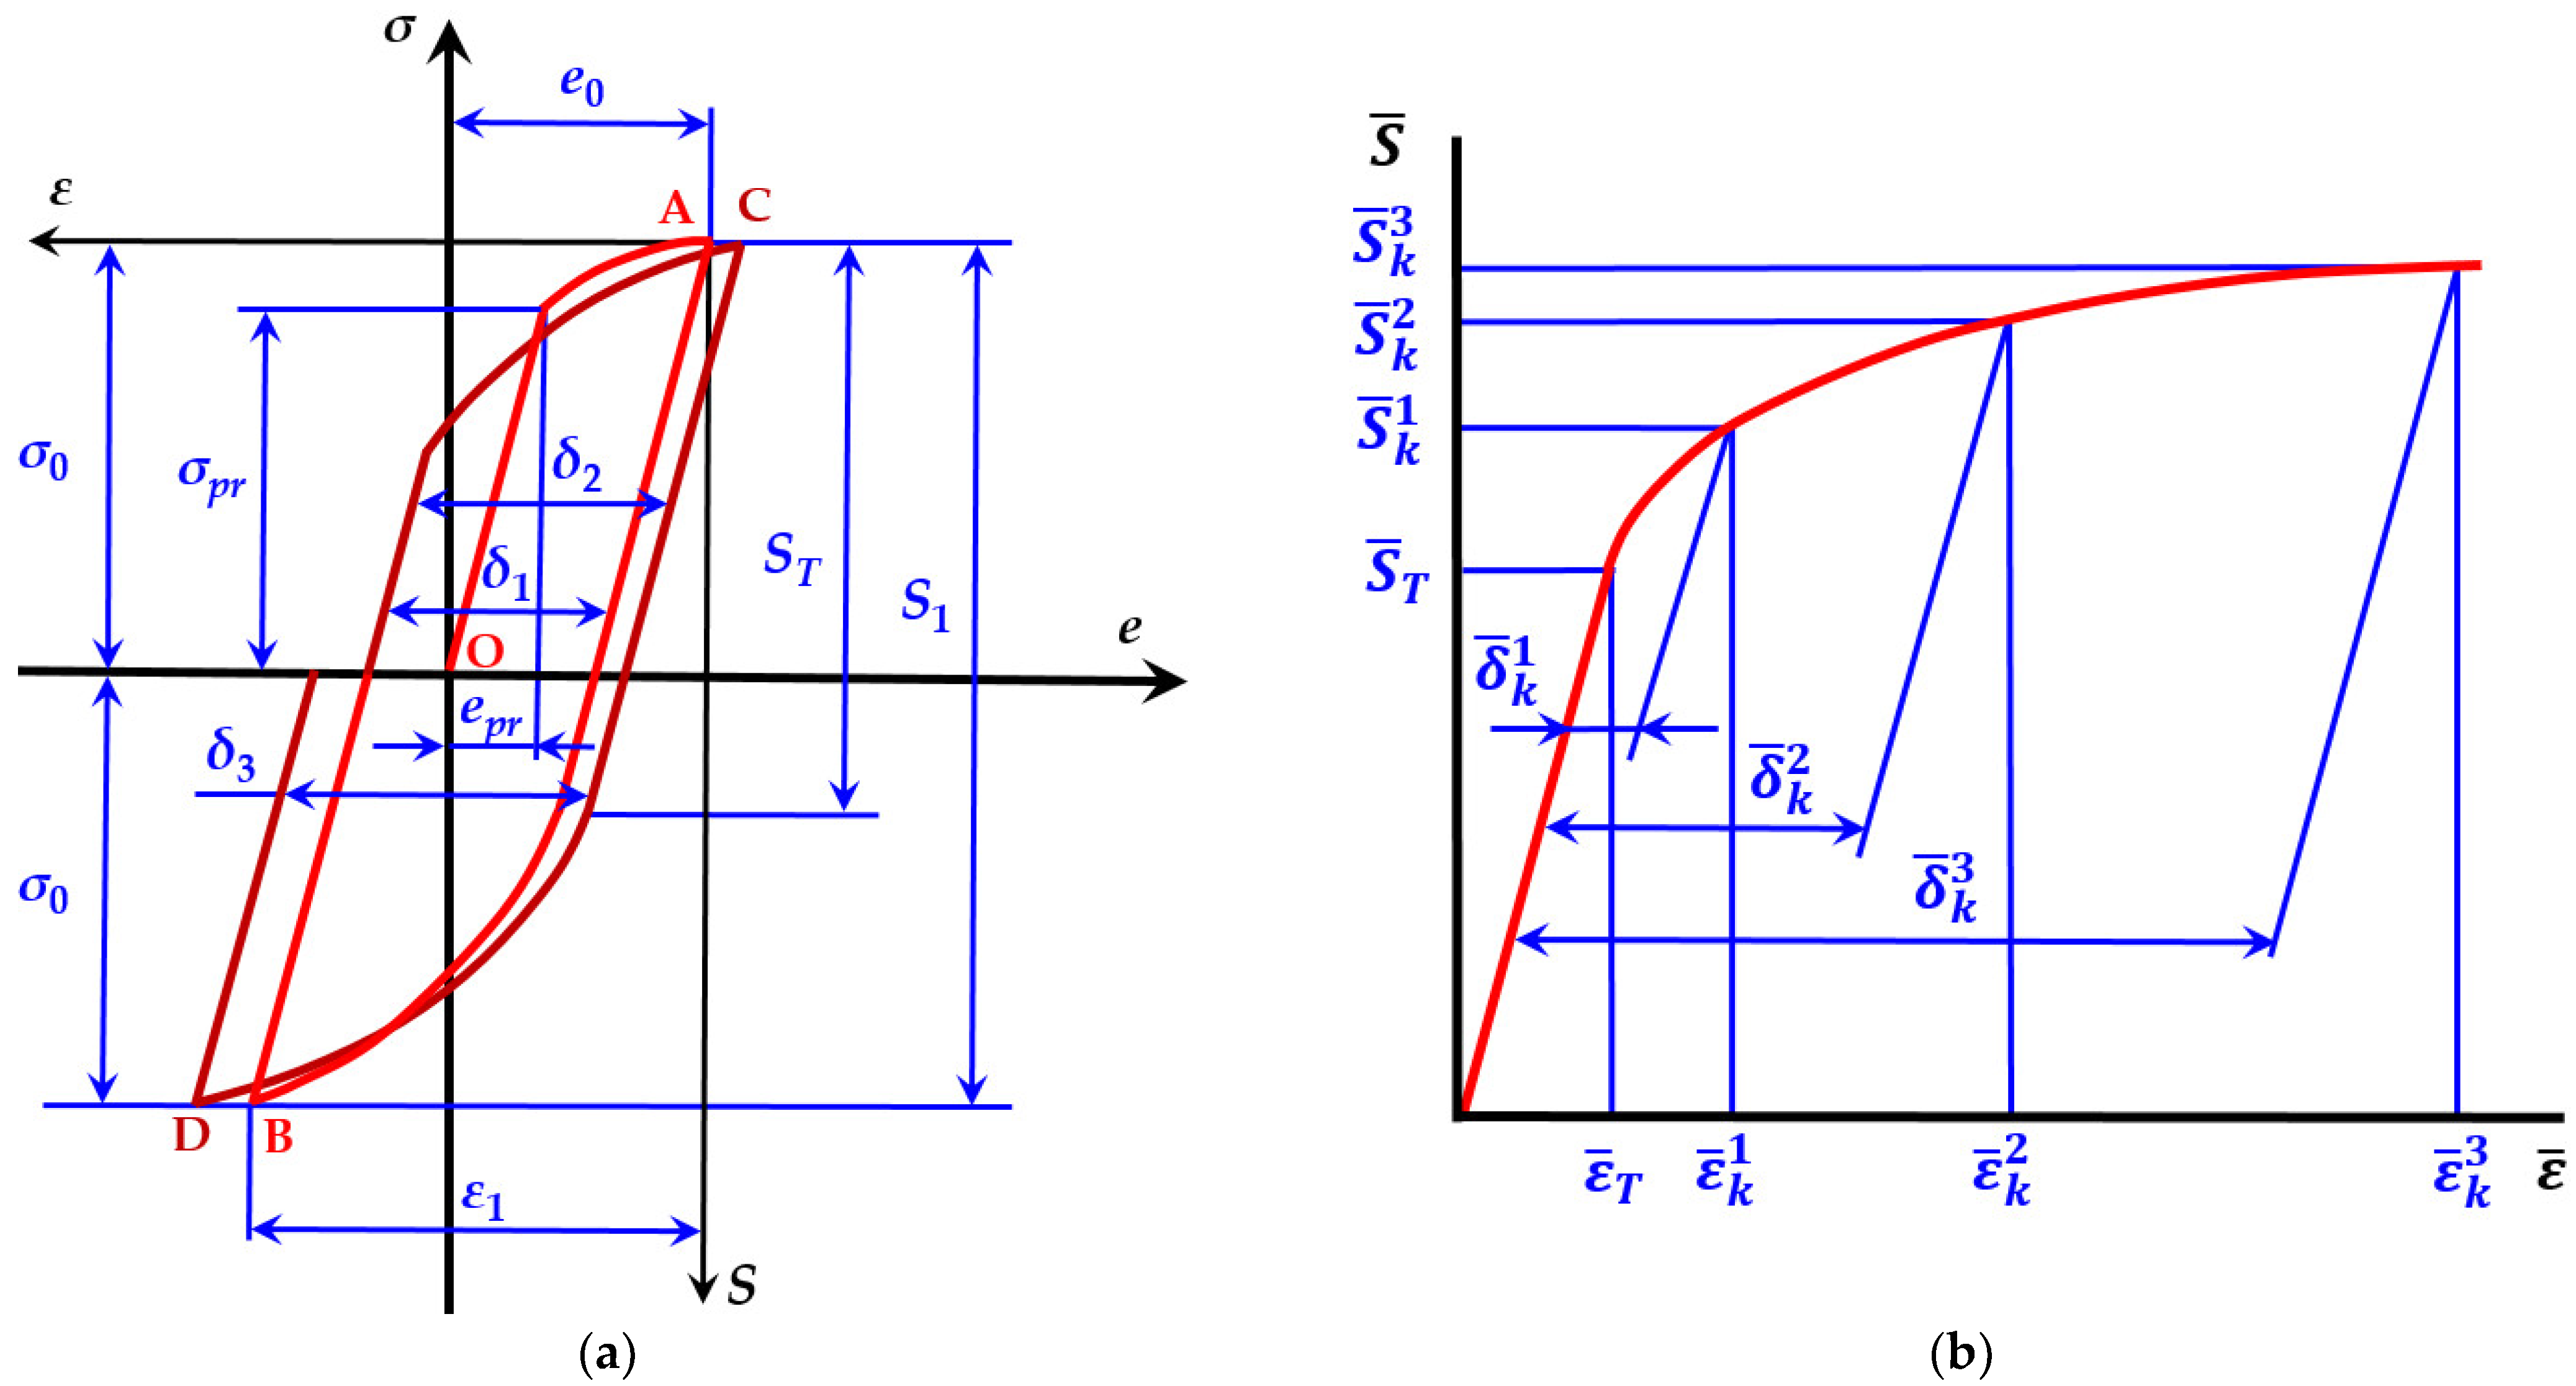
The diagram presented above is based on the results of the experiments. The initial half–cycle is described by key parameters: , , and . The initial half–cycle (curve OA) is positioned in coordinates . First half–cycle (curve AB) and all other half–cycles coordinates are . Each subsequent half–cycle is described: , , , and [22].
References
- Rilo Cañás, A.M.; Rozynek, T.; Sawczuk, W. Test train with digital automatic couplers DAC in Poland. Rail Veh./Pojazdy Szyn. 2022, 3, 54. [Google Scholar] [CrossRef]
- Belyaev, V. Evaluation of prevailing longitudinal forces in the couplings of electric trains. Int. J. Railw. Res. 2023, 10, 1–8. [Google Scholar]
- Makhutov, N.A. Volume 1: Structural Durability, Resource and Tech; Safety; Nauka: Novosibirsk, Russia, 2005. (In Russian) [Google Scholar]
- Makhutov, N.A. Volume 2: Structural Durability, Resource and Tech; Safety; Nauka: Novosibirsk, Russia, 2005. (In Russian) [Google Scholar]
- Makhutov, N.A.; Panov, A.N.; Yudina, O.N. The development of models of risk assessment complex transport systems. In IOP Conference Series: Materials Science and Engineering, Proceedings of the V International Scientific Conference, Survivability and Structural MaterialScience (SSMS2020), Moscow, Russia, 27–29 October2020; Institute of Physics Publishing (IOP): Moscow, Russia, 2021; Volume 1023, Available online: https://scholar.google.lt/scholar?hl=lt&as_sdt=0%2C5&q=The+development+of+models+of+risk+assessment+complex+transport+systems&btnG (accessed on 25 March 2022).
- Serensen, S.V.; Shneiderovich, R.M. Deformations and rupture criteria under low-cycles fatigue. Exp. Mech. 1966, 6, 587–592. [Google Scholar] [CrossRef]
- Serensen, S.V.; Kogayev, V.P.; Shneiderovich, R.M. Load Carrying Ability and Strength Evaluation of Machine Components, 3rd ed.; Mashinostroeniya: Moscow, Russia, 1975; pp. 255–311. (In Russian) [Google Scholar]
- Giannella, V.; Sepe, R.; Borrelli, A.; De Michele, G.; Armentani, E. Numerical investigation on the fracture failure of a railway axle. Eng. Fail. Anal. 2021, 129, 105680. [Google Scholar] [CrossRef]
- Mohammadi, M.; Rahmatfam, A.; Zehsaz, M.; Hassanifard, S. Failure analysis study of railway draw-hook coupler. J. Cent. S. Univ. 2019, 26, 916–924. [Google Scholar] [CrossRef]
- Kınacı, B.F.; Botsalı, H.; Özarpa, C.; Esen, I.; Ahlatçı, H. Investigation of fatigue life of draw hook equipment used in freight wagon: Miscellaneous result. Eng. Fail. Anal. 2024, 155, 107757. [Google Scholar] [CrossRef]
- Nikolsky, L.N.; Petrunina, I.S.; Petrunin, V.S. Statistical method of calculation of auto coupler durability taking into account low-cycle fatigue (Cтaтиcтичecкий мeтoд дoлгoвeчнocти aвтocцeпки c учeтoм мaлoциклoвoй уcтaлocти). Mashinovedenie 1975, 1, 75–80. (In Russian) [Google Scholar]
- Stepnov, M.N.; Giacintov, E.V. Fatigue of Light Structural Alloys; Mashinostroeniya: Moscow, Russia, 1973; pp. 8–22. (In Russian) [Google Scholar]
- Kostenko, N.A.; Nikolskiy, L.N. About calculation of reliability of couplers (O pacчeтe нaдeжнocти aвтocцeпoк). Mashinovedenie 1968, 3, 84–91. (In Russian) [Google Scholar]
- Infante, V.; Branco, C.M.; Brito, A.S.; Morgado, T.L. A failure analysis study of cast steel railway couplings used for coal transportation. Eng. Fail. Anal. 2003, 10, 475–489. [Google Scholar] [CrossRef]
- Berkovits, A.; Fang, D. An analytical master curve for Goodman diagram data. Int. J. Fatigue 1993, 15, 173–180. [Google Scholar] [CrossRef]
- Gao, Y.X.; Yi, Z.; Lindley, T.C. The effect of porosity on the fatigue life of cast aluminium–silicon alloys. Fatigue Fract. Eng. Mater. Struct. 2004, 27, 559–570. [Google Scholar] [CrossRef]
- Bekerman, A.F.; Kostina, N.A.; Kosarev, L.N. Resistance of couplings made of steel 20GL after normalisation and thermal treatment to fatigue failure. In Problems of Railway Transport Mechanics; Proc. of All-Union Conf.; Institute of Physics Publishing: Dnepropetrovsk, Ukraina, 1984; pp. 182–183. [Google Scholar]
- Oganyan, E.S.; Kossov, V.S.; Ovechnikov, M.N.; Volokhov, G.M.; Bykov, V.A.; Spirov, A.V.; Gasyuk, A.S. Loading simulation and lifetime evaluation of automatic coupler in extreme environment. Procedia Struct. Integr. 2019, 20, 42–47. [Google Scholar] [CrossRef]
- Ren, X.; Wu, S.; Xing, H.; Fang, X.; Ao, N.; Zhu, T.; Li, Q.; Kang, G. Fracture mechanics based residual life prediction of railway heavy coupler with measured load spectrum. Int. J. Fract. 2022, 234, 313–327. [Google Scholar] [CrossRef]
- GOST 25502-79 Standard; Strength Analysis and Testing in Machine Building. Methods of Metals Mechanical Testing. Methods of Fatigue Testing. Standardinform: Moscow, Russia, 1993.
- GOST 22015-76 Standard; Quality of Product. Regulation and Statistical Quality Evaluation of Metal Materials and Products on Speed-torque Characteristics. Standardinform: Moscow, Russia, 2010.
- Daunys, M. Cycle Strength and Durability of Structures; Technologija: Kaunas, Lithuania, 2005. (In Lithuanian) [Google Scholar]
- Bazaras, Ž.; Lukoševičius, V. Statistical Estimation of Resistance to Cyclic Deformation of Structural Steels and Aluminum Alloy. Metals 2022, 12, 47. [Google Scholar] [CrossRef]
- Daunys, M.; Šniuolis, R. Statistical evaluation of low cycle loading curves parameters for structural materials by mechanical characteristics. Nucl. Eng. Des. 2006, 236, 13. [Google Scholar] [CrossRef]
- Coffin, L.F., Jr. A Study of the Effects of Cyclic Thermal Stresses on a Ductile Metal. Trans Met. Soc. ASME 1954, 76, 931–950. [Google Scholar] [CrossRef]
- Manson, S.S. Fatigue: A Complex Subject—Some Simple Approximations. Exp. Mech. 1965, 7, 193–225. [Google Scholar] [CrossRef]


Disclaimer/Publisher’s Note: The statements, opinions and data contained in all publications are solely those of the individual author(s) and contributor(s) and not of MDPI and/or the editor(s). MDPI and/or the editor(s) disclaim responsibility for any injury to people or property resulting from any ideas, methods, instructions or products referred to in the content. |
© 2024 by the authors. Licensee MDPI, Basel, Switzerland. This article is an open access article distributed under the terms and conditions of the Creative Commons Attribution (CC BY) license (https://creativecommons.org/licenses/by/4.0/).