
Personalised High Tibial Osteotomy Surgery Is Accurate: An Assessment Using 3D Distance Mapping


 , ,
, ,  , , , and
Abstract
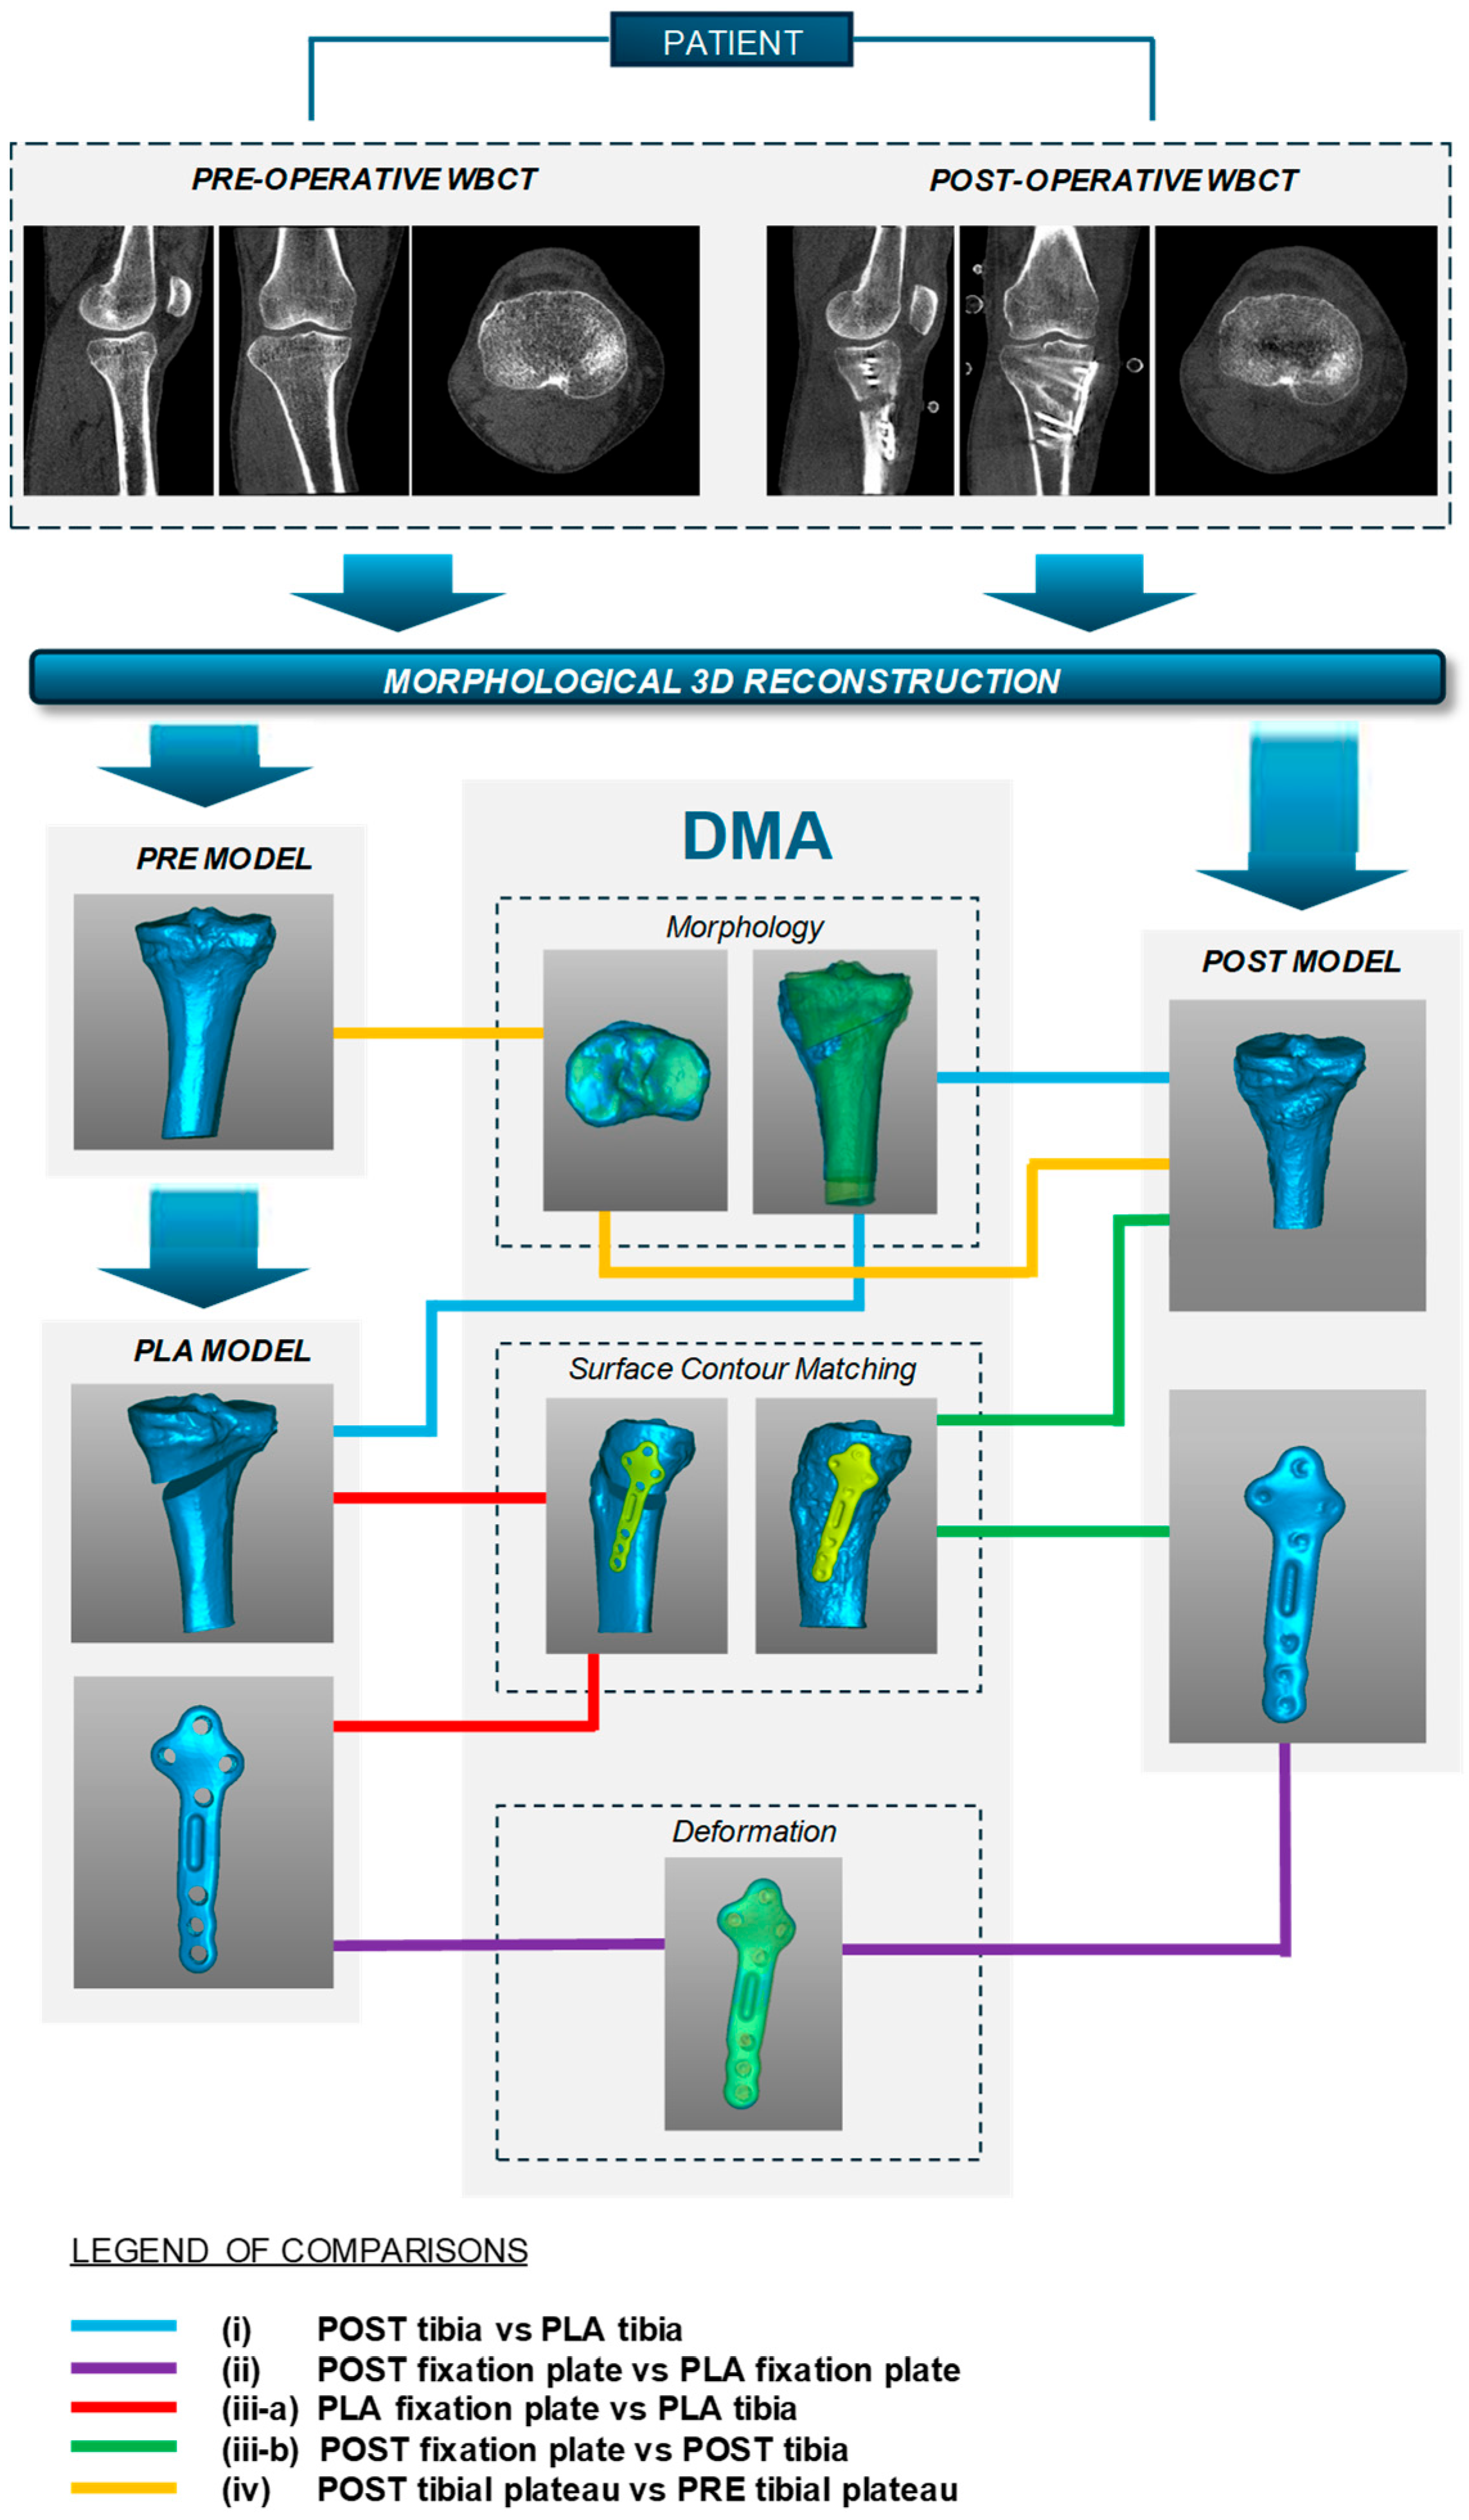
:1. Introduction
2. Materials and Methods
2.1. Study Design
2.2. Patient Cohort
- -
- Inclusion: age 40–65 years; BMI < 40; varus deformity <20°; diagnosis of non-inflammatory degenerative joint disease; mono-compartmental medial knee OA.
- -
- Exclusion: BMI ≥ 40; patients’ inability to provide informed consent; patients’ non-compliance with postoperative rehabilitation and evaluation schedules; patients with comorbidities or with very poor bone quality; other lower limb joint surgeries.
2.3. Imaging, Surgical Planning and Procedure
2.4. Distance Map Analysis
2.5. Data Processing
3. Results
3.1. Radiological and Clinical Evaluations
3.2. DMA Variables
- (i)
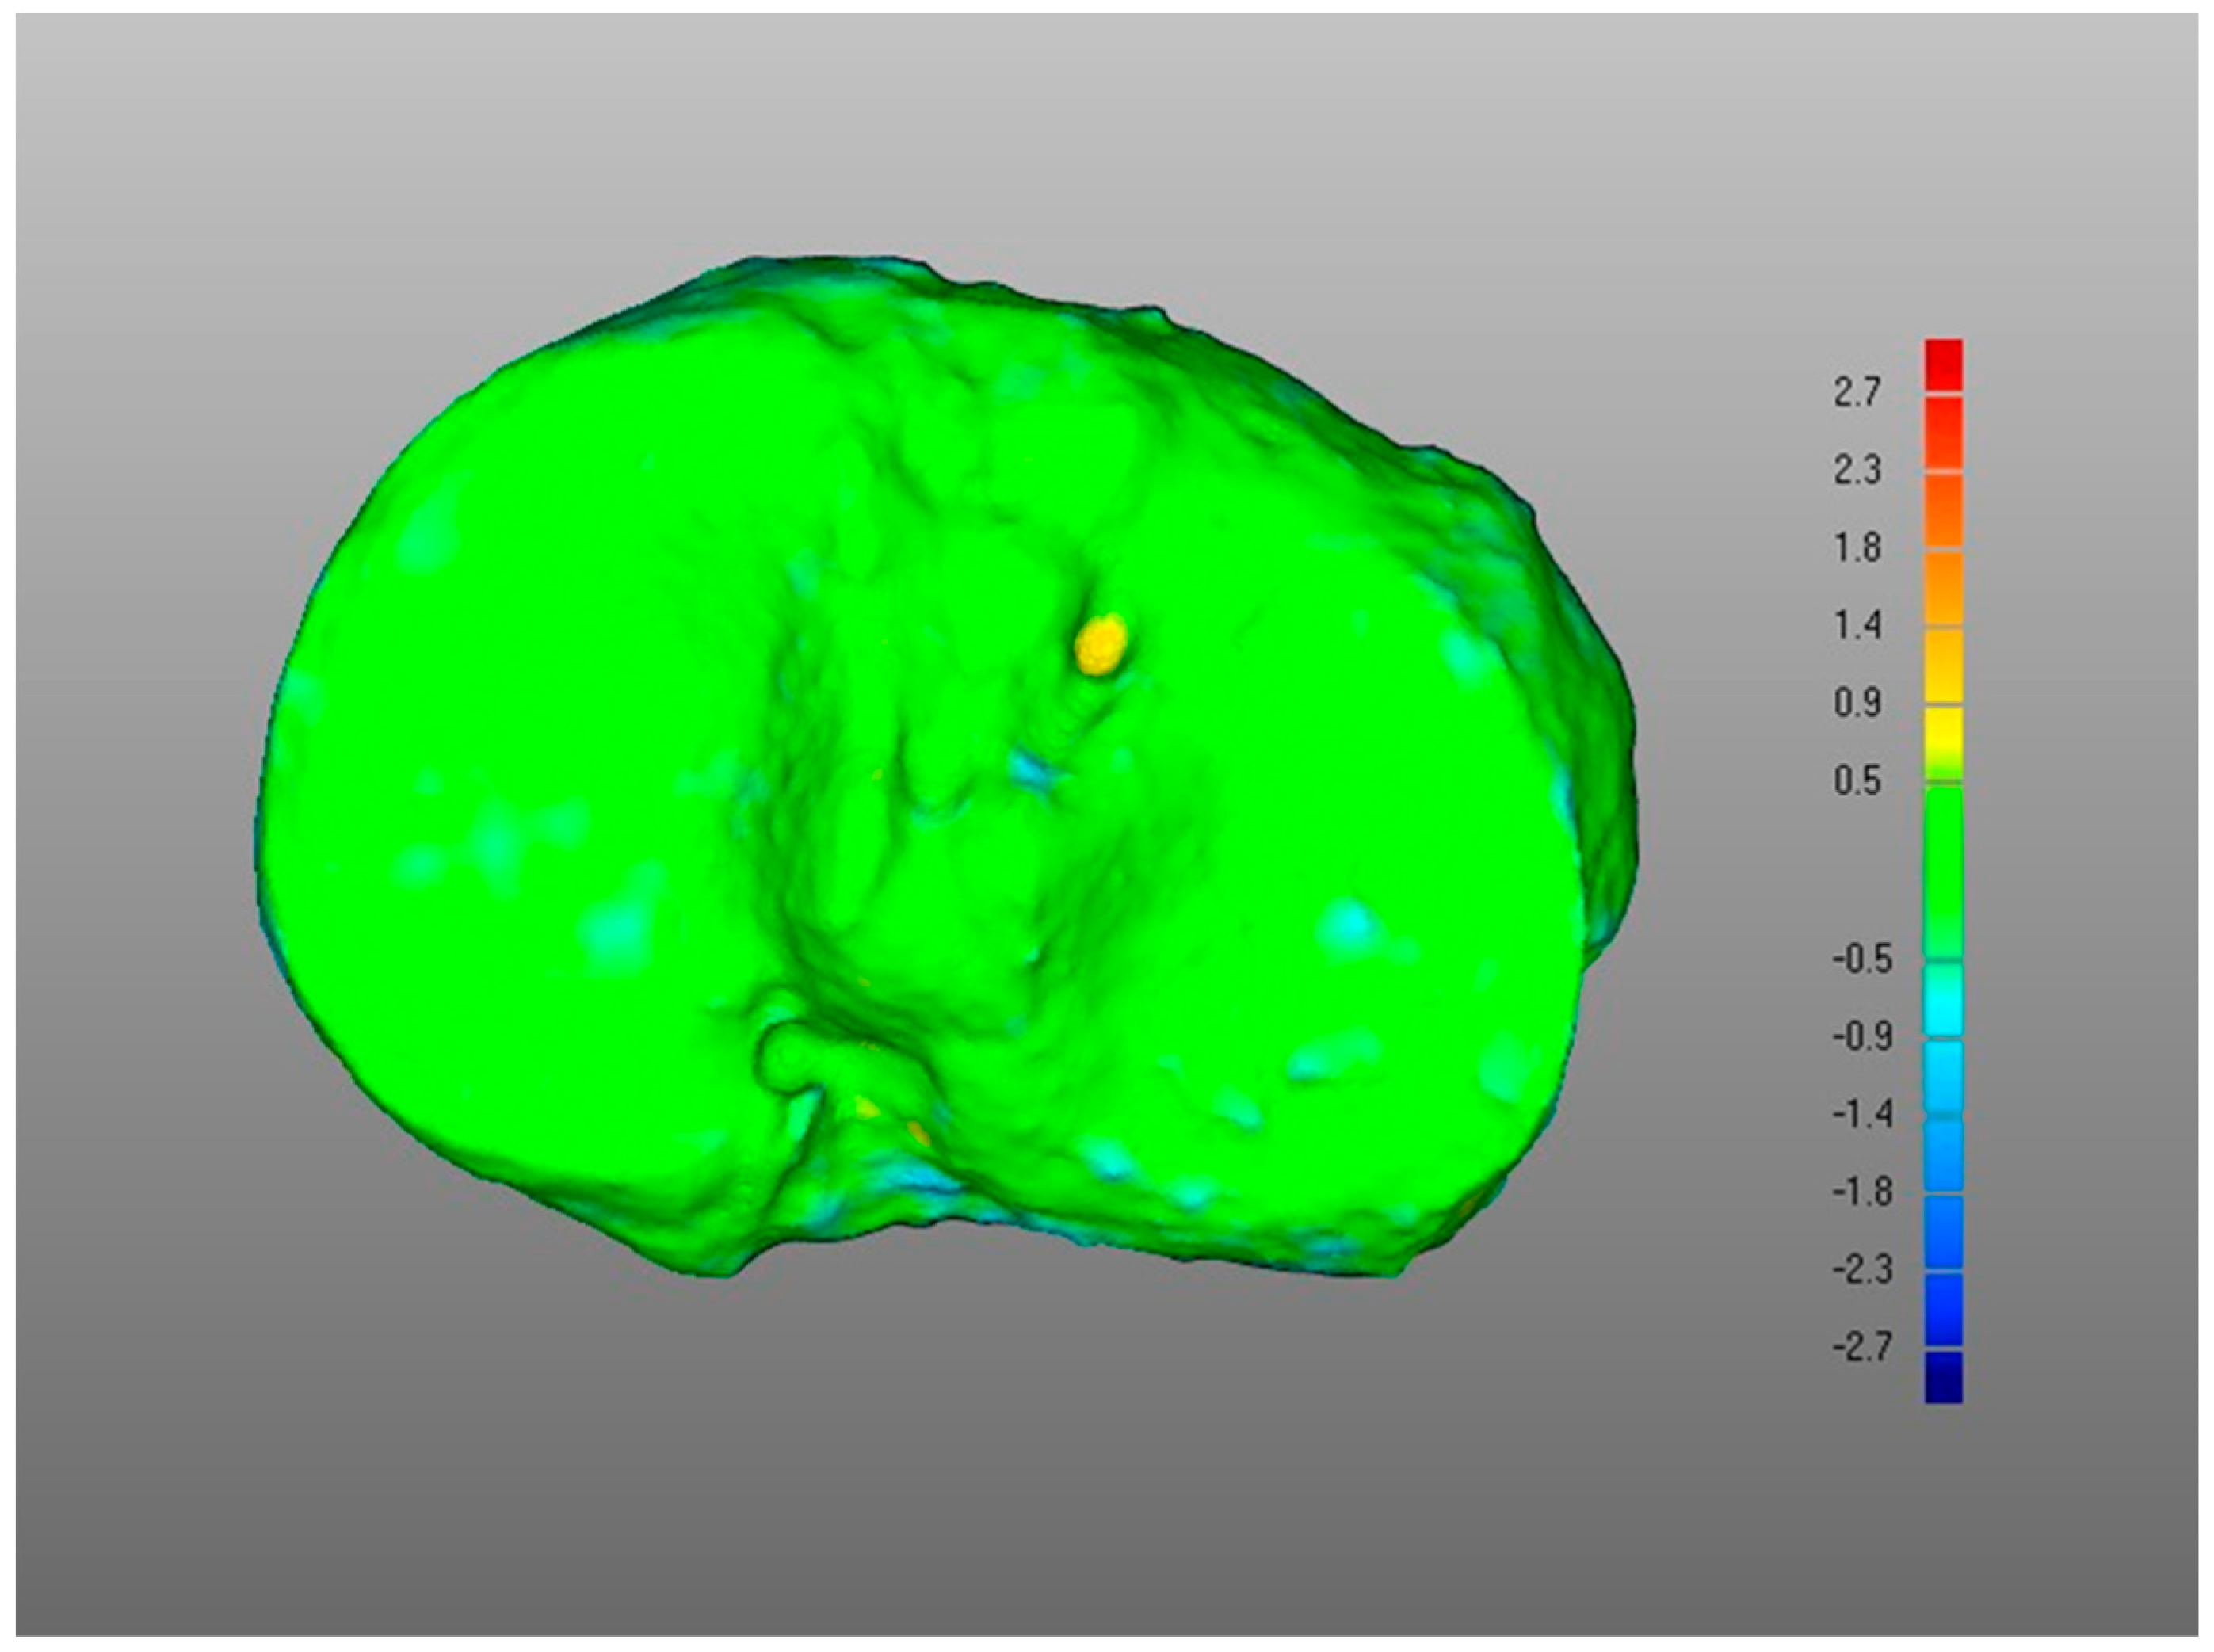
- Overall, a good replication of PLA tibia morphology was achieved in POST (Figure 3 and Figure 4), with average values for of 1.4 mm and of −0.9 mm, associated with very small DMA standard deviation (DSD average value 1.6 mm) over the entire patient cohort (Table 1). Most points were in the safe zone (Table 2), although discrepancies were observed, mainly due to the difficulty of excluding the bone allograft (used to fill the osteotomy cut which is the standard practice of the operating surgeon) during image segmentation, thus altering the morphology of the area around the osteotomy in POST with reference to the corresponding one in PLA.Table 1. DMA outputs (units for all variables mm). = Positive mean Distance, = Negative mean Distance, DSD = DMA standard deviation.Table 1. DMA outputs (units for all variables mm). = Positive mean Distance, = Negative mean Distance, DSD = DMA standard deviation.
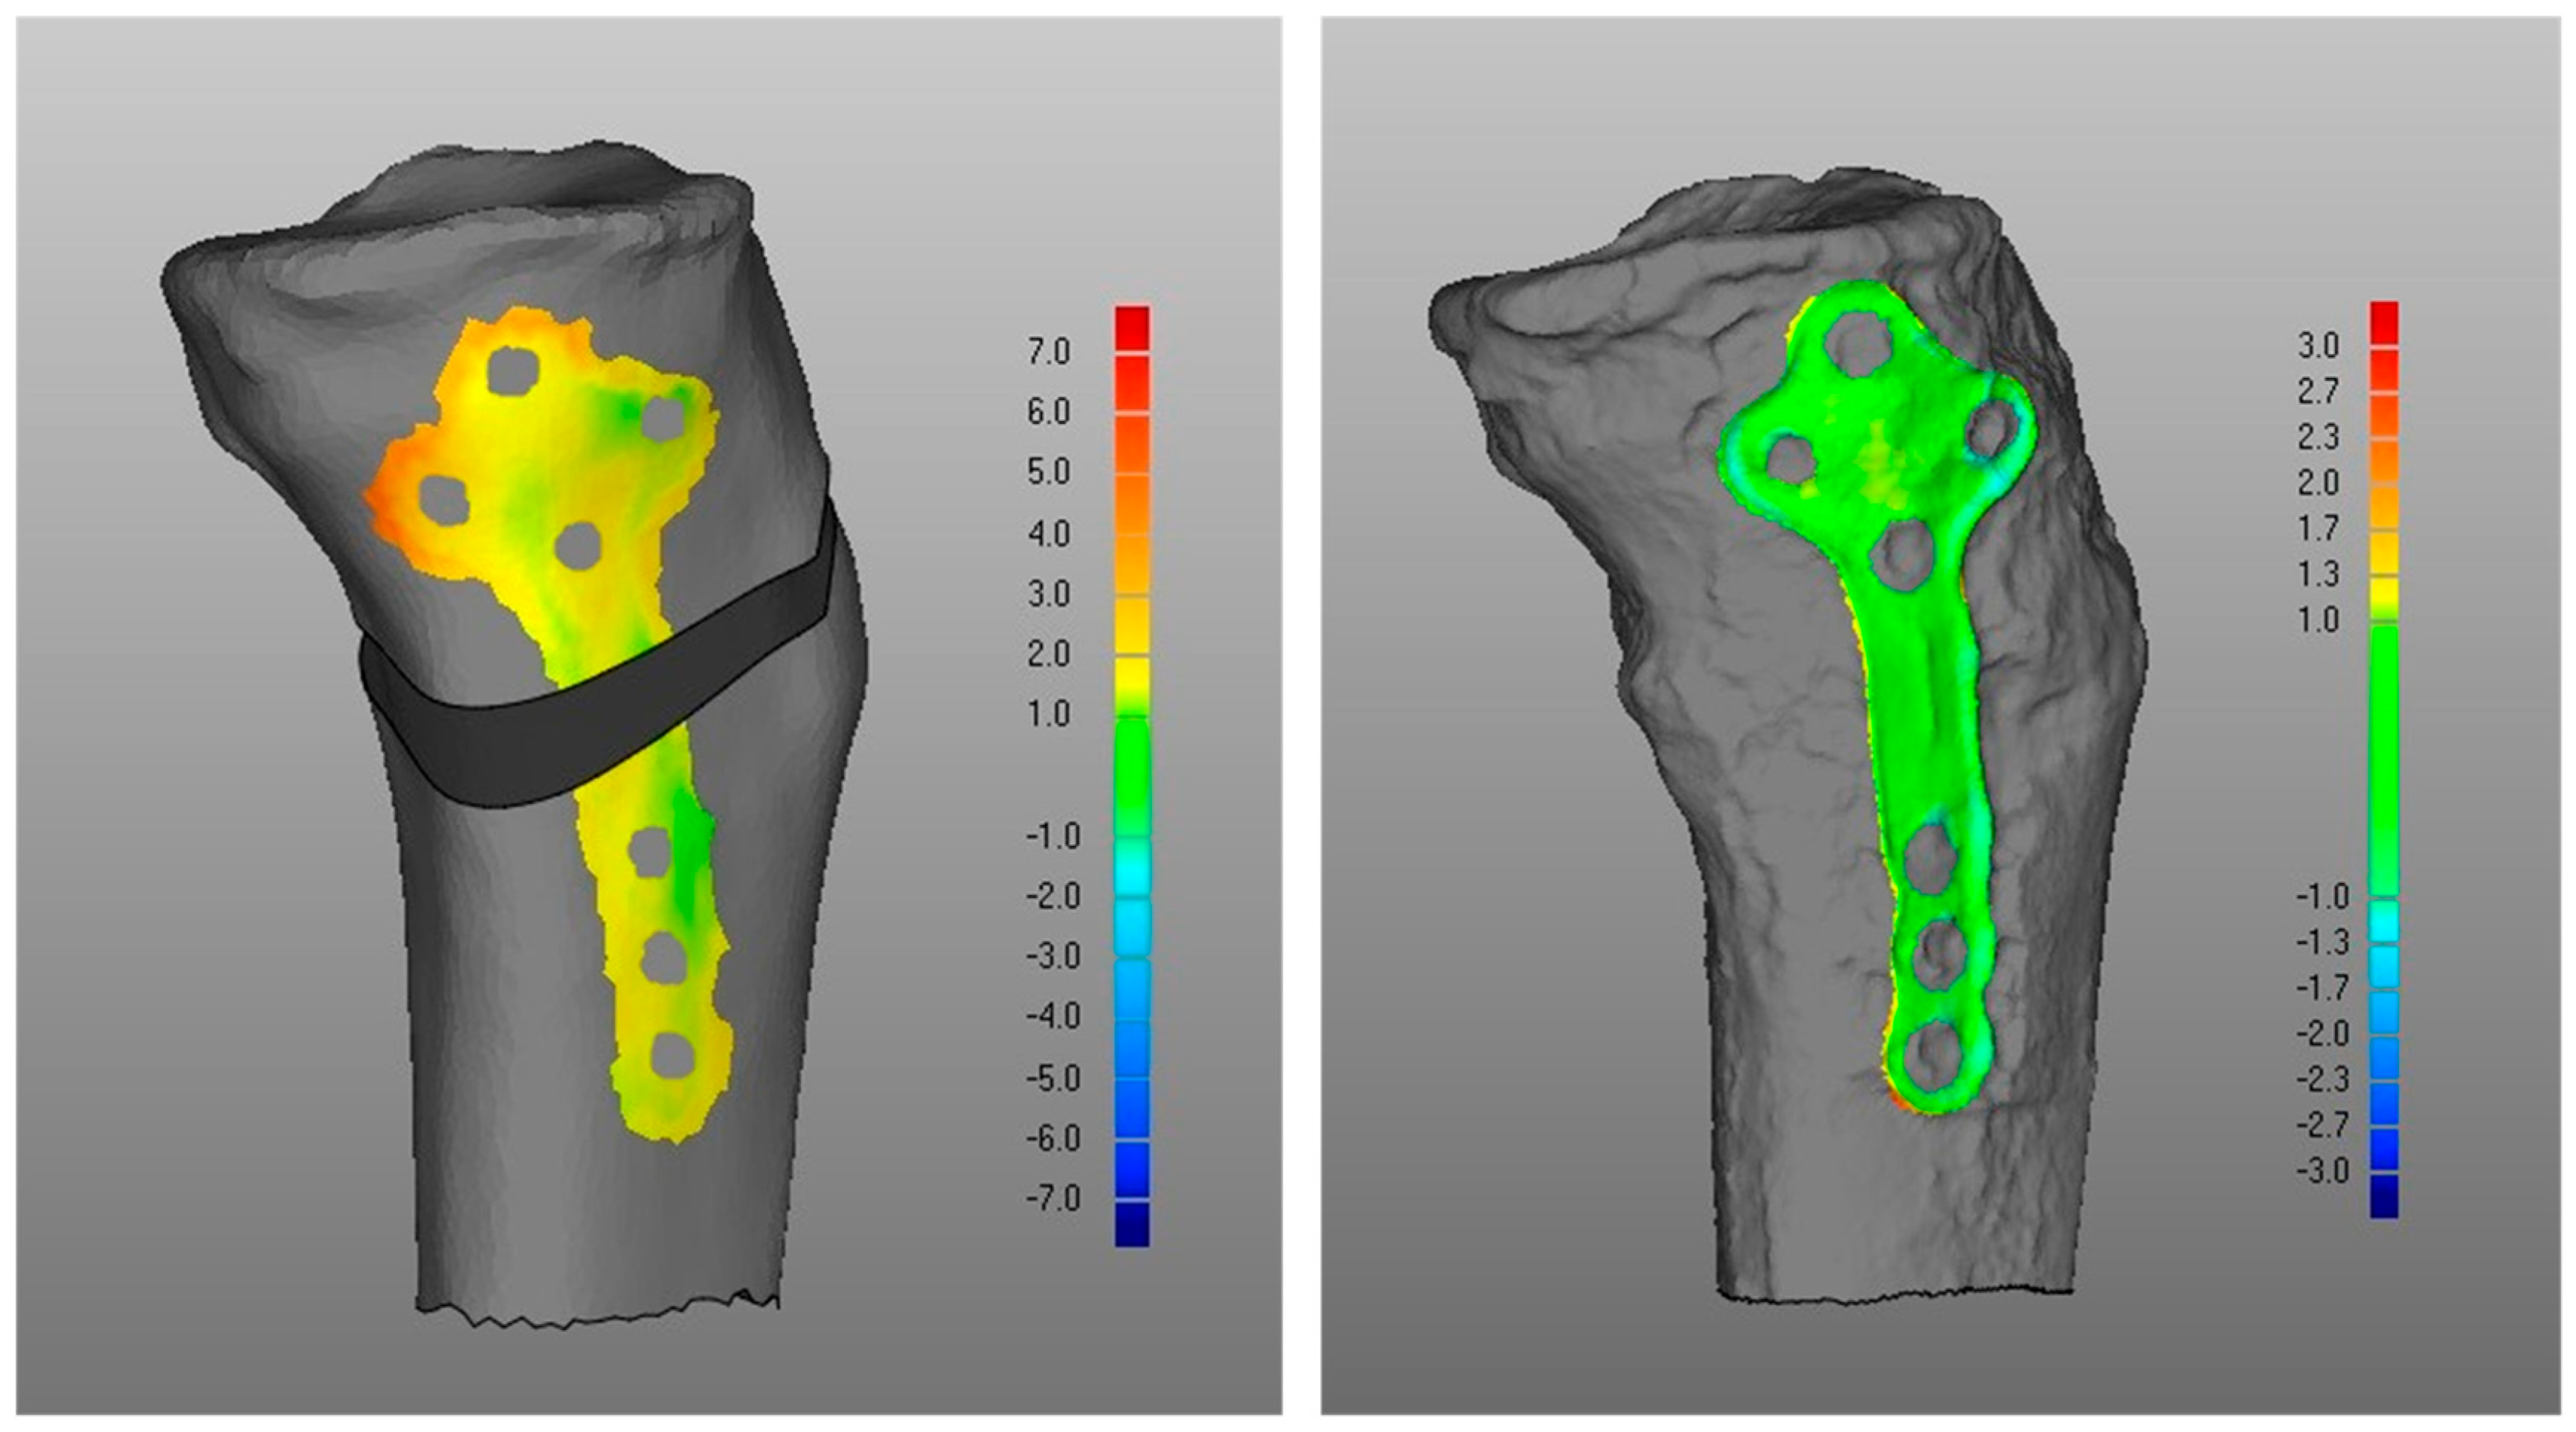
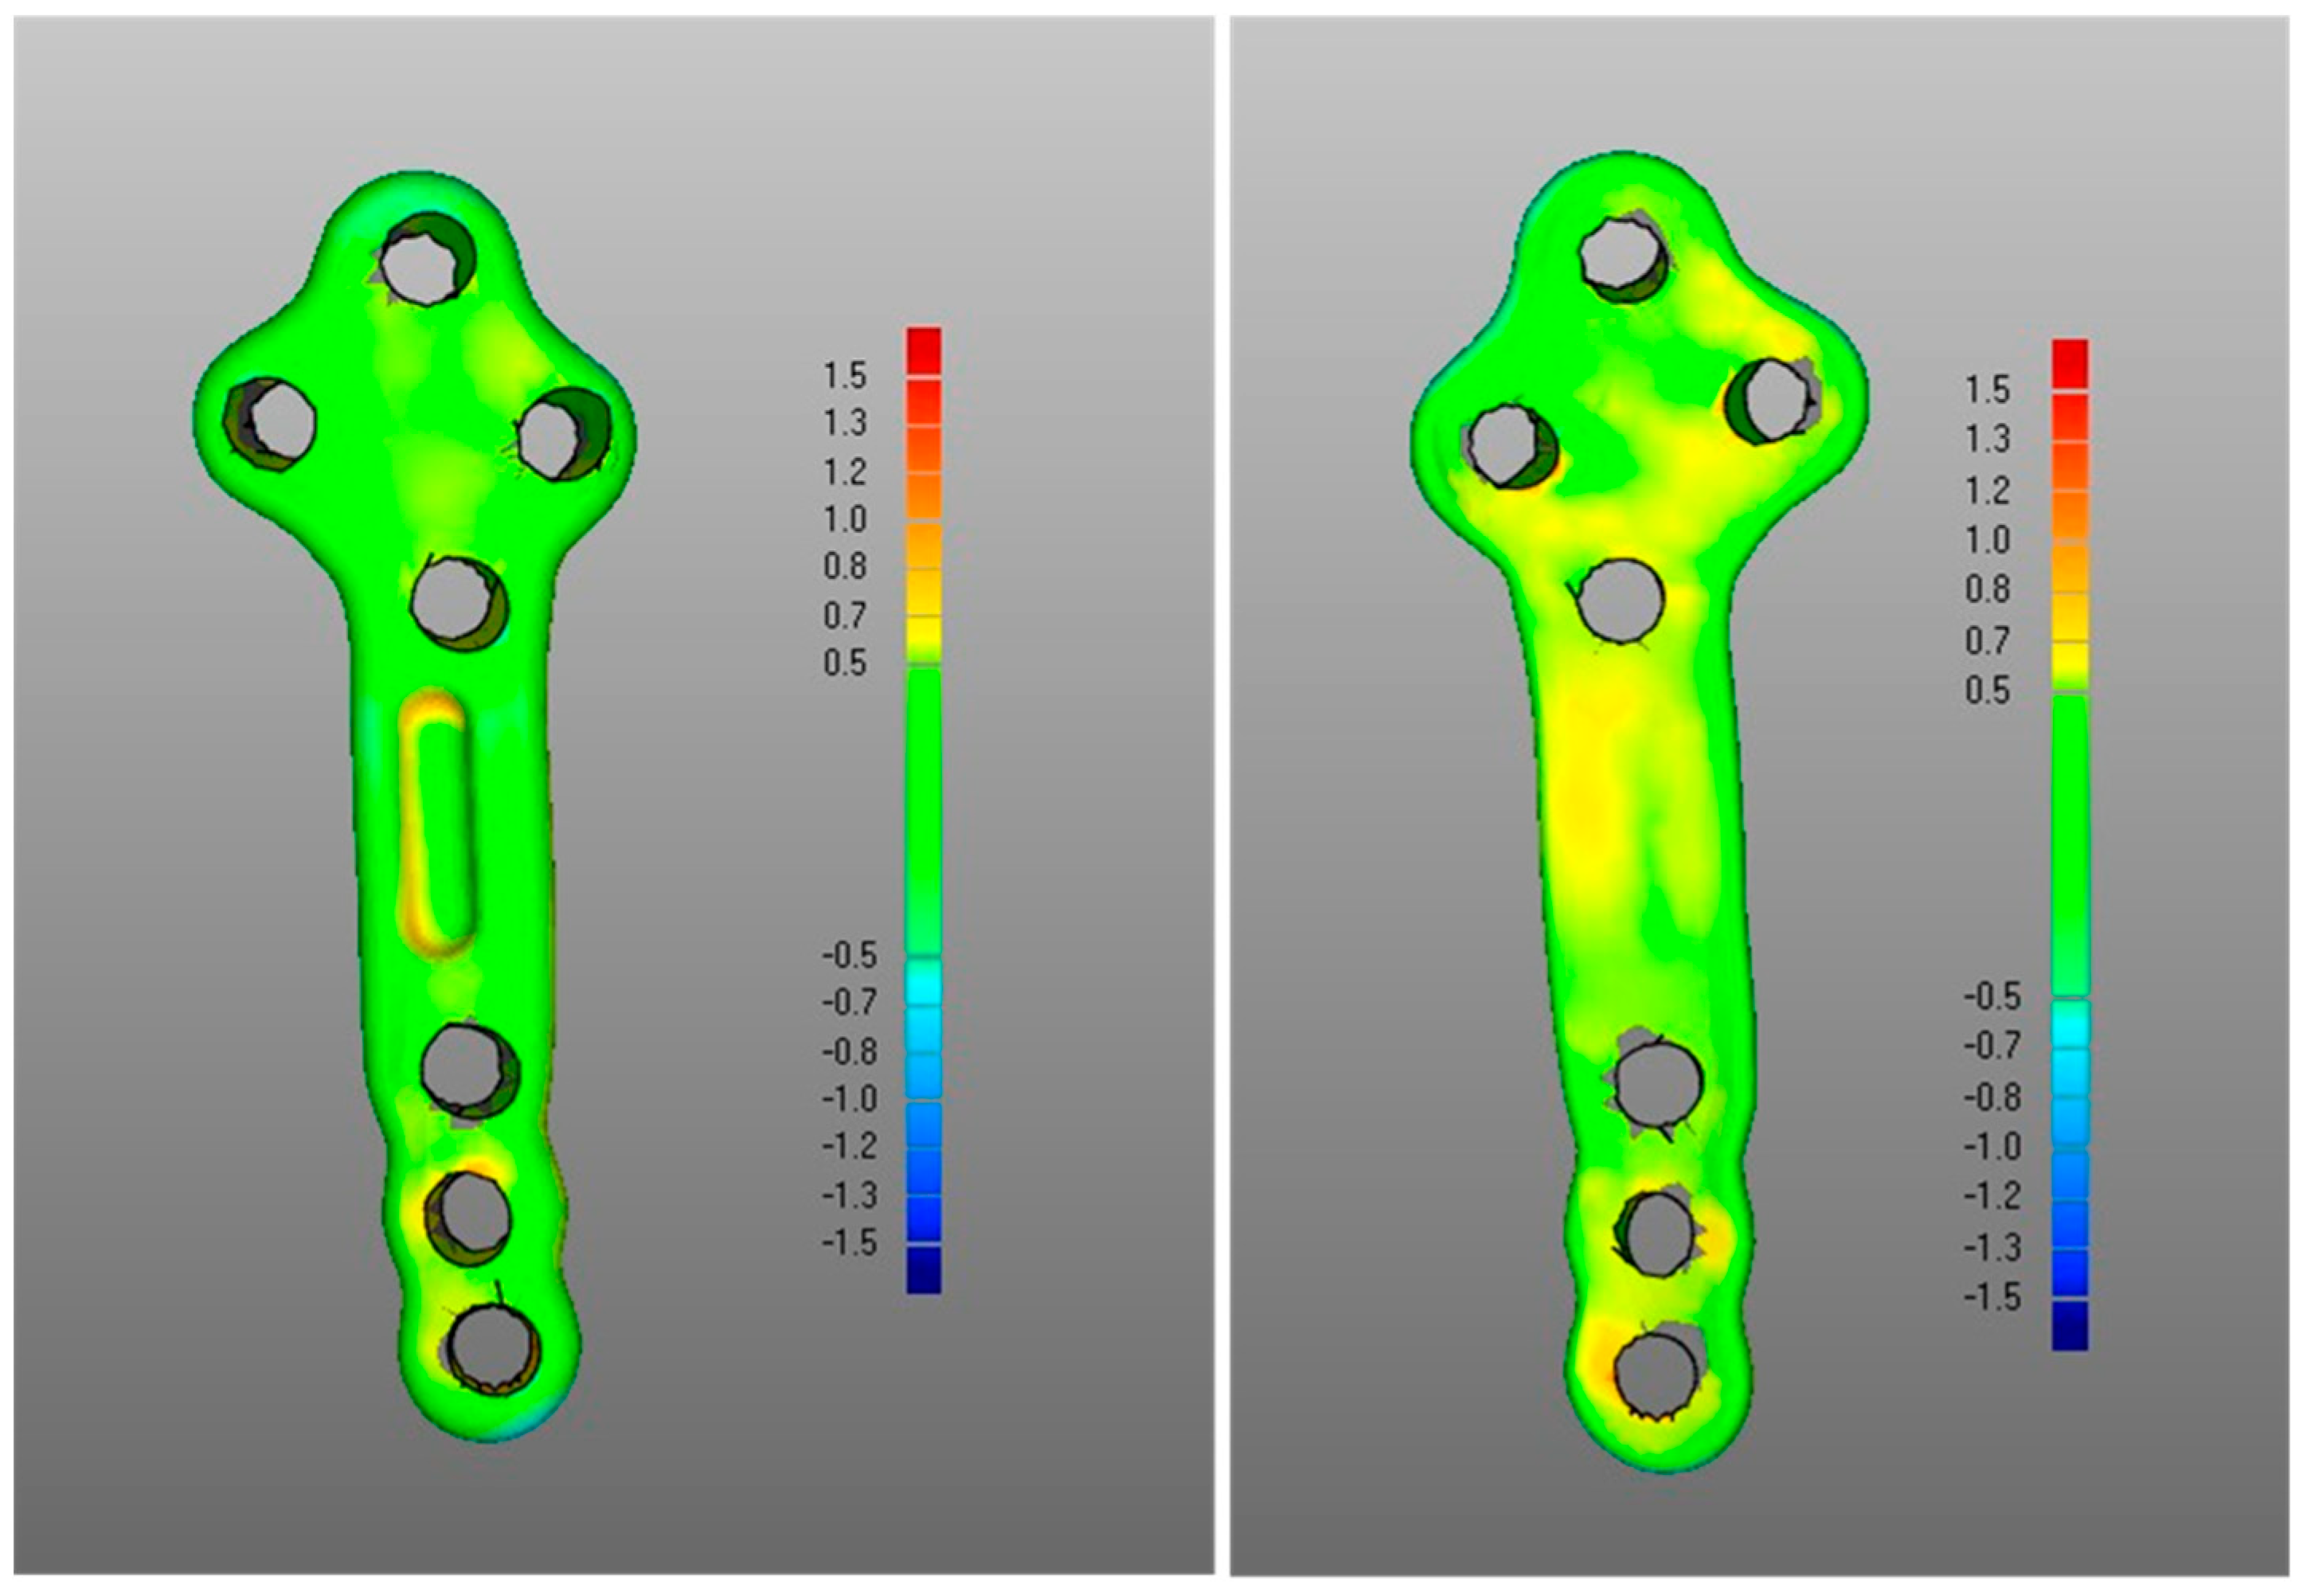
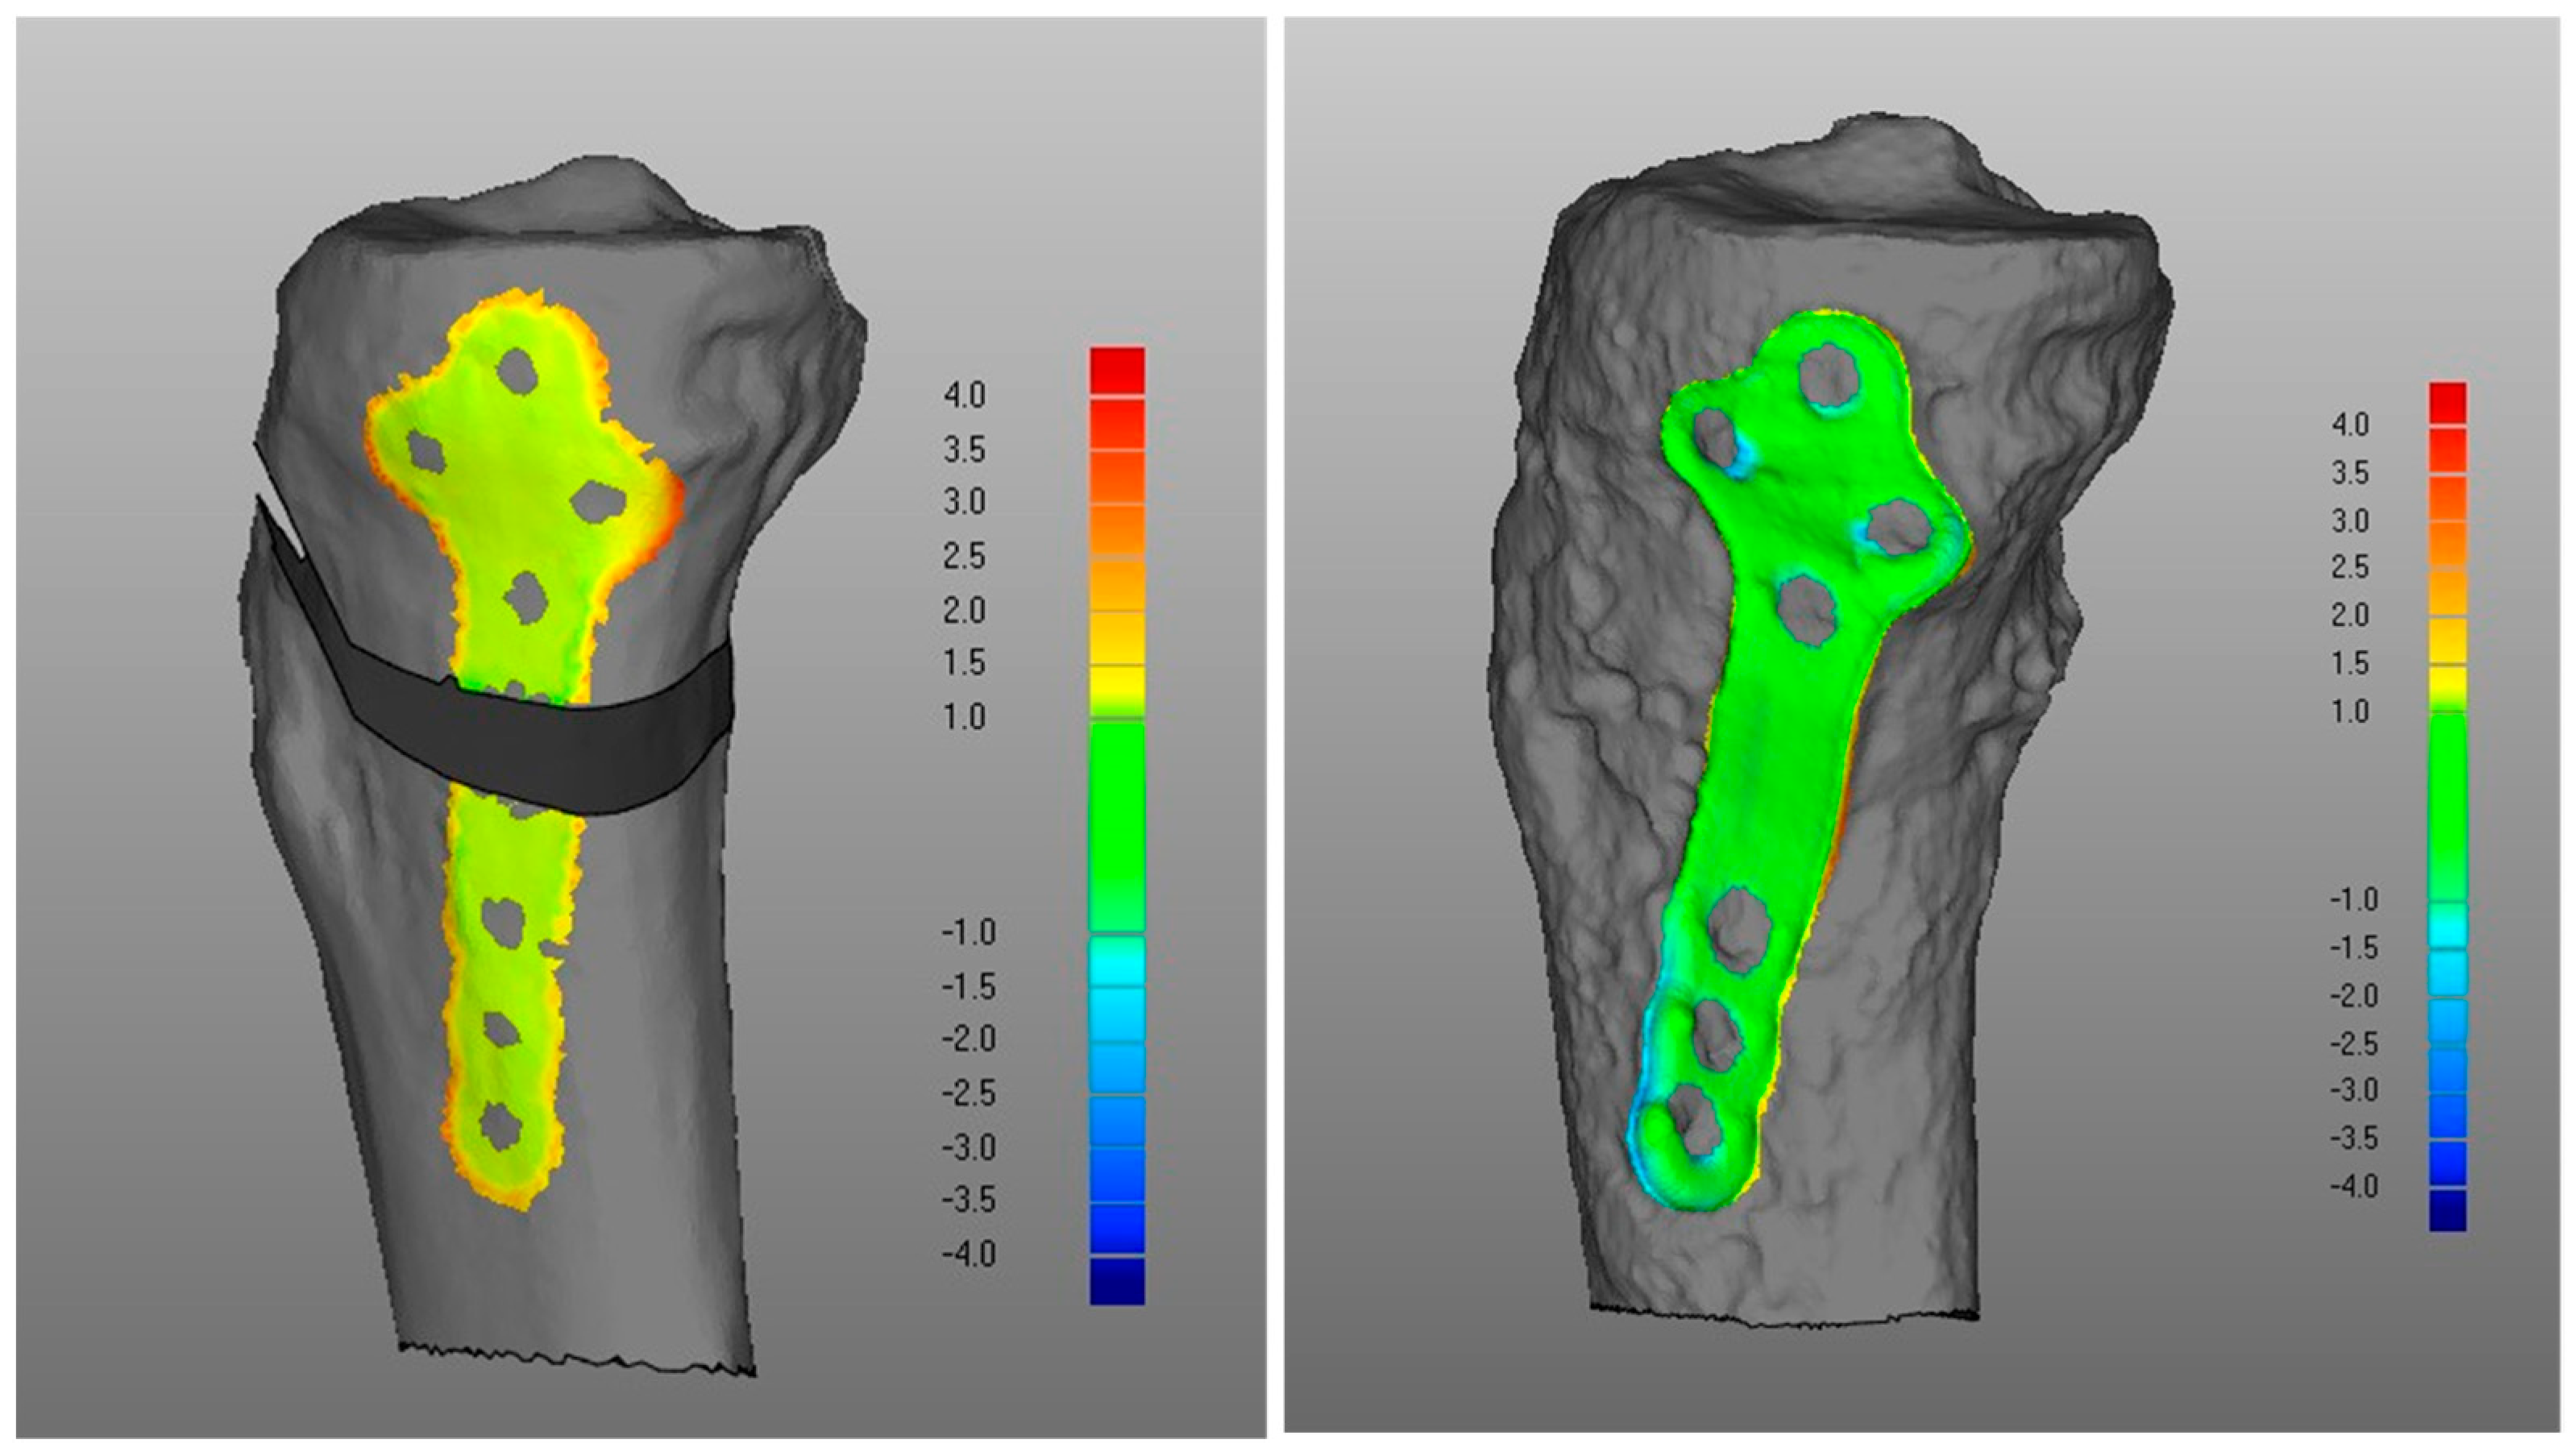
DMA Comparison Variable Mean Median Standard Deviation (i) POST tibia vs. PLA tibia 1.4 1.4 0.5 −0.9 −0.8 0.4 DSD 1.6 1.4 0.5 (ii) POST plate vs. PLA plate 0.4 0.4 0.1 −0.2 −0.2 0.1 DSD 0.4 0.4 0.1 (iii-a) PLA plate vs. PLA tibia 1.3 1.3 0.2 0 0 0 DSD 0.5 0.4 0.2 (iii-b) POST plate vs. POST tibia 0.7 0.6 0.4 −0.3 −0.3 0.2 DSD 0.6 0.5 0.2 (iv) POST tib plateau vs. PRE tib plateau 0.4 0.4 0.2 −0.3 −0.2 0.1 DSD 0.6 0.6 0.2 Figure 3. Boxplots for positive mean distance (), negative mean distance (), and DMA standard deviation (DSD) for all sets of surface comparisons.Figure 3. Boxplots for positive mean distance (), negative mean distance (), and DMA standard deviation (DSD) for all sets of surface comparisons.![Applsci 14 09033 g003]() Figure 4. Screenshot of DMA software depicting (i) POST tibia versus PLA tibia. Data from a representative case, the colour scale gives surface deviation in millimetres.Figure 4. Screenshot of DMA software depicting (i) POST tibia versus PLA tibia. Data from a representative case, the colour scale gives surface deviation in millimetres.
Figure 4. Screenshot of DMA software depicting (i) POST tibia versus PLA tibia. Data from a representative case, the colour scale gives surface deviation in millimetres.Figure 4. Screenshot of DMA software depicting (i) POST tibia versus PLA tibia. Data from a representative case, the colour scale gives surface deviation in millimetres.![Applsci 14 09033 g004]()
- (ii)
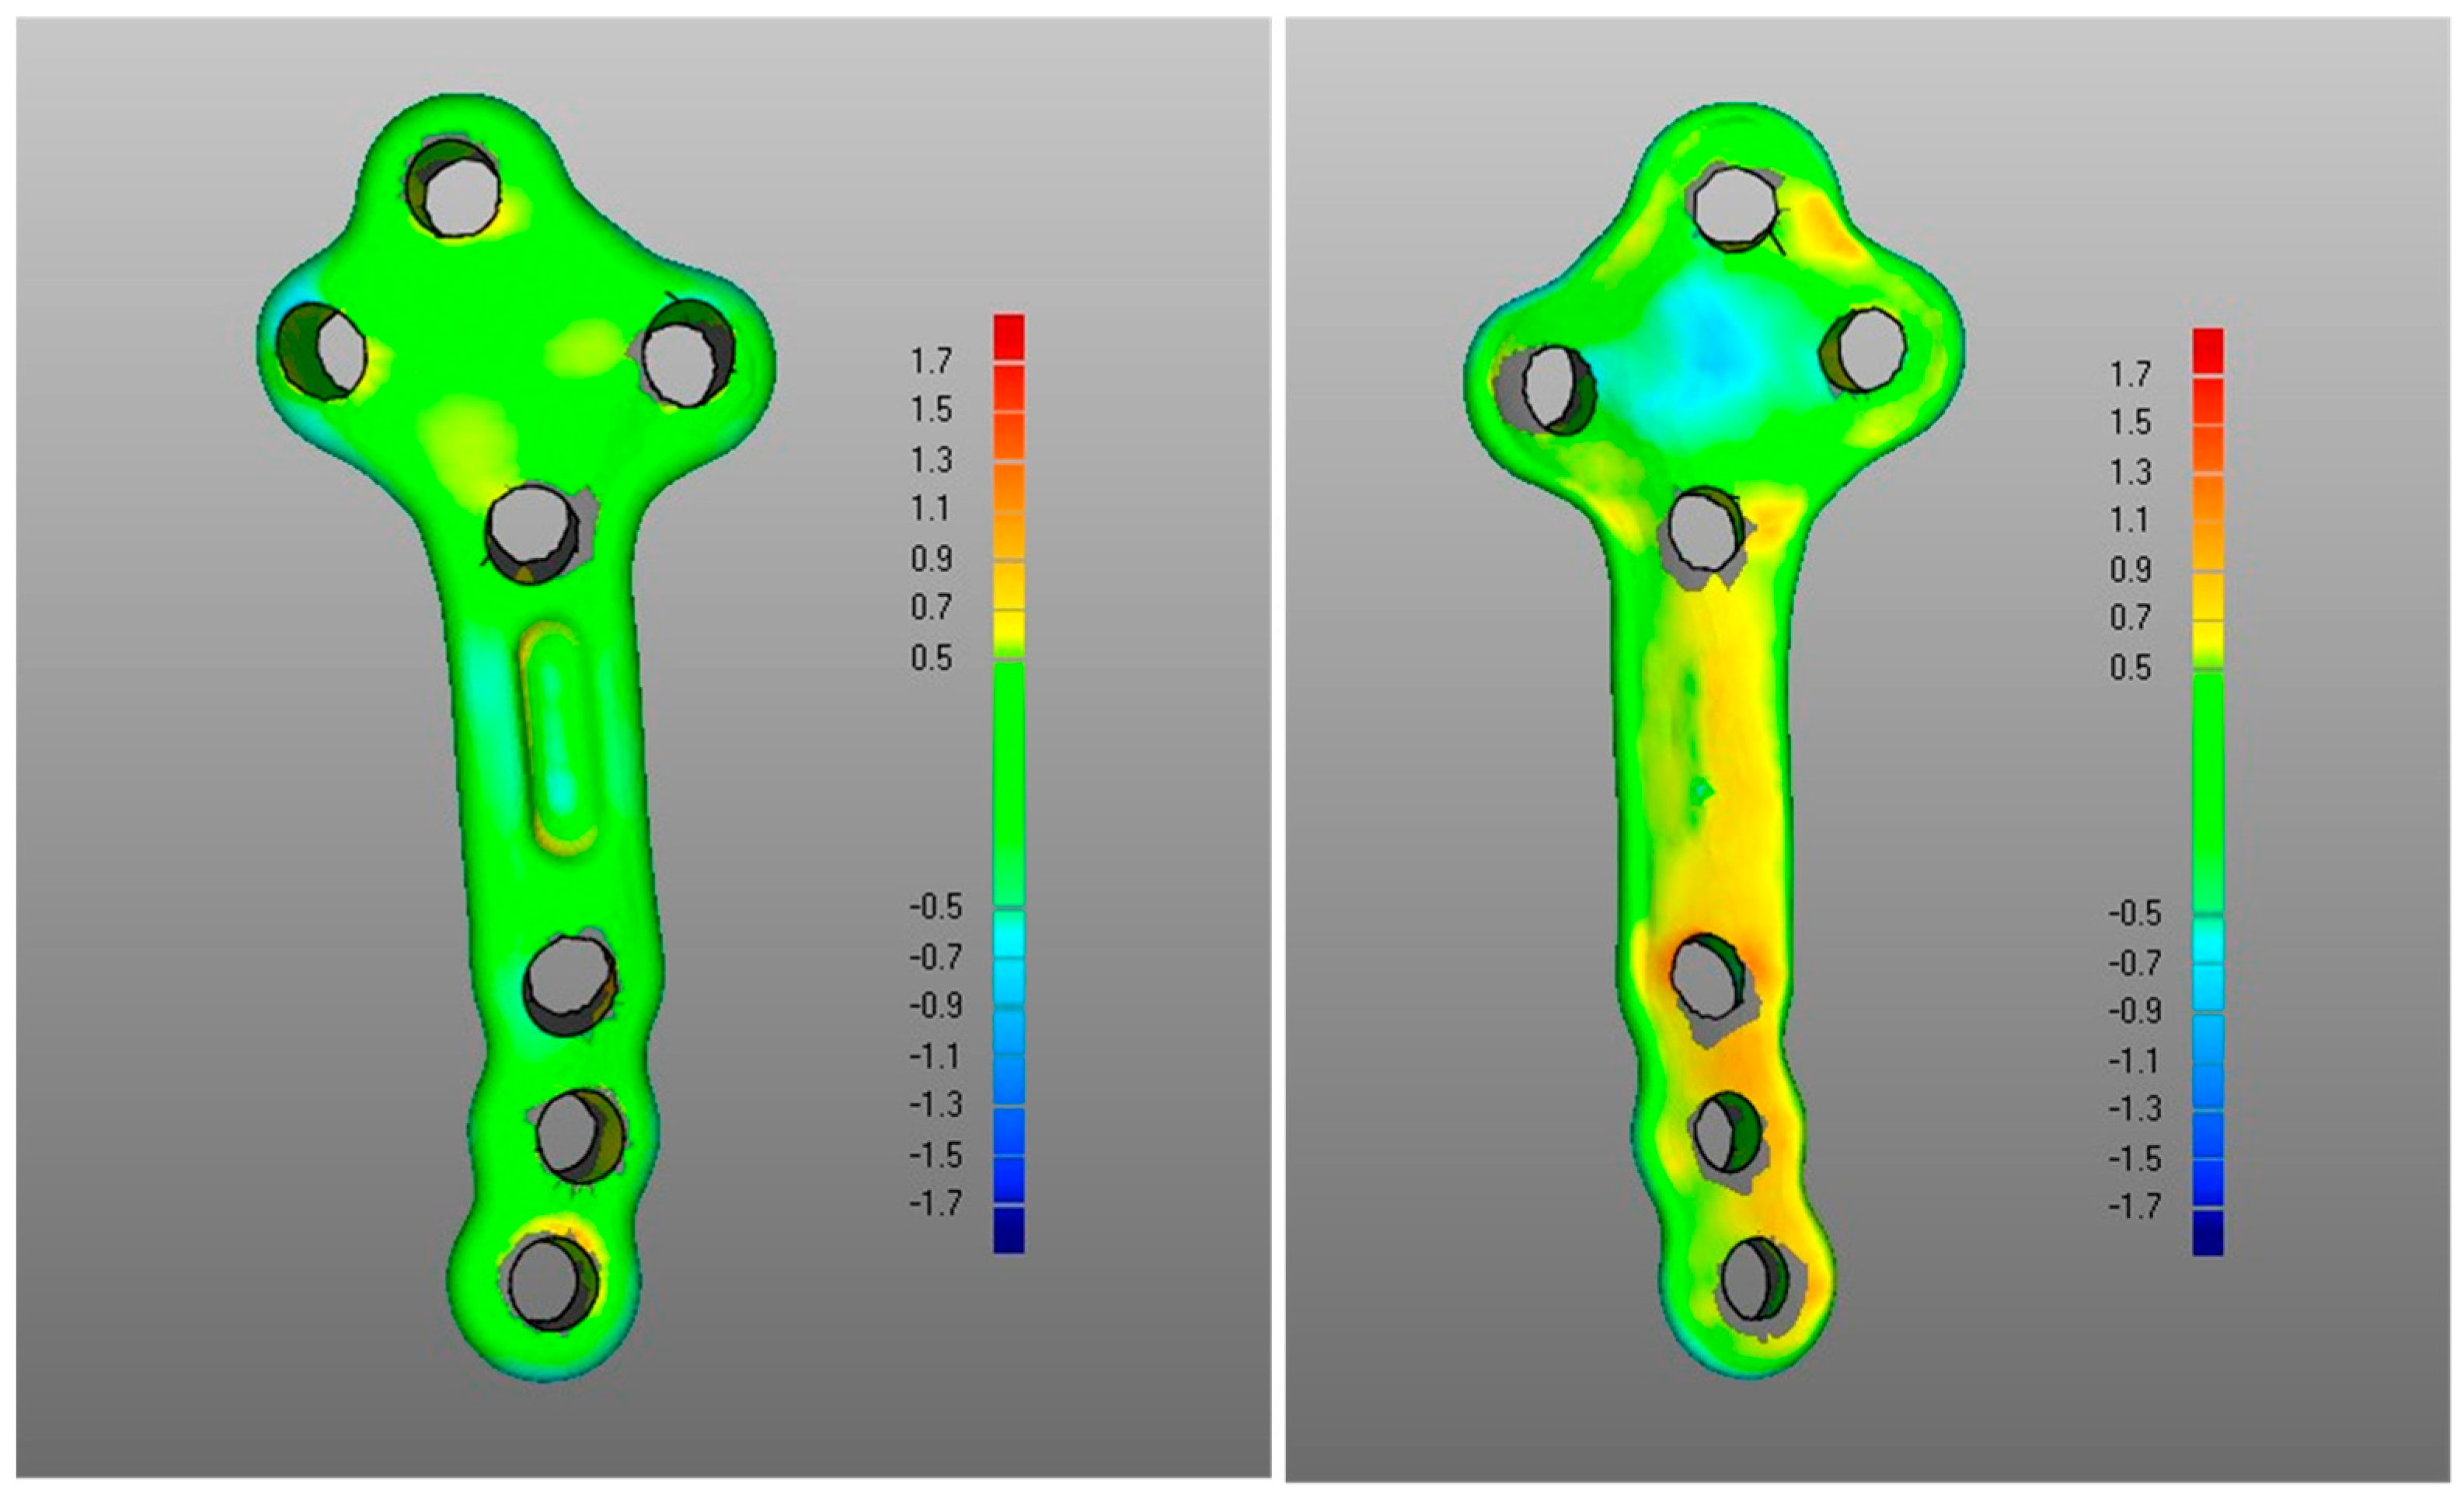
- The DMA values associated with the deformation of the fixation plate (average for was 0.4 mm, was −0.2 mm, with DSD of 0.4 mm) were all less than the critical value, i.e., 1 mm (Table 1) and with most of the points in the safety zone (Table 2), indicating that the overall shape of the metal plate was maintained after surgery at follow-up (Figure 3 and Figure 5).
- (iii)
- Regarding the matching of the plate surface contour to the tibia, the comparison between PLA, i.e., iii-a (Figure 6 left), and POST, i.e., iii-b (Figure 6 right), the low DMA values (Figure 3 and Table 1) reveal a very good replication of the planned contour matching of the plate to the tibia in the POST condition. In iii-a comparison, there was no negative value, i.e., penetration, of the test surface relative to the reference (Table 2).
- (iv)


4. Discussion
5. Conclusions
Author Contributions
Funding
Institutional Review Board Statement
Informed Consent Statement
Data Availability Statement
Conflicts of Interest
Appendix A
| DMA Comparisons | Parameter | Mean | Median | Standard Deviation | |
|---|---|---|---|---|---|
| (i) | POST tibia vs. PLA tibia | PMD | 7.4 | 7.2 | 2.3 |
| NMD | −5.4 | −5.2 | 1.4 | ||
| 1.4 | 1.4 | 0.5 | |||
| −0.9 | −0.8 | 0.4 | |||
| DSD | 1.6 | 1.4 | 0.5 | ||
| (ii) | POST fixation plate vs. PLA fixation plate | PMD | 2.3 | 1.9 | 1.2 |
| NMD | −1.9 | −1.8 | 0.5 | ||
| 0.4 | 0.4 | 0.1 | |||
| −0.2 | −0.2 | 0.1 | |||
| DSD | 0.4 | 0.4 | 0.1 | ||
| (iii-a) | PLA fixation plate vs. PLA tibia | PMD | 5.0 | 4.8 | 1.2 |
| NMD | 0.0 | 0.0 | 0.0 | ||
| 1.3 | 1.3 | 0.2 | |||
| 0.0 | 0.0 | 0.0 | |||
| DSD | 0.5 | 0.4 | 0.2 | ||
| (iii-b) | POST fixation plate vs. POST tibia | PMD | 3.2 | 3.3 | 1.2 |
| NMD | −1.6 | −1.4 | 1.1 | ||
| 0.7 | 0.6 | 0.4 | |||
| −0.3 | −0.3 | 0.2 | |||
| DSD | 0.6 | 0.5 | 0.2 | ||
| (iv) | POST tibial plateau vs. PRE tibial plateau | PMD | 3.8 | 3.2 | 1.8 |
| NMD | −2.3 | −2.0 | 1.3 | ||
| 0.4 | 0.4 | 0.2 | |||
| −0.3 | −0.2 | 0.1 | |||
| DSD | 0.6 | 0.6 | 0.2 |
Appendix B

References
- Peat, G.; McCarney, R.; Croft, P. Knee pain and osteoarthritis in older adults: A review of community burden and current use of primary health care. Ann. Rheum. Dis. 2001, 60, 91–97. [Google Scholar] [CrossRef] [PubMed]
- Hermans, J.; Koopmanschap, M.A.; Bierma-Zeinstra, S.M.; van Linge, J.H.; Verhaar, J.A.; Reijman, M.; Burdorf, A. Productivity costs and medical costs among working patients with knee osteoarthritis. Arthritis Care Res. 2012, 64, 853–861. [Google Scholar] [CrossRef] [PubMed]
- Xie, F.; Kovic, B.; Jin, X.; He, X.; Wang, M.; Silvestre, C. Economic and Humanistic Burden of Osteoarthritis: A Systematic Review of Large Sample Studies. Pharmacoeconomics 2016, 34, 1087–1100. [Google Scholar] [CrossRef] [PubMed]
- Cui, A.; Li, H.; Wang, D.; Zhong, J.; Chen, Y.; Lu, H. Global, regional prevalence, incidence and risk factors of knee osteoarthritis in population-based studies. EClinicalMedicine 2020, 29–30, 100587. [Google Scholar] [CrossRef]
- Prieto-Alhambra, D.; Judge, A.; Javaid, M.K.; Cooper, C.; Diez-Perez, A.; Arden, N.K. Incidence and risk factors for clinically diagnosed knee, hip and hand osteoarthritis: Influences of age, gender and osteoarthritis affecting other joints. Ann. Rheum. Dis. 2014, 73, 1659–1664. [Google Scholar] [CrossRef] [PubMed]
- Nguyen, U.S.; Zhang, Y.; Zhu, Y.; Niu, J.; Zhang, B.; Felson, D.T. Increasing prevalence of knee pain and symptomatic knee osteoarthritis: Survey and cohort data. Ann. Intern. Med. 2011, 155, 725–732. [Google Scholar] [CrossRef] [PubMed]
- Turkiewicz, A.; Petersson, I.F.; Bjork, J.; Hawker, G.; Dahlberg, L.E.; Lohmander, L.S.; Englund, M. Current and future impact of osteoarthritis on health care: A population-based study with projections to year 2032. Osteoarthr. Cartil. 2014, 22, 1826–1832. [Google Scholar] [CrossRef] [PubMed]
- Perruccio, A.V.; Power, J.D.; Badley, E.M. Revisiting arthritis prevalence projections—It’s more than just the aging of the population. J. Rheumatol. 2006, 33, 1856–1862. [Google Scholar] [PubMed]
- Wallace, I.J.; Worthington, S.; Felson, D.T.; Jurmain, R.D.; Wren, K.T.; Maijanen, H.; Woods, R.J.; Lieberman, D.E. Knee osteoarthritis has doubled in prevalence since the mid-20th century. Proc. Natl. Acad. Sci. USA 2017, 114, 9332–9336. [Google Scholar] [CrossRef] [PubMed]
- Swain, S.; Coupland, C.; Strauss, V.; Mallen, C.; Kuo, C.F.; Sarmanova, A.; Bierma-Zeinstra, S.M.A.; Englund, M.; Prieto-Alhambra, D.; Doherty, M.; et al. Clustering of comorbidities and associated outcomes in people with osteoarthritis—A UK Clinical Practice Research Datalink study. Osteoarthr. Cartil. 2022, 30, 702–713. [Google Scholar] [CrossRef] [PubMed]
- Cleveland, R.J.; Alvarez, C.; Schwartz, T.A.; Losina, E.; Renner, J.B.; Jordan, J.M.; Callahan, L.F. The impact of painful knee osteoarthritis on mortality: A community-based cohort study with over 24 years of follow-up. Osteoarthr. Cartil. 2019, 27, 593–602. [Google Scholar] [CrossRef] [PubMed]
- Patel, A.; Pavlou, G.; Mujica-Mota, R.E.; Toms, A.D. The epidemiology of revision total knee and hip arthroplasty in England and Wales: A comparative analysis with projections for the United States. A study using the National Joint Registry dataset. Bone Joint J. 2015, 97-B, 1076–1081. [Google Scholar] [CrossRef] [PubMed]
- Kurtz, S.; Ong, K.; Lau, E.; Mowat, F.; Halpern, M. Projections of primary and revision hip and knee arthroplasty in the United States from 2005 to 2030. J. Bone Joint Surg. Am. 2007, 89, 780–785. [Google Scholar] [CrossRef] [PubMed]
- National Institute for Health and Care Excellence (NICE). Evidence Review for Total Knee Replacement: Guideline (NICE Guideline, No. 157); National Guideline Centre: London, UK, 2020. [Google Scholar]
- London, N.J.; Miller, L.E.; Block, J.E. Clinical and economic consequences of the treatment gap in knee osteoarthritis management. Med. Hypotheses 2011, 76, 887–892. [Google Scholar] [CrossRef] [PubMed]
- Silverman, S.; Thakkar, S.; Sell, H.; White, A.G.; Downes, N.; Pajerowski, W.; Robinson, R.L.; Beck, C.G.; Emir, B.; Schepman, P. All-Cause Health Care and Work Loss Burden Associated With Nonsteroidal Anti-Inflammatory Drug and Opioid Treatment in Employed Patients With Osteoarthritis. J. Occup. Environ. Med. 2022, 64, 699–706. [Google Scholar] [CrossRef] [PubMed]
- Silverman, S.; Rice, J.B.; White, A.G.; Beck, C.G.; Robinson, R.L.; Fernan, C.; Schepman, P. Clinical and economic burden of prescribing tramadol and other opioids for patients with osteoarthritis in a commercially insured population in the United States. Pain 2022, 163, 75–82. [Google Scholar] [CrossRef] [PubMed]
- Yu, D.; Hellberg, C.; Appleyard, T.; Dell’Isola, A.; Thomas, G.E.R.; Turkiewicz, A.; Englund, M.; Peat, G. Opioid use prior to total knee replacement: Comparative analysis of trends in England and Sweden. Osteoarthr. Cartil. 2022, 30, 815–822. [Google Scholar] [CrossRef] [PubMed]
- Ledingham, J.; Regan, M.; Jones, A.; Doherty, M. Radiographic patterns and associations of osteoarthritis of the knee in patients referred to hospital. Ann. Rheum. Dis. 1993, 52, 520–526. [Google Scholar] [CrossRef] [PubMed]
- Zuiderbaan, H.A.; van der List, J.P.; Kleeblad, L.J.; Appelboom, P.; Kort, N.P.; Pearle, A.D.; Rademakers, M.V. Modern Indications, Results, and Global Trends in the Use of Unicompartmental Knee Arthroplasty and High Tibial Osteotomy in the Treatment of Isolated Medial Compartment Osteoarthritis. Am. J. Orthop. 2016, 45, E355–E361. [Google Scholar] [PubMed]
- Santoso, M.B.; Wu, L. Unicompartmental knee arthroplasty, is it superior to high tibial osteotomy in treating unicompartmental osteoarthritis? A meta-analysis and systemic review. J. Orthop. Surg. Res. 2017, 12, 50. [Google Scholar] [CrossRef]
- Spahn, G.; Hofmann, G.O.; von Engelhardt, L.V.; Li, M.; Neubauer, H.; Klinger, H.M. The impact of a high tibial valgus osteotomy and unicondylar medial arthroplasty on the treatment for knee osteoarthritis: A meta-analysis. Knee Surg. Sports Traumatol. Arthrosc. 2013, 21, 96–112. [Google Scholar] [CrossRef] [PubMed]
- Cao, Z.; Mai, X.; Wang, J.; Feng, E.; Huang, Y. Unicompartmental Knee Arthroplasty vs High Tibial Osteotomy for Knee Osteoarthritis: A Systematic Review and Meta-Analysis. J. Arthroplast. 2018, 33, 952–959. [Google Scholar] [CrossRef] [PubMed]
- Hunt, L.P.; Blom, A.W.; Matharu, G.S.; Kunutsor, S.K.; Beswick, A.D.; Wilkinson, J.M.; Whitehouse, M.R. Patients Receiving a Primary Unicompartmental Knee Replacement Have a Higher Risk of Revision but a Lower Risk of Mortality Than Predicted Had They Received a Total Knee Replacement: Data From the National Joint Registry for England, Wales, Northern Ireland, and the Isle of Man. J. Arthroplast. 2021, 36, 471–477. [Google Scholar] [CrossRef]
- Hansen, E.N.; Ong, K.L.; Lau, E.; Kurtz, S.M.; Lonner, J.H. Unicondylar Knee Arthroplasty Has Fewer Complications but Higher Revision Rates Than Total Knee Arthroplasty in a Study of Large United States Databases. J. Arthroplast. 2019, 34, 1617–1625. [Google Scholar] [CrossRef] [PubMed]
- Di Martino, A.; Bordini, B.; Barile, F.; Ancarani, C.; Digennaro, V.; Faldini, C. Unicompartmental knee arthroplasty has higher revisions than total knee arthroplasty at long term follow-up: A registry study on 6453 prostheses. Knee Surg. Sports Traumatol. Arthrosc. 2021, 29, 3323–3329. [Google Scholar] [CrossRef] [PubMed]
- Ben-Shlomo, Y.; Blom, A.; Boulton, C.; Brittain, R.; Clark, E.; Dawson-Bowling, S.; Deere, K.; Esler, C.; Espinoza, O.; Goldberg, A.; et al. The National Joint Registry 18th Annual Report 2021; National Joint Registry: London, UK, 2021. [Google Scholar] [PubMed]
- Van den Bempt, M.; Van Genechten, W.; Claes, T.; Claes, S. How accurately does high tibial osteotomy correct the mechanical axis of an arthritic varus knee? A systematic review. Knee 2016, 23, 925–935. [Google Scholar] [CrossRef] [PubMed]
- Hsu, R.W.; Himeno, S.; Coventry, M.B.; Chao, E.Y. Normal axial alignment of the lower extremity and load-bearing distribution at the knee. Clin. Orthop. Relat. Res. 1990, 255, 215–227. [Google Scholar] [CrossRef]
- Spahn, G. Complications in high tibial (medial opening wedge) osteotomy. Arch. Orthop. Trauma. Surg. 2004, 124, 649–653. [Google Scholar] [CrossRef] [PubMed]
- Zaffagnini, S.; Dal Fabbro, G.; Belvedere, C.; Leardini, A.; Caravelli, S.; Lucidi, G.A.; Agostinone, P.; Mosca, M.; Neri, M.P.; Grassi, A. Custom-Made Devices Represent a Promising Tool to Increase Correction Accuracy of High Tibial Osteotomy: A Systematic Review of the Literature and Presentation of Pilot Cases with a New 3D-Printed System. J. Clin. Med. 2022, 11, 5717. [Google Scholar] [CrossRef]
- Belvedere, C.; Macleod, A.; Leardini, A.; Grassi, A.; Fabbro, G.D.; Zaffagnini, S.; Gill, H.S. 3D Medical Imaging Analysis, Patient-Specific Instrumentation and Individualized Implant Design, with Additive Manufacturing Creates a New Personalized High Tibial Osteotomy Treatment Option. J. Mech. Med. Biol. 2023, 23, 2340041. [Google Scholar] [CrossRef]
- MacLeod, A.R.; Peckham, N.; Serrancoli, G.; Rombach, I.; Hourigan, P.; Mandalia, V.I.; Toms, A.D.; Fregly, B.J.; Gill, H.S. Personalised high tibial osteotomy has mechanical safety equivalent to generic device in a case-control in silico clinical trial. Commun. Med. 2021, 1, 6. [Google Scholar] [CrossRef] [PubMed]
- Belvedere, C.; Gill, H.S.; Ortolani, M.; Sileoni, N.; Zaffagnini, S.; Norvillo, F.; MacLeod, A.; Dal Fabbro, G.; Grassi, A.; Leardini, A. Instrumental gait analysis and tibial plateau modelling to support pre- and post-operative evaluations in personalized high tibial osteotomy. Appl. Sci. 2023, 13, 12425. [Google Scholar] [CrossRef]
- Jeong, S.H.; Samuel, L.T.; Acuna, A.J.; Kamath, A.F. Patient-specific high tibial osteotomy for varus malalignment: 3D-printed plating technique and review of the literature. Eur. J. Orthop. Surg. Traumatol. 2022, 32, 845–855. [Google Scholar] [CrossRef] [PubMed]
- MacLeod, A.R.; Mandalia, V.I.; Mathews, J.A.; Toms, A.D.; Gill, H.S. Personalised 3D Printed high tibial osteotomy achieves a high level of accuracy: ‘IDEAL’ preclinical stage evaluation of a novel patient specific system. Med. Eng. Phys. 2022, 108, 103875. [Google Scholar] [CrossRef] [PubMed]
- Zaffagnini, S.; Dal Fabbro, G.; Lucidi, G.A.; Agostinone, P.; Belvedere, C.; Leardini, A.; Grassi, A. Personalised opening wedge high tibial osteotomy with patient-specific plates and instrumentation accurately controls coronal correction and posterior slope: Results from a prospective first case series. Knee 2023, 44, 89–99. [Google Scholar] [CrossRef] [PubMed]
- Durastanti, G.; Leardini, A.; Siegler, S.; Durante, S.; Bazzocchi, A.; Belvedere, C. Comparison of cartilage and bone morphological models of the ankle joint derived from different medical imaging technologies. Quant. Imaging Med. Surg. 2019, 9, 1368–1382. [Google Scholar] [CrossRef] [PubMed]
- Honigmann, P.; Keller, M.; Devaux-Voumard, N.; Thieringer, F.M.; Sutter, D. Distance mapping in three-dimensional virtual surgical planning in hand, wrist and forearm surgery: A tool to avoid mistakes. Int. J. Comput. Assist. Radiol. Surg. 2023, 18, 565–574. [Google Scholar] [CrossRef] [PubMed]
- Negrillo-Cardenas, J.; Jimenez-Perez, J.R.; Canada-Oya, H.; Feito, F.R.; Delgado-Martinez, A.D. Automatic detection of landmarks for the analysis of a reduction of supracondylar fractures of the humerus. Med. Image Anal. 2020, 64, 101729. [Google Scholar] [CrossRef]
- Perez-Cano, F.D.; Jimenez-Perez, J.R.; Molina-Viedma, A.J.; Lopez-Alba, E.; Luque-Luque, A.; Delgado-Martinez, A.; Diaz-Garrido, F.A.; Jimenez-Delgado, J.J. Human femur fracture by mechanical compression: Towards the repeatability of bone fracture acquisition. Comput. Biol. Med. 2023, 164, 107249. [Google Scholar] [CrossRef]
- Ruggeri, M.; Gill, H.S.; Leardini, A.; Zaffagnini, S.; MacLeod, A.; Ortolani, M.; Faccia, F.; Grassi, A.; Fabbro, G.D.; Durante, S.; et al. Superimposition of ground reaction force on tibial-plateau supporting diagnostics and post-operative evaluations in high-tibial osteotomy. A novel methodology. Gait Posture 2022, 94, 144–152. [Google Scholar] [CrossRef]
- Roos, E.M.; Lohmander, L.S. The Knee injury and Osteoarthritis Outcome Score (KOOS): From joint injury to osteoarthritis. Health Qual. Life Outcomes 2003, 1, 64. [Google Scholar] [CrossRef] [PubMed]
- Delgado, D.A.; Lambert, B.S.; Boutris, N.; McCulloch, P.C.; Robbins, A.B.; Moreno, M.R.; Harris, J.D. Validation of Digital Visual Analog Scale Pain Scoring With a Traditional Paper-based Visual Analog Scale in Adults. J. Am. Acad. Orthop. Surg. Glob. Res. Rev. 2018, 2, e088. [Google Scholar] [CrossRef] [PubMed]
- Leardini, A.; Durante, S.; Belvedere, C.; Caravaggi, P.; Carrara, C.; Berti, L.; Lullini, G.; Giacomozzi, C.; Durastanti, G.; Ortolani, M.; et al. Weight-bearing CT Technology in Musculoskeletal Pathologies of the Lower Limbs: Techniques, Initial Applications, and Preliminary Combinations with Gait-Analysis Measurements at the Istituto Ortopedico Rizzoli. Semin. Musculoskelet. Radiol. 2019, 23, 643–656. [Google Scholar] [CrossRef] [PubMed]
- Nardi, C.; Salerno, S.; Molteni, R.; Occhipinti, M.; Grazzini, G.; Norberti, N.; Cordopatri, C.; Colagrande, S. Radiation dose in non-dental cone beam CT applications: A systematic review. Radiol. Med. 2018, 123, 765–777. [Google Scholar] [CrossRef] [PubMed]
- Holbrook, H.S.; Bowers, A.F.; Mahmoud, K.; Kelly, D.M. Weight-Bearing Computed Tomography of the Foot and Ankle in the Pediatric Population. J. Pediatr. Orthop. 2022, 42, 321–326. [Google Scholar] [CrossRef] [PubMed]
- Lemmens, C.; Faul, D.; Nuyts, J. Suppression of metal artifacts in CT using a reconstruction procedure that combines MAP and projection completion. IEEE Trans. Med. Imaging 2009, 28, 250–260. [Google Scholar] [CrossRef]
- Dal Fabbro, G.; Grassi, A.; Agostinone, P.; Lucidi, G.A.; Fajury, R.; Ravindra, A.; Zaffagnini, S. High survivorship rate and good clinical outcomes after high tibial osteotomy in patients with radiological advanced medial knee osteoarthritis: A systematic review. Arch. Orthop. Trauma. Surg. 2024. [Google Scholar] [CrossRef]
- Teo, S.J.; Purnomo, G.; Koh, D.T.S.; Soong, J.; Yeo, W.; Razak, H.; Lee, K.H. High tibial osteotomy versus unicompartmental knee arthroplasty in advanced medial compartmental knee arthrosis: A comparative study with propensity score matched analysis. Knee 2024, 49, 116–124. [Google Scholar] [CrossRef] [PubMed]
- Munier, M.; Donnez, M.; Ollivier, M.; Flecher, X.; Chabrand, P.; Argenson, J.N.; Parratte, S. Can three-dimensional patient-specific cutting guides be used to achieve optimal correction for high tibial osteotomy? Pilot study. Orthop. Traumatol. Surg. Res. 2017, 103, 245–250. [Google Scholar] [CrossRef]
- Fayard, J.M.; Saad, M.; Gomes, L.; Kacem, S.; Abid, H.; Vieira, T.D.; Lambrey, P.J.; Ollivier, M.; Thaunat, M. Patient-specific cutting guides increase accuracy of medial opening wedge high tibial osteotomy procedure: A retrospective case-control study. J. Exp. Orthop. 2024, 11, e12013. [Google Scholar] [CrossRef]
- Kuzu, T.E.; Kis, H.C. Effect of different cone beam computed tomography settings on artifact production in titanium and zirconia dental implants: An in vitro study. Dent. Med. Probl. 2024, 61, 233–239. [Google Scholar] [CrossRef] [PubMed]
| DMA Comparison | DMA Range (Δ) | Mean | Median | Standard Deviation | |
|---|---|---|---|---|---|
| (i) | POST tibia | Δ > 1 | 31.4 | 31.8 | 0.1 |
| vs. | Δ < −1 | 10.5 | 11.2 | 0.1 | |
| PLA tibia | −1 ≤ Δ ≤1 | 60.0 | 59.0 | 0.1 | |
| (ii) | POST fixation plate | Δ > 1 | 20.5 | 20.1 | 0.1 |
| vs. | Δ < −1 | 2.5 | 1.9 | 0.0 | |
| PLA fixation plate | −1 ≤ Δ ≤1 | 77 | 76.8 | 0.1 | |
| (iii-a) | PLA fixation plate | Δ > 1 | 83.4 | 83.6 | 0.1 |
| vs. | Δ < −1 | 0 | 0 | 0 | |
| PLA tibia | −1 ≤ Δ ≤1 | 16.6 | 16.4 | 0.1 | |
| (iii-b) | POST fixation plate | Δ > 1 | 13.6 | 6.7 | 0.2 |
| vs. | Δ < −1 | 2.3 | 1.0 | 0.0 | |
| POST tibia | −1 ≤ Δ ≤1 | 84.1 | 90.4 | 0.2 | |
| (iv) | POST tibial plateau | Δ > 1 | 13.8 | 12.5 | 0.1 |
| vs. | Δ < −1 | 4.8 | 3.4 | 0.0 | |
| PRE tibial plateau | −1 ≤ Δ ≤1 | 81.4 | 85.9 | 0.1 |
Disclaimer/Publisher’s Note: The statements, opinions and data contained in all publications are solely those of the individual author(s) and contributor(s) and not of MDPI and/or the editor(s). MDPI and/or the editor(s) disclaim responsibility for any injury to people or property resulting from any ideas, methods, instructions or products referred to in the content. |
© 2024 by the authors. Licensee MDPI, Basel, Switzerland. This article is an open access article distributed under the terms and conditions of the Creative Commons Attribution (CC BY) license (https://creativecommons.org/licenses/by/4.0/).
Share and Cite
Varaschin, A.; Gill, H.S.; Zaffagnini, S.; Leardini, A.; Ortolani, M.; Norvillo, F.; MacLeod, A.; Dal Fabbro, G.; Cassiolas, G.; Grassi, A.; et al. Personalised High Tibial Osteotomy Surgery Is Accurate: An Assessment Using 3D Distance Mapping. Appl. Sci. 2024, 14, 9033. https://doi.org/10.3390/app14199033
Varaschin A, Gill HS, Zaffagnini S, Leardini A, Ortolani M, Norvillo F, MacLeod A, Dal Fabbro G, Cassiolas G, Grassi A, et al. Personalised High Tibial Osteotomy Surgery Is Accurate: An Assessment Using 3D Distance Mapping. Applied Sciences. 2024; 14(19):9033. https://doi.org/10.3390/app14199033
Chicago/Turabian StyleVaraschin, Andrea, Harinderjit Singh Gill, Stefano Zaffagnini, Alberto Leardini, Maurizio Ortolani, Fabio Norvillo, Alisdair MacLeod, Giacomo Dal Fabbro, Giorgio Cassiolas, Alberto Grassi, and et al. 2024. "Personalised High Tibial Osteotomy Surgery Is Accurate: An Assessment Using 3D Distance Mapping" Applied Sciences 14, no. 19: 9033. https://doi.org/10.3390/app14199033