Article

Remaining Useful Life of the Rolling Bearings Prediction Method Based on Transfer Learning Integrated with CNN-GRU-MHA

1
School of Mechanical Engineering, Hunan University of Technology, Zhuzhou 412007, China
2
Key Laboratory of High-Performance Rolling Bearings in Hunan Province, Zhuzhou 412007, China
*
Author to whom correspondence should be addressed.
Appl. Sci. 2024, 14(19), 9039; https://doi.org/10.3390/app14199039
Submission received: 20 August 2024 / Revised: 26 September 2024 / Accepted: 3 October 2024 / Published: 7 October 2024

Abstract

:
To accurately predict the remaining useful life (RUL) of rolling bearings under limited data and fluctuating load conditions, we propose a new method for constructing health indicators (HI) and a transfer learning prediction framework, which integrates Convolutional Neural Networks (CNN), Gated Recurrent Units (GRU), and Multi-head attention (MHA). Firstly, we combined Convolutional Neural Networks (CNN) with Gated Recurrent Units (GRU) to fully extract temporal and spatial features from vibration signals. Then, the Multi-head attention mechanism (MHA) was added for weighted processing to improve the expression ability of the model. Finally, a new method for constructing Health indicators (HIs) was proposed in which the noise reduction and normalized vibration signals were taken as a HI, the L1 regularization method was added to avoid overfitting, and the model-based transfer learning method was used to realize the RUL prediction of bearings under small samples and variable load conditions. Experiments were conducted using the PHM2012 dataset from the FEMTO-ST research institute and XJTU-SY dataset. Three sets of 12 migration experiments were conducted under three different operating conditions on the PHM2012 dataset. The results show that the average RMSE of the proposed method was 0.0443, indicating high prediction accuracy under variable loads and small sample conditions. Three different operating conditions and two sets of four migration experiments were conducted on the XJTU-SY dataset, and the results show that the average RMSE of the proposed method was 0.0693, verifying the good generalization of the model under variable load conditions. In summary, the proposed HI construction method and prediction framework can effectively reduce the differences between features, with high stability and good generalizability.

1. Introduction

As a core component of rotating machinery, rolling bearings are widely used in important equipment in the fields of railway vehicles, the automobile industry, electric power equipment, etc., and their operating condition is decisive for the reliable operation of the whole system [1,2]. In various application scenarios, rolling bearings are often subjected to high loads, high speeds, and corrosiveness. Under complex working conditions such as strong vibrations and impacts, it is easy to cause bearing failure [3,4]. According to relevant research studies, about 30% of rotating equipment failures are caused by rolling bearings [5,6]. When the equipment is in operation, if the rolling bearing fails, it will lead to equipment downtime maintenance, affecting the efficiency of the enterprise, or lead to disaster, causing great losses to the country and the people. Therefore, it is of great significance to take the rolling bearing as the research object, scientifically and reasonably establish the rolling bearing Remaining Useful Life (RUL) prediction model, and conduct real-time monitoring of the operation status of the rolling bearing [7,8,9,10].
Currently, the RUL prediction method for rolling bearings can be broadly categorized into three main types: physical model-based methods, statistical model-based methods, and data-driven methods [11,12,13].
Some applications exist for physical and statistical model-based RUL prediction methods, but most of the parameter estimation methods for physical models are relatively complex and usually require extensive practical experience and guidance from domain experts [14]. Statistical model-based methods have the advantages of being easy to implement and easy to interpret in terms of the prediction results, but such methods can only respond to the commonality of the degradation of the same type of equipment, and the scope of application is narrower [15].
As industrial equipment tends to be more sophisticated and complex, data-driven methods based on data have gradually become mainstream. Deep learning has adaptive feature extraction capability and powerful generalizability, which can find the general law of degradation from messy and complicated data and is more suitable for modern mechanical equipment with massive data, complex structures, and many parameters [16,17,18].
CNN and GRU, as landmark networks in deep learning, are widely used in many fields such as fault diagnosis, life prediction, and target detection [19,20]. Sateesh [21] converted vibration signals into images and input them into CNN to successfully realize RUL prediction, but the data processing of this method is too complicated. Nie [22] constructed the correlation between statistical features and time series by the HIs of bearings and input them into CNN to realize the RUL prediction of bearings, but the method requires a lot of prior knowledge and expert experience. Mo Renpeng [23] combined a residual network and an attention mechanism to effectively predict the RUL of bearings, but the method requires a large amount of training data. He [24] improved the GRU network and introduced the attention mechanism to weigh the processing and input the normalized time-frequency features into the network to achieve the RUL prediction of bearings, and the experiments show that the improved network can effectively predict the RUL trend of rolling bearings over time. Zhang [25] proposed a CNN-LSTM-based model that effectively combines the powerful feature extraction ability of CNN and the sequential processing capability of LSTM, and the results reveal its superiority and effectiveness in accurate RUL prediction.. Sun [26] introduced a CNN-LSTM hybrid that utilizes a wide convolutional kernel for feature extraction, significantly enhancing noise robustness and diagnostic precision. The experimental results validate its superior performance in mixed-load scenarios.
Utilizing the advantages of CNN and GRU, combining the two for more comprehensive modeling is another common processing method. Gao [27] combined both CNN and GRU to fully utilize the temporal and spatial information of the bearing vibration signals and effectively improve the prediction accuracy of the bearing’s RUL, but the method is only applicable to a single load. Guo [28] achieved the RUL prediction of bearings by feature mining through CNN, normalizing the obtained monotonicity and temporal degradation features as the HIs of bearings, and inputting them into an LSTM network. Cai [29] successfully combined CNN and GRU to achieve a high-precision prediction of bearings, while also verifying that the performance of the CNN-GRU network is superior to a single network.
Although all of the above methods have achieved certain results in the field of bearing RUL prediction, they still have certain shortcomings. First, the existing deep learning-based bearing RUL prediction methods usually select the variables that react to the bearing degradation trend from the time or frequency domain of the bearing signal and perform dimensionality reduction through principal component analyses and other methods to obtain the HI of the bearing, which is a cumbersome procedure, overly relies on the experience of the experts, and does not necessarily react well to the degradation of the bearings. Secondly, the existing deep learning prediction methods mainly focus on the RUL prediction of single-loaded bearings, and it is difficult to predict the RUL of bearings under variable-load conditions; moreover, the existing deep learning bearing RUL prediction methods need to use a large amount of data to train the model, which makes the prediction difficult when there are a lack of training data. The above problems bring challenges to accurately predict the RUL of rolling bearings under variable load conditions. In this paper, we propose a new HI construction method, which combines CNN-GRU-MHA and migration learning to construct a prediction model, realizing a high-accuracy prediction of the RUL of rolling bearings under variable load conditions with a small amount of data, and verifying the performance of the proposed model based on the PHM2012 and XJTU-SY datasets.

2. Model

2.1. CNN and GRU

The CNN is a typical feed-forward neural network containing convolutional operations with local connectivity, parameter sharing, and multi-channel processing advantages, which is widely used in computer vision, image classification, medical impact analysis, and mechanical fault diagnosis and lifetime prediction. A typical CNN has a deep structure, usually consisting of three parts: input–output layer, convolutional pooling layer, and dense connection layer (fully connected layer). The structure of a typical convolutional neural network is shown in Figure 1.
The core modules of the CNN are the convolutional and pooling layers, and the layer-by-layer stripping of input data, as well as mining of latent abstract features of the data, can be achieved by alternating convolutional pooling operations. The principles of convolution and pooling operations are shown in Equation (1).
y j l = f ( i w i j l x i l 1 + b i l )
where bil is the bias matrix; wijl is the weight matrix; yjl is the convolutional layer feature of the l layer; xil−1 is the i feature of the l-1 layer; and f is the activation function.
To better leverage relevant features in sparse environments, a Rectified Linear Unit (ReLU) activation function is typically added to the model to introduce non-linearity, enabling neural networks to approximate any non-linear function arbitrarily. The expression for ReLU is as follows:
R e L U ( x ) = M a x ( 0 , x )
Cho [30] proposed a variant of LSTM—Gate Recurrent Unit (GRU) to solve the problem of difficult information capture in long-distance data. GRU simplifies the LSTM structure by introducing two key gate control structures: reset gate and update gate. The reset gate determines how much of the input information is retained at the current moment, while the update gate controls the amount of information retained at past moments. Compared to the LSTM, the GRU has a more compact design with fewer parameters and is more computationally efficient. The GRU structure and principle are shown in Figure 2 and Equations (2)–(5).
Z t = σ ( W ( Z ) x t + U ( Z ) h t 1 )
R t = σ ( W ( R ) x t + U ( R ) h t 1 )
h t 1 = tan W x t + R t U h t 1
h t = Z t h t 1 + 1 Z t h t 1
where xt is the current input vector, ht-1 is the hidden state at the previous time, W and U are linear transformation matrices, Zt is the update gate, ht1 is the candidate memory unit passed at the previous time, Rt is the reset gate, and ht is the output of the current neuron.

2.2. Migration Principle of Model

Migration learning methods are mainly used to utilize valuable knowledge information from known data to assist the learning process of unknown data [31]. Migration learning can be utilized to improve model performance when bearing RUL prediction tasks are performed with small amounts of training data. Migration learning solves the problem of data scarcity by transferring knowledge from already trained models to other prediction tasks. Among the various migration learning methods, the model-based migration learning approach is a simple and effective method. As shown in Figure 3, it can be used to train a model by utilizing the source domain data, then sharing the model parameters, fine-tuning the model in the target domain, and finally validating the performance of the model.

2.3. MHA Mechanism

Multi-head attention (MHA) is a mechanism that utilizes multiple parallel attention heads to process sequences, which can effectively improve the model’s representability, capture complex relationships in the input data, improve generalizability, and deal with long-distance dependencies, thus improving the model’s performance and effectiveness in a variety of tasks [32]. Multi-head attention is shown in Figure 4.
The MHA mechanism is a query-, key-, and value-based mechanism for interacting, integrating, and extracting information from different locations in the input sequence to better capture the associative and contextual information in the sequence, where the output of the attention mechanism is the weights obtained by calculating the dot product similarity between the query and the corresponding key, and the value is obtained by weighting and summing based on these weights. Since the dot product results may have large differences, to avoid the problem of gradient vanishing, a scaling factor is usually introduced to scale the dot product results and normalized using the Softmax function to improve the performance of the Multi-head attention mechanism. The computational flow of the MHA mechanism is shown in Equations (6)–(10).
Q i = X W q
K i = X W k
V i = X W v
h e a d i = Softmax ( α Q i K i T ) V i
Y o u t p u t = c o n c a t ( h e a d 1 , h e a d 2 ...... h e a d h )
where X is the input data, Qi, Ki, Vi denote the result of a linear transformation of the input data by the i-th head, Wq, Wk, Wv are query, key, and value weight matrices, respectively, concat denotes the splicing operation, α is the scaling factor, headi is the computation result of the i-th head, Wo is the output of the linear transformation, and Youtput is the result of the computation of the Multi-head attention mechanism.

2.4. L1 Regularization

L1 regularization is introduced into the model to prevent overfitting and improve generalizability. The L1 regularization method introduces a penalty term in the loss function; the size of this penalty term is proportional to the L1 paradigm of the model parameters [33,34]. The L1 regularization makes certain weight coefficients of the model become 0 during training, which can effectively reduce the complexity of the model. After adding L1 regularization in the model, the loss function of the model can be expressed as shown in Equation (11).
L o s s = 1 m i = 1 m y i Y i 2 + α j = 1 n w j
where the first term is the RMSE loss, α is the regularity term coefficient, and w is the parameter of the model.

2.5. Network Structure and Training Process

The constructed RUL prediction model of CNN-GRU-MHA is shown in Figure 5.
The model firstly extracts the shallow features of bearing degradation through three sets of 5 × 5 convolutions and 2 × 2 pooling layers, and at the same time adds BN to prevent the problem of gradient disappearance or explosion during training; adds multi-attention mechanism multi-features for weighting in the model; then adds three sets of 3 × 3 convolutions and 2 × 2 pooling layers to extract the deep features of bearing degradation and, to improve the prediction accuracy and avoid overfitting, adds L1 regularization to the model; finally, the higher-order features extracted by CNN are inputted into GRU to realize the time information of the bearings. To improve the prediction accuracy and avoid overfitting, L1 regularization is added to the model; finally, the higher-order features extracted by CNN are inputted into GRU to realize the extraction of temporal information of the bearing and are inputted into the fully connected layer to realize the prediction of the RUL of the bearing. The number of convolutional kernels in the six sets of convolutional layers in the CNN-GRU-MHA model is 32, 64, 128, 256, 512, and 1024, respectively, and the activation functions used in the model are all Relu, with the number of heads of the Multi-head attention being 2, the number of hidden nodes in the two GRU layers being 512 and 128, and the number of nodes in the two fully connected layers being 64 and 1, respectively.
The training process of the CNN-GRU-MHA model is shown in Figure 6.
(1)
In the preprocessing part, firstly, the vibration signal is subjected to noise reduction by discrete wavelet transform; secondly, the vibration signal is normalized to between 0 and 1 as the bearing HI using the maximum–minimum normalization method.
(2)
Construct the degradation labels of the receding bearings, in which the training set data and test set data according to all contain labels and the validation set data do not contain labels.
(3)
Input the training set data into the CNN-GRU-MHA model, and the spatial information of the degradation features of the rolling bearing is sufficiently obtained by CNN.
(4)
Input the CNN extracted features into GRU for further modeling the temporal information of the degraded features.
(5)
Input the degraded features into two fully connected layers to realize the RUL prediction of rolling bearings.
(6)
Calculate the loss function of the model.
(7)
Utilize the loss-tuned parameters of the model to complete the training of the training set data when the number of iterations m of the network reaches N. Otherwise, repeat steps (4) to (6).
(8)
Freeze the structure and parameters of the feature extraction layer of the model and continue training the top layer of the model on the test set data.
(9)
Repeat steps (4)~(7).
(10)
Complete the test set model training.
(11)
Output the prediction results of the validation set data.

3. Experiment

3.1. Experimental Data Sources

Experiments were conducted using the bearing degradation dataset PHM2012, which was published in 2012 and contains the full-life vibration signal data of bearings from normal stage to degradation, provided by the PRONOSTIA experimental platform of FEMTO-ST Institute in France [35]. This experimental platform can accelerate the rolling bearing degradation process under specific conditions and record the experimental data such as rotational speed, load, vibration signals, etc., at the same time, which can provide data support for the RUL prediction of rolling bearings. The RONOSTIA experimental platform is shown in Figure 7.
The PHM2012 dataset contains the full-life vibration signal data of 17 bearings under three operating conditions, and different bearing numbers represent the experimental bearings under different operating conditions, e.g., bearing 1-1 represents the first experimental bearing under operating condition 1, and the PHM2012 data are shown in Table 1.
The PHM2012 data include vibration signals in both horizontal and vertical directions, and the signals in the horizontal direction can reflect the degradation of the bearings more quickly and accurately, so only the vibration signals in the horizontal direction are used in this paper for the prediction of bearing life.
Three groups of 12 different migration experiments were set up to verify the prediction effect of the CNN-GRU-MHA model with a small amount of training data, and the experimental data are shown in Table 2.
In Table 2, the source domain data are used as training data, and the target domain data are divided into test data and validation data in a ratio of 1:1. The training and test data contain labels and the validation data do not contain labels.

3.2. Data Processing

3.2.1. Data Noise Reduction

Because the bearing is affected by different loads, rotational speeds, and other factors during operation, the bearing usually contains a lot of noise, such as directly into the model to predict the RUL, which will affect the accuracy of prediction, so it is necessary to carry out noise reduction on the bearing signal. The author uses discrete wavelet transform for noise reduction in the signal and decomposes the bearing signal into a high-frequency part (detail coefficients, CD) and low-frequency part (approximation coefficient, CA) by selecting the wavelet base as ‘sym8’. The number of times this is performed is 3. The resulting CA and CD are reconstructed using the inverse wavelet transform to suppress the high-frequency components of the signal and realize noise reduction in the signal. The discrete wavelet transform decomposition flowchart is shown in Figure 8.

3.2.2. Normalization Process

To improve the performance of the model to achieve a better migration effect, the original data are linearly transformed using the maximum–minimum normalization method to normalize the data between 0 and 1. Without loss of generality, x = {x1, x2, x3……xn} is used to denote the original vibration signals, and the maximum and minimum values in the original vibration signals are xmax and xmin, respectively. X = {X1, X2, X3……Xn} is used to denote the transformed data. The maximum–minimum normalization method is shown in Equation (12).
X i = x i x min x max x min

3.2.3. HI Build

In the RUL prediction problem of rolling bearings, the accurate construction of bearing Health indicators (HIs) is the key to improving the accuracy of RUL predictions. However, most of the existing HI construction methods select the indicators that can reflect the degradation of the bearing as HIs from the time or frequency domain of the vibration signal, and such methods are overly dependent on the experience of experts and also require a certain degree of understanding of the degradation mechanism of the equipment, which has greater limitations [36]. To this end, We propose a new HI construction method, which firstly reduces the noise of the bearing vibration signal by discrete wavelet transform, then normalizes the data to 0–1 by maximum–minimum normalization, and then takes the noise-reduced and normalized vibration signal as the HI of the bearing. This method not only makes full use of the vibration signal, but also improves the stability of the model training, reduces the variability of features, and improves the generalizability of the model.

3.3. Label Building

Since no label exists in the original data, it is necessary to construct a degradation label corresponding to the HIs. The degradation label refers to the degradation degree of the bearing, which is usually measured by the percentage of bearing degradation. If there are N samples in the training data, the remaining life Y i corresponding to the i sample is shown in Equation (13).
Y i   =   N i N

4. Results and Discussion

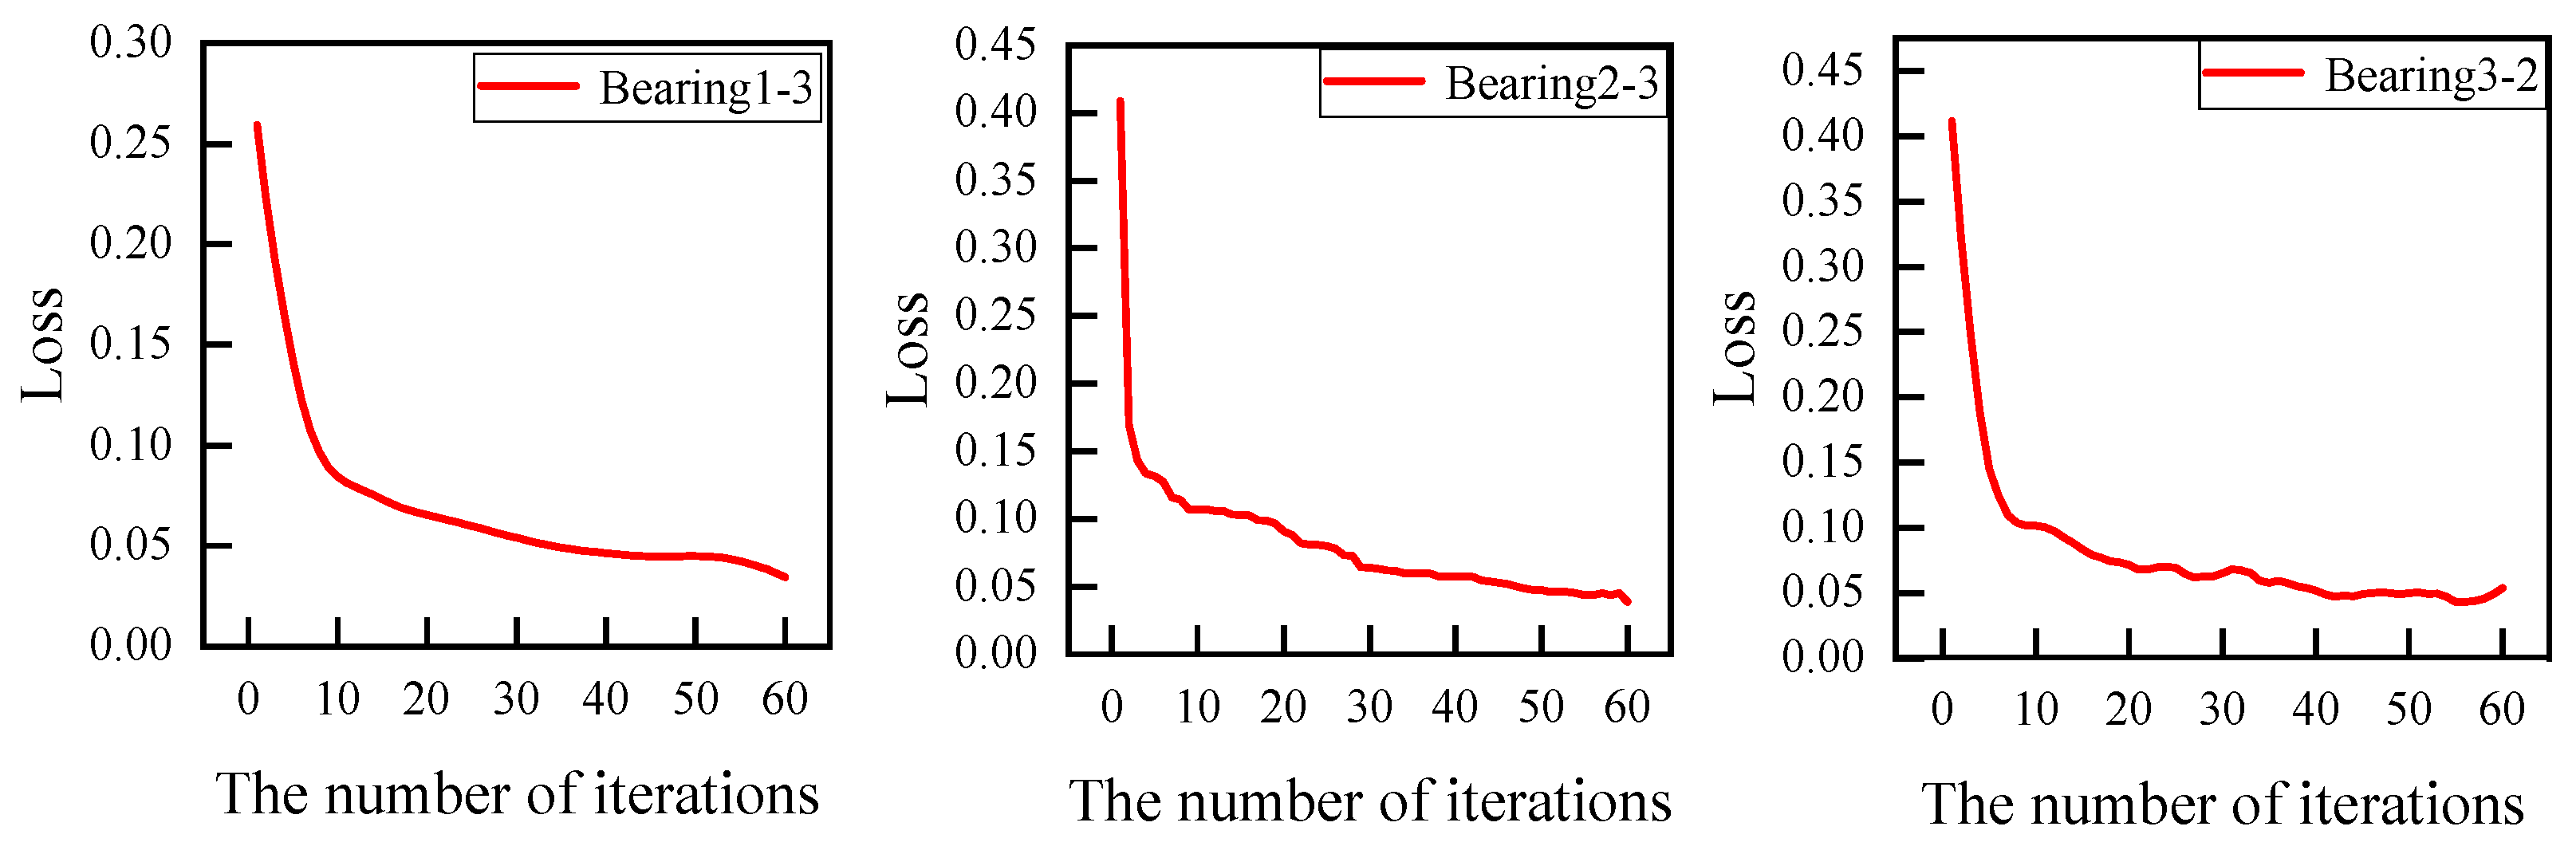
4.1. Training Set Loss

In this experiment, the network model is constructed based on the deep learning framework Tensorflow 2.5.0 and the Python programming language, the GPU used is RTX3060, the CPU is Core I5-12400F, and the computationally efficient Adam optimization algorithm is used to train the model. The training hyperparameters are shown in Table 3.
As can be seen from Figure 9, the loss of the four bearings decreases gradually with the increase in iterations. The loss of bearing 1-3 decreases from 0.26 to 0.046, the loss of bearing 2-3 decreases from 0.41 to 0.048, and the loss of bearing 3-2 decreases from 0.42 to 0.053. The loss of the three bearings is smaller, and all of them are in the vicinity of 0.05, which indicates that the constructed CNN-GRU-MHA model has a small error and can fit the training set data well. To verify that the model trained on the training set data can be well applied to the test set and validation set, the structure and parameters of the feature extraction layer of the CNN-GRU-MHA model under the three experiments are frozen separately, the feature extraction capability of the model is retained, and the top layer of the model is retrained. The loss of the model after 100 rounds of reiteration on the test set is specifically shown in Table 4, and to avoid chance, the experiment is repeated five times to take the average value of the loss.
As can be seen from Table 4, the migration experiments of the four bearings have good results, and the loss under variable load conditions is in the range of 0.04–0.05.

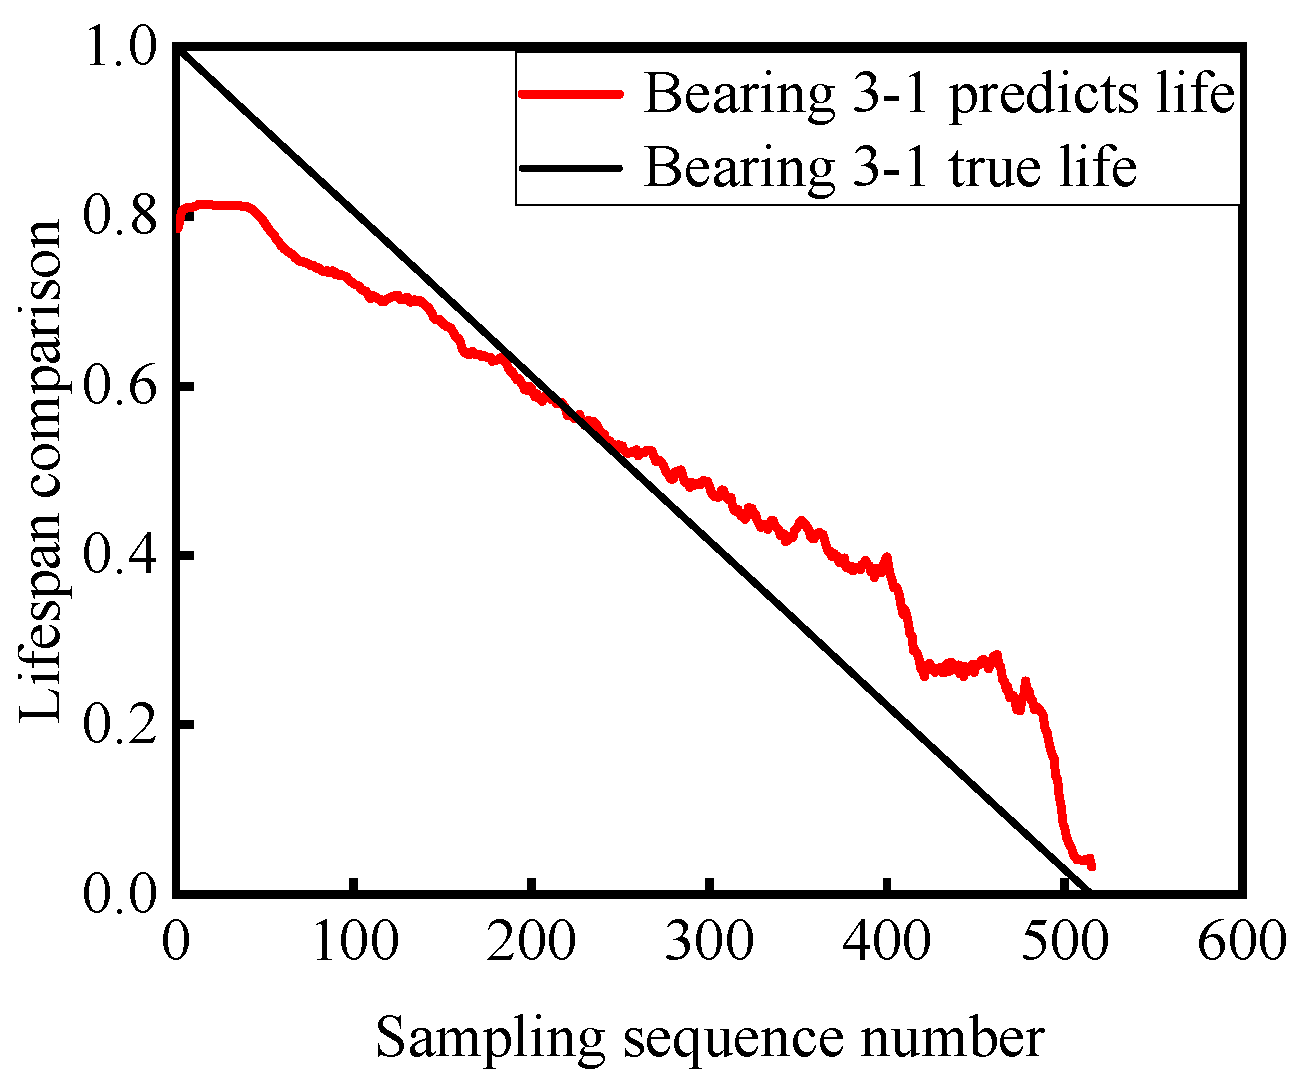
4.2. Prediction Based on Validation Set

To more intuitively reflect the prediction effect of the model in the validation set, the predicted life curves of the bearings after the partial noise reduction is demonstrated with the true life curves, as shown in Figure 10, Figure 11, Figure 12, Figure 13, Figure 14, Figure 15, Figure 16, Figure 17, Figure 18, Figure 19, Figure 20 and Figure 21.

4.3. Model Generalizability Validation

The XJTU-SY dataset contains the full life cycle vibration signals of 15 rolling bearings under three operating conditions and clearly labels the failure location of each bearing [37]. Two sets of migration experiments are constructed based on the XJTU-SY bearing dataset to verify the generalizability of the model in different datasets. The results of the migration learning dataset construction and experiments are shown in Table 5, and the specific life prediction curves are shown in Figure 22, Figure 23, Figure 24 and Figure 25.

5. Conclusions

In this chapter, we mainly focus on the study of RUL for bearings under a small amount of data and propose a CNN-GRU-MHA method for predicting the RUL of bearings.
(1)
The method combines CNN and GRU and directly inputs the vibration signals processed by the maximum–minimum normalization method and the discrete wavelets as HIs into the model.
(2)
Local features of rolling bearing signals are extracted using CNN, and then the timing information is modeled and predicted using the GRU model; MHA is introduced for weighting, the L1 regularization method is added to reduce the number of features and reduce the computational complexity, and avoid overfitting, and a model-based migration learning method is also introduced to achieve the RUL prediction of rolling bearings with a small amount of data.
(3)
Experimental validation was carried out using the PHM2012 and XJTU-SY bearing datasets. The experimental results of PHM2012 data show that the average RMSE of the CNN-GRU-MHA model, with three sets of twelve migration experiments under variable load conditions, is 0.0443; and the results of the XJTU-SY data show that the average RMSE of two sets of four migration experiments under variable load conditions is 0.0691, which verifies the accuracy and good generalization of the model.
(4)
In future work, it will be necessary to further collect actual industrial production bearing vibration data to validate the model’s performance.

Author Contributions

Conceptualization, J.Y. and Q.Y.; methodology, J.Y. and X.P.; software, X.P. and J.S.; formal analysis, J.S. and X.P.; data curation, X.P. and J.S.; writing—original draft preparation, J.S.; writing—review and editing, J.Y.; visualization, X.P.; supervision, Q.Y.; project administration, Q.Y. and J.Y.; funding acquisition, T.L. and J.Y. All authors have read and agreed to the published version of the manuscript.

Funding

The National Natural Science Foundation of China [No. 52305465] and the Hunan Natural Science Foundation in China [No. 2021JJ50054].

Institutional Review Board Statement

Not applicable. This study does not involve research on humans or animals.

Informed Consent Statement

Not applicable. This study does not involve research on humans.

Data Availability Statement

Data are available on request from the authors.

Conflicts of Interest

The authors declare that they have no known competing financial interests or personal relationships that could have appeared to influence the work reported in this article.

References

  1. Yin, X.; Rong, Y.; Li, L.; He, W.; Lv, M.; Sun, S. Health State Prediction Method Based on Multi-Featured Parameter Information Fusion. Appl. Sci. 2024, 14, 6809. [Google Scholar] [CrossRef]
  2. Yao, Q.; Dai, L.; Tang, J.; Wu, H.; Liu, T. High-Speed Rolling Bearing Lubrication Reliability Analysis Based on Probability Box Model. Probabilistic Eng. Mech. 2024, 76, 103612. [Google Scholar] [CrossRef]
  3. Soomro, A.A.; Muhammad, M.B.; Mokhtar, A.A.; Md Saad, M.H.; Lashari, N.; Hussain, M.; Sarwar, U.; Palli, A.S. Insights into Modern Machine Learning Approaches for Bearing Fault Classification: A Systematic Literature Review. Results Eng. 2024, 23, 102700. [Google Scholar] [CrossRef]
  4. Peng, G.; Zheng, J.; Pan, H.; Tong, J.; Liu, Q. Ensemble holo-Hilbert spectral analysis and its application in fault diagnosis of rolling bearing. J. Vib. Shock 2024, 43, 98–105. [Google Scholar] [CrossRef]
  5. Cerrada, M.; Sánchez, R.-V.; Li, C.; Pacheco, F.; Cabrera, D.; Valente de Oliveira, J.; Vásquez, R.E. A Review on Data-Driven Fault Severity Assessment in Rolling Bearings. Mech. Syst. Signal Process. 2018, 99, 169–196. [Google Scholar] [CrossRef]
  6. Yang, G. Practical Techniques for Fault Diagnosis of Rolling Bearings; China Petrochemical Press: Beijing, China, 2012; pp. 20–39. [Google Scholar]
  7. Chelmiah, E.T.; McLoone, V.I.; Kavanagh, D.F. Low Complexity Non-Linear Spectral Features and Wear State Models for Remaining Useful Life Estimation of Bearings. Energies 2023, 16, 5312. [Google Scholar] [CrossRef]
  8. Investigation on Rolling Bearing Remaining Useful Life Prediction: A Review. IEEE Conference Publication. IEEE Xplore. Available online: https://ieeexplore.ieee.org/document/8603483 (accessed on 15 August 2024).
  9. Chen, J.; Huang, R.; Chen, Z.; Mao, W.; Li, W. Transfer Learning Algorithms for Bearing Remaining Useful Life Prediction: A Comprehensive Review from an Industrial Application Perspective. Mech. Syst. Signal Process. 2023, 193, 110239. [Google Scholar] [CrossRef]
  10. Yin, C.; Hu, Y.; Cao, W. A Review of Methods for Remaining Useful Life Prediction of Motor Bearings. In Proceedings of the 2023 3rd International Joint Conference on Energy, Electrical and Power Engineering, CoEEPE 2023, Lecture Notes in Electrical Engineering, Melbourne, VIC, Australia, 22–24 November 2023; Hu, C., Cao, W., Eds.; Springer: Singapore, 2023; Volume 1208. [Google Scholar] [CrossRef]
  11. Wang, C.; Jiang, W.; Yang, X.; Zhang, S. RUL Prediction of Rolling Bearings Based on a DCAE and CNN. Appl. Sci. 2021, 11, 11516. [Google Scholar] [CrossRef]
  12. Wang, Y.; Zhao, Y.; Addepalli, S. Remaining Useful Life Prediction Using Deep Learning Approaches: A Review. Procedia Manuf. 2020, 49, 81–88. [Google Scholar] [CrossRef]
  13. Mogal, S.; Bhandare, R.V.; Phalle, V.M.; Kushare, P.B. Fault Diagnosis and Prediction of Remaining Useful Life (RUL) of Rolling Element Bearing: A Review State of Art. Finn. J. Trib. 2024, 41, 28–42. [Google Scholar] [CrossRef]
  14. Lei, Y.; Li, N.; Gontarz, S.; Lin, J.; Radkowski, S.; Dybala, J. A Model-Based Method for Remaining Useful Life Prediction of Machinery. IEEE Trans. Rel. 2016, 65, 1314–1326. [Google Scholar] [CrossRef]
  15. Yu, G.; Li, C.; Zhang, J. A New Statistical Modeling and Detection Method for Rolling Element Bearing Faults Based on Alpha–Stable Distribution. Mech. Syst. Signal Process. 2013, 41, 155–175. [Google Scholar] [CrossRef]
  16. Deng, L.; Li, W.; Yan, X. An Intelligent Hybrid Deep Learning Model for Rolling Bearing Remaining Useful Life Prediction. Nondestruct. Test. Eval. 2024, 1–28. [Google Scholar] [CrossRef]
  17. Akpudo, U.E.; Hur, J.-W. Towards Bearing Failure Prognostics: A Practical Comparison between Data-Driven Methods for Industrial Applications. J. Mech. Sci. Technol. 2020, 34, 4161–4172. [Google Scholar] [CrossRef]
  18. Shutin, D.; Bondarenko, M.; Polyakov, R.; Stebakov, I.; Savin, L. Method for On-Line Remaining Useful Life and Wear Prediction for Adjustable Journal Bearings Utilizing a Combination of Physics-Based and Data-Driven Models: A Numerical Investigation. Lubricants 2023, 11, 33. [Google Scholar] [CrossRef]
  19. Wang, Q.; Li, Y.; Wang, Y.; Ren, J. An Automatic Algorithm for Software Vulnerability Classification Based on CNN and GRU. Multimed. Tools Appl. 2022, 81, 7103–7124. [Google Scholar] [CrossRef]
  20. Liu, F.; Zhang, Z.; Zhou, R. Automatic Modulation Recognition Based on CNN and GRU. Tsinghua Sci. Technol. 2022, 27, 422–431. [Google Scholar] [CrossRef]
  21. Deep Convolutional Neural Network Based Regression Approach for Estimation of Remaining Useful Life. SpringerLink. Available online: https://link.springer.com/chapter/10.1007/978-3-319-32025-0_14 (accessed on 15 August 2024).
  22. Nie, L.; Zhang, L.; Xu, S.; Cai, W.; Yang, H. Remaining Useful Life Prediction for Rolling Bearings Based on Similarity Feature Fusion and Convolutional Neural Network. J. Braz. Soc. Mech. Sci. Eng. 2022, 44, 328. [Google Scholar] [CrossRef]
  23. Mo, R.; Li, T.; Si, X.; Zhu, X. A device residual life prediction method using residual network and convolutional attention mechanism. J. Xi’an Jiaotong Univ. 2022, 56, 194–202. [Google Scholar] [CrossRef]
  24. He, J.; Zhang, X.; Zhang, X.; Shen, J. Remaining Useful Life Prediction for Bearing Based on Automatic Feature Combination Extraction and Residual Multi-Head Attention GRU Network. Meas. Sci. Technol. 2024, 35, 036003. [Google Scholar] [CrossRef]
  25. Zhang, Q.; Ye, Z.; Shao, S.; Niu, T.; Zhao, Y. Remaining Useful Life Prediction of Rolling Bearings Based on Convolutional Recurrent Attention Network. Assem. Autom. 2022, 42, 372–387. [Google Scholar] [CrossRef]
  26. Sun, H.; Fan, Y. Fault diagnosis of rolling bearings based on CNN and LSTM networks under mixed load and noise. Multimed Tools Appl. 2023, 82, 43543–43567. [Google Scholar] [CrossRef]
  27. Gao, X.; Wang, H.; Zhao, Z.; Tian, J.; Zhang, F.; Wang, C. Prediction of Bearing Remaining Useful Life Based on CNN and Gated Recurrent Unit. In Proceedings of the 2023 Global Reliability and Prognostics and Health Management Conference (PHM-Hangzhou), IEEE, Hangzhou, China, 2–15 October 2023; pp. 1–7. [Google Scholar] [CrossRef]
  28. Guo, J.; Wang, J.; Wang, Z.; Gong, Y.; Qi, J.; Wang, G.; Tang, C. A CNN-BiLSTM-Bootstrap Integrated Method for Remaining Useful Life Prediction of Rolling Bearings. Qual. Reliab. Eng. 2023, 39, 1796–1813. [Google Scholar] [CrossRef]
  29. Cai, Y. Rolling Bearing Life Prediction Based on CNN-GRU”. Mech. Eng. Autom. 2023, 1, 143–145+148. [Google Scholar] [CrossRef]
  30. Cho, K.; van Merrienboer, B.; Bahdanau, D.; Bengio, Y. On the Properties of Neural Machine Translation: Encoder-Decoder Approaches. arXiv 2014. [Google Scholar] [CrossRef]
  31. Tan, C.; Sun, F.; Kong, T.; Zhang, W.; Yang, C.; Liu, C. A Survey on Deep Transfer Learning. In Artificial Neural Networks and Machine Learning—ICANN 2018; Kůrková, V., Manolopoulos, Y., Hammer, B., Iliadis, L., Maglogiannis, I., Eds.; Lecture Notes in Computer Science; Springer International Publishing: Cham, Switzerland, 2018; Volume 11141, pp. 270–279. [Google Scholar] [CrossRef]
  32. Mercat, J.; Gilles, T.; El Zoghby, N.; Sandou, G.; Beauvois, D.; Gil, G.P. Multi-Head Attention for Multi-Modal Joint Vehicle Motion Forecasting. In Proceedings of the 2020 IEEE International Conference on Robotics and Automation (ICRA), IEEE, Paris, France, 31 May–31 August 2020; pp. 9638–9644. [Google Scholar] [CrossRef]
  33. Kulkarni, P.; Zepeda, J.; Jurie, F.; Pérez, P.; Chevallier, L. Learning the Structure of Deep Architectures Using L1 Regularization. In Proceedings of the British Machine Vision Conference, Swansea, UK, 7–10 September 2015. [Google Scholar] [CrossRef]
  34. Sun, L.; Yang, Y.; Zhang, N. Research on Bearing State Prediction Using L1 Regularization and BiGRU Model. Electron. Meas. Technol. 2024, 47, 58–65. [Google Scholar] [CrossRef]
  35. Darwish, A. A Data-Driven Deep Learning Approach for Remaining Useful Life of Rolling Bearings. Syst. Assess. Eng. Manag. 2024, 1, 8–25. [Google Scholar] [CrossRef]
  36. Qian, M.; Yu, Y.; Guo, L.; Gao, H.; Zhang, R.; Li, S. A New Health Indicator for Rolling Bearings Based on Impulsiveness and Periodicity of Signals. Meas. Sci. Technol. 2022, 33, 105008. [Google Scholar] [CrossRef]
  37. Lei, Y.; Han, T.; Wang, B.; Li, N.; Yan, T.; Yang, J. XJTU-SY Rolling Element Bearing Accelerated Life Test Datasets: A Tutorial. J. Mech. Eng. 2019, 55, 1–6. [Google Scholar] [CrossRef]
Figure 1. Structure of a typical convolutional neural network.
Applsci 14 09039 g001
Figure 2. Structure diagram of GRU.
Applsci 14 09039 g002
Figure 3. Schematic diagram of model-based transfer learning.
Applsci 14 09039 g003
Figure 4. Multi-head attention mechanism.
Applsci 14 09039 g004
Figure 5. RUL prediction model of CNN-GRU-MHA model.
Applsci 14 09039 g005
Figure 6. The training process of CNN-GRU-MHA.
Applsci 14 09039 g006
Figure 7. PRONOSTIA experimental platform.
Applsci 14 09039 g007
Figure 8. Signal decomposition process by discrete wavelet transform.
Applsci 14 09039 g008
Figure 9. Training set loss.
Applsci 14 09039 g009
Figure 10. Bearing 1-3. Migration 2-3.
Applsci 14 09039 g010
Figure 11. Bearing 1-3. Migration 2-4.
Applsci 14 09039 g011
Figure 12. Bearing 1-3. Migration 3-1.
Applsci 14 09039 g012
Figure 13. Bearing 1-3. Migration 3-3.
Applsci 14 09039 g013
Figure 14. Bearing 2-3. Migration 1-3.
Applsci 14 09039 g014
Figure 15. Bearing 2-3. Migration 1-4.
Applsci 14 09039 g015
Figure 16. Bearing 2-3. Migration 3-1.
Applsci 14 09039 g016
Figure 17. Bearing 2-3. Migration 3-3.
Applsci 14 09039 g017
Figure 18. Bearing 3-2. Migration 1-3.
Applsci 14 09039 g018
Figure 19. Bearing 3-2. Migration 1-4.
Applsci 14 09039 g019
Figure 20. Bearing 3-2. Migration 2-3.
Applsci 14 09039 g020
Figure 21. Bearing 3-2. Migration 2-4.
Applsci 14 09039 g021
Figure 22. Bearing 1-3. Migration 2-3.
Applsci 14 09039 g022
Figure 23. Bearing 1-3. Migration 3-2.
Applsci 14 09039 g023
Figure 24. Bearing 2-3. Migration 2-3.
Applsci 14 09039 g024
Figure 25. Bearing 2-2. Migration 3-2.
Applsci 14 09039 g025
Table 1. Data of PHM2012.
Working ConditionRotational Speed (rpm)Load (N)Bearing Data
Working condition 1180040001_1, 1_2, 1_3, 1_4, 1_5, 1_6, 1_7
Working condition 2165042002_1, 2_2, 2_3, 2_4, 2_5, 2_6, 2_7
Working condition 3150050003_1, 3_2, 3_3
Table 2. Construction of experimental dataset.
TestSource Domain DataTarget Domain Data
Test 1bearing 1-3bearing 2-3, bearing 2-4, bearing 3-1, bearing 3-3
Test 2bearing 2-3bearing 2-4, bearing 2-5, bearing 3-3, bearing 3-3
Test 3bearing 3-2bearing 1-3, bearing 1-4, bearing 2-3, bearing 2-4
Table 3. Parameter table.
Hyperparameter NameHyperparameter Value
Learning rate0.001
Sample size128
Number of iterations60/100
Batch size128
Table 4. Losses from four experiments.
Source Domain DataTarget Domain DataLossAverage Loss
Bearing 1-3Bearing 2-30.04630.0433
Bearing 1-3Bearing 2-40.0449
Bearing 1-3Bearing 3-10.0427
Bearing 1-3Bearing 3-30.0461
Bearing 2-3Bearing 1-30.0458
Bearing 2-3Bearing 1-40.0426
Bearing 2-3Bearing 3-30.0416
Bearing 3-2Bearing 1-30.0382
Bearing 3-2Bearing 1-40.0397
Bearing 3-2Bearing 2-30.0413
Bearing 3-2Bearing 2-40.0418
Table 5. Construction of experimental dataset of XJTU-SY.
Experiment No.Source Domain DataTarget Domain DataLossAverage Loss
1bearing1-3bearing2-30.05680.0691
bearing1-3bearing3-20.0464
2bearing2-3bearing1-30.1138
bearing2-3bearing3-20.0595
Disclaimer/Publisher’s Note: The statements, opinions and data contained in all publications are solely those of the individual author(s) and contributor(s) and not of MDPI and/or the editor(s). MDPI and/or the editor(s) disclaim responsibility for any injury to people or property resulting from any ideas, methods, instructions or products referred to in the content.

