
Comparison of Lab vs. Backcalculated Moduli of Virgin Aggregate and Recycled Aggregate Base Layers


 ,
,
Abstract
1. Introduction
2. Methodology
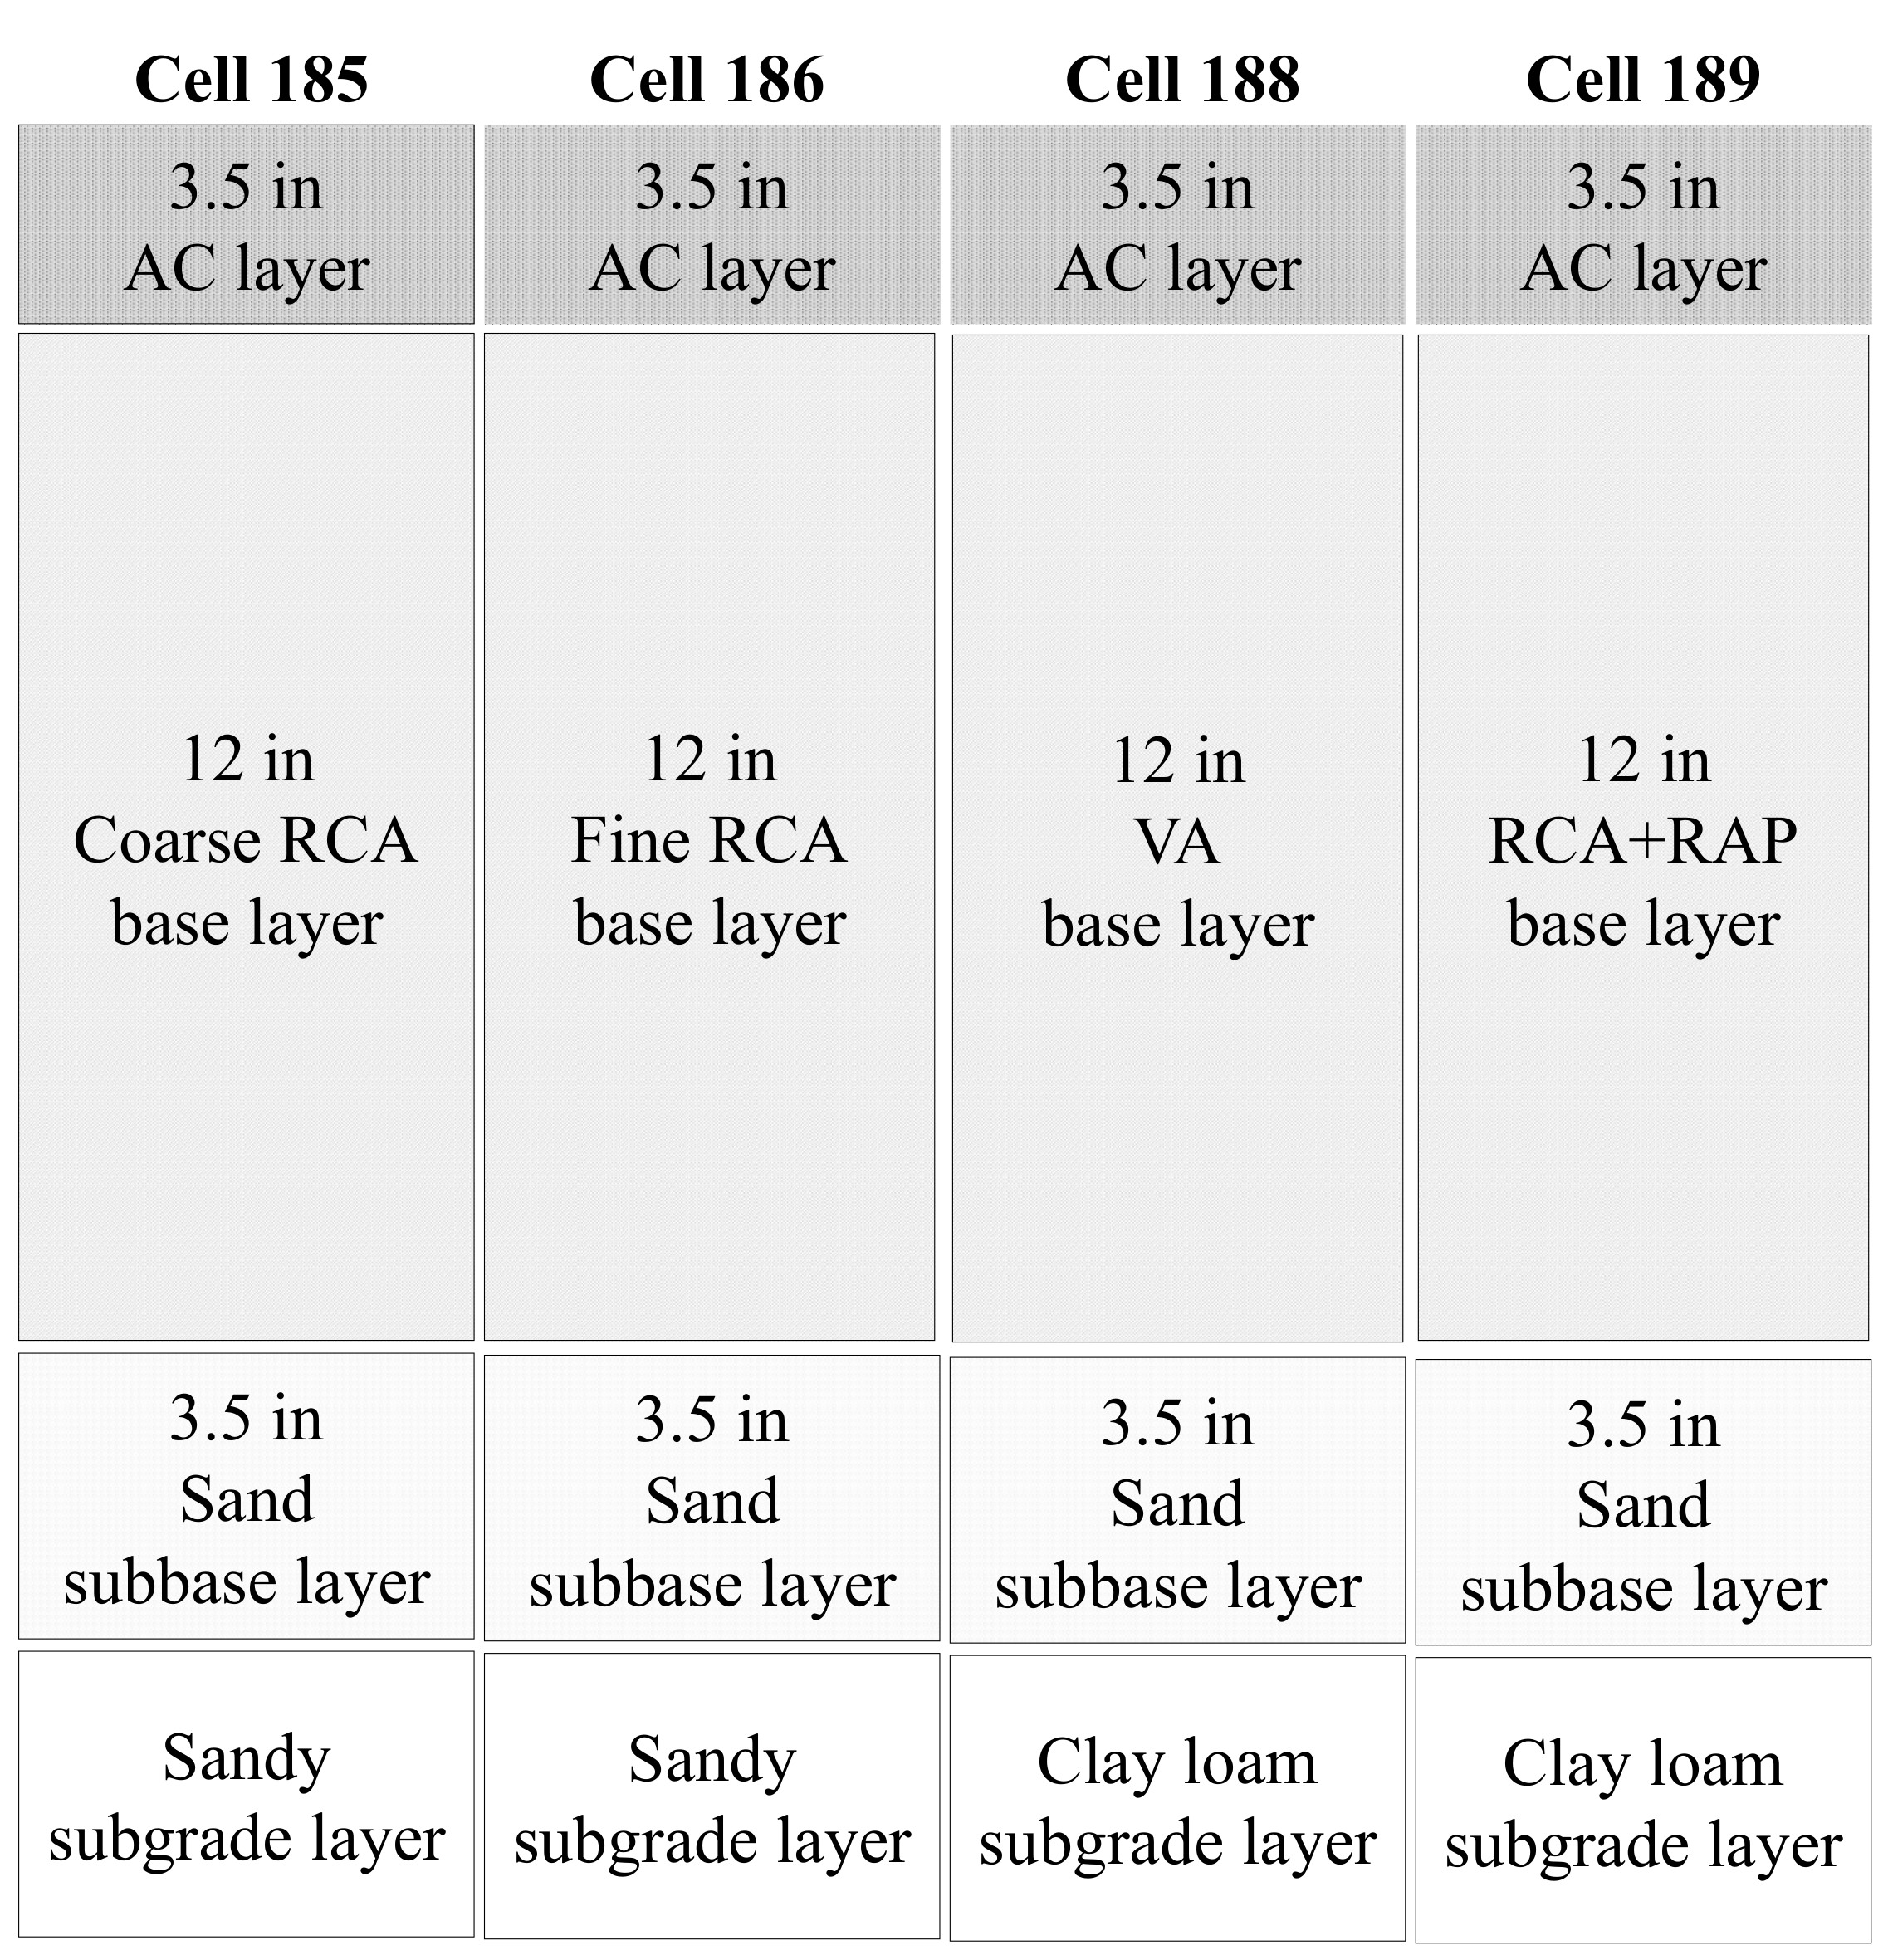
2.1. Test Sections
2.2. Testing Plan
2.3. Nonlinearity of Unbound Materials
2.4. Analysis Method
3. Results and Discussion
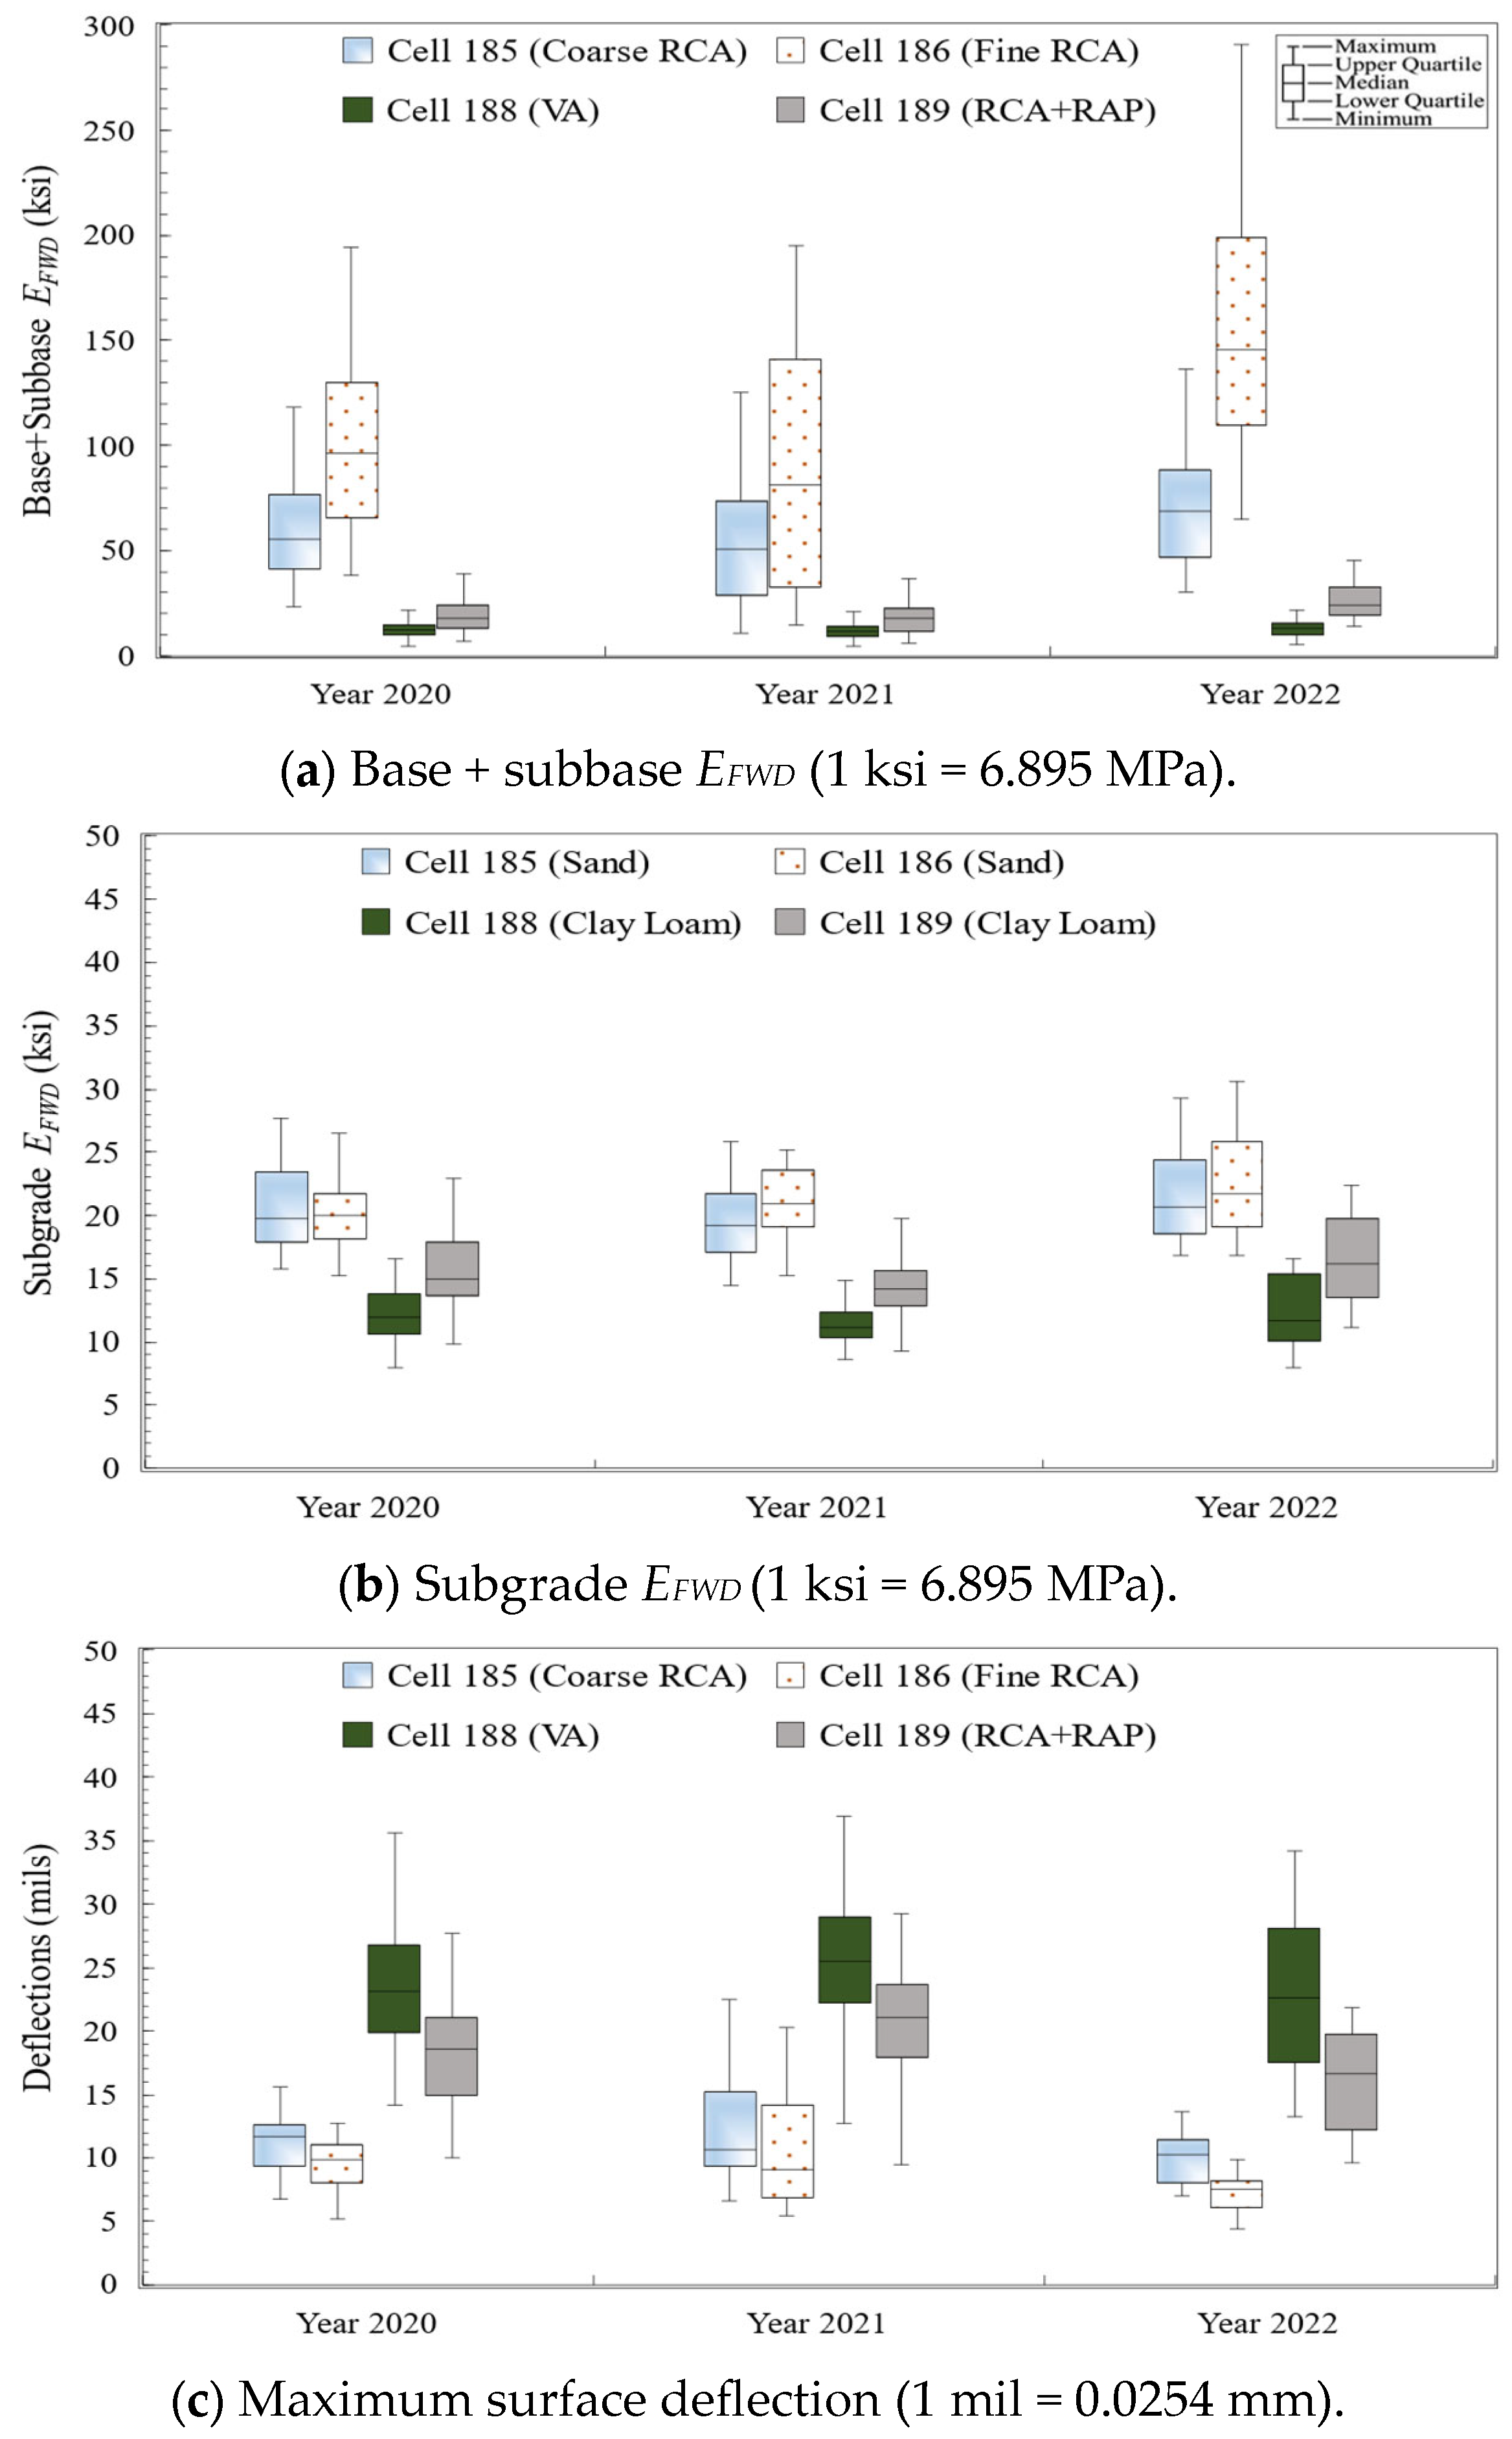
3.1. FWD Test Results
3.2. Comparison of Laboratory-Measured MR against Backcalculated EFWD
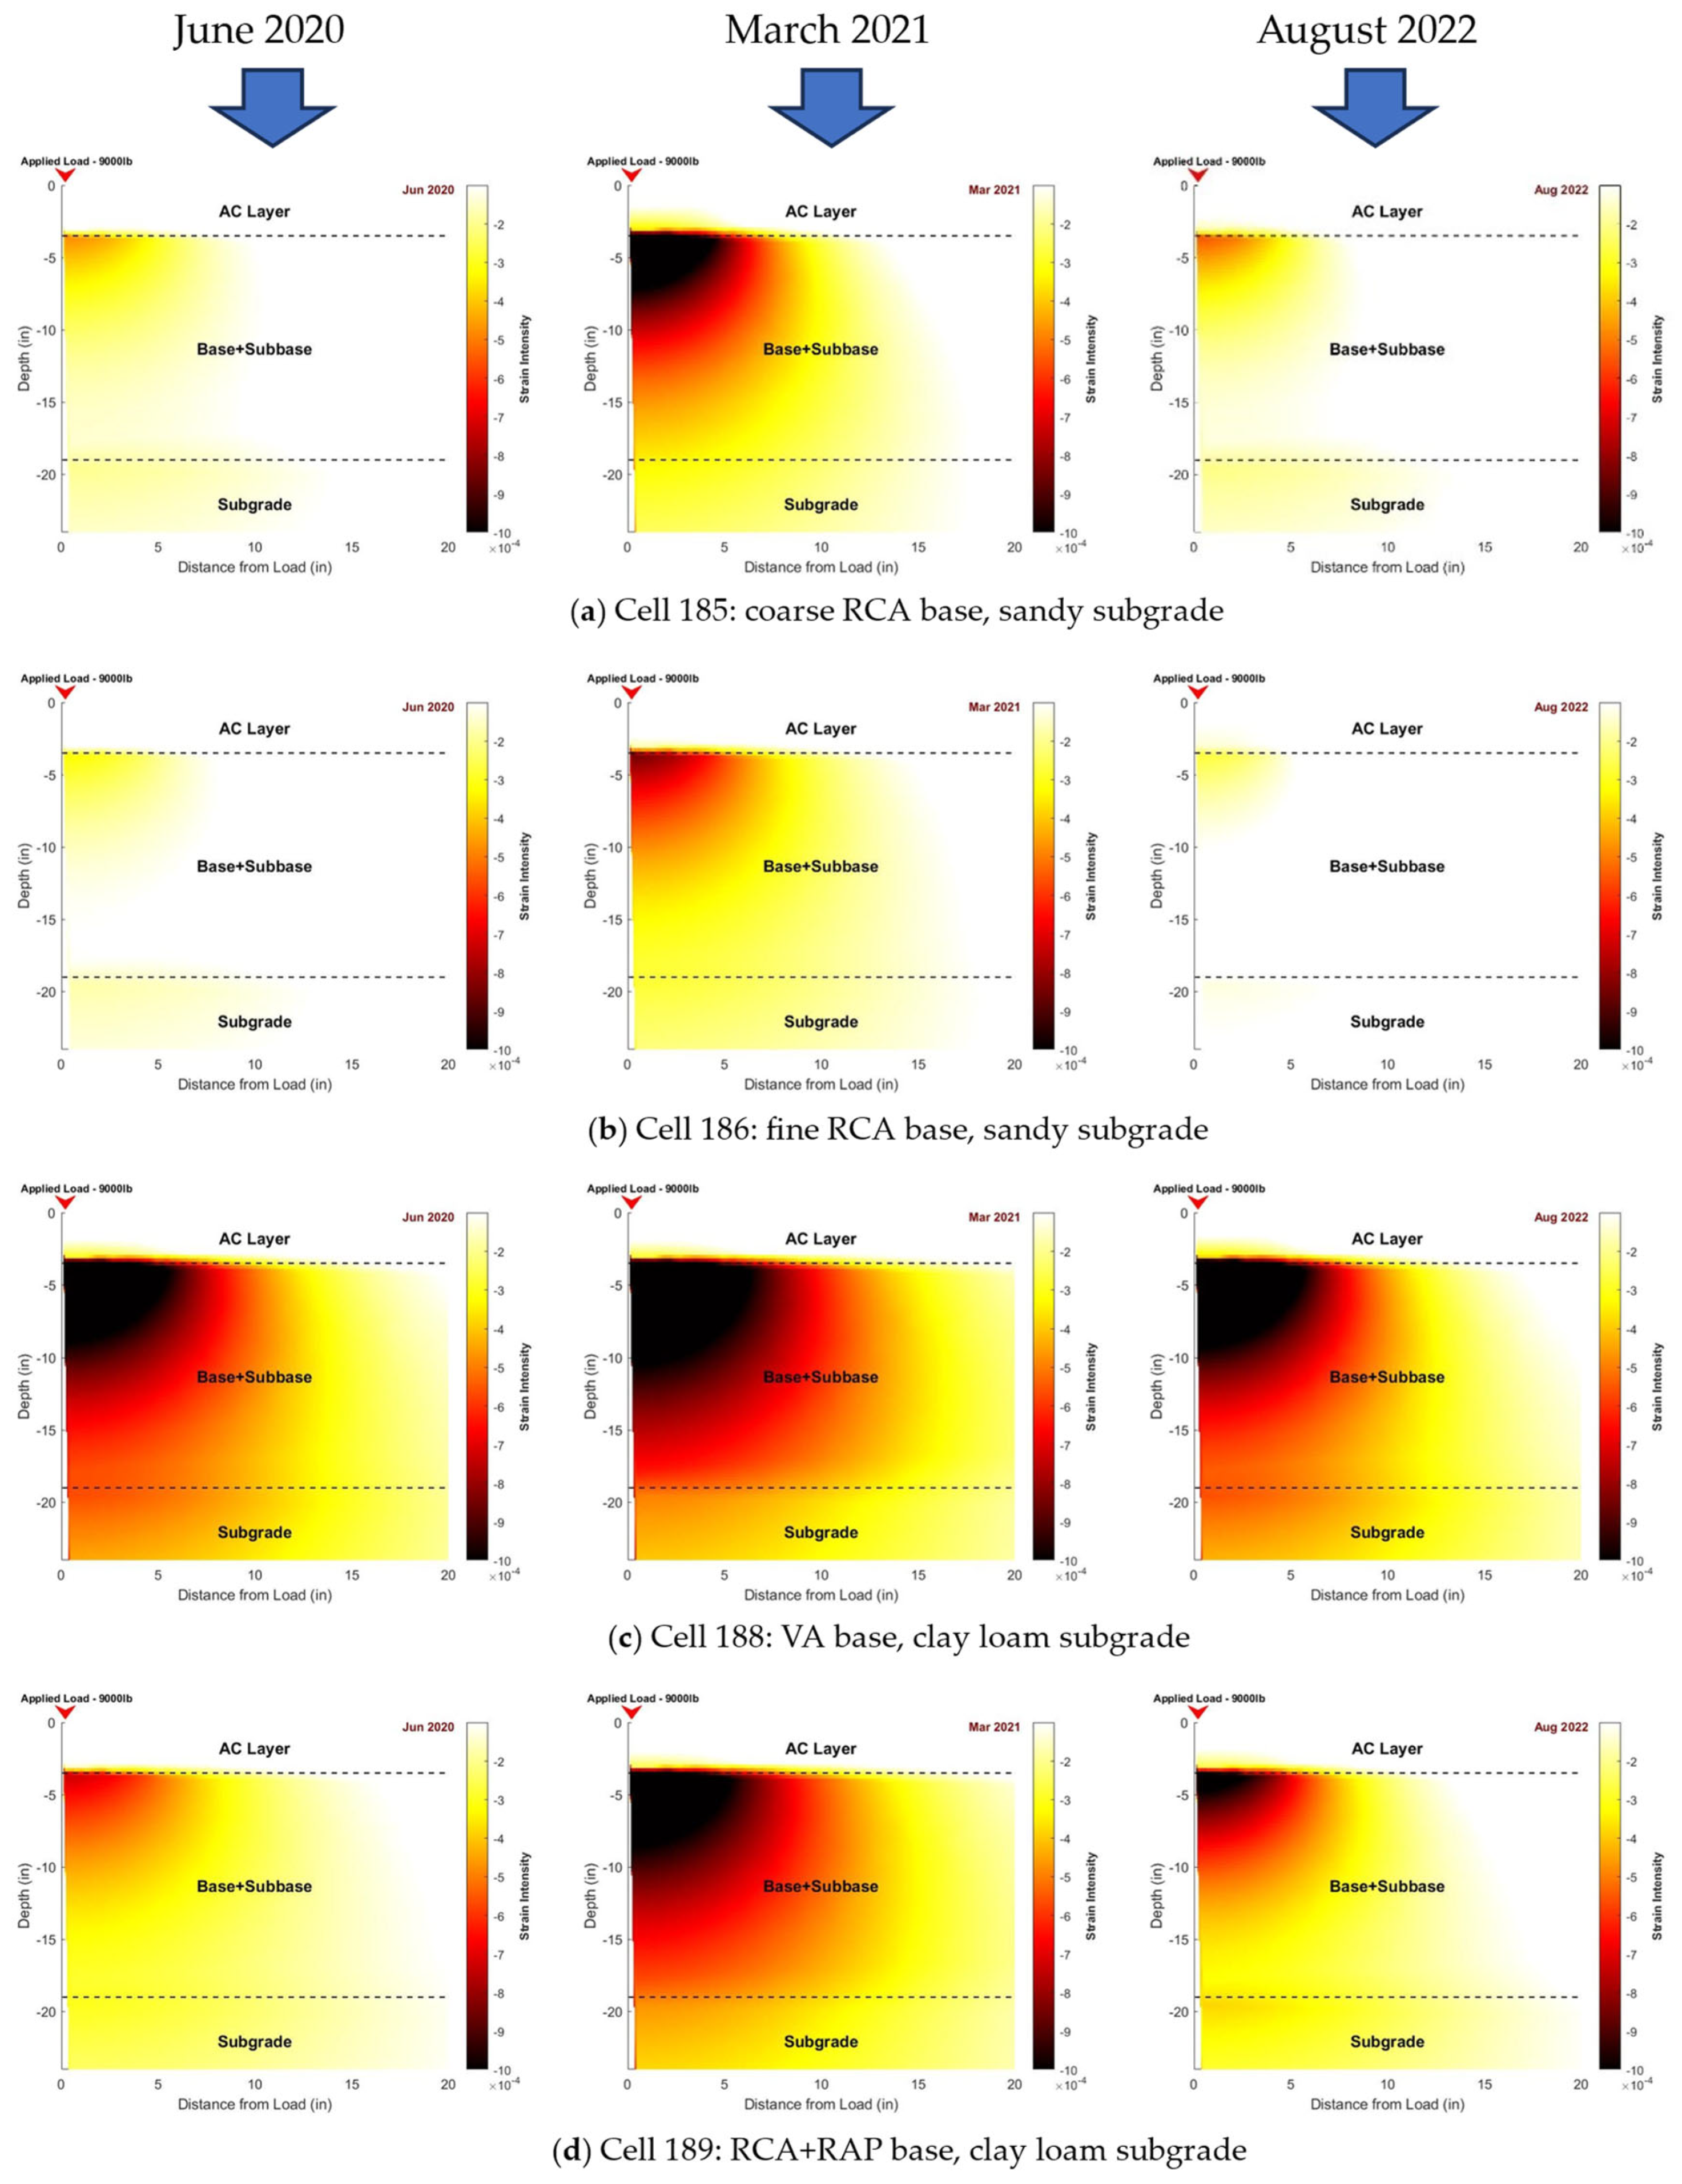
3.3. Distribution of Nonlinear Vertical Strain Responses
3.4. Validation of FWD-Based Calibrated NCHRP 1-37A Model
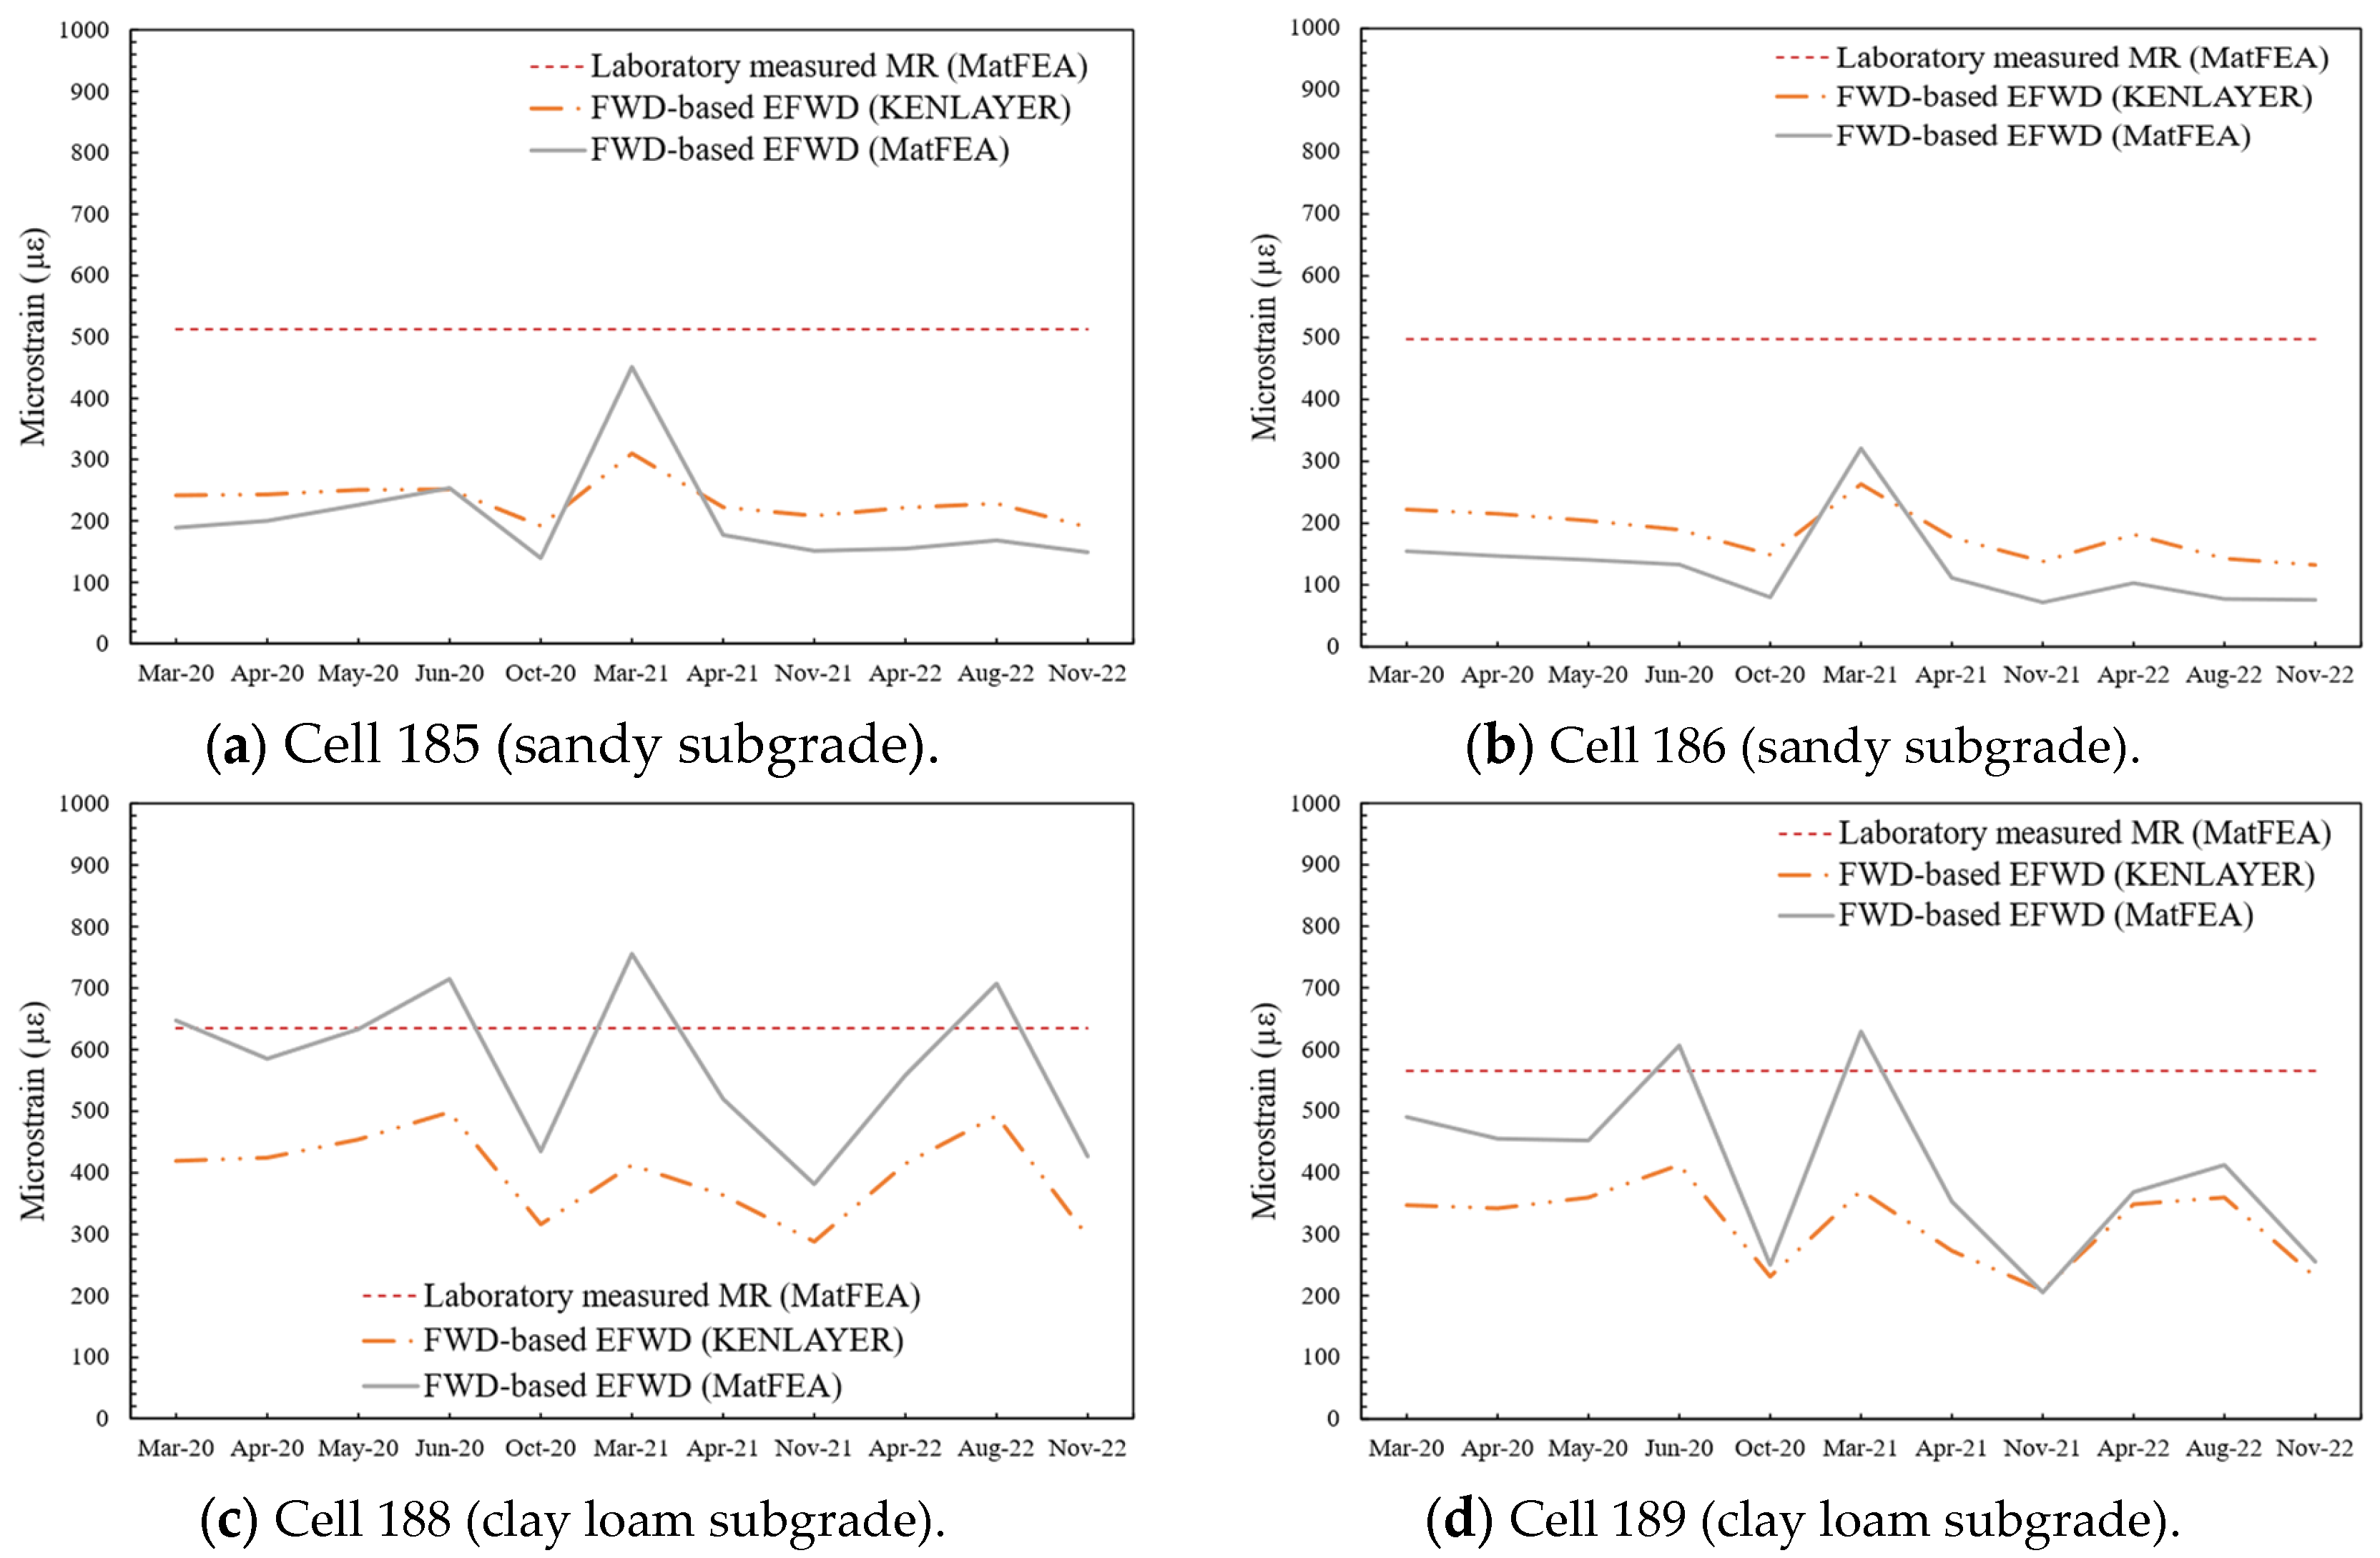
3.5. Comparison of Vertical Strains
4. Summary and Conclusions
- The application of fine recycled concrete aggregate (RCA) materials in the base layer showed the best results in the field with their high stiffness and low strain responses, followed by coarse RCA, the blend of RCA and recycled asphalt pavement (RAP) (RCA + RAP), and VA materials.
- Laboratory-measured MR values and their corresponding coefficients of the NCHRP 1-37A model cannot represent the stiffness state of RAB material in the field. They could result in overdesigning the pavement structure. This is attributed to the aging and hydration processes of the mortar components in RAB materials.
- A comparison of the vertical strain responses between the mid-depth of the base and the top of the subgrade layer presented no correlation between the laboratory-measured MR and the field-based backcalculated EFWD for the RAB materials. However, such a correlation seems reasonable for Cell 188, with the VA base (limestone) and clay loam subgrade layers, as the laboratory-based and field-based vertical strains were reasonably close to each other. Therefore, the following conversion factors are proposed by the authors:MR = 0.87 EFWD (for limestone aggregate in the base layer);MR = 1.55 EFWD (for clay loam material in the subgrade layer).
- Field-calibrated coefficients of the NCHRP 1-37A model, which were obtained using the LEA approach and multi-load FWD test data, were validated with the nonlinear FE-based pavement response.
- The difference between the vertical strains obtained using the FE-based approach and those calculated via LEA tended to increase with depth. The FE approach remained conservative by giving higher strains for limestone and RCA + RAP at 20in. The opposite was observed for the coarse and fine RCA.
- By generating the pavement’s response through nonlinear parameters or stress dependencies, obtained by using EFWD in the NCHRP model, the FE-based approach provided a better solution to avoid conversions of the modulus and obtain the best estimate of material in the field.
- This study examined the linear and nonlinear pavement responses to a single load level of 9000 lbs, establishing a foundation for future analyses of pavement responses under varying loads and their effects on the correlation between lab MR and EFWD.
Author Contributions
Funding
Institutional Review Board Statement
Informed Consent Statement
Data Availability Statement
Acknowledgments
Conflicts of Interest
References
- Christopher, B.R.; Schwartz, C.; Boudreau, R. Geotechnical Aspects of Pavements. Publication NHI-05-037; National Highway Institute: Washington, DC, USA, 2006; p. 888. [Google Scholar]
- ARA Inc. NCHRP Project 1-37A: Guide for Mechanistic–Empirical Design of New and Rehabilitated Pavement Structures; American Association of State Highway and Transportation Officials: Washington, DC, USA, 2004. [Google Scholar]
- Nazzal, M.D.; Mohammad, L.N. Estimation of Resilient Modulus of Subgrade Soils Using Falling Weight Deflectometer. Transp. Res. Rec. J. Transp. Res. Board 2010, 2186, 1–10. [Google Scholar] [CrossRef]
- Alavi, S.; Lecates, J.F.; Tavares, M.P. NCHRP Synthesis 381: Falling Weight Deflectometer Usage; National Cooperative Highway Research Program: Washington, DC, USA, 2008. [Google Scholar]
- Puppala, A.J. NCHRP Synthesis 382: Estimating Stiffness of Subgrade and Unbound Materials for Pavement Design; National Cooperative Highway Research Program: Washington, DC, USA, 2008. [Google Scholar]
- Malla, R.B.; Joshi, S. Establish Subgrade Support Values for Typical Soils in New England; Publication NETCR 57; New England Transportation Consortium: Fall River, MA, USA, 2006. [Google Scholar]
- AASHTO. AASHTO Guide for Design of Pavement Structures; American Association of State Highway and Transportation Officials: Washington, DC, USA, 1993. [Google Scholar]
- Chen, D.H.; Bilyeu, J.; He, R. Comparison of Resilient Moduli Between Field and Laboratory Testing: A Case Study. In Proceedings of the 78th Annual Meeting of Transportation Research Board, Washington, DC, USA, 10 January 1999. [Google Scholar]
- Von Quintus, H.L.; Killingsworth, B. Analyses Relating to Pavement Material Characterizations and Their Effect on Pavement Performance; Publication FHWA-RD-97-085; Federal Highway Administration: McLean, VA, USA, 1998. [Google Scholar]
- Nazarian, S.; Yuan, D.; Tandon, V.; Arellano, M. Quality Management of Flexible Pavement Layers with Seismic Methods; Publication Research Report 0-1735-3; Center for Transportation Infrastructure Systems: El Paso, TX, USA, 2005; p. 119. [Google Scholar]
- Ping, W.V.; Yang, Z.; Gao, Z. Field and Laboratory Determination of Granular Subgrade Moduli. J. Perform. Constr. Facil. 2002, 16, 149–159. [Google Scholar] [CrossRef]
- Rahim, A.; George, K.P. Falling Weight Deflectometer for Estimating Subgrade Elastic Moduli. J. Transp. Eng. 2002, 129, 100–107. [Google Scholar] [CrossRef]
- Coban, H.S.; Cetin, B.; Ceylan, H.; Edil, T.B.; Likos, W.J. Evaluation of Engineering Properties of Recycled Aggregates and Preliminary Performance of Recycled Aggregate Base Layers. J. Mater. Civ. Eng. 2022, 34, 04022053. [Google Scholar] [CrossRef]
- ASTM D6913; Standard Test Methods for Particle-Size Distribution (Gradation) of Soils Using Sieve Analysis. ASTM International: West Conshohocken, PA, USA, 2004.
- ASTM D2487; Standard Practice for Classification of Soils for Engineering Purposes (Unified Soil Classification System). ASTM International: West Conshohocken, PA, USA, 2017.
- BSI 1377-2; Methods of Test for Soils for Civil Engineering Purposes—Part 2: Classification Tests. British Standards Institution: London, UK, 1990.
- ASTM D1557; Standard Test Methods for Laboratory Compaction Characteristics of Soil Using Modified Effort. ASTM International: West Conshohocken, PA, USA, 2020.
- ASTM D4718; Standard Practice for Correction of Unit Weight and Water Content for Soils Containing Oversize Particles. ASTM International: West Conshohocken, PA, USA, 2015.
- ASTM C127; Standard Test Method for Relative Density (Specific Gravity) and Absorption of Coarse Aggregate. ASTM International: West Conshohocken, PA, USA, 2015.
- ASTM C128; Standard Test Method for Relative Density (Specific Gravity) and Absorption of Fine Aggregate. ASTM International: West Conshohocken, PA, USA, 2015.
- ASTM D854; Standard Test Methods for Specific Gravity of Soil Solids by Water Pycnometer. ASTM International: West Conshohocken, PA, USA, 2014.
- AASHTO T 307; Standard Method of Test for Determining the Resilient Modulus of Soils and Aggregate Materials. American Association of State Highway and Transportation Officials (AASHTO): Washington, DC, USA, 2007.
- Cetin, B.; Coban, H.S.; Edil, T.B.; Likos, W.J.; Zheng, J.; Buss, A. Determining Pavement Design Criteria for Recycled Aggregate Base and Large Stone Subbase; Publication NRRA202103; Minnesota Department of Transportation: St. Paul, MN, USA, 2021. [Google Scholar]
- Hick, R.G.; Monismith, C.L. Factors Influencing the Resilient Response of Granular Materials. Highw. Res. Rec. 1971, 345, 15–31. [Google Scholar]
- Witczak, M.W.; Uzan, J. The Universal Airport Pavement Design System, Report I of V: Granular Material Characterization; University of Maryland: College Park, MD, USA, 1998. [Google Scholar]
- Ahmed, M.; Hasan, M.; Tarefder, R. Investigating Stress Dependency of Unbound Layers Using Falling-Weight Deflectometer and Resilient Modulus Tests. Geotech. Test. J. 2016, 39, 954–964. [Google Scholar] [CrossRef]
- Huang, Y. Pavement Analysis and Design; Pearson: Upper Saddle River, NJ, USA, 2004. [Google Scholar]
- Abdollahi, S.F.; Kutay, M.E.; Ghazavi, M. MatFEA: Efficient Finite Element Framework for Analyzing Pavement Structures with Nonlinear Unbound Materials. Transp. Res. Rec. J. Transp. Res. Board 2023, 2677, 732–742. [Google Scholar] [CrossRef]
- Thompson, M.R.; Elliot, R.P. ILLI-PAVE-Based Response Algorithms for Design of Conventional Flexible Pavements. Transp. Res. Rec. J. Transp. Res. Board 1985, 1043, 50–57. [Google Scholar]
- Uzan, J. Characterization of Granular Materials. Transp. Res. Rec. J. Transp. Res. Board 1985, 1022, 52–59. [Google Scholar]


| Material | Gravel 1 (%) | Sand 2 (%) | Fine 3 (%) | Cu 4 | Cc 5 | LL 6 (%) | USCS 7 | MDU 8 (pcf) | OMC 9 (%) | Abp.10 |
|---|---|---|---|---|---|---|---|---|---|---|
| Coarse RCA | 61.7 | 34.9 | 3.4 | 34.49 | 1.75 | N/A 11 | GW | 126.10 | 9.5 | 6.97 |
| Fine RCA | 38.3 | 54.6 | 7.1 | 33.93 | 1.12 | 32.7 | SW-SM | 119.24 | 11.1 | 8.65 |
| Limestone | 52.3 | 32.6 | 15.1 | 211.3 | 1.91 | 17.9 | GM | 140.46 | 6.3 | 1.72 |
| RCA + RAP | 41 | 50.4 | 8.6 | 49.41 | 0.98 | 27.4 | SP-SM | 123.61 | 10.0 | 4.34 |
| Sand (subgrade) | 27.6 | 59.8 | 12.6 | 33.12 | 1.24 | 19.9 | SM | 134.84 | 5.6 | 1.84 |
| Clay loam | 3.1 | 37.2 | 59.7 | N/A | N/A | 36.3 | CL | 122.36 | 10 | N/A |
| Sand (subbase) | 31.1 | 56.5 | 12.4 | 30.30 | 1.10 | 18.9 | SM | 137.34 | 5.3 | 1.53 |
| Material | Lab Tests | Multi-Load FWD Tests | ||||||
|---|---|---|---|---|---|---|---|---|
| k1 | k2 | k3 | SMR (ksi) | k1-FWD | k2-FWD | k3-FWD | EFWD (ksi) | |
| Coarse RCA | 913 | 0.44 | −0.07 | 18.1 | 4125 | 0.24 | −0.03 | 58.28 |
| Fine RCA | 882 | 0.45 | −0.06 | 17.8 | 7616 | 0.17 | −0.03 | 107.7 |
| VA | 762 | 0.32 | −0.05 | 13.9 | 894 | 0.14 | −0.05 | 12.08 |
| RCA + RAP | 803 | 0.51 | −0.12 | 16.5 | 1310 | −0.01 | −0.06 | 19.75 |
| Sand subgrade | 947 | 0.75 | −0.42 | 11.3 | 1558 | 0.07 | −0.05 | 20.4 |
| Clay loam | 1005 | 0.33 | −2.59 | 8.6 | 810 | −0.08 | −0.06 | 13.35 |
| Material | Relative Difference (EFWD) | |
|---|---|---|
| Base + Subbase | Subgrade | |
| Cell 185 (coarse RCA base, sandy subgrade) | 0.99 | 0.85 |
| Cell 186 (fine RCA base, sandy subgrade) | 0.96 | 0.92 |
| Cell 188 (VA base, clay loam subgrade) | 0.97 | 1.12 |
| Cell 189 (RCA + RAP base, clay loam subgrade) | 0.99 | 1.10 |
| Test Section | Average Relative Difference between EFWD and MR Strains at 9 Inches | Average Relative Difference between EFWD and MR Strains at 20 Inches | ||
|---|---|---|---|---|
| FE | LEA | FE | LEA | |
| Cell 185 (coarse RCA base, sandy subgrade) | 0.45 | 0.43 | 0.40 | 0.45 |
| Cell 186 (fine RCA base, sandy subgrade) | 0.30 | 0.30 | 0.26 | 0.47 |
| Cell 188 (VA base, clay loam subgrade) | 0.93 | 0.96 | 0.91 | 0.63 |
| Cell 189 (RCA + RAP base, clay loam subgrade) | 0.76 | 0.76 | 0.72 | 0.56 |
Disclaimer/Publisher’s Note: The statements, opinions and data contained in all publications are solely those of the individual author(s) and contributor(s) and not of MDPI and/or the editor(s). MDPI and/or the editor(s) disclaim responsibility for any injury to people or property resulting from any ideas, methods, instructions or products referred to in the content. |
© 2024 by the authors. Licensee MDPI, Basel, Switzerland. This article is an open access article distributed under the terms and conditions of the Creative Commons Attribution (CC BY) license (https://creativecommons.org/licenses/by/4.0/).
Share and Cite
Zulfiqar, Q.; Haider, S.W.; Cetin, B.; Coban, H.S.; Abdollahi, S.F. Comparison of Lab vs. Backcalculated Moduli of Virgin Aggregate and Recycled Aggregate Base Layers. Appl. Sci. 2024, 14, 9049. https://doi.org/10.3390/app14199049
Zulfiqar Q, Haider SW, Cetin B, Coban HS, Abdollahi SF. Comparison of Lab vs. Backcalculated Moduli of Virgin Aggregate and Recycled Aggregate Base Layers. Applied Sciences. 2024; 14(19):9049. https://doi.org/10.3390/app14199049
Chicago/Turabian StyleZulfiqar, Qasim, Syed Waqar Haider, Bora Cetin, Haluk Sinan Coban, and Seyed Farhad Abdollahi. 2024. "Comparison of Lab vs. Backcalculated Moduli of Virgin Aggregate and Recycled Aggregate Base Layers" Applied Sciences 14, no. 19: 9049. https://doi.org/10.3390/app14199049
APA StyleZulfiqar, Q., Haider, S. W., Cetin, B., Coban, H. S., & Abdollahi, S. F. (2024). Comparison of Lab vs. Backcalculated Moduli of Virgin Aggregate and Recycled Aggregate Base Layers. Applied Sciences, 14(19), 9049. https://doi.org/10.3390/app14199049