Article

The Application of Computed Tomography to Study the Soil Porosity of Mountain Red Earth

Faculty of Geography, Yunnan Normal University, Kunming, Yunnan, 650500, China
*
Author to whom correspondence should be addressed.
Appl. Sci. 2024, 14(19), 9050; https://doi.org/10.3390/app14199050
Submission received: 20 August 2024 / Revised: 1 October 2024 / Accepted: 3 October 2024 / Published: 7 October 2024

Abstract

:
Mountain red soil, as a special type of soil in the South, has received widespread attention for its soil erosion problems. Its pore structure restricts water infiltration, thereby affecting the occurrence and development of soil erosion. In order to systematically obtain the distribution characteristics of the pore structure within the surface mountain red soil, this paper uses non-destructive CT detection technology to scan the soil column samples taken from the typical mountain red soil distribution area in Chenggong District, Kunming City, Yunnan Province. Image processing technology is applied to CT slices, and ImageJ (1.46r) software is used to obtain the distribution characteristics of pores within the soil column, including pore sizes and the number of pores at each depth, the proportion of pore area, roundness, and box-counting dimension. The results show that with the increase in depth, the proportion of pore area decreases linearly from the maximum value of 52.25% at the top to the minimum value of 2.02% at the bottom; the roundness of pores fluctuates between 0.8 and 0.9, overall increasing; the total number of pores generally first increases then decreases, and small pores are predominant, with the least number of large pores in the topsoil layer; the box-counting dimension shows a gradual linear decrease, with a maximum value of 1.7980 and a minimum value of 0.9878. The number of pores affects both roundness and the box-counting dimension, and the proportion of pore area also affects the box-counting dimension. There is a negative correlation between roundness and the box-counting dimension. The 3D visualization reconstruction of pores shows that most are interconnected, with the pore size significantly reducing with increasing depth. The quantitative analysis of parameters and 3D visualization reveal, to some extent, the impact of pore structure on the occurrence and development of soil erosion in mountain red soil. These research findings form the foundation for studying soil erosion in this region and provide a basis for systematically understanding its processes and mechanisms.

1. Introduction

Mountain Red Earth, a type of soil predominantly found in southern China, is characterized by its high iron oxide content, imparting a distinctive reddish hue to the soil. This soil type plays a significant role in agricultural production and the ecological environment. Its unique properties and composition make it a subject of considerable interest in soil science and environmental studies [1]. In recent years, due to the influence of natural factors and human activities, the erosion and degradation of Mountain Red Earth has caused various ecological and environmental problems, such as ecological degradation and sediment deposition, and these problems have attracted worldwide attention [2].
Regions where Mountain Red Earth is found typically exhibit uneven terrain and soil with a complex pore structure, leading to significant spatial variability in permeability. Areas with low vegetation cover are especially vulnerable to soil erosion during rainy seasons, which thins the soil layer and severely impacts the regional ecological environment. Regarding soil-water loss in red soil, many scholars have focused on how different scale structures and particle size compositions affect mechanical characteristics. This includes the impact of soil regulation on soil structure and its relation to red soil’s erosion resistance [3,4,5]. Previous studies have mainly concentrated on agricultural soils, noting that different land use and cropping methods significantly affect runoff and soil erosion [6,7]. Red soil is characterized by low levels of organic carbon, total nitrogen, available nitrogen, available potassium, and calcium [8], along with a poor aggregate structure, making it prone to rapid erosion [9]. Additionally, red soil is susceptible to physical crusting, which leads to faster runoff and greater damage under rainfall conditions [10,11], especially during rapid rainfall events. Undoubtedly, the structure and physicochemical properties of red soil [12], particularly its pore structure and permeability, are critical intrinsic factors determining soil erosion [13].
Conducting systematic quantitative research on the pore structure characteristics of Mountain Red Earth is theoretically significant for understanding the processes and mechanisms of soil erosion. Currently, the soil slicing method is a commonly used but destructive technique for observing the microscopic pore structure of soil. This method involves preparing soil slices using epoxy resin impregnation, which, despite its complexity and potential to disrupt the native soil structure, is less destructive than earlier methods and facilitates easier shaping. However, it remains inconvenient for large-scale samples. With further optimization, it is now possible to produce 30 μm thick soil thin sections through processes, including air-drying, oven-drying, impregnation, curing, slicing, and grinding [14,15,16]. In summary, the soil slicing method is often overly complex and prone to disrupting the native structure, and due to technical limitations, it remains unsuitable for widespread application. Non-destructive research methods such as the dye tracing technique (DTT) and moisture penetration methods are generally more applicable. The DTT method tracks soil moisture to construct an intact and high-precision native soil structure. While effective for pore structure analysis, it is challenging to obtain sufficient stained profiles in field conditions to comprehensively reconstruct soil structure, so it is often used to validate related studies [17]. In recent years, the agricultural sector has utilized ultrasonic sensing methods to measure the porosity of arable land. This method is unique in its ability to measure porosity in a non-invasive and relatively straightforward manner [18]. Computed Tomography (CT) technology has played a crucial role in soil and geological research and has achieved significant development with the progress of electronic computer technology. Initially, the technology was widely used in the fields of petroleum, geology, and mining and later introduced into geological structure and soil research, providing a new perspective for quantitative structural characterization [19,20,21,22,23]. For example, through 3D reconstruction, CT technology enables researchers to visually compare water migration paths under different land use types and observe the long-term effects of cultivation on soil physical properties [24,25,26,27,28]. In the study of peatland, CT technology has achieved the first extraction of the peat deposit porous network from µCT images, filling the gap in the study of peatland porosity characteristics [29]. CT technology has offered significant insights into the assessment of the physical properties and compressibility of rehabilitated soils [30]. Additionally, it has been utilized to investigate the impact of long-term application of cow manure and inorganic fertilizers on the porosity structure of soils in corn-soybean rotation systems [31]. Its non-invasive nature and capability for precise quantitative analysis have provided a robust foundation for further research in the fields of soil science and geology [32].
Mountain Red Earth is a unique type of soil widely distributed across subtropical and tropical regions. Despite its ecological importance, there is still a limited understanding of how it interacts with different agricultural practices, particularly the use of organic and inorganic amendments. This knowledge gap may affect the sustainable management of these soils, especially in areas prone to erosion. To address this issue, our study proposes using computed tomography (CT) technology to scan soil columns from Mountain Red Earth. Previous research shows that this soil has not been thoroughly studied using non-destructive methods to examine its pore structure, especially in eroded areas. By applying CT scanning, we aim to provide a clear and detailed view of the pore structure in Mountain Red Earth. This approach could help improve our understanding of how soil erosion occurs and suggest better ways to manage the soil, leading to more sustainable agricultural practices and better soil conservation.

2. Materials and Methods

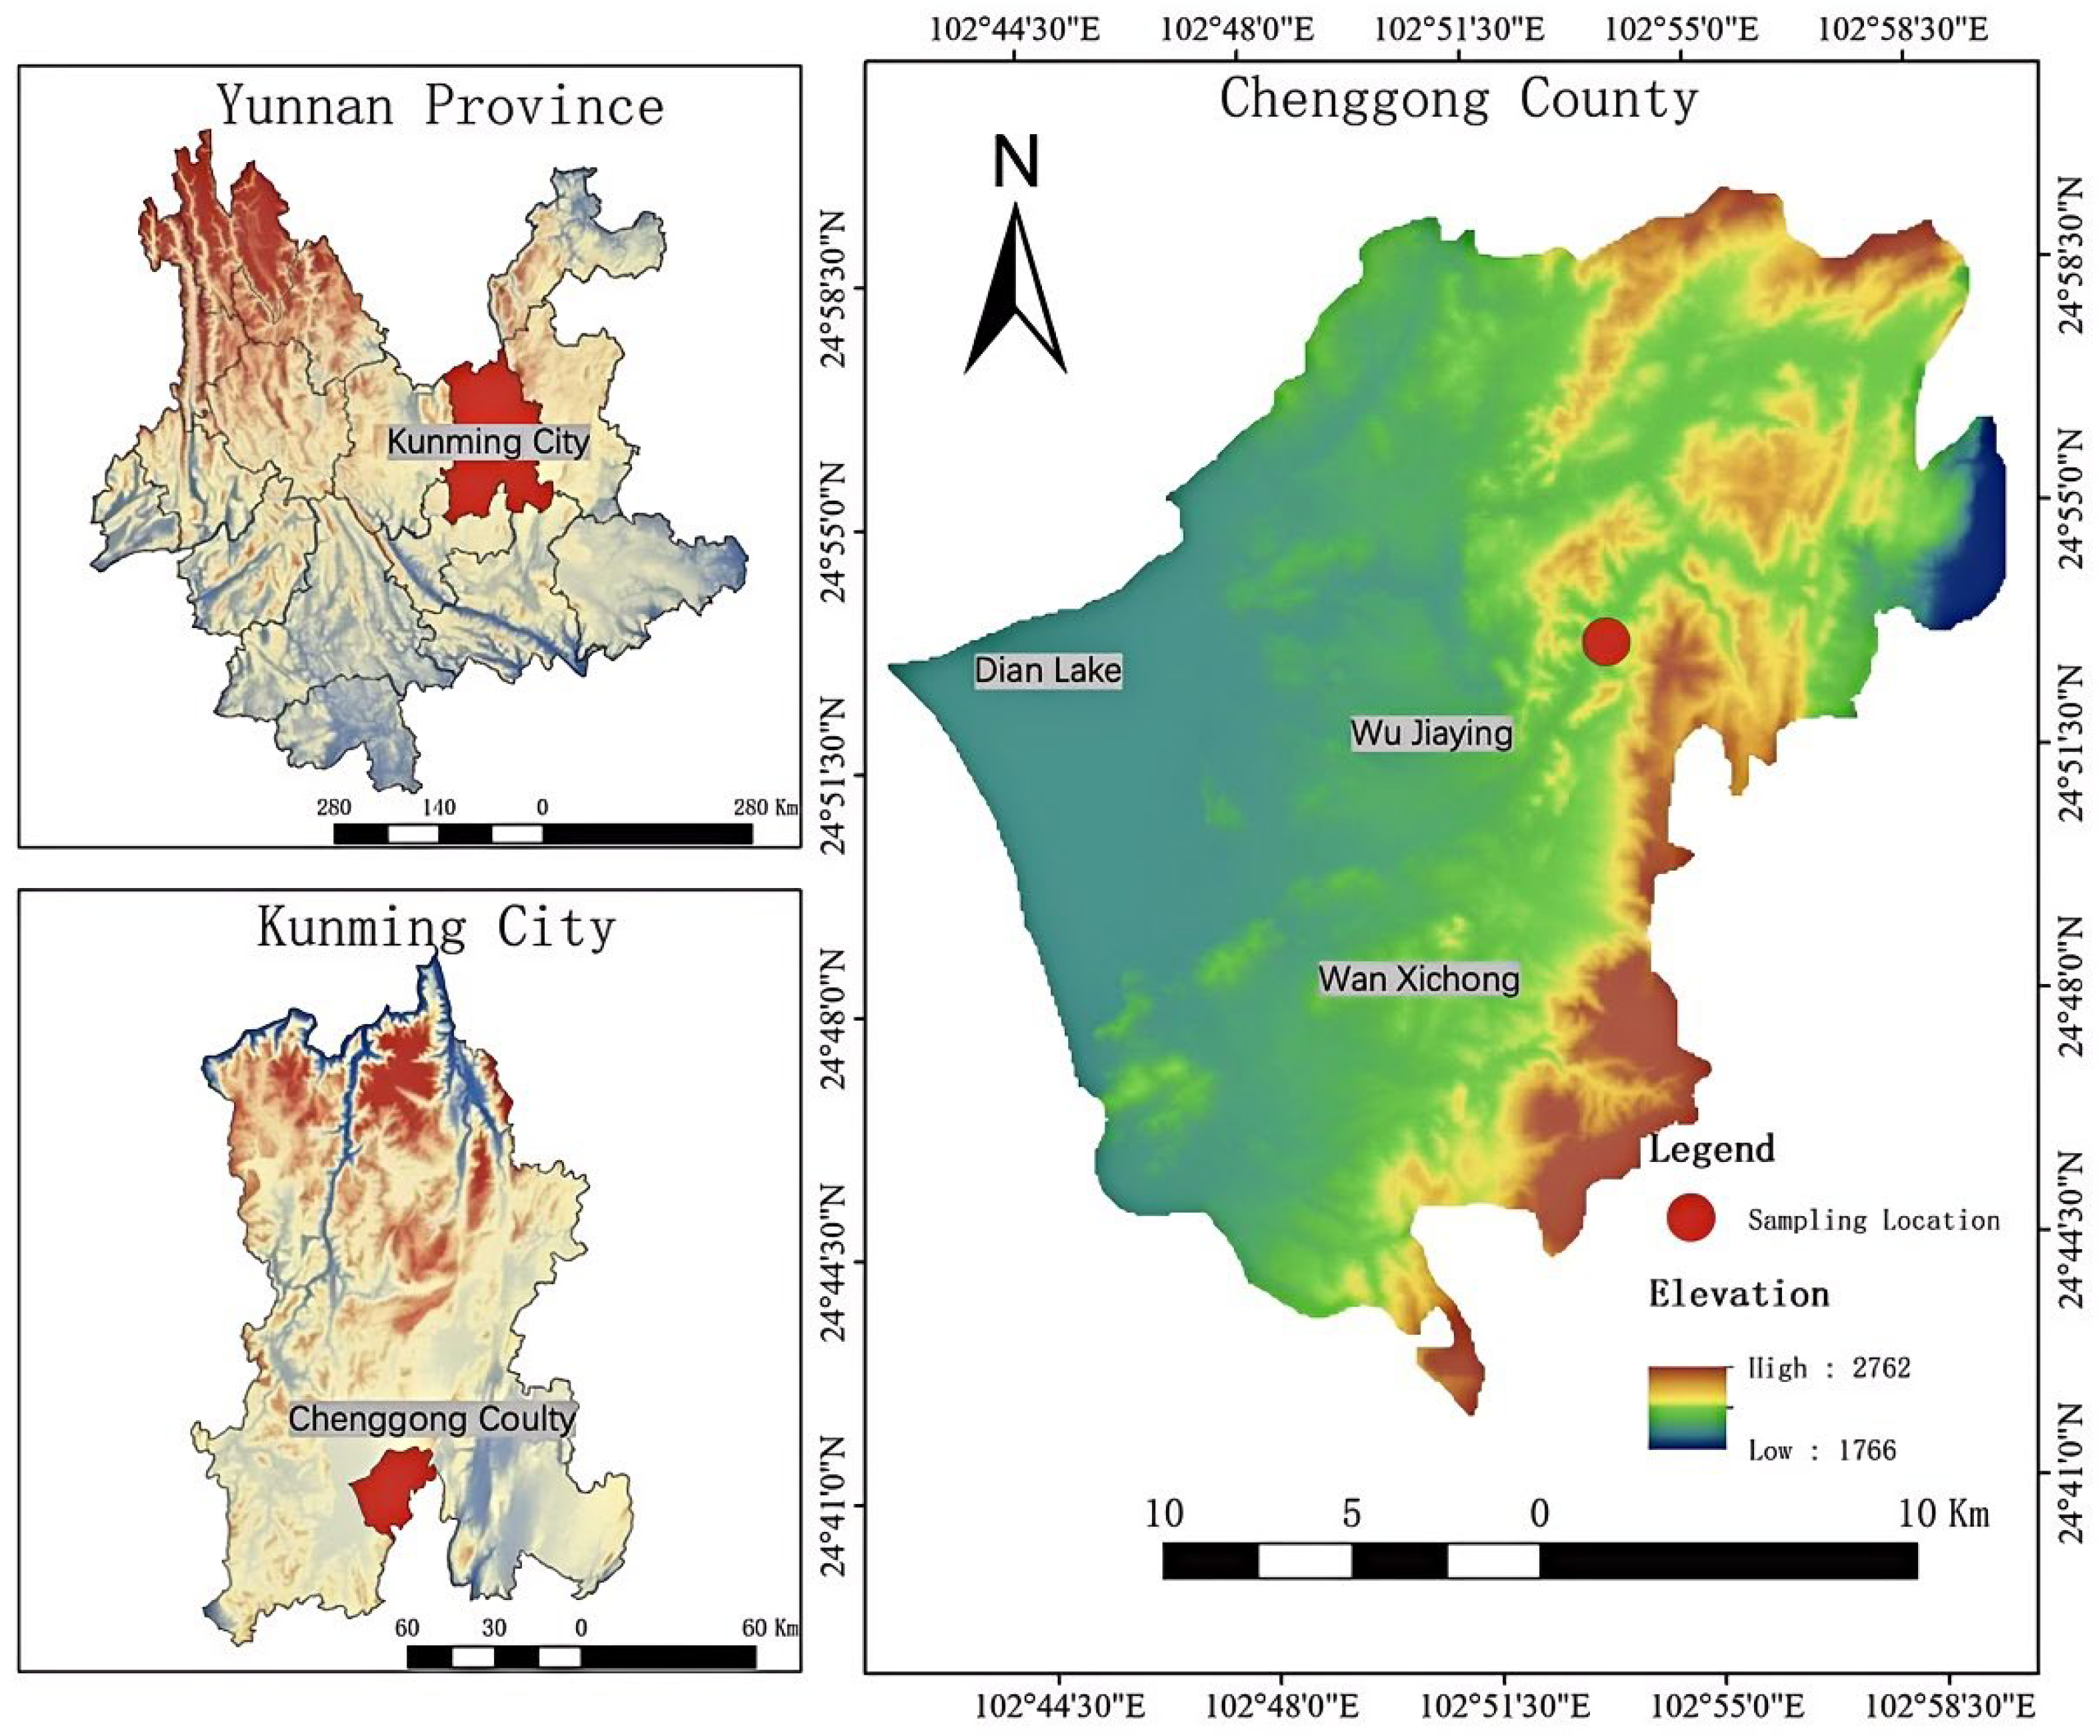
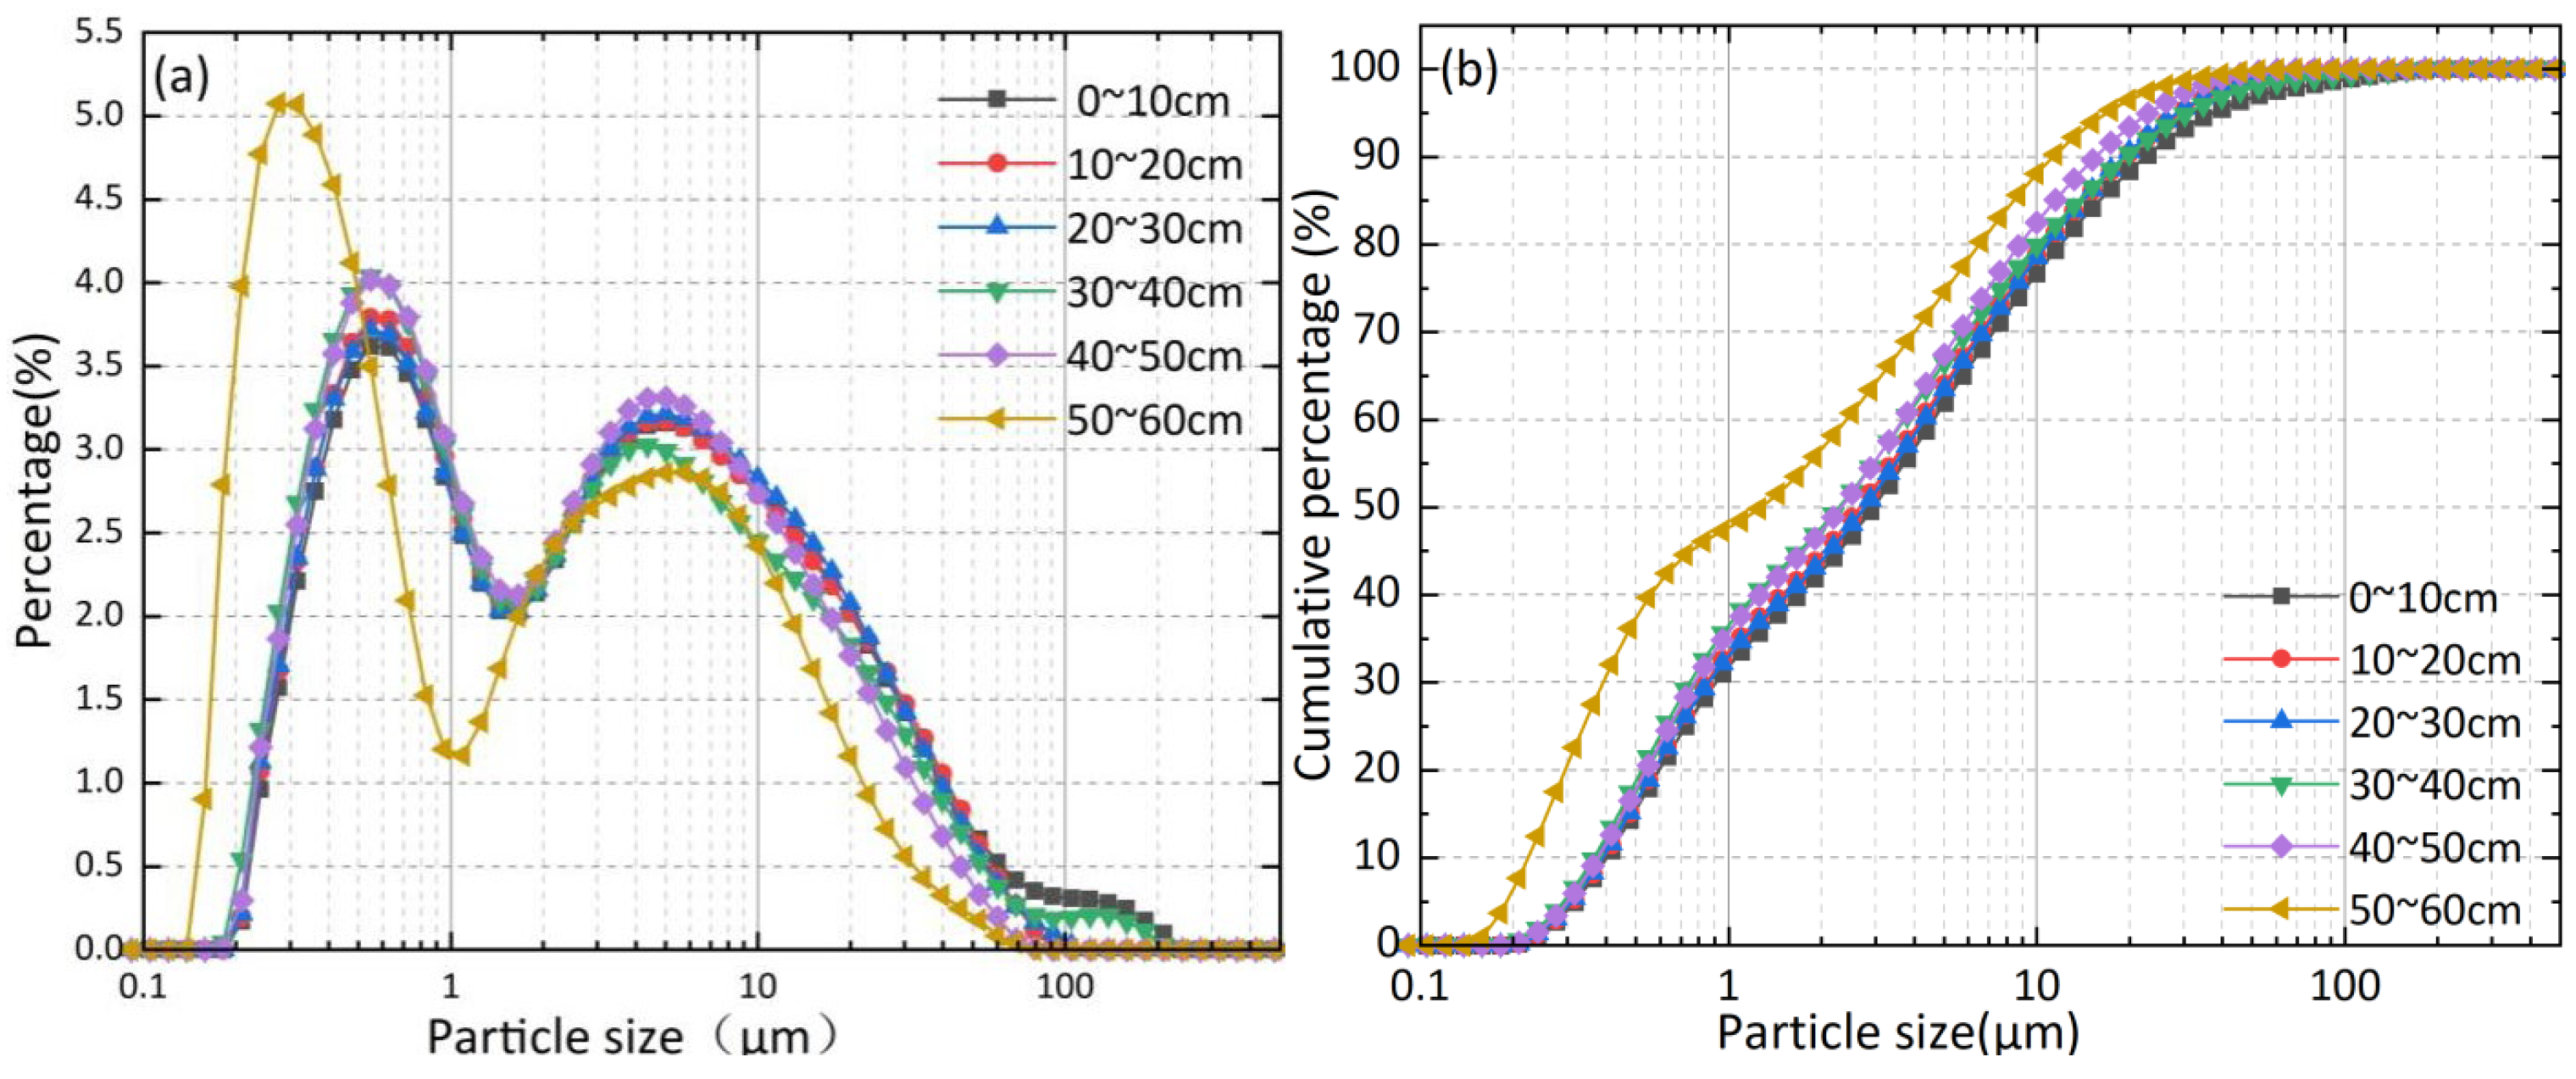
2.1. Study Site and Sampling

The study area is located in the southwestern corner of Songmao Reservoir, Laoya Mountain, Chenggong District, Kunming City, Yunnan Province, China (Figure 1). Songmao Reservoir, built in 1958, is situated in the upper reaches of the Laoyu River in the Chenggong District of Kunming City, Yunnan Province. The normal reservoir capacity is 10.9 million cubic meters, with a catchment area of 38 square kilometers. The annual average precipitation is over 1000 mm. This area belongs to the subtropical highland monsoon climate. The reservoir water surface is at an altitude of 2016.75 m, surrounded by mountains and dense forests, making it a typical red soil region. The research area is situated approximately 10 km east of Dianchi Lake, in the hilly region on the outskirts of the Kunming Basin. The area features small elevation differences and slopes, well-developed gullies, and relatively well-preserved but variably thick weathering crusts. In this region, extensive and deep regional ancient soils known as Mountain Red Earth are widely distributed across the Yunnan Guizhou Plateau, primarily concentrated in the eastern part of the Yunnan Plateau. These red soils are generally believed to have begun forming in the late Tertiary period, when a warm and humid environment facilitated a process of desilication and aluminum enrichment in the rocks. This process resulted in the formation of thick, high-aluminum red weathering crusts. Subsequent tectonic movements intermittently uplifted the plateau, further promoting the development of Mountain Red Earth [33]. The vegetation in the region predominantly comprises subtropical evergreen broad-leaved forests, mainly consisting of artificially planted Yunnan pine and Chinese fir. The vertical structure of the plant communities is relatively straightforward. However, in recent years, the Laoyu River basin has faced severe erosion of Mountain Red Earth due to natural factors and human activities. This has resulted in adverse vegetation retrogression in parts of the study area, making it challenging for vegetation to establish and grow. Urgent measures such as tree planting, grass seeding, and vegetation restoration are crucial to address these ecological challenges.
The sampling site is located on the southwestern slope of Songmao Reservoir area, Kunming City, Yunnan Province, with geographical coordinates approximately 102.88° E longitude and 24.88° N latitude. In this area, there is development of secondary forests dominated by artificial plantations. The vegetation is primarily composed of eucalyptus trees. In order to maintain the original state of internal soil pores and facilitate sampling, an area was chosen that is relatively open and free from the influence of large tree roots. During sampling procedures, particular attention was given to carefully removing the superficial humus layer, which is loose and not pertinent to the research focus of this study. Initially, a boundary of 100 cm × 100 cm was excavated on the slope. After digging to the predetermined depth, the excavation slowly proceeded towards the core area of the soil column. When the excavation reached within 5 cm of the core region, the soil column was meticulously trimmed. The surplus of fine roots and debris on the side of the soil column was removed using a soil knife. To prevent water loss and disturbance to the soil body in its natural state during transportation, multiple layers of cling film and cushioning cotton layers were wrapped around the surface of the soil column at the site. The soil sample was then secured with a pre-prepared wooden board, and the exterior was tightly wrapped and sent to the detection unit for CT scanning.
During sample collection for CT scanning, samples were also taken at 10 cm intervals for particle size determination. The analysis results show that (Figure 2) the particle size frequency distribution curve reveals a bimodal characteristic, predominantly composed of clay (<0.002 mm) and silt (0.002–0.05 mm). The cumulative distribution curve indicates a relatively uniform particle size distribution. These characteristics suggest the presence of particles at different scales in the soil, which may result in a multi-scale pore structure. This uniform distribution facilitates the flow and retention of water and nutrients in the soil.Further research can integrate CT technology and other non-destructive testing methods to perform a more detailed quantitative analysis of the soil pores structure.

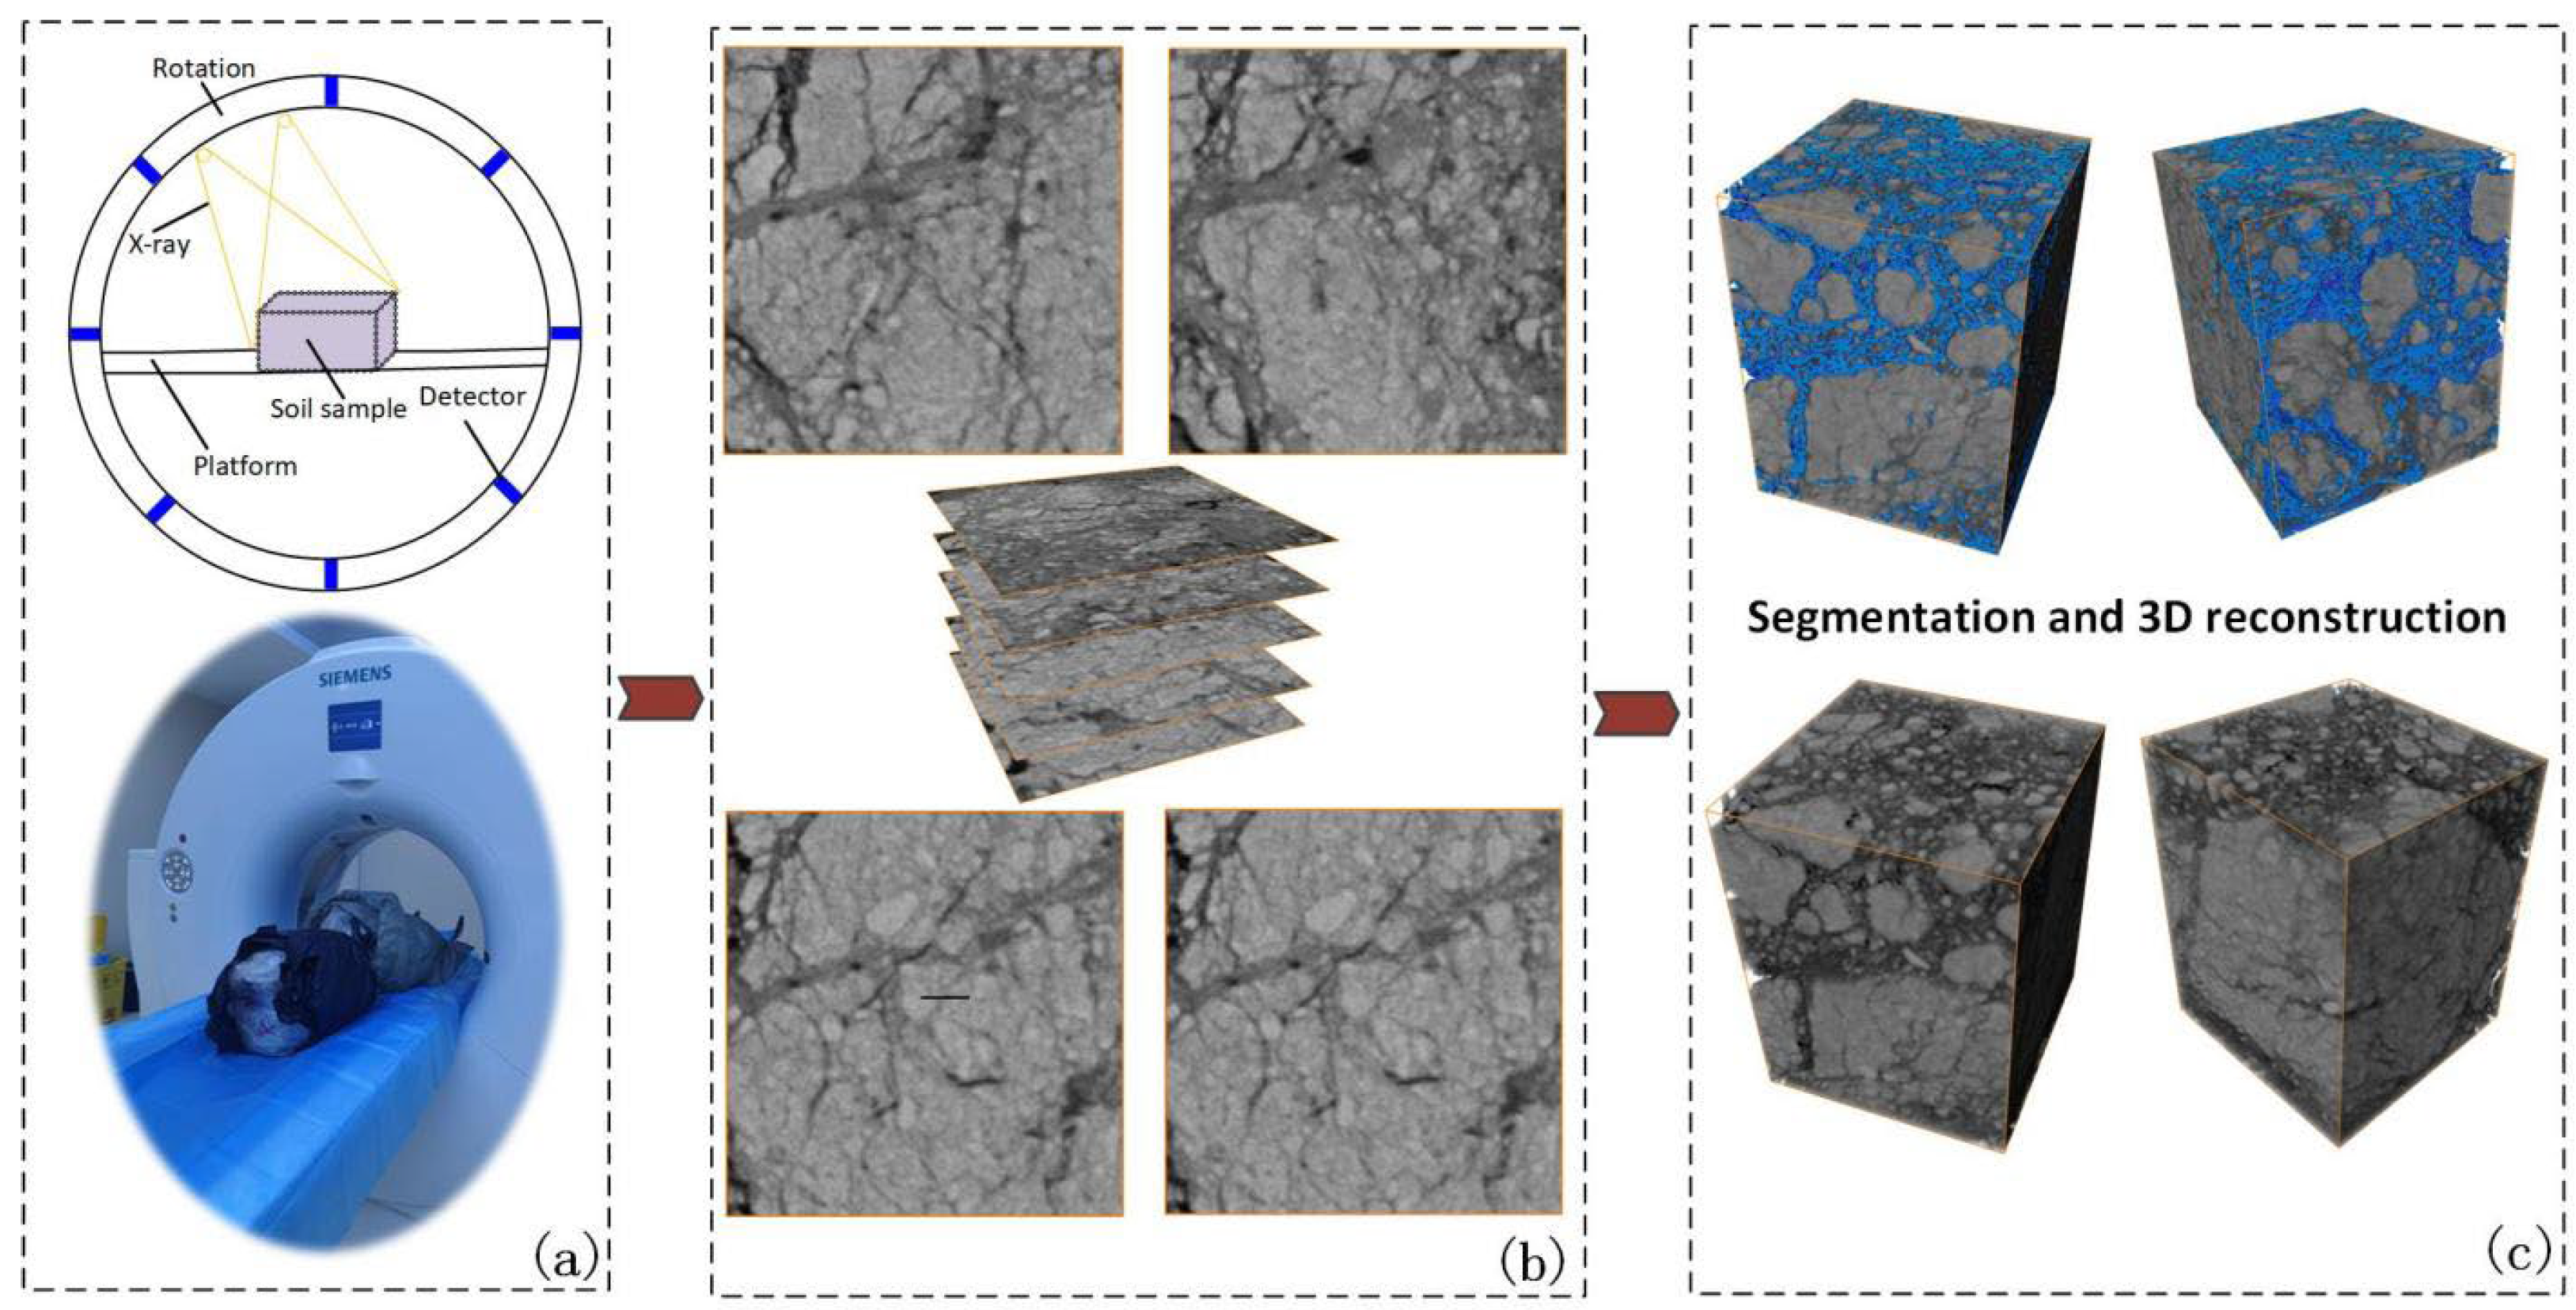
2.2. X-ray CT Scanning

The CT model used for scanning the soil samples in this study is the Siemens SOMATOM Definition AS+ 64-slice 128-layer CT (Siemens Healthineers, located in Erlangen, Germany). This machine is one of the most advanced CT scanners currently available and is also one of the high-end multi-slice spiral CTs with the fastest scanning speed and lowest radiation dosimetry. The most distinguishing feature of the 128-layer spiral CT is that it can scan the thinnest layer up to 0.6 mm, thereby enhancing the resolution of the images. The sub-millimeter scanning under a large coverage range provides a one-time rapid synchronous scanning of 128 layers, covering a range of 200 cm in a single scanning. This brings a new application experience to image diagnostics, especially in the field of functional diagnosis where it has made major technical breakthroughs. The imaging process can be simplified as follows: ball tube → X-ray → collimator → human/object data acquisition system (DAS) → antenna (front Slip) → optical fiber → reconstruction computer → main control computer. All components (including the examination bed) communicate via a controller local area network bus connected in a line. The status signals of each component after startup are uniformly sent back to the static main control unit for feedback [34]. As this CT scanner is primarily used for human medical examinations, the parameters need to be reset when scanning soil samples. The CT scanning parameters are set as follows: scanning current of 176 mA, voltage of 120 kV, voxel size of 0.98 mm × 0.98mm × 0.70 mm, resulting in a total of 500 × 500 × 868 voxels per soil column group. The inter-slice spacing for each CT slice is 0.7 mm. Note that the actual spatial resolution of the image data is generally considered to be twice the voxel size, which in this case is approximately 1.95 mm × 1.95 mm × 1.4 mm. This limitation arises from the inherent characteristics of medical CT imaging technology.
The process begins with placing the sample on the platform of the CT system (Figure 3a). Once the power supply is activated, the X-ray source rotates under control of the system, generating a sequence of CT slices of the concrete. These slices serve as the foundation for reconstructing the object’s 3D structure. Due to the varying densities and attenuation coefficients of different substances within the concrete, the brightness of the projections varies accordingly. In the CT slices (Figure 3b), different substances can be distinguished based on their brightness, measured as CT values. The slice image data obtained can be imported into a 3D space, where each coordinate point is populated with the data recorded by the CT scan. By assigning attributes such as color and transparency, 3D reconstruction of different materials, including pores, can be achieved (Figure 3c).

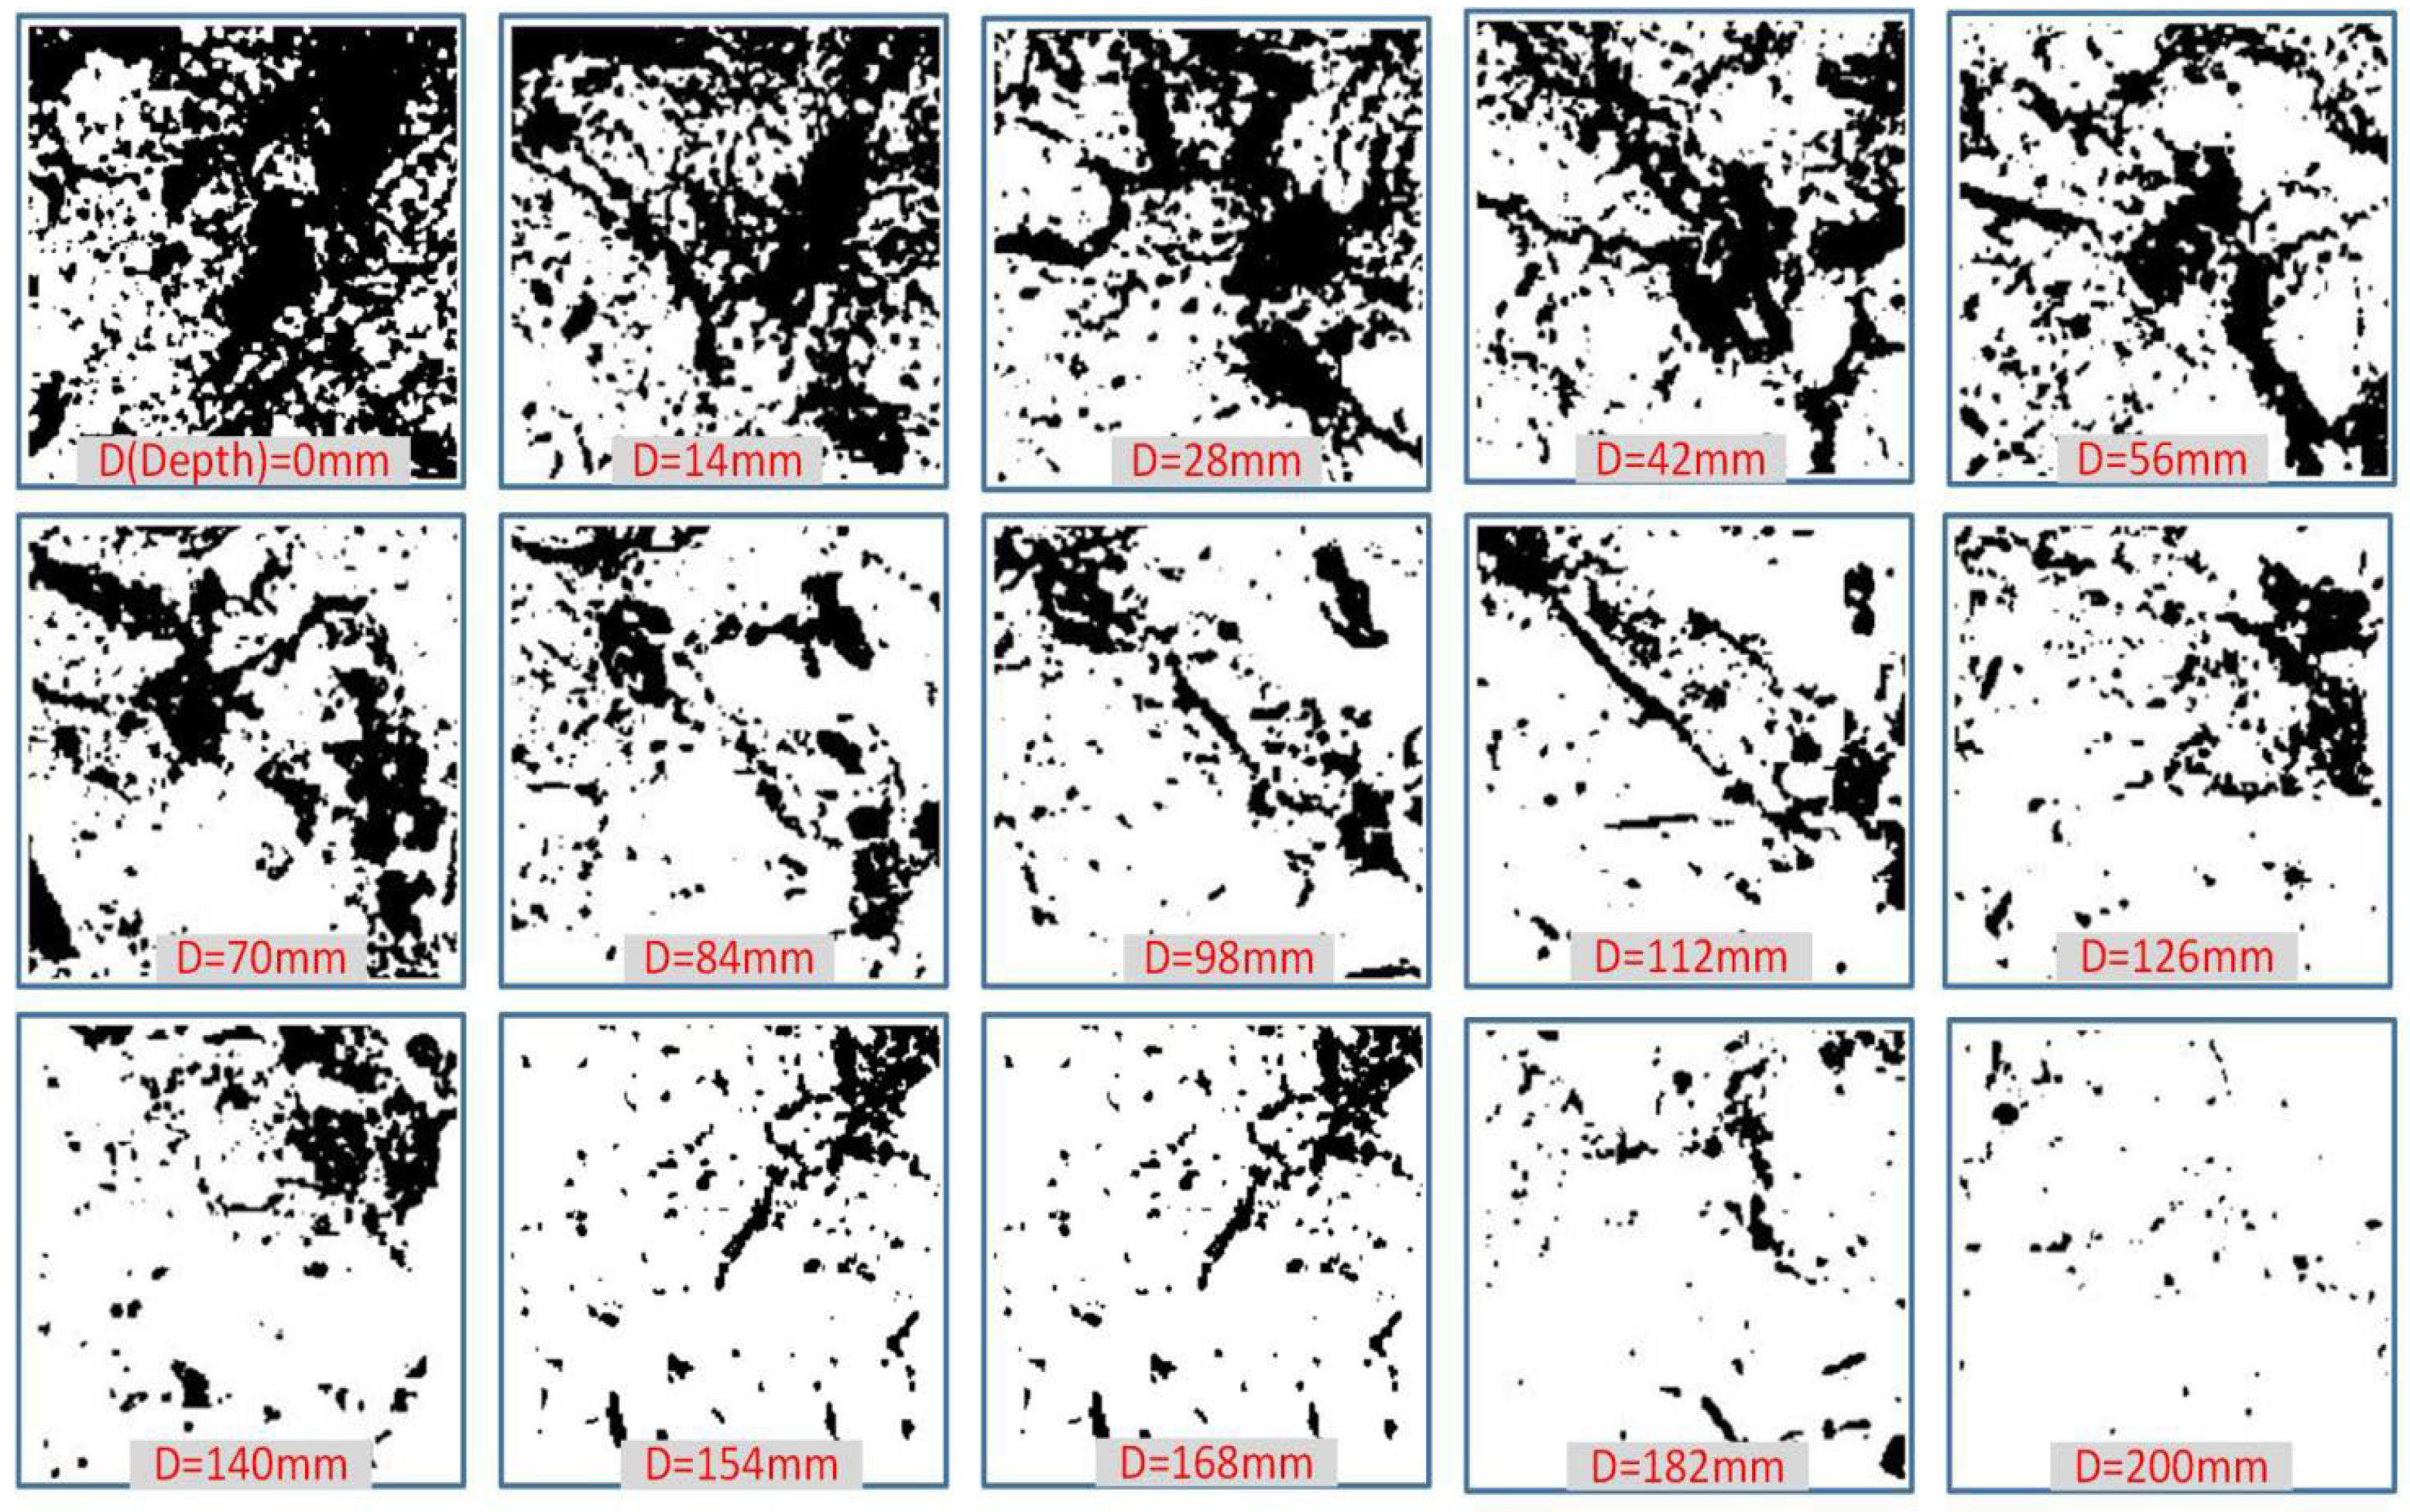
2.3. Image Processing

After obtaining CT data of the soil columns, extracting the pores from the slices is crucial and involves several key processing steps. Typically, image processing methods such as image reconstruction, enhancement, region segmentation, and feature extraction are employed.
CT data consists of multiple slice images. Image reconstruction algorithms are used to synthesize these slice images into 3D image. Initially, these algorithms enhance the CT images through a series of processes, including noise reduction, contrast adjustment, and edge enhancement. Subsequently, the regions of interest are segmented using a combination of thresholding and morphological operations [35]. The CT value of a substance represents its density, with different materials exhibiting different CT values. By utilizing the CT values of substances within the soil columns, it becomes possible to distinguish between particulate media and pore structures on the slices. This approach enables precise separation of materials based on their CT values. Based on detailed analysis of each slice at different depths within the soil columns from the original files, the CT values of the substances within the columns range from −1024 to 1837.6 Hounsfield Units (HU). Upon thorough comparison and verification of CT slices, the CT values for soil pores range from-120-25(HU). It is important to note that the presence of abundant root systems significantly influences the formation and evolution of large pores within the columns. Additionally, the decay of roots forms continuous channels that play a crucial role in rapid water infiltration in slope soils [36,37,38]. For the purpose of this study, the root systems were not separated from the analysis; instead, they were classified together with the regions occupied by air as part of the pores. The maximum scanning dimensions of the soil sample are 26 cm × 29 cm × 33 cm (Figure 4a). Due to the manual cutting of samples during collection, there are unavoidable defects at the corners, resulting in an irregular shape. To eliminate the impact of these corner defects on the processing results, a specific outer region of the soil was removed, and a cubic soil column measuring 15 cm × 15 cm × 20 cm was selected as the object of study. Different colors were assigned to materials based on their CT value ranges, and the images were imported into Adobe Photoshop for cropping to obtain the 15 cm × 15 cm area image. In this representation, red and black indicate the pores, while green represents the soil (Figure 4b). Threshold processing was then applied to convert the image into a binary image containing only black and white colors (Figure 4c). In this binary image, the soil matrix and gravel are displayed in white, while the large pores are shown in black. During the threshold processing of the images, the contrast of the CT images was enhanced using Adobe Photoshop by increasing the contrast settings to prevent the omission of smaller pore sizes during the binarization process. Finally, the resulting binary images were imported into ImageJ, where the particle analysis feature was used to obtain the number of pores on each CT slice, the corresponding area of each pore, and various information, including the roundness of each pore (Figure 4d).
In this scanning, the distance between slices was 0.7 mm, resulting in a total of 290 CT slices for the soil column. For convenience in calculations and research, one slice was selected every five slices, leading to a total spacing of 3.5 mm between selected slices. This included the top and bottom surfaces of the study area (at depths of 0 mm, 3.5 mm, 7 mm, …, 196 mm, and 200 mm), resulting in a total of 58 slices for processing and analysis. Figure 5 presents 20 typical binary images of slices used in this study. From the images, it is visually apparent that the trend of pore area and pore quantity changes with depth, showing a decrease in both the number and area of pores as depth increases. Consequently, the vertical and horizontal pathways of soil pores also decrease. Further quantitative characterization requires statistical analysis of the pore’s feature parameters to gain a deeper understanding of these changes.

2.4. Computational Method

After selecting the cropped region of interest (15 cm × 15 cm), the images were binarized and imported into ImageJ for analysis. Each slice’s pore parameters, including quantity, area, and perimeter, were statistically analyzed. These parameters can be directly obtained using ImageJ.
While the number, area, and perimeter of pores reflect their 2D morphological status, the shape and roundness of the pores can also be quantitatively evaluated using the pore roundness (C) metric. The calculation formula for the roundness is as follows [39]:
C = 4πA/P2,
where A is the pore area; P is the pore perimeter; C is the roundness rate of the pore, which is between 0 and 1. The larger the value of C, the more circular the pore shape, with C = 1 indicating a perfectly circular pore. As C approaches 0, the pore shape becomes increasingly irregular. This roundness metric offers insight into the geometric characteristics of the pores within the soil structure.
Apart from the aforementioned parameters, the intricate structures and characteristics of pores can be elucidated through fractal theory. At the heart of fractal theory lies the concept of “fractal,” which pertains to geometric shapes displaying self-similarity. By examining portions of these entities, one can observe structures mirroring the entire object. Fractal theory posits that many natural objects possess fractal surfaces in space, offering a theoretical basis for employing fractal models in image analysis. Fractal theory has found extensive application in the quantitative analysis of soil pores as well as in studying the morphology and fracture of construction materials [40]. The box-counting dimension, in particular, has been applied in various fields, such as in the analysis of Ecological distribution patterns [41] and in the quantitative study of large soil pores [42], and has yielded positive results. The heterogeneity, complexity, and irregularity of pores can be characterized using the fractal dimension from fractal theory. In this study, the fractal dimension is determined based on the distribution of the original area of large pores [43]. The determination of this value can be achieved using the box-counting method with the calculation principle outlined as follows [44]: Let (A) be any non-empty subset of Rn. For any (r > 0), let (Nr(A)) denote the minimum number of cubes (or boxes) with side length (r) required to cover (A). If there exists a number (D) such that as (r→0) we calculate the following:
Nr(A)∝1/rd.
Therefore, (D) is the fractal box dimension of (A). The specific approach involves processing each CT slice image into a binary image, followed by the application of square grids of varying sizes (with side lengths r) to cover the image. The number of pixels corresponding to large pores within the grid is counted as Nr. By selecting different sizes r, a range of Nr can be obtained. Next, using the least squares method, the natural logarithm of lnr and lnNr is fitted to a straight line. The negative of the slope K of this line gives the fractal dimension D of the large pores, expressed mathematically as: D = −K. This method effectively quantifies the complexity of the pore structure by analyzing its fractal characteristics.

3. Results and Discussion

3.1. Parameter Quantization

The number and size of soil pores are critical indicators in describing the structure of soil porosity. The count and distribution significantly influence the soil’s permeability to air and water, as well as its water retention capacity. Figure 6 shows the changes in the pore count at different depths. The number of pores ranges from 77 to 216. As depth increases, the count first rises from 137 at the top to a maximum of 216 and then falls to 139 at the bottom. The increase in the number of pores from the surface upwards may be due to the predominance of larger pores at the surface; though fewer in number, these pores have a larger diameter. The variation in pore area with depth is illustrated in Figure 6. As seen in Figure 7, the total percentage of pore area (or total pore area) ranges from 2.02% (1084 mm2) to 52.25% (24,702 mm2). With increasing depth, the percentage of area decreases gradually from a maximum of 52.25% at the top to a minimum of just 2.02% at the bottom, showing a clear linear relationship with depth.
The observed changes in pore number and area are mainly due to significant biological activity in surface soils, which includes plant root growth and soil organism movement, forming additional pores. These pores are more concentrated and larger, enhancing water and gas transport efficiency and supporting plant root growth. Surface soil has larger pores despite being fewer in number. As depth increases, biological activity decreases, and physical/chemical factors become more prominent, resulting in smaller, less numerous, and more scattered pores. This arrangement affects water infiltration, causing slower movement through deeper layers of Mountainous Red Earth.
In addition to the number and total area of pores, the scale of individual pores also significantly affects soil water and gas movement. Currently, there is not a clear, unified standard for classifying the scale of soil pores. Some researchers, after conducting CT scanning experiments on undisturbed soil columns containing various large pores and filled soil columns with known large pore diameters, generally agreed that pores with equivalent diameters larger than 0.5 mm should all be classified as large pores [45].
In soil science, pores are classified into three types based on equivalent pore diameter: inactive pores (≤0.002 mm, suction > 1500 mb), capillary pores (0.002 mm–0.02 mm, suction between 1500 mb and 150 mb), and aeration pores (≥0.02 mm, suction < 150 mb) [46]. Due to the resolution limits of the CT equipment in this study, the smallest discernible pores were 0.64 mm × 0.64 mm in 2D images. Given the lack of standardized pore classification, pores were categorized by pixel size into micro-pores (1 pixel), small pores (2–20 pixels), medium pores (21–50 pixels), and large pores (>50 pixels). Analysis of pore distribution from slices enabled calculations of pore area percentages and quantities by pore size (Figure 8, Figure 9 and Figure 10), with seven sample depths taken at equidistant intervals from 24.5 mm to 192.5 mm.
Within the depth of 1 mm to 165.5 mm, the distribution trends of the four types of pores are rather stable. Small pores generally account for the largest proportion, followed by medium and large pores, while micro-pores cover the smallest area. However, overall, the area proportion of large pores is higher than that of both micro-pores and medium pores. This is indicative of the broad distribution of large pores in the surface soil layer, largely due to active biological activity. Within the depth range of 65.5 mm to 200 mm, the proportional distribution of the four types of pores displays a slight shift compared to the patterns observed previously. This is consistent with the pore distribution derived from the CT value extraction (Figure 8). As depth increases, the amount of biological matter decreases along with the distribution of root systems. This results in a reduction of structural pores associated with biological activity. Sudden changes in pore area observed at some locations can be attributed to the decay of roots or the slanting intrusion and extension of roots from the exterior of the soil column under study.
Observing the number of pores within each scale of pore (Figure 9), at various depths, the quantity of each type of pore aligns with their area proportions. Small pores are most numerous, followed by medium and large pores, while micro-pores are the least. With increasing depth, the total number of pores first increases and then gradually decreases. Although the topsoil layer contains a higher number of large pores, their overall area is larger despite the lesser quantity. Beyond a depth of 80.5 mm, there is a linear decrease in pore number, reaching its minimum at the bottom. In this process, within the surface layer of 80.5 mm, the number of large and medium pores is relatively higher compared to other layers, with numerous small pores as well. The distribution of medium and large pores is most abundant at a depth of 80.5 mm, which could be related to the greater root distribution within this range. In summary, litterfall on the forest floor provides a form of shelter, particularly for the large pores that significantly contribute to water conduction in the surface soil layer. This protective layer serves as a barrier that also mitigates the direct erosive impact of raindrops on the soil surface, thereby facilitating soil erosion prevention. However, the vegetation in the research area is somewhat homogenous, predominantly comprising Dianthus caryophyllus and Pinus thunbergii. Given their relatively low biological activity, the resultant layer of litterfall is correspondingly thin. With underdeveloped soil strata and a thin humus layer, the protective effect of the litterfall on the pore structure is somewhat limited. In the event of rainfall, the impact of raindrops could lead to the degradation of the pore structure or induce splash erosion, potentially leading to pore blockages.
Roundness in soil can serve as an indicator for assessing soil texture and particle structure. Higher roundness typically signifies more homogeneous soil particles with more regular shapes. Such soil exhibits superior water permeability and aeration, and it can retain moisture and nutrients more effectively, thereby facilitating root system development and growth in slope vegetation. Considering the earlier discussion on the trends in pore quantity and area, we find that the roundness at the top of the soil column is lower compared to that near the bottom. This can be attributed to the number and diameter of pores distributed at these depths. The top area contains a larger proportion of medium and large pores, which are less spherical, resulting in lower roundness. However, as depth increases, the pores gradually transition to smaller scales, with both their number and area decreasing. As a result, their shapes become more spherical, leading to a higher roundness.
The results derived from the pore characterization via CT scanning suggest that although the surface layer’s large pores are larger than those at other depths, they only account for a fraction of 15.9%, with this proportion decreasing with depth. The pore structure, particularly the large pores, is insufficient to absorb and facilitate the timely percolation of surface runoff generated by rain. Additionally, the erosion prevention capacity of the shallow layer of litterfall is relatively low. Prolonged surface runoff could instigate extensive slope erosion, underscoring the need for location-specific vegetation restoration and afforestation in mitigating soil and water losses in the mountainous red soil region. Such strategies should aim to cultivate a complex, stable forest ecosystem, thereby establishing a multi-tiered protection system for the mountainous red soil, both horizontally and vertically. The pore roundness of the soil column with depth, as depicted in Figure 10, exhibits minimum and maximum values of 0.806 (at 3.5 mm) and 0.903 (at 200 mm), respectively. The roundness of the soil sample oscillates between 0.8 and 0.9, showing an overall increase. Within the depth range of 1 mm to 150 mm, there is no substantial fluctuation, with the roundness value stabilizing at around 0.85. Beyond 150 mm, there is a slight increase towards the bottom.

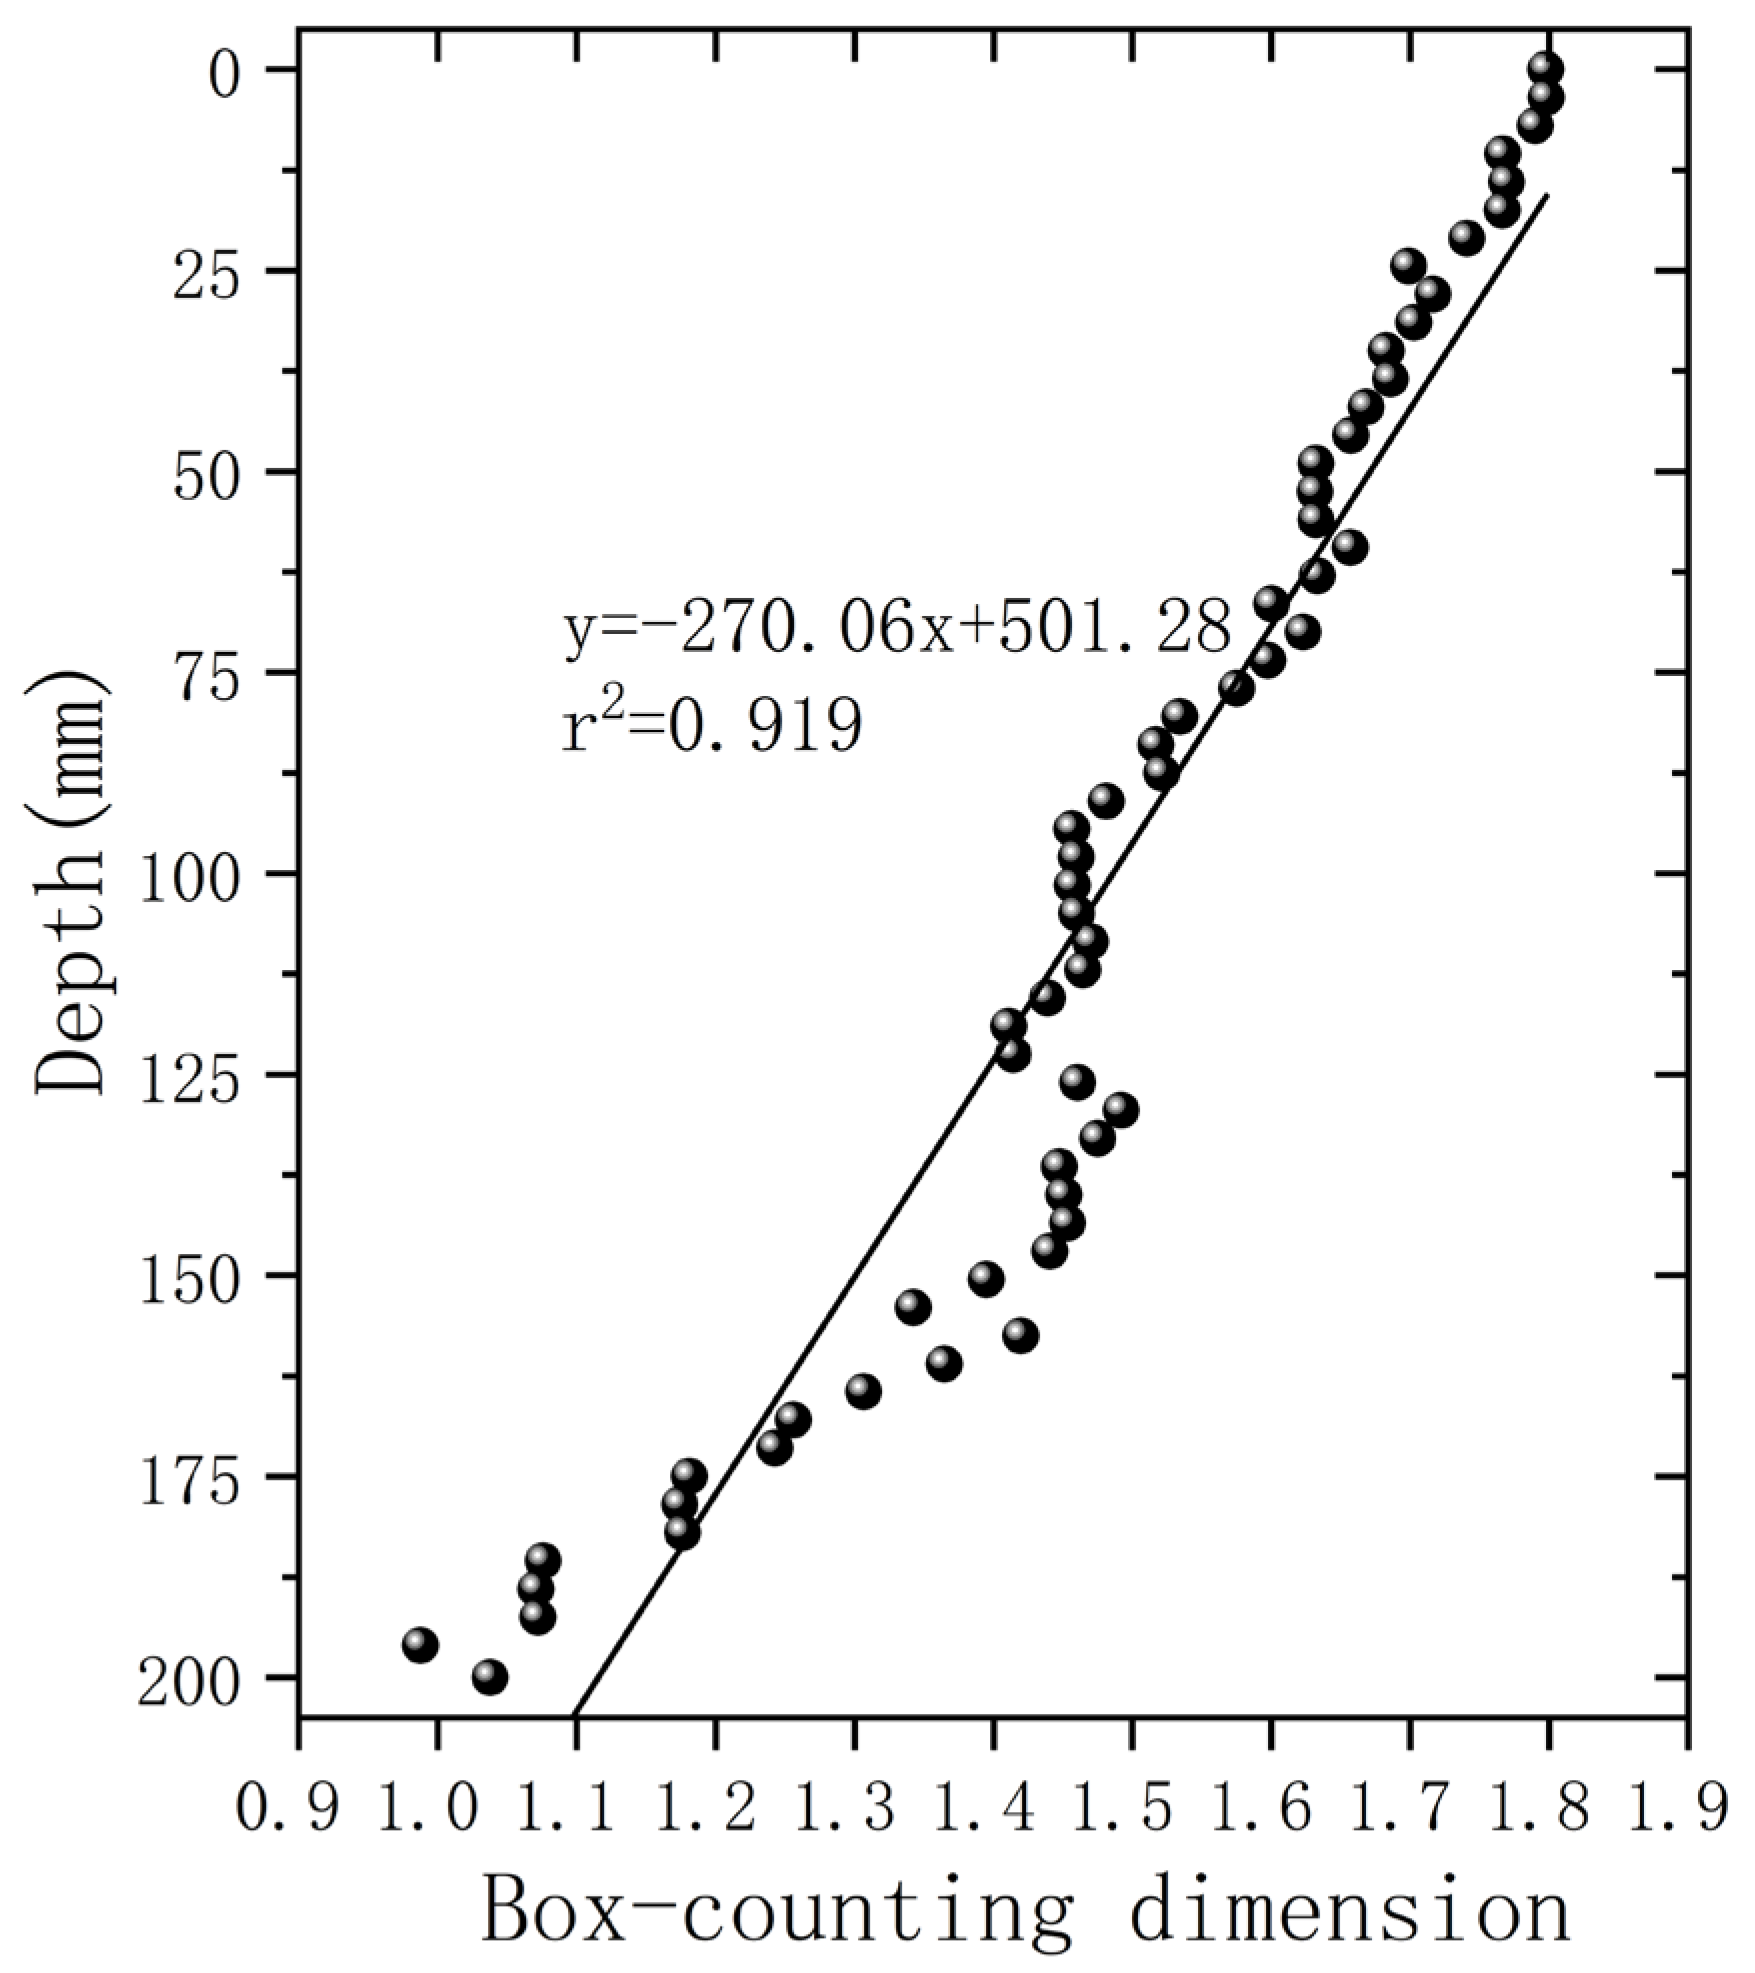
3.2. Fractal Characteristics of Pores

Key indicators such as pore area, proportion, number, and roundness provide a quantitative framework for analyzing the pore structure of mountainous red soil. The spatial and planimetric variations show significant heterogeneity and complexity, which can be effectively described using fractal analysis. By applying the box-counting method and linear regression between lnr and lnNr, the fractal box dimension (D) is calculated, reflecting the distribution’s complexity. A higher box dimension indicates more complexity, while a lower dimension suggests simplicity. The study, using ImageJ software, confirms the self-similarity in pore distribution with a high determination coefficient (R2 > 0.99), supporting the use of fractal theory to describe the soil’s pore characteristics, as shown in Figure 11.
Through computational analyses, we can discern the variation trends of box dimensions with respect to depth as exhibited in Figure 12. The results underscore the efficacy of the box dimension in encapsulating the individual conditions and the evolutionary trajectories of each soil slice. The soil column’s upper segment exhibits a relatively larger box dimension, peaking at a value of 1.7980 at the surface level. With increased depth, the box dimension follows a linear declining trend, reaching its nadir at a value of 0.9878 at the base.
Quantitative pore analysis shows that surface soil, affected by plant roots and fauna, has a higher pore quantity, area, and ratio, with most pores being small. The complexity of the surface soil’s pore structure, driven by these small pores, leads to a fractal pattern. As depth increases, pore formation factors weaken, reducing pore quantity and complexity, which lowers the fractal box dimension. While the box dimension effectively describes pore characteristics, pore roundness remains consistent with depth and is not a reliable indicator of pore complexity.

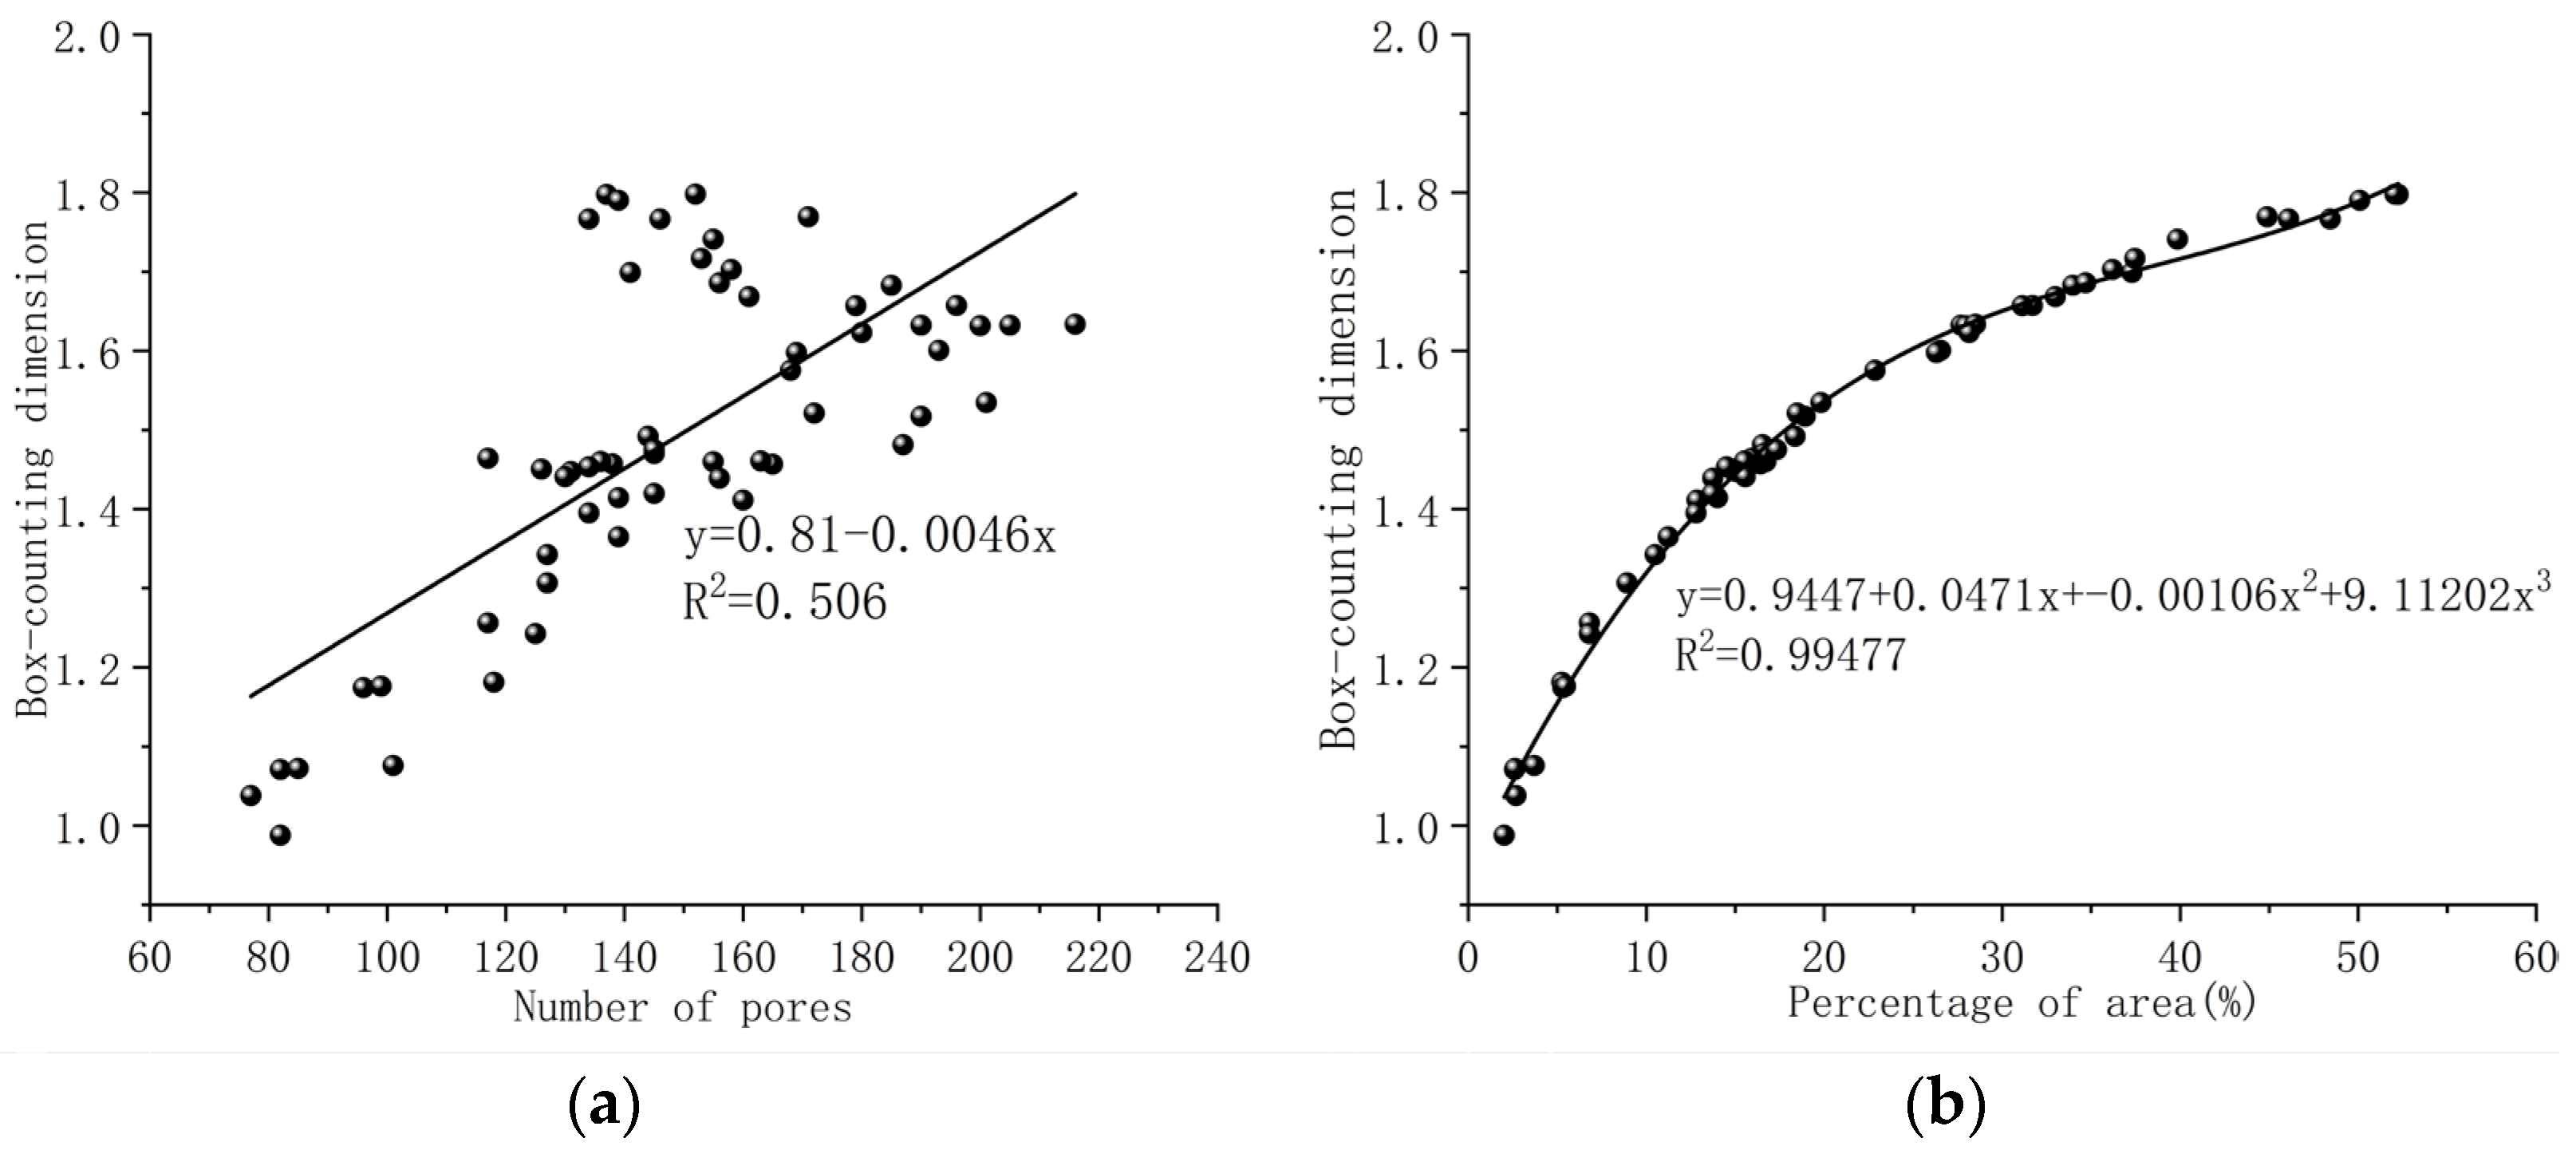
3.3. The Relationship between the Parameters of Pores

The parameters of pore quantity, area, roundness, and fractal dimension can provide a multi-faceted, quantitative examination of pore characteristics, with each parameter exerting some degree of influence over the others. The size of the pore area (percentage of total area) does not significantly affect the roundness (Figure 13). An analysis of individual pores on the CT slices also shows that the size of a pore’s area has no bearing on its roundness; it is only determined by the pore’s equivalent diameter. However, the number of pores does impact roundness; as the quantity of pores increases, the overall roundness tends to decrease gradually. This is because smaller pores are more likely to approximate a circular shape, resulting in a higher roundness value. When the number of pores is high, such as in the topsoil layer, there are more large- and medium-scale pores, leading to a smaller roundness value. As depth gradually increases, the number of large pores decreases, the quantity of medium- and small-scale pores increases, and the overall shape is more circular, resulting in a larger roundness value. There is a clear correlation between the number of pores, the percentage of pore area, and the box dimension, with all displaying a clear positive relationship (Figure 14). This relationship is most evident in the way the pore area percentage relates linearly to the box dimension. The more widely the pores are distributed on the CT slices and the larger their area, the stronger the heterogeneity, complexity, and irregularity will be. This makes it more conducive to water infiltration under rainy conditions. Therefore, in the topsoil layer, where the distribution of pores is extensive, there is also strong spatial heterogeneity of the pores, which is more favorable for the absorption and infiltration of water. Finally, a correlation analysis was conducted between the D value and the parameters of pore count, roundness, and pore area percentage using the Pearson correlation coefficient; the results are shown in Table 1. It can be seen that the correlation coefficient values between the box dimension D and the number of pores, roundness, and pore area percentage all show significance. Specifically, the correlation coefficient between the D value and the number of pores is 0.711, indicating a significant positive correlation between the D value and the number of pores. The correlation coefficient between the D value and the pore area percentage is 0.934, indicating a significant positive correlation between the D value, the number of pores, and the pore area percentage. As depth increases and the number and area of soil pores decrease, the pore structure gradually simplifies, consistent with the results shown in Figure 6 and Figure 7. The correlation coefficient between the D value and roundness is −0.545, indicating a significant negative correlation between the D value and roundness. This suggests that a higher degree of roundness, and thus a larger roundness value, is associated with lower complexity and heterogeneity in the pore structure.

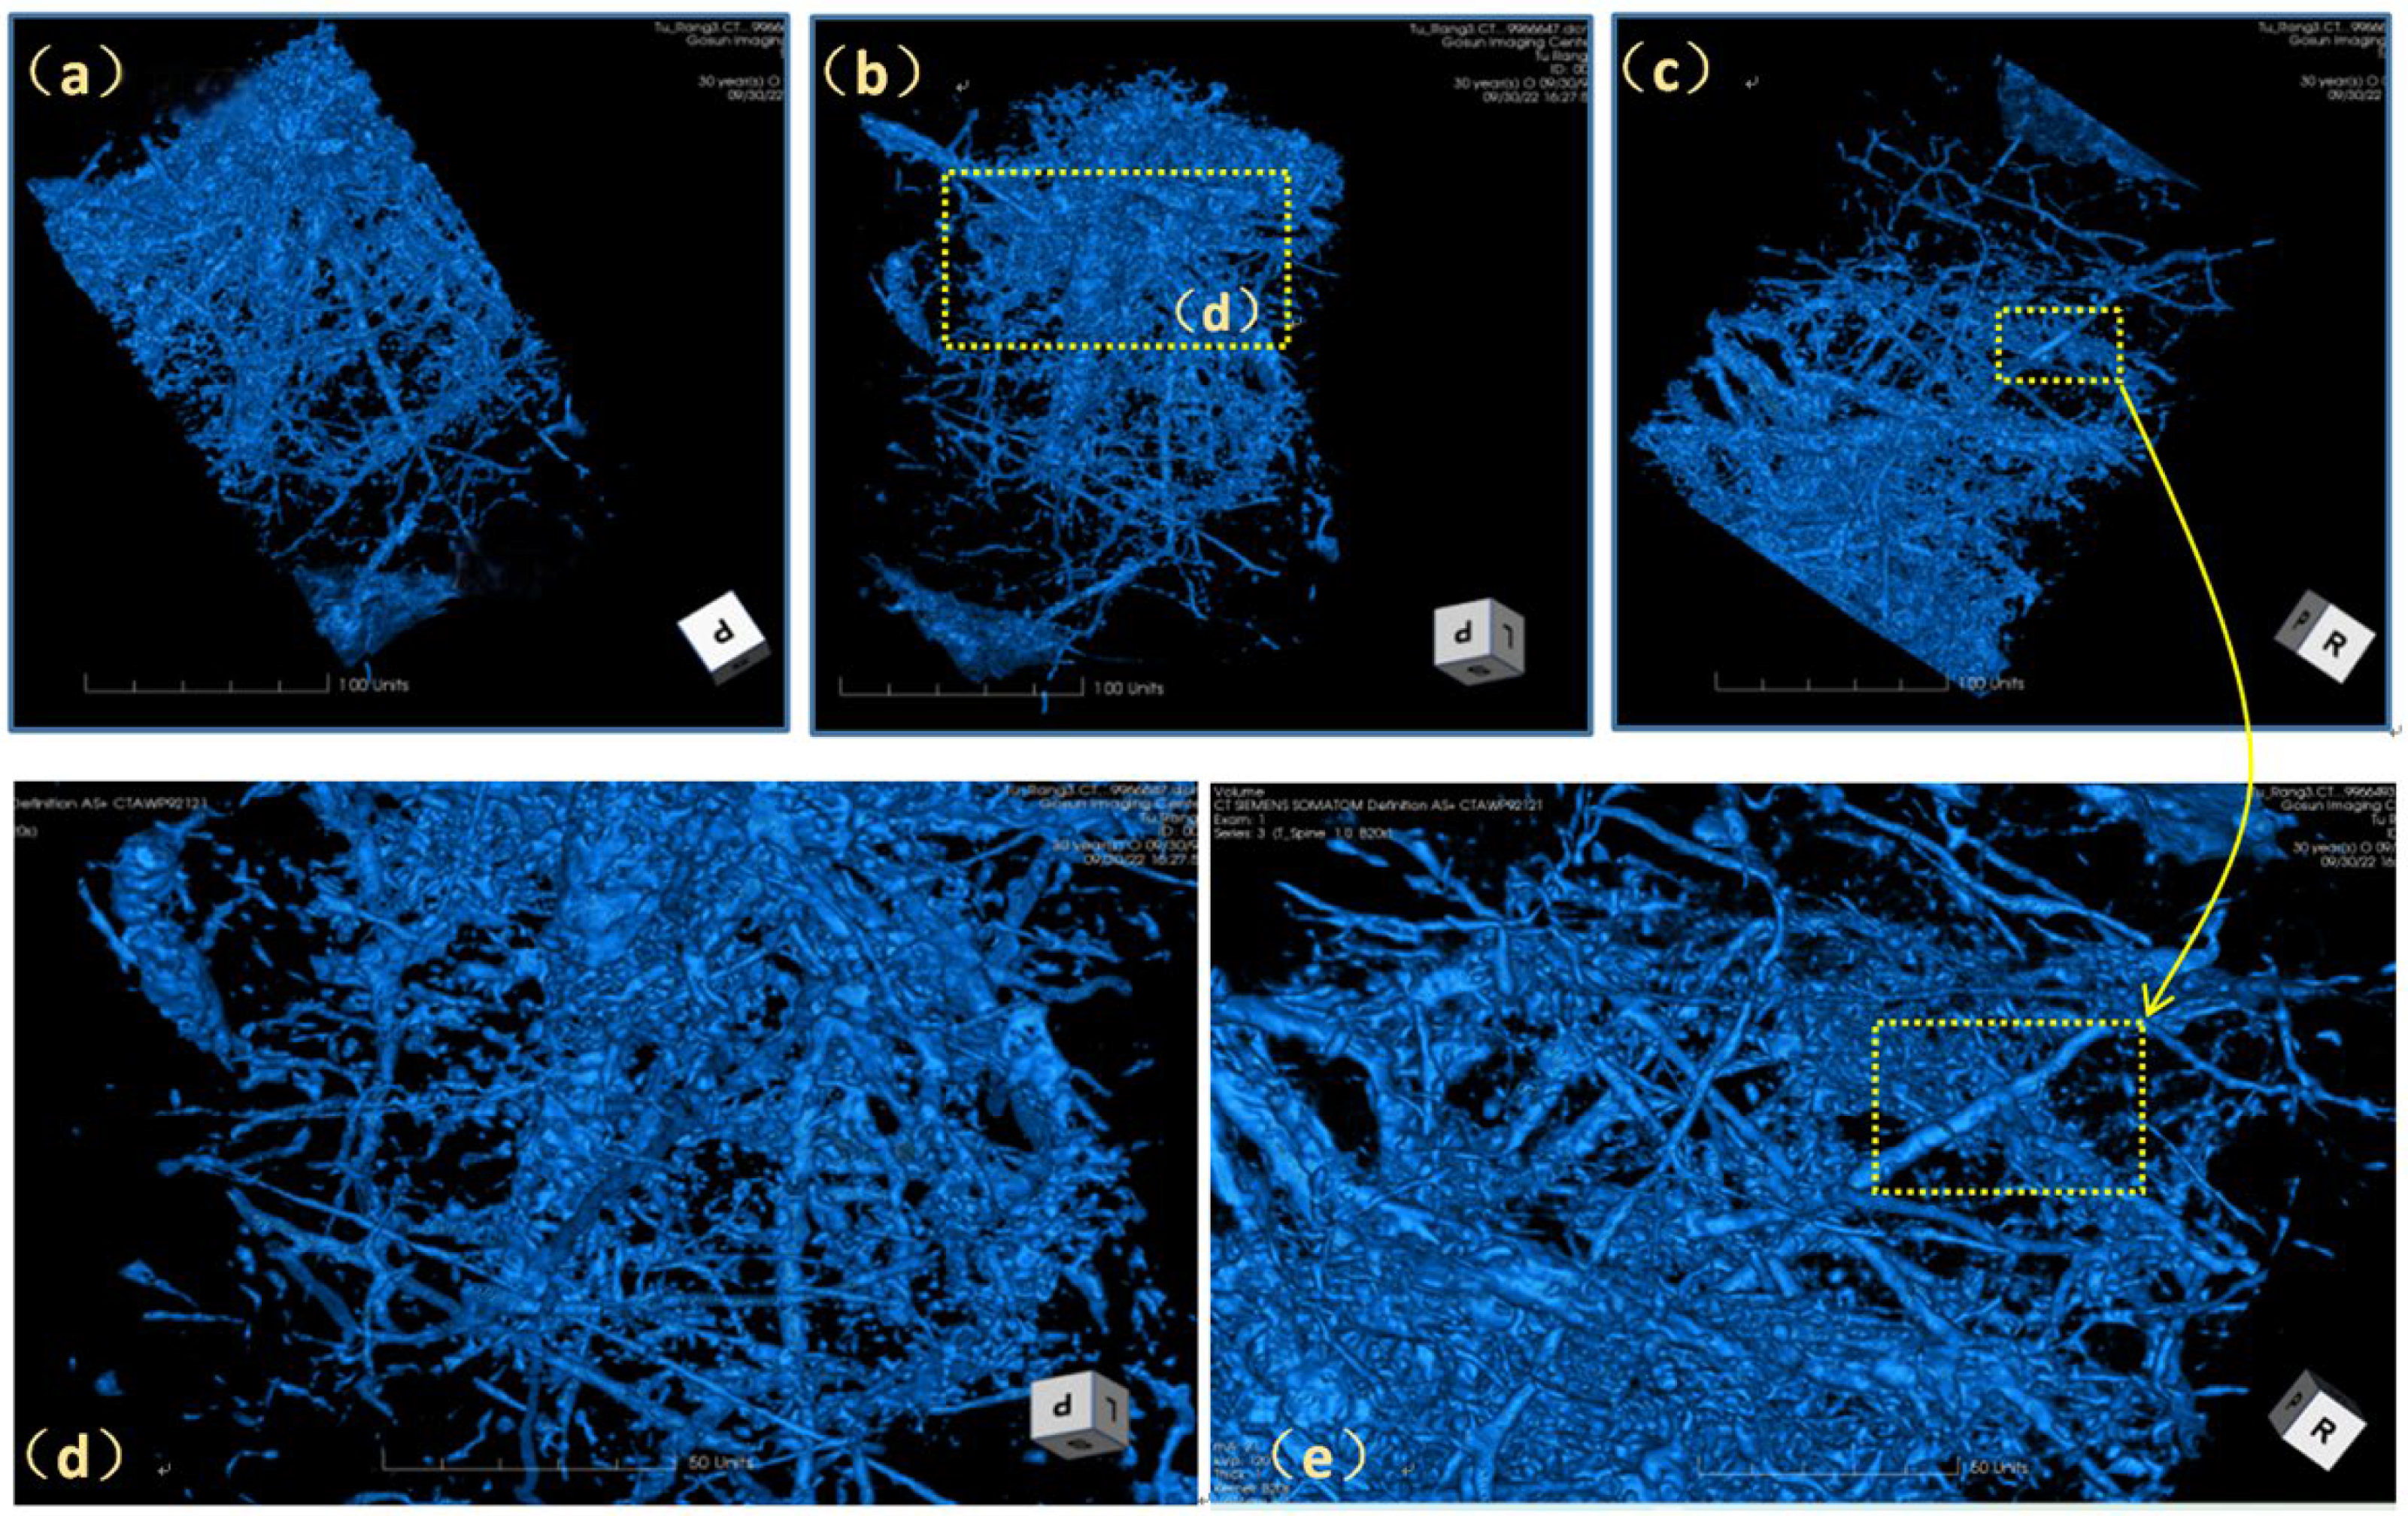
3.4. Three-Dimensional Morphology of Pores

Avizo software (v2022.2) is widely used for 3D visualization and reconstruction based on CT scan data. It effectively partitions components and quantifies geological properties like porosity and permeability, making it popular in geology. Figure 15 illustrates the 3D reconstruction of Mountainous Red Earth, involving stages such as image preprocessing, pore separation, and rendering. CT slice data are superimposed to create a grayscale 3D image (Figure 15a), with soil boundaries marked (Figure 15b). By extracting and rendering the pores (Figure 15c,d), their spatial distribution, connectivity, and curvature are clearly represented.
The 3D pore structures were rendered, revealing both overall and localized details, as shown in Figure 16. Most pores are concentrated in the upper part of the soil column with an intermingled and connected distribution, suggesting the presence of transverse and longitudinal connective channels. Isolated pores are relatively few. These well-connected pores, formed by surface biomass and organic-inorganic colloid aggregation, facilitate water storage and infiltration. The number of pores decreases vertically from top to bottom, with noticeable differences between the surfaces, indicating dynamic changes. This structure allows for rapid surface water accumulation, potentially leading to supersaturation, erosion, and soil loss in slope areas.
Based on the results of CT scanning and utilizing 3D visualization technology, the 3D morphology of Mountain Red Earth was reconstructed from multiple perspectives. The results indicate that CT non-destructive testing technology can better qualitatively observe and quantitatively characterize the pore structure of Mountain Red Earth, rendering the macro- and microstructures of soil samples in three dimensions. This allows us to delve into the analysis of pore size, shape, distribution, and connectivity. Three-dimensional reconstruction not only provides a more intuitive viewpoint but also quantitatively describes the features of pore space. Building upon this, simulated experiments and computational models can be used to explore the impact of different pore structures on moisture, gases, and microbes in the structures formed by CT 3D reconstruction. Finally, through model building and parameter adjustment, the distribution and connectivity of pores under different soil types and humidity conditions can be simulated, thereby predicting soil responses to external rainfall. This method provides a powerful tool for studying soil moisture movement and gas exchange and for revealing the complexity and diversity of soil internal structures, thus providing a fundamental basis for studying the processes and mechanisms of soil and water loss in Mountain Red Earth.
Through analysis of the 2D and 3D reconstructed structures, it was observed that smaller pores were not extracted, leading to their oversight. Nonetheless, these small pores play a crucial role in influencing soil properties. Therefore, future research should focus on enhancing techniques to capture these minute, yet significant, structural features, thereby facilitating a more comprehensive understanding of soil complexity and functionality.

4. Conclusions

(1)
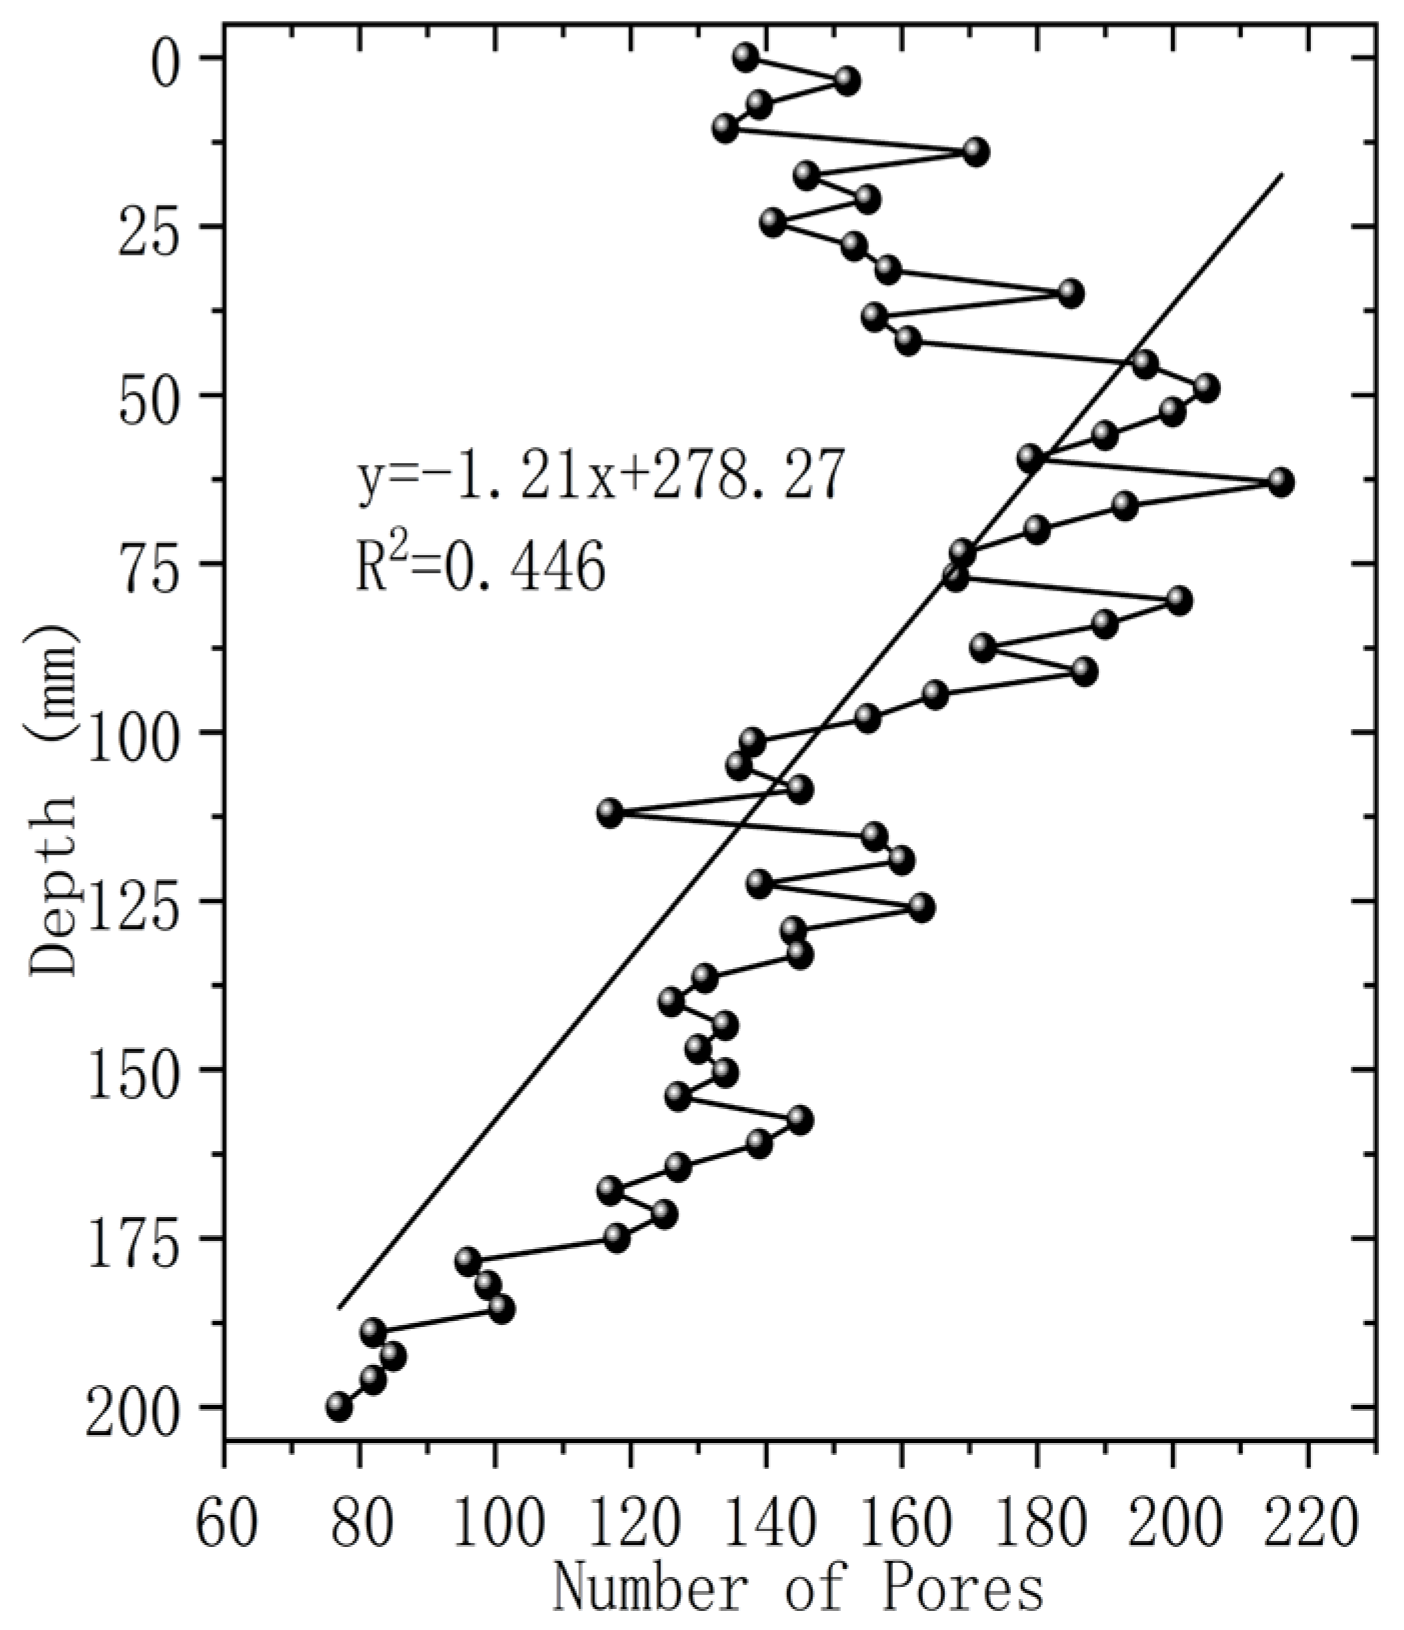
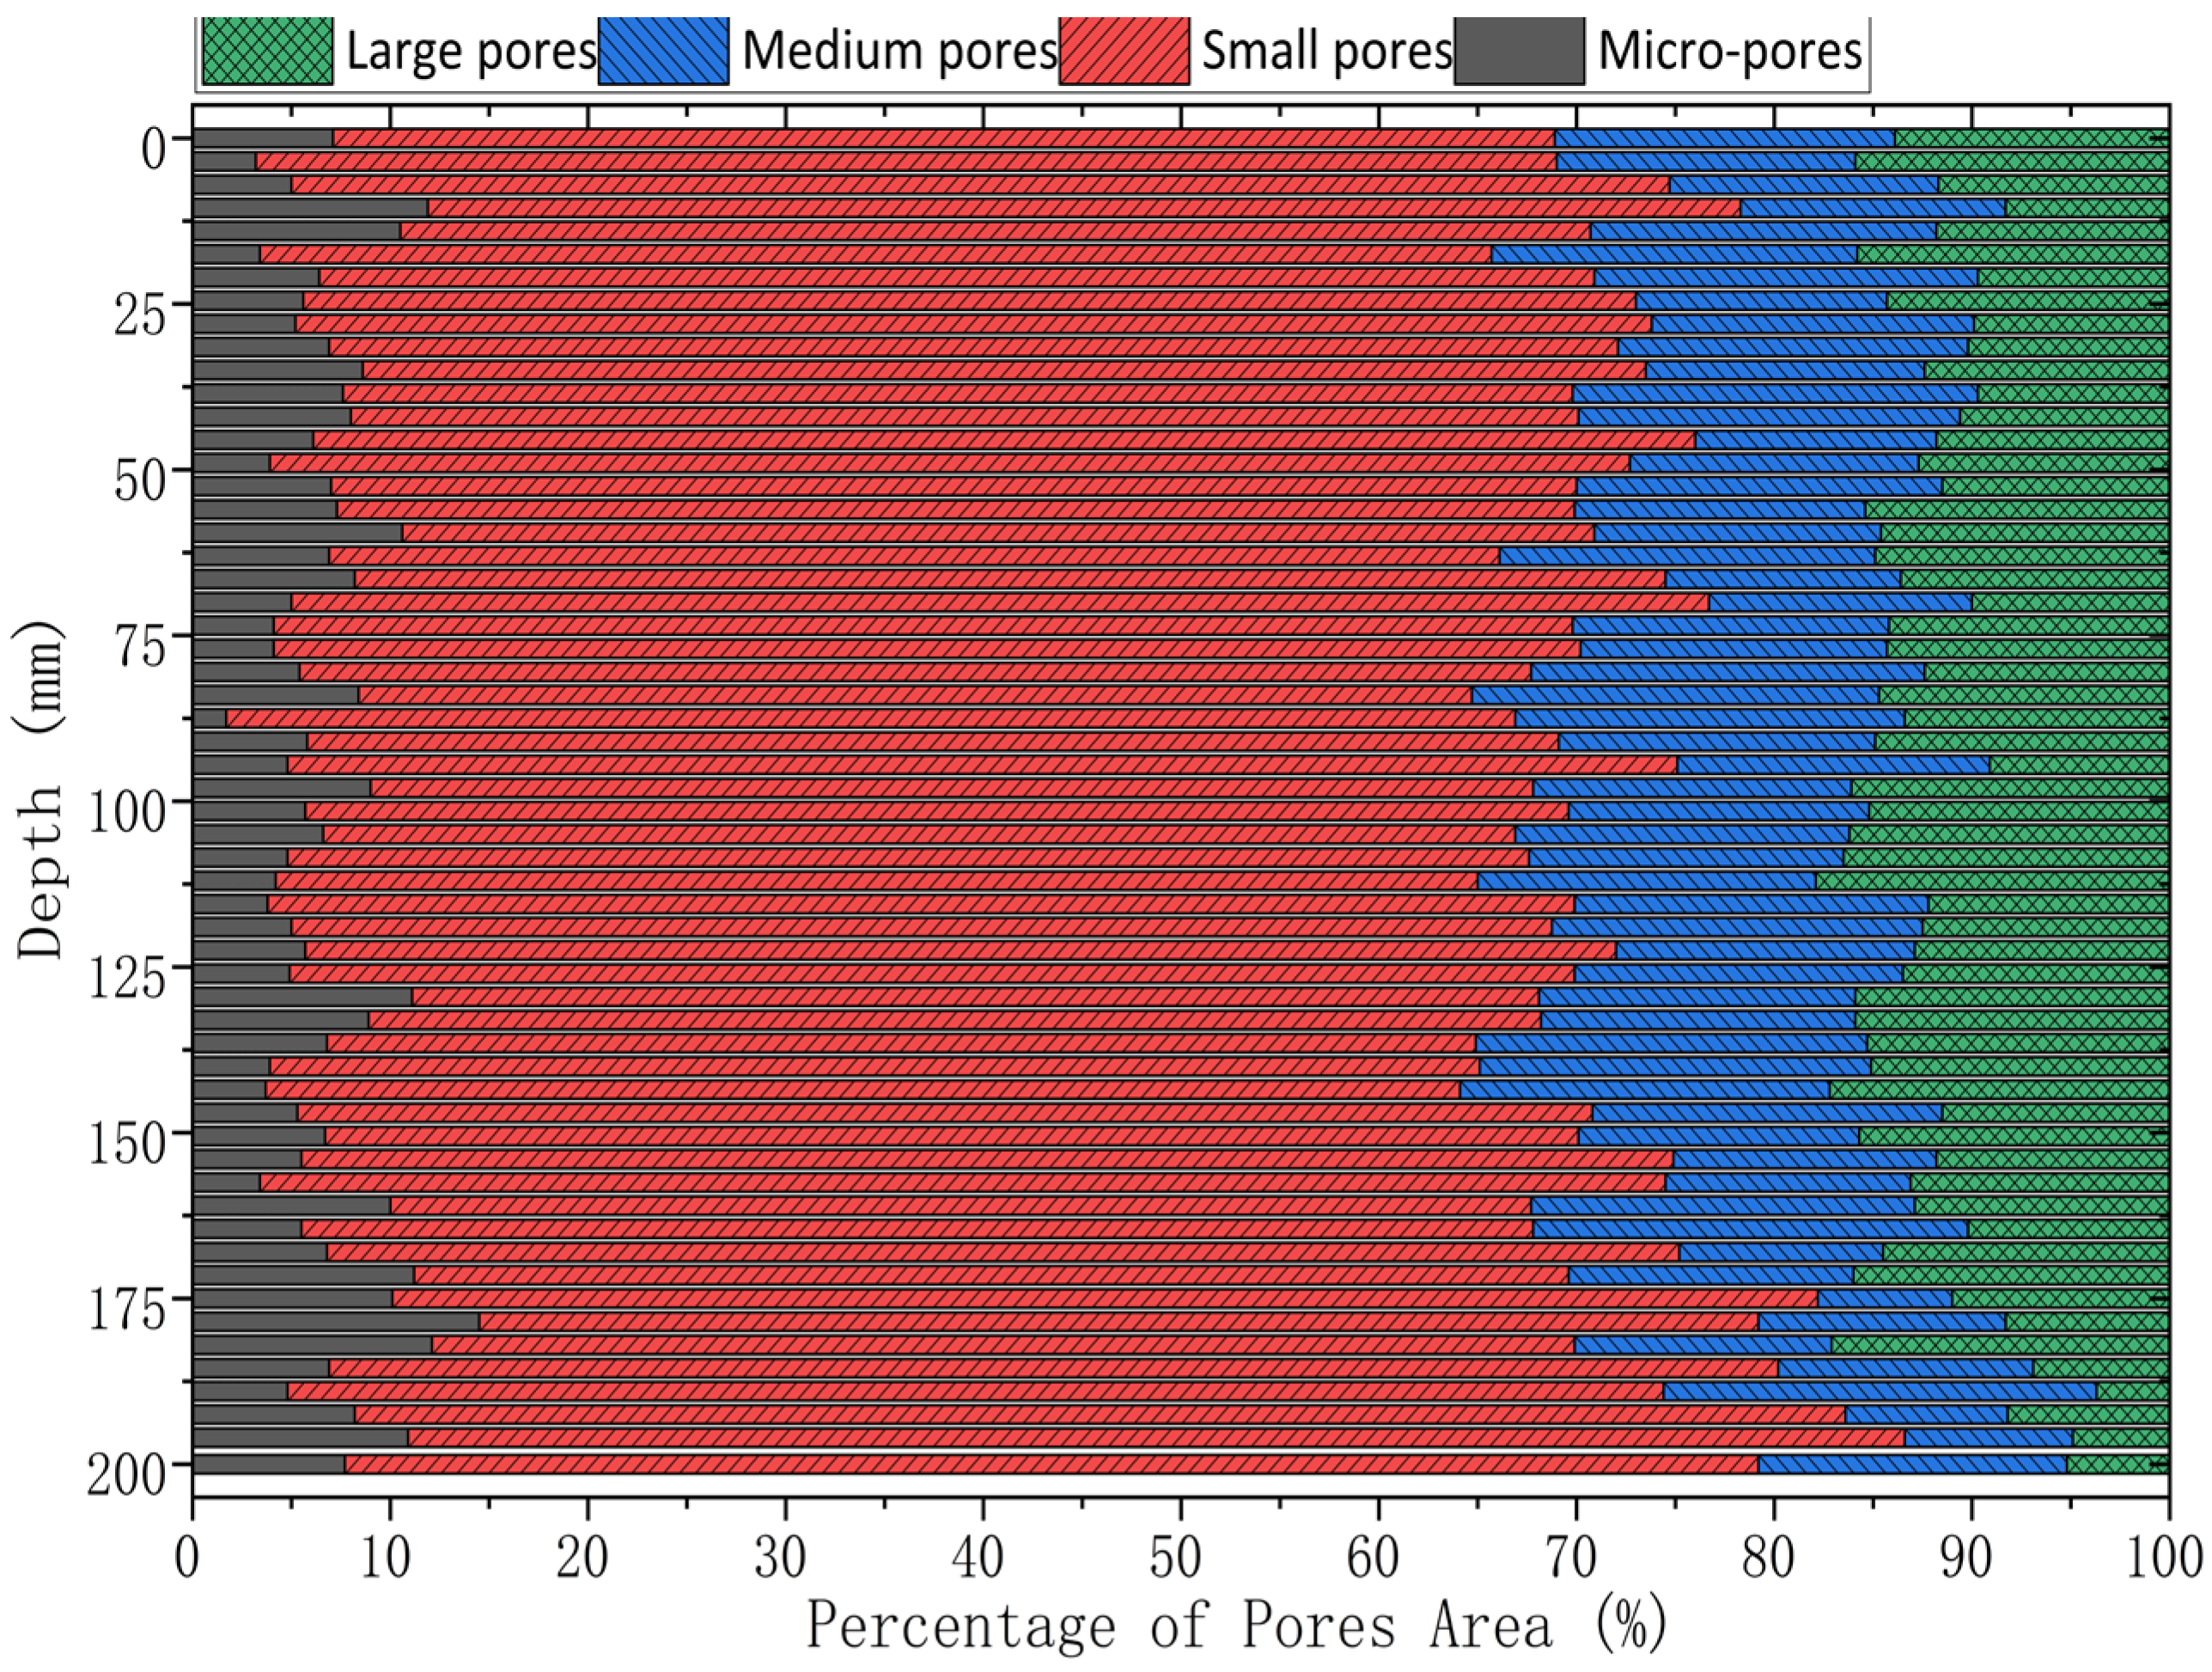
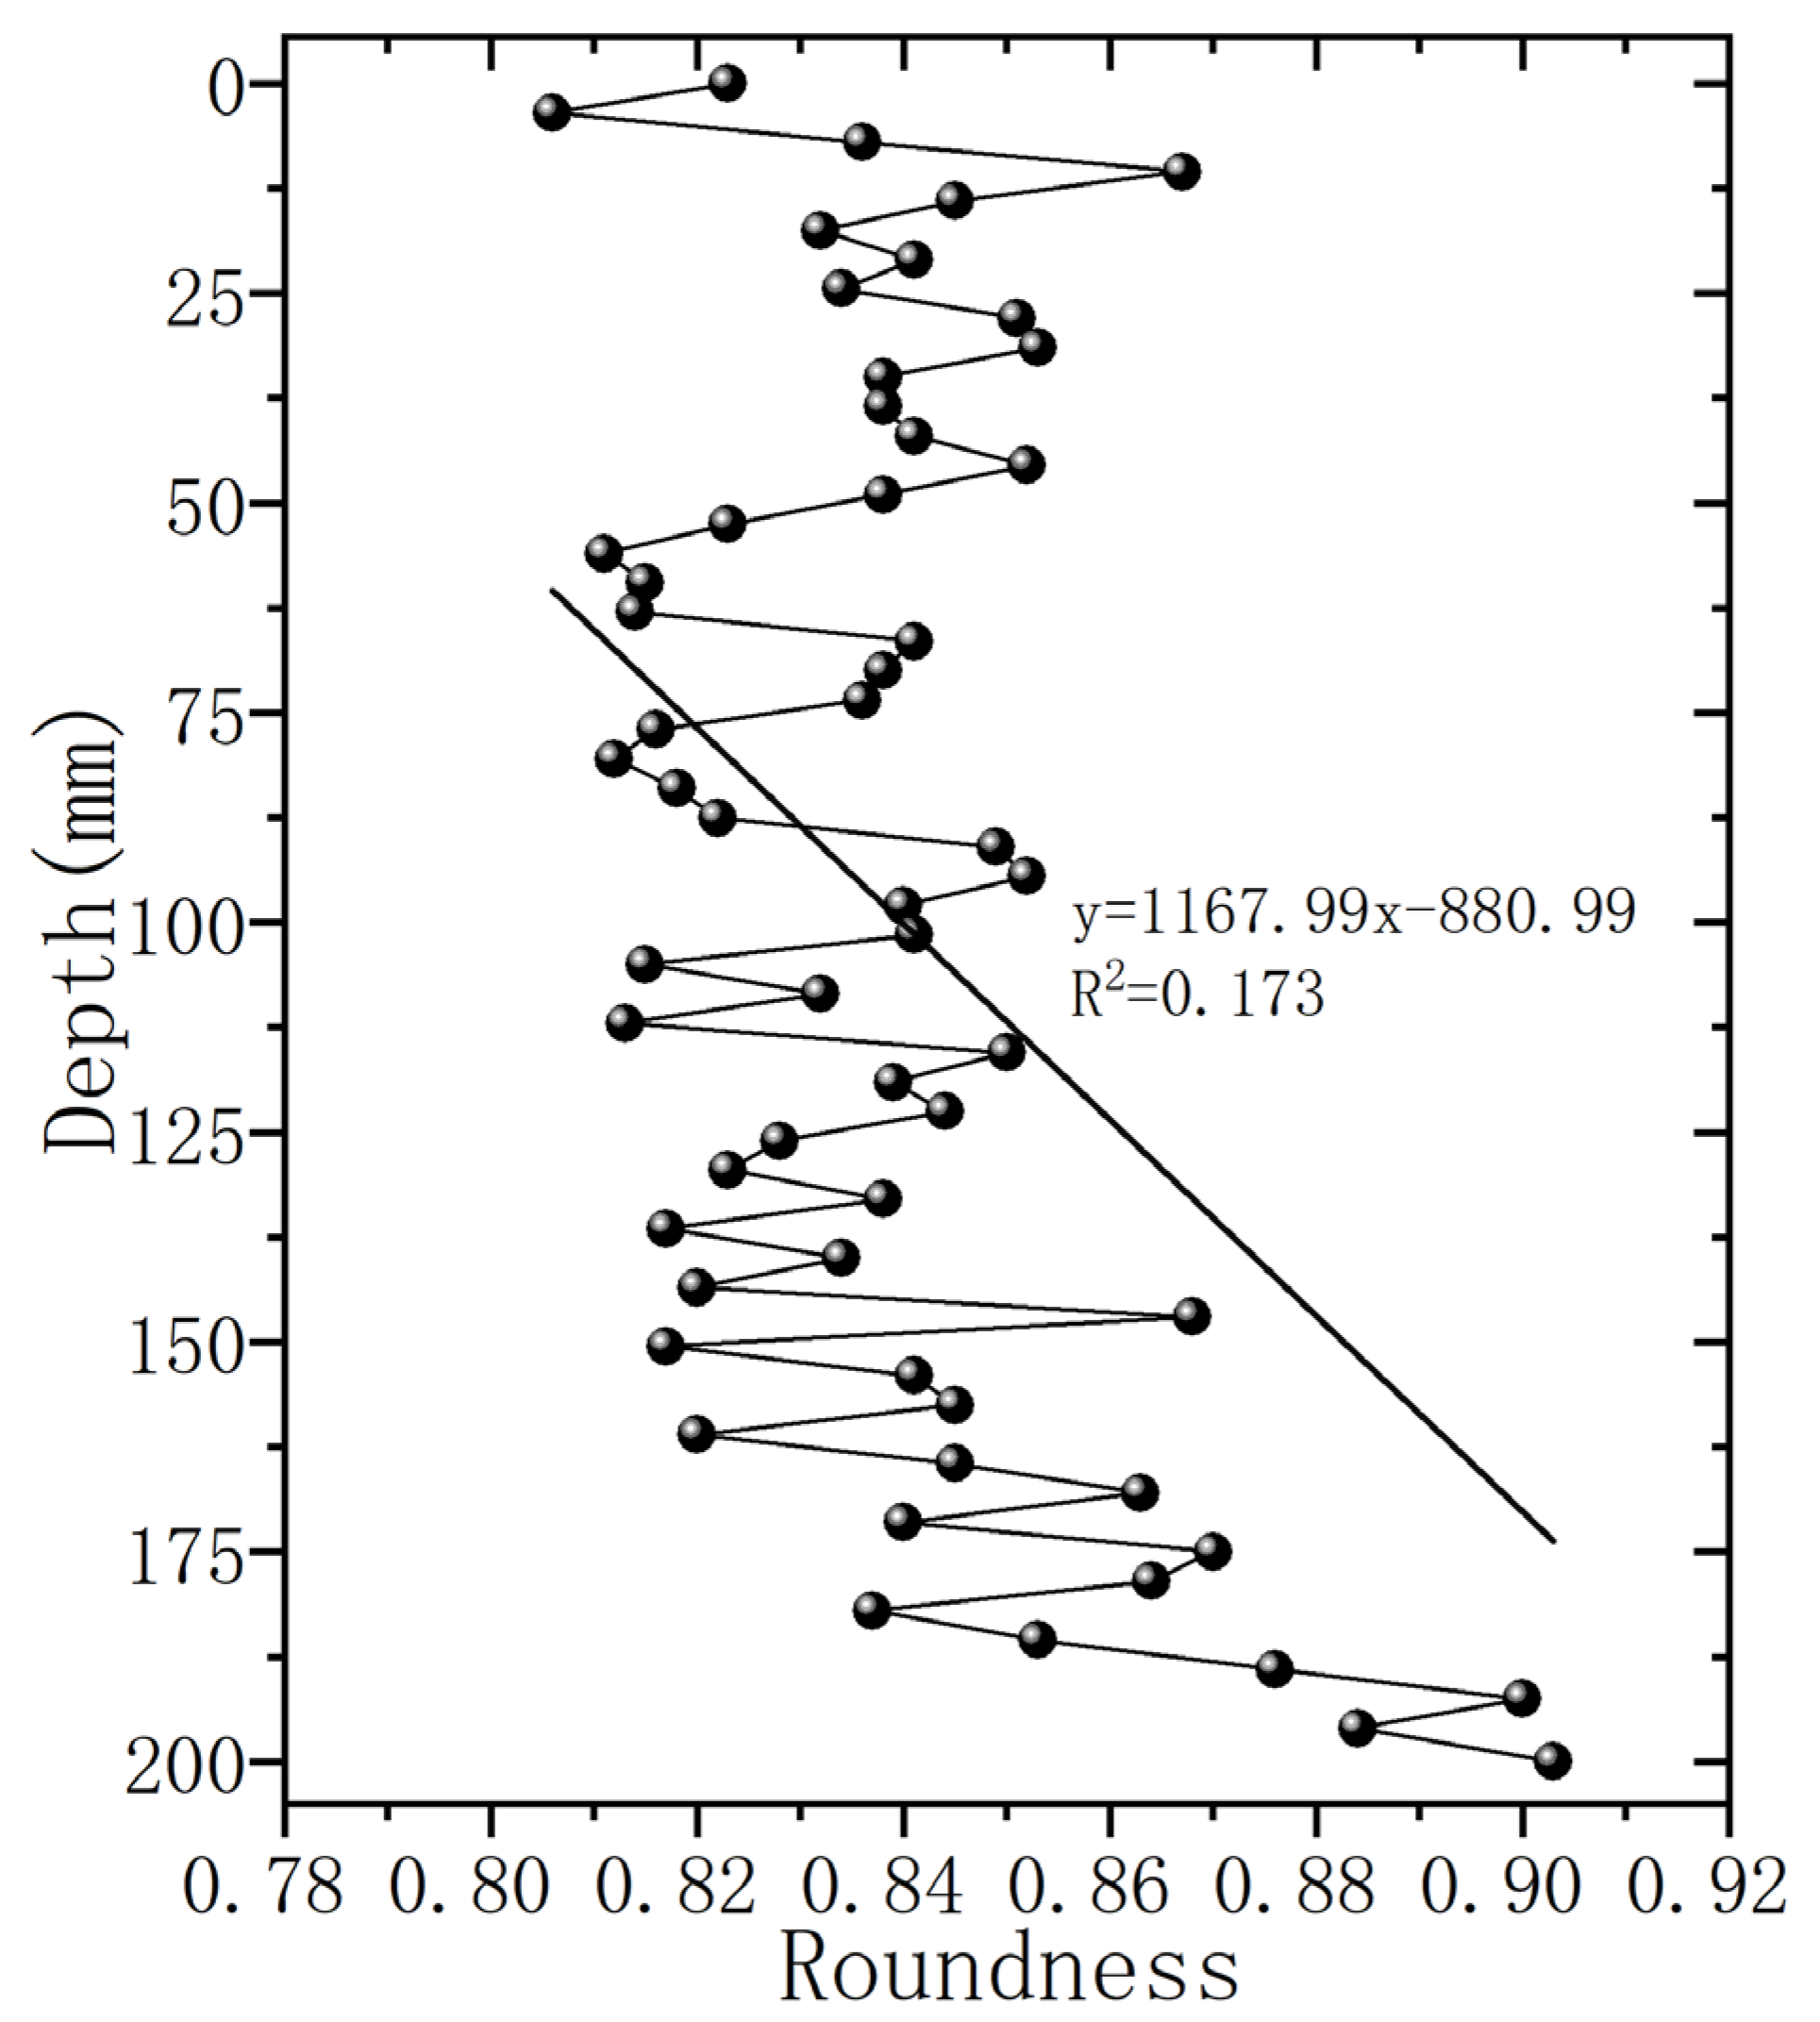
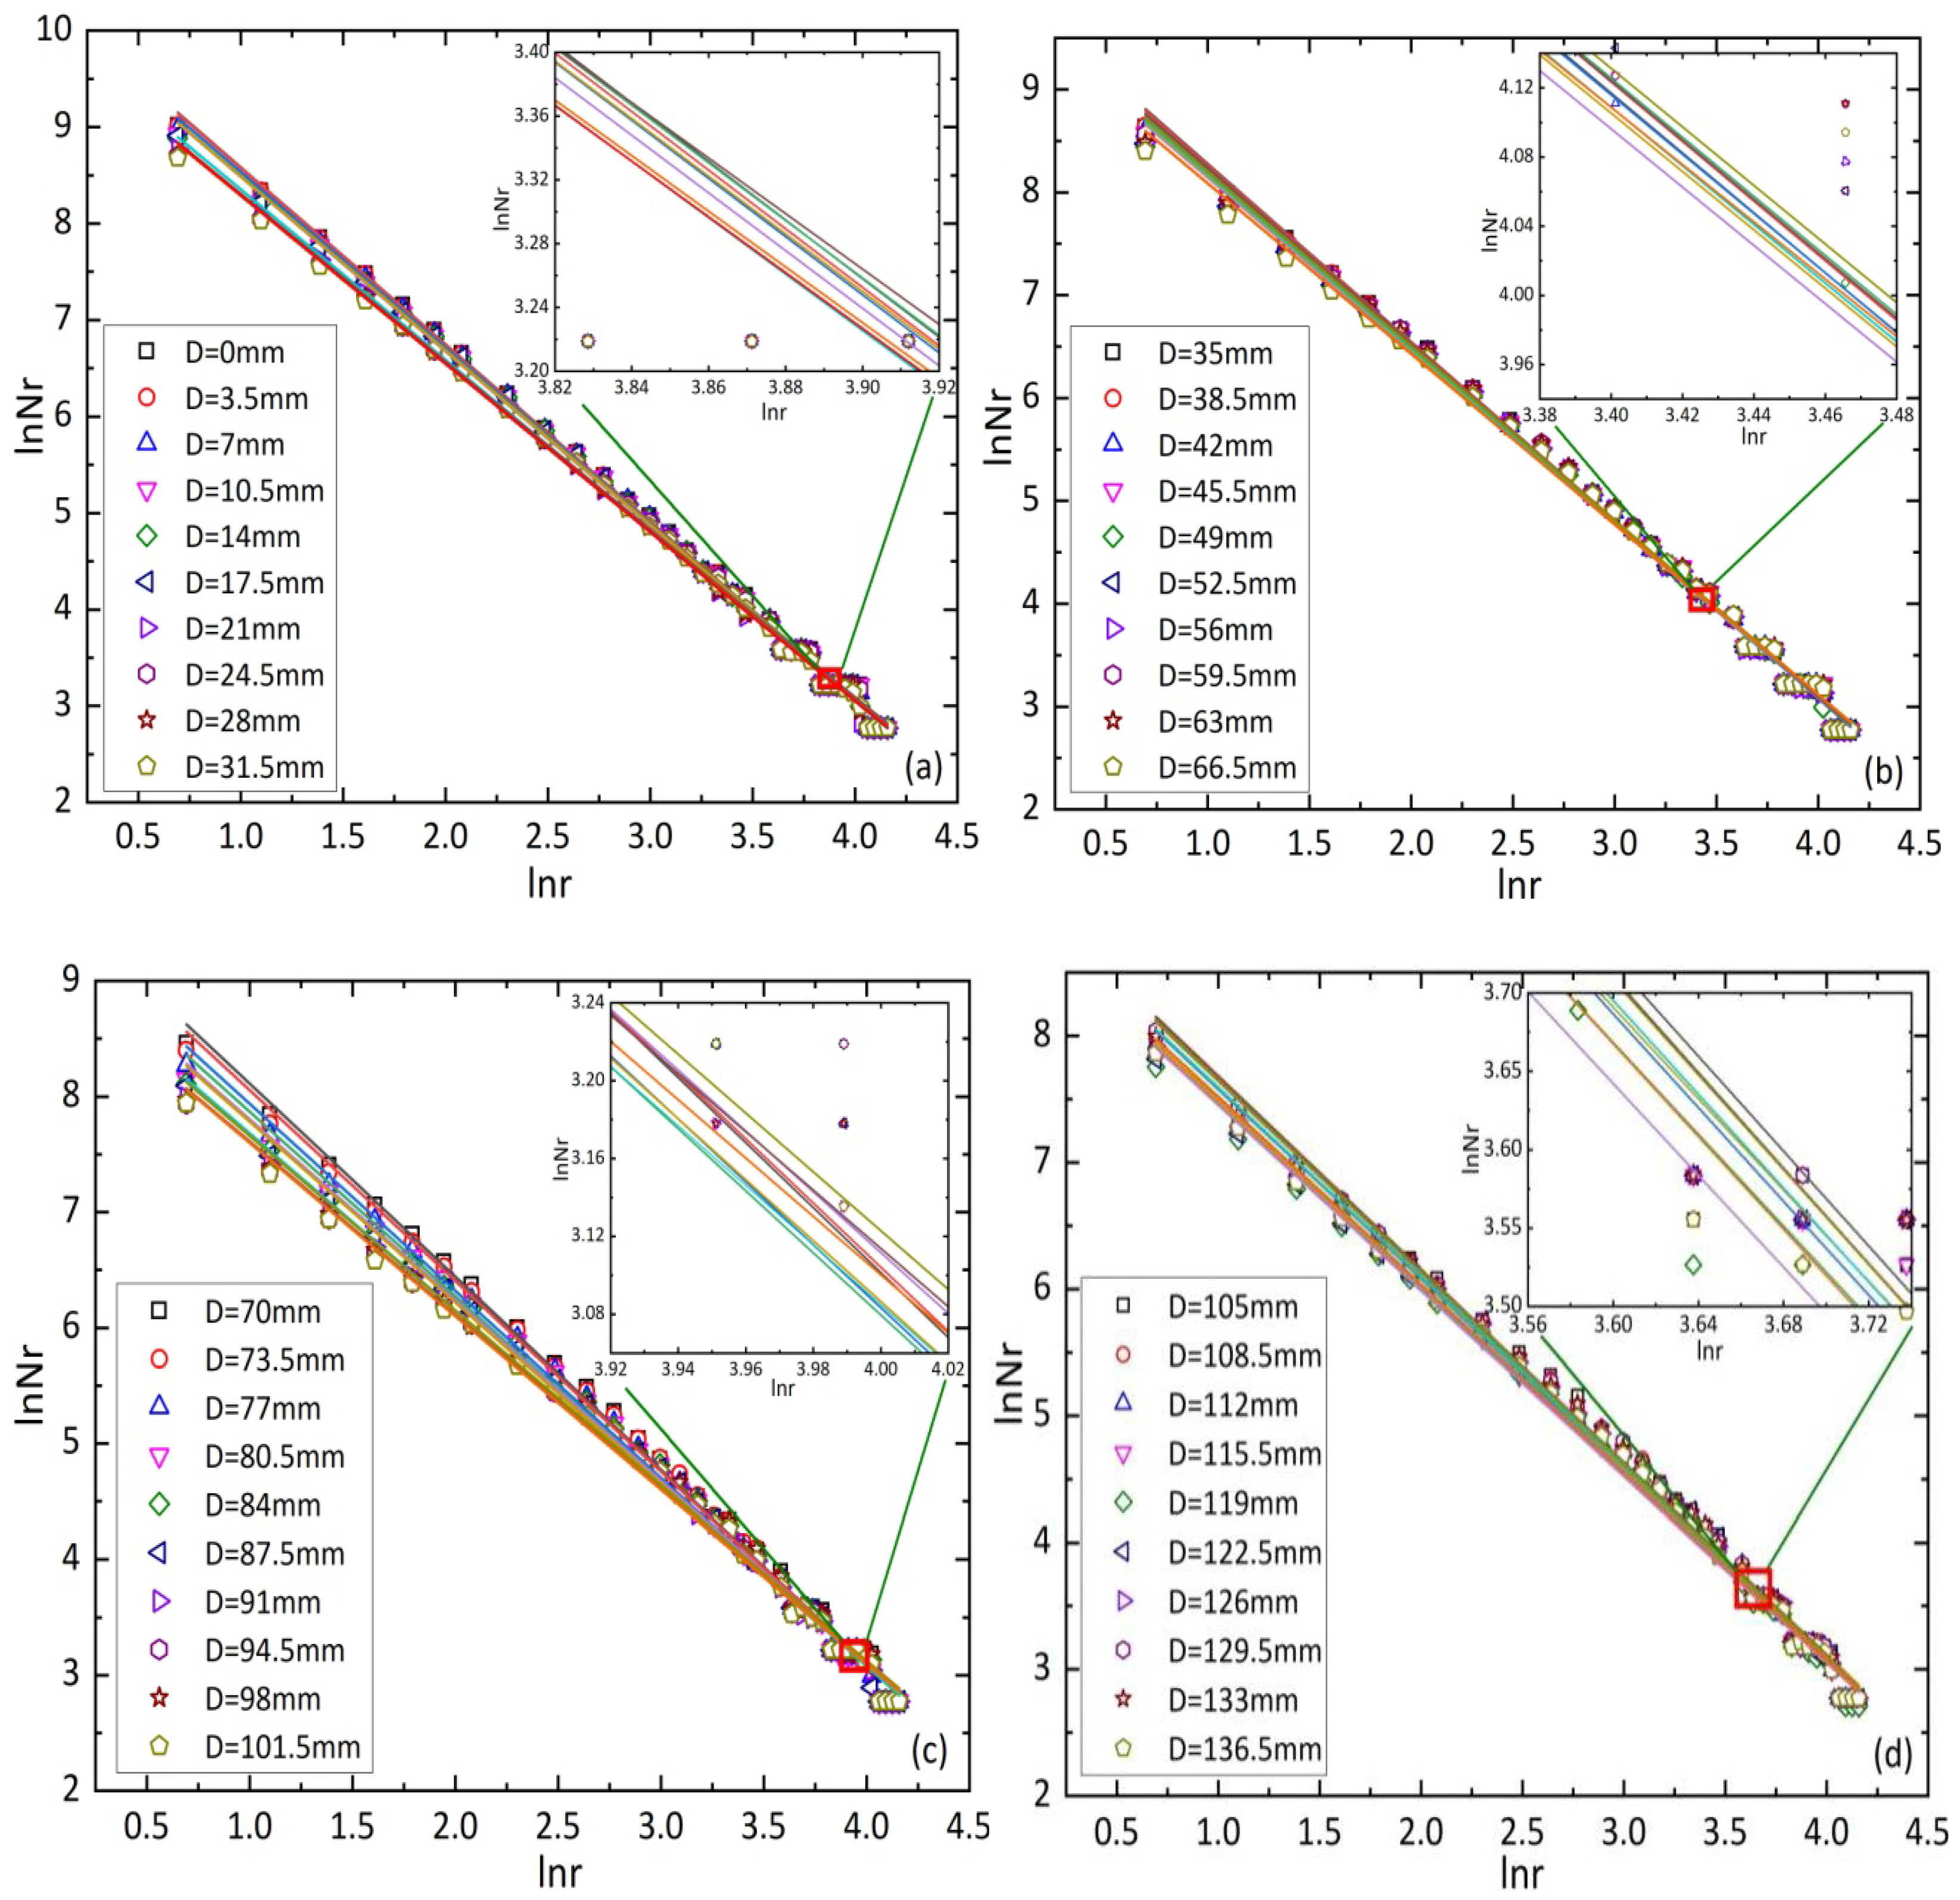
The study used CT scanning to non-destructively examine Mountain Red Earth columns. Analyses showed a linear decrease in pore area percentage with depth. Pore roundness fluctuated more, and the total pore count initially increased, then decreased. Micropores were most prevalent, while medium and large pores were fewer, with more large pores in the topsoil. The box-counting dimension effectively highlighted the heterogeneity and complexity of soil pores, decreasing linearly with depth.
(2)
In this study, it was found that the soil predominantly consisted of small pores, which generally indicate high aggregate stability. Stable aggregates are formed by the interaction of soil particles with organic matter and clay minerals. While small pores help maintain aggregate stability and enhance soil structure, an excessive amount can make the soil more prone to erosion. Additionally, soil porosity decreases with depth, leading to reduced structural stability, limited water infiltration, restricted root growth, and lower organic matter content, all of which increase erosion risks. Therefore, soil management must consider porosity changes and their impact on erosion.
(3)
The correlation analysis of quantified pore parameters indicates that as depth increases, there is no direct relationship between pore area percentage and roundness. However, the number of pores does affect roundness values. Both the number of pores and the ratio of pore area to box-counting dimension exhibit a clear linear positive correlation, with the linear influence of pore area on the box-counting dimension being particularly distinct. Meanwhile, there is a negative correlation between the box-counting dimension and roundness.
(4)
The 3D visualization reconstruction using Avizo effectively reconstructs the pore structure of Mountain Red Earth. The results indicate that pores are mainly concentrated in the upper soil column, distributed in an interconnected pattern with few isolated pores. The pore scale decreases significantly with depth, showing clear differences between the top and bottom surfaces, consistent with 2D slice observations.
(5)
CT scanning and 3D visualization successfully reconstructed the morphology of Mountain Red Earth from various perspectives. This demonstrates that CT non-destructive testing effectively observes and characterizes its pore structure qualitatively and quantitatively.

Author Contributions

Z.X. was responsible for the review and editing of the manuscript, as well as providing software guidance. H.Y. contributed to the writing of the original draft. L.Z. and Y.C. were responsible for conducting the experimental operations. All authors have read and agreed to the published version of the manuscript.

Funding

This research was financially supported by the Yunnan Natural Science Foundation Project (202401AT070119).

Institutional Review Board Statement

Not applicable.

Informed Consent Statement

Not applicable.

Data Availability Statement

Data are contained within the article. The original contributions presented in the study are included in the article, further inquiries can be directed to the corresponding author/s.

Conflicts of Interest

The authors declare no conflicts of interest.

References

  1. Ju, X.; Gao, L.; She, D.; Chen, Y. Impacts of the soil pore structure on infiltration characteristics at the profile scale in the red soil region. Soil Tillage Res. 2024, 236, 105922. [Google Scholar] [CrossRef]
  2. Lin, Z.; Huang, W.; Liao, D.; Zhang, Y. Sediment production process and hydraulic characteristics of ephemeral gully erosion in granite hilly area. Catena 2024, 210, 105899. [Google Scholar] [CrossRef]
  3. Wang, X.; Li, J.; Wang, X.; Zhang, Y. Study on strength and microstructure of red clay reinforced by F1 ionic soil stabilizer. Appl. Sci. 2022, 12, 9831. [Google Scholar] [CrossRef]
  4. Lu, Z.; Zhou, Y.; Li, Y.; Wu, Y. Effects of partial substitution of chemical fertilizer with organic manure on the activity of enzyme and soil bacterial communities in the mountain red soil. Front. Microbiol. 2023, 14, 1234904. [Google Scholar] [CrossRef]
  5. Wang, Y.; Li, K.; Li, J.; Chen, Y. Influence of soil particle size on the engineering properties and microstructure of a red clay. Appl. Sci. 2021, 11, 10887. [Google Scholar] [CrossRef]
  6. Deng, K.; Zhu, Y.; Liu, Z.; Wu, Y. Effects of crop growth and surface microtopography on runoff and soil losses in the red soil region of southern China. Catena 2024, 238, 107894. [Google Scholar] [CrossRef]
  7. Liu, Z.; Deng, K.; Zheng, H.; Wang, Y. Effects of tillage practices on runoff and soil losses in response to different crop growth stages in the red soil region of southern China. J. Soils Sediments 2024, 24, 2199–2212. [Google Scholar] [CrossRef]
  8. Huang, F.; Wei, X.; Zhu, T.; Liu, Y. Insights into distribution of soil available heavy metals in karst area and its influencing factors in Guilin, southwest China. Forests 2021, 12, 609. [Google Scholar] [CrossRef]
  9. Zhao, Y.; Hu, X.; Li, X. Analysis of the intra-aggregate pore structures in three soil types using X-ray computed tomography. Catena 2020, 193, 104622. [Google Scholar] [CrossRef]
  10. Zhu, X.; Liang, Y.; Cao, L.; Liu, Y. Pore characteristics of physical crust samples from two typical erodible soils in southern China. Eur. J. Soil Sci. 2022, 73, e13234. [Google Scholar] [CrossRef]
  11. Han, Y.; Fan, Y.; Xin, Z.; Zhang, Y. Effects of wetting rate and simulated rain duration on soil crust formation of red loam. Environ. Earth Sci. 2016, 75, 1–9. [Google Scholar] [CrossRef]
  12. Wilson, G.V.; Zhang, T.; Wells, R.R.; Yang, Y. Consolidation effects on relationships among soil erosion properties and soil physical quality indicators. Soil Tillage Res. 2020, 198, 104550. [Google Scholar] [CrossRef]
  13. Zhang, S.Y.; He, B.; Hao, B.; Chen, Y. Quantification of red soil macropores affected by slope erosion and sediment using computed tomography. Vadose Zone J. 2023, 22, e20276. [Google Scholar] [CrossRef]
  14. Liu, J.; Chen, X.; Qin, Z.; Wang, Y. Soil pore structure and water movement characteristics of sugarcane field under the influence of two typical tillage methods. J. Soil Water Conserv. 2023, 37, 237–245. (In Chinese) [Google Scholar]
  15. Shen, S.; Liu, Z.; Lv, Y. Effects of different planting patterns on soil microstructure in greenhouse. Soils 2016, 48, 355–360. (In Chinese) [Google Scholar]
  16. Zhou, H.; Li, B.; Lv, Y.; Wu, Y. Multifractal characteristics of soil pore structure under different tillage systems. Acta Pedol. Sinica 2010, 47, 1094–1100. (In Chinese) [Google Scholar] [CrossRef]
  17. Wang, K.; Zhang, R.D. Heterogeneous soil water flow and macropores described with combined tracers of dye and iodine. J. Hydrol. 2011, 397, 105–117. [Google Scholar] [CrossRef]
  18. Bradley, S.; Ghimire, C. Design of an ultrasound sensing system for estimation of the porosity of agricultural soils. Sensors 2024, 24, 2266. [Google Scholar] [CrossRef]
  19. Kim, S.Y.; Chun, J.K.; Yeo, J.Y.; Lee, J. Estimation of soil porosity in mine tailing using parameters from instrumented oedometer test. Eng. Geol. 2023, 317, 107065. [Google Scholar] [CrossRef]
  20. de Oliveira JA, T.; Cássaro FA, M.; Pires, L.F. Estimating soil porosity and pore size distribution changes due to wetting-drying cycles by morphometric image analysis. Soil Tillage Res. 2021, 205, 104814. [Google Scholar] [CrossRef]
  21. Liu, B.; Fan, H.; Jiang, Y.; Zhang, Y. Evaluation of soil macro-aggregate characteristics in response to soil macropore characteristics investigated by X-ray computed tomography under freeze-thaw effects. Soil Tillage Res. 2023, 225, 105559. [Google Scholar] [CrossRef]
  22. Budhathoki, S.; Lamba, J.; Srivastava, P.; Singh, R. Impact of land use and tillage practice on soil macropore characteristics inferred from X-ray computed tomography. Catena 2022, 210, 105886. [Google Scholar] [CrossRef]
  23. Tian, M.; Qin, S.; Whalley, W.R.; Zhang, Y. Changes of soil structure under different tillage management assessed by bulk density, penetrometer resistance, water retention curve, least limiting water range and X-ray computed tomography. Soil Tillage Res. 2022, 221, 105420. [Google Scholar] [CrossRef]
  24. Yang, Y.; Wu, J.; Zhao, S.; Liu, Y. Impact of long-term sub-soiling tillage on soil porosity and soil physical properties in the soil profile. Land Degrad. Dev. 2021, 32, 2892–2905. [Google Scholar] [CrossRef]
  25. Pessoa, T.N.; Cooper, M.; Nunes, M.R.; Ribeiro, A. 2D and 3D techniques to assess the structure and porosity of Oxisols and their correlations with other soil properties. Catena 2022, 210, 105899. [Google Scholar] [CrossRef]
  26. Shaheb, M.R.; Misiewicz, P.A.; Godwin, R.J.; Zhang, Y. A quantification of soil porosity using X-ray computed tomography of a drummer silty clay loam soil. In Proceedings of the 2020 ASABE Annual International Virtual Meeting, Online, 13–15 July 2020; American Society of Agricultural and Biological Engineers: St. Joseph, MI, USA, 2020; pp. 1–10. [Google Scholar] [CrossRef]
  27. Pires, L.F.; Ferreira, T.R.; Cássaro FA, M.; Almeida, D. A comparison of the differences in soil structure under long-term conservation agriculture relative to a secondary forest. Agriculture 2022, 12, 1783. [Google Scholar] [CrossRef]
  28. Ivonin, D.; Kalnin, T.; Dembovetskiy, A.; Kim, S.Y. Experimental data showing the effect of wetting on soil structure transformations: 3D images. Data Brief 2022, 41, 107928. [Google Scholar] [CrossRef]
  29. Ghardaghloo, B.; Price, J.S.; Rezanezhad, F.; Quinton, W.L. Evaluating the hydraulic and transport properties of peat soil using pore network modeling and X-Ray micro computed tomography. J. Hydrol. 2018, 561, 494–508. [Google Scholar] [CrossRef]
  30. Zeng, F.; Dong, C. Pore structure characteristics of reservoirs of Xihu Sag in East China Sea Shelf Basin based on dual resolution X-ray computed tomography and their influence on permeability. Energy 2022, 239, 122386. [Google Scholar] [CrossRef]
  31. Singh, N.; Kumar, S.; Udawatta, R.P.; Anderson, S.H.; de Jonge, L.W.; Katuwal, S. X-ray micro-computed tomography characterized soil pore network as influenced by long-term application of manure and fertilizer. Geoderma 2021, 385, 114872. [Google Scholar] [CrossRef]
  32. Yu, Q.; Yan, X.; Wang, Q.; Yang, T.; Kong, Y.; Huang, X.; Mehmood, Q. X-ray computed tomography-based evaluation of the physical properties and compressibility of soil in a reclamation area. Geoderma 2020, 375, 114524. [Google Scholar] [CrossRef]
  33. Zhang, L.; Wang, J.; Xiao, M.; Chen, Y. Variations of aggregates and organic matter in soil profile during degradation process of mountainous red soil in karst area of East Yunnan Province. Bull. Soil Water Conserv. 2015, 35, 53–58. (In Chinese) [Google Scholar]
  34. Wang, C.; Wu, X.; Zhang, M. Analysis of maintenance case of trouble of Siemens Definition AS CT. China Med. Equip. 2023, 38, 175–180. (In Chinese) [Google Scholar]
  35. Yang, C. The Research on Medical Image Segmentation Algorithm Based on Level Set. Master’s Thesis, Chongqing University of Posts and Telecommunications, Chongqing, China, 2021. (In Chinese). [Google Scholar]
  36. Heeraman, D.A.; Hopmans, J.W.; Clausnitzer, V. Three-dimensional imaging of plant roots in situ with X-ray computed tomography. Plant Soil 1997, 189, 167–179. [Google Scholar] [CrossRef]
  37. Yu, H.; Dong, Z.; Yang, J.Y.; Zhang, Y. Study on soil macropore characteristics and infiltration capacity of different land use types based on CT scanning. J. Arid. Land Resour. Environ. 2023, 37, 55–61. (In Chinese) [Google Scholar]
  38. Luo, L.; Lin, H.; Li, S. Quantification of 3-D soil macropore networks in different soil types and land uses using computed tomography. J. Hydrol. 2010, 393, 53–64. [Google Scholar] [CrossRef]
  39. Zhu, H.; Ji, C.C. Fractal Theory and Its Applications; Science Press: Beijing, China, 2011. (In Chinese) [Google Scholar]
  40. Carpinteri, A.; Lacidogna, G.; Pugno, N. "Scaling of energy dissipation in crushing and fragmentation: A fractal and statistical analysis based on particle size distribution. Int. J. Fract. 2004, 129, 131–139. [Google Scholar] [CrossRef]
  41. Wu, Z.; Peng, Z.C.; Hou, F.J. Response of main plant population pattern to winter grazing in alpine steppe of the Qilian Mountains. Acta Ecol. Sin. 2019, 39, 8010–8020. (In Chinese) [Google Scholar]
  42. Feng, J.; Yu, J.Y. Effect on soil wetting pattern caused by emitter discharge and spacing for layered soil in sunshine greenhouse. J. Irrig. Drain. 2005, 4, 26–28+40. (In Chinese) [Google Scholar]
  43. Tao, G.L. Fractal Approach on Pore Structure of Rock and Oil Porous Media and Its Applications. Master’s Thesis, Wuhan University of Technology, Wuhan, China, 2010. (In Chinese). [Google Scholar]
  44. Lü, Y.Z.; Li, B.G. (Eds.) Soil Science; China Agricultural Press: Beijing, China, 2006. (In Chinese) [Google Scholar]
  45. .Feng, J.; Hao, Z.C. Determination of soil macropore distribution using CT scanning. Adv. Water Sci. 2002, 5, 611–617. (In Chinese) [Google Scholar]
  46. Sun, J.R. Simulation Study of Infiltration Process in Heterogeneous Porous Media. Master’s Thesis, China University of Mining and Technology, Xuzhou, China, 2023. (In Chinese). [Google Scholar]
Figure 1. Study area and sampling location.
Applsci 14 09050 g001
Figure 2. The curves of particle size frequency distribution (a) and accumulation percentage (b).
Applsci 14 09050 g002
Figure 3. CT scanning and CT data processing, including schematic and field view of CT scanning (a), original images of CT slices (b), and segmentation and 3D reconstruction of soil sample (c).
Applsci 14 09050 g003
Figure 4. Processing of CT slices: (a) The original image from CT scanning. (b) Extraction of regions of interest. (c) Image after binary segmentation (black represents pores and white represents background). (d) The pores are extracted based on ImageJ.
Applsci 14 09050 g004
Figure 5. Binarized images at different depths (black area represents pores).
Applsci 14 09050 g005
Figure 6. Variation of pore number with depth.
Applsci 14 09050 g006
Figure 7. Variation of the porosity with depth.
Applsci 14 09050 g007
Figure 8. Cumulative distribution of pore area percentage within each scale of pore including large pores, medium pores, small pores, and micropores. It can be seen that the percentage of pores area in each scale is different.
Applsci 14 09050 g008
Figure 9. Distribution of the number of pores in each scale of pore including large pores, medium pores, small pores, and micropores. It can be seen that there are obvious differences in the number of pores each scale.
Applsci 14 09050 g009
Figure 10. Variation of roundness with depth.
Applsci 14 09050 g010
Figure 11. Linear fitting plots of lnr and lnNr for box-counting dimension calculation.
Applsci 14 09050 g011aApplsci 14 09050 g011b
Figure 12. The box-counting dimension varies with depth.
Applsci 14 09050 g012
Figure 13. The relationship between the roundness rate and the percentage of pore area (a) and the number of pores (b).
Applsci 14 09050 g013
Figure 14. The relationship between the box-counting dimension and the number of pores (a) and the percentage of pore area (b).
Applsci 14 09050 g014
Figure 15. Reconstruction process of soil sample.
Applsci 14 09050 g015
Figure 16. Global and local 3D morphology of soil pore structure.
Applsci 14 09050 g016
Table 1. Results of Pearson correlation analysis between the parameters of the pores.
Pore ParametersAverageStandard Deviation (SD) Box-Counting Dimension (D)Number of PoresSphericityPercentage of Pore Area
Box-counting Dimension (D)1.4870.2101
Number of Pores147.79332.6900.711 **1
Sphericity0.8400.021−0.545 **−0.565 **1
Percentage of Pore Area21.54713.6920.934 **0.507 **−0.357 **1
p < 0.05; ** p < 0.01.
Disclaimer/Publisher’s Note: The statements, opinions and data contained in all publications are solely those of the individual author(s) and contributor(s) and not of MDPI and/or the editor(s). MDPI and/or the editor(s) disclaim responsibility for any injury to people or property resulting from any ideas, methods, instructions or products referred to in the content.

