Article

Physical Properties of Selected Fruit Fibre and Pomace in the Context of Their Sustainable Use for Food Applications

Department of Food Engineering and Process Management, Institute of Food Sciences, Warsaw University of Life Sciences-SGGW, 159c Nowoursynowska St., 02-776 Warsaw, Poland
*
Author to whom correspondence should be addressed.
Appl. Sci. 2024, 14(19), 9051; https://doi.org/10.3390/app14199051
Submission received: 21 August 2024 / Revised: 6 September 2024 / Accepted: 12 September 2024 / Published: 7 October 2024

Abstract

:
Pomace, a waste product, generates a huge problem in the fruit and vegetable industry. Numerous studies prove that pomace and fibre are valuable sources of many nutrients. Due to their properties, their popularity is growing in many industries. Water vapour isotherms and kinetics were determined for selected fruit fibre and pomace. The activity and water content, colour, apparent and bulk density, and material structure were also investigated. In addition, the thermal stability of the tested fibres and pomace was examined. Fibre and pomace from chokeberries, apples and currants were used in the research. The determined kinetic curves proved that apple fibre absorbed more water vapour. The isotherms were found to have a shape characteristic of type III sorption isotherms. The Guggenheim–Anderson–de Boer model (GAB) described experimental data for sorption isotherms well (taking an RMS value of less than 10% as a good fit of the model to the sorption data). Thermogravimetric analysis showed good thermal stability, and all analysed fruit fibre and pomace showed similar behaviour in the three main stages of weight loss. The results suggest that the analysed waste materials can be used for different applications, including flour replacements for food products or filling materials in edible packaging films.

1. Introduction

The European Environment Agency (EEA) has announced the need to move from a linear economy to a circular economy. In a linear economy, the central model for economic development is raw materials, which are taken, processed, consumed, and disposed of as waste. In a closed-loop economy, the recovery and valorisation of waste allow for materials to be reused and put back into the supply chain [1].
Using the economic model in question, some points of the European Green Deal (EGD) are being implemented. EGD is a package of initiatives to implement green transformation and then climate neutrality; it consists of 7 pillars. The EGD assumptions mainly focus on reducing greenhouse gas emissions and improving energy efficiency. The assumptions of the EGD mainly focus on reducing greenhouse gas emissions and improving energy efficiency. Such actions can result in reducing energy consumption, producing fewer harmful gases, while supporting local entrepreneurs by sourcing raw materials from nearby areas [2].
Each year, global fruit production exceeds 900 million tons. About 30% of the total amount of fruit produced is waste. Fibre and pomace comprise the largest portion of the fruit industry’s wastes. Managing waste in the fruit industry is a major problem for producers and processed fruit [3]. A very significant portion of by-products from the fruit industry ends up in landfills. This production practice poses serious environmental hazards due to the high biological and chemical oxygen demand rate of such waste [4]. Despite its valuable properties, fruit pomace and other waste are still not properly managed. Many bioactive compounds can be extracted from the by-products [5].
Currently, the use of natural bioactive compounds in the food industry is hampered by laboratory-intensive and lengthy extraction and isolation methods. As technology advances, new, rapid and efficient technologies for extracting and separating natural compounds are emerging that can yield high-quality extracts with better yields, less time and less solvent consumption. However, the higher costs associated with these new technologies and the difficulty of adapting to industry standards remain a major challenge [6].
Fibre is defined as carbohydrates derived from plant cell walls, resistant starch and oligosaccharides resistant to gastric acidity, hydrolysis by mammalian enzymes and absorption in the upper gastrointestinal tract [7]. Several types of dietary fibre can be extracted from grain, fruit and vegetable processing waste. Dietary fibre is classified based on water solubility into soluble dietary fibre (SDF) and insoluble dietary fibre (IDF). Pectins (found in whole grains, legumes, etc.), gums (found in legumes, etc.) and mucilages (found in aquatic plants, aloe vera, okra and glycoproteins from food additives) are examples of soluble dietary fibre, while cellulose (which provides glucose monomers found in fruits, roots and grains), hemicellulose (complex sugars found in cereal bran and grains) and lignin (aromatic alcohols found in vegetables) are examples of insoluble dietary fibre [8].
Dietary fibre extracted from plant wastes and by-products can be a rich source of polyphenols, flavonoids and carotenoids (e.g., hydrolysable polyphenols, hydrolysable tannins, proanthocyanidins). It can form a single matrix called antioxidant dietary fibre [9]. Compared to cereal fibre, fruit fibre has a much higher soluble fraction [10].
Fruit pomace is a by-product of pressing raw fruits for juice. They have a high water content, so there is a risk of developing undesirable microorganisms. Immediate drying of pomace is used in the fruit industry. As a by-product, dried pomace is a very inexpensive intermediate product that can be used in various industries [11].
Fruit pomace can be used to produce animal feed. The limitation is the quality of the resulting feed. Due to its low protein content, such feed is not a complete animal food [5]. In addition, fruit pomace is rich in sugar-containing substances, so it can be used as a raw material for biofuel production, which will reduce environmental pollution [9]. Fruit pomace can be used as an inexpensive, low-calorie filler in food products to replace sugar, fat or flour partially [12]. Researchers are also interested in studying the use of kiwi by-products as a raw material. The powder obtained by freeze-drying kiwifruit peel, pulp and seeds contained large amounts of phenolic compounds, mainly protocatechuic acid, chlorogenic acid, caffeic acid, rutin, p-hydroxybenzoic acid and quercetin [13].
This study aimed to investigate the physical properties of pomace and fibre from chokeberry, currant and apple in the context of their sustainable use for food applications. The water activity and water content, colour, apparent and bulk density, and material structure were investigated. In addition, the thermal stability of water vapour isotherms and kinetics were determined.

2. Materials and Methods

2.1. Materials

The research material was commercial fibres and fruit pomace from chokeberry, black currant (currant) and apple powdered from GreenField Sp. Z o.o. Sp. k. (Warsaw, Poland). Fibre and fruit pomace from chokeberries, currants and apples were chosen because the consumption of these fruits in Poland is the highest. The studied materials had a similar fineness in the 0–425 μm range. Before testing the kinetics and isotherms of water vapour adsorption, the samples were dried at 70 °C for 24 h using a SUP-65W laboratory dryer (Wamed, Warsaw, Poland).

2.2. Analytical Methods

2.2.1. Water Content

Study material weighing approximately 1 g was weighed on an analytical balance (RagWag, Warsaw, Poland) with an accuracy of ±0.0001 g and placed in weighing cells. Then, the fibre and pomace were dried in an oven at 105 °C for 4 h in a SUP-65W laboratory dryer (Wamed, Warsaw, Poland). The samples were weighed again after cooling in a dried calcium chloride desiccator. The determination was performed in 3 replicates.
The water content was calculated from the formula
u = 1 s s
where
u —water content (g water/g d.m.)
s —dry matter content (g d.m./g)

2.2.2. Water Activity

The water activity of the study powders was measured using an AquaLab 4TE water activity meter (Decagon Devices, Inc., Pullman, WA, USA). The study material was applied to a maximum of half the cell’s height and then placed in the measuring instrument.

2.2.3. Colour

The colour of the study material was measured in six replicates using a Minolta (Tokyo, Japan) model CR-300 colorimeter. The measurement used was in reflection with a diameter of 8 mm in the CIE L*a*b* colour system and a 0° angle of observation.

2.2.4. Apparent Density

The apparent density of the powders was measured using a helium pycnometer model, Stereopycnometer (Quantachrome Instruments, Warsaw, Poland). A large cell of known volume was filled with test material of known mass and unknown volume. Then, the cell with the sample was placed in a device in which helium flowed through the test material. The measurement was performed in triplicate.

2.2.5. Bulk Density

Bulk density was determined using an STAV shock volumeter 2003 Engelsmann AG (Ludwigshafen, Germany). The test material with a fixed volume of 250 cm3 was placed in a cylinder, and then 100 times shaking of the test material was applied. The determination was performed in 3 replicates. Bulk density was determined using the following formula:
ρ = m v
where
ρ —bulk density lose (g/cm3)
m —mass (g)
v —volume (cm3).

2.2.6. Water Vapour Adsorption Kinetics

Water vapour sorption kinetics was determined by the weight changes of the samples in an environment with 100% relative humidity (distilled water). For the study, 250 mg of material was weighed using a Mettler Toledo AE 240 balance (Mettler-Toledo Sp. z o.o., Warsaw, Poland) with an accuracy of ±0.0001 g. Measurements were carried out in triplicate at 23 ± 1 °C for 5 days after 0.5, 1, 3, 6, 9, 12, 24, 48, 72 and 96 h. The interpretation of the results of water vapour adsorption kinetics was performed based on the kinetic curves of the correlation of the rate of water vapour adsorption, g water/g d.m.*h, as a function of time (h).
For the mathematical interpretation of the correlation of the amount of adsorbed water with the water content, the following exponential equation was used:
u = a + b ( 1 e x p c τ )
where
a, b and c—equation constants
τ—adsorption time (h)
u —water content (g water/g d.m.).
The suitability of the exponential equation to describe the obtained curves kinetic curves of water vapour adsorption was evaluated by analysing the determination coefficient R2.

2.2.7. Water Vapour Adsorption Isotherms

Water vapour sorption isotherms were determined in triplicate using the static–excitation method [14]. Saturated salt solutions of CaCl2, LiCl, CH3COOK, MgCl2, K2CO3, Mg(NO3)2, NaNO2, NaCl, (NH4)2SO4 and (NH4)H2PO4 in the water activity range of 0.00–0.93 were used as hydrostatic agents. The samples were kept in desiccators for 3 months. The weight of the samples was measured on a Mettler AE 240 analytical balance with an accuracy of ±0.0001 g. In the desiccators with environmental water activity above 0.75, thymol was placed to prevent the moulding of the samples.
The results of water vapour sorption isotherms of static conditions were interpreted based on the curves of water content’s dependence on the environment’s water activity. To describe the water adsorption isotherms, the Guggenheim–Anderson–de Boer model (GAB) was used. This model described experimental data for sorption isotherms well (taking an RMS value of less than 10% as a good fit of the model to the sorption data). The following Equation was used [15]:
u = u m C k a w 1 k a w [ 1 + C 1 k a w ) ]
where
a w —water activity
u m —water content of the monolayer, g water/100 g d.m.
C ,   k —equation constants.
The approximation of isotherms was carried out based on all points of measurements (three repetitions). The Table Curve2D program version 5.0.1. (Systat Software Inc., San Jose, CA, USA) was used to fit the tested model to the experimental data. The evaluation of the suitability of the equations to describe the obtained sorption isotherm curves was performed by analysing the following:
Coefficient of determination (R2)
Value of mean square error (MRE):
M R E = 100 N | u e u o u e |
Root mean square deviation (RMS):
R M S = ( u e u o u e ) 2 N   100 %
Sum of residual squares (RSS):
R S S = ( u e u o ) 2
Moisture estimation error (SEE):
S E E = ( u e u o ) 2
where
u —water content, g water/g d.m.
e —experimental data
o —prognostic data
n —number of data.

2.2.8. Thermal Properties

Thermogravimetric analyses were performed using a TGA thermal analyser (Mettler Toledo, Warszawa, Poland) to determine the thermal stability and degradation of the fruit pomace and fibres. Each sample (5 mg) was heated at 5 °C min−1 from 30 to 600 °C under a nitrogen atmosphere (N2 flow was 50 mL min−1). TGA and DTG curves were acquired from the differential TGA values.

2.2.9. Microstructure

Observations of the microstructure of the powder molecules were made based on images using a scanning electron microscope model Quanta 200 MK2 (FEI Company, Fremont, CA, USA). The powders were placed on carbon disks and sputtered with gold using the model 108 auto sputter coater (Cressington Scientific Instruments, Watford, UK). Observations of the structure were made in a low vacuum of 0.35–1 torr at a magnification of 250.

2.3. Statistical Analysis

Statistical analysis was performed using the Statistica 13 package. A one-way analysis of variance (ANOVA) was performed using Tuckey’s post hoc test. The significance level was p = 0.05.

3. Results and Discussion

3.1. General Characteristics of Fruit Fibres and Pomace

The study examined commercial fruit products in the form of fibres and pomace from chokeberries, currants and apples, a picture of which is shown in Figure 1.
All preparations were characterised by similar granularity, but for the study, powders with particle sizes in the range of 0–425 μm were used. The colours of the fibres and pomace from the same fruits were similar to each other: purple for chokeberry and currant, and light brown for apple products. Table 1 presents the nutritional values of fibre from chokeberries, apples and currant. The tested materials differ in the content of some components, particularly the content of sugars and protein.

3.2. Water Content of Fruit Fibres and Pomace

The results obtained allowed us to conclude that the water content of the fibres differed significantly. Currant fibre had the lowest water content and 0.0381 g water/g d.m. The water content of apple fibre was equal to 0.0402 g water/g d.m. Fibre extracted from chokeberries, on the other hand, contained the highest amount of water—0.0550 g water/g d.m. Statistical analysis showed that water content in apple and currant fibre did not differ significantly.
No significant difference in water content was observed between pomace. The highest water content per dry matter was in chokeberry pomace—0.0798 g water/g d.m. Currant pomace had 0.0768 g water/g d.m., while the apple pomace contained the least water—0.0713 g water/g d.m. Based on the obtained results, it was found that the water content differs between pomace and fibre. Chokeberry, apple and currant pomace had a higher water content than fibres from the same fruits. The results of the water content obtained are presented in Table 2.
A study by Witczak et al. [19] showed that the dry matter content in currant pomace was 0.0700 g water/g d.m. The result of the present study in terms of dry matter is close to that of the researchers. Reißner et al. [20] determined the water content of fresh and powdered pomace of various origins. The determinations of materials not subjected to a drying process showed that chokeberry pomace contained more water than currant pomace. However, the latter was characterized by a higher water content in powdered form.

3.3. Water Activity of Fruit Fibres and Pomace

The water activity of the tested materials was measured to determine the baseline general properties. The results showed that the highest water activity, equal to 0.424, was characterized by chokeberry fibre. Apple and currant fibre had lower water activity, 0.341 and 0.324, respectively. The highest water activity among all types of pomace was possessed by currant pomace, which was 0.364. Apple pomace had a lower water activity of 0.032, while the lowest extrudate obtained from chokeberries was 0.321. The obtained water activity results are presented in Table 3.
The results obtained for the water activity of the fibres allow for concluding that the water content of the material determines the water activity. The chokeberry fibre, having the highest water activity of 0.424, was also characterised by the highest water content water, which was 0.0550 g/g d.m. Next, in descending order, was apple fibre with a water activity of 0.341 and a water content of 0.040 g/g d.m. The lowest results were characterised by currant fibre, of which the water activity was 0.324 and water content 0.0381 g/g d.m. The water activity of each of the tested materials was below 0.6. This is a water activity value below which microbial growth is impossible. This means that the pomace and fibres of the selected fruits were microbiologically stable [21].

3.4. Colour of Fruit Fibres and Pomace

Colour is the most important quality attribute regarding food products because it directly impacts consumer choices and the assessment of the acceptability of food. Therefore, its evaluation is crucial for food application due to the impact on the final product’s colour, i.e., snack bars or biscuits when pomace or fibre replaces flour. The results of the colour analysis showed that the apple fibre was characterised by the highest value of the parameter L*, which is responsible for brightness. The value of this parameter for apple fibre was 69.08. Currant and chokeberry fibres showed a lower value for this parameter, which was 48.18 and 42.16, respectively. Among the pomace, apple pomace had the brightest colour, of which the value of the L* parameter reached 57.35. The darkest colours were the chokeberry and currant pomace, of which the values of the L* parameter equalled 36.54 and 37.71. It was also found that the fibres had a higher L* parameter than pomace derived from the same fruits. The difference between fibre and chokeberry pomace was 5.61; in fibre and apple pomace, 11.73; and in fibre and currant pomace, 10.47. The proportion of the colour parameter L* in individual pomace and fibres is shown in Table 4. The currant fibre characterised the highest parameter, a*, representing red colour. The value for this material reached 14.41. Chokeberry fibre, second in descending order regarding this parameter, reached a value of 12.70. On the other hand, apple fibre had the lowest share of parameter a*, which, in this case, was only 8.05. Comparing the results of pomace colour, it was observed that those obtained from currant, just as in the case of the fibres, reached the highest value of the a* parameter. This means that the highest proportion of the colour red characterises both fibre and currant pomace. The lowest share of this parameter was characterised by chokeberry pomace, which reached a value of 8.53.
Parameter b* is equivalent to the yellow colour. The highest proportion of the described parameter was observed in apple fibre. The value of parameter b* was equal to 24.29. Chokeberry fibre and fibre had a much smaller share of yellow colour. The values of parameter b* of the tested fibres reached 4.73 and 5.37, respectively. It was also observed that the fibres, compared to pomace extracted from the same fruits, are characterised by a higher proportion of the b* colour parameter. Apple pomace showed a similar value of the b* colour parameter compared to the fibre of the same origin. The described parameter was equal to 21.81. Chokeberry pomace reached a value of 4.38, while the lowest value, 3.91, was characterised by currant pomace.
Alongi et al. [22] studied the colour parameters of apple pomace. The material analysed in the cited work was brighter, as indicated by a 20.50 higher value of the L* colour parameter. A lower proportion of red colour also characterised the apple pomace, as the a* parameter reached a value of 2.60, while in the present work, the value was equal to 9.22. In contrast, both pomaces were characterized by a very similar proportion of yellow colour. The b* parameter measurement result for the material Alongi et al. [22] studied was 2.50, while the extrudate studied in the present work was 21.81. The differences in the L* and a* colour parameters may have been determined by the variety or maturity of the fruit from which the pomace was obtained.

3.5. Apparent Density of Fruit Fibres and Pomace

The results obtained from measurements with a helium pycnometer found that the currant fibre had the highest apparent density of 1.47 g/cm3 (Table 5). The other tested fibres had a similar density. The apparent density of apple fibre was 1.37 g/cm3, while that of chokeberry fibre was 1.36 g/cm3. The highest apparent density of 1.44 g/cm3 among the pomace had a currant pomace. A slightly lower value was achieved by apple pomace, of which the apparent density was 1.42 g/cm3. The lowest apparent density, equal to 1.34 g/cm3, was achieved by chokeberry pomace. Comparing the results of fibres and pomace of the same fruits, it was observed that a higher apparent density characterized the fibres in each case. The differences in apparent density of the tested materials may have been influenced by the shape and size of the particles [23,24].

3.6. Bulk Density of Fruit Fibres and Pomace

The results presented that apple fibre was characterised by the highest bulk density among the fibres, which was 0.5146 g/cm3 in the loose state and 0.6625 g/cm3 after shaking. Chokeberry fibre had the lowest value of bulk density, which, in the loose state, was equal to 0.4537 g/cm3, while in the shaken state, the shook condition was 0.5427 g/cm3. Statistical analysis showed no statistically significant differences between chokeberry and currant’s loose and bulk fibre density. The chokeberry pomace had the highest bulk density, which, in the loose state, was 0.5261 g/cm3; after shaking, it was 0.6293 g/cm3. The bulk density of the loose apple pomace was equal to 0.462 g/cm3 and shaken 0.5447 g/cm3. The pomace currant showed the lowest value of the tested parameter—bulk density loss was equal to 0.4203 g/cm3, while, after 100 times shaking, it was 0.4813 g/cm3. The results obtained are shown in Table 5.
One of the factors affecting the bulk density of powders is particle size. The low value of bulk density could be due to a significant number of particles of larger sizes, of which the presence determines the formation of voids. On the other hand, the size of particles with a large variation reduces the number of voids, increasing bulk density. Another parameter shaping the value of bulk density is the water content. A higher moisture content favours the merging of powder into larger clusters, resulting in the formation of void spaces and, consequently, a decrease in bulk density [25]. Currant pomace, characterised by the lowest bulk density, showed almost the highest water content among the tested materials. In contrast, a relatively low moisture content characterised the apple fibre, with a high bulk density value. The loose and shaken bulk density results allowed for the calculation of the Hausner ratio and Carr’s index. Their knowledge allows them to determine the cohesion and flowability of powders. The Hausner ratio of currant fibre, apple pomace and currant pomace did not exceed the value of 1.20, which means that these materials were characterised by low cohesion. In contrast, chokeberry fibre, apple fibre and chokeberry pomace were classified as powders with medium cohesion, as they adopted values of 1.20–1.21. According to the classification based on Carr’s index value, currant fibre and currant pomace were characterised by very good flowability, taking values of 12.66 and 13.47. The other materials tested were 15.00–20.00, which means they were characterised by good flowability. Witczak et al. [26] studied the physical properties of powdered pomace chokeberry. The value of Carr’s index presented by the researchers was equal to 7, which means that the powder was characterised by better flowability than the one studied in the present study. Bulk density was loose, and after 100.00 shakings, it was higher than the chokeberry pomace studied in this paper. The dry matter content of the pomace chokeberry pomace studied by the authors was 93.80%, while the pomace used in the present work was 92.60%. The higher water content of the pomace presented in the paper may have influenced the lower bulk density values [27].

3.7. Water Vapor Sorption Kinetics of Fruit Fibres and Pomace

The sorption properties of the studied fibres and pomace were analysed by determining kinetic curves, which show the dependence of the change in the amount of absorbed water with the duration of the process. The kinetic curves are presented as a graph in Figure 2.
The best hygroscopic ability was shown by apple fibre, of which the amount of absorbed water after 120 h of the process was 73.77 g/100 g d.m. A much lower rate of water absorption was characterised by chokeberry and currant fibres, in which the amount of absorbed water was similar. The water content of the former increased by 26.65 g/100 g d.m., while in the latter by 27.20 g/100 g d.m. It was found that the water content stabilised after 60 h in chokeberry and currant fibres. In the final stage of the process, the water content of the chokeberry fibre and currant fibre was similar in shape. These materials, for the first 40 h of the process, intensively absorbed water, while after this time, water vapour adsorption stabilised. Apple fibre was hygroscopic for the entire duration of the process. The increase in water content in the last hours of the process indicates that the apple-derived material had not reached a state of moisture equilibrium [28]. The dependence of water content as a function of time was subjected to mathematical analysis, and the curves were described using an exponential equation. Parameter analysis of the exponential equation showed a good fit to the experimental data. The value of the coefficient of determination R2 was in the range of 0.971–0.995 (Table 6), which indicates a good description of the experimental data by the exponential equation.
Analysing the kinetic curves of the pomace, it was observed that the apple pomace absorbed water the fastest. After 120 h, per 100 g of dry substance, it absorbed 58.03 g of water. Apple pomace showed significantly better hygroscopic abilities compared to the other extrudates tested. Pomace derived from chokeberry absorbed 34.33 g/100 g d.m. The least hygroscopic material was currant pomace, which absorbed only 31.52 g/100 g d.m. As in the case of fibres, the water content of chokeberry and currant pomace stabilised after 60 h. The chokeberry pomace showed similar properties to the fibre of the same origin, as between 100 h and 120 h of the duration of the process, instead of being absorbed, it gave up 0.65 g/100 g d.m. As with the fibres, the course of the curves of chokeberry and currant pomace was similar in shape. The reduction in adsorption intensity occurred after 40 h of the process. Apple pomace did not reach a state of moisture equilibrium, as an increase in water content was noted of water in the last hours of the process. A graph of the dependence of the change in the amount of adsorbed water with time is shown in Figure 3. An exponential equation describes the kinetic curves. The parameters of the equation indicate a good fit to the experimentally obtained data. A high R2 coefficient (0.985–0.995) indicates a good description of the experimental data with the exponential equation.
Vapour adsorption rate curves of the studied fibres were also determined as a function of time, which are shown in Figure 3. Among the fibres, the highest rate of water vapour adsorption was characterised by apple fibre, which, at the beginning of the process, was 4.51 g/100 g d.m.*h. Chokeberry fibre, on the other hand, showed the lowest adsorption rate, which was equal to 2.72 g/100 g d.m.*h. The water content of the tested material determined the water vapour adsorption rate. A lower water content determined the higher speed of the adsorption process. Apple fibre, which had the highest rate of water vapour adsorption after a time of 5 h had 2.78 g water/100 g d.m. In contrast, in chokeberry fibre, of which the rate of adsorption was the lowest, the water content was equal to 3.80 g/100 g d.m.

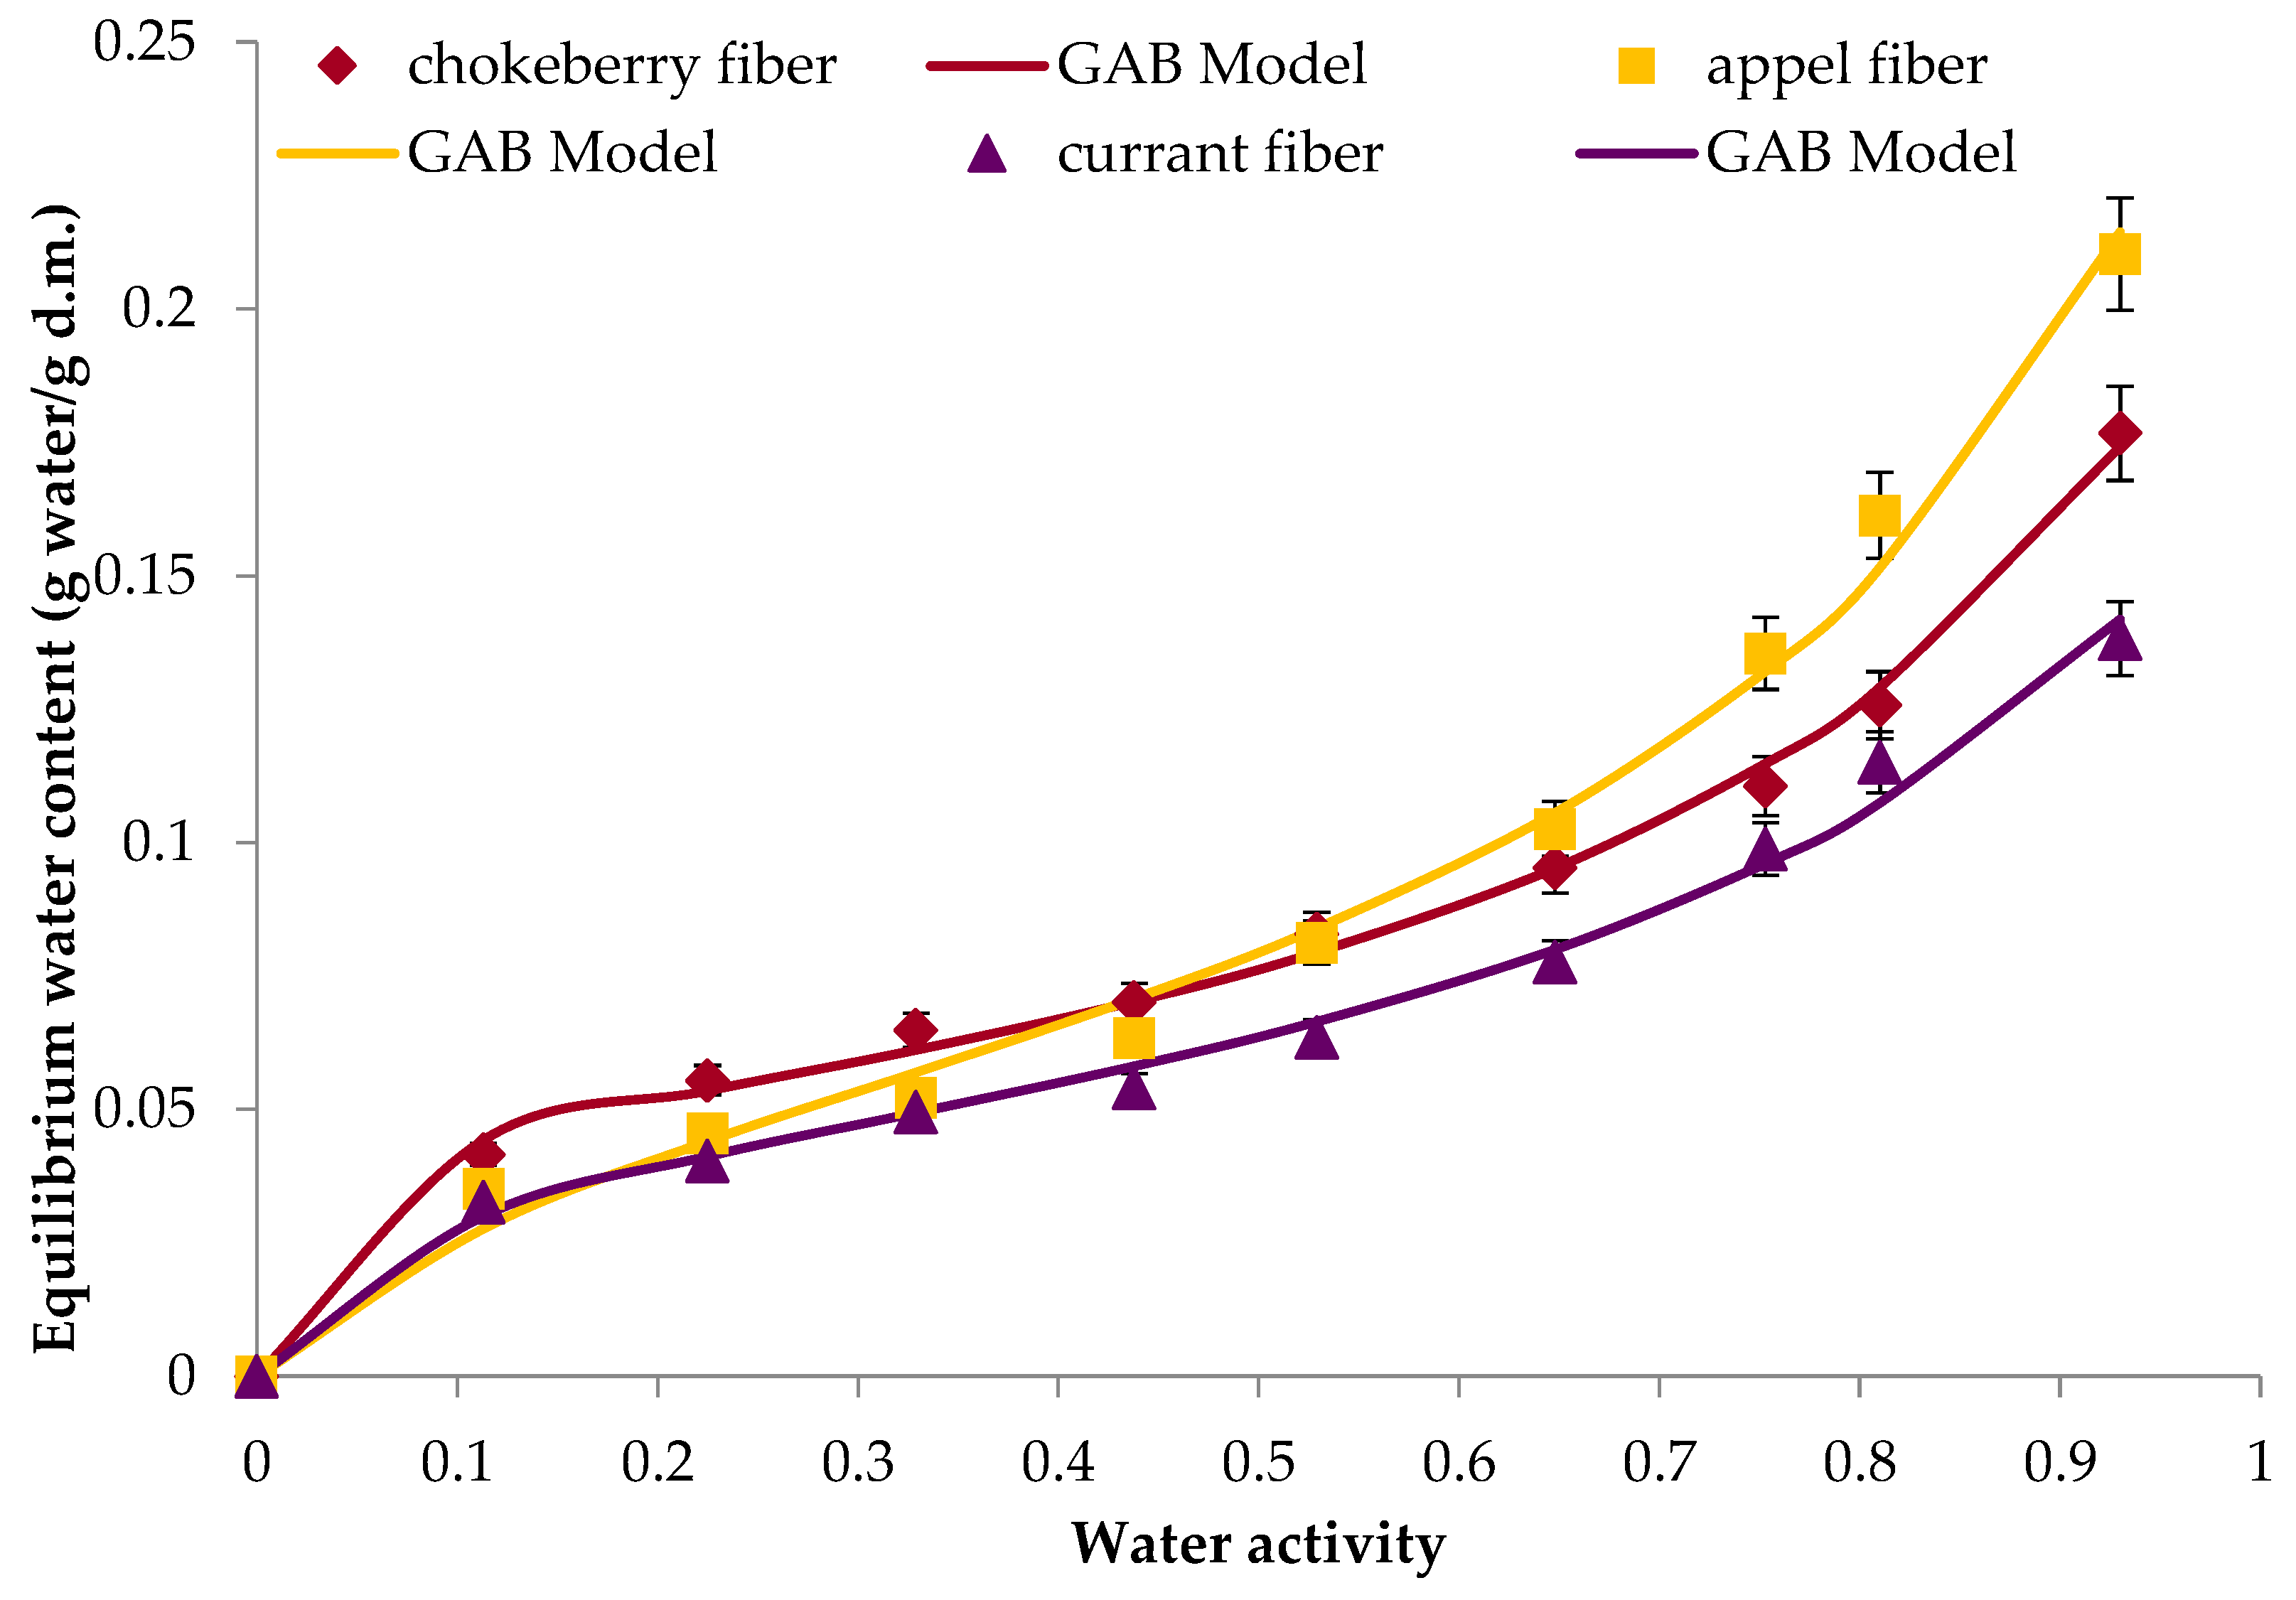
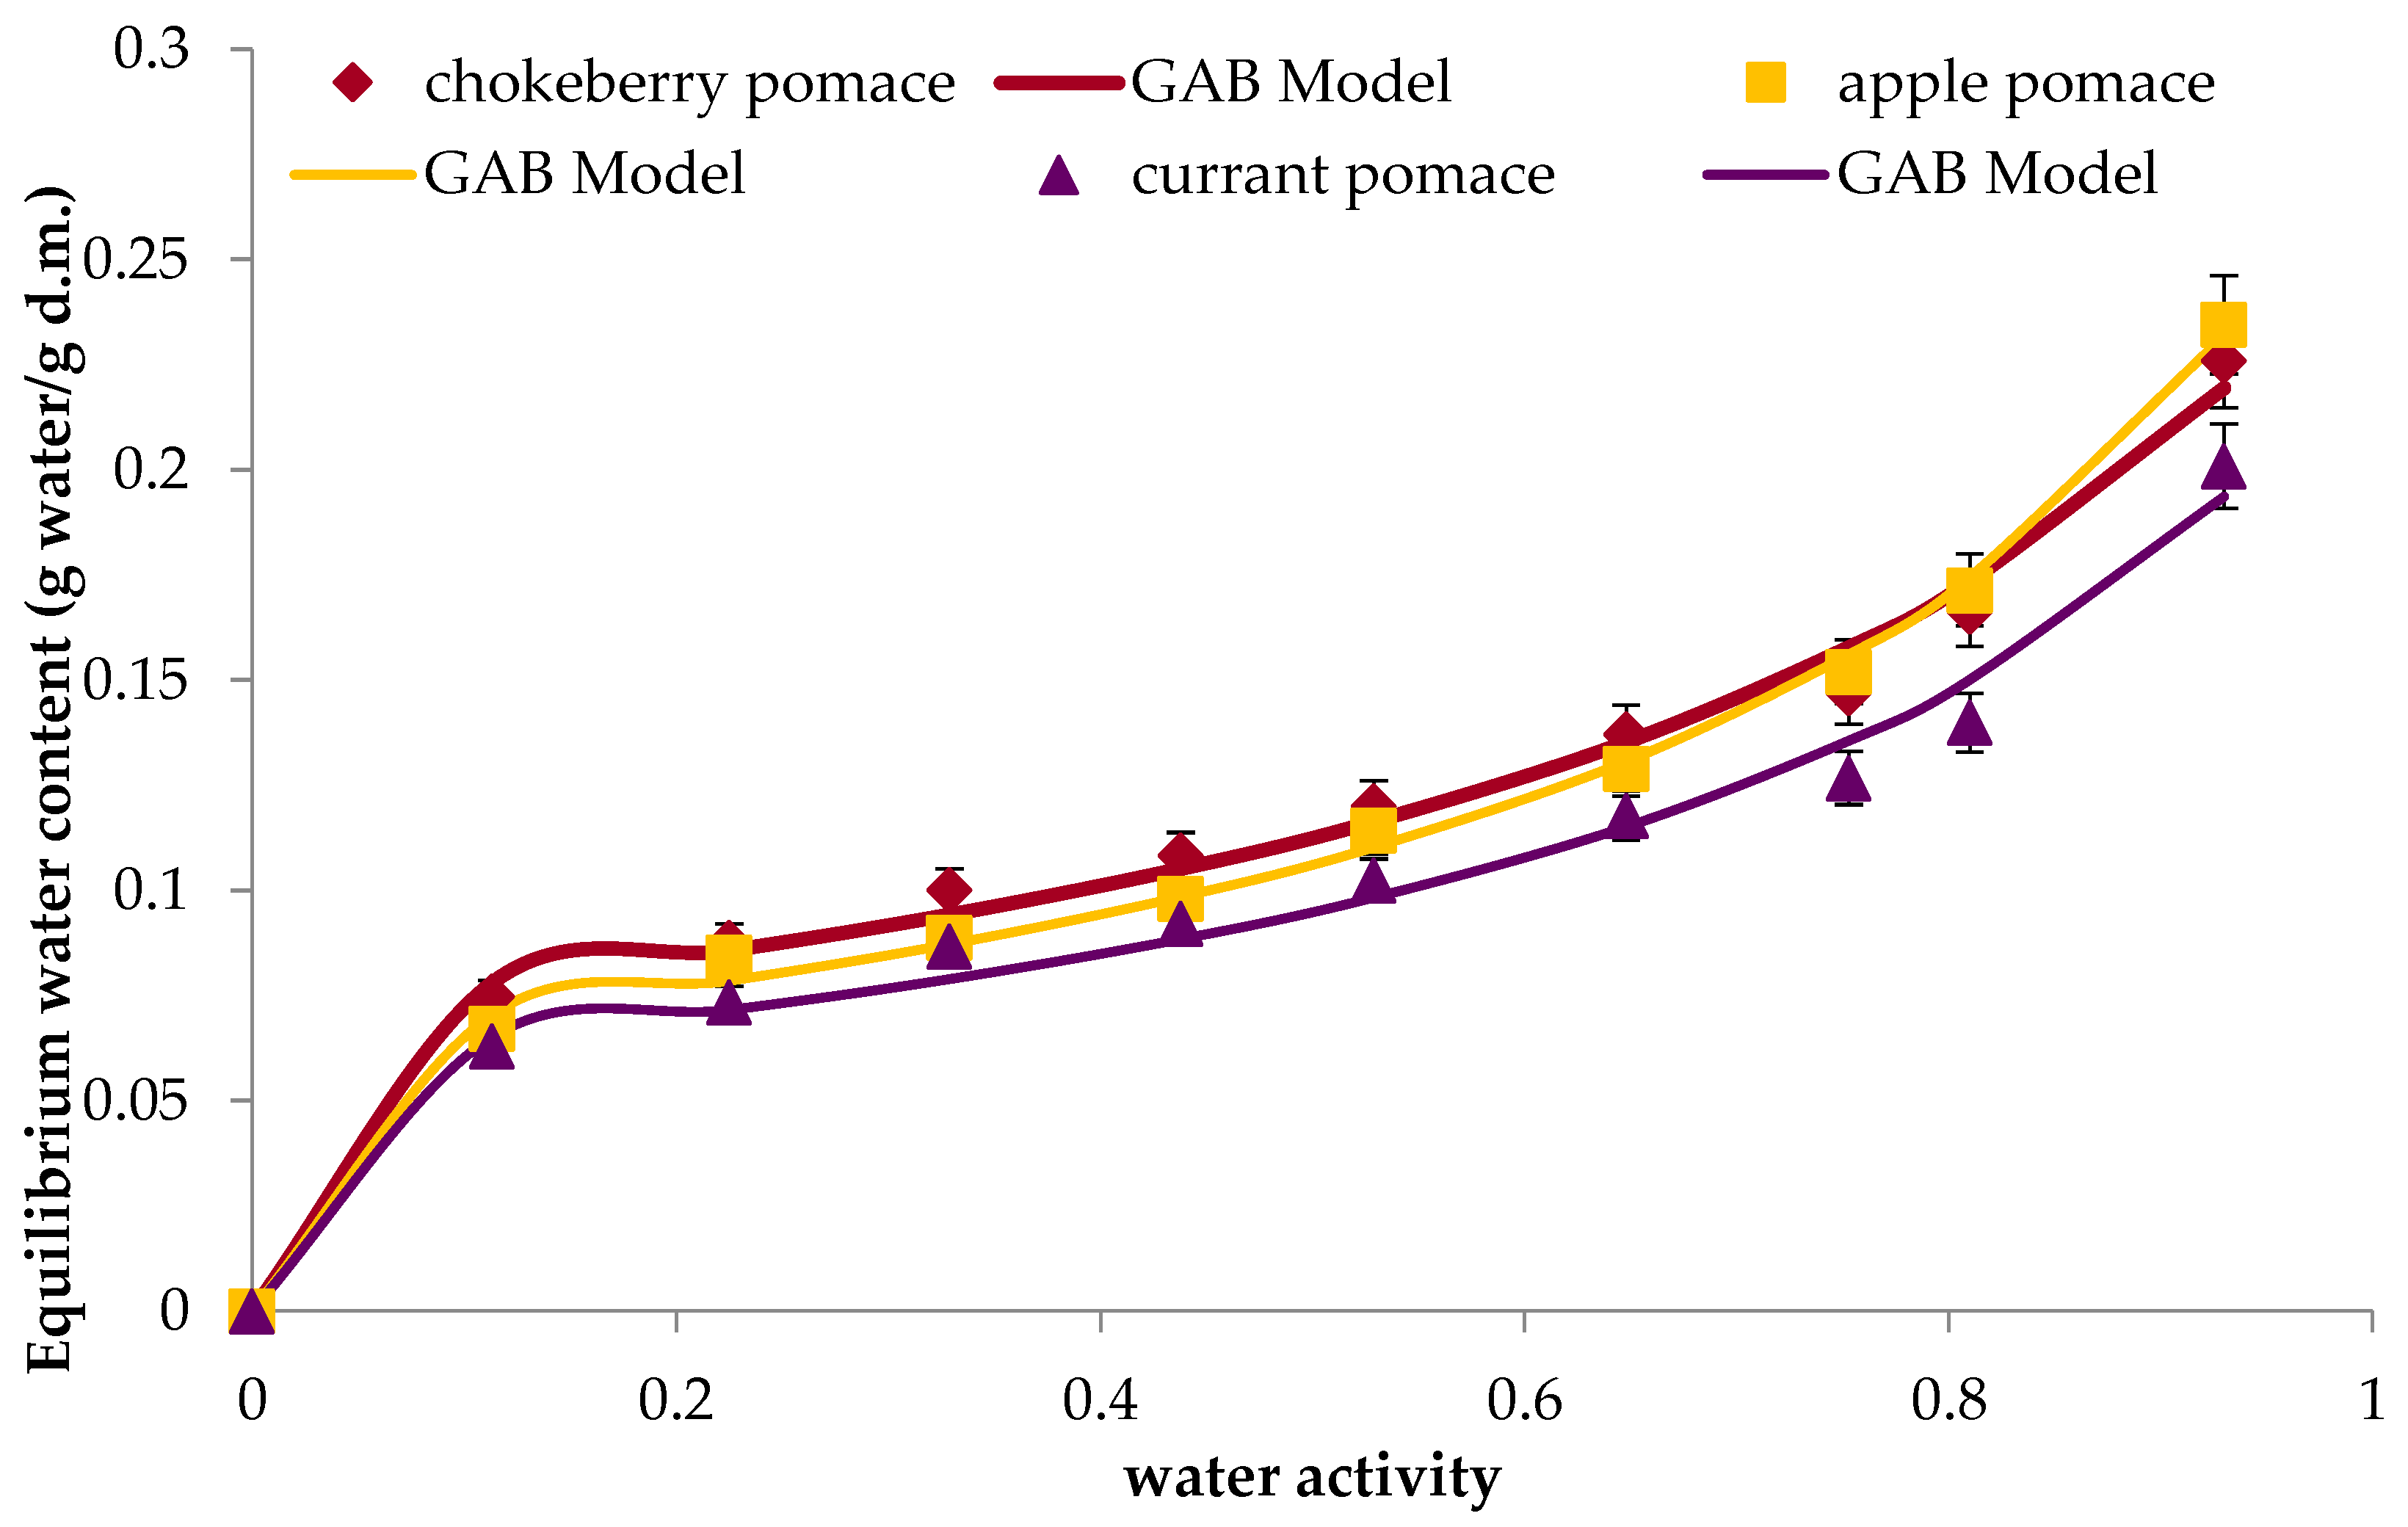
3.8. Isotherms of Water Vapour Sorption of Fruit Fibres and Pomace

Based on the results obtained, water vapour adsorption isotherms were determined. The isotherms of the studied fibres had a shape according to the classification of Brunauer et al. [29] characteristic of type III isotherms.
Based on the determined curves, it was found that apple fibre had a significantly better hygroscopic ability compared to the other tested materials (Figure 4). In an environment with a water activity of 0.93, the equilibrium water content in apple fibre was 0.21 g water/g d.m. Under the same conditions for chokeberry fibre, this value was equal to 0.18 g water/g d.m., while for fibre from currant was equal to 0.14 g water/g d.m. The tested materials in the range of water activity 0–0.438 absorbed insignificant amounts of water, while a sudden increase in equilibrium water content begins in an environment with water activity above 0.648. Figure 5 shows the course of isotherms of fibre from chokeberry, currant and apple. The GAB model was used to describe water vapour sorption isotherms, which is used to predict optimal storage conditions and storage stability of foods, which are characterised by low and medium water content. From the GAB model, the monolayer capacities and the constants C and k were calculated, which are related to the energy of interactions between the first water molecule and the further absorbed ones [30]. The capacity of a monolayer determines availability of polar sites for water vapour, and is determined by the presence of components such as starch or protein and the physical state of these components [31]. The highest water content in the monolayer, which was equal to 0.0563 g water/g d.m., was characterised by apple fibre. The smaller capacity of the monolayer was demonstrated by the other studied fibres. In fibre from chokeberries, 0.0477 g water/g d.m. was found, while in fibre from currant, there was only 0.0430 g water/g d.m. An evaluation of the suitability of the equations to describe the obtained sorption isotherms showed a good fit of the model to the experimental data. The coefficient of determination R2 was in the range (0.990–0.989), while the mean square deviation did not exceed 10% [32]. Table 1 shows the nutritional values of the tested fibres. The most hygroscopic material, apple fibre, is characterised by a higher carbohydrate content than the other fibres. In contrast, the fibre from currant, which absorbed the least water, was the poorest in sugars. The fibres in question differ in protein content, which may also affect the sorption properties. Currant fibre contains almost twice this component compared to apple fibre. Based on the results, the isotherms of vapour sorption of pomace from apple, currant and chokeberry. Based on the determined isotherms of water vapour sorption of the studied pomace, it was found that the apple pomace absorbed the highest amount of water. The differences between the tested materials were not as significant as in fibres. The equilibrium water content of the apple pomace reached a value of 0.23 g water/g d.m. in an environment with the highest water activity of 0.93. Chokeberry pomace reached a value equal to 0.22 g water/g d.m. Currant pomace showed the worst hygroscopic abilities, with an equilibrium water content of 0.20 g water/g d.m. The tested pomace absorbed a small amount of water in the water activity range of 0–0.438. A sharp increase in water adsorption of water was observed in environments with water activity above 0.648. The dependence of the equilibrium water content on water activity is shown in Figure 5.
The water vapour sorption isotherms of the pomace studied were described by the GAB model. It was found that, as in the case of fibres, the course of the isotherms has a shape similar to Type III isotherms. The highest capacity of the monolayer was shown by chokeberry pomace, which had 0.072 g water/g d.s. A lower water content was found in apple pomace (0.065 g water/g d.m.) and currant pomace (0.059 g water/g d.m.). An evaluation of the suitability of the equations to describe the obtained sorption isotherms was carried out using parameters such as the coefficient of determination (R2) and the mean deviation square (RMS). The values of the coefficient of determination (0.976–0.983) and the mean square deviation not exceeding 10% testify to the good agreement of the model fit to the experimental data (Table 7).
A study by Reißner [17] showed that the structure and composition of the chemical composition affected the sorption properties. The material studied was pomace from black and red currant, chokeberry, gooseberry and rowan. Chokeberry pomace, which contained the most carbohydrates, showed the best hygroscopic abilities.

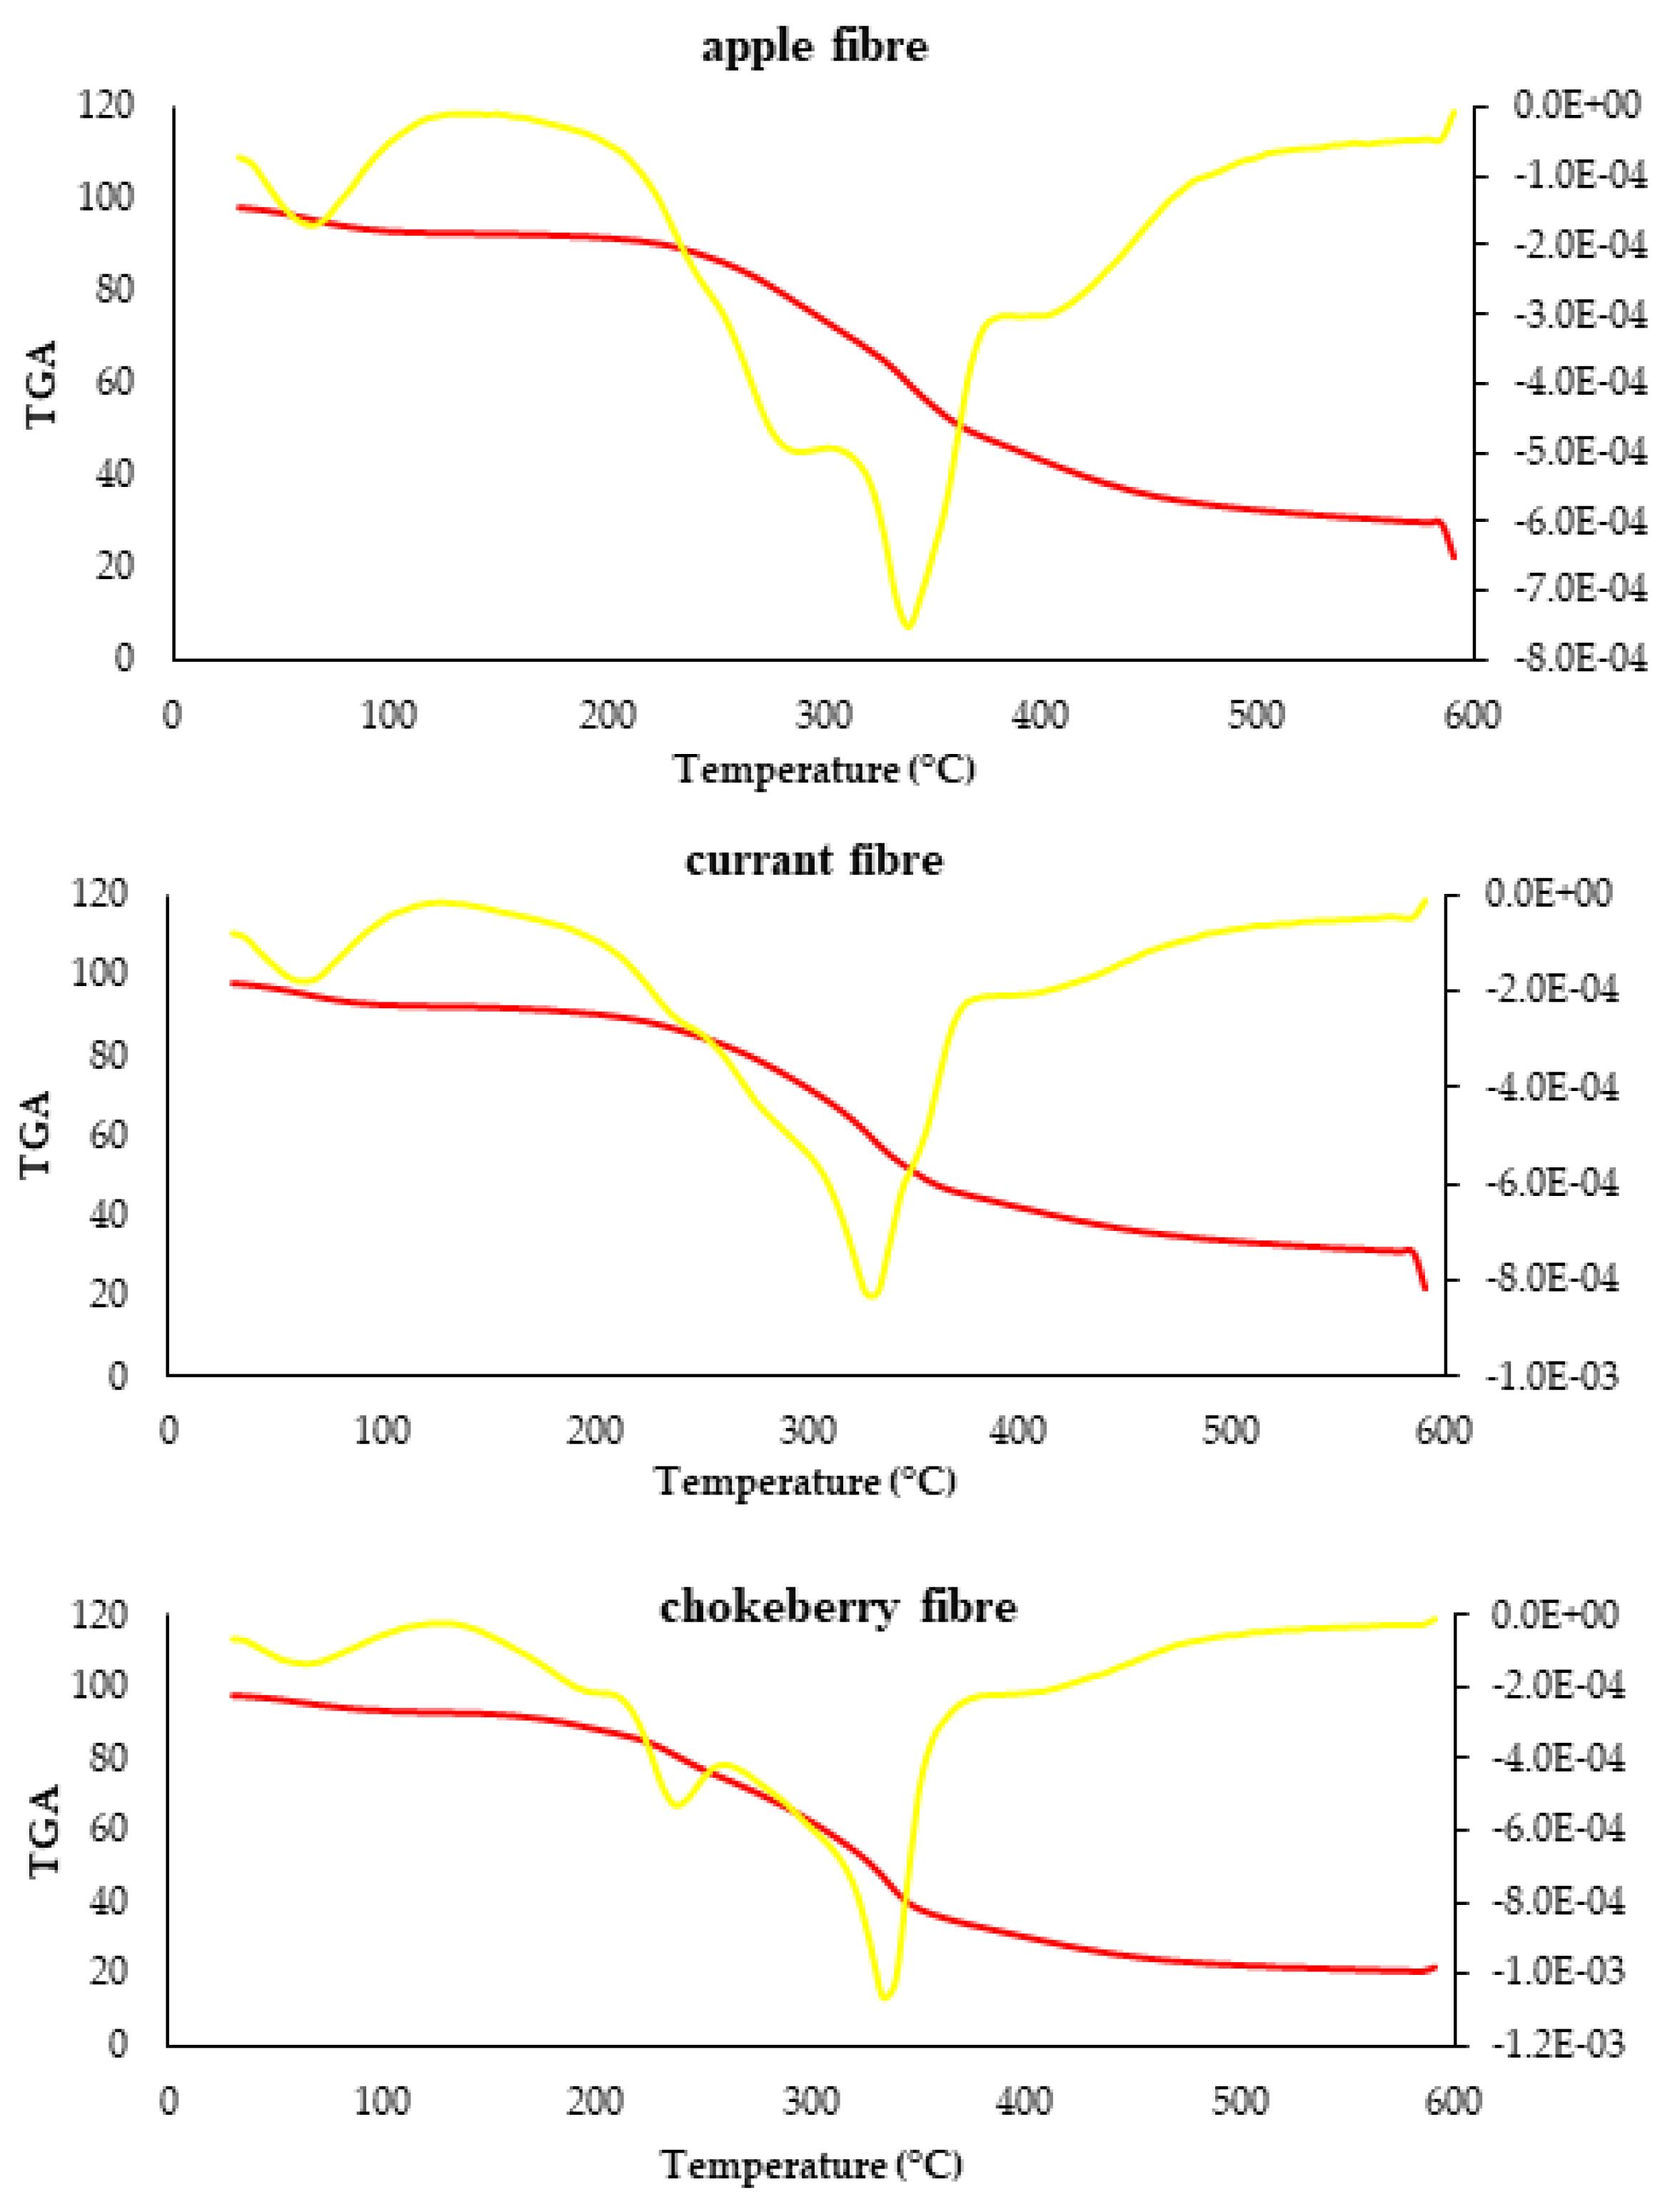
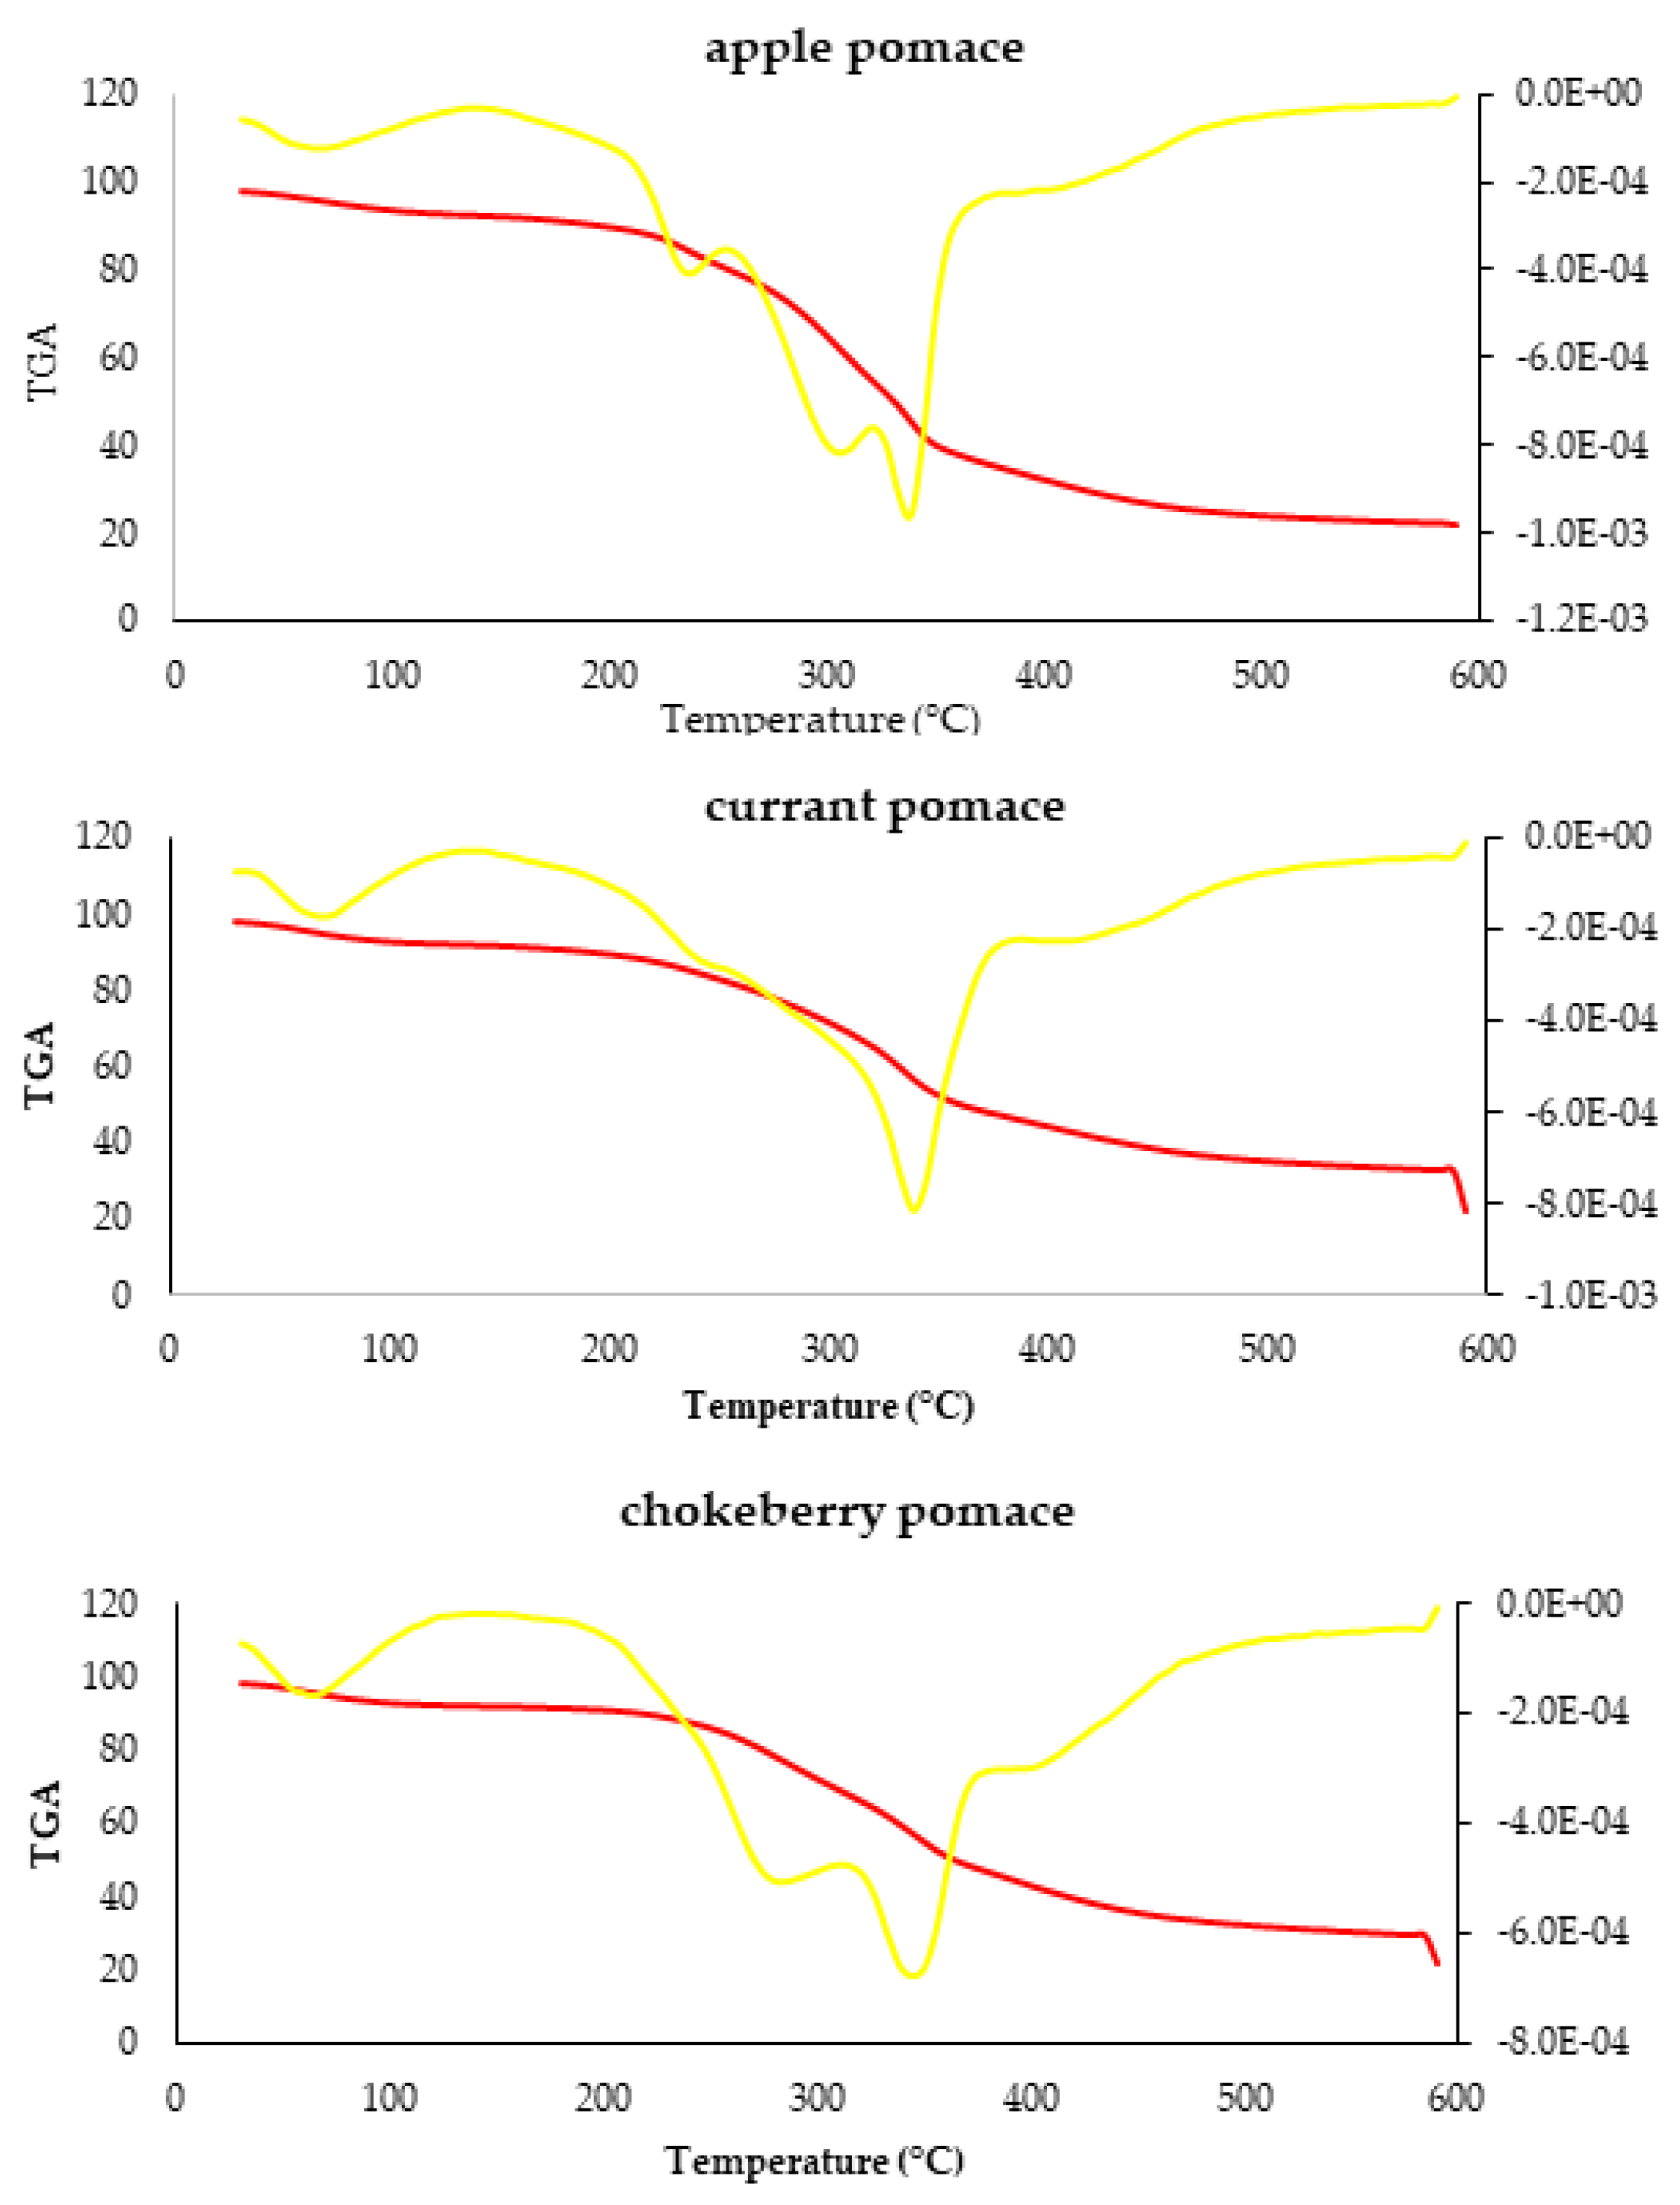
3.9. Thermal Properties of Fruit Fibres and Pomace

The thermogravimetric analysis (TGA) curves and their first derivatives (DTG) for the fibres are shown in Figure 6 and were studied to assess the thermal stability (Table 8). The dTG curves were shifted vertically for easier comparison. All the fibres analysed showed similar behaviour in the three main stages of weight loss (Figure 6). The first stage was observed up to 66 °C and was associated with the loss of adsorber and bound water. Typically, the first stage, from 25 to 200 °C, is assigned to the evaporation of water and molecular-weight molecules. The type of fibre influenced this stage. Apple fibre showed the highest temperature (66.88 °C), while currant fibre showed the lowest temperature (64.31 °C), associated with a lower thermal stability. Apple fibre showed the greatest weight loss (6.65%). In turn, apple fibre had the lowest weight loss (5.21%). In terms of weight loss, it can be observed that in the second stage, the lowest value was observed for chokeberry fibre (13.36%) and the highest for apple fibre (29.89%). Generally, the second stage, from 242.88 to 287.33 °C, is attributed to the thermal decomposition of the analysed fibres. In the third stage, all fibres showed similar low degradation temperatures, between 340.07 and 344.74 °C. However, the weight loss was 10.19% for apple fibre and ranged in the case of chokeberry fibre from 5.61 to 9.89% for currant fibre. In general, in the third stage, it is possible to observe the degradation of the carbon residues formed in the second stage, combined with the complex oxidation of these materials. In the fourth stage, all fibres showed similar degradation temperatures, ranging from 422.23 to 425.23 °C. However, the weight loss in the case of apple fibre was 5.10%, and in the case of currant fibre and chokeberry fibre, from 12.17 to 12.31%.
Thermogravimetric analysis (TGA) curves and their first derivatives (dTG) for the pomace are shown in Figure 7 and were examined to assess thermal stability (Table 8). For easier comparison, the dTG curves have been shifted vertically. It can be seen that all analysed pomace showed similar behaviour in the three main stages of weight loss (Figure 7). The first stage was observed up to a temperature of 67 °C and was associated with the loss of adsorber and bound water. Typically, the first stage, from 25.00 to 200.00 °C, evaporates water and molecular-weight molecules. The type of fibre influenced this stage. The highest temperature was recorded by apple pomace (67.32 °C), and the lowest was recorded by chokeberry pomace (66.54 °C), associated with a lower thermal stability. The greatest weight loss was shown by apple fibres (3.89%). In turn, chokeberry fibre showed the lowest weight loss (6.14%). In terms of weight loss, it can be observed that in the second stage, the lowest value was observed for chokeberry pomace (14.25%) and the highest for apple fibre (24.31%). Generally, the second stage, from 242.45 to 288.30 °C, is attributed to the thermal decomposition of the analysed pomace. In the third stage, all pomace showed similarly low degradation temperatures, ranging from 343.32 to 453.96 °C. However, the weight loss in the case of currant was 7.82%, and in the case of chokeberry pomace and apple pomace, it ranged from 4.21 to 4.76%. In the fourth stage, all pomace showed similar degradation temperatures, ranging from 418.42 to 430.22 °C. However, the weight loss in the case of chokeberry pomace was 15.19%, and in the case of currant pomace and apple pomace, from 7.89 to 10.03%.
Similar results of thermal analysis of pomace were obtained by Fidriyanto et al. [33]. Apple pomace showed an initial weight loss (1.00 to 4.00%) at temperatures of 70.00–12.00 °C. The second degradation stage (193.00–400.00 °C) had a significant weight loss (up to 65.00%) due to the degradation of polysaccharides and lipids and strong reactions such as dehydroxylation, deoxygenation or decarboxylation. The third stage (400.00–700.00 °C) resulted in complete weight loss attributed to the degradation of cellulose or the degradation of substances resulting from the polymerisation of degradation products produced in the earlier stages. Also, in the study by Tulej et al. [34], characteristic peaks were observed for pectins and hemicelluloses with maxima ranging from 186.00 to 215.00 °C and 235.00 to 237.00 °C, respectively. Weight loss over this temperature range ranged from 18.00 to 23.00%. In the study by Afrin et al. [35], weight loss was not significant below 150.00 °C, and the first weight loss was evident between 150.00 and 200.00 °C. This weight change was due to moisture loss and other volatile components, such as oils, pigments. The second weight loss could be observed between 250.00 and 400.00 °C and corresponded to the degradation of cellulose and hemicelluloses. The weight loss was not significant after 700.00 °C.

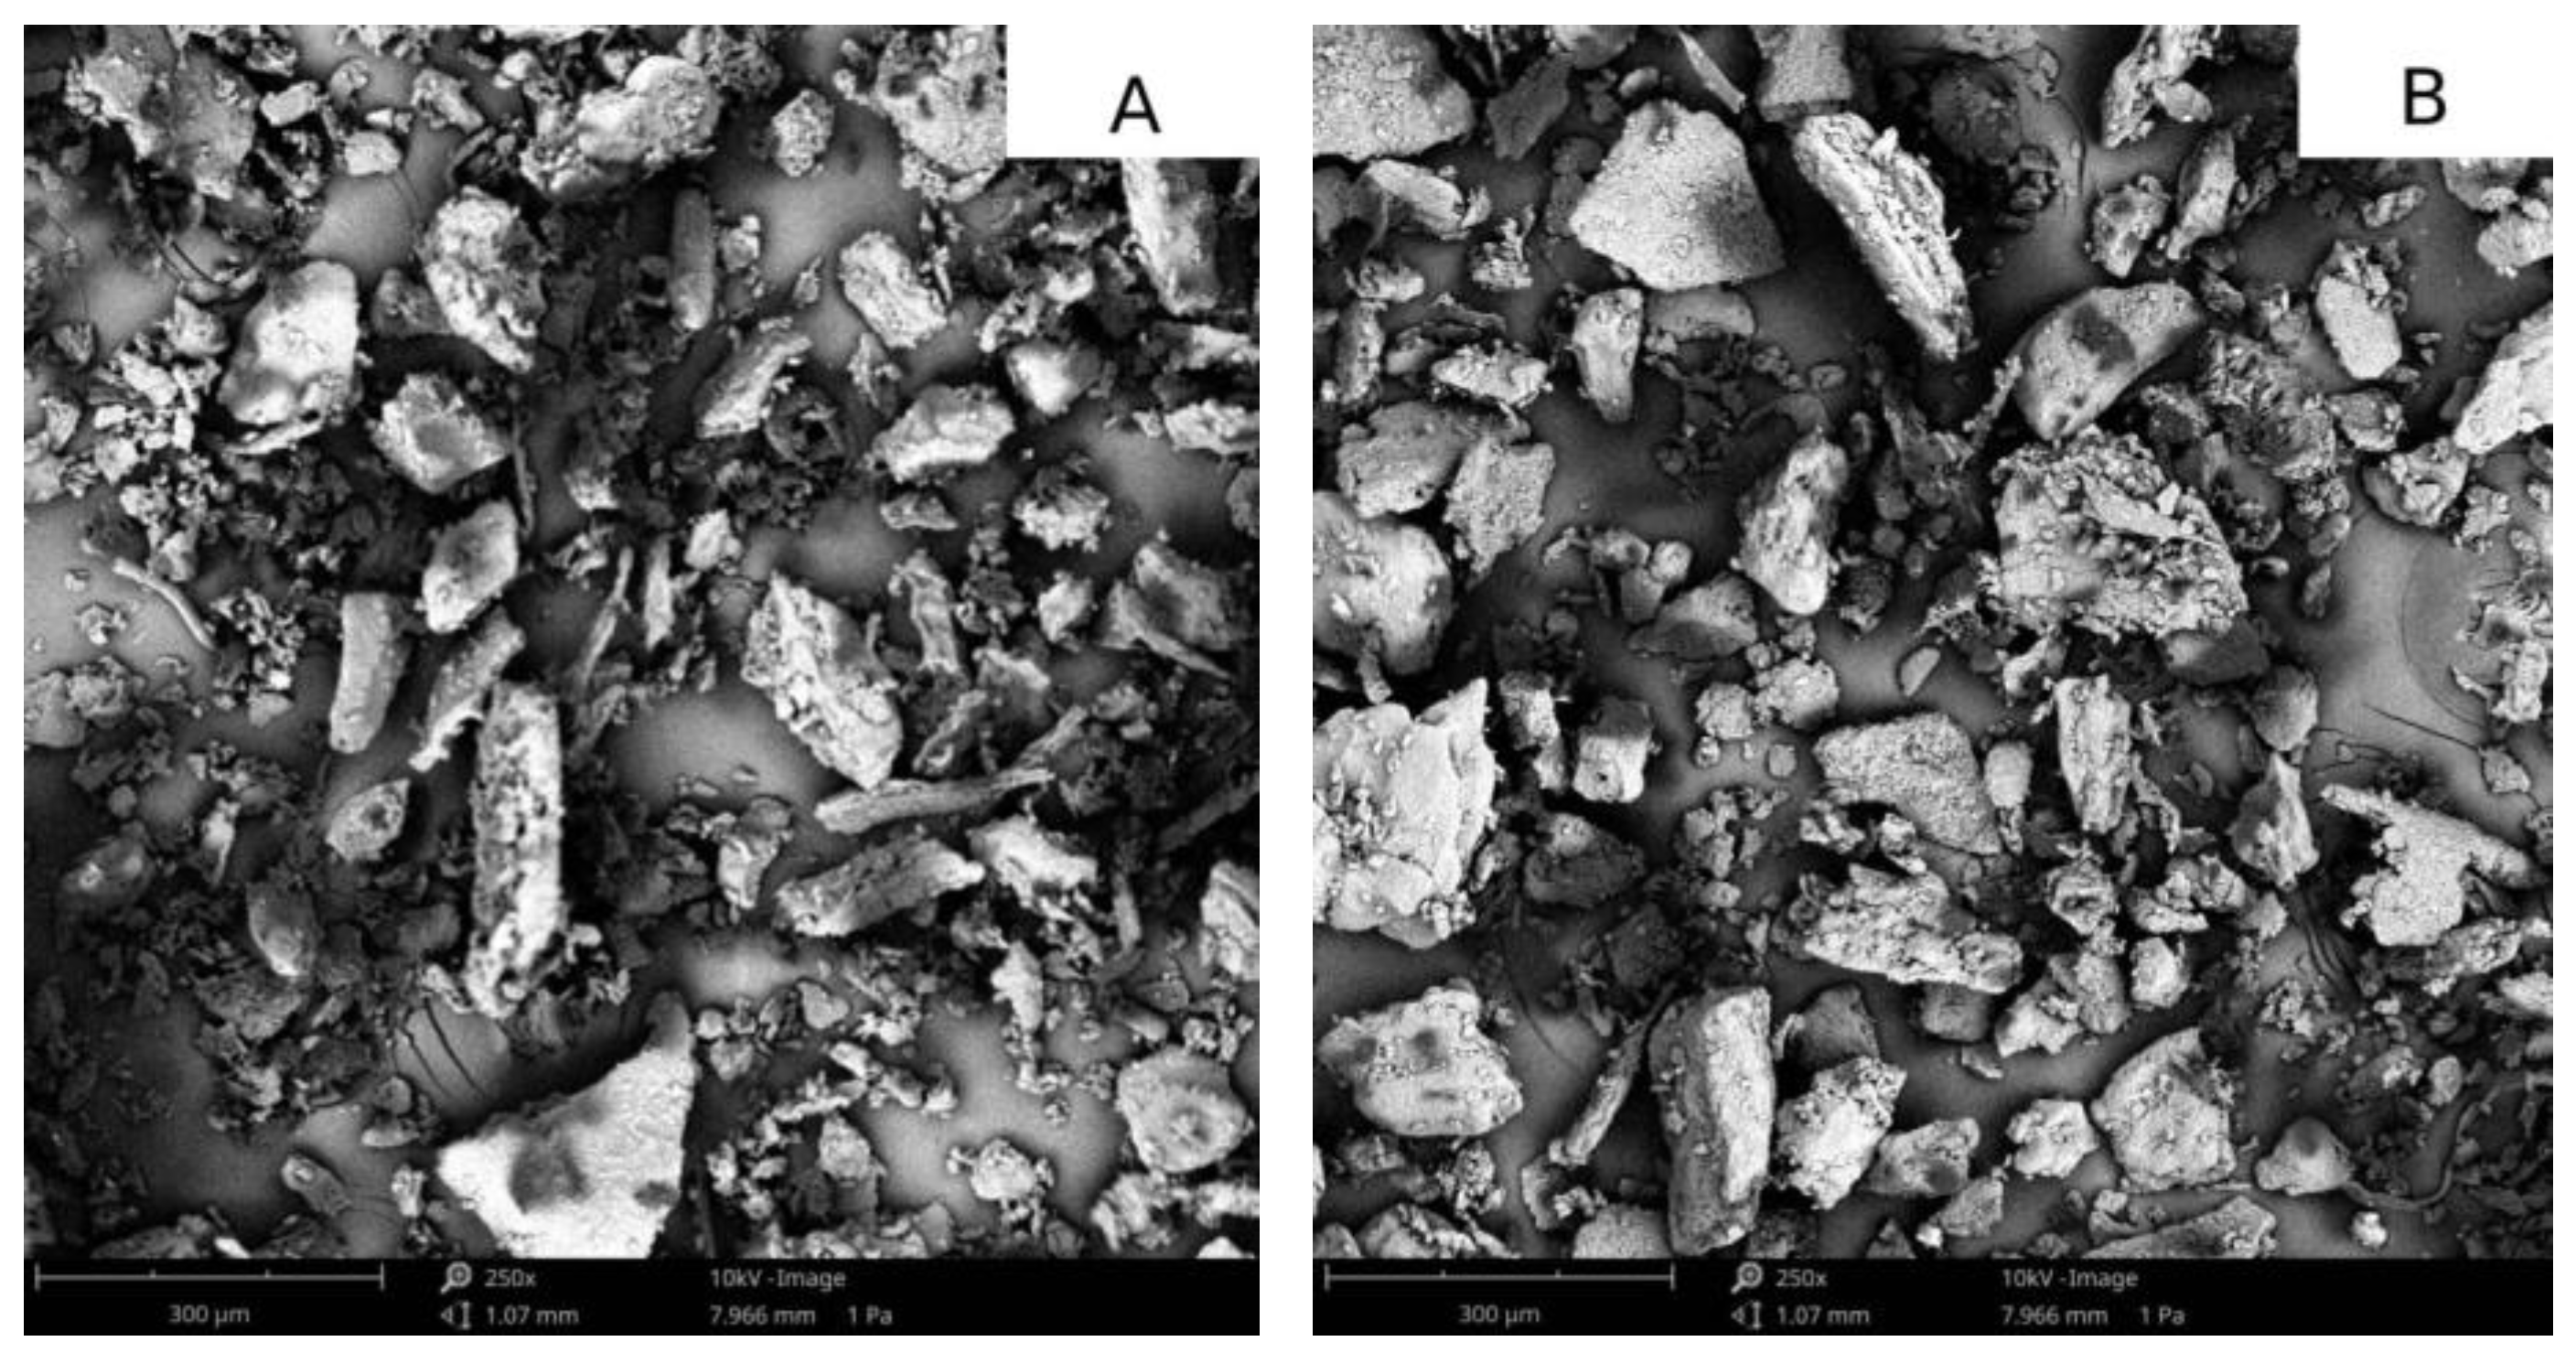
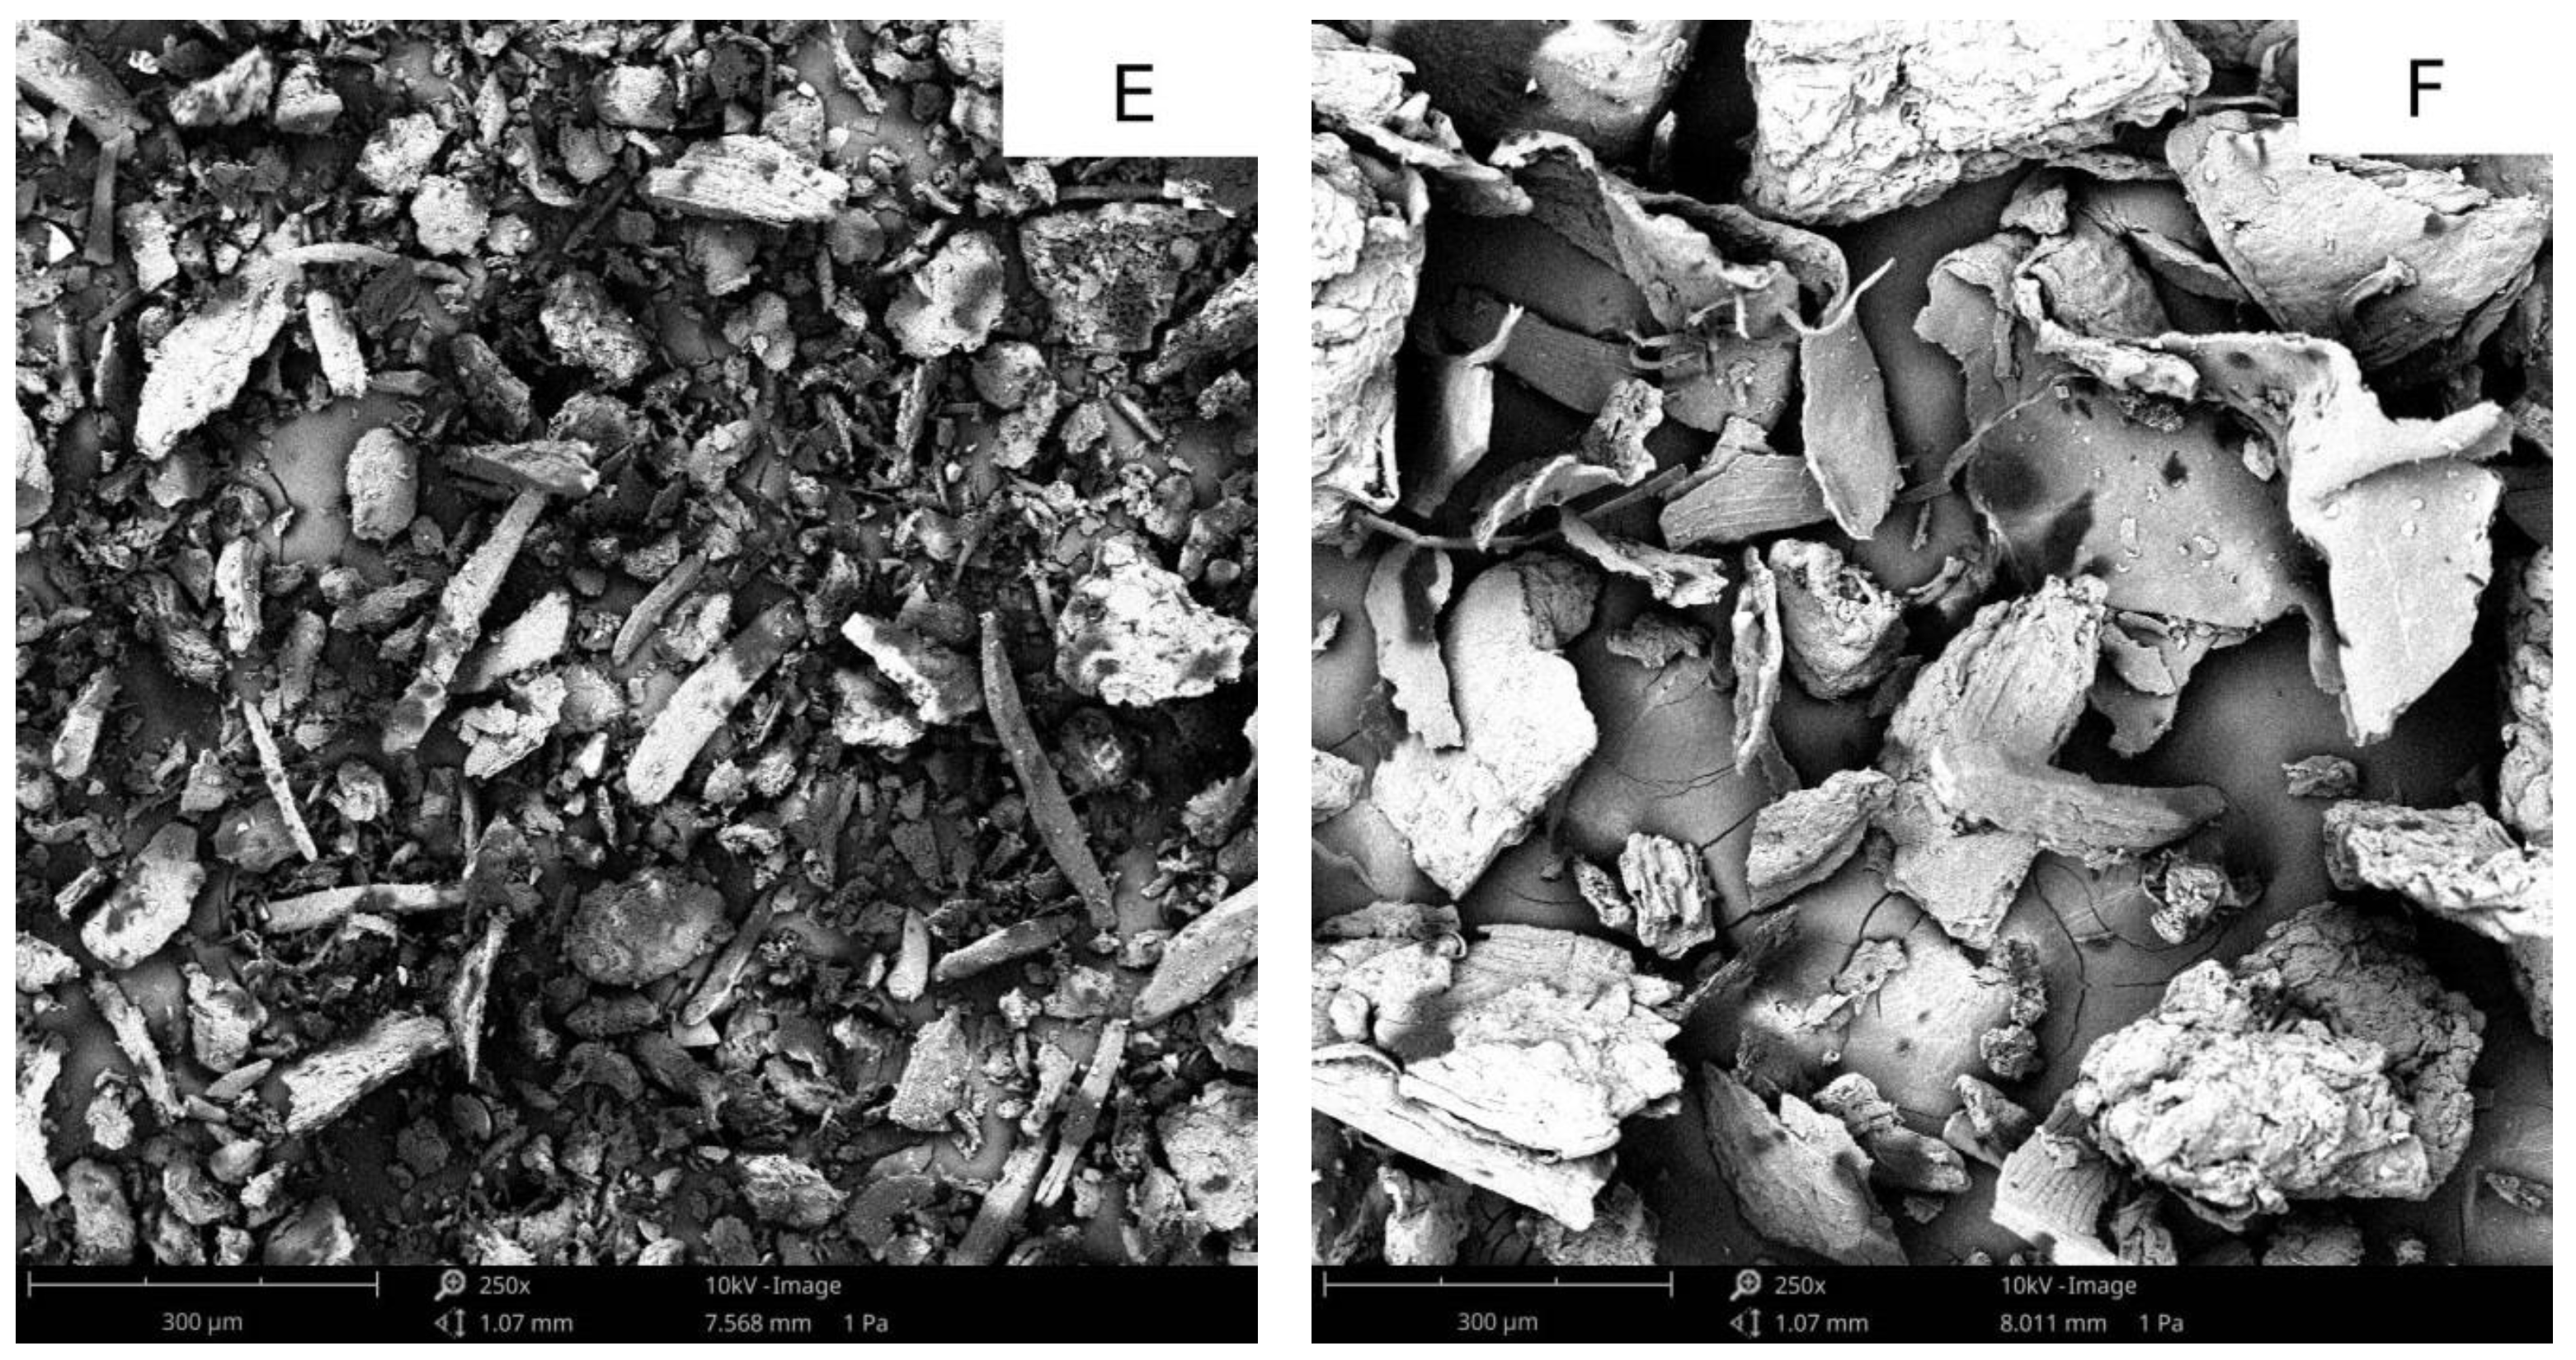
3.10. Microstructure of Fruit Fibres and Pomace

Electron microscopy was used to study the microstructure of the pomace and fibres studied. The resulting image is shown in Figure 8, Figure 9 and Figure 10. Microscopic photographs showed that the fibre and chokeberry pomace had a similar structure. The size and shape of the particles were similar to each other. Different shapes of the particles can be observed, which is attributed to the milling process. Image materials are related to the method used to grind the material. The particles of the apple fibre were significantly smaller compared to the pomace. This is probably due to different chemical composition, such as the higher content of pectin in comparison to other samples. The largest difference in structure was noted in the fibre and pomace derived from currant. The fibre had smaller particles, much of which assumed an elongated shape. An irregular shape characterized the particles of the currant pomace; their size was much larger than that of the fibre. O’Shea et al. [36] observed the structure of apple and orange pomace based on images taken with an electron microscope at magnifications of 250 to 5000. The microscopic images showed that the apple powder contained granules of starch, which were visible as dark particles.

4. Conclusions

This study examined fibres and pomace from chokeberry, currant and apples. The physical properties of the powders, such as water content, water activity, colour, apparent and bulk density and microstructure, were studied. The most important point of the work was the thermogravimetric analysis and sorption properties of the materials studied. The determined kinetic curves, rate dependence curves and water vapour sorption isotherms made it possible to learn about the hygroscopic abilities of the materials studied. The chemical composition of the studied fibres and fruit pomace influenced the hygroscopic capacity. Pomace had a higher water content compared to the fibres. Chokeberry pomace showed the highest water content value, whereas chokeberry fibre had the highest water activity. All powders tested had water activity below 0.6, meaning that they were not exposed to the growth of microorganisms.
Fibres were characterized by higher values of parameter L* which are responsible for colour lightness. Currant and chokeberry pomace and fibres had a higher proportion of red colour—parameter a*—while pomace and fibre from apples had a higher b* colour parameter, which accounts for yellow colour. Fibre and currant pomace showed the highest apparent density. Currant pomace and apple fibre had the highest bulk density value apple pomace. The tested materials were characterised by good or very good flowability and low-to-medium cohesion. Fibre and apple pomace showed the fastest water vapour adsorption, indicating that the highest hygroscopicity characterised them. The speed of water vapour adsorption was influenced by the water content: the lower the water content, the faster the water vapour adsorption. According to the course of the sorption, isotherms had a shape characteristic of type III isotherms. Apple fibre and pomace demonstrated the best hygroscopic abilities. Regarding thermogravimetric analysis, all pomace and fibres showed similar behaviour in the three main stages of weight loss. However, the weight loss and temperatures differ due to the chemical composition. Observation of microscopic images made it possible to conclude that the structure of apple fibre and pomace are similar to each other. The powders’ structure from currant differed significantly: fibre had smaller particles with an elongated shape. At the same time, pomace was characterised by large particles with an irregular shape.

Author Contributions

Conceptualisation, S.G.; methodology, S.G.; software, A.P., L.K. and S.G.; validation, S.G.; formal analysis, L.K.; investigation, A.P., L.K. and S.G.; resources, A.P., L.K. and S.G.; data curation, A.P., L.K. and S.G.; writing—original draft preparation, A.P. and S.G.; writing—review and editing, A.P., L.K. and S.G.; visualisation, S.G.; supervision, S.G.; project administration, S.G.; funding acquisition, S.G. All authors have read and agreed to the published version of the manuscript.

Funding

This research received no external funding.

Institutional Review Board Statement

Not applicable.

Informed Consent Statement

Not applicable.

Data Availability Statement

The raw data supporting the conclusions of this article will be made available by the authors on request.

Acknowledgments

The authors thank Greenfield Sp. Z o.o. for providing fruit fibres and pomace for the research, and Katarzyna Rybak for helping conduct the thermogravimetric analysis.

Conflicts of Interest

The authors declare no conflicts of interest.

References

  1. Kalmykova, Y.; Sadagopan, M.; Rosado, L. Circular economy—From review of theories and practices to development of implementation tools. Resour. Conserv. Recycl. 2018, 135, 190–201. [Google Scholar] [CrossRef]
  2. Hereu-Morales, J.; Segarra, A.; Valderrama, C. The European (Green?) Deal: A systematic analysis of environmental sustainability. Sustain. Dev. 2024, 32, 647–661. [Google Scholar] [CrossRef]
  3. Kara, S.; Hauschild, M.; Sutherland, J.; McAloone, T. Closed-loop systems to circular economy: A pathway to environmental sustainability? CIRP Ann. 2022, 71, 505–528. [Google Scholar] [CrossRef]
  4. Chavan, P.; Singh, A.K.; Kaur, G. Recent progress in the utilization of industrial waste and by-products of citrus fruits: A review. J. Food Process Eng. 2018, 41, 8. [Google Scholar] [CrossRef]
  5. Nirmal, N.P.; Khanashyam, A.C.; Mundanat, A.S.; Shah, K.; Babu, K.S.; Thorakkattu, P.; Pandiselvam, R. Valorization of fruit waste for bioactive compounds and their applications in the food industry. Foods 2023, 12, 556. [Google Scholar] [CrossRef]
  6. Plakantonaki, S.; Roussis, I.; Bilalis, D.; Priniotakis, G. Dietary fiber from plant-based food wastes: A comprehensive approach to cereal, fruit, and vegetable waste valorization. Processes 2023, 11, 1580. [Google Scholar] [CrossRef]
  7. Campos, D.A.; Gómez-García, R.; Vilas-Boas, A.A.; Madureira, A.R.; Pintado, M.M. Management of fruit industrial by-products—A case study on circular economy approach. Molecules 2020, 25, 320. [Google Scholar] [CrossRef]
  8. Dreher, M.L. Whole fruits and fruit fiber emerging health effects. Nutrients 2018, 10, 1833. [Google Scholar] [CrossRef] [PubMed]
  9. Hussain, S.; Jõudu, I.; Bhat, R. Dietary fiber from underutilized plant resources—A positive approach for valorization of fruit and vegetable wastes. Sustainability 2020, 12, 5401. [Google Scholar] [CrossRef]
  10. Cui, J.; Lian, Y.; Zhao, C.; Du, H.; Han, Y.; Gao, W.; Xiao, H.; Zheng, J. Dietary fibers from fruits and vegetables and their health benefits via modulation of gut microbiota. Compr. Rev. Food Sci. Food Saf. 2019, 18, 1514–1532. [Google Scholar] [CrossRef]
  11. Skwarek, P.; Karwowska, M. Fruit and vegetable processing by-products as functional meat product ingredients-a chance to improve the nutritional value. LWT 2023, 189, 115442. [Google Scholar] [CrossRef]
  12. Kruczek, M.; Drygaś, B.; Habryka, C. Pomace in fruit industry and their contemporary potential application. World Sci. News 2016, 48, 259–265. [Google Scholar]
  13. Katnić, Đ.; Marinović-Cincović, M.; Porobić, S.J.; Vujčić, I.; Šaponjić, A.; Sikirić, B.; Živojinović, D. Characterization and kinetics of thermal decomposition behavior of plum and fig pomace biomass. J. Clean. Prod. 2022, 352, 131637. [Google Scholar] [CrossRef]
  14. Spiess, W.E.L.; Wolf, W. Critical evaluation of methods to determine moisture sorption isotherms. In Water Activity; Theory and Applications to Food: Boca Raton, FL, USA, 1987. [Google Scholar]
  15. Lewicki, P.P. The applicability of the GAB model to food water sorption isotherm. Int. J. Food Sci. Technol. 1997, 32, 553–557. [Google Scholar] [CrossRef]
  16. OstroVIT 1. Available online: https://ostrovit.com/pl/products/ostrovit-blonnik-z-aronii-vege-200-g-25736.html?utm_source=iai_ads&utm_medium=google_shopping&curr=PLN (accessed on 31 January 2024).
  17. OstroVIT 2. Available online: https://ostrovit.com/pl/products/ostrovit-blonnik-jablkowy-vege-200-g-25738.html?query_id=1 (accessed on 31 January 2024).
  18. OstroVIT 3. Available online: https://ostrovit.com/pl/products/ostrovit-blonnik-z-czarnej-porzeczki-vege-150-g-25737.html?query_id=1 (accessed on 31 January 2024).
  19. Witczak, T.; Stępień, A.; Gumul, D.; Zięba, T.; Witczak, M. The influence of the extrusion proces with a minimal addition of corn meal on selected properties of fruit pomaces. J. Food Process Eng. 2020, 43, 4. [Google Scholar] [CrossRef]
  20. Reißner, A.M.; Al-Hamimi, S.; Quiles, A.; Schmidt, C.; Struck, S.; Hernando, I.; Turnerb, C.; Rohm, H. Composition and physicochemical properties of dried berry pomace. J. Sci. Food Agric. 2019, 99, 1284–1293. [Google Scholar] [CrossRef]
  21. Labuza, T.P.; Altunakar, B. Water activity prediction and moisture sorption isotherms. In Water Activity in Foods: Fundamentals and Applications; John Wiley & Sons, Inc.: Hoboken, NJ, USA, 2020; pp. 161–205. [Google Scholar] [CrossRef]
  22. Alongi, M.; Melchior, S.; Anese, M. Reducing the glycemic index od short dough biscuit by using apple pomace as a functional ingredient. LWT Food Sci. Technol. 2018, 100, 300–305. [Google Scholar] [CrossRef]
  23. Brika, S.E.; Letenneur, M.; Dion, C.A.; Brailovski, V. Influence of particle morphology and size distribution on the powder flowability and laser powder bed fusion manufacturability of Ti-6Al-4V alloy. Addit. Manuf. 2020, 31, 100929. [Google Scholar] [CrossRef]
  24. Samborska, K.; Wiktor, A.; Jedlińska, A.; Matwijczuk, A.; Jamróz, W.; Skwarczyńska-Maj, K.; Kiełczewski, D.; Tułodziecki, M.; Błażowski, Ł.; Witrowa-Rajchert, D. Development and characterization of physical properties of honey-rich powder. Food Bioprod. Process. 2019, 115, 78–86. [Google Scholar] [CrossRef]
  25. Rosland Abel, S.E.; Yusof, Y.A.; Chin, N.L.; Chang, L.S.; Ghazali, H.M.; Ghani, M.A.; Ishak, I. The effect of particle size on the physical properties of Arabic gum powder. J. Food Process Eng. 2020, 43, 4. [Google Scholar] [CrossRef]
  26. Witczak, T.; Stępień, A.; Gumul, D.; Witczak, M.; Fiutak, G.; Zięba, T. The influence of the extrusion process on the nutritional composition, physical properties and storage stability of black chokeberry pomaces. Food Chem. 2021, 334, 127548. [Google Scholar] [CrossRef] [PubMed]
  27. Chojnacki, J.; Zdanowicz, A.; Ondruška, J.; Šooš, Ľ.; Smuga-Kogut, M. The Influence of apple, carrot and red beet pomace content on the properties of pellet from barley straw. Energies 2021, 14, 405. [Google Scholar] [CrossRef]
  28. Li, X.; Bi, J.; Jin, X.; Wu, X.; Lyu, J.; Li, X.; Hu, L. Effect of the moisture equilibrium process on the expansion behavior of instant controlled pressure drop (DIC) drying of dried apple cubes. J. Sci. Food Agric. 2020, 100, 1635–1642. [Google Scholar] [CrossRef]
  29. Brunauer, S.; Deminig, L.S.; Deming, W.E.; Teller, E. On the theory of the van der Waals adsorption of gases. J. Am. Chem. Soc. 1940, 62, 1723–1732. [Google Scholar] [CrossRef]
  30. Wang, Y.; Hu, L. Evaluation of the BET and GAB models for interpretation of soil water isotherms: A molecular simulation study. Comput. Geotech. 2023, 159, 105454. [Google Scholar] [CrossRef]
  31. Machado, C.M.; Benelli, P.; Tessaro, I.C. Study of interactions between cassava starch and peanut skin on biodegradable foams. Int. J. Biol. Macromol. 2020, 147, 1343–1353. [Google Scholar] [CrossRef] [PubMed]
  32. Cazzaniga, A.; Brousse, M.M.; Linares, R.A. Evaluation of sorption isotherms in snacks with pregelatinized cassava. Repos. Español Cienc. Y Tecnol. A 2022, 24, 28–35. [Google Scholar] [CrossRef]
  33. Fidriyanto, R.; Singh, B.P.; Manju, K.M.; Widyastuti, Y.; Goel, G. Multivariate analysis of structural and functional properties of fibres from apple pomace using different extraction methods. FoodProd. Process. Nutr. 2023, 5, 6. [Google Scholar] [CrossRef]
  34. Tulej, W.; Głowacki, S. Analysis of material-characterization properties of post-production waste—The case of apple pomace. Materials 2022, 15, 3532. [Google Scholar] [CrossRef]
  35. Afrin, S.M.; Acharjee, A.; Sit, N. Convective drying of orange pomace at different temperatures and characterization of the obtained powders. J. Food Sci. Technol. 2022, 59, 1040–1052. [Google Scholar] [CrossRef]
  36. O’shea, N.; Ktenioudaki, A.; Smyth, T.P.; McLoughlin, P.; Doran, L.; Auty MA, E.; Arendt, E.; Gallagher, E. Physicochemical assessment of two fruit by-products as functional ingredients: Apple and orange pomace. J. Food Eng. 2015, 153, 89–95. [Google Scholar] [CrossRef]
Figure 1. Photo of the analyzed pomace and fruit fibres.
Applsci 14 09051 g001
Figure 2. Water vapour kinetic curves of the time dependence of the amount of absorbed water in the tested fruit fibres.
Applsci 14 09051 g002
Figure 3. Kinetic curves of the dependence of the amount of absorbed water on the time of the tested fruit pomace.
Applsci 14 09051 g003
Figure 4. Water vapour sorption isotherms of the studied fibres.
Applsci 14 09051 g004
Figure 5. Water vapour sorption isotherms of the studied fruit fibre and pomace.
Applsci 14 09051 g005
Figure 6. The thermogravimetric analysis (TGA) (red) and derivative thermogravimetry (dTG) (yellow) of the selected fruit fibres.
Applsci 14 09051 g006
Figure 7. The thermogravimetric analysis (TGA) (red) and derivative thermogravimetry (dTG) (yellow) of the selected fruit pomace.
Applsci 14 09051 g007
Figure 8. Microscopic photographs of chokeberry fibre (A) and pomace (B).
Applsci 14 09051 g008
Figure 9. Microscopic photographs of apple fibre (C) and pomace (D).
Applsci 14 09051 g009
Figure 10. Microscopic photographs of the fibre (E) and pomace (F) of currant.
Applsci 14 09051 g010
Table 1. Nutritional values of chokeberry, apple and currant fibre [16,17,18].
Nutritional Value
per 100 g
Chokeberry FibreApple FibreCurrant Fibre
Energy value111 kJ/270 kcal1105 kJ/268 kcal1084 kJ/264 kcal
Fat
—saturated
4.5 g
0.4 g
3.2 g
0.6 g
5.0 g
1.1 g
Carbohydrates
—sugars
17.4 g
16.7 g
24.0 g
13.7 g
12.0 g
5.3 g
Fibre62.0 g60.0 g65.5 g
Protein9.0 g5.8 g10.5 g
Salt0.000 g0.001 g0.000 g
Table 2. The water content of the studied fibres and fruit pomace.
SampleWater Content (g/g d.m.)
chokeberry fibre0.0550 ± 0.0006 b
apple fibre0.0402 ± 0.0012 a
currant fibre0.0381 ± 0.0006 c
chokeberry pomace0.0798 ± 0.0128 a
apple pomace0.0713 ± 0.0009 e
currant pomace0.0768 ± 0.0005 d
The same letters next to the values (a–e) signify the absence of statistically significant differences (p < 0.05).
Table 3. Water activity in the tested fibres and fruit pomace.
SampleWater Activity
chokeberry fibre0.424 ± 0.000
apple fibre0.341 ± 0.000
currant fibre0.324 ± 0.000
chokeberry pomace0.321 ± 0.000
apple pomace0.327 ± 0.000
clack currant pomace0.364 ± 0.000
Table 4. L*, a*, b* colour parameters for the tested fibres and fruit pomace.
SampleL*a*b*
chokeberry fibre42.16 ± 0.25 c12.70 ± 0.08 e4.73 ± 0.03 c
chokeberry pomace36.54 ± 0.25 a8.53 ± 0.11 b4.38 ± 0.08 b
apple fibre69.08 ± 0.26 f8.05 ± 0.11 a24.29 ± 0.25 f
apple pomace57.35 ± 0.71 e9.22 ± 0.22 c21.81 ± 0.21 e
currant fibre48.18 ± 1.11 d14.41 ± 0.43 f5.37 ± 0.11 d
currant pomace37.71 ± 0.31 b11.60 ± 0.27 d3.91 ± 0.15 a
The same letters next to the values (a–f) indicate the absence of statistically significant differences (p < 0.05).
Table 5. Apparent density, bulk loose density (pL), bulk shaken density (pT), Hausner ratio (HR) and Carr’s index (CI) of selected pomace and fibres.
SampleDensity
(g/cm3)
Bulk Density Lose (g/cm3)Bulk Density Shaken (g/cm3)Hausner RatioCarr’s Index
chokeberry fibre1.3669 ± 0.0014 c0.4537 ± 0.0059 b0.5427 ± 0.0064 b1.1964 ± 0.0208 ab16.40 ± 1.44 ab
apple fibre1.3747 ± 0.0014 c0.5146 ± 0.0155 c0.6225 ± 0.0005 c1.2104 ± 0.0371 c17.33 ± 2.57 b
currant fibre1.4671 ± 0.0037 f0.4822 ± 0.0105 b0.5572 ± 0.0061 b1.1557 ± 0.0134 ab13.47 ± 1.01 ab
chokeberry pomace1.3463 ± 0.0029 a0.5261 ± 0.0050 c0.6293 ± 0.0003 c1.1962 ± 0.0057 ab16.40 ± 0.40 ab
apple pomace1.4219 ± 0.0026 d0.4620 ± 0.0155 b0.5447 ± 0.0113 b1.1795 ± 0.0202 ab15.20 ± 1.44 ab
currant pomace1.4371 ± 0.0010 de0.4203 ± 0.0053 a0.4813 ± 0.0032 a1.1453 ± 0.0213 a12.66 ± 1.61 a
The same letters next to the values (a–f) indicate the absence of statistically significant differences (p < 0.05).
Table 6. Parameters of the exponential equation describing the kinetics of water vapour adsorption by the studied fibres and fruit pomace.
SampleEquation CoefficientR2
chokeberry fibrea = 27.2800.981
b = 0.889
c = 0.051
apple fibrea = 75.3990.995
b = 0.955
c = 0.026
currant fibrea = 24.5730.971
a = 0.897
c = 0.057
chokeberry pomacea = 34.6130.985
b = 0.908
c = 0.044
apple pomacea = 57.1450.995
b = 0.960
c = 0.034
currant pomacea = 30.2150.986
b = 0.912
c = 0.055
Table 7. Fitting parameters of the GAB model of the water vapour sorption isotherms of the studied fibres and pomace.
Fibre
ChokeberryAppleCurrant
Equation coefficientum = 0.048um = 0.056um = 0.043
C = 55.960C = 8.047C = 18.816
k = 0.783k = 0.804k = 0.756
R20.9950.9900.989
MRE(%)3.0914.5343.259
RMS3.7399.1634.842
RSS0.0130.1050.036
SEE0.1120.3240.190
Pomace
ChokeberryAppleCurrant
Equation coefficientum = 0.072um = 0.065um = 0.059
C = 2489.925C = 589.143C = 1.362
k = 0.723k = 0.772k = 0.744
R20.9830.9960.976
MRE(%)3.3542.1564.409
RMS4.2013.2935.272
RSS0.0300.0170.049
SEE0.1730.1310.221
Table 8. Temperature and weight loss related to the stages of TG/DTG curves of fruit fibre and pomace from apple, currant and chokeberry.
Sample1st Stage
30.00–130.00 °C
2nd Stage
130.00–310.00 °C
3rd Stage
310.00–380.00 °C
4th Stage
380.00–600.00 °C
T (°)Weight Loss (%)T (°)Weight Loss (%)T (°)Weight Loss (%)T (°)Weight Loss (%)
apple fibre66.885.21243.3629.89344.749.89422.235.10
currant fibre64.316.65242.8819.56340.0710.19428.1712.17
chokeberry fibre65.956.15287.3313.36348.585.61425.2312.31
apple pomace67.323.89242.4524.31346.804.76430.2210.03
currant pomace66.956.03239.7218.59343.327.82425.767.89
chokeberry pomace66.546.14288.3014.25353.964.21418.4215.19
Disclaimer/Publisher’s Note: The statements, opinions and data contained in all publications are solely those of the individual author(s) and contributor(s) and not of MDPI and/or the editor(s). MDPI and/or the editor(s) disclaim responsibility for any injury to people or property resulting from any ideas, methods, instructions or products referred to in the content.

