Abstract
Rowing is a complex sport where technique can significantly impact performance. A better understanding of the rowers’ technique and neuromuscular activations during scull rowing, along with their impact on rowing performance, could greatly help trainers and athletes. Twelve male rowers were asked to row at their competitive stroke rate, and we collected data describing neuromuscular activations, trunk and arm kinematics, as well as technical determinants such as oar angles and angle asymmetries. We fitted linear mixed-effect models to investigate the effects of these variables on power production and boat speed. A larger effective angle had the greatest positive effect on power output, and slip angles had the largest negative effects. Increased elbow flexion at catch had the greatest negative effect on speed. Angle asymmetries affected neither power nor speed. Increased upper limb neuromuscular activity during the first and third quarters of the drive phase helped reduce slip angles, thus increasing performance. Power and speed were influenced similarly by the predictor variables. Still, they showed subtle differences, indicating that the strategies to maximize power production might not be the best ones to also achieve the maximum speed.
1. Introduction
Rowing is a cyclic sport with high technical demands [1], where a good technique is fundamental to propel the boat forward during the drive phase, when the oars are in the water, and to maintain the boat speed during the recovery phase, when the oars are out of the water, ultimately defining the race result [2]. Indeed, according to Kleshnev [3], at the same physiological production, an efficient technique can reduce the race time by 10–15 s over a 2000 m race. The drive phase starts at the minimal negative oar angle, and this event is usually called the catch. Rowers rowing with the Rosenberg style (one of the most adopted styles) start this phase with a leg extension, generating power by pushing their feet against the foot stretcher while their arms remain stretched. This is followed by a trunk extension and a flexion of the arms [3]. Thus, during the drive, the rower’s body works as a kinetic chain where the different body segments (i.e., legs, trunk and arms) can transfer and generate power. A good technique should maximize the power transferred to the oar [4,5,6]. The recovery phase begins after the maximal positive oar angle is achieved (i.e., the finish event) and lasts until the following catch. This phase sees the oars out of the water and the rowers returning to the catch position while trying to maintain an elevated boat speed by pulling the stretcher with their feet [7]. Although no power is transferred to the oars in this phase, technique plays a fundamental role in maintaining maximum boat speed and preparing for the next stroke.
To investigate the importance of technique in determining rowing performance, researchers and trainers have used instrumented boats to measure quantities such as boat speed, oar angle and forces applied to the foot stretcher and oarlocks [2,8,9,10]. These quantities are then used to compute derivative parameters such as power transferred to the oars or power generated by the different body segments [11]. Top rowers have been observed to row with longer strokes [3] and statistical analyses support the notion that longer strokes are indeed better performing [2]. Additionally, rowers must apply propulsive force as soon as the oars enter the water and pull the oars out of the water as soon as they are no longer propelling the boat in order to minimize both catch and finish slip angles, thus increasing their effective stroke angle [2]. Regarding the shape of the force and power profiles, “front loaded” and “rectangular” profiles are more efficient [3,12], as they transfer the force to the boat in a more constant manner, thus reducing fluctuations in boat velocity and increasing rowing efficiency. Similar results were observed on ergometer rowing, where higher mean-to-peak ratios in the power generated by each body segment enhanced the power output at each segment and thus overall performance [6]. Therefore, performance in rowing is the result of many factors and is ultimately defined as the time used to cover a predefined distance or average speed [2]. The power produced by the rowers is one of the most important contributors to performance; it can be provided as real-time feedback to the rowers as part of their training [13] and is usually targeted as a direct measure of performance when training on an ergometer. However, given the complexity of on-water rowing, it is possible that the techniques that maximize power might not be optimal for maximum speed, thus underlying possible limitations of using power feedback during training. Evaluation of the effects of technique on both oar power and boat speed could therefore provide useful insights for training.
The rowing technique depends on the movements of the rowers’ body segments, which are ultimately the product of their neuromuscular activity. Analyzing the rowers’ kinematics and neuromuscular activity could increase our understanding of the connection between motor strategy and performance. Many studies have analyzed kinematics and neuromuscular activations on ergometer rowing, as the indoor setting facilitates the instrumentation of the rowers and ergometer [14,15,16,17,18,19]. On an ergometer, early isometric activation of the trunk extensors allows the transfer of the power generated by the legs. Then, a concentric contraction allows for the extension of the trunk with power production. After this, an eccentric contraction of the trunk flexors slows down the trunk until the maximum trunk extension is reached near the finish event [6,17,18,19,20]. At any stroke rate, trunk flexors and extensors show little to no co-contraction [4]. Similarly, arm extensors are initially isometrically activated to transfer legs and core power during the first part of the drive and then produce their own power by contracting concentrically [21]. While there have been studies that described the neuromuscular activity [22,23], the body’s kinematics [14,24,25,26,27], and studies investigating the effects of technical determinants on performance [2,28], to the authors’ knowledge, there is no study that investigates the modifying effects of neuromuscular activity and body kinematics on performance during scull rowing. During scull rowing, the intrinsic instability of the boat, blade management, and asymmetry introduced at the level of the arms could modify the temporal pattern activation of the core and arms with respect to ergometer rowing.
Knowing how muscle activity influences rowing performance could provide valuable information to trainers. Therefore, the purpose of the current study was (1) to describe the core and upper-body kinematics and neuromuscular activity during rowing on water and (2) to investigate the modifying effects of technical determinants, kinematics, and muscle activations on the rowers’ general performance defined by power transferred to the oars, average boat speed, and catch and finish slip angles.
2. Materials and Methods
2.1. Participants
Twelve male rowers with international competitive experience (including European and world regattas) participated in the study (20 ± 2.1 years old; 185 ± 5 cm; 79 ± 6.7 kg; 2000 m performance: 7 min 28 ± 10 s). Participants train at least 15 h per week and did not suffer any recent injury.
2.2. Test Procedure
Data collection was included in the rowers’ habitual training sessions. Since the measurements were scheduled to accommodate the rowers’ availability, they were performed under varying environmental conditions. On average, the flow of water was 11.3 ± 9 m3/s (based on the characteristics of the basin, we did not collect when the flow was above 50 m3/s), the temperature was 16 ± 4 °C, and the wind speed was 4.5 ± 1.6 m/s (we did not collect when the speed exceeded 10 m/s). The rowers first performed a warm-up session, consisting in reaching the body of water designated for the measurement. This covered a distance of about 2 km, during which the rowers rowed at low intensity, changing the sequencing of the movements (e.g., only legs, only arms) and including a few accelerations towards the end. Afterwards, they were asked to row at their competitive stroke rate with their usual rowing technique to closely simulate the mid-section of a 2000 m race. The body of water used for training only allowed for 500 m in straight line and the presence of other rowers on the basin severely limited the capability of the boat with the sensors’ receiver (see “Data collection”) to follow the rower for the entire session, as the waves generated by the boat could severely disturb the other rowers’ training. For this reason, once the rowers reached their target stroke rate and the sensors were within range, it was decided to limit recording to 15 consecutive strokes. Thus, for each rower, three bouts of 15 strokes were recorded, as rowers have shown to have a high degree of repeatability and other studies performed their analyses on a similar number of strokes [6,29]. Between recorded bouts, rowers had at least three minutes of rest.
2.3. Data Collection
The personal scull boat of each rower was equipped with Powerline systems (Peach, Cambridge, UK). Such a system consisted of bi-axial force and position sensors at port and starboard gates, as well as force sensors at the left and right foot stretchers, allowing for the quantification of the applied effective forces and the oar angles and angular velocity. This system also included a GPS sensor and an inertial measurement unit (IMU). Based on the fusion of these data, the Powerline system computed the speed and acceleration of the boat. All Powerline data were exported at 50 Hz. The Powerline box was installed in front of the rowers and provided them with direct feedback on their stroke rate as they are used to in training. In addition, we collected neuromuscular parameters of the upper limb and trunk via surface electromyography (EMG) at 2000 Hz with Trigno Snap Lead sensors (Trigno™, Delsys, Natick, MA, USA). Prior to measurements, the skin was shaved, abraded, and cleaned with alcohol. An impedance below 5 kΩ was set as a criterion for a good preparation. Afterwards, the electrodes (Ambu® BlueSensor SP, Ambu A/S, Ballerup, Denmark) were attached parallel to muscle fibers of 13 muscles, including left arm muscles (Figure 1): biceps brachii (BB), brachioradialis (BR), deltoideus anterior (DA), deltoideus posterior (DP), flexor carpi ulnaris (FCU), and triceps brachii longus (TBL); and left core muscles: rectus abdominis (RA), external obliquus (EO), internal obliquus (IO), lumbar erector spinae (ESL), thoracic erector spinae (EST), tensor fasciae latae (TFL), and gluteus maximus (GM). Electrode placements were in line with the SENIAM project’s recommendations [30] and previous literature [6,21,31]. The right GM was also recorded as a backup measurement for the left GM. This decision was motivated by the fact that in preliminary studies, the clothes of the rowers, combined with the cyclical motion, proved to cause artefacts and patch detachment on the GM sensor. One last EMG channel was dedicated to the acquisition of data coming from a trigger adapter sensor (Trigno™, Delsys, Natick, MA, USA). This trigger was connected to the Powerline system and transmitted the signal from the starboard oar position to the Delsys system, thus allowing for the synchronization between the two systems. Finally, pelvis, spine, and left arm kinematics were measured via seven IMUs (iSen, STT Systems, San Sebastian, Spain) registering at 100 Hz the 3D spatial orientations [14]. The IMUs (Figure 1) were placed between the two posterior superior iliac spines, on the spine at L2 vertebra level, between the two scapulae at the T6 vertebra level, and at the C7 vertebra level. On the left arm, they were placed on the left third metacarpal bone for the hand, between the radius and ulna for the forearm, and on the lateral side of the arm. IMUs were placed only on the left arm to avoid interfering with the rowing motion. Indeed, in sculling, the hands overlap during the drive phase, with the left hand passing a few centimeters above the right one, possibly interfering with any sensor placed on the back of the right hand. One additional IMU was placed on the boat to measure the boat’s acceleration and allow for synchronization with the Powerline system. Both the Trigno and STT systems were connected wirelessly to a receiver placed on a boat driven by the rowers’ coach that closely followed the rowers throughout their training. Powerline data were downloaded from the logger after the end of the session.
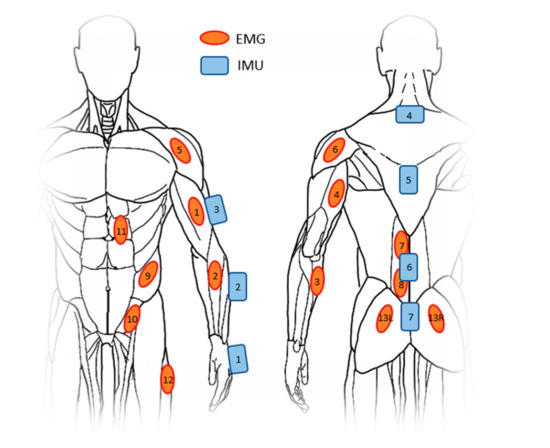
Figure 1.
Placement of IMU and EMG sensors on the body. EMG: 1—biceps brachii, 2—brachioradialis, 3—flexor carpi ulnaris, 4—triceps brachii longus, 5—deltoideus anterior, 6—deltoideus posterior, 7—thoracic erector spinae, 8—lumbar erector spinae, 9—obliquus externus, 10—obliquus internus, 11—rectus abdominis, 12—tensor fasciae latae, 13—gluteus maximus. IMU: 1—hand, 2—forearm, 3—arm, 4—C7 vertebra, 5—T6 vertebra, 6—L2 vertebra, 7—pelvis.
2.4. Data Analysis
The data from the three different systems (i.e., Powerline, Delsys, iSen) were synchronized as follows. The data from the starboard oar angle were sent to the Delsys system (Trigno Control Utility version 3.6.0) via a trigger adapter. This allowed to synchronize the short segments recorded with the Delsys system with the much longer sessions recorded with the Powerline system (version 4.12.0.0). Then, the iSen (version 2022.0) data were synchronized with the Powerline data based on the signal of the boat acceleration along the direction of motion measured by both the IMU placed on the boat and the Powerline box sensor. A custom-made code in Matlab (version R2022b) identified the minima and maxima of the starboard oar angle (i.e., the catch and finish, respectively), which were then used to segment the rowing cycles.
The information about body kinematics (joint angles and angles with respect to the vertical) were provided by the built-in models of the iSen package. We analyzed wrist, elbow, and shoulder flexion as well as the angle with respect to the vertical axis of the T6, L2, and pelvis IMUs. Shoulder flexion is given by the position of the arm in the sagittal plane and has 0° corresponding to a neutral hanging arm.
EMG signals were high-pass filtered at 30 Hz to remove the ECG contributions [32]. They were then demeaned, rectified, and low-pass filtered at 5Hz, similar to Bianco et al. [33]. EMG signals for each subject were normalized to the maximum value observed during the three bouts performed. The decision to normalize to the maximum value observed during the three bouts was due to constraints in the scheduled training, which prevented from performing a rowing bout at maximum intensity and to the desire to avoid effects of perspiration and degradation of the adhesive layer during the session [34]. After processing and segmenting the EMG data into cycles, signals were visually inspected and cycles with motion artefacts or missing data (e.g., due to the sensors being out of reach of the receiver) were removed from subsequent analyses. When both right and left GMs were present, their curves were averaged together and considered as one muscle for the rest of the analysis. The root mean square (RMS) of each signal was calculated over eight equal intervals for the drive (catch to finish) and recovery (finish to catch) phases. Thus, each muscle had 16 RMS values describing its activation pattern throughout the rowing cycle. These values were then used as predictor variables in the statistical analysis. The variables used as predictors are detailed in Table A1. The variables selected describe the technique of the rowers in terms of body kinematics (WriCatch, WriFinish, WriRoM, ElbCatch, ElbFinish, ElbRoM, ShoCatch, ShoFinish, ShoRoM, T6Catch, T6Finish, T6RoM, L2Catch, L2Finish, L2RoM, PelvCatch, PelvFinish, PelvRoM), boat telemetry (Length, LengthAs, CSA, CSAAs, FSA, FSAAs, EFA, EFAAs, mAcc, ForceT2P, ForceM2P, ForceAP), and neuromuscular activations (RMS). These variables were selected based on literature [2,3,6,14,21] and feedback from trainers. In particular, variables such as slip angles and effective angles are often used as performance indicators by trainers as they are among the parameters provided by the Powerline system. Some of these technical determinants were already analyzed by Holt et al. [2] and were included as a way to verify whether our analysis, conducted on different rowing sessions data (i.e., short sessions at constant rate vs. 2000 m races), provided results in agreement. The dependent variables were the catch and finish slip angles and two measures of performance: (1) the average power transferred to the oars over the rowing cycle (i.e., catch to catch) and (2) the average boat speed over the cycle.
The boat speed was obtained directly from the Powerline system. The power transferred to the oar was computed, for both board and starboard sides, based on [11] as
where is the force at the hand, perpendicular to the oar, is the inboard length of the oar, and is the oar angular velocity (derived from the oar angular position provided by the Powerline system). One of the two measures of performance used in this study (i.e., the average power transferred to the oar) was obtained by adding the board and starboard powers and averaging the resultant over the rowing cycle.
The force at the hand was derived from the force measured at the gates:
where is the outboard length of the oar.
2.5. Statistics
Linear mixed-effect models (fitlme function in Matlab) were used to investigate the modifying effects on the rowers’ performance of technical determinants [2] and the neuromuscular activity throughout the rowing cycle. Within the analysis, we considered each individual session, rather than the subject, as random effect. This allowed adjustment not only for consistently better or worse performing subjects but also for the effects of using different kinds of handles, different meteorological conditions, and different rowing directions within the basin. For each pair of predictor and dependent variables ( and , respectively) the analysis fitted a linear mixed-effects model to explain the variance of the dependent variable:
where is the intercept, is the fixed-effect coefficient, is the random effect and is the observation error; the subscript denotes the level of the grouping variable session.
For each of these models, we considered the resultant as the modifying effect of the predictor on the dependent variable . The analysis also returned a p-value associated with each of the fixed-effect coefficients. Coefficients that had a p-value greater than 0.05 were considered non-significant and excluded from the discussion. To compare the effect of the different determinants on performance, we computed the one standard deviation change (1SD):
where is the fixed-effect coefficient of the predictor on the dependent variable , is the standard deviation of the predictor , and is the mean value of the dependent variable .
3. Results
3.1. Rowing Kinematics
For most of the drive phase, the wrist showed little change in flexion, remaining on average between 11° extension and 12° flexion, until right before the finish (Figure 2). Then, there was a sudden change to a 55° extension, with a gradual return to zero during the recovery phase. Arms were kept extended in the first half of the drive, with the elbow flexion between 7° and 13°. Then, the rowers quickly increased the elbow flexion angle, reaching the peak at the finish, which was 100° on average. During the recovery phase, the elbow extended back to the starting position. During the first half of the drive, shoulder flexion slightly increased from 35° to 46°. In the second half of the drive phase, the shoulders started to extend rapidly with the elbow flexion and reached a maximum extension of 41° on average at the finish. During the recovery phase, the shoulders rapidly reached the flexion value observed at catch, which was then held for the last part of the recovery phase. At the catch, the thoracic segment was found on average to lean 17° towards the front while the lumbar and pelvis segments leaned 4° and 26° towards the back, respectively. In the first half of the drive phase, all three segments moved toward the back. In the second half of the drive, the backward movement of the three segments accelerated and reached the maximum angle right before the finish (34°, 49°, and 60° for T6, lumbar, and pelvis, respectively). During the recovery phase, the three segments performed the inverse movement, with the first half at a higher speed and the second half at a lower speed, reaching the minimum value at the catch.
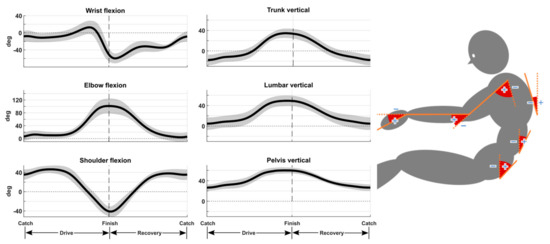
Figure 2.
Average (bold line) ± SD (shaded area) core and arm kinematics. For wrist, elbow, and shoulder, positive values correspond to flexion and negative values to extension. For the thoracic, lumbar, and pelvic segments, positive values correspond to the segment leaning toward the back of the rower and negative values to leaning forward.
3.2. Rowing Neuromuscular Activations
Concerning the muscles of the arms, the first part of the drive phase was dominated by the activations of FCU, TBL and, to a lesser degree, DA and BR (Figure 3). The peak activation for TBL and FCU occurred right before half of the drive phase (34% and 45%, respectively). The second half of the drive phase saw the synergistic action of the BR, BB, and DP reaching their peak activation at 55% of the drive phase, synchronized with the flexion of the elbow and shoulder. The recovery phase started with the peak activation of the DA at 13% of the recovery phase and remained active throughout the entire phase, gradually decreasing in activation until the following catch, where the activation approached zero. Also, DP, TBL, and FCU showed some activation throughout the phase. After the catch, the extensor muscles of the core (i.e., EST, ESL, GM) showed a steep increase in activation, reaching the maximum between 38% and 42% of the drive phase, and then rapidly dropped to almost zero for the rest of the phase. This activity is aligned with the increase in trunk opening speed. The second part of the drive had the activations of the trunk flexors, synchronized to the slowing down of the trunk movement. The trunk flexors peaked in activation between 83% and 90% of the drive phase. Of these, RA and EO showed little to no activation during the recovery phase, except for a short peak in RA activation at catch. IO and TFL were also active throughout the recovery phase, when the trunk was returning forward to the catch position, decreasing their activations until the following catch.
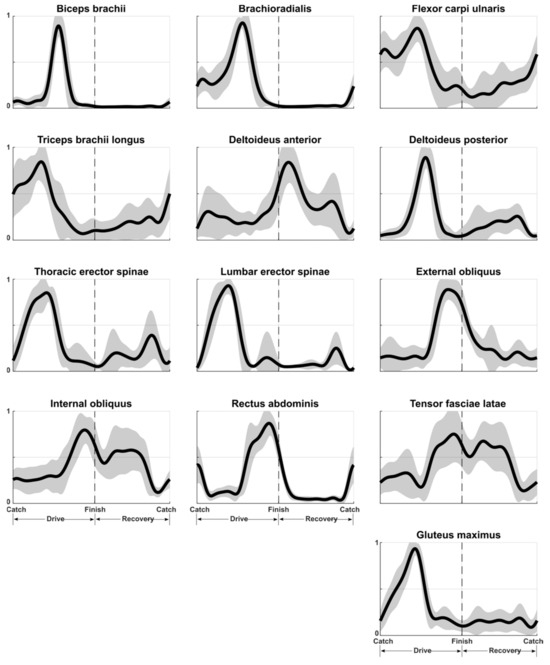
Figure 3.
Average (bold line) ± SD (shaded area) normalized muscle activations. Data were collected from all the twelve subjects and averaged after normalization.
3.3. Effect of Technical Determinants on Performance
Among the variables describing arm kinematics (Figure 4), reduced ElbCatch and ElbFinish (pointing to a straighter arm at the catch and reduced flexion at the finish) as well as decreased WriCatch were indicative of higher power output and speed. Higher values of ShoCatch and ShoFinish, as well as ElbRoM led to higher speed but not to increased power. The greatest effect was observed for ElbCatch with a 1SD increase in flexion, resulting in a power output change of −2.6% and in change in speed of −5.9%. Regarding the movements of the pelvis and spine segments, PelvRoM was the most important parameter for power production, with increased RoM associated with more power produced (5.9% for 1SD change), and L2Catch was the most important for speed with a 1SD change resulting in a 1.7% change. T6RoM and L2RoM also had positive effects on power and speed. A more forward-tilted pelvis at the catch (lower PelvCatch) was favorable to power but had no impact on speed. A more backward-leaning pelvis at the finish (higher PelvFinish) was beneficial to speed but not to power. Regarding the parameters describing the oar angles, asymmetries had no significant influence (LengthAs, EFAAs, FSAAs and CSAAs) on performance. EFA was the most important parameter to power output and speed (an angle increase of 1SD was associated with 7.2% and 1.9% changes, respectively). Increased CSA and FSA negatively impacted power (−2.6% and −4.0%) and speed (−0.4% and −1%). A less negative peak of boat acceleration mAcc was associated with decreased performance in power and speed (−1.7% and −1.4%). A higher ForceM2P had a positive effect on both power and speed (2.7% and 0.7%). Also, an earlier ForceT2P had a positive effect on both power and speed (0.4% and 0.7%). Finally, there was no significant effect on performance for ForceAP (Figure 4).

Figure 4.
Effect of one standard deviation (1SD) change in technical determinants on two measures of performance: average power and average speed over the rowing cycle. Only the effects for the coefficients with p-value < 0.05 are reported.
3.4. Effect of Neuromuscular Activations on Performance
Increased activations in the arm muscles (BB, BR, DA) right after the catch (0 to 25% of the drive phase) had a positive effect on both power and speed, with the greatest effect for DA (1SD change of 3.1% for power output and 1.0% for speed). Reduced ESL activity after the first half of the drive (50% to 75%) had a small effect on boat speed (0.7%), and reduced activity between 62.5% and 75% increased slightly power production (0.4%). More RA activity before the finish (62.5% to 100%) improved both speed and power, with a maximum effect on power of 1.1% and speed of 1%. In the final 25% of the drive, more activity of the muscles to slow down the arm and trunk (DA, TBL, TFL, RA) was beneficial to power and speed. TBL showed the highest effect on both power and speed at 1.8% and 1.9%, respectively. During the recovery phase (between 12.5% and 87.5%), core muscle activation seemed more favorable to performance when using the IO, EO, and TFL instead of the RA, which had a negative effect on power and speed (−1.2% and −0.7%). Also, during the first half of recovery, more activations of GM, TBL, DA, DP, BR, and BB muscles were beneficial to both speed and power. The highest effect on power output (+2.1%) was associated with an increase in GM activation, and the highest effect on speed (+1.6%) was related to a larger DA activation (Figure 5).
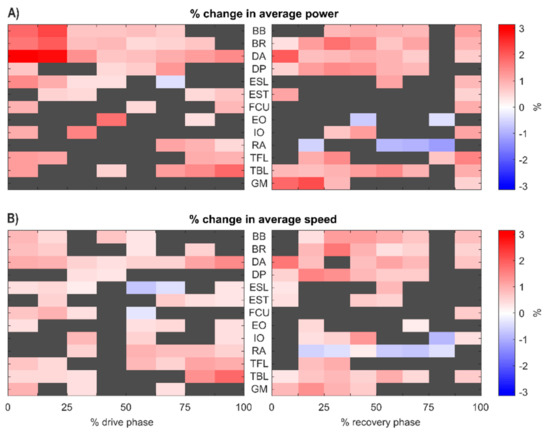
Figure 5.
Effect of one standard deviation (1SD) change in the muscle activations on the two measures of performance: power averaged over the rowing cycle (A) and boat speed averaged over the rowing cycle (B). Grey squares indicate no statistical significance (p value > 0.05), while red and blue squares indicate increase and decrease in performance, respectively, with respect to 1SD change in muscle activation. BB: biceps brachii; BR: brachioradialis; DA: deltoideus anterior; DP: deltoideus posterior; FCU: flexor carpi ulnaris; TBL: triceps brachii longus; RA: rectus abdominis; EO: external obliquus; IO: internal obliquus; ESL: lumbar erector spinae; EST: thoracic erector spinae; TFL: tensor fasciae latae; GM: gluteus maximus.
When focusing on the main performance indicators used by trainers, more arm muscle activity in the 0 to 25% of the drive reduced the CSA. The muscle with the greatest effect was DA, with a 1SD change of −4.3%, followed by BR at −3.6% and BB at −3.2% (Figure 6A). More arm activity (BB, BR, DA, DP, FCU) in the 50% to 75% of the drive phase reduced the FSA. The muscle with the greatest effect was DP, with a 1SD change of −3.3%. Higher abdominal activity during the recovery, especially RA, was associated with increased FSA (Figure 6B).
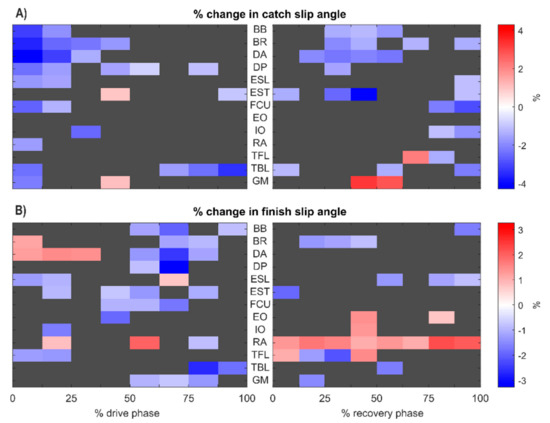
Figure 6.
Effect of one standard deviation (1SD) change in the muscle activations on catch slip angle (A) and finish slip angle (B). Grey squares indicate no statistical significance (p value > 0.05), while red and blue squares indicate increase and decrease in performance, respectively, with respect to 1SD change in muscle activation. BB: biceps brachii; BR: brachioradialis; DA: deltoideus anterior; DP: deltoideus posterior; FCU: flexor carpi ulnaris; TBL: triceps brachii longus; RA: rectus abdominis; EO: external obliquus; IO: internal obliquus; ESL: lumbar erector spinae; EST: thoracic erector spinae; TFL: tensor fasciae latae; GM: gluteus maximus.
4. Discussion
This study identified aspects of the rowers’ technique that can affect sculling performance and could be directly targeted during training, such as arm and trunk positioning at the catch and finish. Other parameters important for performance, such as the slip angles, are more difficult to control directly. However, by identifying the underlying neuromuscular strategies affecting these parameters and the overall performance, it is possible to provide useful information for targeted training protocols.
The first objective was to describe the average neuromuscular activation and kinematics patterns from the trunk and upper body in sculling. The neuromuscular activation pattern resembled the one measured on ergometer [18,19,21,22] and water, albeit with smaller and different sets of muscles [22,23]. Similarly to what was observed on the ergometer [4], the current study observed the absence of co-contraction in the trunk flexors/extensors. It has been demonstrated that co-contraction in pulling is smaller than in pushing tasks [35], and even if the on-water condition is more unstable than ergometer rowing, there is likely not enough instability to require increased core muscle co-contraction. The observed activity of RA for a brief interval at catch, right before the activations of the trunk extensors, might indicate a strategy to reach as far as possible to increase the stroke length, which might be linked to respiration/intra-abdominal pressure due to the strong forces generated at the catch [36] or might be due to the core stabilization known to occur in preparation of leg movements [37]. Also, the different activation profiles of lower (IO) and upper (RA, EO) trunk flexors show that these muscles have different purposes within a rowing cycle, with the former group dedicated to slowing down the trunk before the finish, and the latter dedicated to flexing the trunk during recovery and bringing the rower back to the catch position. Such a strategy of activating OI and TFL, with almost no contribution from RA during the recovery phase, indicate of the rowers’ technique to keep the upper trunk extended during the recovery. Indeed, based on the statistical analysis, an increased RA activation during recovery seems detrimental to performance, being associated with reduced power, speed, and FSA. The activations of DA and TBL during the beginning of the drive phase underline the desire of the rowers to keep their arms extended, which helps in the force transfer from the lower limbs and trunk to the oar. In this initial phase, in line with Hohmuth et al. [23], the BB has very little activation. However, the statistical analysis showed that a slight increase in BB activation, increasing arm stiffness via co-contraction with TBL, could benefit overall performance by reducing the slip angles.
The second objective of the study was to investigate the modifying effects of technical determinants, kinematics, and muscle activations on the rowers’ performance. In line with what was reported in the literature and what is usually reported by trainers [2,3,28], longer length, larger effective angles, and more negative boat accelerations were significantly associated with better performance while higher slip angles had negative effects. At the same time, no significant effect on performance was found for the asymmetries in slip angles and stroke length. This reinforces the idea that asymmetry in rowing at handle should not necessarily be viewed as a negative feature affecting performance [10]. Indeed, due to the hands overlapping during the drive, a certain degree of asymmetry is inevitably introduced. It is also possible that asymmetry between the board and starboard angles is a tool used by the rowers to compensate for disturbing factors like wind and water current, so it is not necessarily an inefficient technique but a fundamental characteristic to keep the boat on track. Similar to findings with ergometer rowing, earlier T2P and greater M2P have been associated with increased performance in on-water rowing [2,3,12]. While an earlier peak of force with respect to the normalized time proved to have a beneficial effect on performance, the angle at which this peak occurred had no effect. This points to strategies that involve a faster and more uniform force application to the oars as more performant.
Regarding the effects of body kinematics on performance, it appears that reaching the finish position with the pelvis and trunk leaning more towards the back was beneficial for performance, expressed in speed and power. Also, an increased range of motion of all the back segments contributes to higher performance. Thus, at least for the rowers participating in the study, an increased trunk involvement seems to improve overall performance. Contrary to previous findings on ergometer, where the range of motion of the pelvis did not affect performance [6], this study showed a positive effect on performance with increased pelvis range of motion. This difference could be explained by the differences between on-water and ergometer rowing. Even though the dynamic ergometer has a high degree of similarity with the boat when it comes to the body accelerations, the kinematics of the hands and arms as well as the force response at the handle are quite different. Moreover, it is easier to keep balance while rowing on an ergometer, which might lead rowers to easily reach a large RoM. Having the pelvis leaning more forward at the catch improved power but not speed. While this strategy to increase the pelvis forward tilt at the catch can increase the range of motion of the back and the power generated, it is possible that it might hinder the rower’s coordination and introduce counterproductive boat speed fluctuations. At the end of the drive phase, more RA and DA activations benefit performance. A study comparing different stroke rates on an ergometer [4] found that increased RA activity at the end of the drive phase was associated with increased stroke rate. Even though the rowers in our study were instructed to row at a constant stroke rate, it is possible that increased RA activity shortens the final part of the drive, where less power is produced, thus allowing for a more efficient finish.
Based on the modifying effects of kinematics and neuromuscular activations, the most performing strategy seems to have a straighter, more forward, and stiffer arm at the catch and less flexed at the finish, which aligns with Gorman et al. [38] and the recommendations from trainers. Indeed, higher elbow flexion at both the catch and finish was found to be detrimental to power and speed in this study, and elbow flexion in the first half of the drive is considered a technical error (known as “grubbing”) [3,5,38]. Indeed, starting the rowing movement with a flexed elbow can reduce the range of motion and require the rower to finish the drive phase at higher degrees of flexion, where it is more difficult to generate force and power. To reduce the finish slip angles, the best neuromuscular strategy seems to be with increased activations of BB, BR, DA, and DP in the third quarter of the drive phase rather than in the last quarter, where more TBL activity, to invert the direction of the elbow movement, is beneficial.
In the first part of the recovery phase, more activations in the arm muscles (DA, TBL, FC) also predicted higher performance. These muscles allowed for higher acceleration of the trunk and arm towards the catch position, which might also have benefitted boat speed conservation. On the other hand, greater RA activation during recovery seemed to hinder performance. This might indicate that a return to the catch position is more effective when the trunk is kept in an erect position, allowing rowers to reach further and maintain better overall coordination. In this case, the increase in muscle activation can be seen as a technical error [3,38]. This is also in line with the indications usually provided by the trainers. The effect of the muscle activations during recovery on the average power and, even more so, on the average speed shows that good placement on the boat and proper coordination to maintain speed throughout the cycle limiting losses is just as important as other technical determinants and activations in other phases of the cycle.
5. Limitations
Some points need to be considered when interpreting the results of this study. Firstly, the number of participants available for this study was limited, since we only recruited high-level athletes from the national training center. However, a number of twelve participants is supported by a published study performing similar analyses [2]. Also, these rowers had a similar rowing technique, which is typical of the Rosenberg style. It is possible that rowers adopting a different style may show different effects of technical determinants, kinematics, and activations on performance.
Another factor potentially limiting the generalizability of our findings is the limited number of stroke cycles analyzed over a distance limited to 500 m. Even though rowers were instructed to row in such a way as to simulate the middle section of a 2000 m race, conditions during a real race could be very different, especially when considering the role of fatigue and different race strategies. It is possible that the effects of technical determinants and neuromuscular activations differ between 2000 m and a race simulated over 500 m. It is also possible that these effects change during the course of a race as a function of the intensity and fatigue, with some variables having a higher effect during the acceleration phase and others being more important in the middle of the race. Comparing the results from this study with those reported by Holt et al. [2], which were based on 2000 m races, we can see agreement in the negative effects of the slip angles and force time-to-peak on average boat speed. They also reported a positive effect of a faster decrease in boat velocity after catch, which agrees with our findings of a more negative peak of boat acceleration. On the other hand, the effects of the force mean-to-peak were different, albeit small in both studies. Overall, the results of this study seem in line with those based on longer rowing sessions. However, further investigation, particularly concerning neuromuscular activations, is needed to confirm the generalizability of these findings to the entire 2000 m race.
6. Conclusions
Power production and boat speed are known to be closely related and they were indeed affected similarly by the predictor variables analyzed in this study. However, the different weights associated with each predictor show that the strategies to achieve higher speed might be slightly different from those that achieve higher power production. Overall, the results of this study highlight changes in technique and neuromuscular activation patterns that might increase scull rowing performance. These results could translate into recommendations to the trainers on how to evaluate the technique of their athletes, with increased effective angles, reduced slip angles and increased pelvis range of motion favorable to power production. Also, the authors can provide recommendations to the rowers on how to improve their placement on the boat, for instance, by limiting elbow flexion at catch, and on how to reduce slip angles by increasing muscle activations in the arms during the first and third quarters of the drive phase.
Author Contributions
Conceptualization, L.P., F.R.S., G.C.G. and G.M.; methodology, L.P., G.N.E. and F.R.S.; software, L.P.; validation, L.P., F.R.S., and G.M.; formal analysis, L.P.; investigation, L.P. and G.N.E.; resources, G.M.; data curation, L.P.; writing—original draft preparation, L.P.; writing—review and editing, L.P., F.R.S., G.N.E., G.C.G. and G.M.; visualization, L.P.; supervision, G.M.; project administration, G.M.; funding acquisition, G.M. All authors have read and agreed to the published version of the manuscript.
Funding
This research was funded by a grant from the PIA (Programme d’Investissements d’Avenir) via the ANR (Agence Nationale de la Recherche) with the reference ANR-20-STHP-0006.
Institutional Review Board Statement
The study was approved by the Sud-Ouest et Outre-Mer III ethics committee (approval reference 20.07.21.43000-ID_9115) and conformed to the requirements stipulated in the Declaration of Helsinki.
Informed Consent Statement
Written informed consent was obtained from all subjects involved in the study.
Data Availability Statement
Data will be made available upon request.
Acknowledgments
The authors thank the trainers and athletes of the Pôle Aviron Nancy for their availability and valuable support.
Conflicts of Interest
The authors declare no conflicts of interest.
Appendix A

Table A1.
Description of the predictor variables included in the statistical analysis.
Table A1.
Description of the predictor variables included in the statistical analysis.
| Base Variable | Description | Name Used |
|---|---|---|
| Wrist flexion angle | Value at catch (°) | WriCatch |
| Value at finish (°) | WriFinish | |
| Range of motion over the cycle (°) | WriRoM | |
| Elbow flexion angle | Value at catch (°) | ElbCatch |
| Value at finish (°) | ElbFinish | |
| Range of motion over the cycle (°) | ElbRoM | |
| Shoulder flexion angle | Value at catch (°) | ShoCatch |
| Value at finish (°) | ShoFinish | |
| Range of motion over the cycle (°) | ShoRoM | |
| Angle WRT vertical: thoracic spine (T6 level) | Value at catch (°) | T6Catch |
| Value at finish (°) | T6Finish | |
| Range of motion over the cycle (°) | T6RoM | |
| Angle WRT vertical: lumbar spine (L2 level) | Value at catch (°) | L2Catch |
| Value at finish (°) | L2Finish | |
| Range of motion over the cycle (°) | L2RoM | |
| Angle WRT vertical: pelvis | Value at catch (°) | PelvCatch |
| Value at finish (°) | PelvFinish | |
| Range of motion over the cycle (°) | PelvRoM | |
| Stroke angle length | Maximum oar angle–minimum oar angle (°) | Length |
| Asymmetry computed as the difference between right and left Length (°) | LengthAs | |
| Catch slip angle | Computed as the difference between the minimum oar angle at catch and the angle at which the force applied exceeds 20 kg (°) | CSA |
| Asymmetry computed as the difference between right and left CSA (°) | CSAAs | |
| Finish slip angle | Computed as the difference between the maximum oar angle at finish and the angle at which the force decreases below 15 kg (°) | FSA |
| Asymmetry computed as the difference between right and left FSA (°) | FSAAs | |
| Stroke effective angle | Length–(CSA + FSA) | EFA |
| Asymmetry computed as the difference between right and left effective angle (°) | EFAAs | |
| Negative peak of boat acceleration | Most negative value of the boat acceleration signal, after catch in Figure A1 (m/s2) | mAcc |
| Total oar force curve (starboard + board) | Time from the catch to the curve peak, expressed as percentage of the drive phase (%) | ForceT2P |
| Mean-to-peak, ratio average force in the drive phase over maximum value | ForceM2P | |
| Angle at which the peak force occurs (°) | ForceAP | |
| Muscle activations | RMS of the normalized EMG signals in each of the 8 zones of the drive and recovery phases |

Figure A1.
Average profiles across the twelve rowers.
Figure A1.
Average profiles across the twelve rowers.

References
- Dawson, R.G.; Lockwood, R.J.; Wilson, J.D.; Freeman, G. The Rowing Cycle: Sources of Variance and Invariance in Ergometer and on-the-Water Performance. J. Mot. Behav. 1998, 30, 33–43. [Google Scholar] [CrossRef] [PubMed]
- Holt, A.C.; Aughey, R.J.; Ball, K.; Hopkins, W.G.; Siegel, R. Technical Determinants of On-Water Rowing Performance. Front. Sports Act. Living 2020, 2, 589013. [Google Scholar] [CrossRef] [PubMed]
- Valery, K. The Biomechanics of Rowing, 2nd ed.; Crowood Press: Marlborough, UK, 2016. [Google Scholar]
- Duchene, Y.; Simon, F.R.; Ertel, G.N.; Maciejewski, H.; Gauchard, G.C.; Mornieux, G. The Stroke Rate Influences Performance, Technique and Core Stability during Rowing Ergometer. Sports Biomech. 2024. [Google Scholar] [CrossRef]
- Gorman, A.J.; Willmott, A.P.; Mullineaux, D.R. The Effects of Concurrent Biomechanical Biofeedback on Novel Skill Acquisition. Sports Biomech. 2022, 21, 297–311. [Google Scholar] [CrossRef]
- Simon, F.R.; Ertel, G.N.; Duchene, Y.; Maciejewski, H.; Gauchard, G.C.; Mornieux, G. Prediction of Rowing Ergometer Performance by Technical and Core Stability Parameters. J. Sports Sci. 2023, 41, 399–407. [Google Scholar] [CrossRef] [PubMed]
- Warmenhoven, J.; Cobley, S.; Draper, C.; Smith, R. Over 50 Years of Researching Force Profiles in Rowing: What Do We Know? Sports Med. 2018, 48, 2703–2714. [Google Scholar] [CrossRef]
- Hofmijster, M.J.; Lintmeijer, L.L.; Beek, P.J.; van Soest, A.J.K. Mechanical Power Output in Rowing Should Not Be Determined from Oar Forces and Oar Motion Alone. J. Sports Sci. 2018, 36, 2147–2153. [Google Scholar] [CrossRef]
- Warmenhoven, J.; Cobley, S.; Draper, C.; Harrison, A.; Bargary, N.; Smith, R. How Gender and Boat-Side Affect Shape Characteristics of Force–Angle Profiles in Single Sculling: Insights from Functional Data Analysis. J. Sci. Med. Sport 2018, 21, 533–537. [Google Scholar] [CrossRef]
- Warmenhoven, J.; Smith, R.; Draper, C.; Harrison, A.J.; Bargary, N.; Cobley, S. Force Coordination Strategies in On-water Single Sculling: Are Asymmetries Related to Better Rowing Performance? Scand. J. Med. Sci. Sports 2018, 28, 1379–1388. [Google Scholar] [CrossRef]
- Kleshnev, V. Power in Rowing. In Proceedings of the 18 International Symposium on Biomechanics in Sports 2000, Hong Kong, China, 25–30 June 2000; pp. 2–5. [Google Scholar]
- Smith, R.; Draper, C. Skill Variables Discriminate between the Elite and Sub-Elite in Coxless Pair-Oared Rowing. Int. Soc. Biomech. Sport. 2006, 24, 1–4. [Google Scholar]
- Lintmeijer, L.L.; Knoek Van Soest, A.J.; Robbers, F.S.; Hofmijster, M.J.; Beek, P.J. Real-Time Feedback on Mechanical Power Output: Facilitating Crew Rowers’ Compliance with Prescribed Training Intensity. Int. J. Sports Physiol. Perform. 2019, 14, 303–309. [Google Scholar] [CrossRef] [PubMed]
- Li, Y.; Koldenhoven, R.M.; Jiwan, N.C.; Zhan, J.; Liu, T. Trunk and Shoulder Kinematics of Rowing Displayed by Olympic Athletes. Sports Biomech. 2020, 22, 1095–1107. [Google Scholar] [CrossRef] [PubMed]
- Martinez-Valdes, E.; Wilson, F.; Fleming, N.; McDonnell, S.J.; Horgan, A.; Falla, D. Rowers with a Recent History of Low Back Pain Engage Different Regions of the Lumbar Erector Spinae during Rowing. J. Sci. Med. Sport 2019, 22, 1206–1212. [Google Scholar] [CrossRef] [PubMed]
- Ng, L.; Campbell, A.; Burnett, A.; O’Sullivan, P. Gender Differences in Trunk and Pelvic Kinematics during Prolonged Ergometer Rowing in Adolescents. J. Appl. Biomech. 2013, 29, 180–187. [Google Scholar] [CrossRef] [PubMed][Green Version]
- Nowicky, A.V.; Burdett, R.; Horne, S. The Impact of Ergometer Design on Hip and Trunk Muscle Activity Patterns in Elite Rowers: An Electromyographic Assessment. J. Sports Sci. Med. 2005, 4, 18–28. [Google Scholar]
- Pollock, C.L.; Jenkyn, T.R.; Jones, I.C.; Ivanova, T.D.; Garland, S.J. Electromyography and Kinematics of the Trunk during Rowing in Elite Female Rowers. Med. Sci. Sports Exerc. 2009, 41, 628–636. [Google Scholar] [CrossRef]
- Pollock, C.L.; Jones, I.C.; Jenkyn, T.R.; Ivanova, T.D.; Garland, S.J. Changes in Kinematics and Trunk Electromyography during a 2000m Race Simulation in Elite Female Rowers. Scand. J. Med. Sci. Sports 2012, 22, 478–487. [Google Scholar] [CrossRef]
- Vinther, A.; Alkjær, T.; Kanstrup, I.L.; Zerahn, B.; Ekdahl, C.; Jensen, K.; Holsgaard-Larsen, A.; Aagaard, P. Slide-Based Ergometer Rowing: Effects on Force Production and Neuromuscular Activity. Scand. J. Med. Sci. Sports 2013, 23, 635–644. [Google Scholar] [CrossRef]
- Ertel, G.N.; Mornieux, G.; Simon, F.R.; Gauchard, G.C. Characterizing the Effects of an Ergonomic Handle on Upper Limbs Kinematics and Neuromuscular Activity, Comfort, and Performance during Ergometer Rowing. Appl. Ergon. 2023, 113, 104093. [Google Scholar] [CrossRef]
- Fleming, N.; Donne, B.; Mahony, N. A Comparison of Electromyography and Stroke Kinematics during Ergometer and On-Water Rowing. J. Sports Sci. 2014, 32, 1127–1138. [Google Scholar] [CrossRef]
- Hohmuth, R.; Schwensow, D.; Malberg, H.; Schmidt, M. A Wireless Rowing Measurement System for Improving the Rowing Performance of Athletes. Sensors 2023, 23, 1060. [Google Scholar] [CrossRef] [PubMed]
- Brice, S.M.; Millett, E.L.; Philippa, B. The Validity of Using Inertial Measurement Units to Monitor the Torso and Pelvis Sagittal Plane Motion of Elite Rowers. J. Sports Sci. 2022, 40, 950–958. [Google Scholar] [CrossRef] [PubMed]
- Buckeridge, E.; Hislop, S.; Bull, A.; McGregor, A. Kinematic Asymmetries of the Lower Limbs during Ergometer Rowing. Med. Sci. Sports Exerc. 2012, 44, 2147–2153. [Google Scholar] [CrossRef] [PubMed]
- Bull, A.M.J.; McGregor, A.H. Measuring Spinal Motion in Rowers: The Use of an Electromagnetic Device. Clin. Biomech. 2000, 15, 772–776. [Google Scholar] [CrossRef]
- McGregor, A.H.; Bull, A.M.J.; Byng-Maddick, R. A Comparison of Rowing Technique at Different Stroke Rates: A Description of Sequencing, Force Production and Kinematics. Int. J. Sports Med. 2004, 25, 465–470. [Google Scholar] [CrossRef]
- Holt, A.C.; Ball, K.; Siegel, R.; Hopkins, W.G.; Aughey, R.J. Relationships between Measures of Boat Acceleration and Performance in Rowing, with and without Controlling for Stroke Rate and Power Output. PLoS ONE 2021, 16, e0249122. [Google Scholar] [CrossRef]
- Doyle, M.M.; Lyttle, A.; Elliott, B. Comparison of Force-Related Performance Indicators between Heavyweight and Lightweight Rowers. Sports Biomech. 2010, 9, 178–192. [Google Scholar] [CrossRef]
- Hermens, H.J.; Freriks, B.; Disselhorst-Klug, C.; Rau, G. Development of Recommendations for SEMG Sensors and Sensor Placement Procedures. J. Electromyogr. Kinesiol. 2000, 10, 361–374. [Google Scholar] [CrossRef]
- Song, D.; Kim, E.; Bak, H.; Shin, G. Effect of Hand Loads on Upper Extremity Muscle Activity during Pushing and Pulling Motions. Appl. Ergon. 2021, 96, 103504. [Google Scholar] [CrossRef]
- Drake, J.D.M.; Callaghan, J.P. Elimination of Electrocardiogram Contamination from Electromyogram Signals: An Evaluation of Currently Used Removal Techniques. J. Electromyogr. Kinesiol. 2006, 16, 175–187. [Google Scholar] [CrossRef]
- Bianco, N.A.; Patten, C.; Fregly, B.J. Can Measured Synergy Excitations Accurately Construct Unmeasured Muscle Excitations? J. Biomech. Eng. 2018, 140, 011011. [Google Scholar] [CrossRef] [PubMed]
- Abdoli-Eramaki, M.; Damecour, C.; Christenson, J.; Stevenson, J. The Effect of Perspiration on the SEMG Amplitude and Power Spectrum. J. Electromyogr. Kinesiol. 2012, 22, 908–913. [Google Scholar] [CrossRef] [PubMed]
- Granata, K.P.; Lee, P.E.; Franklin, T.C. Co-Contraction Recruitment and Spinal Load during Isometric Trunk Flexion and Extension. Clin. Biomech. 2005, 20, 1029–1037. [Google Scholar] [CrossRef] [PubMed]
- Cholewicki, J.; Panjabi, M.M.; Khachatryan, A. Stabilizing Function of Trunk Flexor-Extensor Muscles around a Neutral Spine Posture. Spine 1997, 22, 2207–2212. [Google Scholar] [CrossRef] [PubMed]
- Hodges, P.W.; Richardson, C.A. Contraction of the Abdominal Muscles Associated with Movement of the Lower Limb. Phys. Ther. 1997, 77, 132–142. [Google Scholar] [CrossRef]
- Gorman, A.J.; Willmott, A.P.; Mullineaux, D.R. The Effects of Concurrent Biomechanical Biofeedback on Rowing Performance at Different Stroke Rates. J. Sports Sci. 2021, 39, 2716–2726. [Google Scholar] [CrossRef]


Disclaimer/Publisher’s Note: The statements, opinions and data contained in all publications are solely those of the individual author(s) and contributor(s) and not of MDPI and/or the editor(s). MDPI and/or the editor(s) disclaim responsibility for any injury to people or property resulting from any ideas, methods, instructions or products referred to in the content. |
© 2024 by the authors. Licensee MDPI, Basel, Switzerland. This article is an open access article distributed under the terms and conditions of the Creative Commons Attribution (CC BY) license (https://creativecommons.org/licenses/by/4.0/).