Article

An Application of Mist Generator as a Way to Reduce Particulate Matter during High Concentration Episodes in Urban Forests

1
Livable Urban Forests Research Center, National Institute of Forest Science, 57, Hoegiro, Seoul 02455, Republic of Korea
2
Smarcle Company, 111, Bluetech, 158, Bodemulo, Seo-gu, Incehon-si 22664, Republic of Korea
*
Author to whom correspondence should be addressed.
Appl. Sci. 2024, 14(19), 9061; https://doi.org/10.3390/app14199061
Submission received: 25 August 2024 / Revised: 20 September 2024 / Accepted: 24 September 2024 / Published: 8 October 2024
(This article belongs to the Special Issue Air Quality in the Urban Space Planning and Management)

Abstract

:
Previous conventional mist devices can induce a detrimental effect of leaf burn by intense, focused sunlight in summer. A mist generator is designed to prevent particulate matter (PM) damage to trees by combining mist with PM during high PM episodes. We measured changes in microclimate conditions and the concentration of PM before, during, and after mist spraying in urban parks (Yangjae Citizen Forest, YCF; Cheongdam Road Park, CRP) from May 6 to 8, 2020. PM changes in YCF and CRP were observed immediately after mist spraying and were found to return to the previous concentrations. Mist spraying had no significant effects on the meteorological traits of air temperature, humidity, and wind speed but had significant effects on the concentration of PMx and the ratio of PM during a short time. Also, the ratio of PMx was partially affected by mist spraying. During the morning rush hour and lunch, mist, high wind speed, and low relative humidity conditions were related to the increase in mist movement, resulting in increasing PM (2.5–10 μm) and the deposition of these PM. During the evening rush hour, high relative humidity and low wind speed affected PM concentrations more than mist. This prototype of mist spraying could effectively condense and deposit the PM during high PM episodes.

1. Introduction

Efficient management of particulate matter (PM) is required to mitigate high PM concentrations and increased high PM warnings in Korea [1,2]. PM is an air pollutant containing nitrogen oxides, sulfur dioxide, lead, and ozone, and is mainly generated from fossil fuel combustion and the operation of factories and vehicles [3,4]. High PM concentrations can reduce visibility in the environment, exacerbate the atmospheric environment, and cause various respiratory diseases in humans [5,6,7]. Thus, the government has strengthened regulations on large PM emission sources since 2017 by establishing a comprehensive PM management plan [8]. However, since this regulation is implemented locally, such as in industrial complexes, thermoelectric power plants, and diesel vehicles, other measures are needed to directly reduce human exposure to PM in normal neighborhoods.
Urban greenery is highly utilized in urban air quality management because of its high accessibility to citizens and its effects on reducing PM [9,10,11]. The PM reduction mechanism of trees consists of the absorption of air pollutants through stomata [12,13,14], adsorption of PM by tree structures such as leaves and branches [15,16], and blocking and deposition of PM owing to microclimate changes within forests [17]. However, during high PM episodes, tree PM reduction is limited depending on the characteristics of the leaves, and PM can be absorbed and adsorbed through their leaves by precipitation or strong winds [18,19,20]. In addition, as the damage caused by climate change (dry and heat) has increased, trees have restricted their functions, such as moisture stress and inset damage [21], and tree growth and resilience to extreme drought [22].
A mist generator called the ‘cooling fog’ is a structure that can reduce PM to less than 0.5 µm by combining PM and the mist sprayed from spray nozzles [2]. Mist generators are widely implemented as PM reduction systems in urban areas because of their applicability to various urban living spaces, such as residential playgrounds and bus stops [2]. In particular, mist is often used in high PM episodes because it can reduce PM by condensing PM growth [23], mitigating PM damage to trees. Additionally, spraying mist may reduce temperature and increase relative humidity, preventing leaf injuries by insects and fungi [23]. It also enhances the leaf defense against PM damage such as on leaf shading, increased leaf temperature, stomatal plugging, and interference with stomatal closure [24].
However, previous conventional mist devices can induce the detrimental effect of leaf burn by intense, focused sunlight in summer. Also, most studies on mist are related to crop cultivation [25,26], and the effects of thermal comfort and temperature reduction [2,27]. There is little study on the PM reduction effects of mist generators under trees’ canopies during high PM episodes. Therefore, this study was conducted at two urban parks in Seoul, Republic of Korea (Yangjae Citizen’s Forest—YCF, Cheongdam Road Park—CRP), where mist generators were installed, and the PM concentration and weather conditions before, during, and after spraying mist were measured to identify the PM reduction effects of mist from May 6 to 8, 2020. The research objectives were to determine the effects of PM reduction and microclimate conditions through mist generators during high PM episodes.

2. Materials and Methods

2.1. Mist Generator

The mist generator (design patent application by the National Institute of Forest Science, 30-2018-0057166) used in this study is a device that can condense PM, induce deposition by spraying mist, and improve evapotranspiration by trees by providing water to trees during high PM episodes. The mist has an injection pump, injection nozzle, water scrubber, and sensor (Figure 1a). The sensor is designed to monitor the water level at the water tank, which consisted of three liters, for effective water generation and scrubbing in the generator. The water tank is connected to the water source by a pipeline that provides a continuous supply of water. Mist was sprayed from 72 nozzles of 8 arms (9 nozzles per arm) per mist generator (nozzle size within 0.15 mm) for 5 min (per injection episode), and the injection quantity was 1.5 L/minute due to the effective volume intensity and fog formation. The mist generator width is 1.4–1.6 m, and the height is 2.65 m, allowing the mist to affect human exposure to PM. Based on sprayed areas of mist generators, three generators were installed in YCF and CRP (Figure 1b).

2.2. Study Site

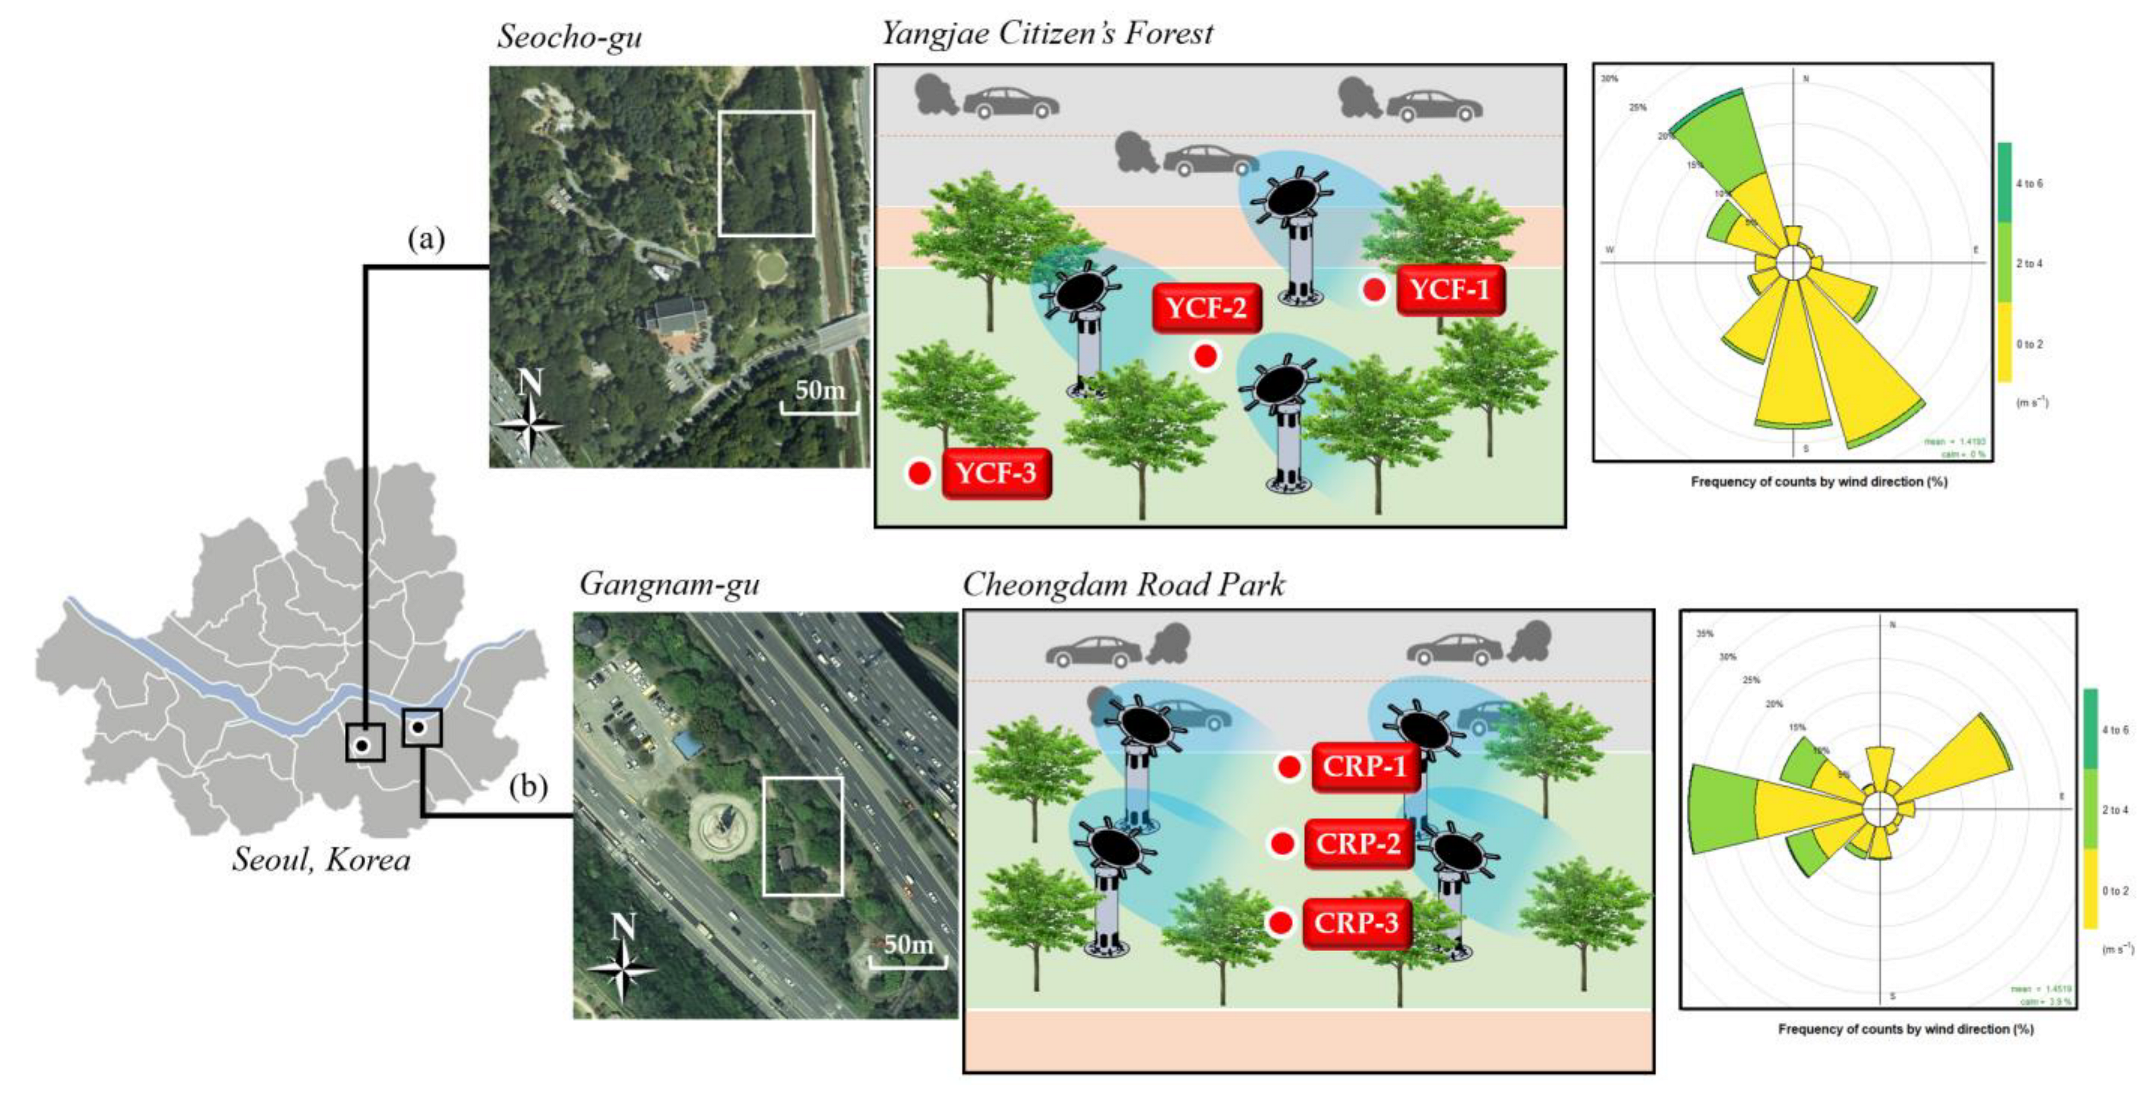
We selected two sites adjacent to the pollutants’ sources of traffic roads in Seoul. Two sites had been implemented to provide the services of urban parks to the people, and deciduous trees of the Occidental Planes (Platanus occidentalis) and Zelkova trees (Zelkova serrata) were planted at two urban parks (YCF and CRP), and based on a preliminary survey for the main direction of the wind rose dataset, we set up the direction of the mist generator at each site, respectively (Figure 2). YCF (37°28′ N, 127°2′ E) is a park built in 1986 to improve the environmental quality around Yangjae Tollgate and has a dense forest (258,991 m2).
CRP (37°28′ N, 127°2′ E) was established in 1986 to commemorate the comprehensive development of the Han River. It is located in the middle of the Olympic Road between the Cheongdam Bridge and the Jamsil Bridge. The park has an area of 25,095 m2 and is easily accessible to cars; thus, it is primarily used as a resting area for drivers.
The user statistics for 2020 were 13,532 people at YCF and 37,313 people at CRP per year, respectively [28]. We replaced the user statistics for each park as the user number at the nearest station due to the open space of each park and no information on the specific number of users at each park.
The national PM station of Gangnam-Gu is located at a distance of 5.6 km from YCP and 1.5 km from CRP, and two 8-lane highways are located at the nearest to YCP and three 6-lane highways are located and surrounded at CRP, so it is difficult to use a national PM monitoring station. But we confirmed the concentrations of PM10 and PM2.5 at two days were 29.71 and 16.92 on May 6 and 24.04 and 12.83 on May 7 from the national monitoring data of PM [29], respectively.

2.3. Measurement of PM and Weather Factors Based on Mist Spraying

Analyzing the characteristics of PM reduction due to mist spraying requires measuring PM concentration using a mobile PM measuring device (Turnkey, UK, ±0.5% accuracy). The Dustmate is a lightweight portable version of the Osiris laser light scattering particulate monitor that is capable of measuring total suspended particulates (TSP), PM10, PM2.5, and PM1 with a resolution of 0.1 µg/m3. Air is drawn into the instrument at a rate of 0.6 L/min, and the flow is configured so that only one particle is illuminated by the laser light beam (670 nm) at any particular moment in time [30]. The use of a Dustmate to measure PM concentrations has been successfully demonstrated in previous studies [31,32,33]. A Dustmate measures real-time PM concentration using the light-scattering method. However, humidity interferes with the light-scattering method, resulting in overestimating PM concentration [30,34]. Thus, we excluded the PM data when humidity values were over 80% to prevent overestimating PM concentration [35]. In addition, we used silica gel, a moisture absorbent, to prevent moisture from entering the Dustmate. However, the silica gel was not large enough to change the inflow rate; hence, we ignored its impact. As mist is heavily influenced by wind. The measuring points in the YCF and CRP were selected based on the main wind direction of each park (Figure 2). In YCF, where the main wind is the northwest wind, the PM was measured at YCF-1 (37°28′13.73′′ N, 127°2′15.49′′ E), YCF-2 (37°28′13.73′′ N, 127°2′14.80′′ E), and YCF-3 (37°28′13.95′′ N, 127°2′14.18′′ E) (n = 3). In CRP, which is strongly affected by the west wind, we measured PM concentration at CRP-1 (37°31′12.20′′ N, 127°3′50.19′′ E), CRP-2 (37°31′12.07′′ N, 127°3′50.06′′ E), and CRP-3 (37°31′11.82′′ N, 127°3′49.91′′ E) (n = 3). A Dustmate was installed 1.5 m above the ground, considering the average breathing height of humans. Three devices simultaneously recorded the PM values at three points in YCF and CRP sites. We focused on the change in PM concentration before and after mist spraying; thus, we did not include control treatments.
Mist spraying and PM measurements were carried out intensively in May when high PM concentrations occurred, and citizens actively enjoyed outdoor activities. Considering that the visitation rate of citizens in each park was high, mist spraying was conducted as follows: the mist was sprayed thrice at 30-min intervals during lunch (11:00–13:00) and evening rush hour (17:00–19:00) [YCF], morning rush hour (08:00–10:00), and lunch and evening rush hour [CRP] (5 min per spraying period). At YCF, the concentrations of PM10 (μg/m3), PM2.5 (μg/m3), and PM1.0 (μg/m3) were measured on May 6 (evening rush hour) and May 7 (lunch), 2020. At CRP, PMx concentrations were measured on May 7 (evening rush hour) and May 8 (morning rush hour and lunch), 2020. Furthermore, PM data were measured at intervals of 1 s; these data were used at an average of 5 min. As light mist particles can diffuse rapidly into the air soon after spraying, we speculated that the PM reduction effect of mist would occur in a short time [2] and would concentrate on changes in PM concentration before (10 min), during (5 min), and after (10 min) mist spraying. Based on the principle that mist and PM would undergo condensation growth and deposition, the changes in PM size due to mist spraying were calculated based on the ratio of small-sized PM concentrations to large-sized PM concentrations (PM2.5·PM10−1, PM1.0·PM10−1, PM1.0·PM2.5−1) (Equation (1)). The ratio of small-size PM concentrations could be utilized as a factor to understand the anthropogenic contribution of aerosols in a city [36].
C h a n g e s   i n   c o n c e n t r a t i o n   w i t h   P M   s i z e   a c c o r d i n g   t o   m i s t   s p r a y i n g   ( P M   r a t i o )   =   P M x P M y
where PMx and PMy are the PM concentrations of that size. x is always less than y.

2.4. Statistical Analysis

To identify the differences in PM concentration, PM ratio, and weather factors before, during, and after mist spraying at each park, we performed statistical analysis using the Tukey HSD procedure (R version 3.0.2 (R Core Development Team 2019, Vienna, Austria). Statistical significance was set at p < 0.05.

3. Results

3.1. Microclimate Conditions at the Study Site

At YCF, the average temperature, relative humidity, and wind speed during the evening rush hour were 25.2 °C, 27.9%, and 0.4 m/s, respectively (Table 1). During lunch, temperature and relative humidity (23.2 °C, 22.9%) were lower, and wind speed (1.3 m/s) was higher than that during the evening rush hour. There were no significant changes of air temperature and humidity between three experiments (before, during, and after) with a statistical analysis of the Tukey HSD procedure during the evening rush hour and lunch time.
In CRP, average temperature, relative humidity, and wind speed during the evening rush hour were 24.2 °C, 25.0%, and 0.5 m/s, respectively (Table 1). Conversely, the average weather factors (temperature, relative humidity, and wind speed) during the morning rush hour were 24.6 °C, 18.9%, and 1.3 m/s, and 20.4 °C, 14.8%, and 1.1 m/s during lunch, respectively. Additionally, changes in the microclimate conditions caused by mist spraying were not observed at CRP at any time.

3.2. Changes in PM According to Mist Spraying at YCF

The concentrations of PM10, PM2.5, and PM1.0 at the measuring points increased twice to thrice as soon as mist spraying began (Figure 3a). However, as the spraying ended, the PM concentration immediately decreased and returned to its initial value. The concentration variation of PM10 was lower than that of PM2.5 and PM1.0 in the evening rush hour, whereas the concentration variation of PM10 was large during lunch. However, after the end of spraying, the PM ratio was the same as before (Figure 3b). During the evening rush hour, PM2.5·PM10−1 and PM1.0·PM10−1 increased, and PM1.0·PM2.5−1 decreased as mist was sprayed. In contrast, during lunch, PM2.5·PM10−1, PM1.0·PM10−1, and PM1.0·PM2.5−1 were reduced.
When spraying mist, PM10, PM2.5, and PM1.0 concentrations were 3.6-, 2.6-, and 2.6-fold higher than the respective concentrations before spraying, respectively, and returned to the previous concentration after spraying (Table 2). The change in PM10 concentration was lower than that in PM2.5 and PM1.0 during the evening rush hour. For the PM ratio, PM2.5·PM10−1 and PM1.0·PM10−1 increased after mist spraying, although there was no significant difference, while PM1.0·PM2.5−1 significantly decreased. The change in PM10 concentration was 1.7 times larger than those of PM2.5 and PM1.0 during lunch. After mist spraying, PM2.5·PM10−1 decreased; however, there was no significant difference between PM1.0·PM10−1 and PM1.0·PM2.5−1 in the Tukey HSD procedure (p < 0.05). These results indicate that the concentration of PMx was significantly changed during mist spraying during the evening rush hour and lunchtime, and the ratio of PM concentration did not significantly differ at all times, except for the value of PM1.0·PM2.5−1 during the evening rush hour at the Yangjae citizens’ forests (YCF). It also represents the mist spraying could affect the concentration and the ratio of PM in a short time.

3.3. Changes in PM According to Mist Spraying at CRP

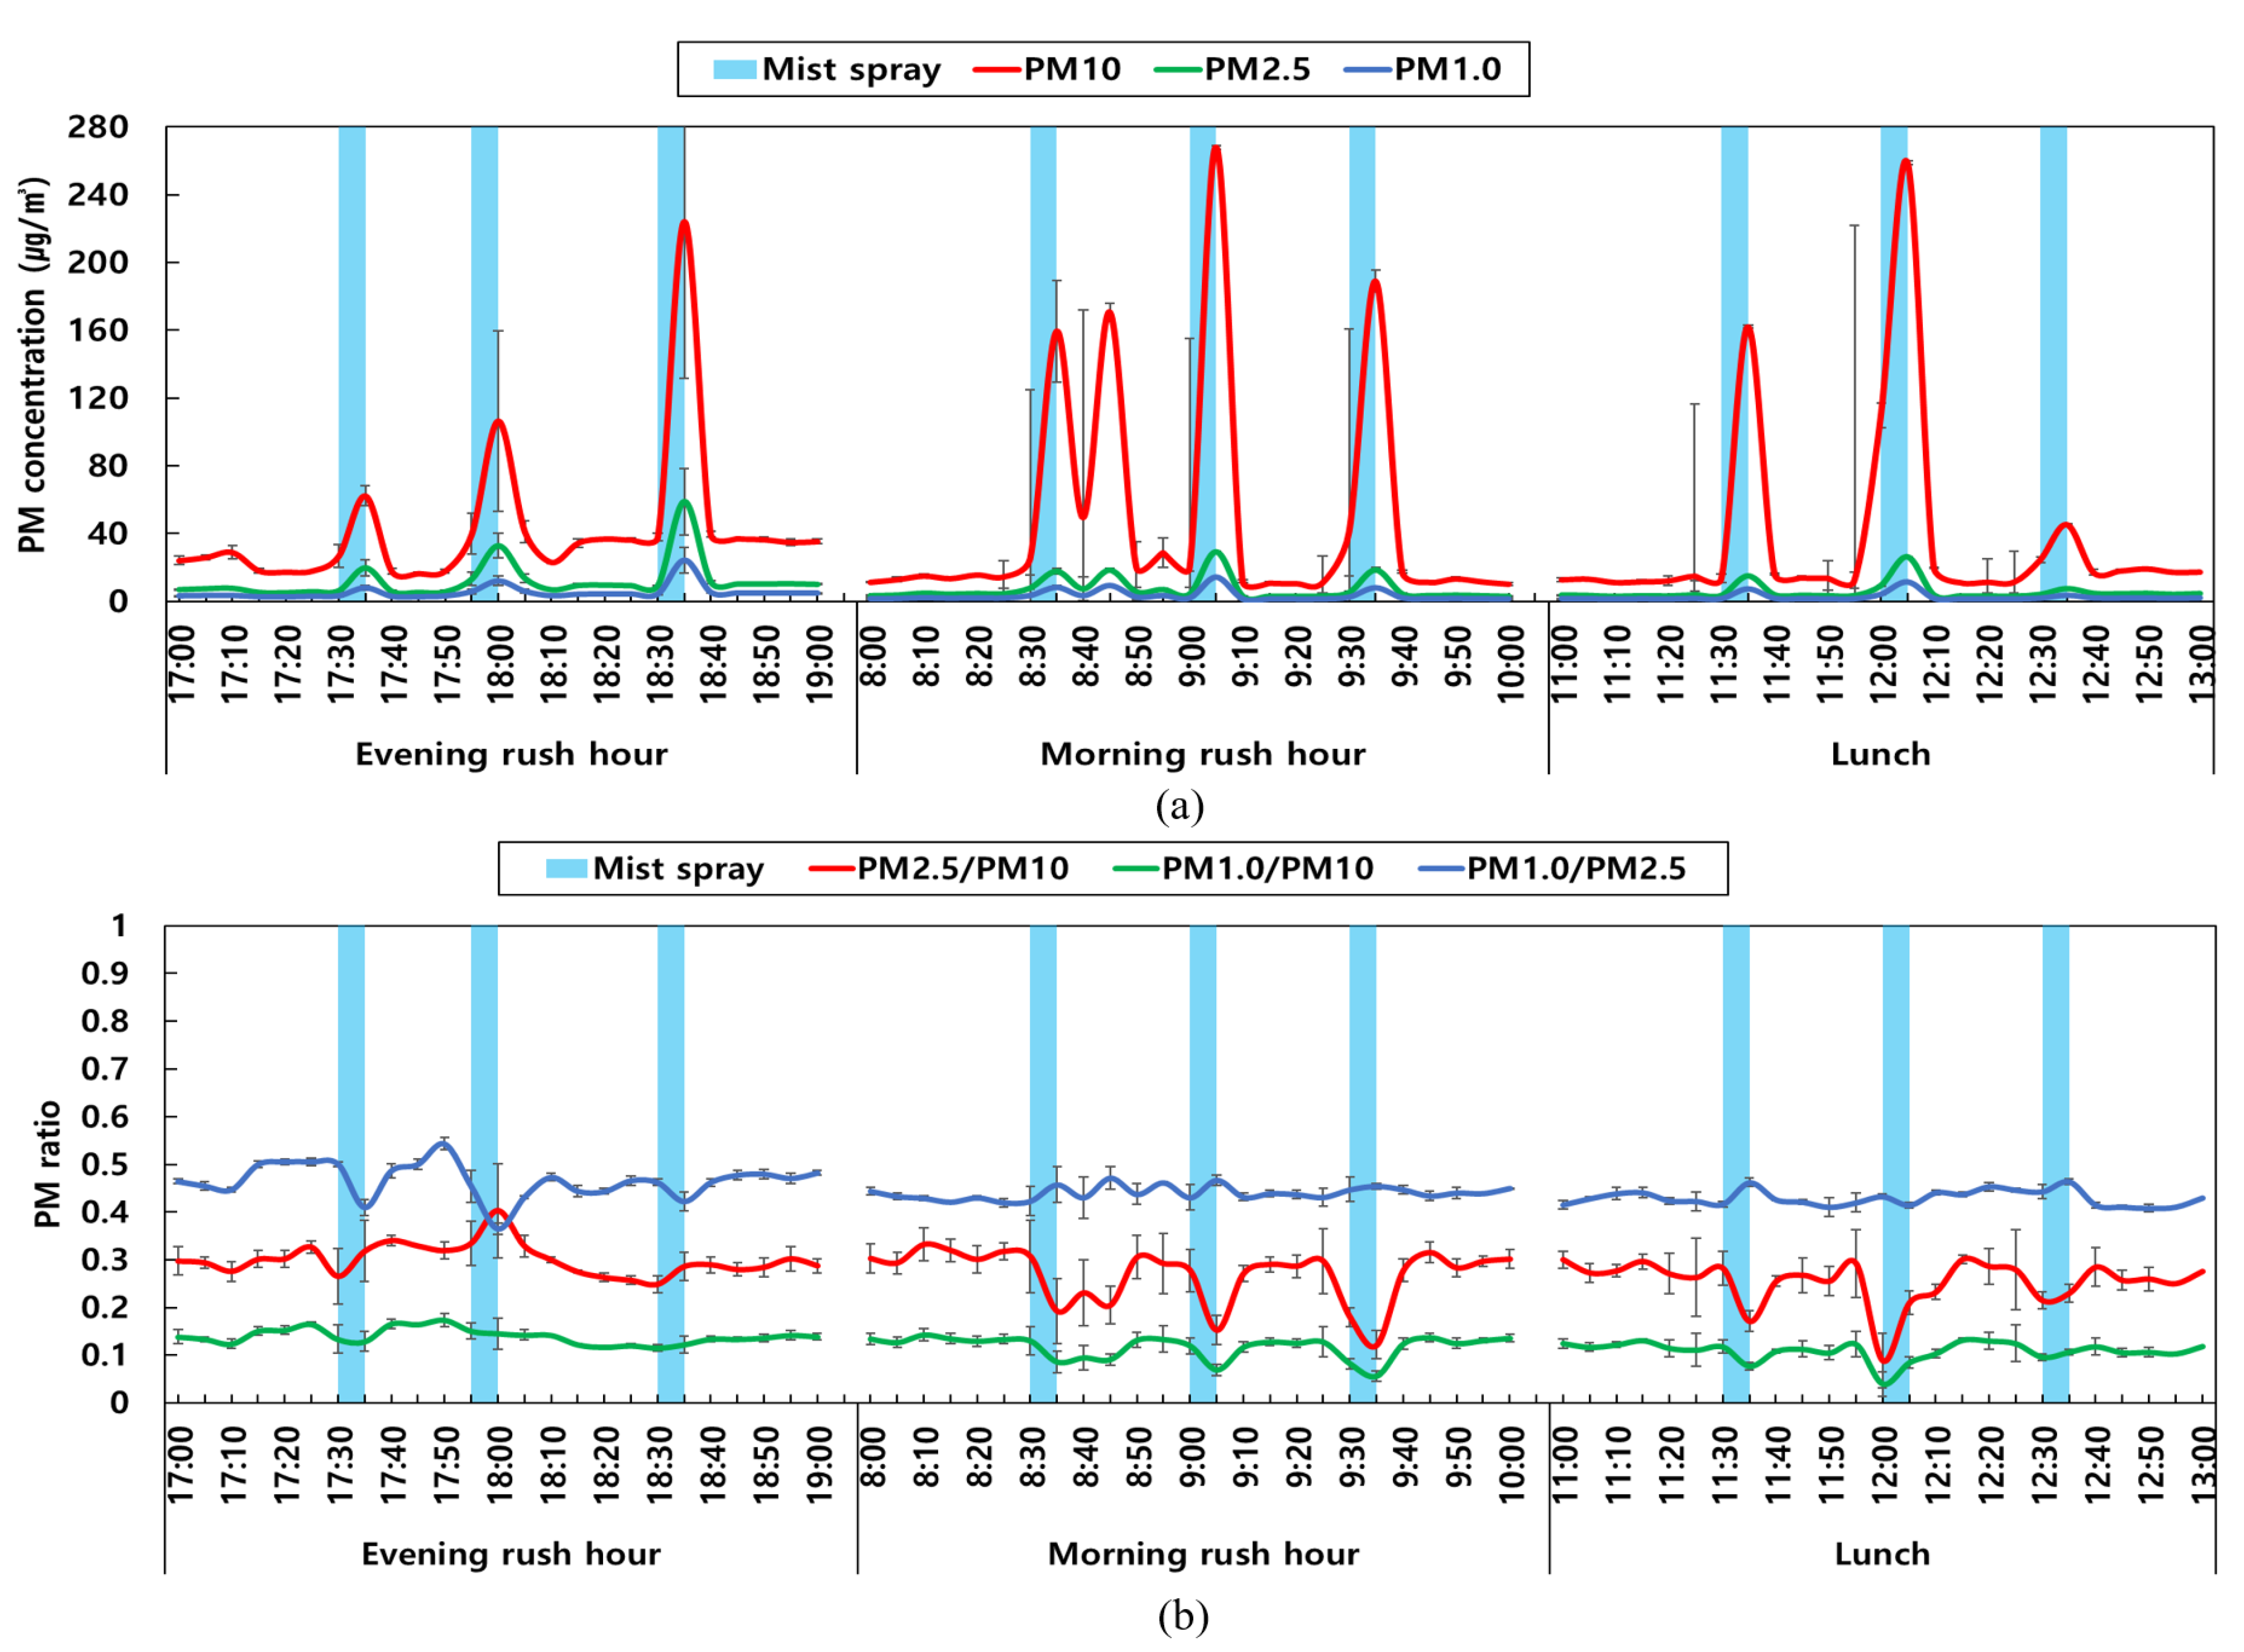
At CRP, the average real-time PM10, PM2.5, and PM1.0 concentrations caused by mist spraying increased three to five times compared with those before the mist spraying (Figure 4a). After the mist spraying ended, the PM concentration returned to the PM values before mist spraying. The concentration variation of PM10 was lower than those of PM2.5 and PM1.0 during the evening rush hour, whereas the concentration variation of PM10 was large during the morning rush hour and lunch. However, after mist spraying, the PM ratio was the same as before (Figure 4b). Moreover, during the evening rush hour, PM2.5·PM10−1 and PM1.0·PM10−1 increased, and PM1.0·PM2.5−1 decreased as mist was sprayed. During the morning rush hour and lunch, PM2.5·PM10−1, PM1.0·PM10−1, and PM1.0·PM2.5−1 were reduced.
When spraying mist, PM10, PM2.5, and PM1.0 concentrations were 5.4-, 2.9-, and 2.4-fold higher than before spraying, respectively, and returned to the previous concentration after spraying (Table 3). The change in PM10 concentration was lower than those in PM2.5 and PM1.0 during the evening rush hour. There was a significant decrease in PM2.5·PM10−1, PM1.0·PM10−1, and PM1.0·PM2.5−1 after mist spraying. The PM10 concentration changes were on average 2.4 times larger than those of PM2.5 and PM1.0 during the morning rush hour and lunch. After mist spraying, PM2.5·PM10−1 and PM1.0·PM10−1 decreased, whereas there was no significant difference in PM1.0·PM2.5−1 in the Tukey HSD procedure (p < 0.05). These results indicate that the concentration of PMx changed during mist spraying at all times, and the five items of PM concentration ratio were significantly lowered during evening rush hour, morning rush hour, and lunch time at Cheongdam Road Park (CRP). So, the mist spraying could affect the change in concentration and ratio of PMx, but the effect differed at the time.

4. Discussion

4.1. Microclimate Conditions According to Mist Spraying

YCF and CRP had higher relative humidities and lower wind speeds during the evening rush hour than at other measurement times (morning rush hour and lunch) (Table 1). The difference is related to common weather characteristics; the temperature and wind speed slowly increase, and relative humidity decreases from noon [35].
Regarding the changes in microclimate conditions related to mist spraying, there was no significant difference between weather factors before, during, and after mist spraying (Table 1). Our results were not consistent with those of [2], who found a significant reduction in temperature (7.3–8.0 °C) and an increase in relative humidity (2–3%). Kim et al. (2020a) [2] sprayed mist in August (13:00–16:00) when the intensity of sunlight was the strongest. There were no significant changes in meteorological traits after mist spraying, which could be related to the micro-scale formation of water vapor rather than water droplets in our device (design patent application by the National Institute of Forest Science, 30-2018-0057166).
Previous researchers have developed the device of water supply to the plants in dry conditions with a fog system [37,38,39], but water drops themselves can induce the detrimental effect of leaf burn by intense, focused sunlight in summer [40]. Sunlit water drops operated by water supply systems in urban forests can cause leaf burn damage and lower the function of trees. To solve this practical problem of a supply of water drops in dry conditions, this mist generator can provide the proper microclimate condition for trees and PM reduction in polluted city conditions.

4.2. Changes in PM According to Mist Spraying

Data collected at YCF and CRP showed that the PM concentration increased rapidly during mist spraying and returned to the previous concentration after spraying (Figure 3 and Figure 4). This could be related to mist spraying, which could affect the concentrations of PMx in surrounding environments, resulting in rapid changes in the PM concentration. We also considered the overestimation of PM concentration, as a PM measuring device using the light-scattering method was highly affected by moisture. However, we used silica gel, which absorbs moisture. The same nozzle generally sprays particles of the same size; thus, only a certain PM concentration may increase sharply when spraying the mist.
In one case during the lunch hour at YCF, the changes in PM ratio of PM2.5·PM10−1 significantly decreased, whereas those of PM1.0·PM10−1 and PM1.0·PM2.5−1 did not change after mist spraying (Table 2). In four cases during the morning rush and lunch hour at CRP, the changes in the PM ratio of PM2.5·PM10−1 and during the morning rush hour and lunch, the changes in the PM ratio according to mist spraying decreased and PM1.0·PM10−1 significantly decreased whereas those of PM1.0·PM2.5−1 did not change after mist spraying (Table 3). This finding indicates that PM particles of size 2.5–10 μm were likely to increase faster than those of other sizes when spraying mist. Thus, the combination of mist and PM resulted in condensation growth, which led to an increase in PM size.
The increased size of PM could facilitate faster deposition than that observed for PM of smaller size [18]. Therefore, reducing PM through mist spraying and mitigating high PM damage to trees will be possible. During the evening rush hour, there was no significant difference in PM2.5·PM10−1, PM1.0·PM10−1, and PM1.0·PM2.5−1, which decreased with mist spraying (Table 2 and Table 3). Unlike the growth of large PM observed during the morning rush hour and lunch, PM concentration (1.0–2.5 μm) increased faster during the evening rush hour. It is difficult to show the statistical relation with the microclimatic conditions and PM concentrations with our data. However, the air stagnation during the evening rushing hour could imply the relatedness between microclimate conditions and PM concentration in micro-scale environments. This seems to be more related to the microclimate conditions in the measuring period than to the effects of the mist.
During the morning rush hour and lunch, when high wind speed and low relative humidity occurred, the mist moved freely and combined with the surrounding PM [41,42,43]. However, during the evening rush hour, high relative humidity and low wind speed limited mist movement, which might have a greater effect on PM concentration than mist. Therefore, it is necessary to consider the microclimate conditions when using a mist generator in a high PM episode to increase condensation PM growth.
However, this study has a limitation, which is to apply the mist generator to control the PM concentration in the field condition directly and widely. But this study implies the possibility of the mist generator to reduce the PM concentration on a micro-temporal and spatial scale, but also to be applied to the healthy condition of trees during high episodes of PM.

5. Conclusions

This study showed that mist spraying could effectively condense and deposit PM during high PM episodes. YCF and CRP were observed to exhibit rapid changes in PM concentration during mist spraying. And the changes in PM size after spraying differed by the measurement time. During the morning rush hour and lunch, high wind speed and low relative humidity conditions might increase the mist mobility and the combination of the mist and PM, increasing the PM from 2.5 to 10 μm and hastening the deposition of these PM. During the evening rush hour, low wind speed and high relative humidity conditions seemed to inhibit mist movement, causing this microclimate condition to have a greater effect on PM concentration than that of the mist. Thus, it is necessary to consider the weather conditions when spraying the mist to improve its influence. In contrast, there were no changes in microclimate conditions due to mist spraying.
Previous conventional mist devices can induce the detrimental effect of leaf burn by intense, focused sunlight in summer, but this mist spraying might lower the leaf burn damage by water vapor. The findings of this study will serve as basic data for applying the effects of the mist generator to reduce PM and tree damage during high PM episodes. However, this study has a limitation on consistent experimental results, owing to various external weather conditions over a short period. In future studies, it will be necessary to analyze the size and growth rate of PM to accurately identify the PM reduction process for mist generators. Based on this, long-term monitoring of microclimate conditions should be conducted to increase the utilization of mist generators to improve the growth environment of trees. Mist spraying can provide an alternative management tool to reduce PM in urban forests during high episodes. This device can be practically applied in an open space of small gardens, street trees, and backyard gardens to diminish leaf burn damage by water droplets during sunny days. This prototype of mist spraying should be more developed and adapted to the field conditions in urban forests with in-depth research between microclimatic conditions and PM growth reductions in the near future.
Finally, we can suggest the main findings of this study as follows:
  • Mist spraying had significant effects on the concentration of PMx and the ratio of PM during a short time.
  • This prototype of mist spraying could effectively condense and deposit the PM during high PM episodes.
  • This device can be practically applied in an outdoor environment to diminish leaf burn damage by water droplets during sunny days.

Author Contributions

Conceptualization, methodology, formal analysis, investigation, writing—original draft, writing—review and editing, visualization: S.-Y.Y.; methodology, formal analysis: T.K.; conceptualization, methodology, formal analysis, investigation, project administration: S.C.; conceptualization, methodology, validation, writing—review and editing, supervision, project administration: C.-R.P.; conceptualization, methodology: D.-H.S. All authors have read and agreed to the published version of the manuscript.

Funding

This research received no external funding, it was internally funded by the National Institute of Forest Science of Korea, grant number NIFOS FE0000201801, and the Korea Forestry Promotion Institute, grant number 2022429B10-2224-0802 (Field test of ultra-fine dust reduction system).

Institutional Review Board Statement

Not applicable.

Informed Consent Statement

Not applicable.

Data Availability Statement

The raw data supporting the conclusions of this article will be made available by the authors on request.

Acknowledgments

We acknowledge the critical comments from the anonymous reviewers and editor.

Conflicts of Interest

Author Dong-Ha Song was employed by the company Smarcle Company. The remaining authors declare that the research was conducted in the absence of any commercial or financial relationships that could be construed as a potential conflict of interest.

References

  1. Jung, M.I.; Son, S.W.; Kim, H.C.; Kim, S.W.; Park, R.J.; Deliang, C. Contrasting synoptic weather patterns between non-dust high particulate matter events and Asian dust events in Seoul, South Korea. Atmos. Environ. 2019, 214, 116864. [Google Scholar] [CrossRef]
  2. Kim, J.; Kang, J.; Kim, H. Model design and demonstration test for the verification of temperature reduction effect cooling fog system with stainless steel. J. Environ. Sci. Int. 2020, 29, 683–689. [Google Scholar] [CrossRef]
  3. Davidson, C.I.; Phalen, R.F.; Solomon, P.A. Airborne particulate matter and human health: A review. Aerosol Sci. Technol. 2005, 39, 737–749. [Google Scholar] [CrossRef]
  4. Ysebaert, T.; Koch, K.; Samson, R.; Denys, S. Green walls for mitigating urban particulate matter pollution—A review. Urban For. Urban Green. 2021, 59, 127014. [Google Scholar] [CrossRef]
  5. Lelieveld, J.; Evans, J.S.; Fnais, M.; Giannadaki, D.; Pozzer, A. The contribution of outdoor air pollution sources to premature mortality on a global scale. Nature 2015, 525, 367–371. [Google Scholar] [CrossRef] [PubMed]
  6. Agudelo-Castañeda, D.M.; Teixeira, E.C.; Schneider, I.L.; Sheila, R.L.; Luis, F.O. Exposure to polycyclic aromatic hydrocarbons in atmospheric PM1.0 of urban environments: Carcinogenic and mutagenic respiratory health risk by age groups. Environ. Pollut. 2017, 224, 158–170. [Google Scholar] [CrossRef] [PubMed]
  7. Ma, T.; Duan, F.; He, K.; Qin, Y.; Tong, D.; Geng, G.; Liu, X.; Li, H.; Yang, S.; Ye, S.; et al. Air pollution characteristics and their relationship with emissions and meteorology in the Yangtze River Delta region during 2014–2016. J. Environ. Sci. (China) 2019, 83, 8–20. [Google Scholar] [CrossRef]
  8. Available online: https://eng.me.go.kr/eng/web/index.do?menuId=464 (accessed on 20 August 2024).
  9. Lovell, S.T.; Taylor, J.R. Supplying urban ecosystem services through multifunctional green infrastructure in the United States. Landsc. Ecol. 2013, 28, 1447–1463. [Google Scholar] [CrossRef]
  10. Andersson-Sköld, Y.; Klingberg, J.; Gunnarsson, B.; Kevin, C.; Ingela, G.; Marcus, H.; Igor, K.; Fredrik, L.; Åsa, O.S.; Håkan, P.; et al. A framework for assessing urban greenery’s effects and valuing its ecosystem services. J. Environ. Manag. 2018, 205, 274–285. [Google Scholar] [CrossRef] [PubMed]
  11. Matasov, V.; Marchesini, L.B.; Yaroslavtsev, A.; Giovanna, S.; Olga, F.; Ivan, S.; Simona, C.; Viacheslav, V.; Riccardo, V. IoT monitoring of urban tree ecosystem services: Possibilities and challenges. Forests 2020, 11, 775. [Google Scholar] [CrossRef]
  12. Nowak, D.J.; Crane, D.E.; Stevens, J.C. Air pollution removal by urban trees and shrubs in the United States. Urban For. Urban Green. 2006, 4, 115–123. [Google Scholar] [CrossRef]
  13. Escobedo, F.J.; Wagner, J.E.; Nowak, D.J.; De la Maza, C.L.; Rodriguez, M.; Crane, D.E. Analyzing the cost effectiveness of Santiago, Chile’s policy of using urban forests to improve air quality. J. Environ. Manag. 2008, 86, 148–157. [Google Scholar] [CrossRef] [PubMed]
  14. Shi, J.; Zhang, G.; An, H.; Yin, W.; Xia, X. Quantifying the particulate matter accumulation on leaf surfaces of urban plants in Beijing, China. Atmos. Pollut. Res. 2017, 8, 836–842. [Google Scholar] [CrossRef]
  15. Hofman, J.; Bartholomeus, H.; Janssen, S.; Kim, C.; Karen, W.; Shari, V.; Roeland, S. Influence of tree crown characteristics on the local PM10 distribution inside an urban street canyon in Antwerp (Belgium): A model and experimental approach. Urban For. Urban Green. 2016, 20, 265–276. [Google Scholar] [CrossRef]
  16. Leonard, R.J.; McArthur, C.; Hochuli, D.F. Particulate matter deposition on roadside plants and the importance of leaf trait combinations. Urban For. Urban Green. 2016, 20, 249–253. [Google Scholar] [CrossRef]
  17. McDonald, A.G.; Bealey, W.J.; Fowler, D.; Dragosits, U.S.; Smith, R.A.; Donovan, R.G.; Brett, H.E.; Hewitt, C.N.; Nemitz, E. Quantifying the effect of urban tree planting on concentrations and depositions of PM10 in two UK conurbations. Atmos. Environ. 2007, 41, 8455–8467. [Google Scholar] [CrossRef]
  18. Gugamsetty, B.; Wei, H.; Liu, C.N.; Awasthi, A.; Hsu, S.C.; Tsai, C.J.; Roam, G.D.; Wu, Y.C.; Chen, C.F. Source Characterization and Apportionment of PM10, PM2.5 and PM0.1 by Using Positive Matrix Factorization. Aerosol Air Qual. Res. 2012, 12, 476–491. [Google Scholar] [CrossRef]
  19. Terzaghi, E.; Wild, E.; Zacchello, G.; Bruno, E.L.C.; Kevin, C.J.; Antonio, D. Forest Filter Effect: Role of leaves in capturing/releasing air particulate matter and its associated PAHs. Atmos. Environ. 2013, 74, 378–384. [Google Scholar] [CrossRef]
  20. Wang, B.; Wei-kang, Z.; Niu, X.; Wang, X. Particulate matter adsorption capacity of 10 evergreen species in Beijing. Huan Jing Ke Xue= Huanjing Kexue 2015, 36, 408–414. [Google Scholar]
  21. Cregg, B.M.; Dix, M.E. Tree moisture stress and insect damage in urban areas in relation to heat island effects. J. Arboric. 2001, 27, 8–17. [Google Scholar]
  22. Fahey, R.T.; Bialecki, M.B.; Carter, D.R. Tree growth and resilience to extreme drought across an urban land-use gradient. Arboric. Urban For. 2013, 39, 279–285. [Google Scholar] [CrossRef]
  23. Zhao, S.P.; Yu, Y.; Yin, D.Y.; Qin, D.H. Contrasting response of ultrafine particle number and PM2.5 mass concentrations to Clean Air Action in China. Geophys. Res. Lett. 2021, 48, e2021GL093886. [Google Scholar] [CrossRef]
  24. Yamaguchi, M.; Izuta, T. Effects of Aerosol Particles on Plants. In Air Pollution Impacts on Plants in East Asia; Izuta, T., Ed.; Springer: Tokyo, Japan, 2017. [Google Scholar] [CrossRef]
  25. Katsoulas, N.; Bartzanas, T.; Boulard, T.; Mermier, M.; Kittas, C. Effect of vent openings and insect screens on greenhouse ventilation. Biosyst. Eng. 2006, 93, 427–436. [Google Scholar] [CrossRef]
  26. Li, S.; Willits, D.; Yunker, C. Experimental study of a high-pressure fogging system in naturally ventilated greenhouses. In Proceedings of the International Symposium on Greenhouse Cooling, Almería, Spain, 24–27 April 2006; Volume 719, pp. 393–400. [Google Scholar] [CrossRef]
  27. Arbel, A.; Yekutieli, O.; Barak, M. Performance of a fog system for cooling greenhouses. J. Agric. Eng. Res. 1999, 72, 129–136. [Google Scholar] [CrossRef]
  28. Available online: https://parks.seoul.go.kr (accessed on 20 August 2024).
  29. Available online: https://airkorea.or.kr (accessed on 20 August 2024).
  30. Wallace, L.A.; Wheeler, A.J.; Kearney, J.; Keth, V.; Hongyu, Y.; Ryan, H.K.; Pat, E.R.; Jeff, R.B.; Xiaohong, X. Validation of continuous particle monitors for personal, indoor, and outdoor exposures. J. Expo. Sci. Environ. Epidemiol. 2011, 21, 49–64. [Google Scholar] [CrossRef]
  31. Turnkey Instruments Ltd. Dustmate Operating Instructions. 2002. Available online: www.turnkey-instruments.com (accessed on 20 August 2024).
  32. Chen, J.; Yu, X.; Sun, F.; Xiaoxiu, L.; Yanlin, F.; Guodong, J.; Zhengming, Z.; Xuhui, L.; Li, M.; Huaxing, B. The concentrations and reduction of airborne particulate matter (PM10, PM2.5, PM1) at shelterbelt site in Beijing. Atmosphere 2015, 6, 650–676. [Google Scholar] [CrossRef]
  33. Wu, Y.; Liu, J.; Zhai, J.; Cong, L.; Wang, Y.; Ma, W.; Zhang, Z.; Li, C. Comparison of dry and wet deposition of particulate matter in near-surface waters during summer. PLoS ONE 2018, 13, e0199241. [Google Scholar] [CrossRef] [PubMed]
  34. McMurry, P.H.; Stolzenburg, M.R. On the sensitivity of particle size to relative humidity for Los Angeles aerosols. Atmospheric Environment 1989, 23, 497–507. [Google Scholar] [CrossRef]
  35. Yoo, S.Y.; Kim, T.H.; Ham, S.H.; Choi, S.M.; Park, C.R. Importance of urban green at reduction of particulate matters in Sihwa Industrial Complex, Korea. Sustainability 2020, 12, 7647. [Google Scholar] [CrossRef]
  36. Fan, H.; Zhao, C.; Yang, Y.; Yang, X. Spatio-Temporal Variations of the PM2.5/PM10 Ratios and Its Application to Air Pollution Type Classification in China. Front. Environ. Sci. 2021, 9, 692440. [Google Scholar] [CrossRef]
  37. Chon, Y.S.; Ha, S.H.; Jeong, K.J.; Choi, K.O.; Yun, J.G. Effect of mist treatment on the growth and quality of cut rose “Hanmaum” during summer. Korean J. Hortic. Sci. Technol. 2013, 31, 538–543. [Google Scholar] [CrossRef]
  38. Nam, S.W.; Kim, K.S.; Giacomelli, G.A. Improvement of cooling efficiency in greenhouse fog system using the dehumidifier. J. Bio-Environ. Control 2005, 14, 29–37, (In Korean with English Abstract). [Google Scholar]
  39. Sase, S.; Ishii, M.; Hayashi, M.; Sabeh, N.; Romero, P.; Giacomelli, G.A. Effect of natural ventilation rate on relative humidity and water use for fog cooling in a semiarid greenhouse. In Proceedings of the International Symposium on Greenhouse Cooling, Almería, Spain, 24–27 April 2006; Volume 719, pp. 385–392. [Google Scholar] [CrossRef]
  40. Egri, A.; Horváth, A.; Kriska, G.; Horváth, G. Optics of sunlit water drops on leaves: Conditions under which sunburn is possible. New Phytol. 2010, 185, 979–987. [Google Scholar] [CrossRef] [PubMed]
  41. Arbel, A.; Barak, M.; Shklyar, A. Combination of forced ventilation and fogging systems for cooling greenhouses. Biosyst. Eng. 2003, 84, 45–55. [Google Scholar] [CrossRef]
  42. Villarreal-Guerrero, F.; Kacira, M.; Fitz-Rodríguez, E.; Linker, R.; Kubota, C.; Giacomelli, G.A.; Arbel, A. Simulated performance of a greenhouse cooling control strategy with natural ventilation and fog cooling. Biosyst. Eng. 2012, 111, 217–228. [Google Scholar] [CrossRef]
  43. Kim, J.; Kim, W.; Kim, E. Analysis of temperature influence experiment on green spaces in campus. J. Korea Acad. Ind. Coop. Soc. 2020, 21, 511–520. [Google Scholar] [CrossRef]
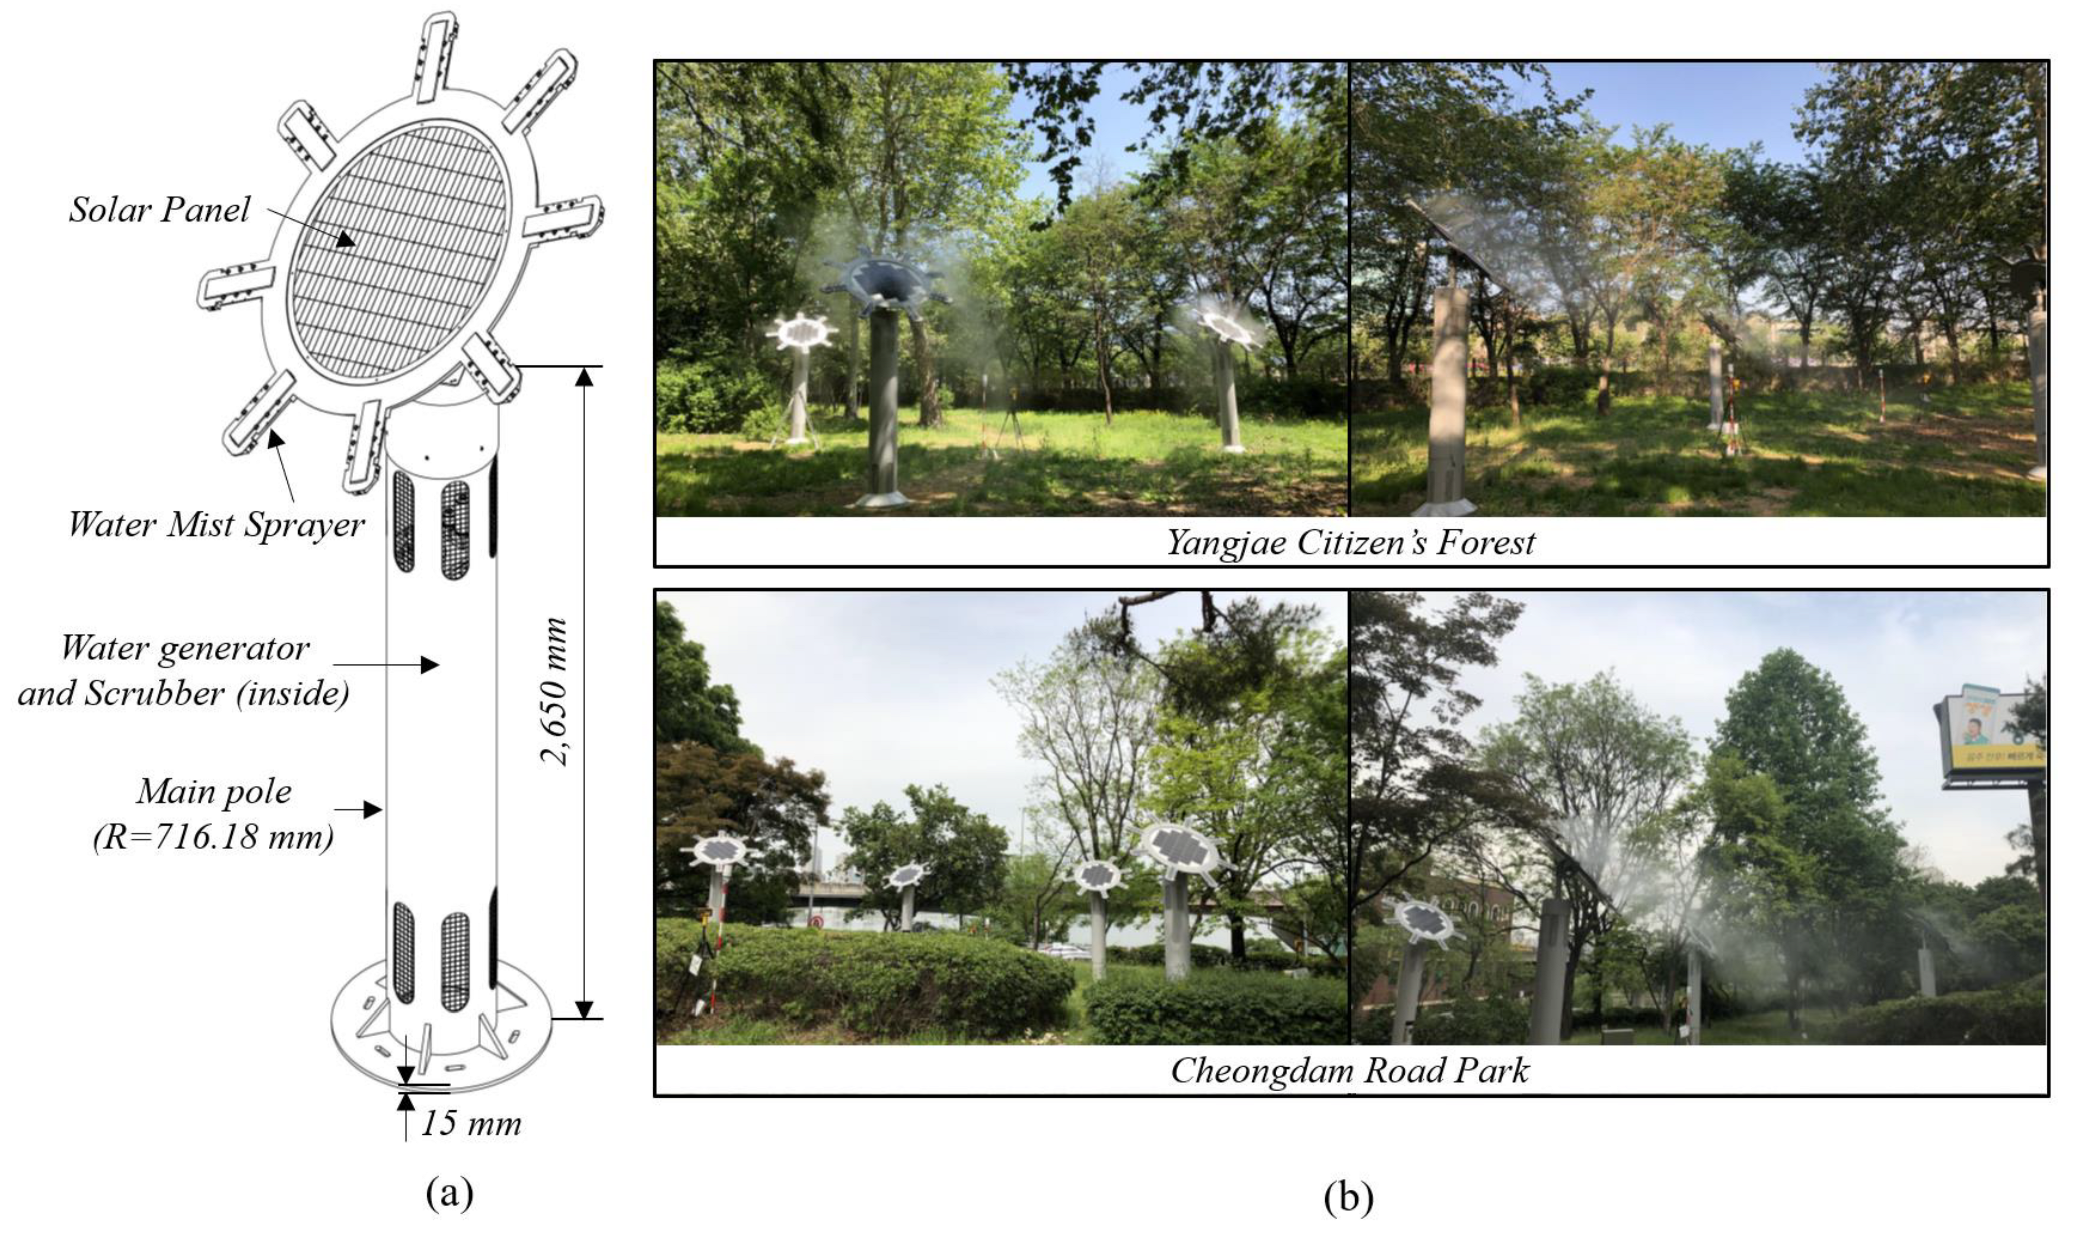
Figure 1. (a) Schematic illustration of the mist generator; (b) mist generators installed at the study site.
Applsci 14 09061 g001
Figure 2. (a) Location and wind rose (green color notes the speed of 4~6 m/s) of the Yangjae Citizen’s Forest (YCF, three points at the green-colored urban parks near grey-colored roads); (b) the location and wind rose of the Cheongdam Road Park (CRP) in Seocho-gu and Gangnam-gu, Seoul, Republic of Korea.
Applsci 14 09061 g002
Figure 3. PMx concentrations (mean ± S.D., μg/m3) at the upper part (a) and PM concentration ratio (mean ± S.D.) at the lower part (b) in the Yangjae Citizen’s Forest (YCF) before and after mist spraying.
Applsci 14 09061 g003
Figure 4. PMx concentrations (mean ± S.D., μg/m3) at the upper part (a) and PM concentration ratio (mean ± S.D.) at the lower part (b) in the Cheongdam Road park (CRP) before and after mist spraying.
Applsci 14 09061 g004
Table 1. The average values of meteorological factors of air temperature, relative humidity, and wind speed between three experiments (before, during, and after) of spraying mist in the Yangjae Citizen’s Forest (YCF) and Cheongdam Road Park (CRP).
Measuring
Time
Mist
Spray
Yangjae Citizen’s ForestCheongdam Road Park
TemperatureRelative HumidityWind
Speed
TemperatureRelative
Humidity
Wind
Speed
-------°C-----------%--------m/s---------°C--------%-------m/s----
Evening
Rush hour
Before25.4 a
(±0.2)
26.8 a
(±0.7)
0.4 a
(±0.0)
24.4 a
(±0.2)
24.2 a
(±0.9)
0.5 a
(±0.1)
During25.2 a
(±0.3)
27.9 a
(±1.3)
0.4 a
(±0.0)
24.2 a
(±0.3)
25.0 a
(±1.3)
0.5 a
(±0.1)
After25.0 a
(±0.3)
27.4 a
(±1.5)
0.4 a
(±0.0)
24.1 a
(±0.2)
24.8 a
(±1.3)
0.4 a
(±0.1)
Morning
Rush hour
Before 24.6 a
(±0.2)
18.4 a
(±0.3)
1.2 a
(±0.1)
During 24.6 a
(±0.2)
18.9 a
(±0.4)
1.3 a
(±0.1)
After 24.7 a
(±0.4)
18.2 a
(±0.4)
1.2 a
(±0.1)
LunchBefore23.3 a
(±0.1)
22.3 a
(±0.2)
1.4 a
(±0.1)
20.4 a
(±0.3)
14.4 a
(±0.2)
0.9 a
(±0.1)
During23.2 a
(±0.1)
22.9 a
(±0.4)
1.3 a
(±0.2)
20.4 a
(±0.3)
14.8 a
(±0.4)
1.1 a
(±0.1)
After23.5 a
(±0.2)
22.6 a
(±0.2)
1.0 a
(±0.2)
20.8 a
(±0.2)
14.5 a
(±0.4)
1.0 a
(±0.1)
a The value in parenthesis shows the standard deviation, and there was no significant difference in three experiments at p < 0.05 according to the Tukey HSD procedure.
Table 2. The concentrations (mean ± S.D., μg/m3) and PM concentration ratio (mean ± S.D.) among the three experiments (before, during, and after spraying) during the evening rush hour and lunch hour in the Yangjae Citizen’s Forest (YCF).
TimeMist
Spray
PM10PM2.5PM1.0PM2.5/PM10PM1.0/PM10PM1.0/PM2.5
-----------------μg/m3------------------
Evening
Rush hour
Before27.0(±2.4) b8.4(±0.6) b4.3(±0.3) b0.33(±0.01) a0.17(±0.01) a0.51(±0.00) a
During53.7(±5.8) a21.0(±3.3) a9.1(±1.2) a0.39(±0.04) a0.18(±0.01) a0.46(±0.02) b
After33.0(±3.7) b11.6(±1.4) b5.3(±0.5) b0.37(±0.02) a0.18(±0.01) a0.47(±0.01) ab
LunchBefore13.2(±0.5) b4.3(±0.1) b2.2(±0.0) b0.34(±0.01) a0.18(±0.01) a0.52(±0.00) a
During67.1(±22.1) a11.5(±1.5) a6.5(±0.7) a0.27(±0.02) b0.15(±0.01) a0.54(±0.00) a
After14.2(±0.7) b4.2(±0.1) b2.2(±0.0) b0.32(±0.01) ab0.17(±0.00) a0.53(±0.00) a
The bold letters and different upper letter a & b indicate difference at p < 0.05 according to the Tukey HSD procedure.
Table 3. The concentration (mean ± S.D., μg/m3) of PMx and PM concentration ratio (mean ± S.D.) among three experiments (before, during, and after spraying) during the evening rush hour and lunch hour in the Cheongdam Road Park (CRP).
TimeMist
Spray
PM10PM2.5PM1.0PM2.5/PM10PM1.0/PM10PM1.0/PM2.5
-----------------μg/m3------------------
Evening
Rush hour
Before23.9(±4.1) b6.9(±0.8) b3.4(±0.3) b0.30(±0.01) a0.15(±0.01) a0.49(±0.01) a
During82.9(±30.5) a23.4(±8.0) a9.6(±3.2) a0.31(±0.02) a0.13(±0.01) a0.44(±0.02) b
After29.2(±4.6) b9.0(±1.4) b4.2(±0.6) b0.31(±0.01) a0.15(±0.01) a0.47(±0.01) a
Morning
Rush hour
Before16.9(±2.8) b4.8(±0.6) b2.1(±0.3) b0.30(±0.00) a0.13(±0.00) a0.44(±0.01) a
During117.1(±42.2) a13.9(±4.0) a6.4(±1.9) a0.21(±0.03) b0.09(±0.01) b0.45(±0.01) a
After45.4(±25.8) b6.8(±2.5) b3.2(±1.3) b0.27(±0.02) a0.12(±0.01) a0.44(±0.01) a
LunchBefore12.7(±0.6) b3.5(±0.1) b1.5(±0.0) b0.27(±0.01) a0.12(±0.00) a0.43(±0.01) a
During102.4(±38.8) a11.1(±3.5) a5.0(±1.5) a0.20(±0.03) b0.09(±0.01) b0.44(±0.01) a
After16.2(±1.3)b4.1(±0.2) b1.7(±0.1) b0.27(±0.01) a0.11(±0.00) a0.43(±0.00) a
The bold letters and different upper letter a & b indicate the significant difference at p < 0.05 according to the Tukey HSD procedure.
Disclaimer/Publisher’s Note: The statements, opinions and data contained in all publications are solely those of the individual author(s) and contributor(s) and not of MDPI and/or the editor(s). MDPI and/or the editor(s) disclaim responsibility for any injury to people or property resulting from any ideas, methods, instructions or products referred to in the content.