Abstract
Multi-scale assessment of shear behavior in the tunnel carbonaceous slate is critical for evaluating the stability of the surrounding rock. In this study, direct shear tests were conducted on carbonaceous slates from the Muzhailing Tunnel, considering five bedding dip angles (β) and four normal stresses (σn). The micro-mechanism was also examined by combining acoustic emission (AE) and energy rate with PFC2D Version 5.0 (particle flow code 2D Version 5.0 software) numerical simulations. The results showed a linear relationship between peak shear stress and normal stress, with the rate of increase inversely related to β. Cohesion increased linearly with β, while internal friction angle and AE activity decreased; the energy release rate is 3.92 × 10⁸ aJ/s at 0° and 1.93 × 10⁸ aJ/s at 90°. Shearing along the preset fracture plane was the main failure mode. Increased normal stress led to lateral cracks perpendicular to or intersecting the shear plane. Cracks along the bedding plane formed a broad shear band with concentrated compressive force, and inclined bedding was accompanied by a dense tension chain along the bedding plane.
1. Introduction
Bedding planes are a crucial factor contributing to rock anisotropy and significantly influencing the corresponding mechanical behavior, which may result in variations in the mechanical properties of rocks depending on their orientation. Therefore, a thorough analysis of the bedding plane in anisotropic rocks and its impact is imperative in rock mechanics and engineering. Previous studies on the anisotropic characteristics of rocks have mainly focused on the influence of the bedding dip angle (β) on fracture strength under uniaxial and triaxial conditions [1] for various lithologies such as sandstone, slate, shale, and schist [2,3]. However, investigating the influence of β on the shear failure behavior of rocks under shear stress conditions is also equally critical [4,5,6,7].
Most research studies on shear failure behavior have been conducted at a laboratory scale, involving the analysis of mechanical parameters and failure modes of bedding. Various theoretical models are established to estimate the strength. Pan et al. performed direct shear, uniaxial, and triaxial tests on rocks with different bedding angles and thicknesses to illustrate anisotropy [8]. Alsuwaidi et al. and Heng et al. [9,10] evaluated the anisotropic shear strength characteristics of shale by direct shear tests and theoretical analyses. Ikari et al. [11] examined the impact of different angles between shale bedding planes and shear forces on macroscopic crack evolution under biaxial shear, proposing a simplified model for predicting shear strength in anisotropic rocks with varying β through direct shear tests. Fan et al. [12] conducted direct shear tests on shale samples, analyzing the anisotropy of acoustic emission (AE) parameter characteristics and strain field evolution during crack formation and propagation.
It is pertinent to note that investigating the microscopic mechanisms of layered rocks should not be underestimated. In addition to laboratory tests, numerical simulations based on rock mechanical test results can enhance the comprehension of test conclusions [13]. Recently, AE has become prevalent for monitoring the microcracking process and understanding the failure mechanism of rocks [14,15,16]. Several researchers have explored its applicability in monitoring the degradation process of joint asperities under shear loading [17,18,19,20]. Therefore, studying layered rock shear failure behavior from the perspective of AE characteristics and numerical simulation is imperative for a better and more thorough understanding [21]. Similarly, Liu et al. [22] studied the anisotropic shear mechanism of slate by experimental and numerical analyses, revealing that the shear strength and failure mechanism of layered rocks is significantly influenced by β. Noori et al. [23] experimentally investigated the fracture behavior and micro-fracture process of anisotropic sandstone and analyzed it using particle flow code. The influence of bedding plane inclination angle on strength was found to be more significant than that of bedding plane spacing.
Although extensive studies have been conducted earlier to reveal the mechanical anisotropies of layered rocks [24,25,26,27,28,29], including their strength, deformation, and failure modes, the findings on the influence of different normal stresses (σn) and bedding dip angles on the failure behavior of layered rocks, especially under shear, are sparse. Since under different engineering loads or natural conditions, rocks are subjected to varying stresses in various environments, such as the static or pseudo-static loadings in rainfall-induced rockslides and the dynamic loadings in earthquake-triggered rockslides, systematically studying the shear failure behavior of layered slate under different normal stresses and bedding dip angles is critical. Therefore, this research work is carried out in which the direct shear tests were conducted on rock specimens with varying β values (0°, 30°, 45°, 60°, 90°) under different σn levels (5 MPa, 10 MPa, 15 MPa, 20 MPa). AE was used to monitor microcrack evolution during shear failure in real time. Subsequently, numerical simulation tests under identical conditions were performed, and a systematic analysis of shear strength parameters, failure modes, and microcrack evolution characteristics was conducted to offer a theoretical reference for addressing anisotropy issues in rock engineering.
2. Materials and Methodology
2.1. Materials
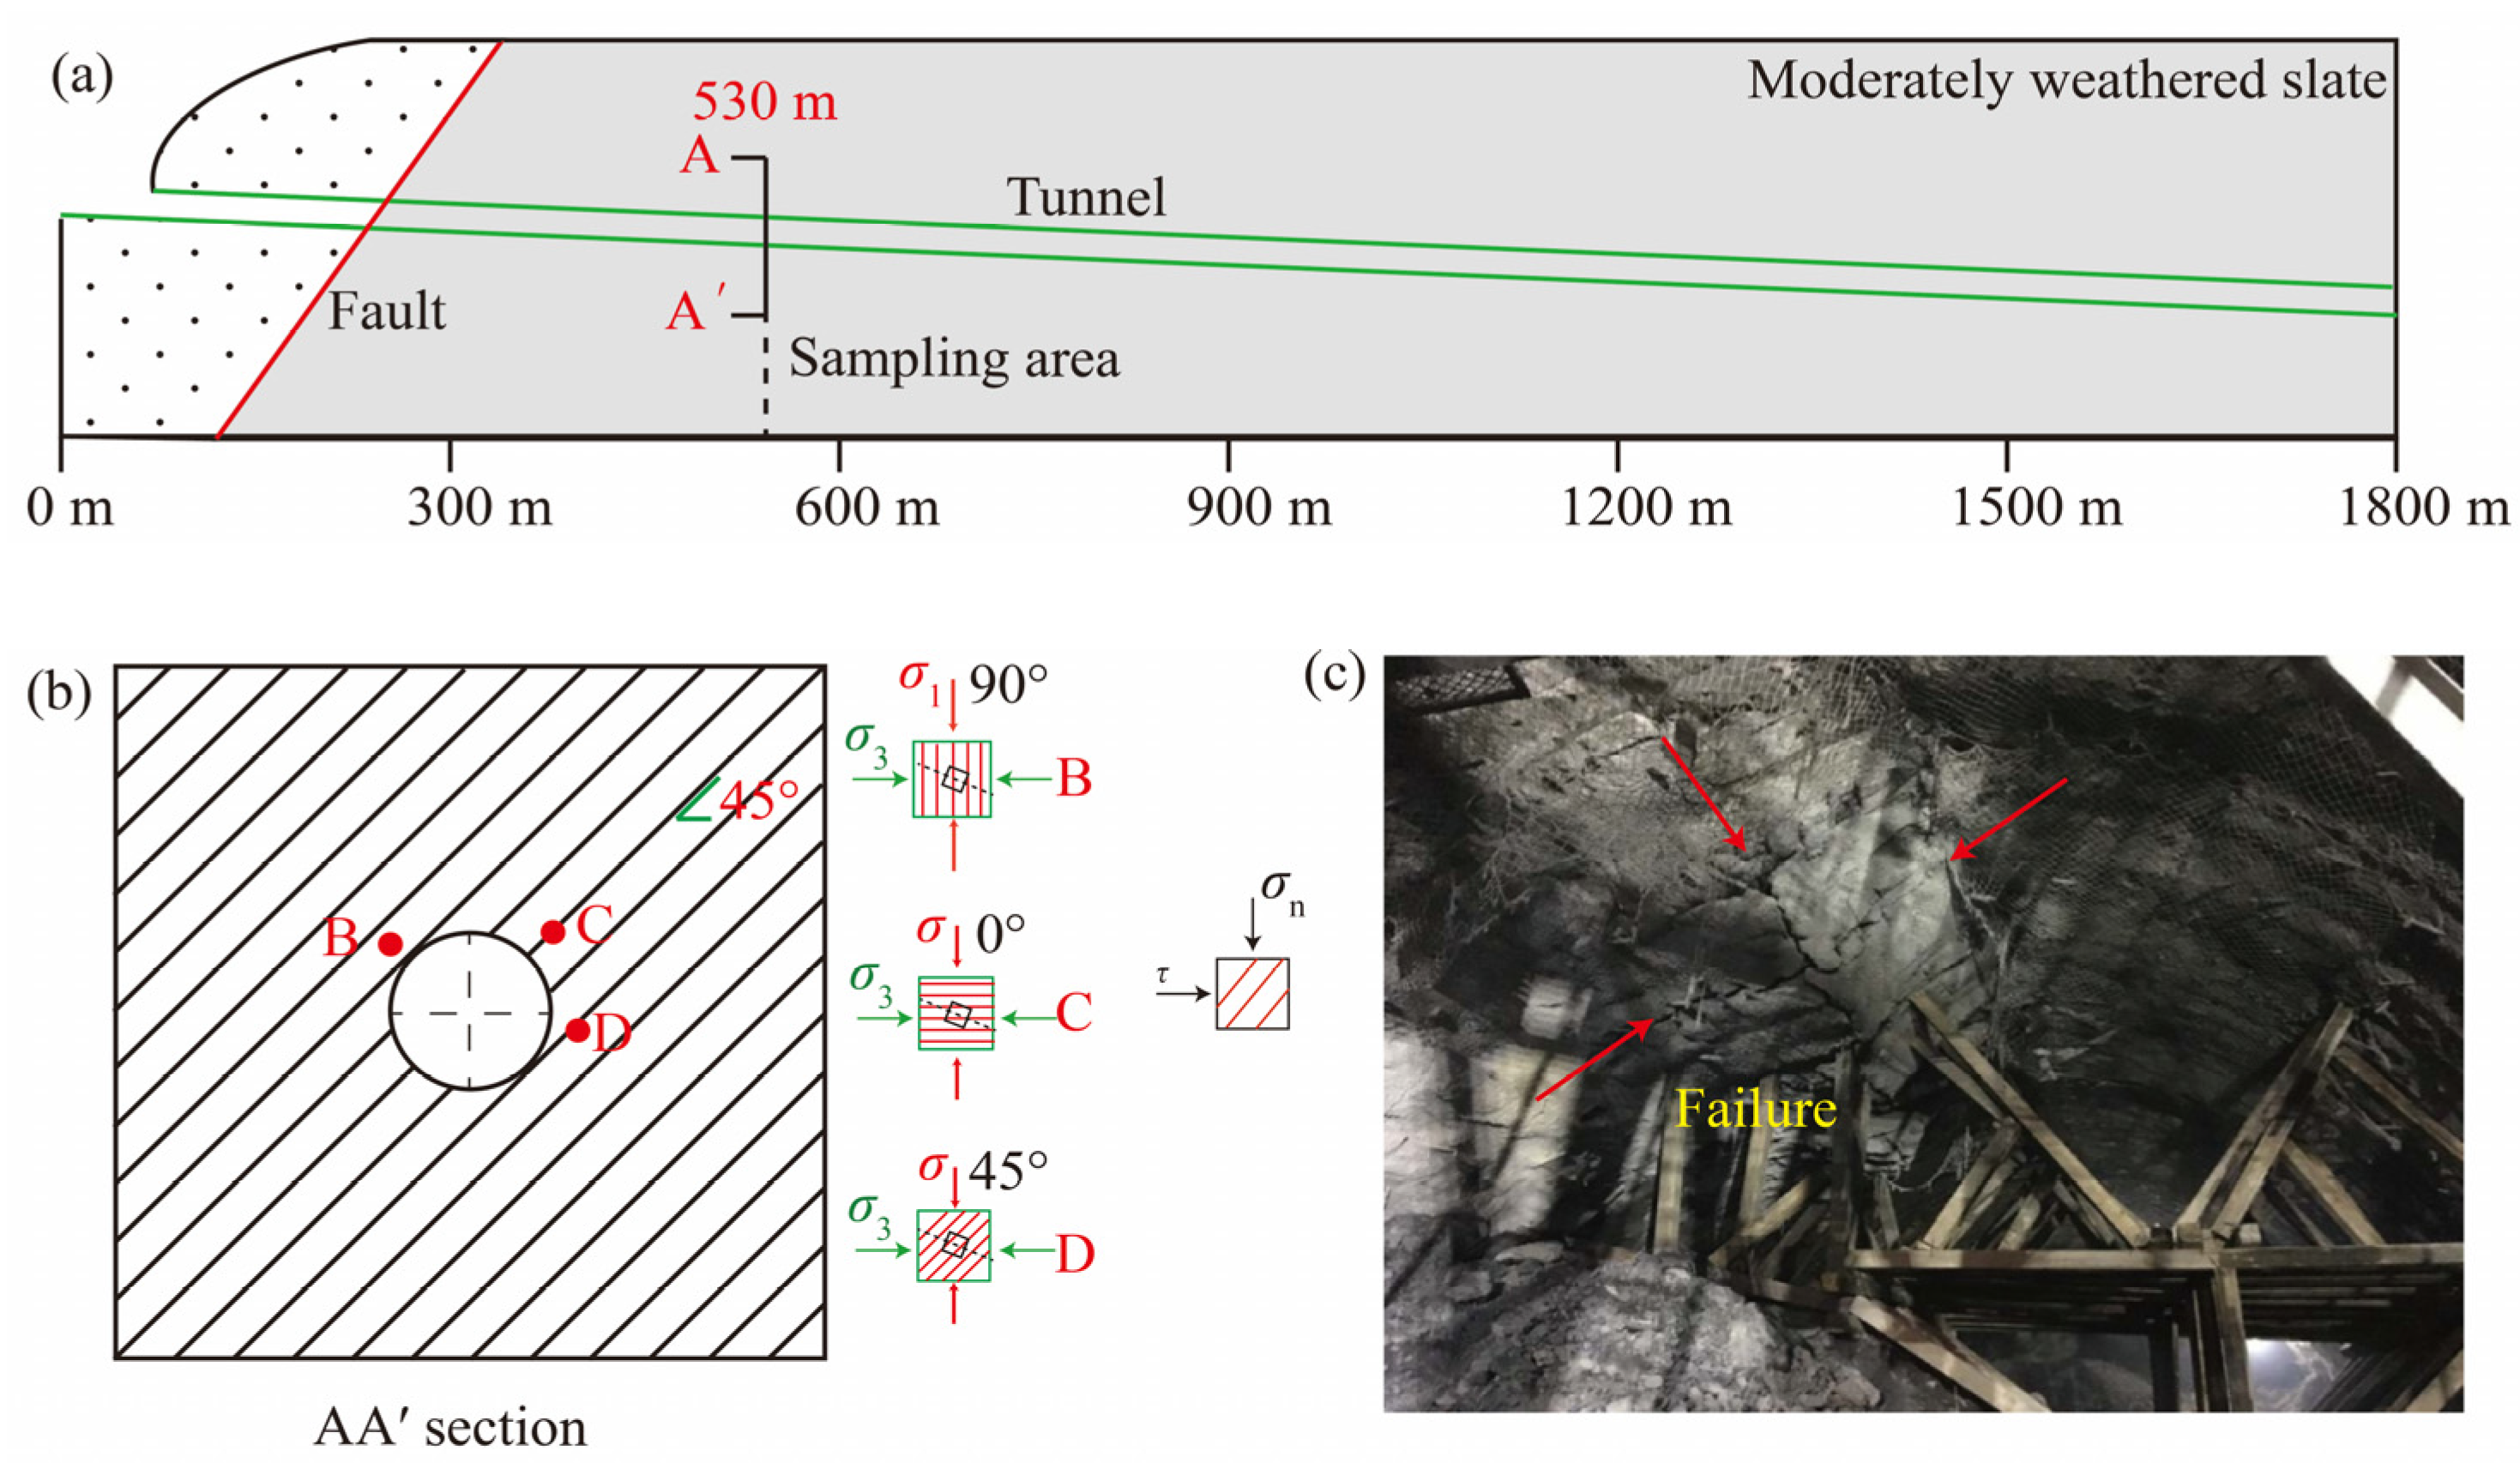
Slate samples were collected from the Muzhailing Tunnel in Gansu province, China. The tunnel, extending in the N71°E direction, is 1813 m long, with a maximum burial depth of 591 m. The in situ stress direction is N34°E, and the maximum horizontal principal stress is 24.95 MPa. The predominant surrounding rock also consists of moderately weathered slate (grade V surrounding rock). The engineering geology profile of the Muzhailing Tunnel is shown in Figure 1a. The sampling area was located at the tunneling face, specifically at excavation footage 530 m. The rock element exhibits varying dip angles in different regions of the tunnel (AA′ section in Figure 1b). The bedding plane of the rock element is vertical at the left shoulder of the tunnel (β = 90°), while the left shoulder of the tunnel has undergone significant deformation in the field (Figure 1c). The evident bending and shear failure was observed under the support of the steel arch.
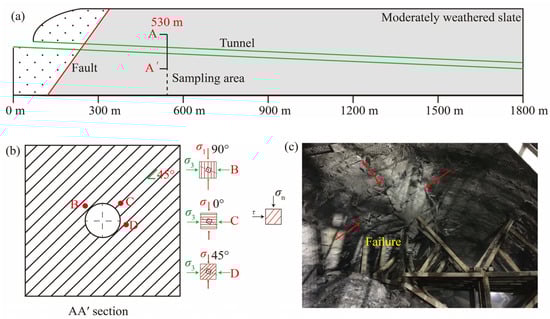
Figure 1.
(a) Engineering geology profile of Muzhailing Tunnel, (b) diagram of bedding dip angle (β) of rock element at different locations of tunnel section, and (c) severe deformation in the left shoulder of tunnel [30].
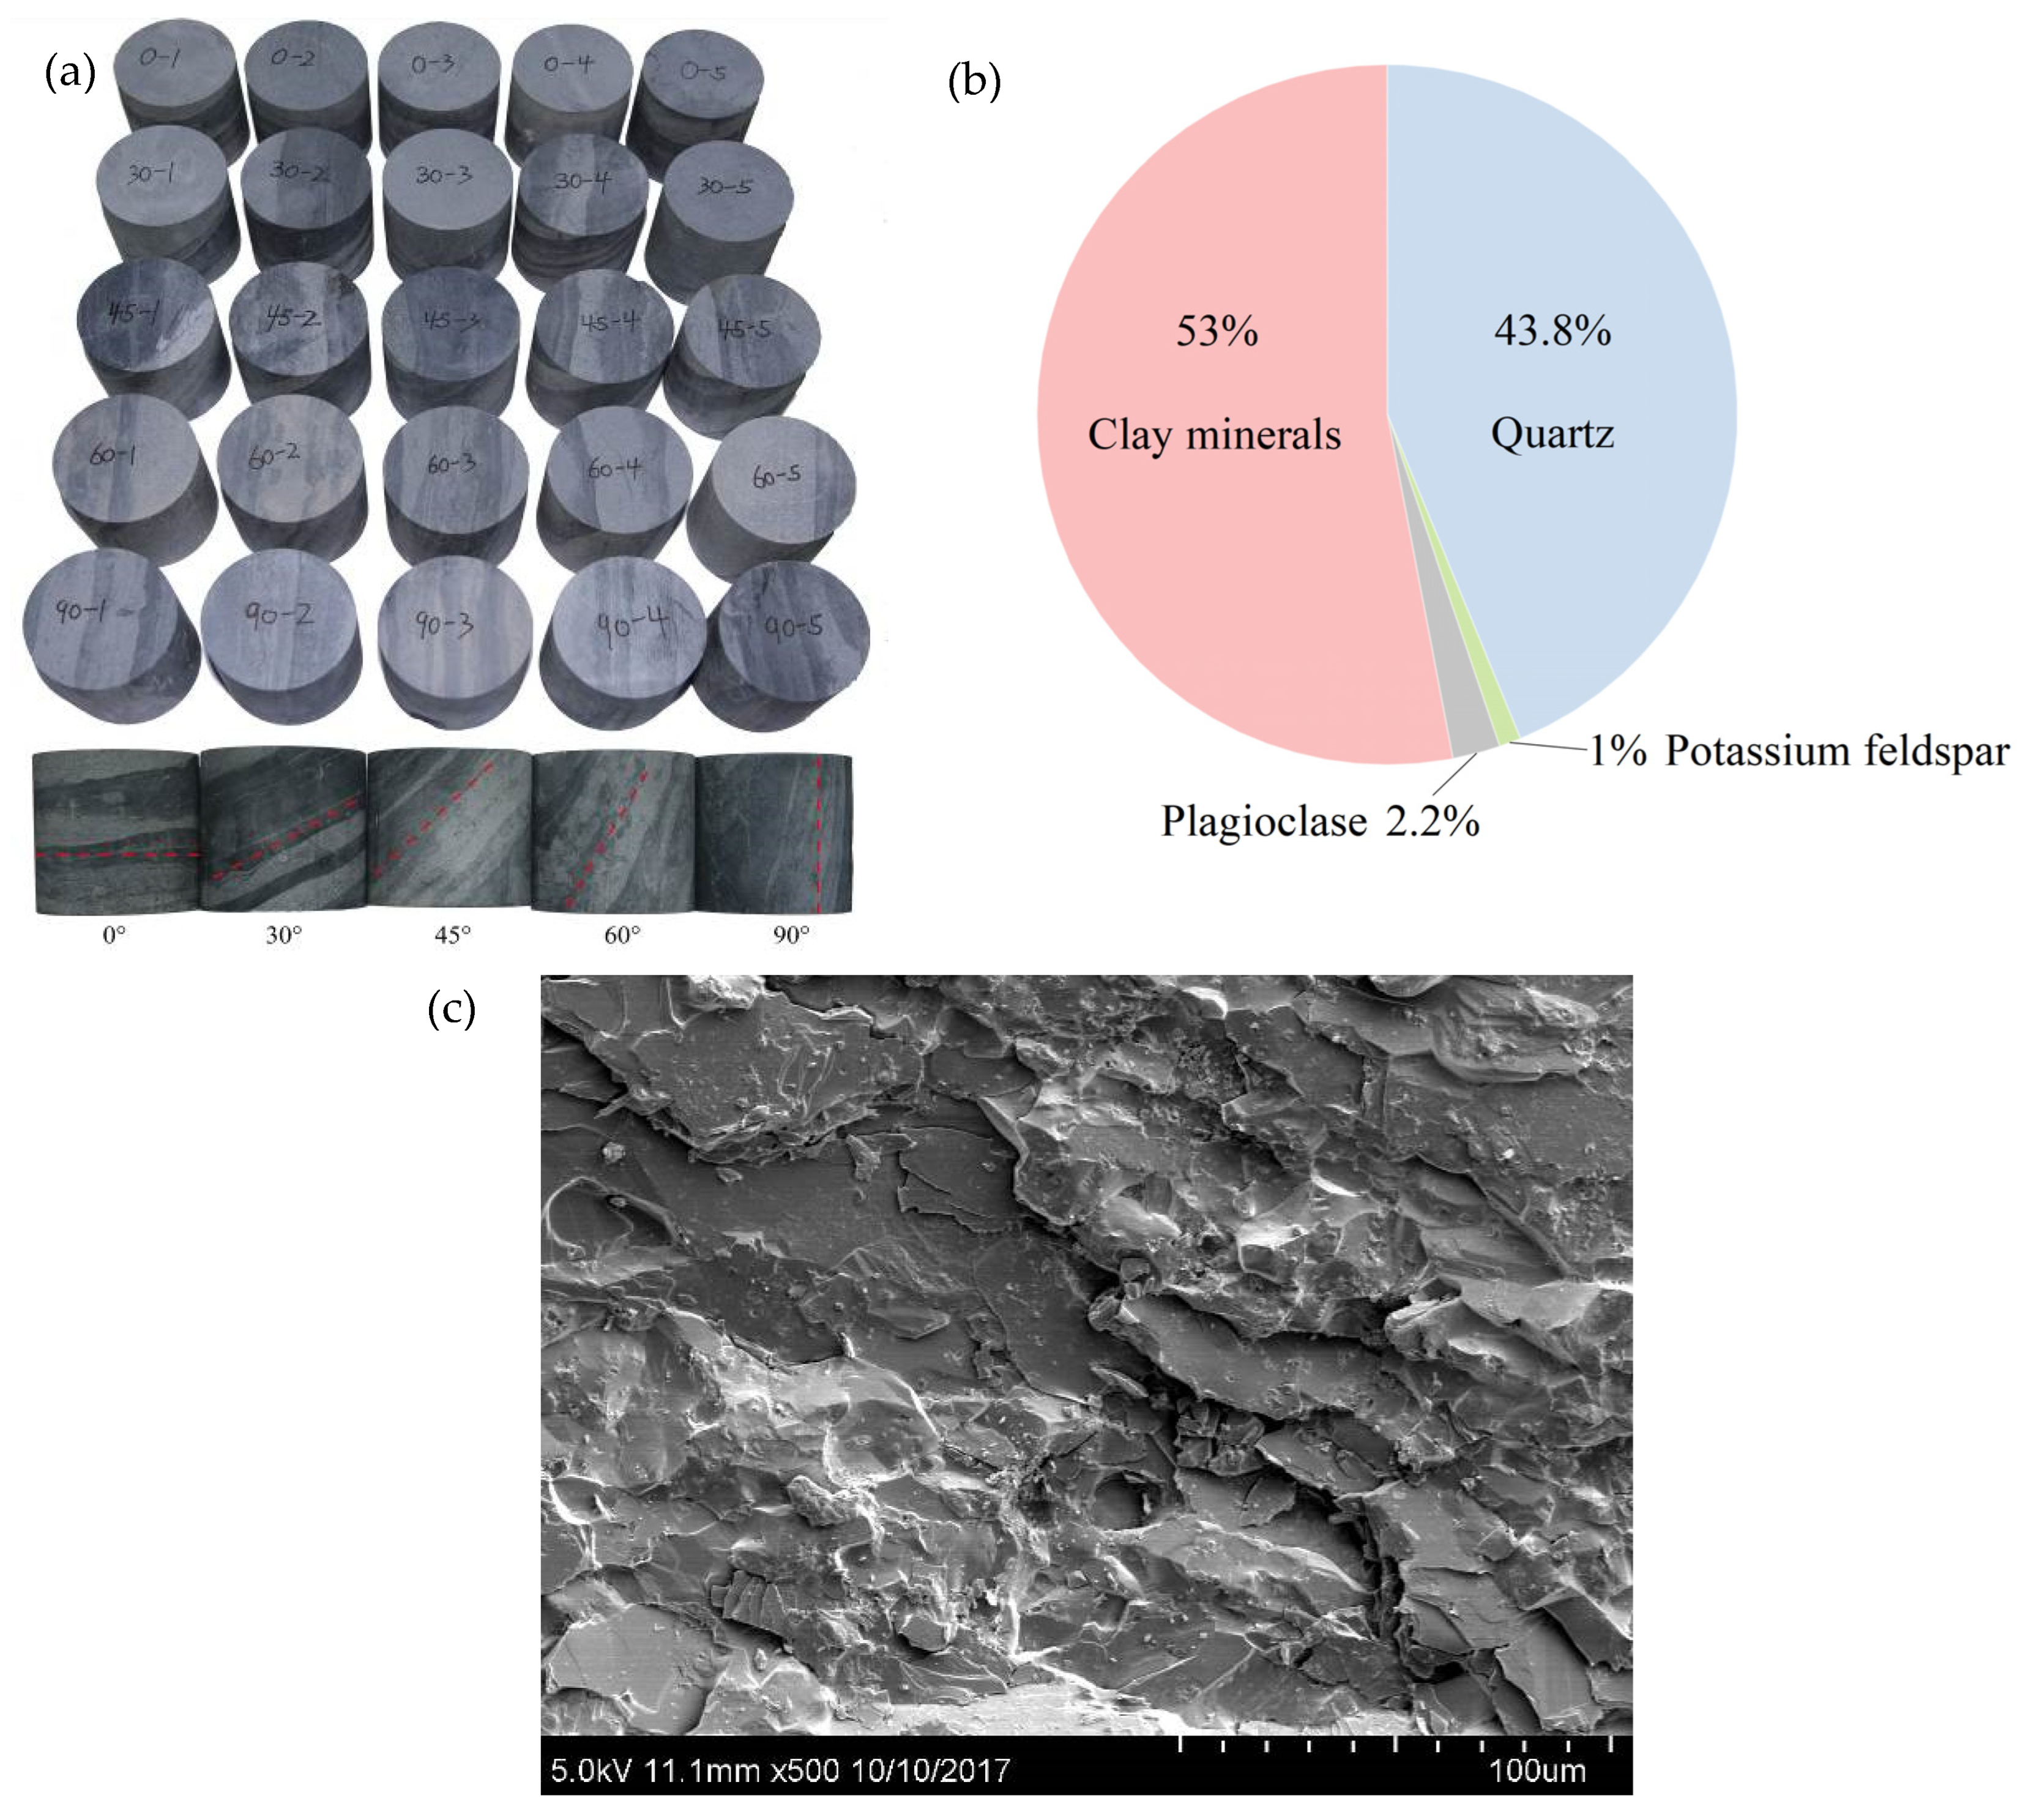
The slate was molded into cylindrical specimens of 50 mm diameter and height, as shown in Figure 2a. Twenty-five samples were categorized into five groups based on β (0°, 30°, 45°, 60°, and 90°), representing the angle between the bedding plane and the horizontal plane. Four samples from each group were tested under different σn values (5 MPa, 10 MPa, 15 MPa, 20 MPa). The remaining sample was spare and remained untested. Before conducting the tests, X-ray diffraction (XRD) analysis was performed on the slate samples. The major minerals identified in the slate were quartz (43.8%), potassium feldspar (1.0%), plagioclase (2.2%), and clay minerals (53.0%, predominantly illite) (Figure 2b). Also, scanning electron microscopy (SEM) imaging revealed a distinct layered structure within the slate (Figure 2c).

Figure 2.
(a) Slate samples for direct shear test, (b) mineral composition, and (c) microscopic structure of the slate.
2.2. Experimental Method
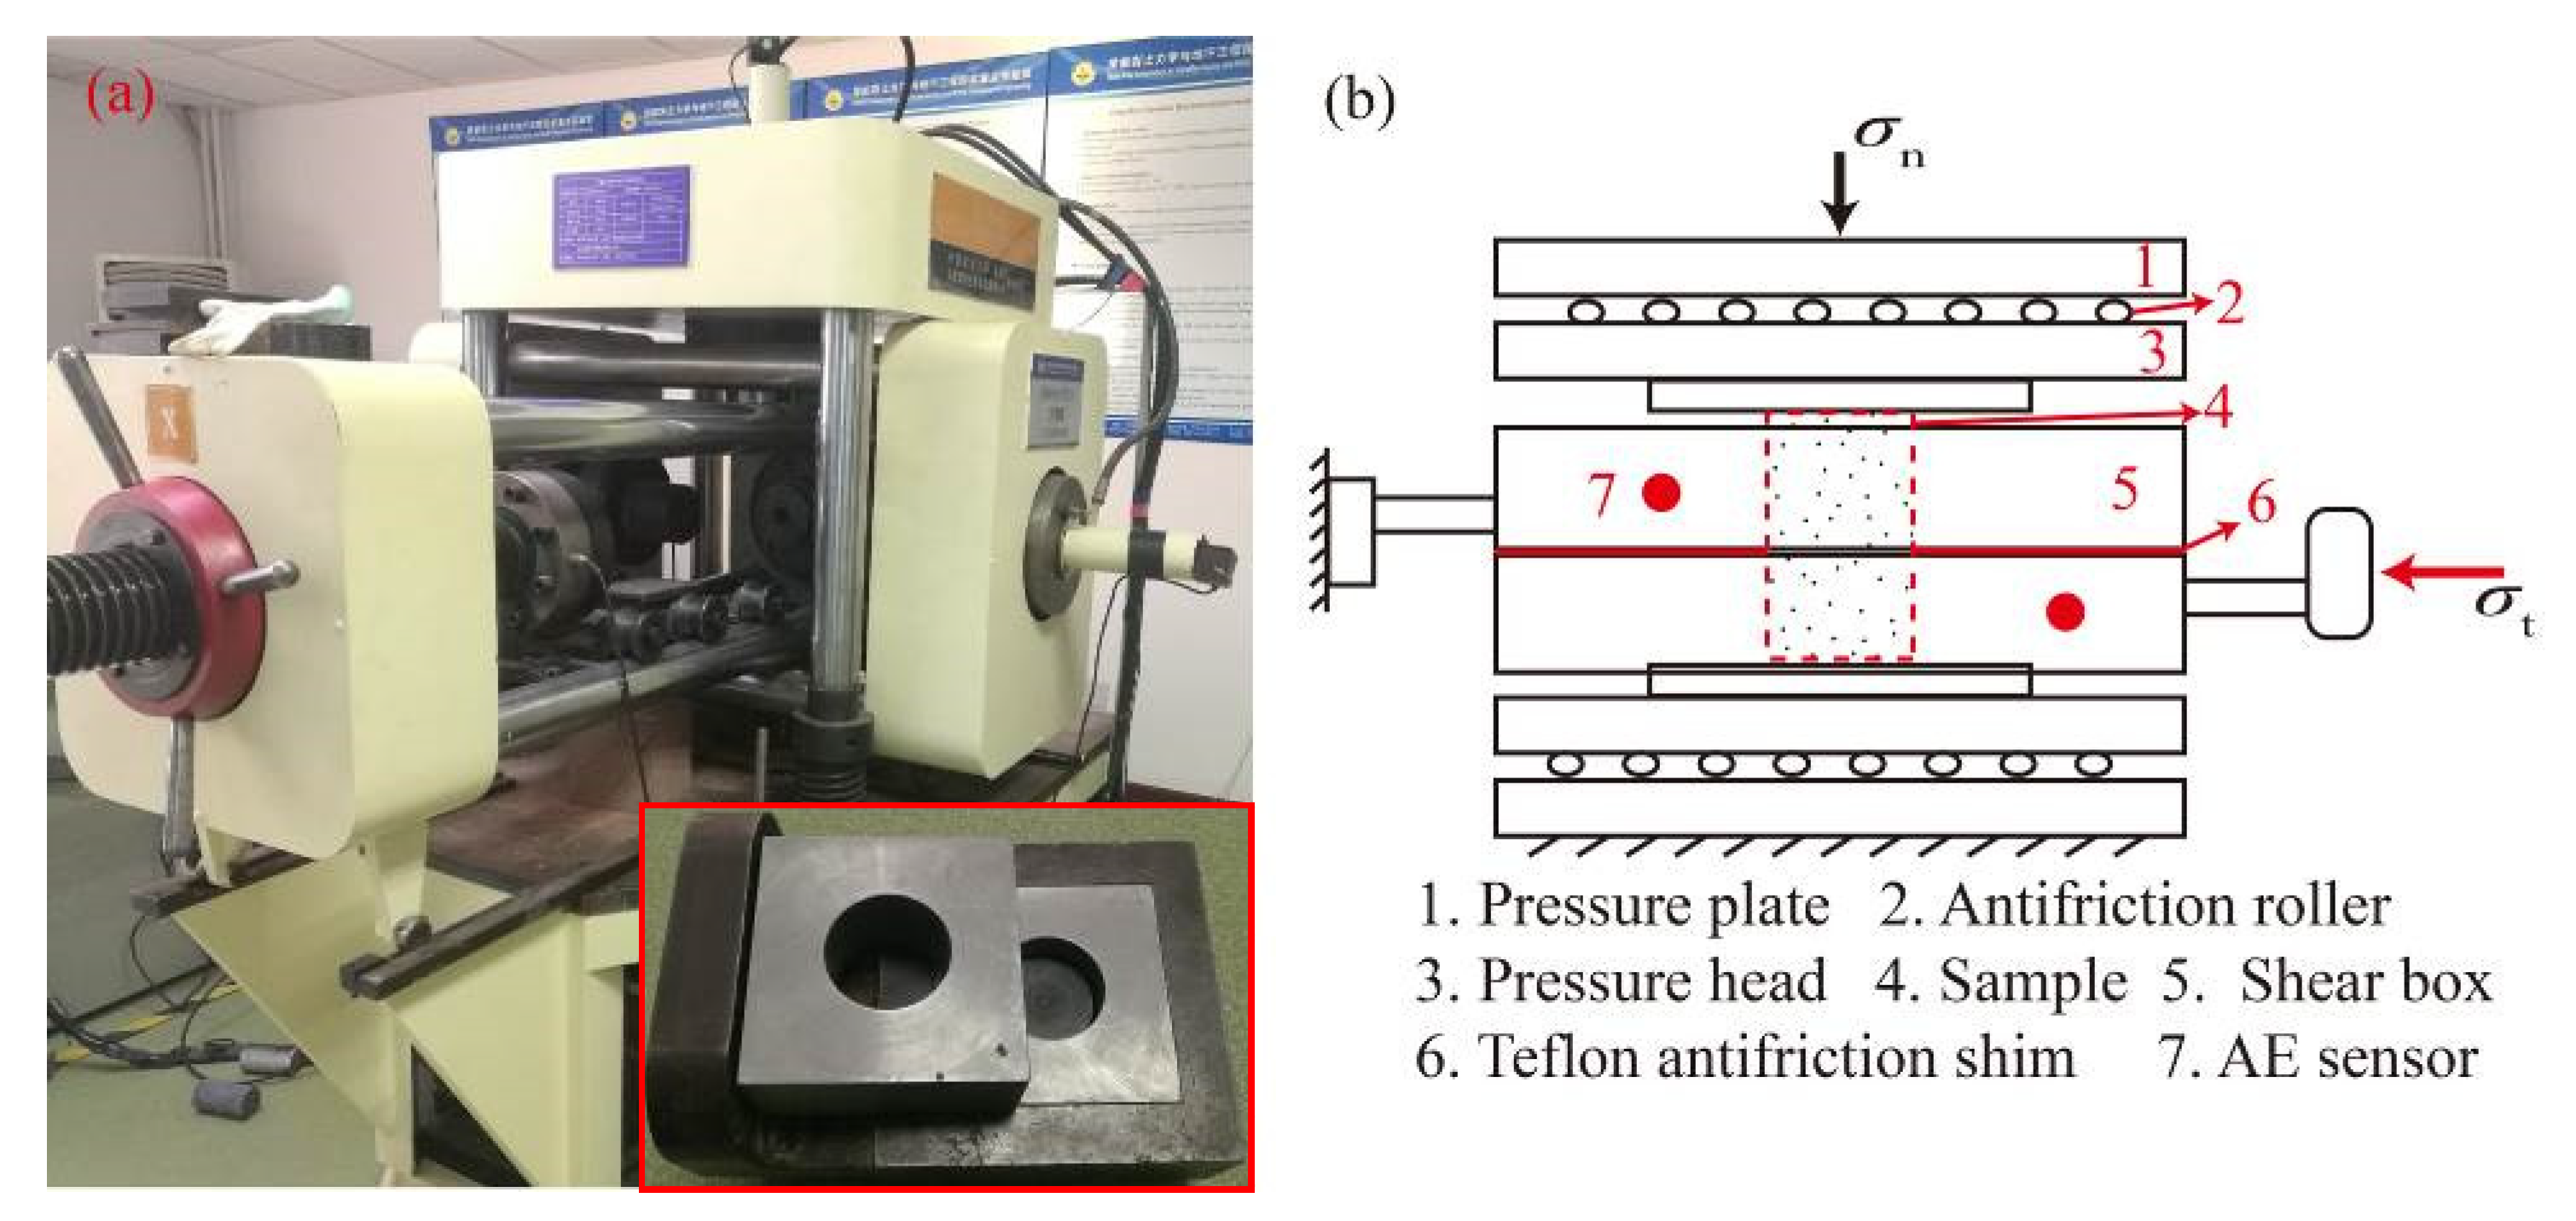
Direct shear tests were performed on a true triaxial electrohydraulic servo-controlled loading system (Figure 3a). The schematic representation of the direct shear test is shown in Figure 3b. Anti-friction rollers were strategically placed between the loading plate and pressure head to minimize friction. A Teflon anti-friction shim was also inserted between the upper and lower shear boxes to reduce friction. Initially, the normal stress σn was applied to the specimen at a loading rate of 0.5 kN/s, maintaining the load for 100 s to ensure an even stress distribution. Subsequently, shear stress was applied at a rate of 0.004 mm/s until the final failure.
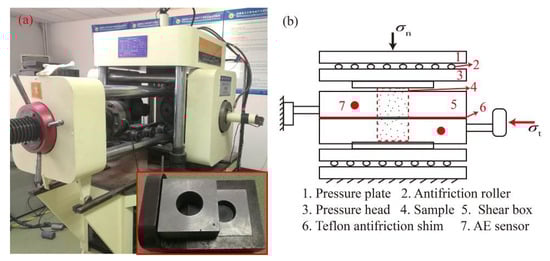
Figure 3.
(a) Ture triaxial loading system and shear box and (b) schematic of principal of the shear box [31].
An American Physical Acoustics Corporation (PAC) Micro-II system was used for AE monitoring throughout the test. This system incorporates 18-bit A/D switching technology, enabling instantaneous time waveform recording. In this study, the AE signals were amplified 100 times (with a 40 dB amplifier). The threshold, sampling frequency, and sampling length were set at 40 dB, 2 MHz, and 4096 data points, respectively. Two Nano-30 sensors with a 100–400 kHz response frequency were affixed to the upper and lower parts of the shear box using glue (Figure 3b) to acquire the AE signals.
3. Test Results
3.1. Shear Strength Parameters
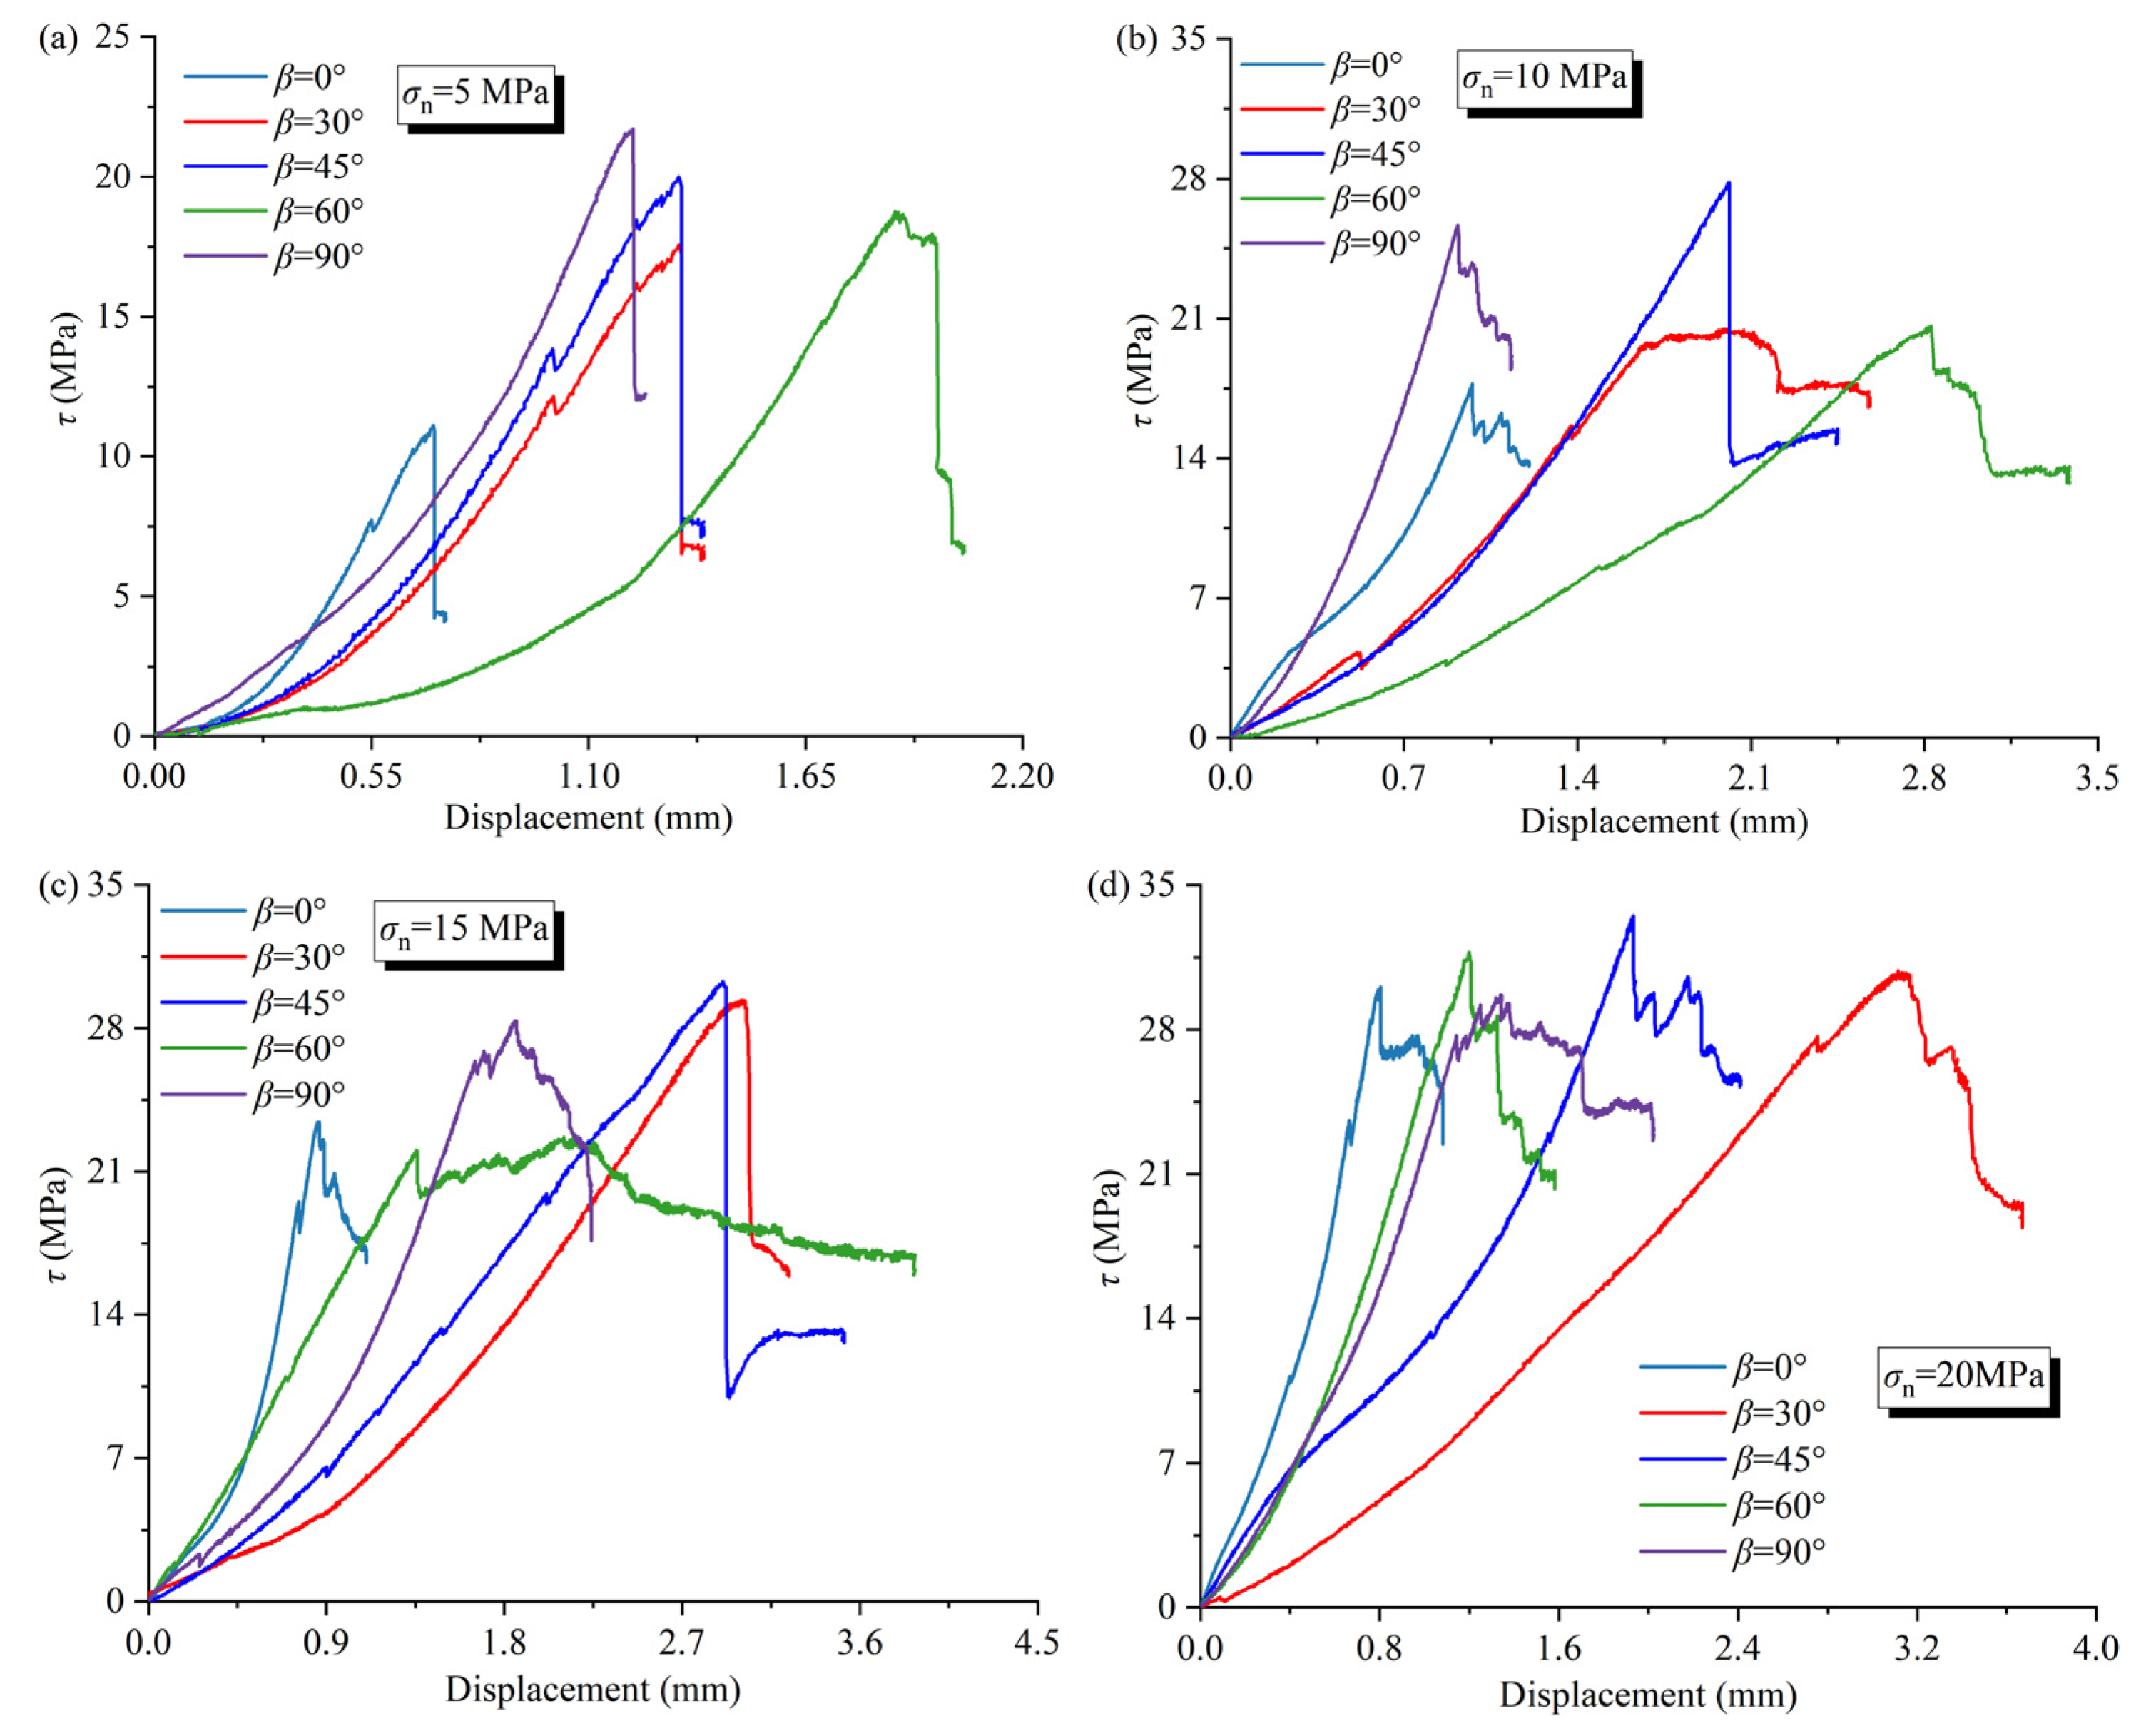
The shear stress–displacement curve of slate under different β and σn is shown in Figure 4. The overall variation in shear stress–shear displacement curves for all samples is similar before reaching τp. Initially, the curve exhibits a slight slope during loading, with the shear displacement rapidly increasing and the shear stress increasing slowly. This is attributed to a specific gap between the shear box and the sample; the initial shear stress has decreased these gaps. After reaching a certain shear displacement value, the slope of the curve increases significantly, and shear displacement rises at a slower. Notably, when β = 30°, higher σn values correspond to a longer linear deformation stage [32]. After reaching the τp, the slope of the curve shifts from positive to negative, and the stress decline phenomenon appears multiple times. As shear stress decreases to a specific level, the slope suddenly becomes smooth. With increasing shear displacement, the shear stress gradually enters the residual strength phase.
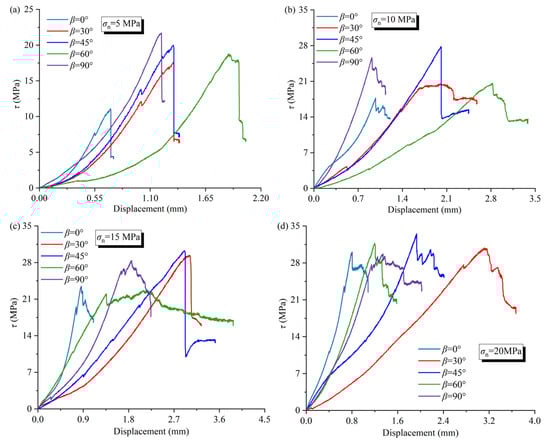
Figure 4.
Curves of shear stress–displacement for slate with different β (0°, 30°, 45°, 60°, 90°) under (a) σn = 5 MPa, (b) σn = 10 MPa, (c) σn = 15 MPa, and (d) σn = 20 MPa, respectively.
In general, when β = 45°, τp is the largest, and it is the smallest at 0°. The τp of different β values correspond to distinct tangential displacements. Specifically, for β values of 0° and 90°, the tangential displacement at peak load is relatively minor, ranging from 0.7 mm to 1.0 mm and 0.8 mm to 1.8 mm, respectively. For β values of 45° and 60°, the spans of tangential displacement (1.3–2.9 mm and 1.2–2.8 mm, respectively) are similar. Brittle shear failure occurs only at 5 MPa for β = 0° and 90°. The brittle shear failure is more pronounced for β = 45° and σn < 20 MPa. At β = 60°, there are more shear-slip phenomena, particularly evident when σn = 15 MPa and the displacement corresponding to τp is the smallest at σnmax. With the increase in σn, samples with different β values exhibit a shear-slip phenomenon.
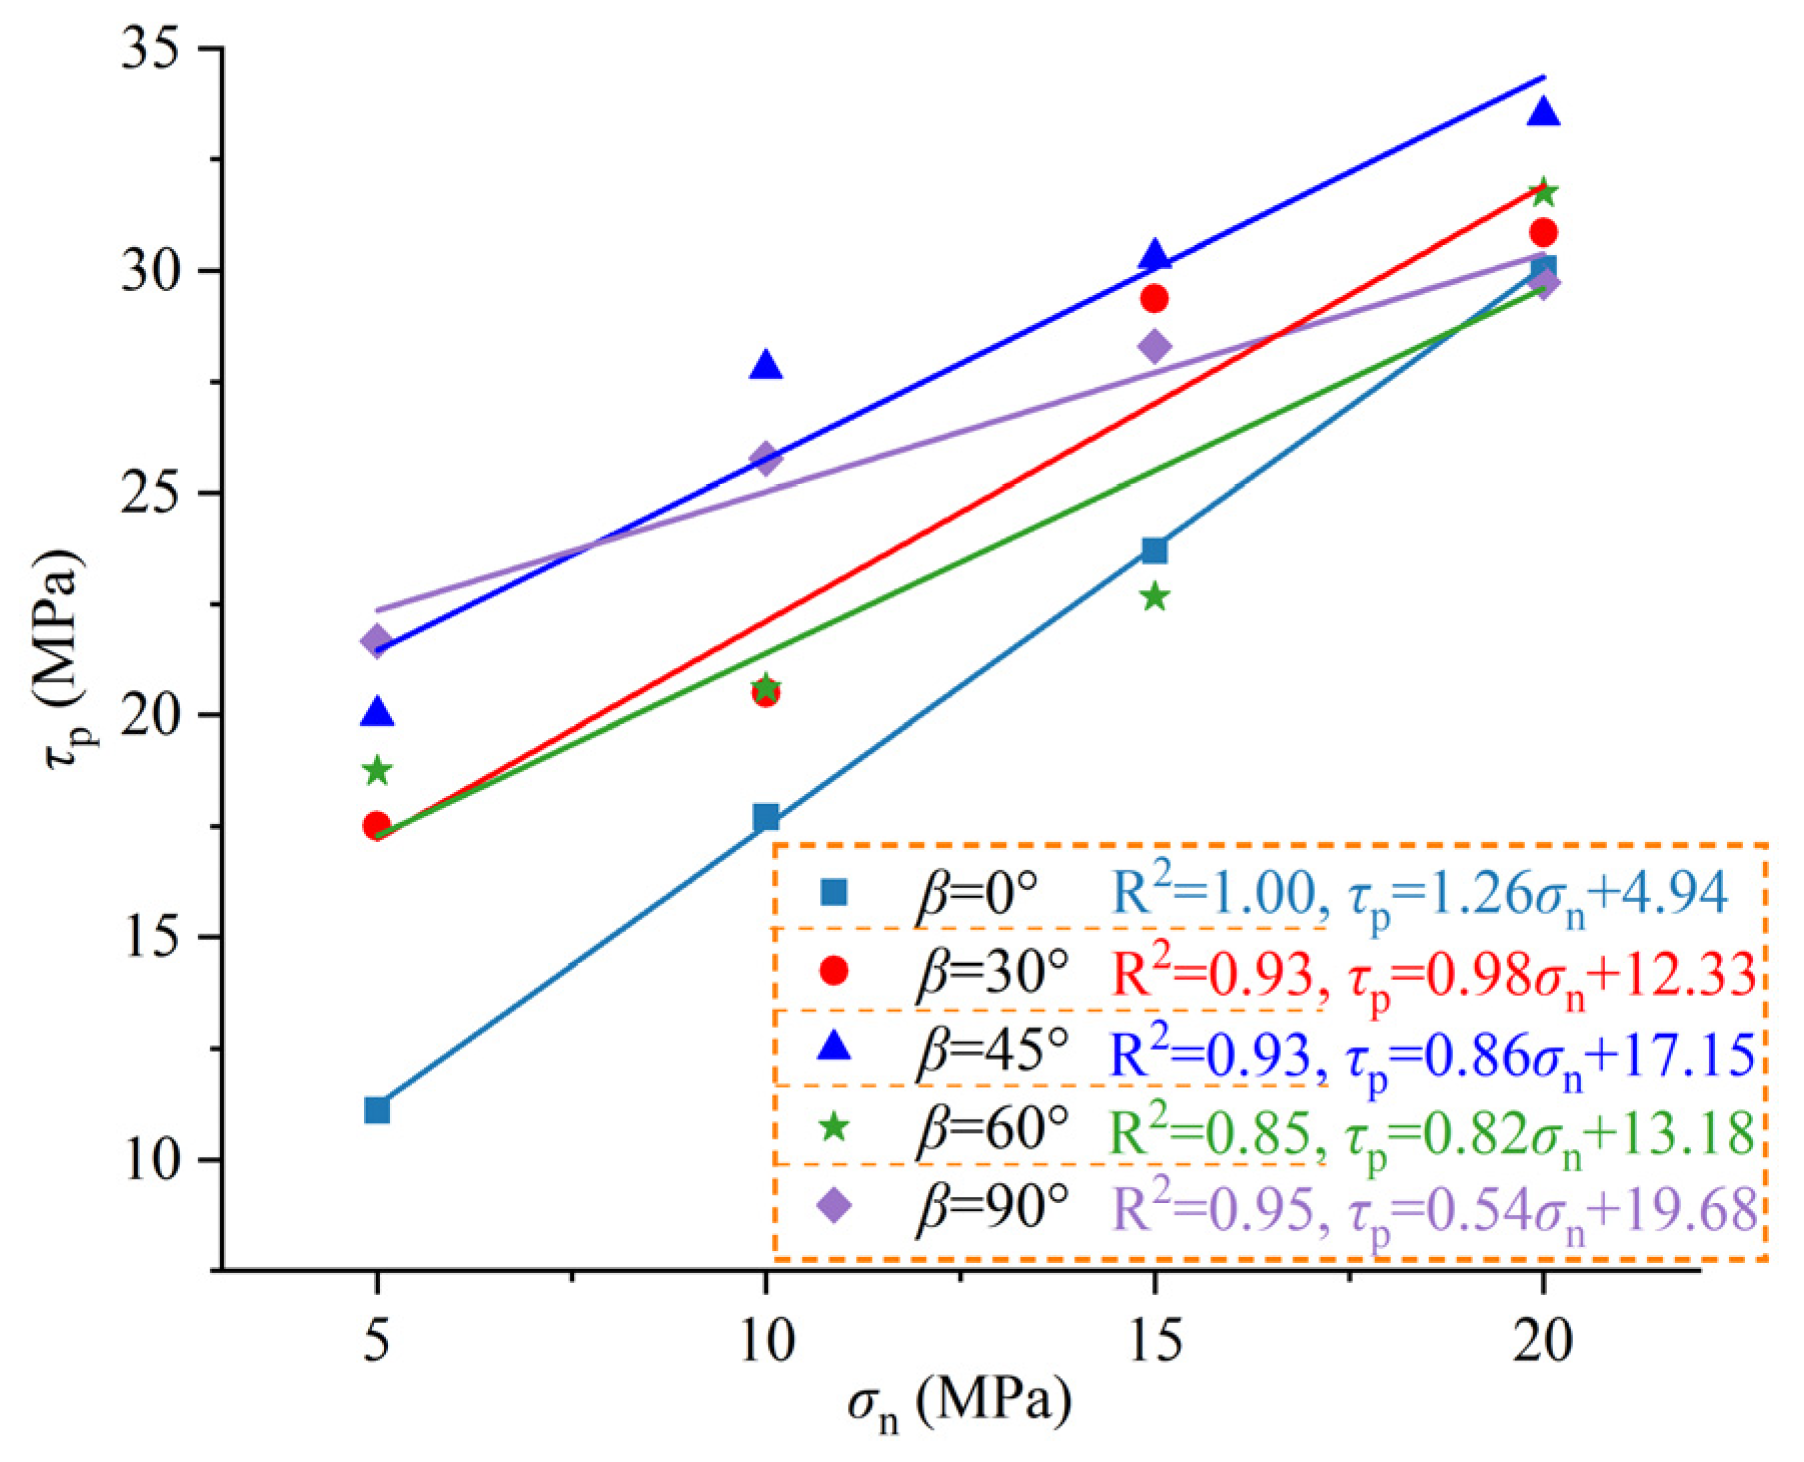
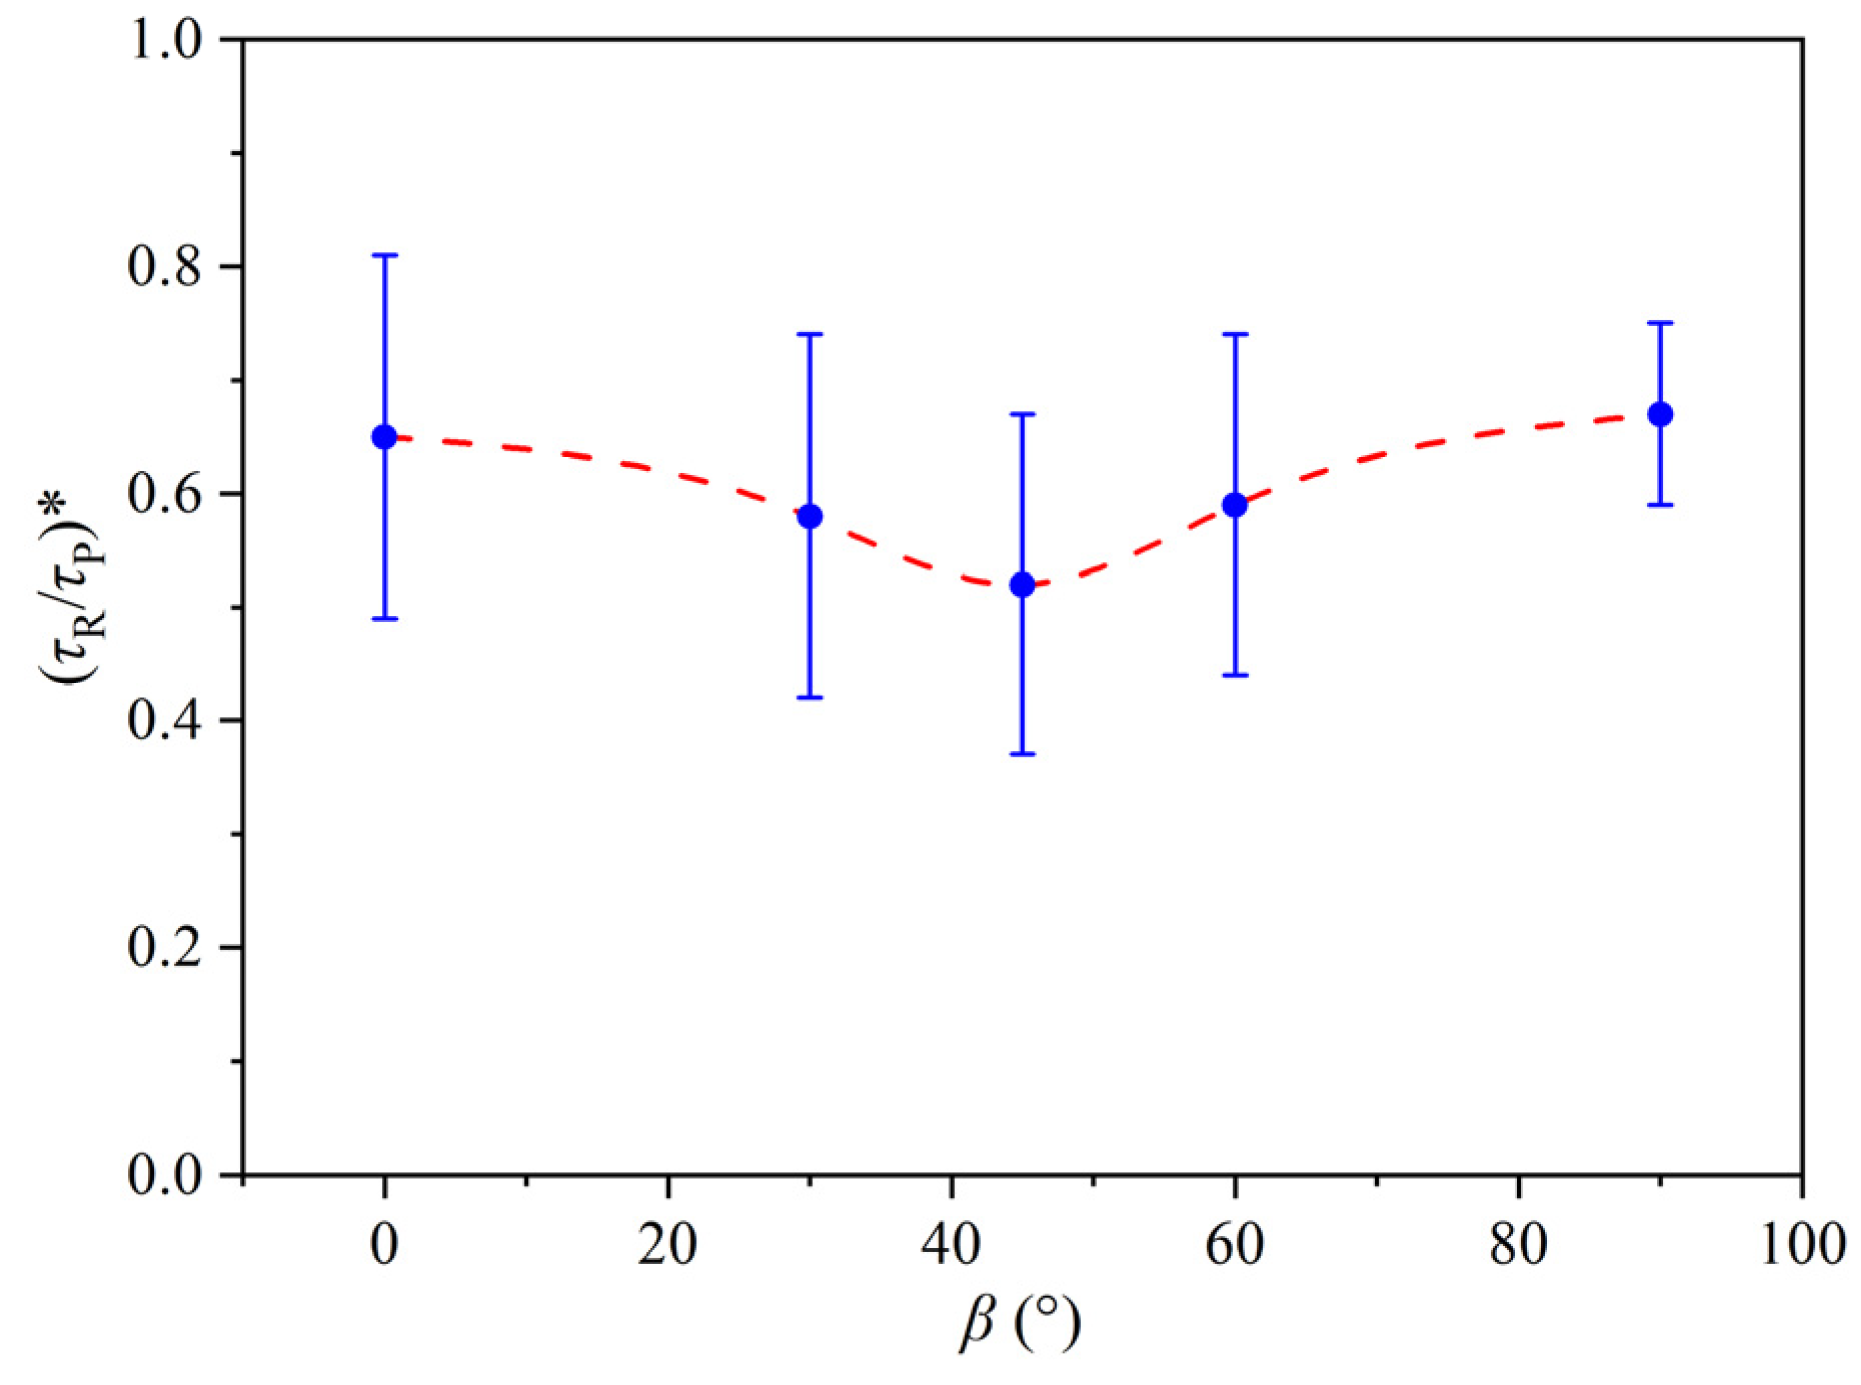
All samples exhibit residual stress. Table 1 presents the mean and standard deviation (SD) ratio of residual stress to peak stress ratio (τr/τp). The variation in shear strength concerning β and σn is shown in Figure 5, while the correlation between the ratio (τr/τp) and β is depicted in Figure 6. As β increases, the ratio initially decreases and then increases. The highest corresponding value (0.7) is observed when β is 90°, while the lowest (0.5) occurs at β = 45°. The stress drop associated with a vertical bedding plane is the most significant, indicating brittle failure, followed by horizontal bedding, with smaller stress drops corresponding to oblique bedding (0.5–0.6). Based on the Mohr–Coulomb shear strength criterion [33], the shear strength parameters of slate with different β values were calculated using Equation (1) and given in Table 1. The variations in cohesion (c) and internal friction angle (φ) are illustrated in Figure 7.
where c and φ represent the cohesion and internal friction angle, respectively, while τ and σn denote the shear and normal stresses.

Table 1.
Mechanical properties of slate for direct shear tests.
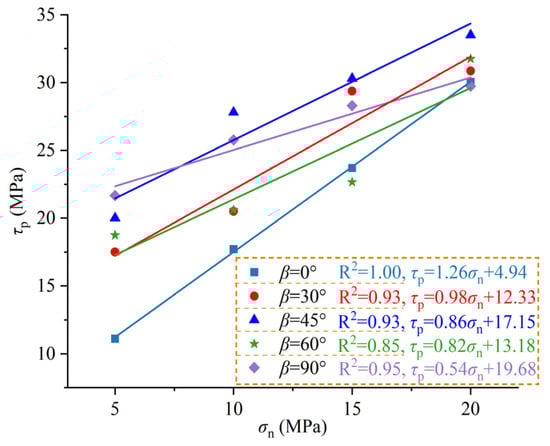
Figure 5.
Variation of shear strength with σn under different β.
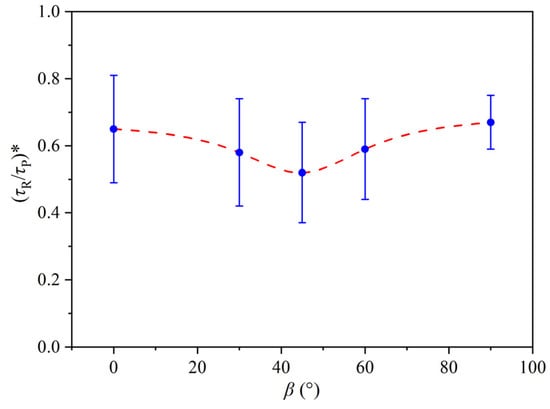
Figure 6.
Variation of (τR/τP)* with β.
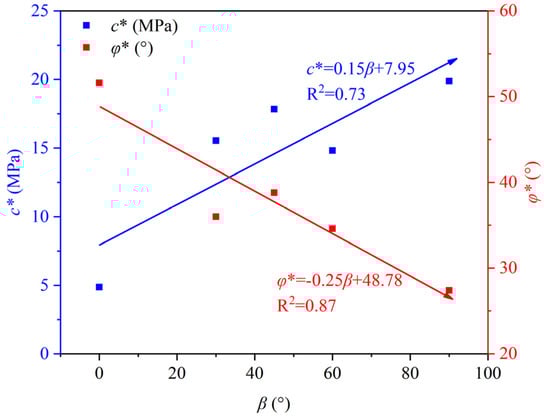
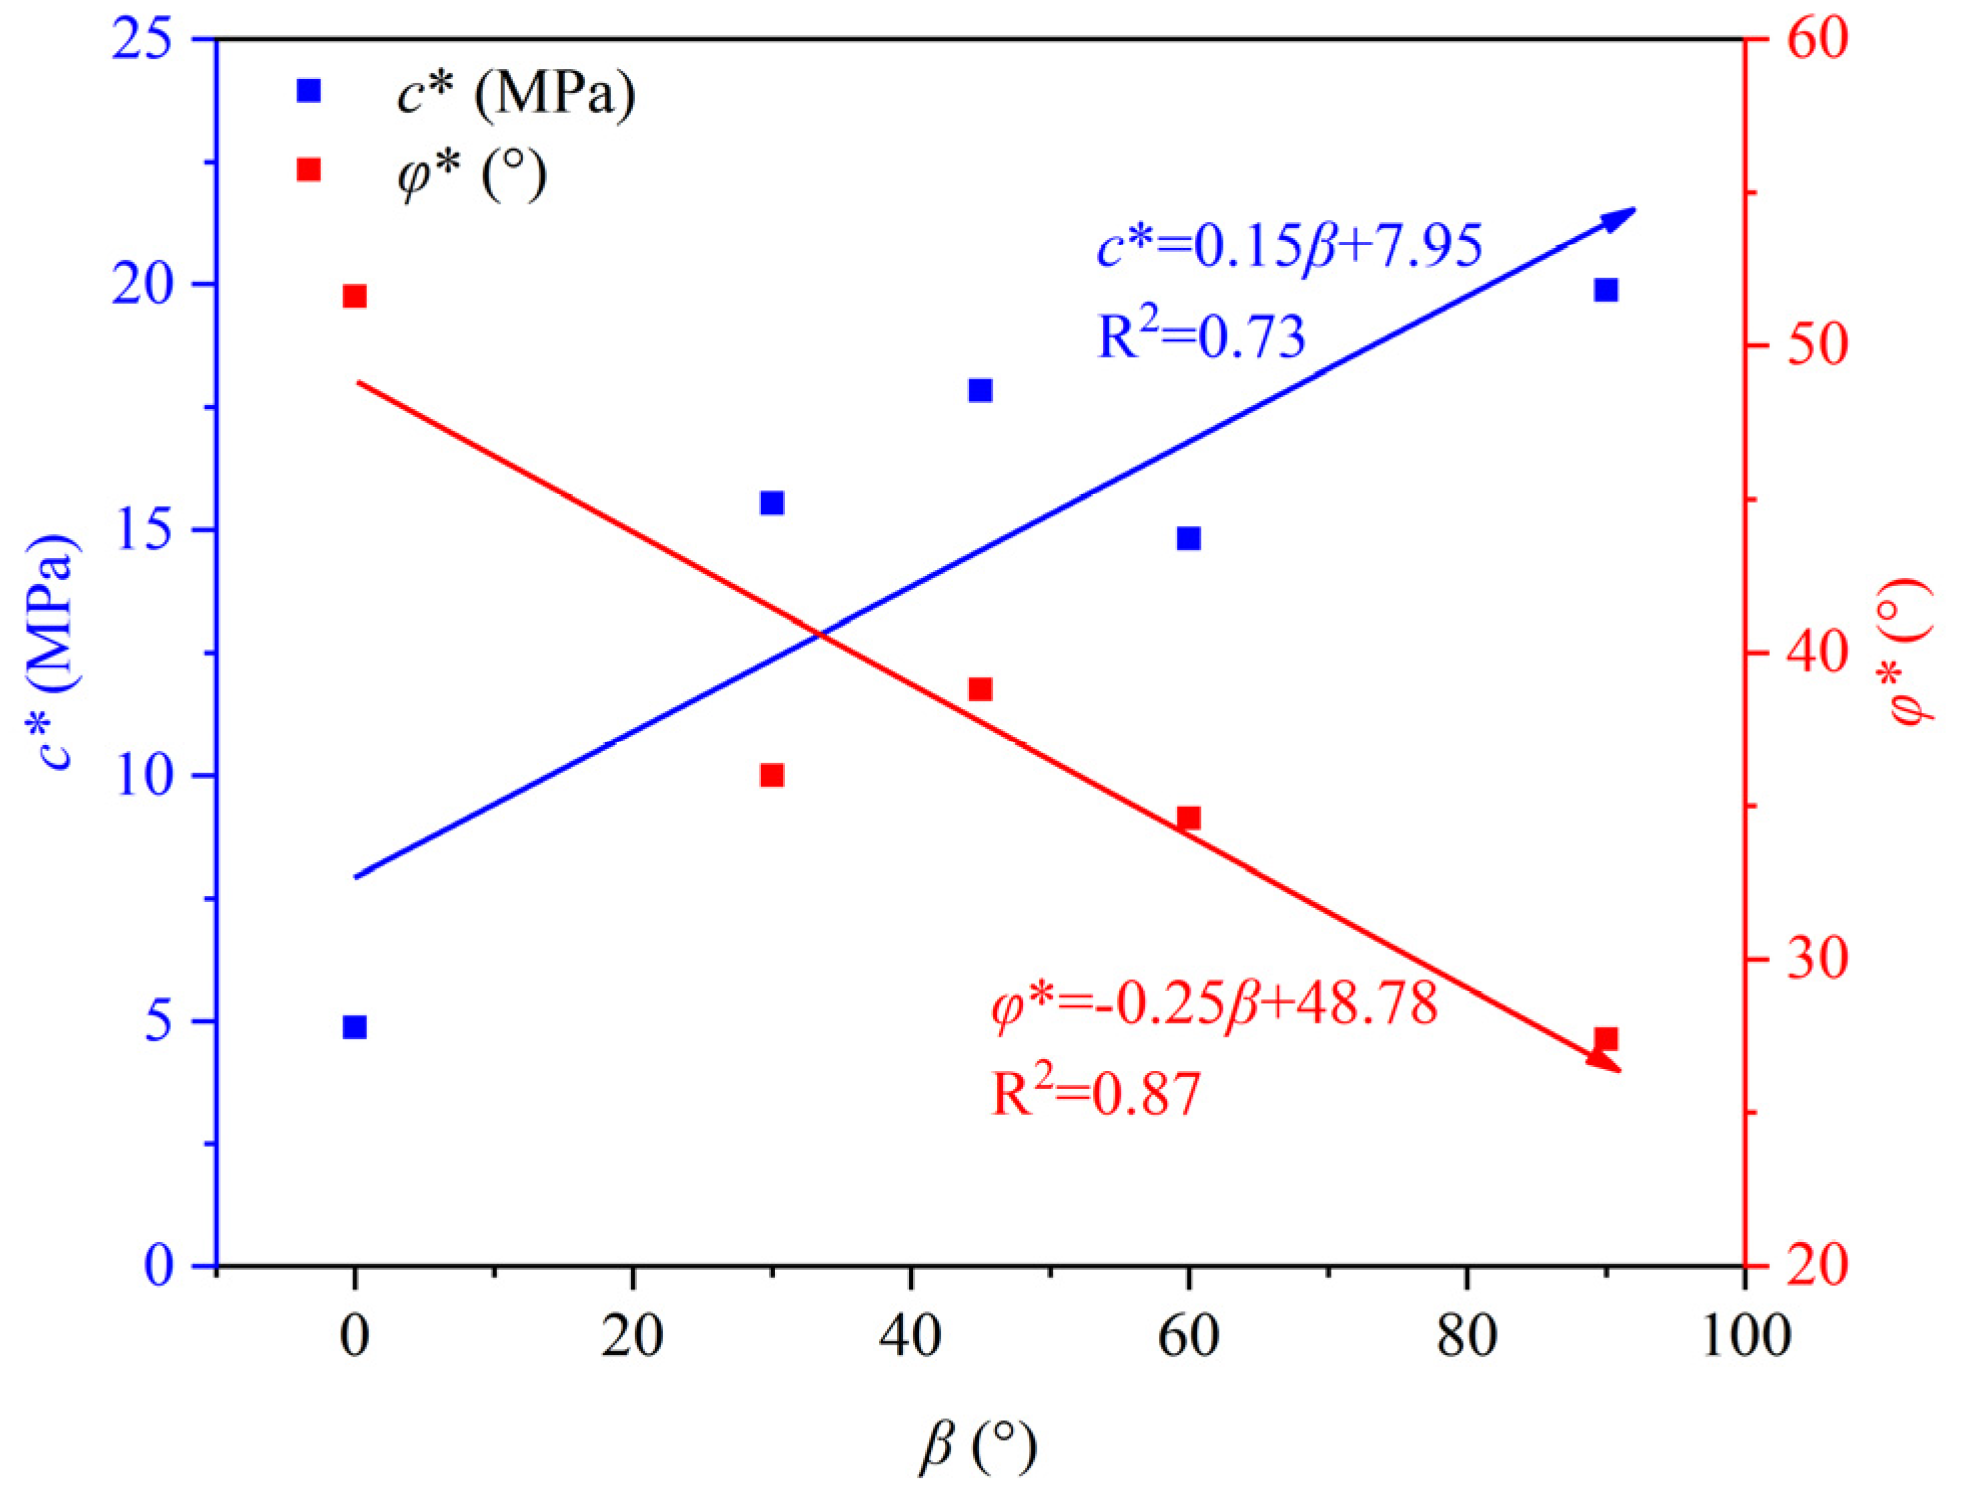
Figure 7.
Correlation between shear strength parameters (c* and φ*) and β.
As β increases, cohesion exhibits a linear increase, whereas the internal friction angle undergoes an opposite change. The cohesion reaches its maximum value (19.9) at 90° and its minimum (4.9) at 0°, while the internal friction angle follows the opposite pattern.
Factors such as test instruments, sample dimensions, and temperature can all influence the outcomes. These errors are unavoidable during the experiment, but they are within acceptable ranges. Therefore, in the analysis of results, averaging methods are used to study the shear mechanical behavior of slate under different bedding dip angles to minimize errors.
3.2. Failure Pattern of Slate
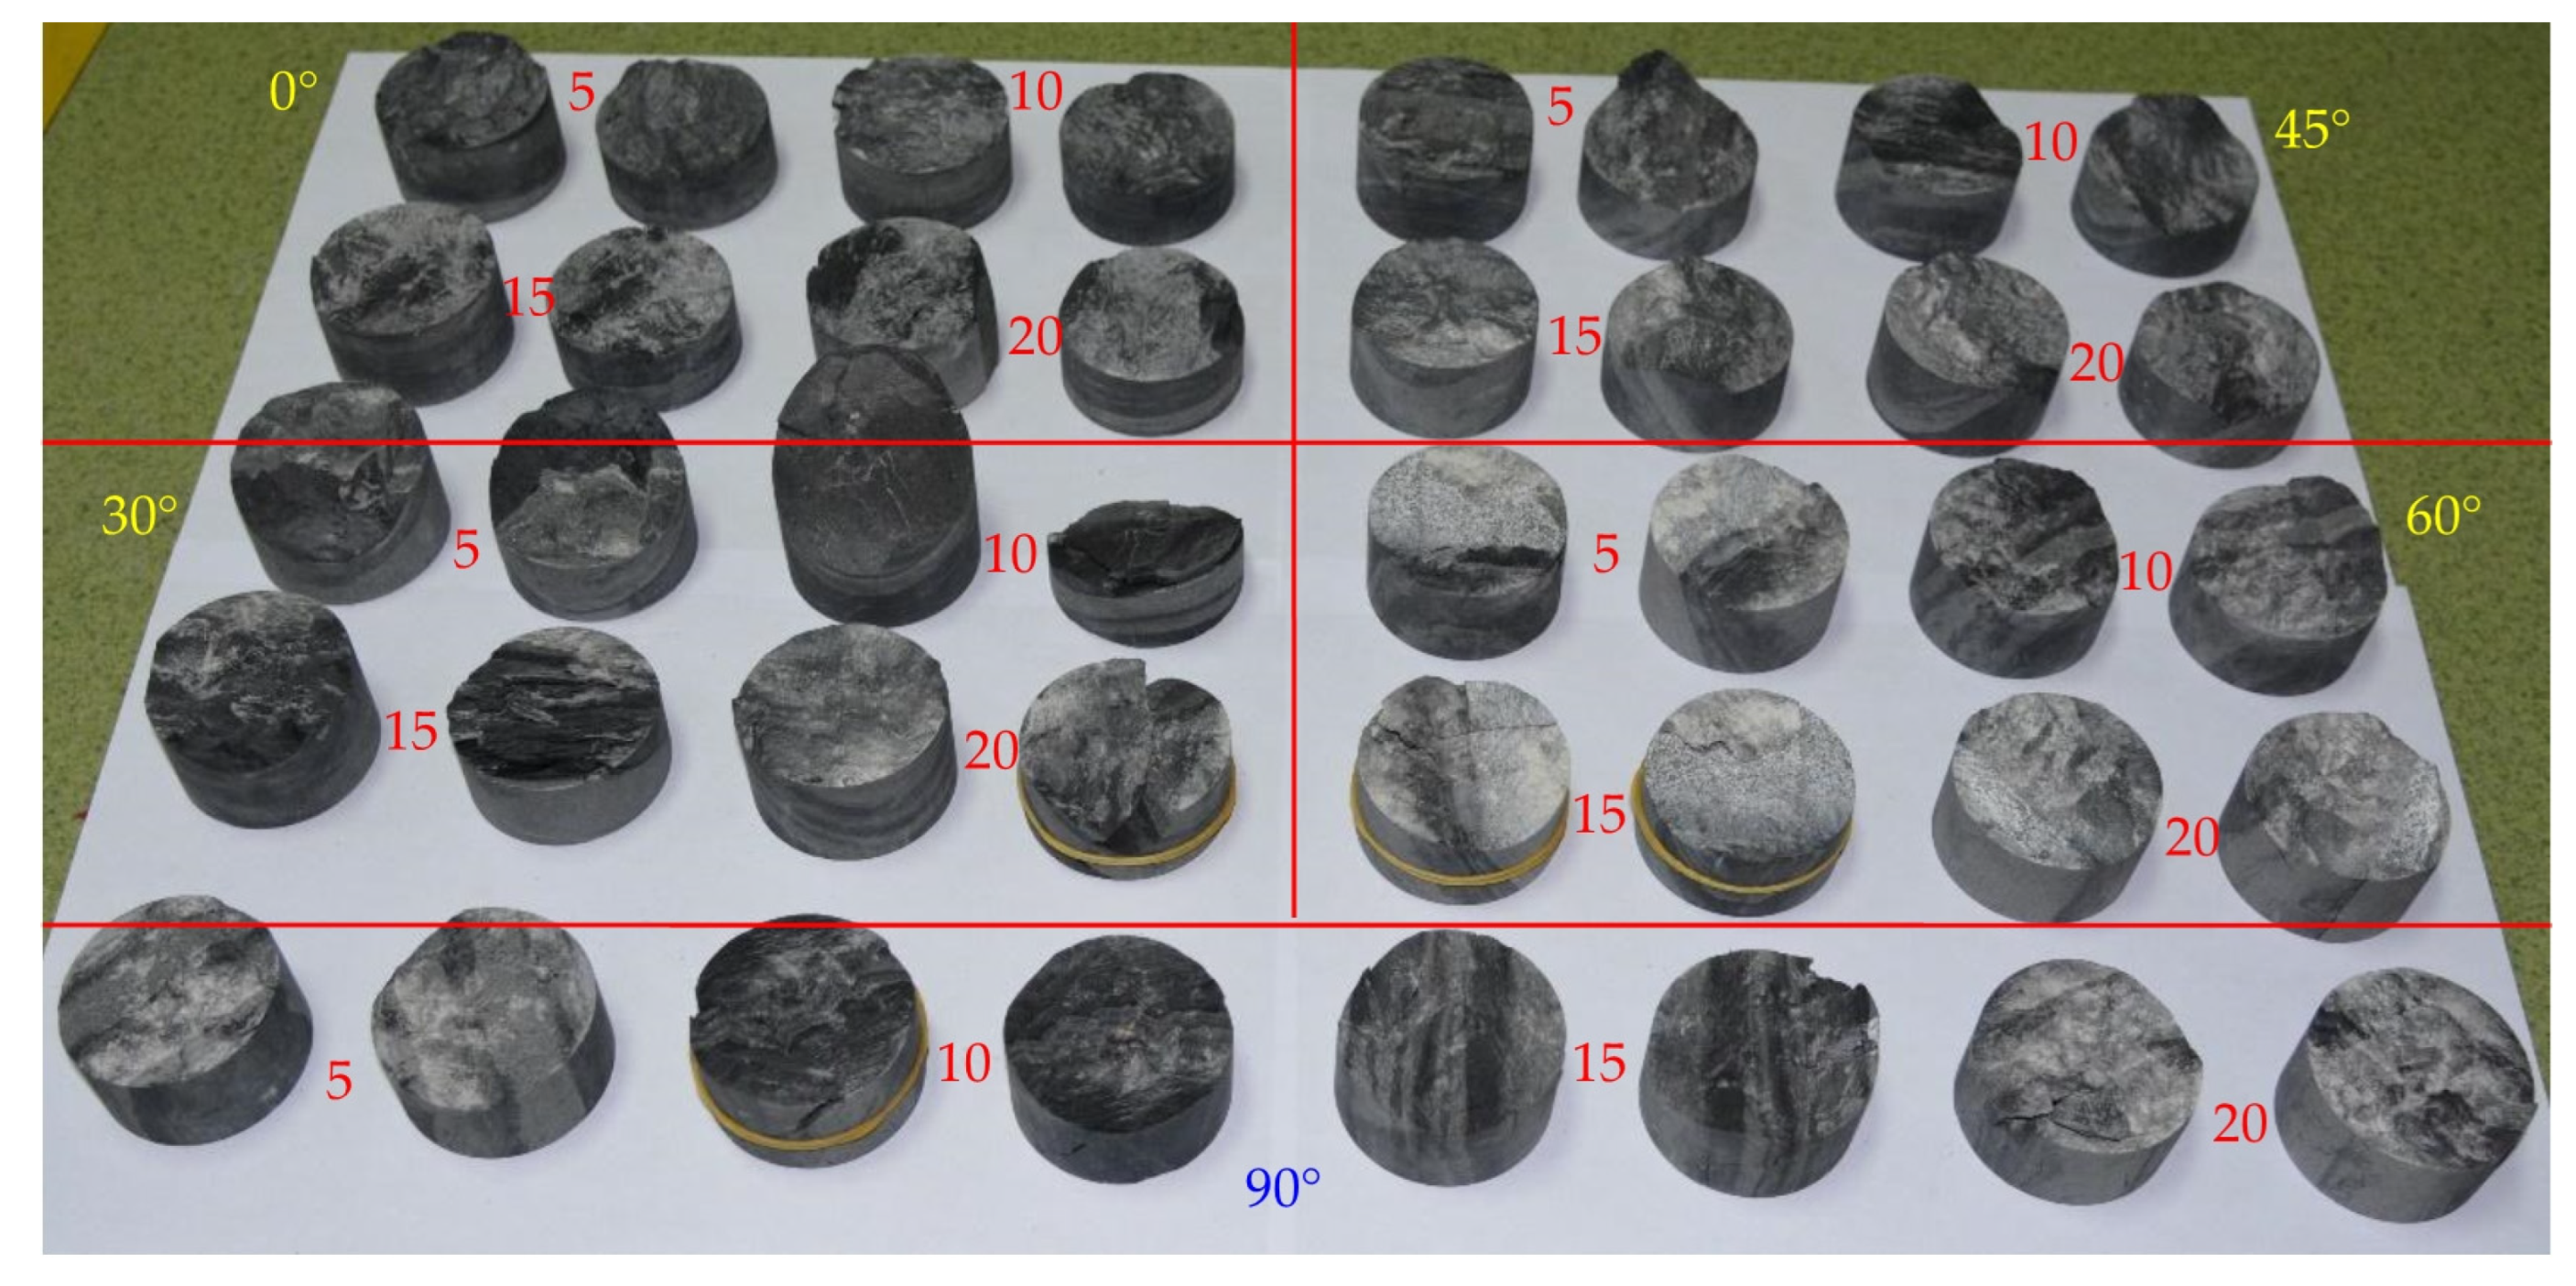
The failure patterns of slate specimens under varying σn during shear failure are shown in Figure 8. For slate with β of 0°, integral shear failure along the bedding plane is dominant. At σn = 5 MPa, local protrusions emerge on the shear section. The cracks on the section due to friction become more pronounced with increasing σn. For slate with β ranging from 30 to 60°, varying degrees of bedding plane cracking and matrix shear composite failure are observed. Notably, at β = 30° and σn = 15 MPa, stepped tensile cracks are evident, and a concave crack forms along the bedding plane at β = 45° and σn = 10 MPa. Cracks along the bedding plane become particularly prominent when β = 60° and σn = 15 MPa, displaying distinct scratches and fragmented characteristics. At β = 90°, a crack forms due to the shear failure of the matrix and bedding plane. Also, local cracking of the vertical bedding plane is observed; with the increase in σn, the scratches on the crack surface become more prominent.

Figure 8.
Fractured slate specimens after direct shear tests.
In both intact and cracked rocks, the shear strength in a specific area near the crack tip is weakened by sliding as the shear crack extends. Different anisotropic rock masses exhibit distinct signs of slip weakening (SW) [10]. At β = 0°, shear weakening along the bedding plane is more pronounced when σn > 5 MPa. When β = 90°, the overall SW phenomenon is weak. The shear SW is also associated with the spacing of bedding planes. At 45°, the bedding plane width (the gray band shown in Figure 2a) in the shear core area is larger, and the brittleness is more evident at failure. This results in a less evident slip-weakening phenomenon, leading to higher shear strength. For slate with β = 30° and 60°, shear action induces tensile cracks developing along the bedding plane, leading to local failure. Subsequently, these tensile cracks propagate along the bedding plane during shearing and sliding, creating an overall rupture zone where shear and tensile cracks interconnect. Cracks along the bedding plane contribute to increased roughness on the shear rupture plane, which explains why the shear strengths of slate with β values of 30° and 60° closely resemble those of vertically bedded slate.
3.3. AE Characteristics
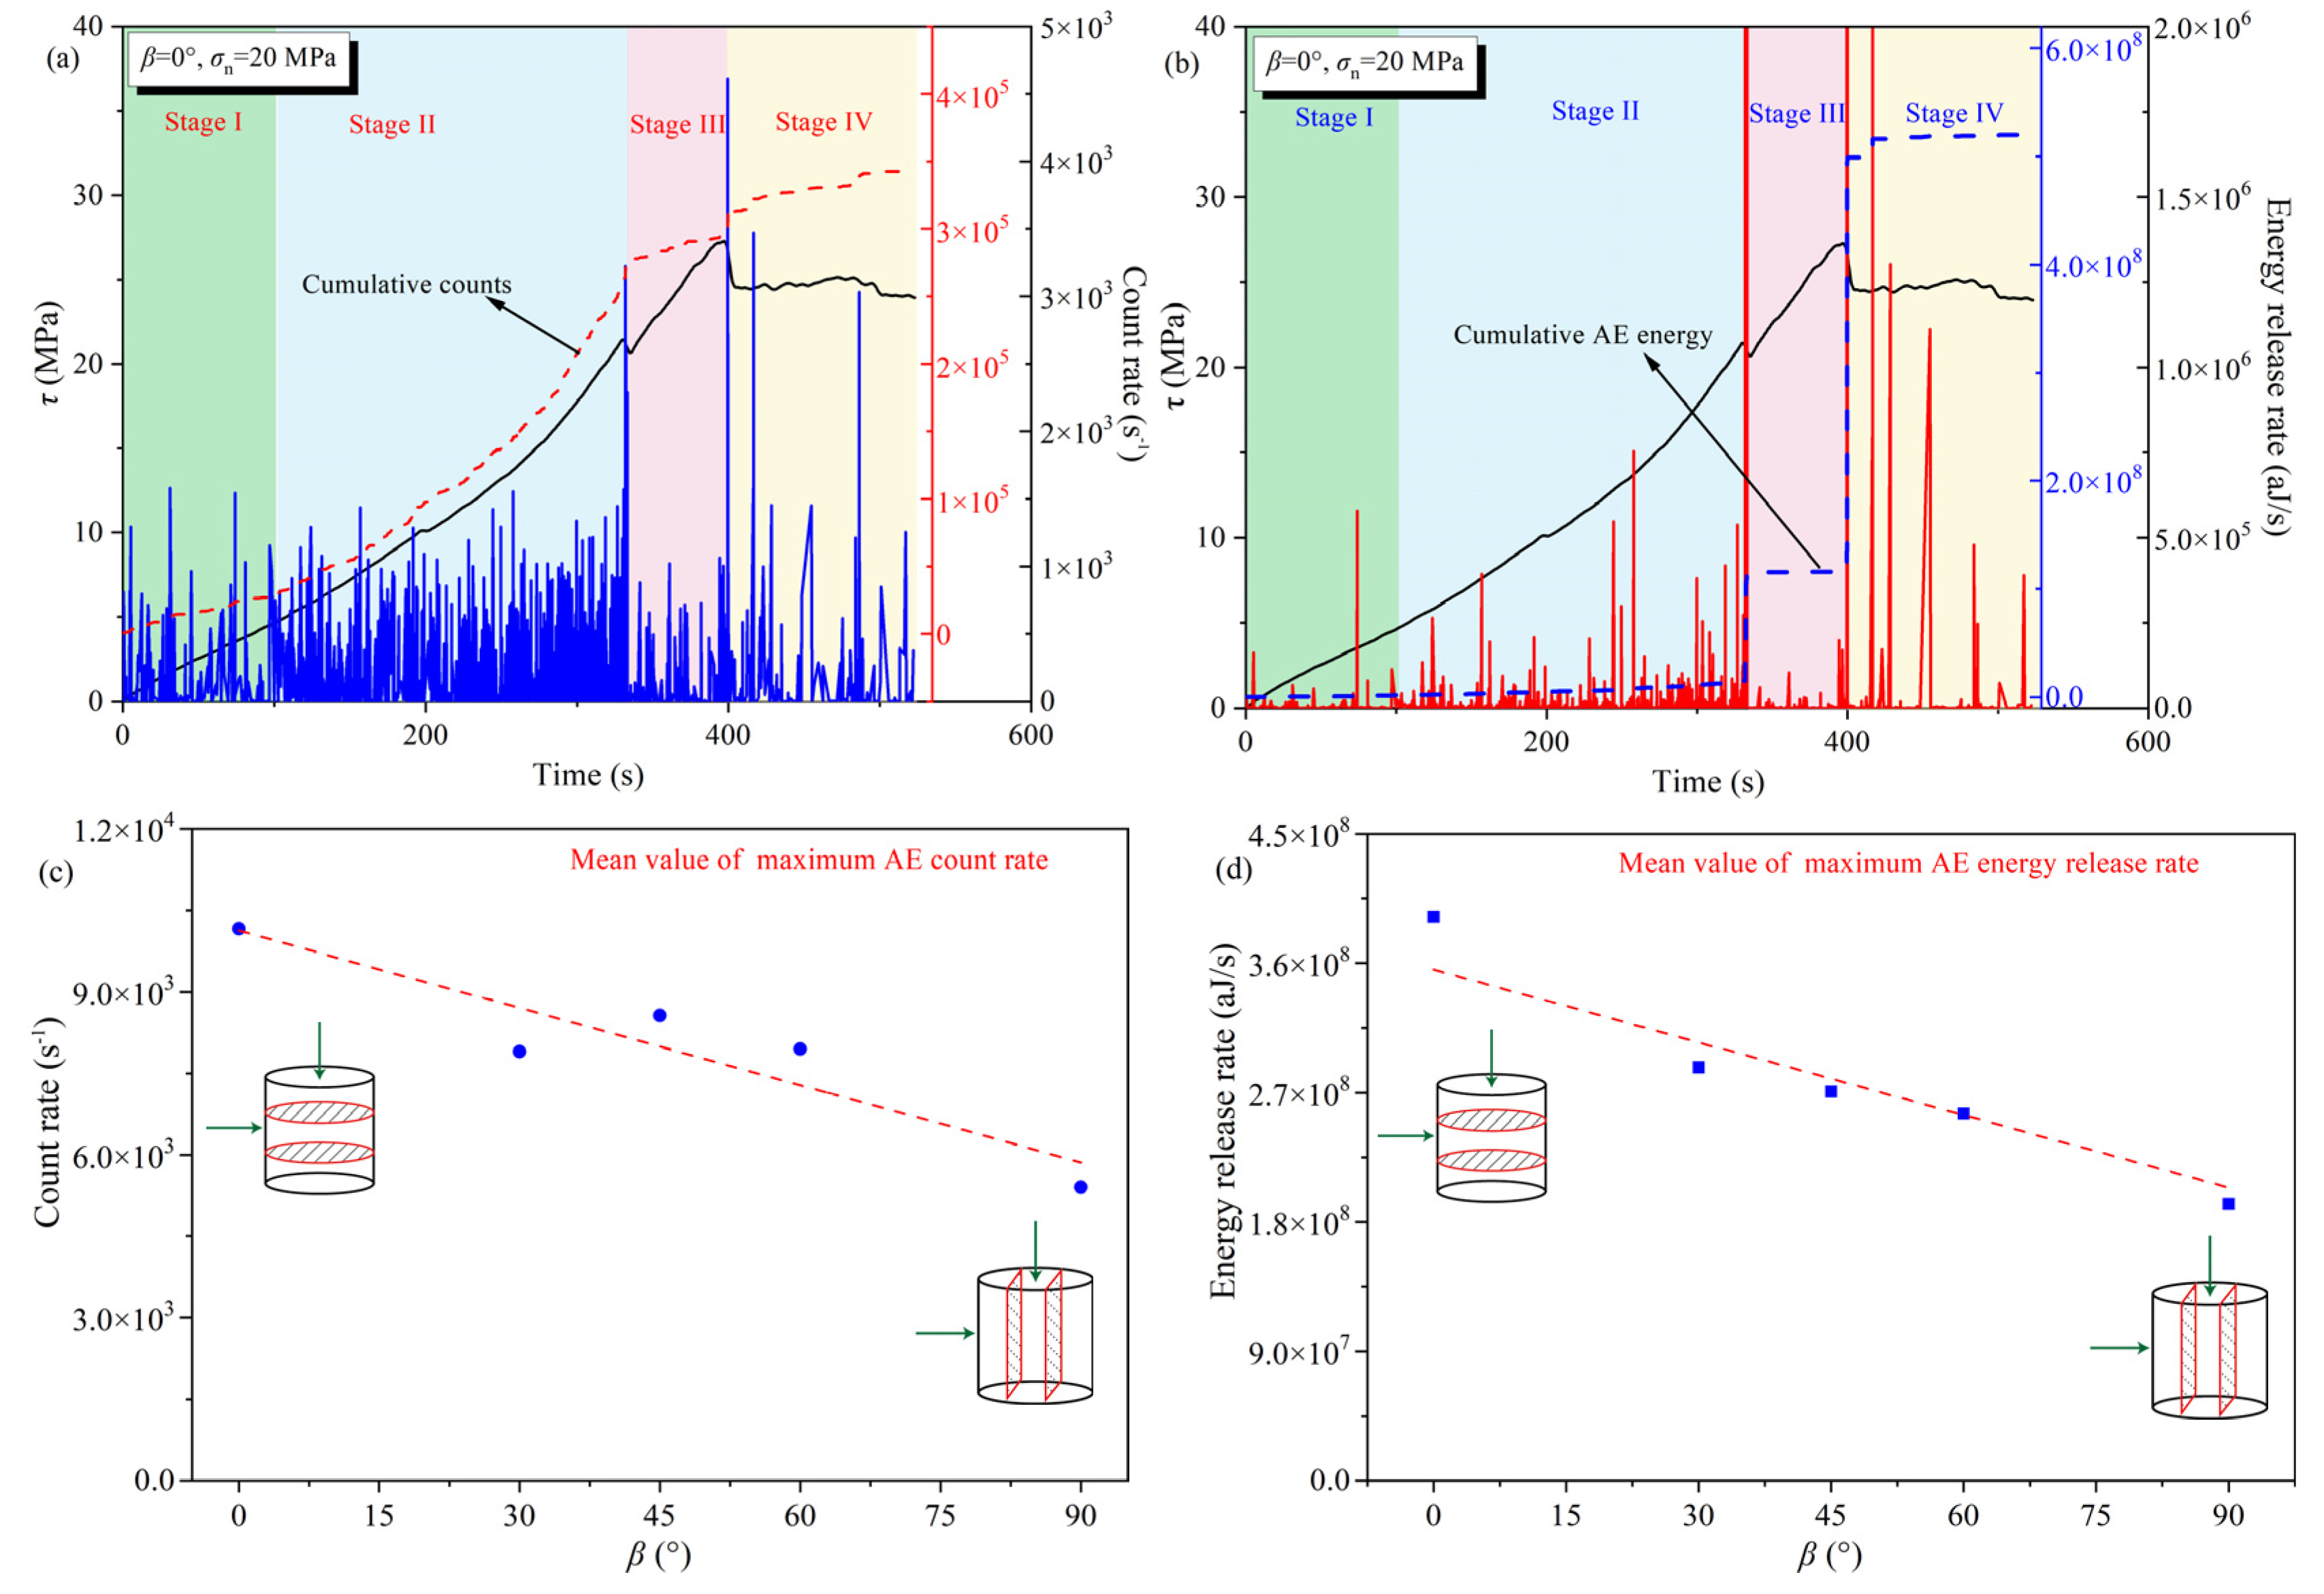
AE activity and energy release can be used to assess the microcrack development and propagation during direct shear tests. AE count is a commonly used metric to characterize AE activity. AE energy represents the energy released during the rock failure process. When β = 0° and σn = 20 MPa, the curve showing the variation in AE count rate and cumulative AE counts with shear stress and time is presented in Figure 9a. The entire loading process can be divided into four stages. In the initial loading stage (Stage I), relatively strong intermittent AE signals are generated, and the cumulative AE count increases slowly. These signals in Stage I are because of the internal pores of the slate and the closure of the gap between the shear box and the specimen. During the continuous stable deformation stage (Stage II), AE signals become noticeably denser, yet the overall count rate remains relatively small. Also, the cumulative count curve approximately parallels the loading curve, signifying a stable rate of microcrack evolution with the fastest growth rate throughout the loading process. Toward the end of Stage II, a slight stress decline in shear stress corresponding to a larger count rate is observed. Moving into the unstable deformation stage (Stage III), the AE signals decrease, and the cumulative count increases at a lower rate. Stage III reflects the influence of the stress release of the preceding stage, entering a relatively quiet period. In addition, energy accumulates gradually and is suddenly released during peak stress, generating more AE signals and a sudden increase in cumulative counts. Stage IV represents the post-peak deformation stage, in which AE signals intermittently intensify until the end of the test while the cumulative AE count also increases.

Figure 9.
(a) AE count rate and (b) energy release rate of slate (β = 0°, σn = 20 MPa) with time elapse; relationship between mean value of maximum (c) AE count rate and (d) AE energy release rate and β.
The variation in AE energy release rate and cumulative released energy with the shear stress–time curve is depicted in Figure 9b for β = 0° and σn = 20 MPa. This curve can be divided into four stages. During Stage I and Stage II, the AE signals primarily consist of low-energy signals, resulting in a slow increase in the cumulative released energy curve. However, a small stress drop in Stage II significantly increases the cumulative energy release, signifying more energy release. Only a small amount of energy is released in Stage III, and the cumulative released energy curve remains almost horizontal, while a sudden increase in AE energy is observed at the peak stress point, with the largest increment. The post-peak energy release characteristic aligns with AE activity, indicating intermittent energy release with a smaller contribution to cumulative energy. The AE activity and energy release characteristics of the remaining samples are similar to those of the aforementioned slate samples, though the specific values differ. Mean values of the maximum AE count rate and maximum energy release rate for slate with different β values are presented in Figure 9c and Figure 9d. Overall, as β increases, the AE count and energy release rates decrease linearly. The energy released with vertical bedding is the least, indicating tensile microcrack generation along the bedding plane, weakening the energy release to some extent.
4. Numerical Simulations
4.1. Numerical Model and Calibration
In numerical simulations, uncertainties primarily stem from model parameter selection, boundary condition simplifications, rock heterogeneity, and numerical errors. Model parameters (such as particle diameter, contact stiffness, and bond strength) are typically set based on experimental or empirical data, but these parameters may exhibit significant variability in actual rocks, affecting the accuracy of the simulation results. The simplification of boundary conditions and the neglect of the complex internal structure of rocks (such as heterogeneity and anisotropy) can also lead to discrepancies between the simulation results and real-world conditions.
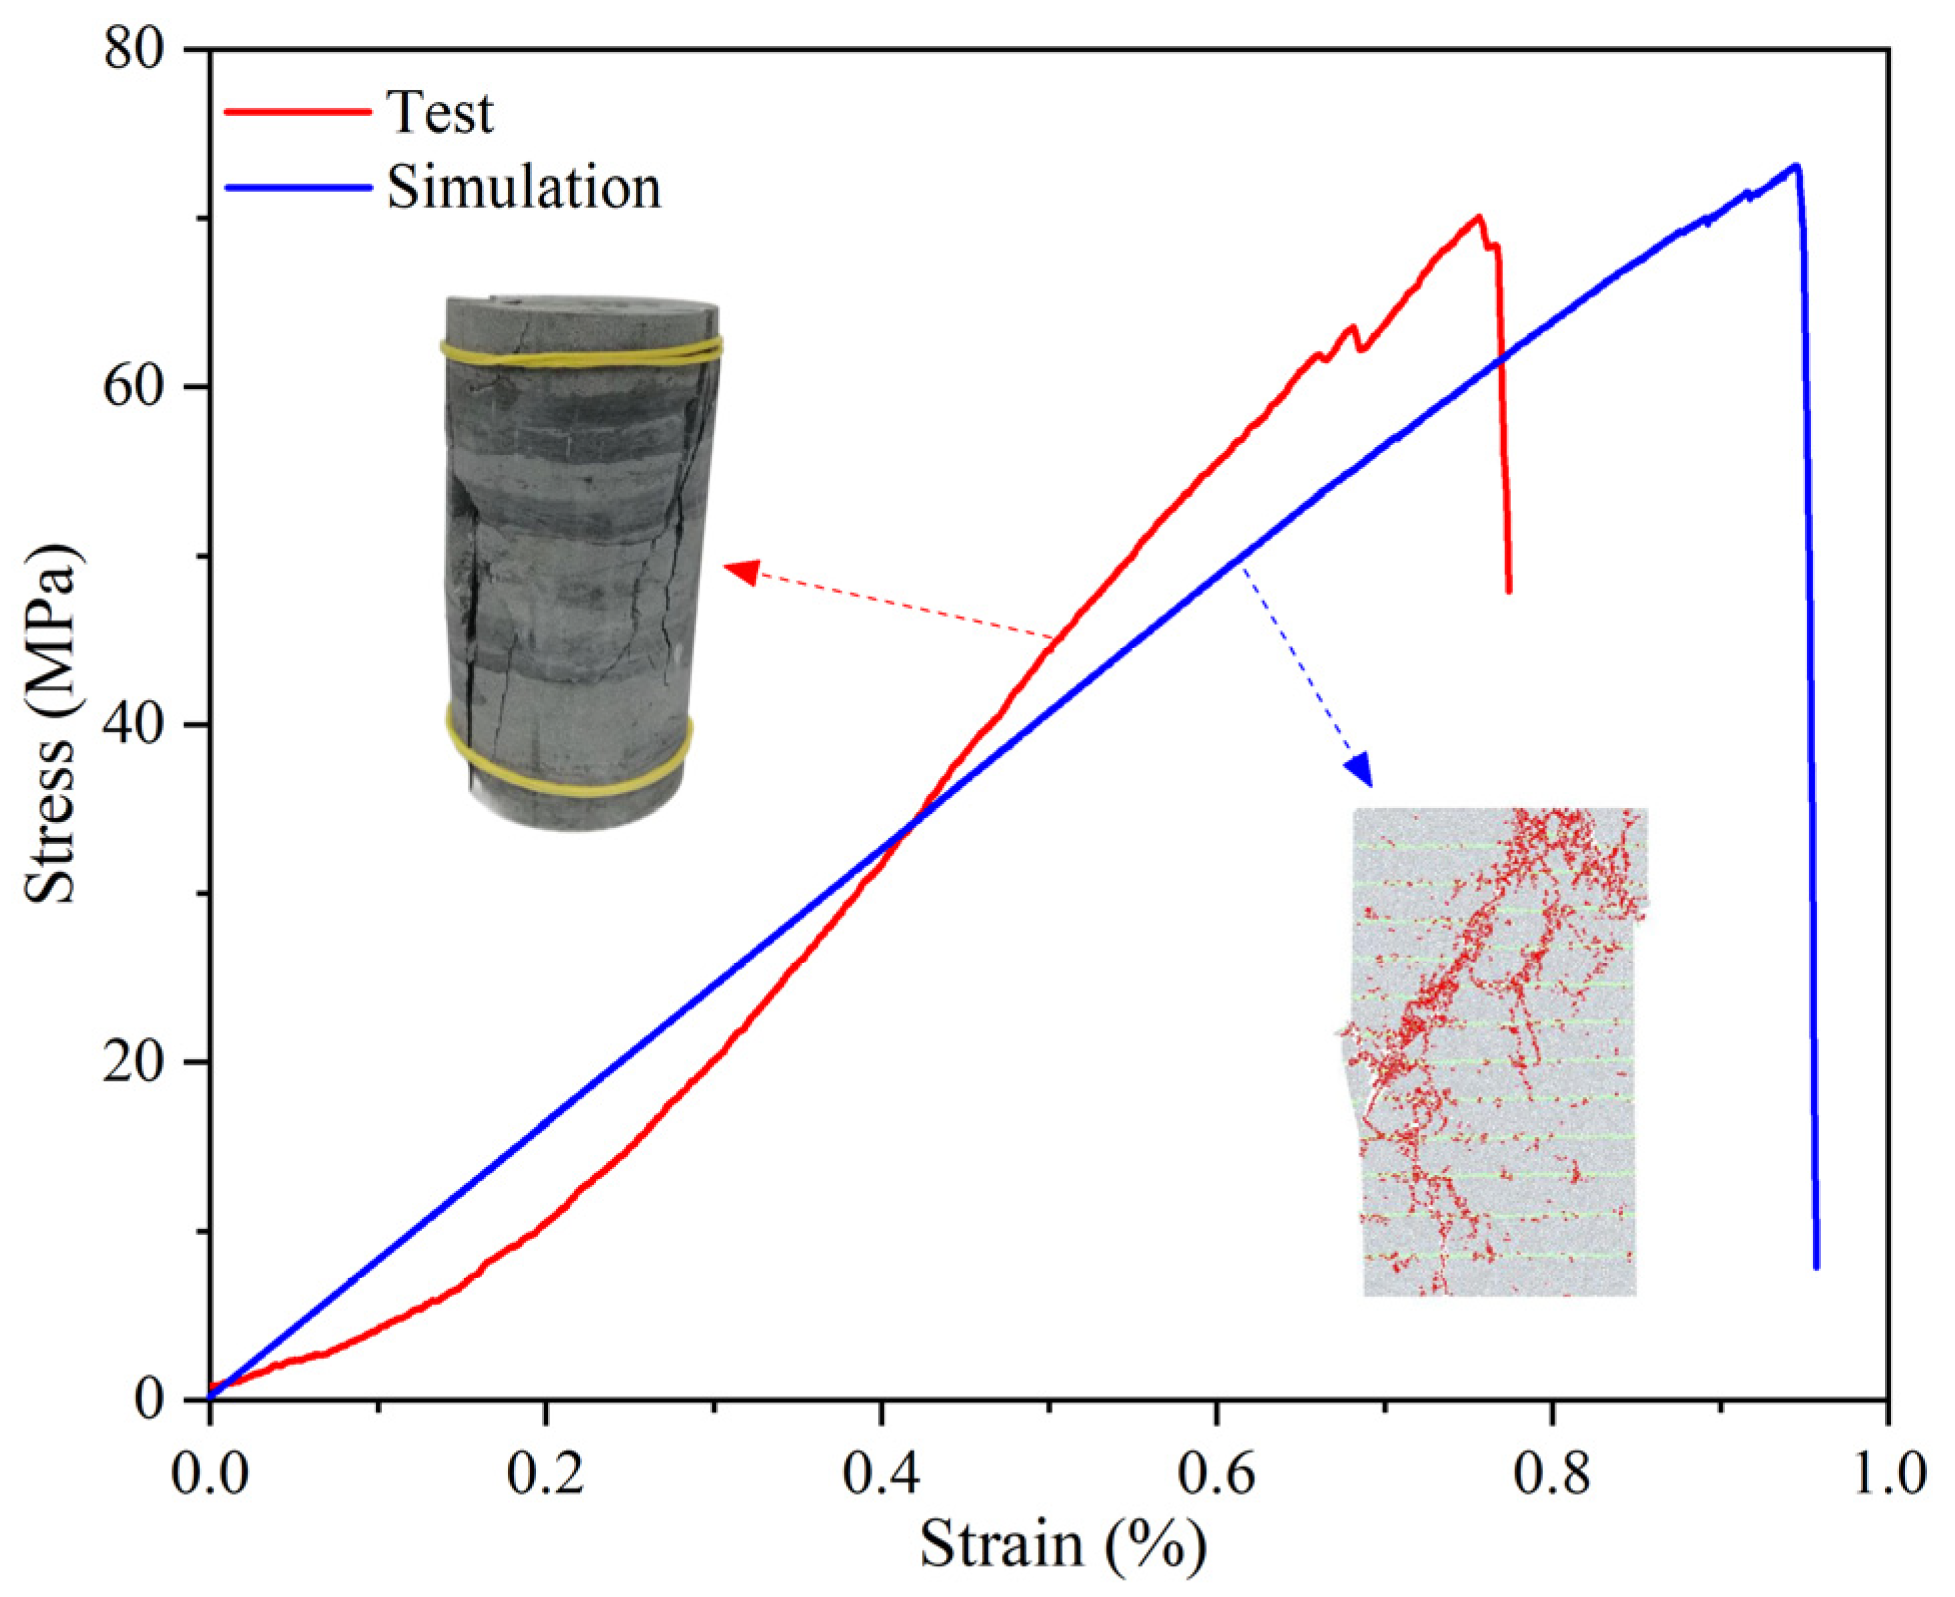
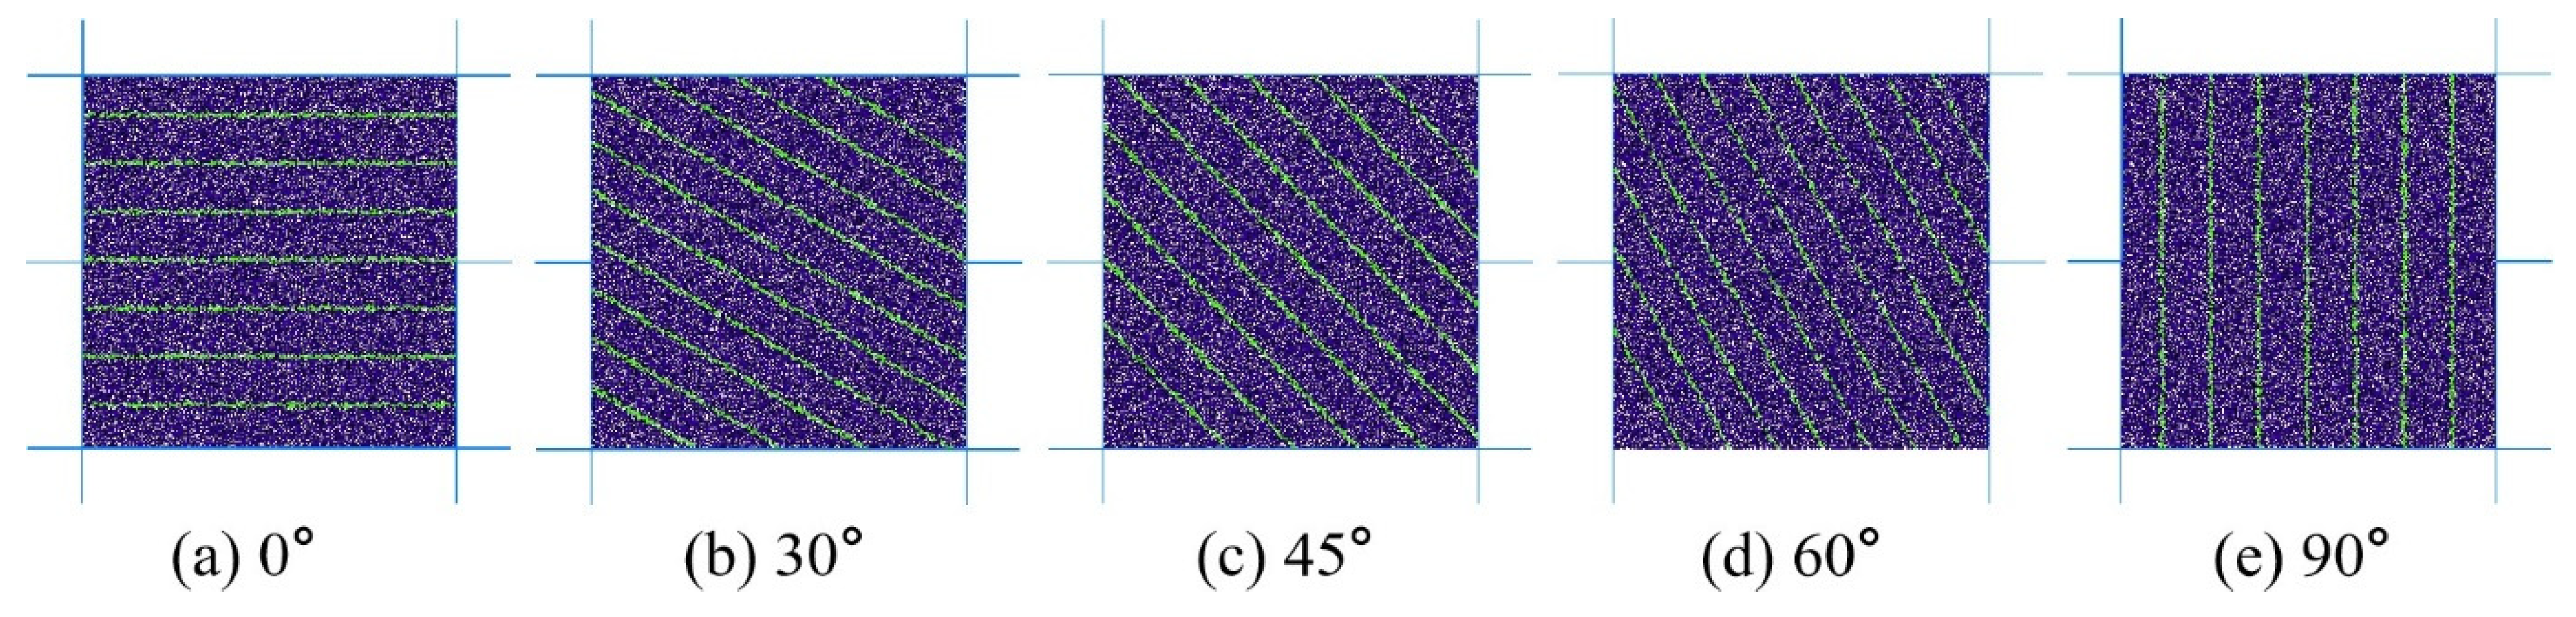
The numerical simulation based on the discrete element method provides a robust supplement to indoor testing. A two-dimensional numerical model (50 mm × 50 mm) was used to simulate the shear test. The minimum particle size was set at 0.20 mm, and the maximum to minimum particle radius ratio was 1.5, ensuring a uniform distribution. Through a trial-and-error method, the numerical simulation and experimental results are generally consistent. It cannot be entirely consistent due to numerical simulations typically assume that rock materials are homogeneous and isotropic, whereas actual rocks exhibit heterogeneity and anisotropy. In the simulations, particle shapes are idealized, while the geometrical structure of real rock particles is more complex. Bonding models assume that the bonding strength and fracture behavior between particles are relatively simple, but the microstructure of real rocks is more complex, especially during crack propagation and failure. Simplified bonding models cannot fully capture the mechanical responses observed in experiments (Figure 10). The determined micro-parameters are outlined in Table 2. With these micro-parameters, direct shear tests under various bedding dip angles were designed (Figure 11), where the bedding plane is marked in green. Eight rigid walls were used to simulate the upper and lower shear boxes.
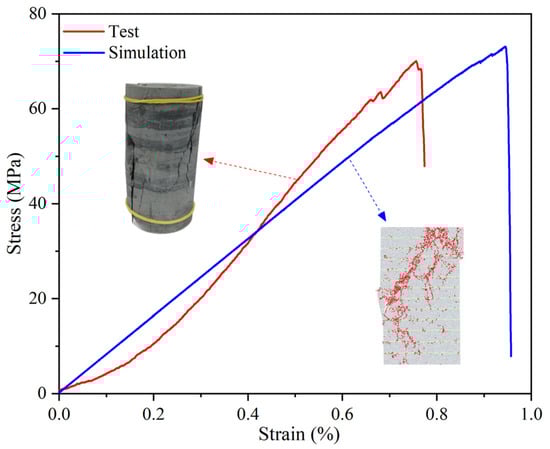
Figure 10.
Stress–strain curves of uniaxial compression and the corresponding numerical tests of slate.
Table 2.
Mesoscopic parameters of numerical model.
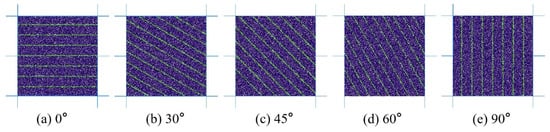
Figure 11.
Numerical models of direct shear test for slate with different β.
The numerical model is somewhat idealized in the modeling process and can only analyze layered rocks through laboratory experiments, which presents certain limitations. A comparison of experimental results and numerical simulation results shows that, although there are some differences, the overall mechanical features, such as strength, stress drop rate, failure characteristics, and failure modes of the numerical model, are similar to those of the experimental results. According to [34,35,36], these results are considered to have a certain degree of validity.
4.2. Failure Behavior of Slate
4.2.1. Shear Strength Properties
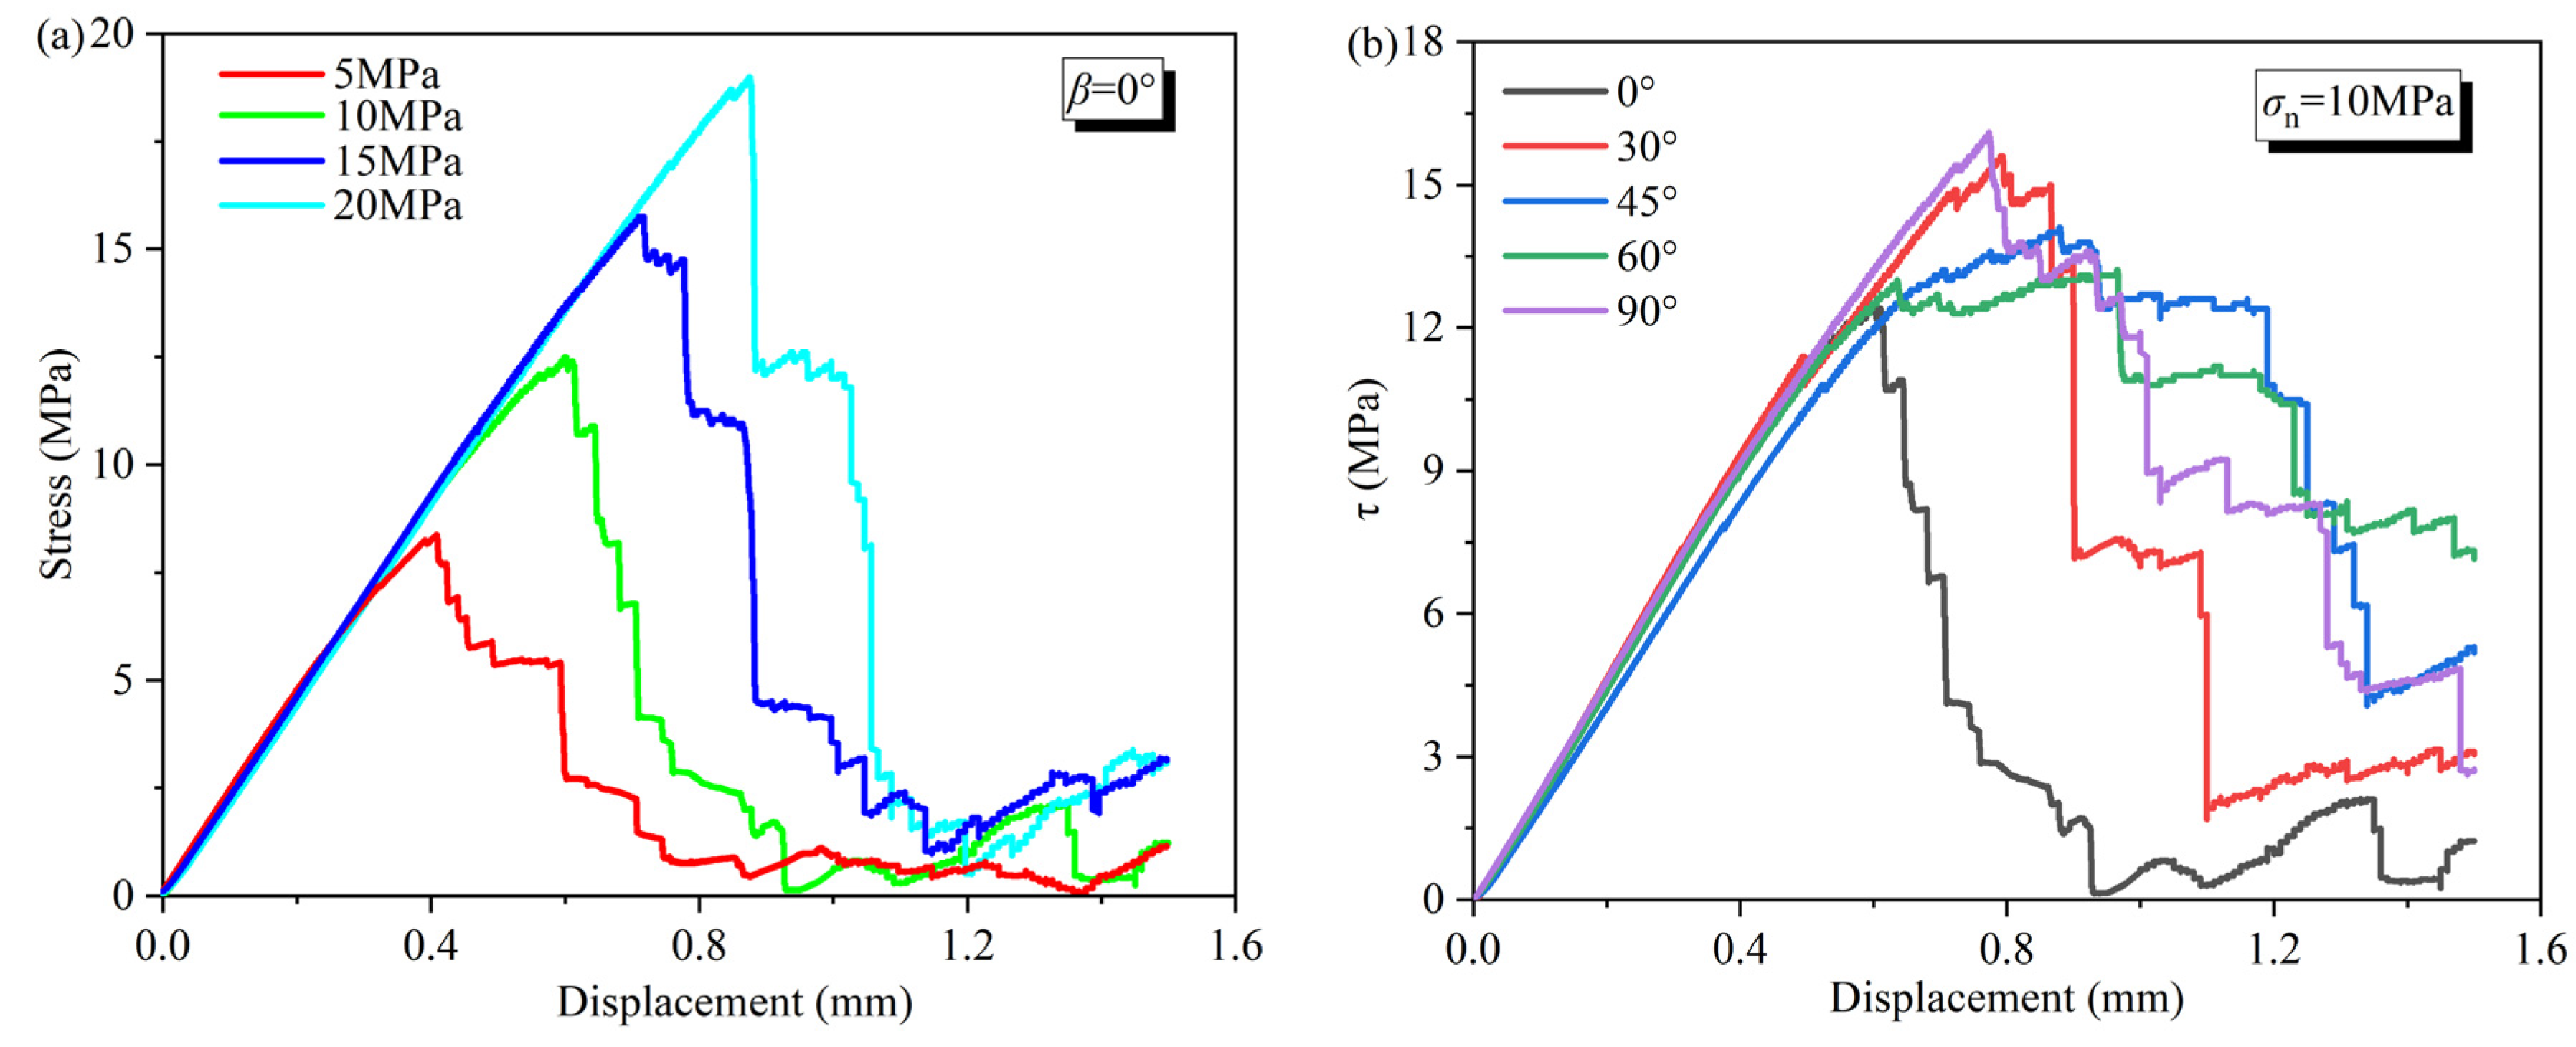
The shear stress–displacement curve obtained by the direct shear test for slate at β = 0° and σn = 10 MPa is shown in Figure 12. Both τp and peak shear displacement increase with σn increases, with τr being higher at σn values of 15 MPa and 20 MPa. τp exhibits an increasing–decreasing–increasing pattern with increasing β. Peak shear displacement is relatively small at β = 0° and 90°, measuring 0.60 mm and 0.77 mm, respectively, whereas it is more substantial at β values of 30°, 45°, and 60°. For β = 0° and 90°, the curve segment after τp exhibits a multiple shear stress drop phenomenon. As the shear stress decreases to a certain extent, the slope of the curve becomes gentler, and the stick-slip phenomenon emerges. Unlike the curve for β = 90° and β = 0°, when the stress after the peak decreases to a certain extent, there is a more pronounced fluctuation. At β = 30°, the number of post-peak stress declines is lower, yet each decrease is more substantial. At β = 45° and 60°, the shear stress changes slowly, shear displacement increases rapidly, and the shear-slip phenomenon becomes more pronounced. In general, the elastic modulus of slate remains unchanged with the increase in β and σn.
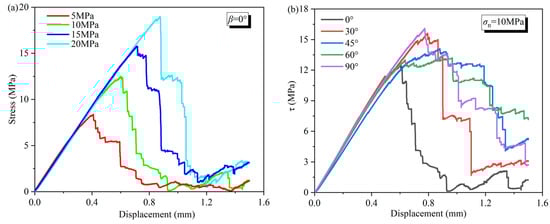
Figure 12.
Shear stress–displacement curves of numerical simulation for slate with (a) different σn when β = 0° and (b) different β when σn = 10 MPa.
At σn = 10 MPa (Figure 4b and Figure 12b), due to the simplified assumptions in the numerical model, it cannot fully reflect the heterogeneity and anisotropy of real rock materials. Therefore, there are some discrepancies between the experimental and simulation results. However, overall, there is a certain similarity in the strength response under different β.
4.2.2. Crack Evolution
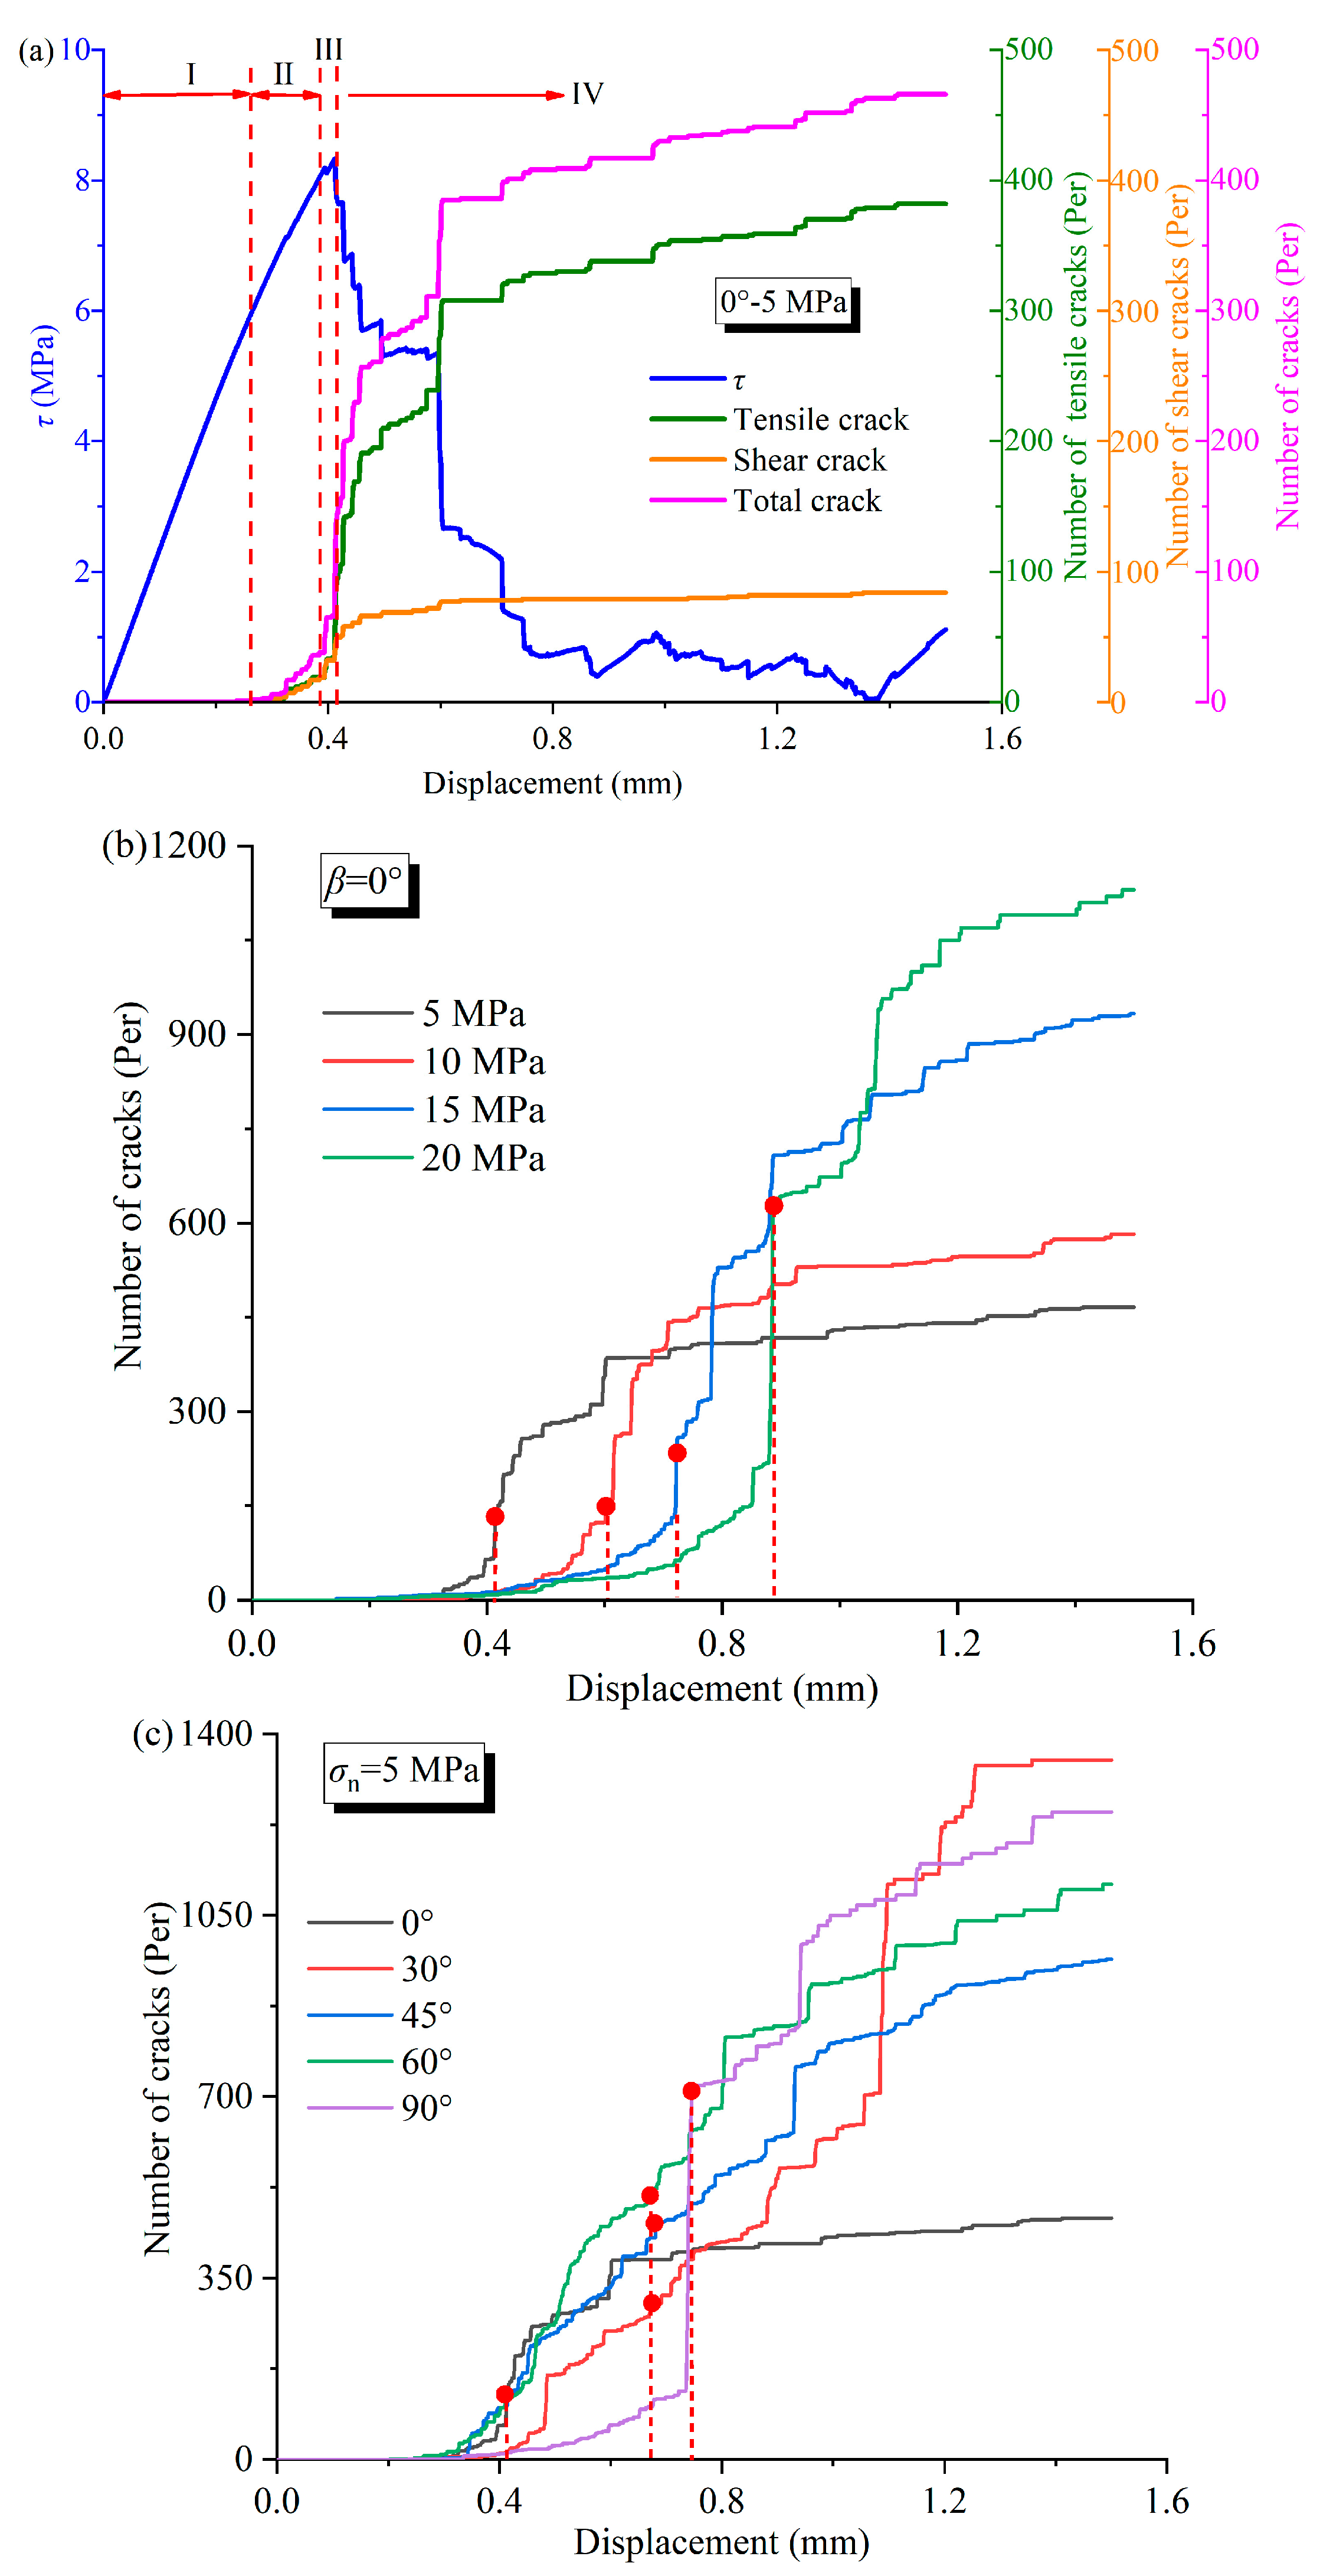
The specimen cracking and damage are macroscopically exhibited as the initiation, propagation, and penetration of microcracks. Quantitative analysis of the damage process can be carried out through the variation in the number of microcracks. The crack evolution with displacement under different conditions is similar. Taking the sample with β = 0° and σn = 5 MPa as an example, the relationship between shear stress, displacement, and the crack number is presented in Figure 13a. The crack evolution process can be divided into four stages with the progression of displacement:
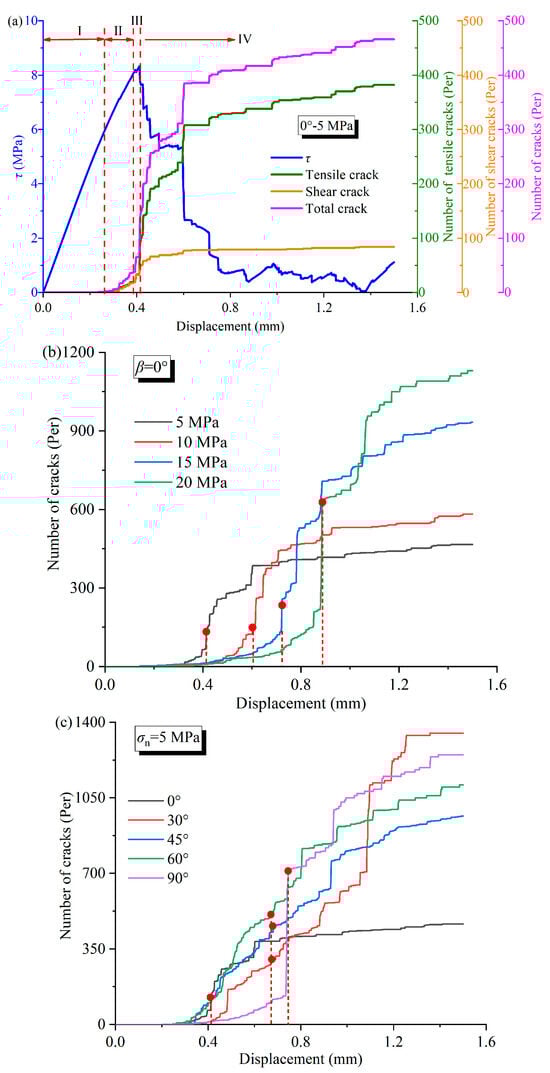
Figure 13.
Variation in number of cracks during shearing for slate: (a) for the tensile, shear, and total crack (β = 0°, σn = 5 MPa); the total crack under different (b) σn (β = 0°); and (c) β (σn = 5 MPa).
Stage I—elastic stage: The shear stress–displacement curve is approximately linear, and there are almost no cracks during this stage.
Stage II—crack stable propagation: As the interaction force between particles exceeds its bond strength, particle bonds break, generating tensile and shear cracks. At this stage, cracks are generated locally without connecting and penetrating. Therefore, the number of cracks increases slowly and remains relatively stable.
Stage III—unstable expansion stage: With increasing load, particle bond failure continues to rise, rapidly increasing the number of cracks. The shear stress–displacement curve exhibits prominent nonlinear growth, primarily due to the mutual expansion, intersection, and penetration of cracks.
Stage IV—post-peak stage: After reaching the τp of the specimen, the shear stress decreases rapidly. The growth rate of the crack number slows down and gradually stabilizes. Inside the specimen, prominent macroscopic and secondary cracks are forming [37].
The variation in crack number with the displacement of specimens at different σn with β = 0° is shown in Figure 13b, where the red points indicate the shear displacement at the peak shear stress. Crack evolution for specimens under different σn follows a similar trend. For the same β, an increase in σn leads to a higher crack number. Notably, at higher normal stress levels, the increase rate of crack number is lower when it reaches the same displacement in the stable propagation stage. This observation suggests that normal stress effectively inhibits microcrack generation. The crack evolution under varying β values is presented in Figure 13c (σn = 5 MPa). The number of cracks and the corresponding increase rate at the peak shear stress moment for specimens with vertical bedding are higher than those with horizontal bedding. However, the crack growth rate at the peak shear stress moment for other β values is similar. The growth rate of the number of cracks gradually slows down with increasing displacement and ultimately stabilizes. The total number of cracks initially increases, then decreases, and subsequently increases with the increase in β.
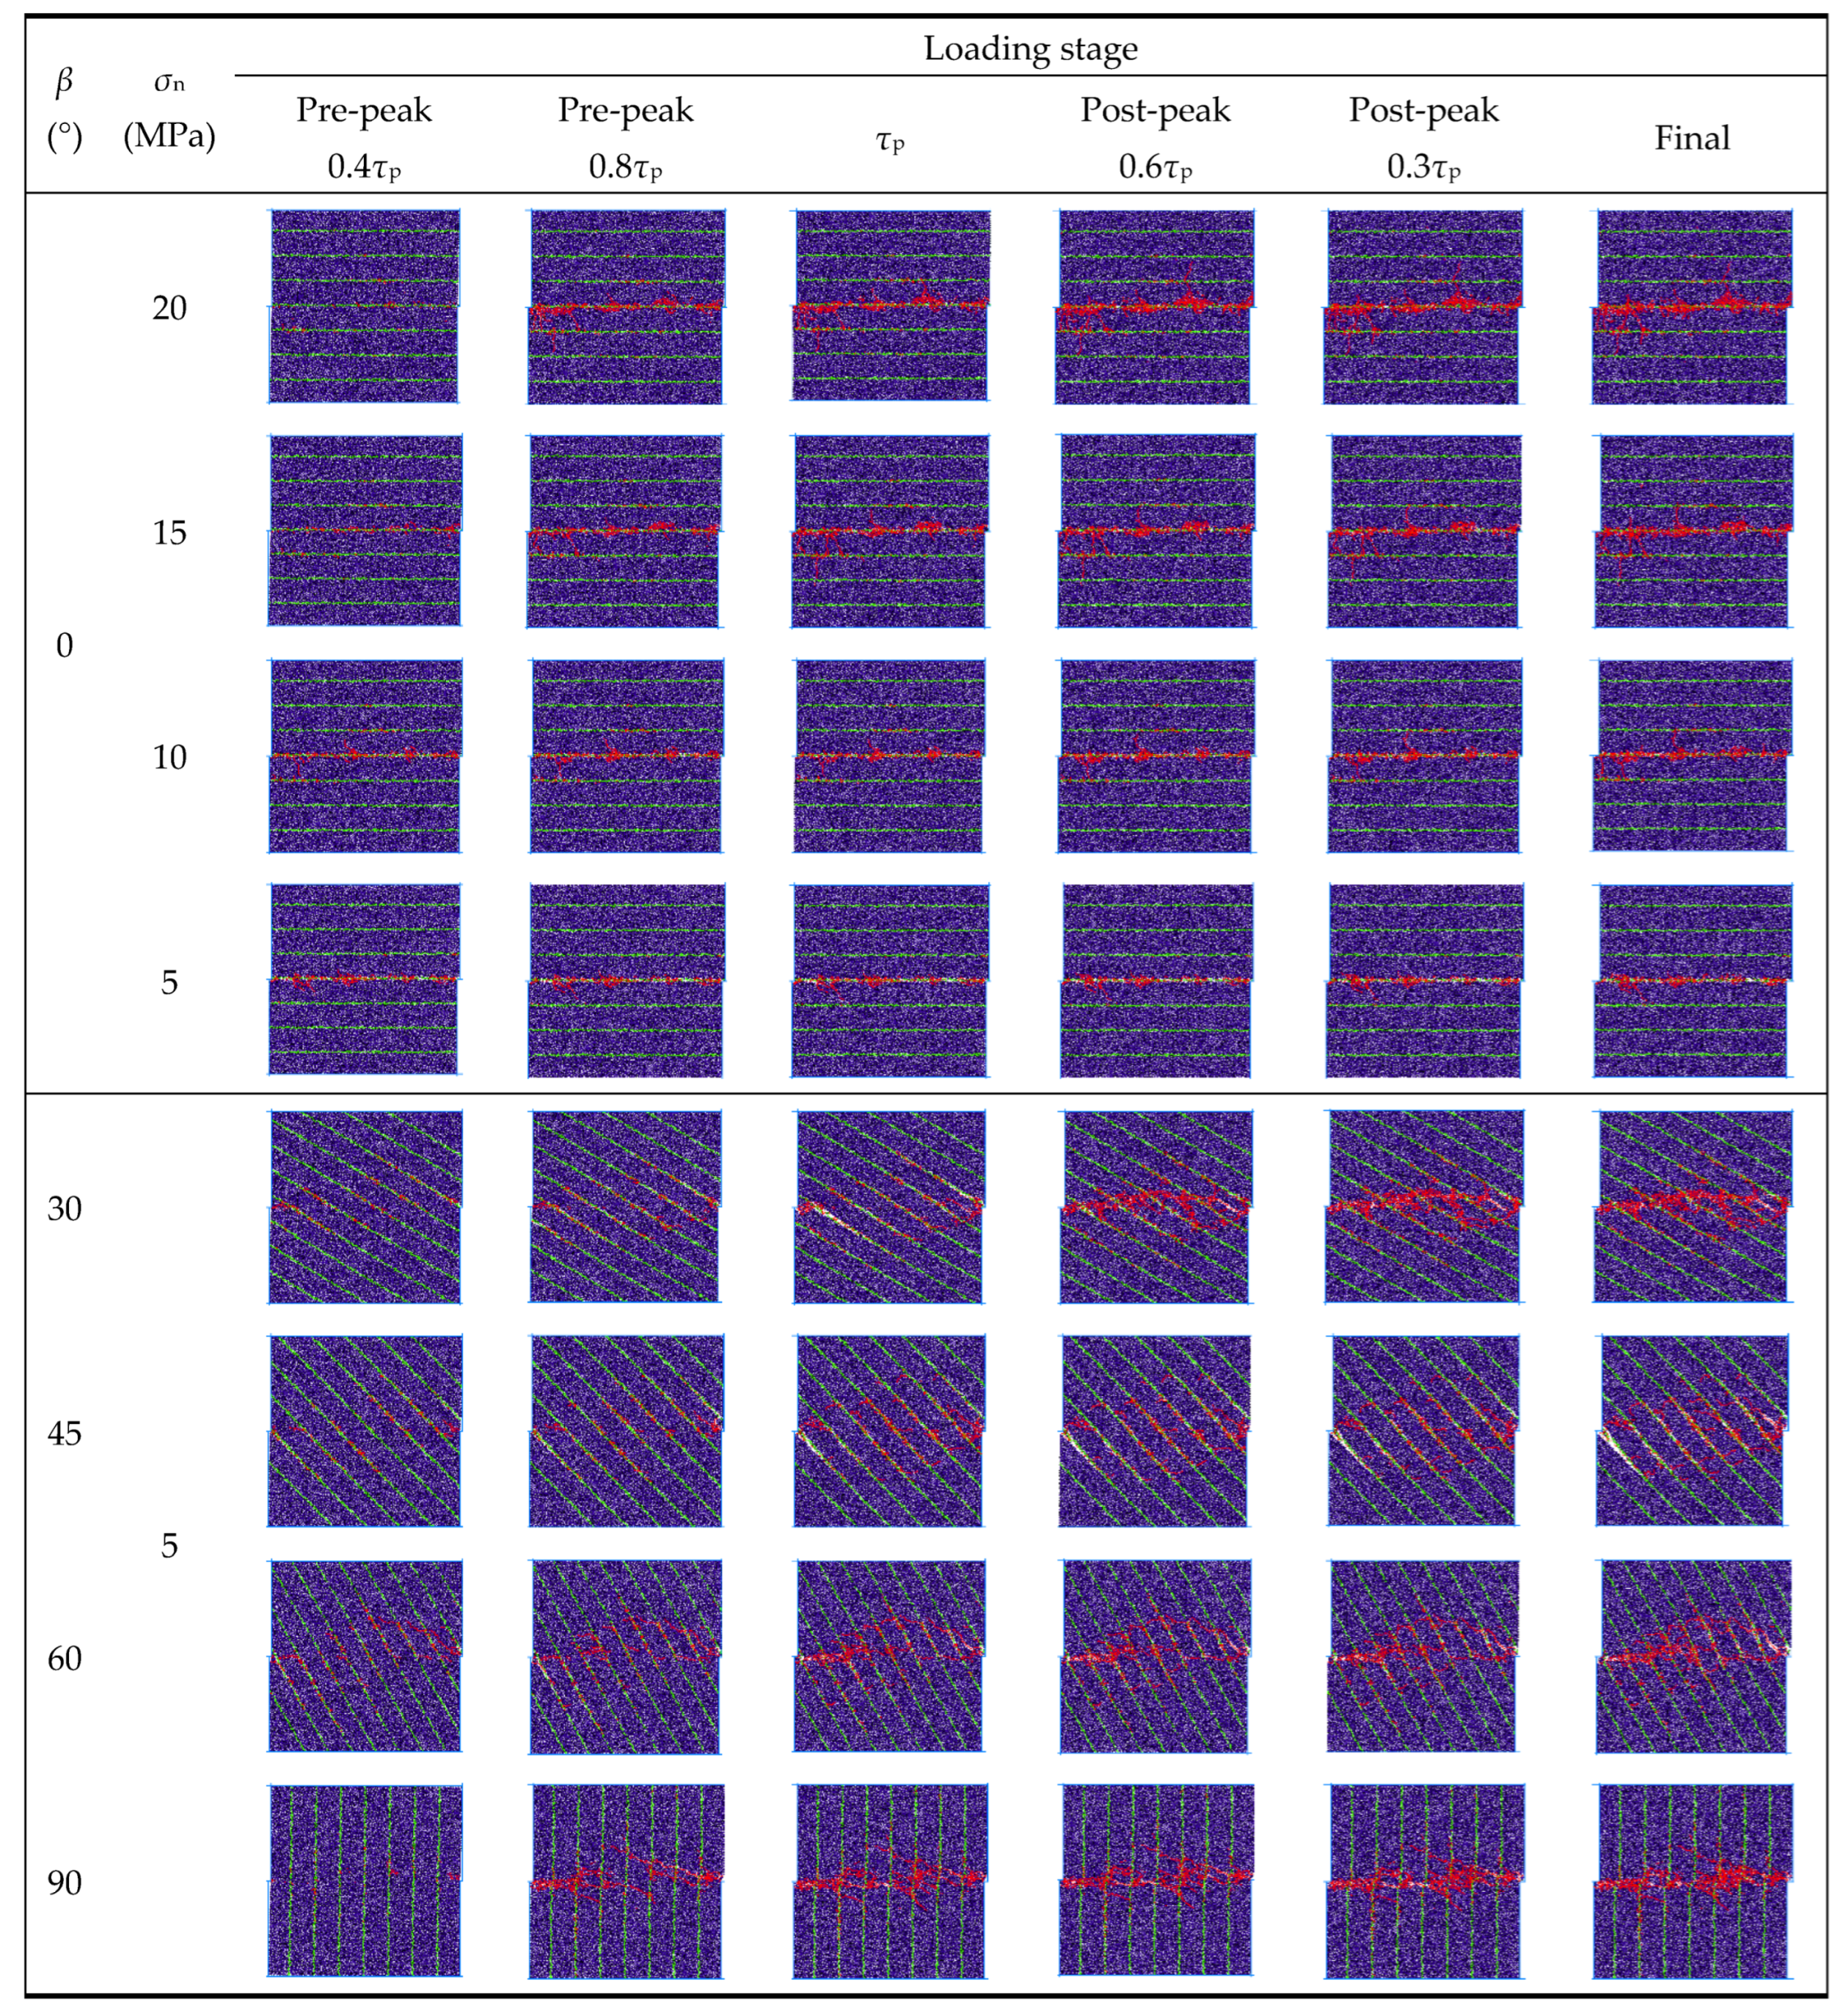
In conjunction with the crack evolution depicted in Figure 14, when β is within 30–60°, shear cracks initially initiate along the bedding plane of the sample during the early loading stage. As displacement increases, internal stress redistributes, and the slip effect along the bedding plane is constrained by normal stress. Subsequently, cracks start appearing in the matrix and steadily increasing in number; nevertheless, the crack generation rate is slower than that in the bedding plane, culminating in shear failure either along or through the bedding plane. However, lateral deformation in samples with β values of 0° and 90° is inhibited under normal stress. The shear and tensile effects on the bedding plane are minimal, resulting in no rapid crack increase in the early loading stage. Precisely, at β = 0°, larger σn values correspond to a more pronounced lateral crack development. These lateral branch cracks in the middle part of the inclined bedding prominently develop along the bedding plane. In horizontal bedding, most cracks are concentrated on the shear band, whereas the distribution range of the shear bed in inclined bedding is wider, being widest at β = 45°.
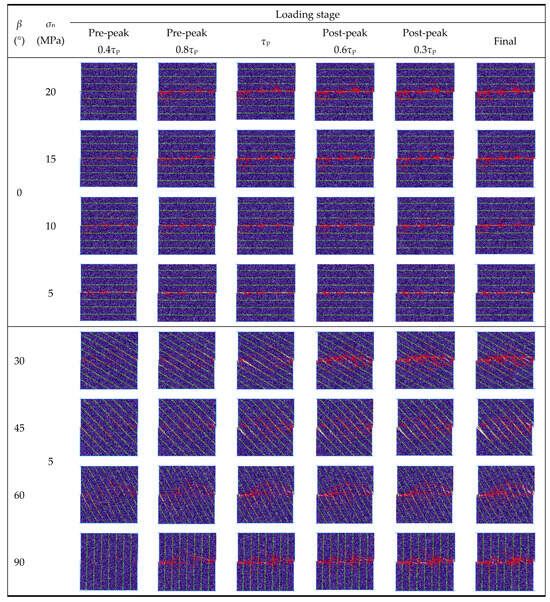
Figure 14.
Cracks evolution of slate under different β and σn.
4.2.3. The Features of the Force Chain
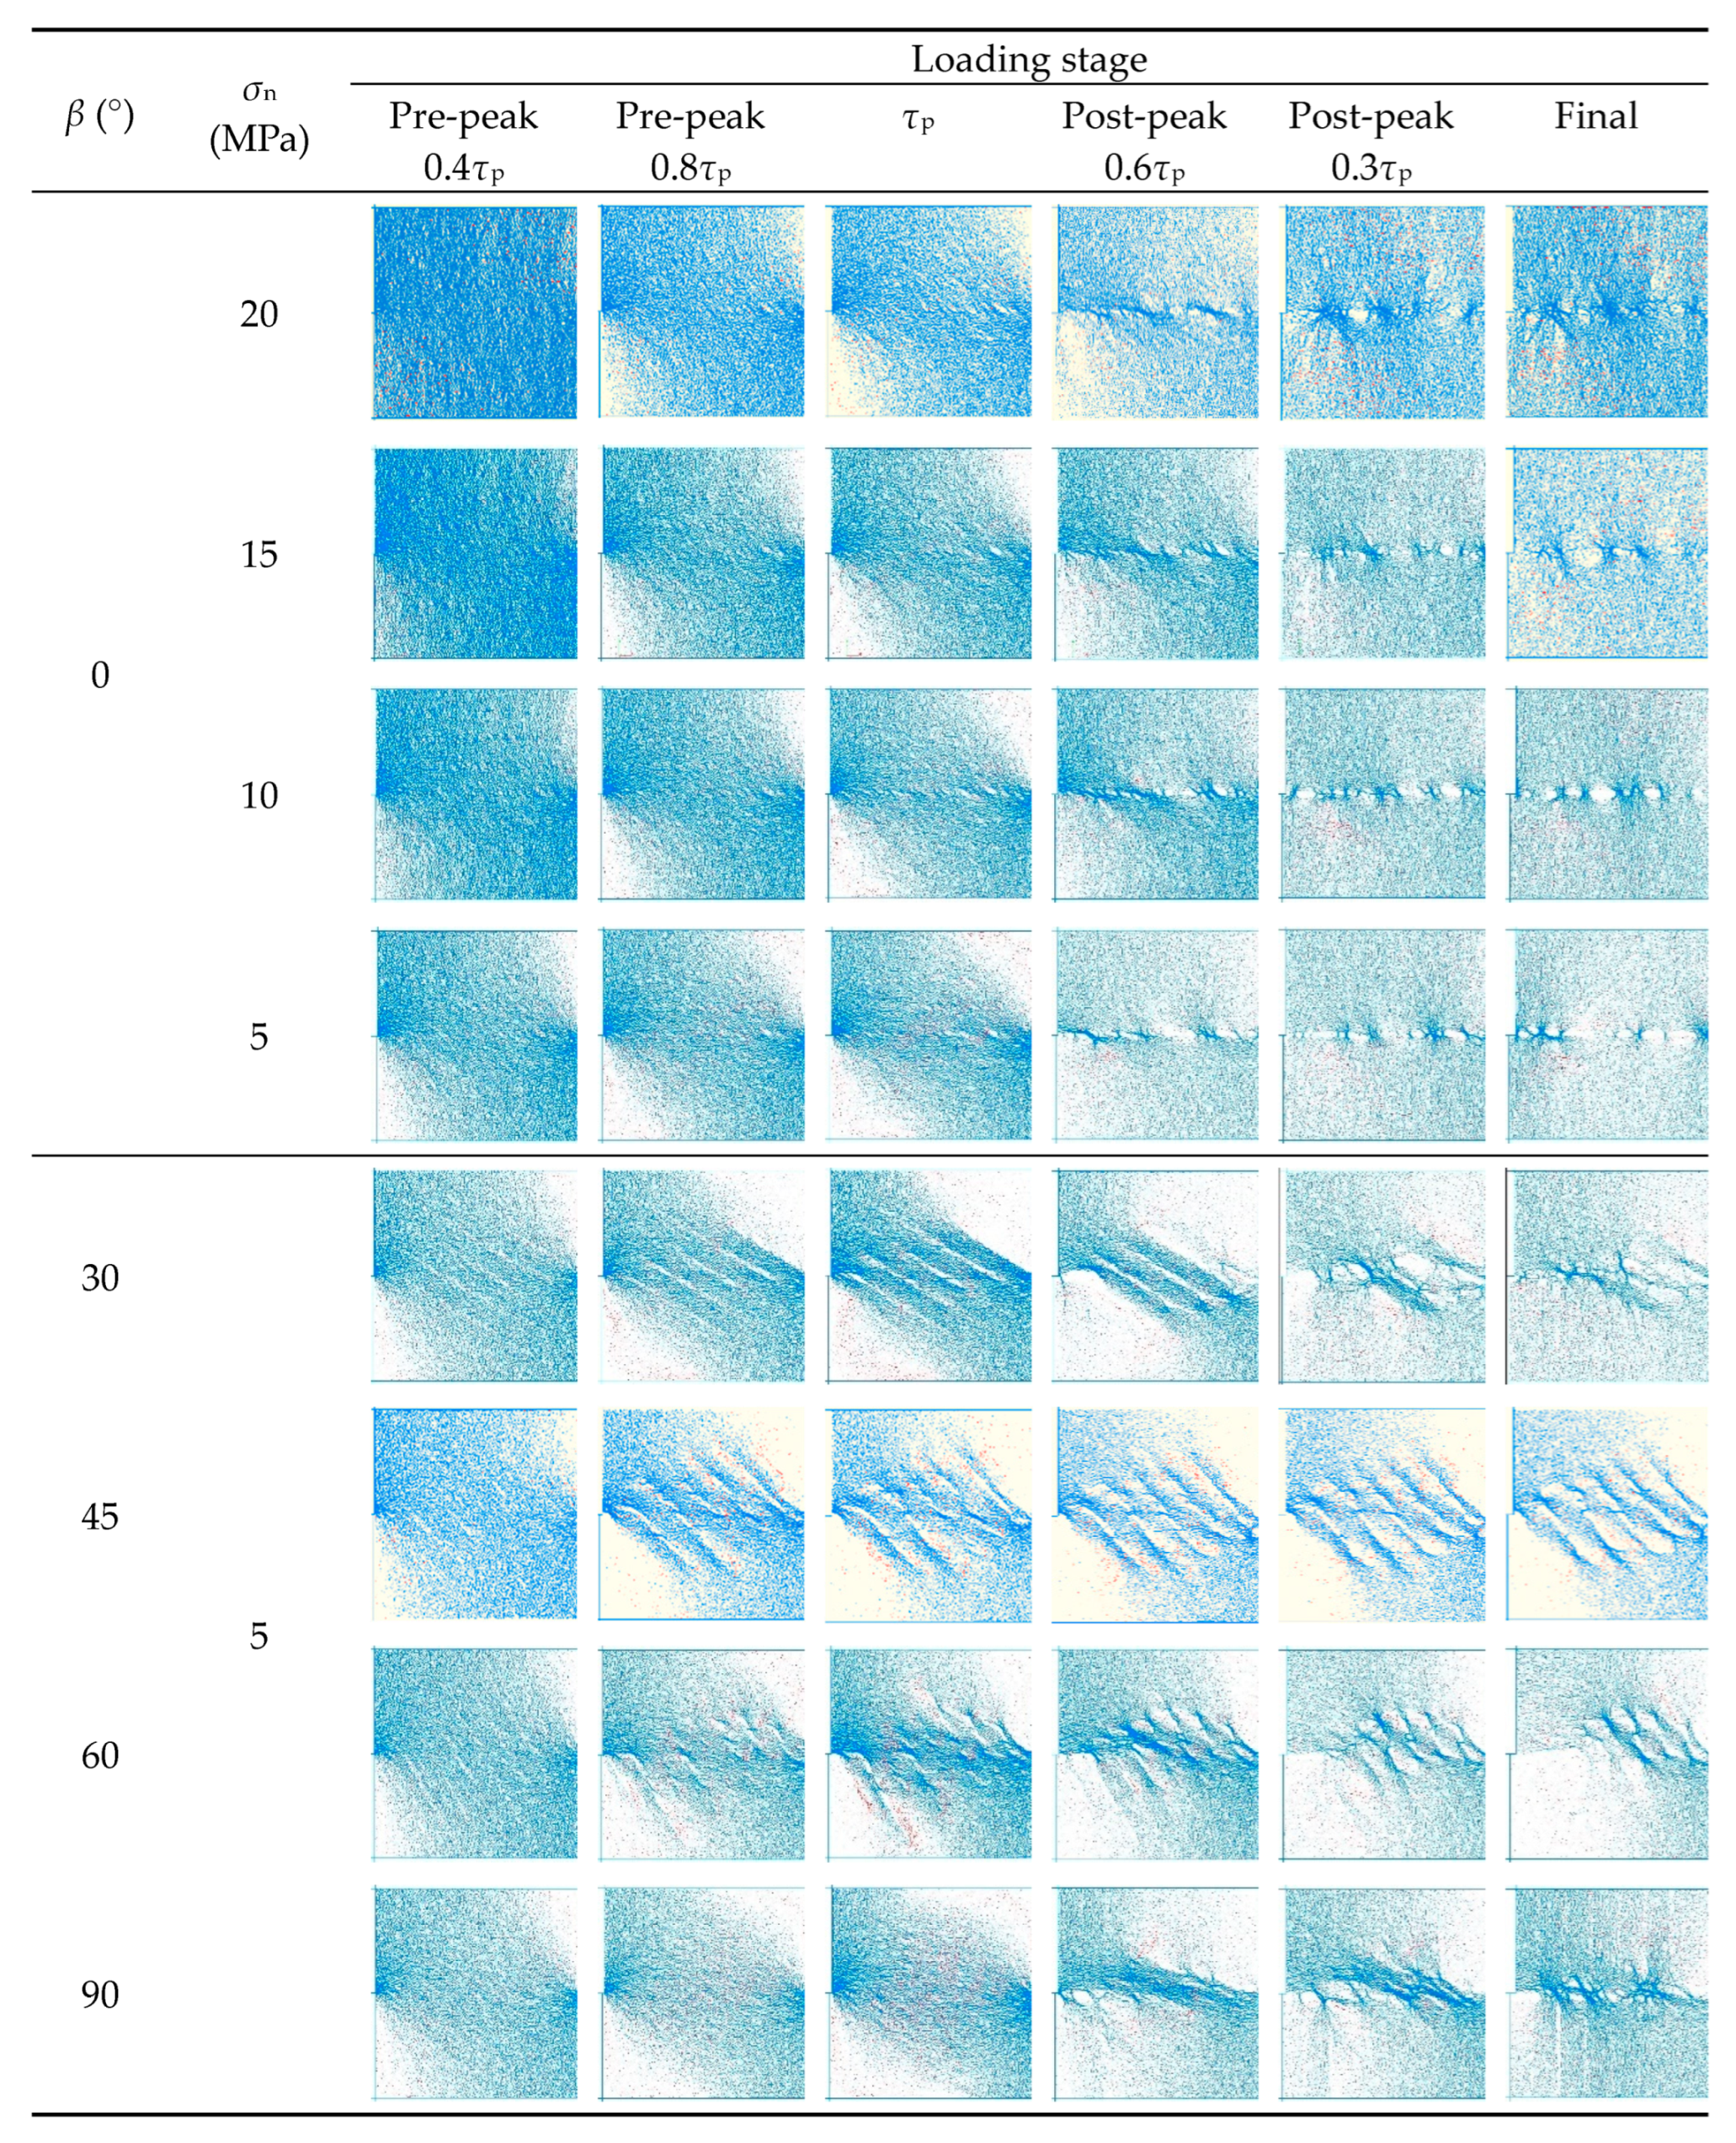
In order to investigate the micro-mechanism of layered slate under direct shear, the distribution of the particle force chain (FC) in the specimen was monitored and recorded. FC evolution under varying β and σn values is shown in Figure 15. Using the examples of β = 0° and σn = 5 MPa, the impact of σn and β on the FC evolution is analyzed. In the FC diagram, blue and red lines represent compression and tensile forces, respectively. The thickness of the FC line corresponds to the magnitude of the contact force: A thicker FC indicates a greater contact force.
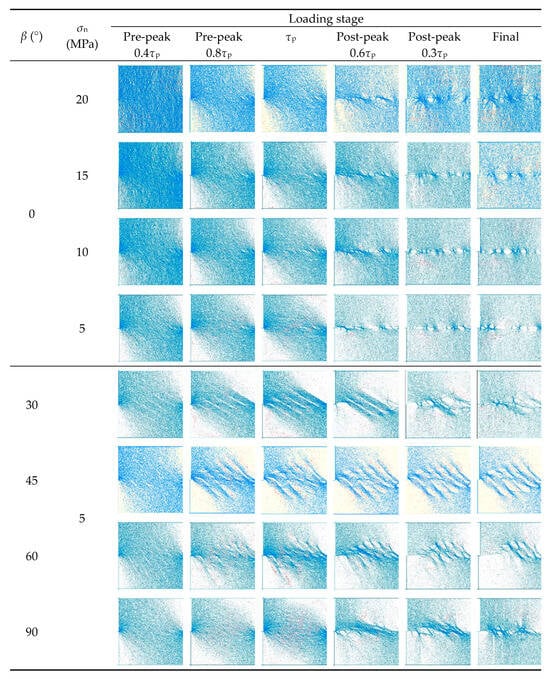
Figure 15.
Force chain evolution of slate under different β and σn.
At the same β, the FC density increases with increasing σn. In the initial loading stage, the contact force distribution of the samples is relatively uniform. Near τp, FC becomes more concentrated, and the damaged area expands. With the progression of displacement, FC is more concentrated in the shear slip direction (the density of FC in this direction is more considerable). As cracks initiate, propagate, and penetrate, internal FC gradually breaks and diminishes. Macroscopic fractures initiate with the increased contact force in the loading direction. Corresponding to the shear stress–displacement curve, as σn increases from low to high, FC continues to break at shear displacements of 0.40 mm, 0.60 mm, 0.72 mm, and 0.85 mm, respectively. This phenomenon aligns with the crack evolution discussed above, which shows the fastest increase in the number of cracks.
For samples with different β values at 5 MPa, a noticeable distribution of the FC along the bedding direction is noticed. In the initial loading stage, the contact force distribution in horizontal bedding is more uniform, with a higher FC density and more prominent contact force. As stress increases, FC gradually diffuses toward both ends. At a load of 0.8τp, the contact force becomes concentrated at the upper left and lower right ends of the model. At this point, tensile force is more pronounced with β = 45° and 60° along the bedding plane, particularly evident at τp. FC concentrates further in the direction of shear slip as displacement increases, where the contact force is larger, and the FC density is higher. After the τp, except for β = 90°, FC at other β values gradually weakens and disappears with crack penetration.
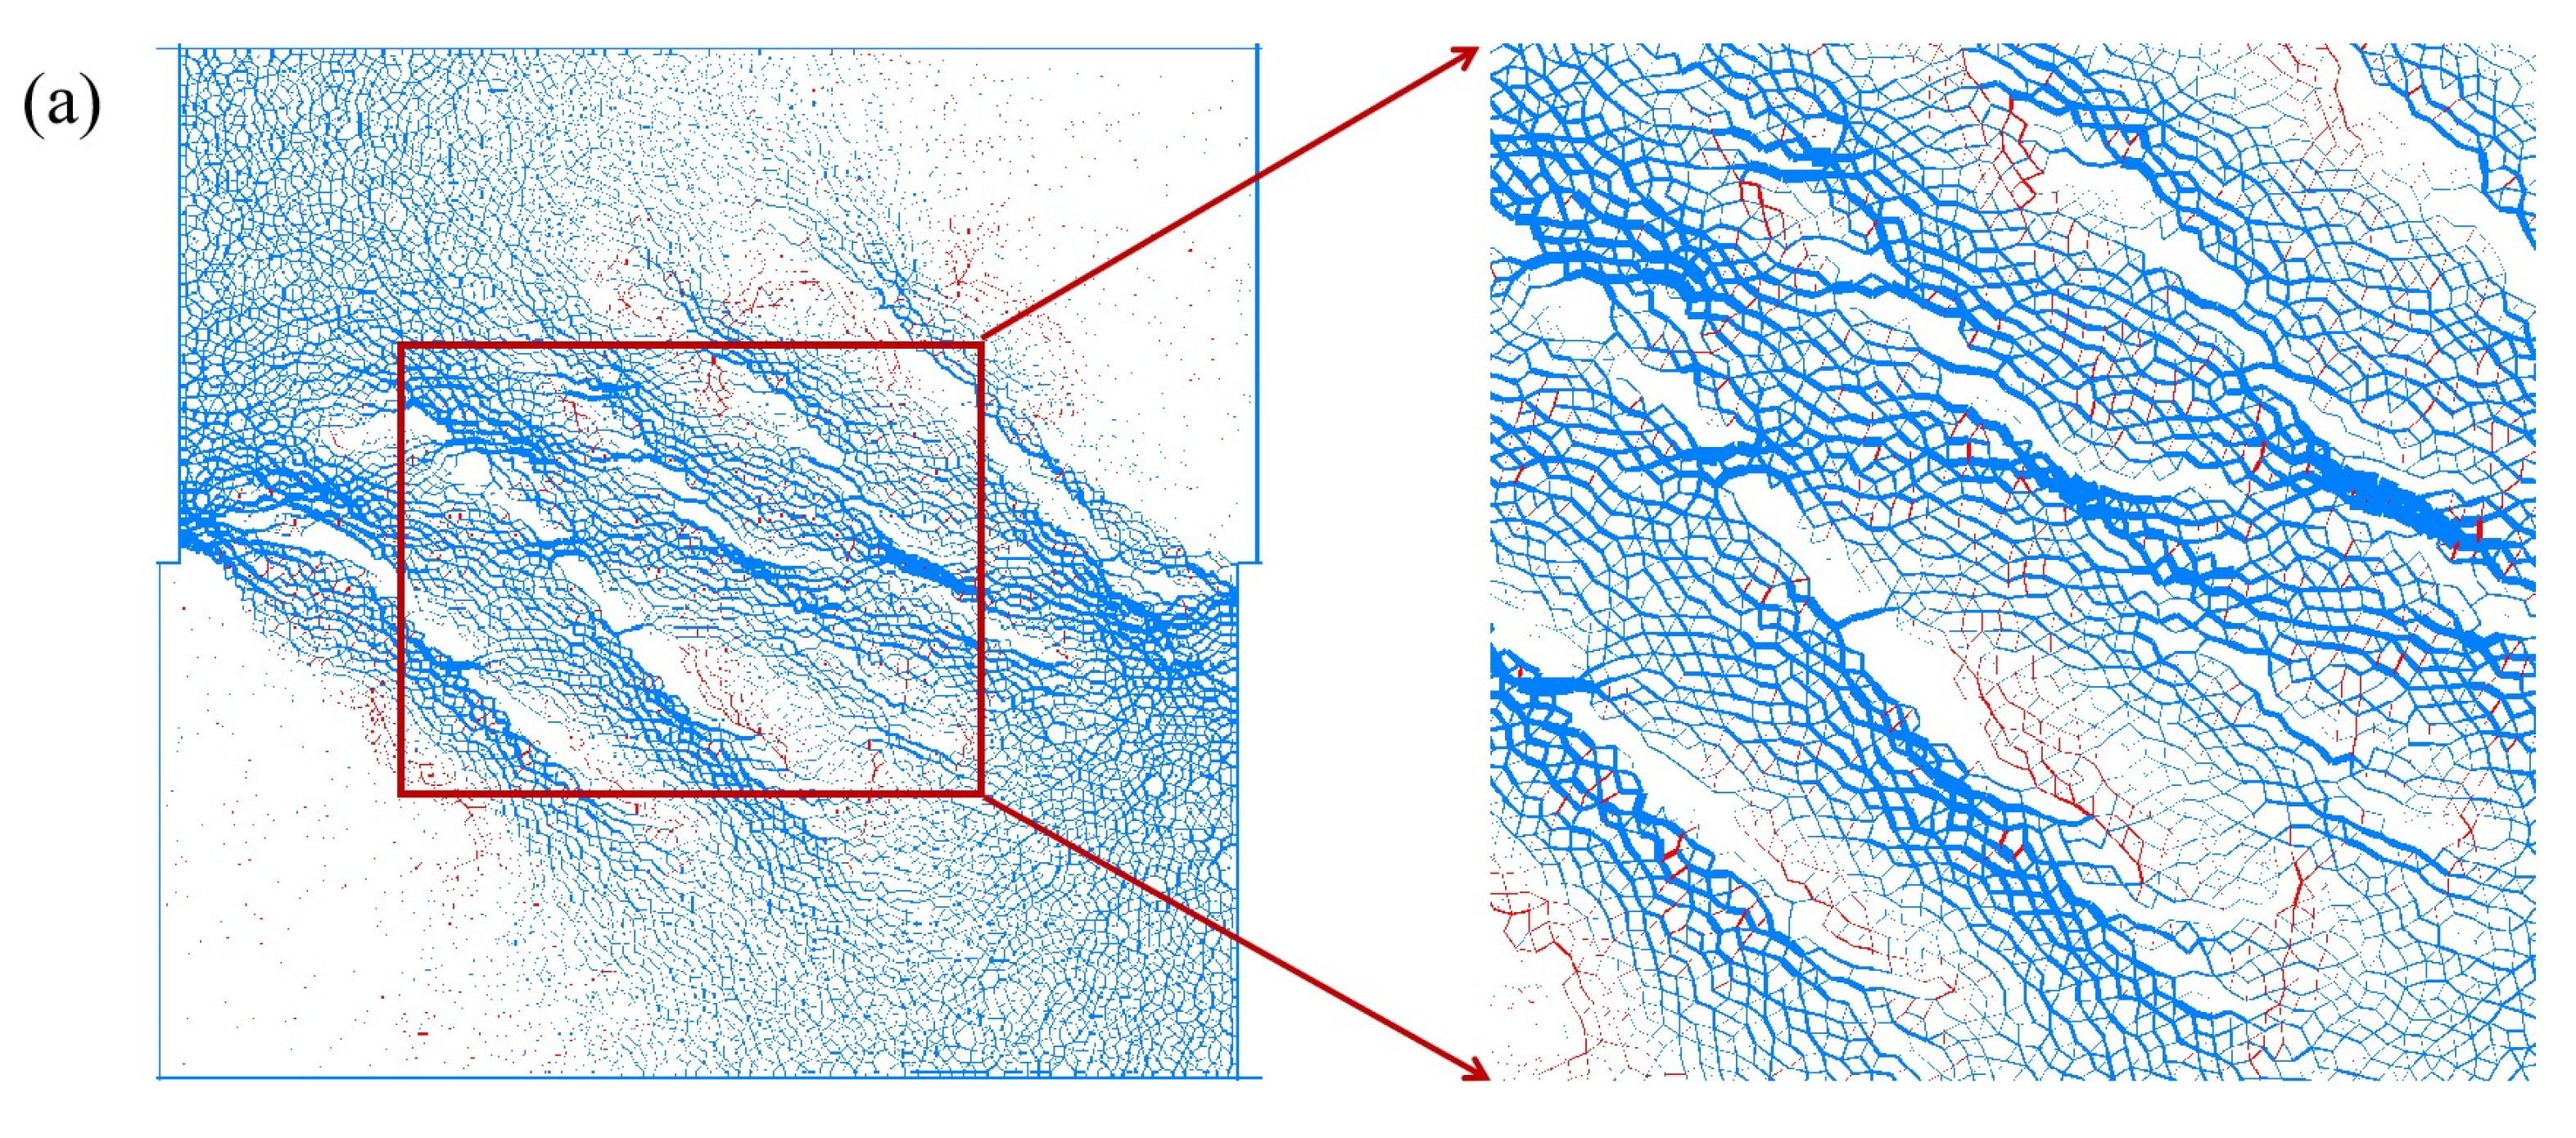
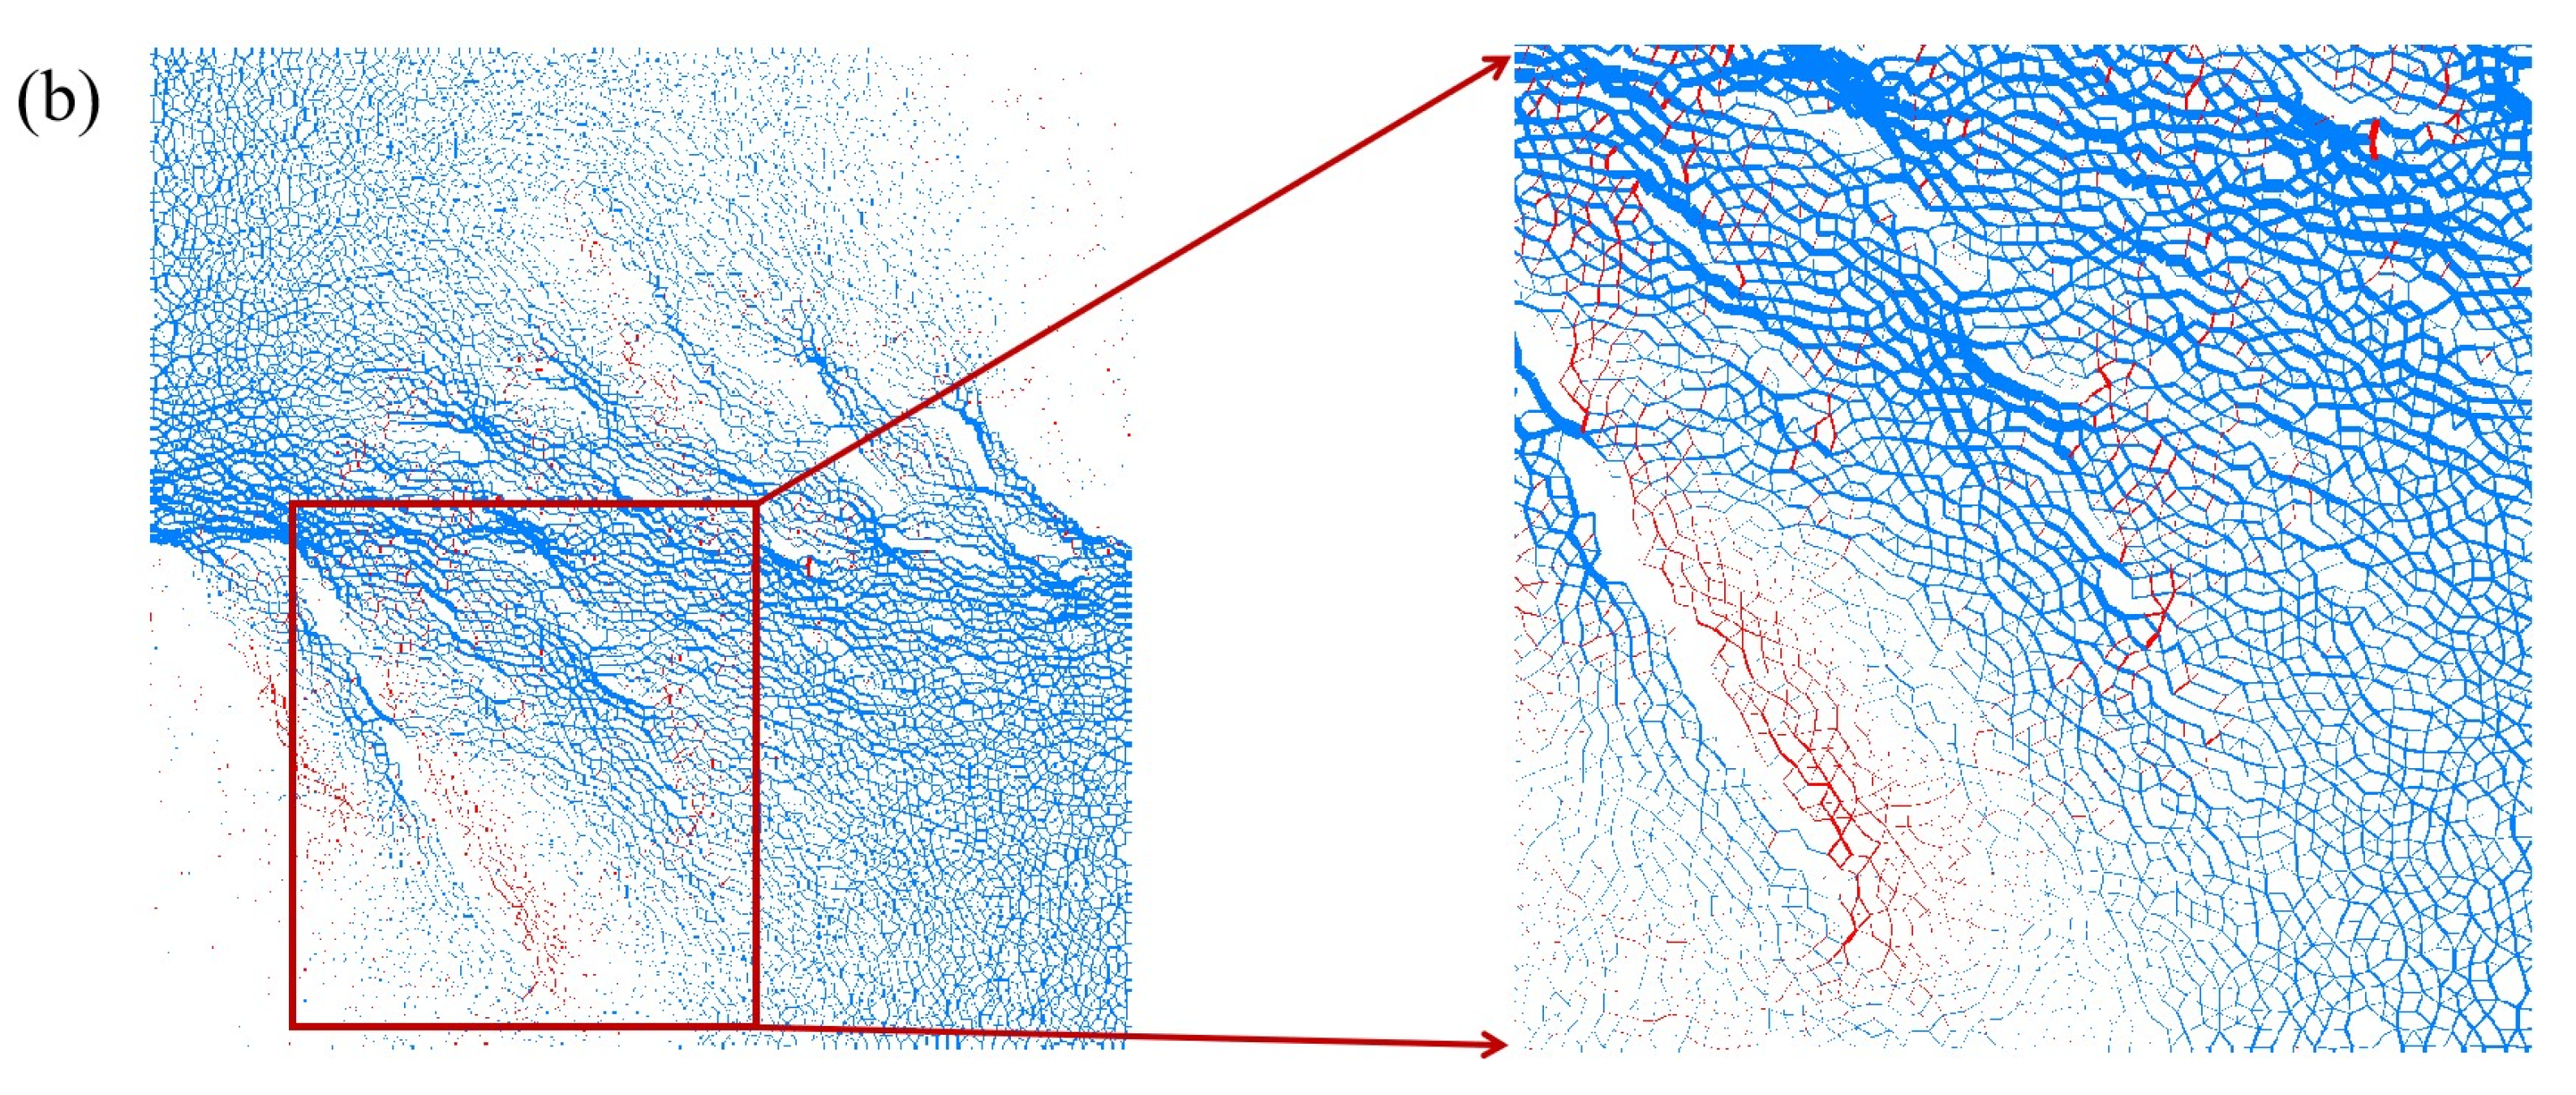
The locally enlarged image of FC for a sample with β = 45° and 60° at τp is shown in Figure 16. The tensile FC of the sample at 45° is mainly distributed along the chains between the particles and primarily found in the matrix layer. However, the tensile FC is predominantly distributed in the bedding plane for the specimen with β = 60°, forming a chain distribution along the bedding direction. The distribution characteristics of the tensile force provide a better explanation for τp = 45° > τp = 60°: when the tensile force along the non-layered surface distribution is more prominent, failure is more complex, which is attributed to the bedding plane (with lower tensile strength) of the rock being weaker than the matrix.
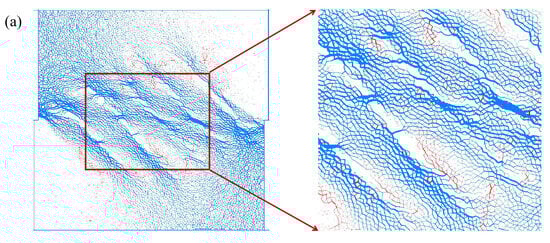
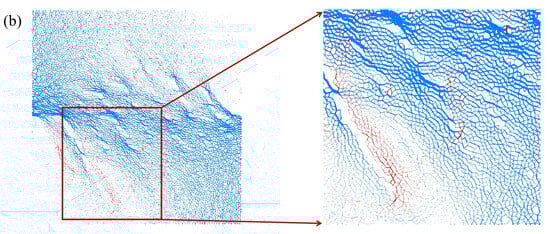
Figure 16.
Local magnification of force chain at peak stress; (a) β = 45° and (b) β = 60°.
5. Discussion
In order to assess the shear strength of slate using the anisotropic shear failure criterion initially proposed for shale [32], it is imperative to ascertain the anisotropic state parameter A to capture both the inherent bedding-induced anisotropy and the stress-induced anisotropy observed in the tests. When τ = 0 MPa, A can be further simplified as expressed in Equation (2).
where represents the uniaxial compressive strength, and fc0, fc1, and fc2 are unknown material parameters. The Mohr–Coulomb criterion, widely used to describe the shear strength of geotechnical materials, is expressed as Equation (5).
For transversely isotropic geomaterials, the internal friction angle and cohesion are related to the bedding orientation or, more directly, the anisotropic state. From Equation (4), it is reasonably assumed that the M-C strength parameters of a given anisotropic geomaterial follow the same variation trend as A. Therefore, the internal friction coefficient and cohesion are considered as given in Equations (6) and (7).
where f0, f1, f2, c0, c1, and c2 are material parameters that can be determined through a numerical approximation method using direct shear tests on slate samples with different orientations. Substituting Equations (6) and (7) into the M-C criterion in Equation (5) yields a new anisotropic shear failure criterion.
The uniaxial compressive strength of slate samples in different bedding directions can be used to calibrate δ. The compressive strength values of slate with bedding directions of 0°, 45°, and 90° are 70 MPa, 30 MPa, and 90 MPa, respectively. Then, the unknown parameters are determined using the least square method as Δ = 2.952, fc0 = 31.71, fc1 = 3.56, and A can be calculated. Finally, six material parameters can be obtained, i.e., c0 = 10.798, c1 = 1.118, c2 = 0.508, f0 = 0.808, f1 = −0.693, and f2 = 0.256.
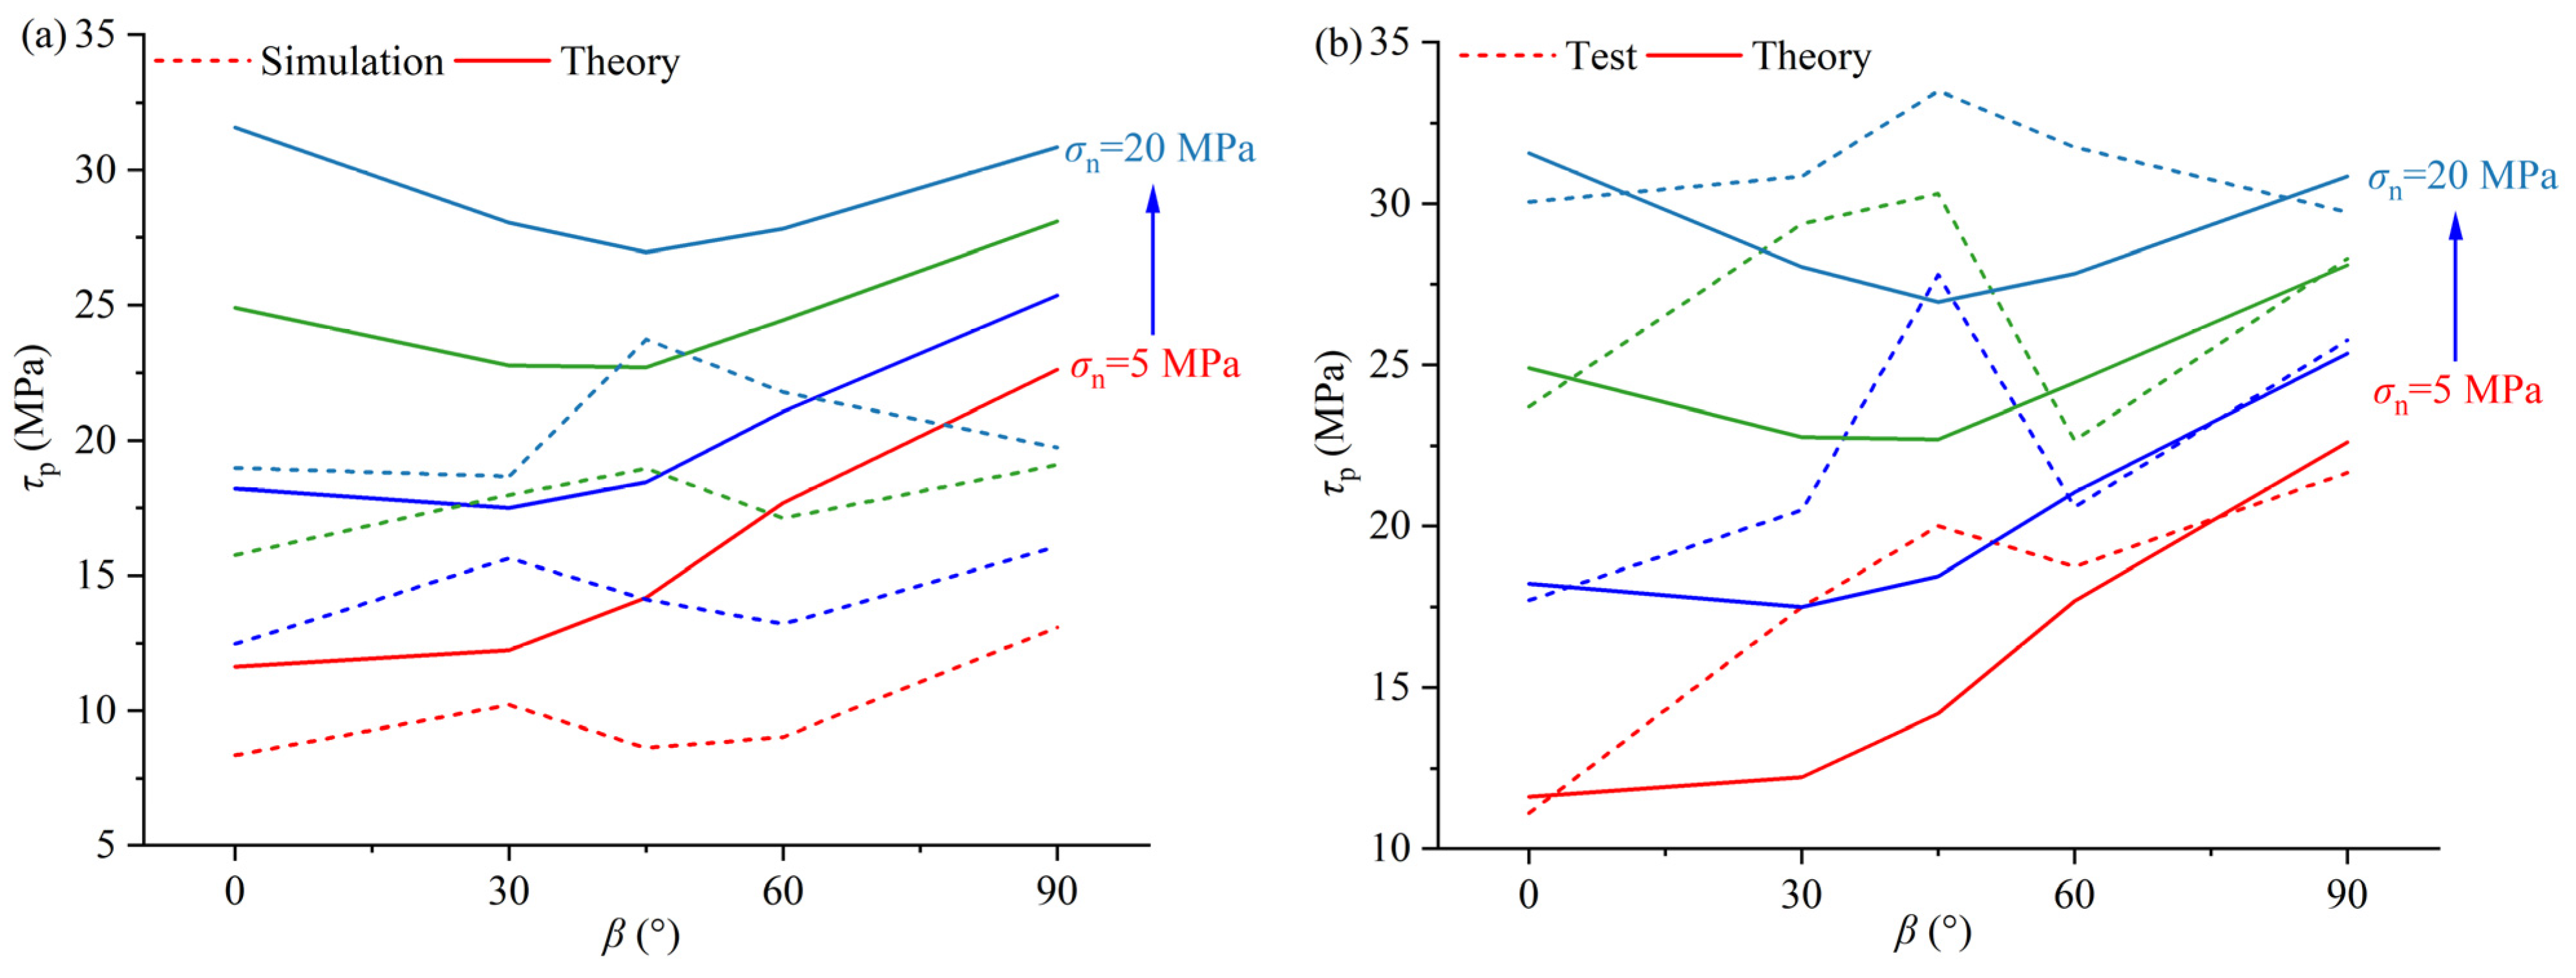
The theoretical estimates of the shear strength for specimens with different bedding orientations are shown in Figure 17. This criterion can capture the slate shear strength sensitivity to β and σn. However, the estimated values exhibit significant disparities from experimental and simulation results. A macroscopic analysis suggests that the literature uses shale, a sedimentary rock, whereas it is a metamorphic rock derived from an original sedimentary rock composed of clay or volcanic ash. Sedimentary rocks are usually formed by the deposition of sediments such as clasts, minerals, and organic material in natural processes. Organic matter such as asphalt and carbon are also sometimes present. The mineralogical characteristics of metamorphic rocks are related to the composition of the original rocks, but some minerals may change during metamorphism. For example, under high temperatures and high pressure, feldspar may become amphibole, and quartz may change to form new minerals such as mica. In addition, the bedding distribution of shale samples is more uneven than that of slate, affecting the accuracy of the estimation results [38,39,40,41,42].
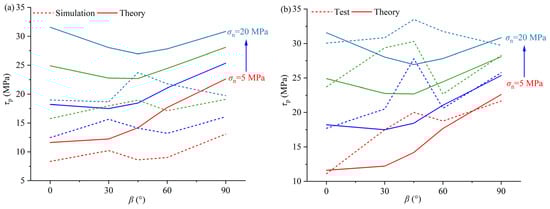
Figure 17.
The comparison of shear strength between theoretical calculation [32] and (a) simulation and (b) experimental results.
From a microscopic mechanism perspective, samples at 45° and 60° exhibit τp = 45° > τp = 60° due to the distribution characteristics of tensile force. The crack evolution reveals that, for the 90° sample, cracks mostly appear along the loading and the non-layered planes, with almost no cracks along the bedding direction, resulting in higher strength. The number of cracks for the 30° bedding angle is comparable to that at 90°, though cracks at 30° are more likely to appear along the bedding plane, making the model more prone to failure. At β = 60°, the specimen develops cracks on both the bedding plane and the matrix, which are more divergent, can expand faster, and result in lower strength. In the case of the 0° specimen, only a small number of cracks are generated on the loading surface, leading to the lowest strength; thus, τp = 90° > τp = 30° > τp = 60° > τp = 0°.
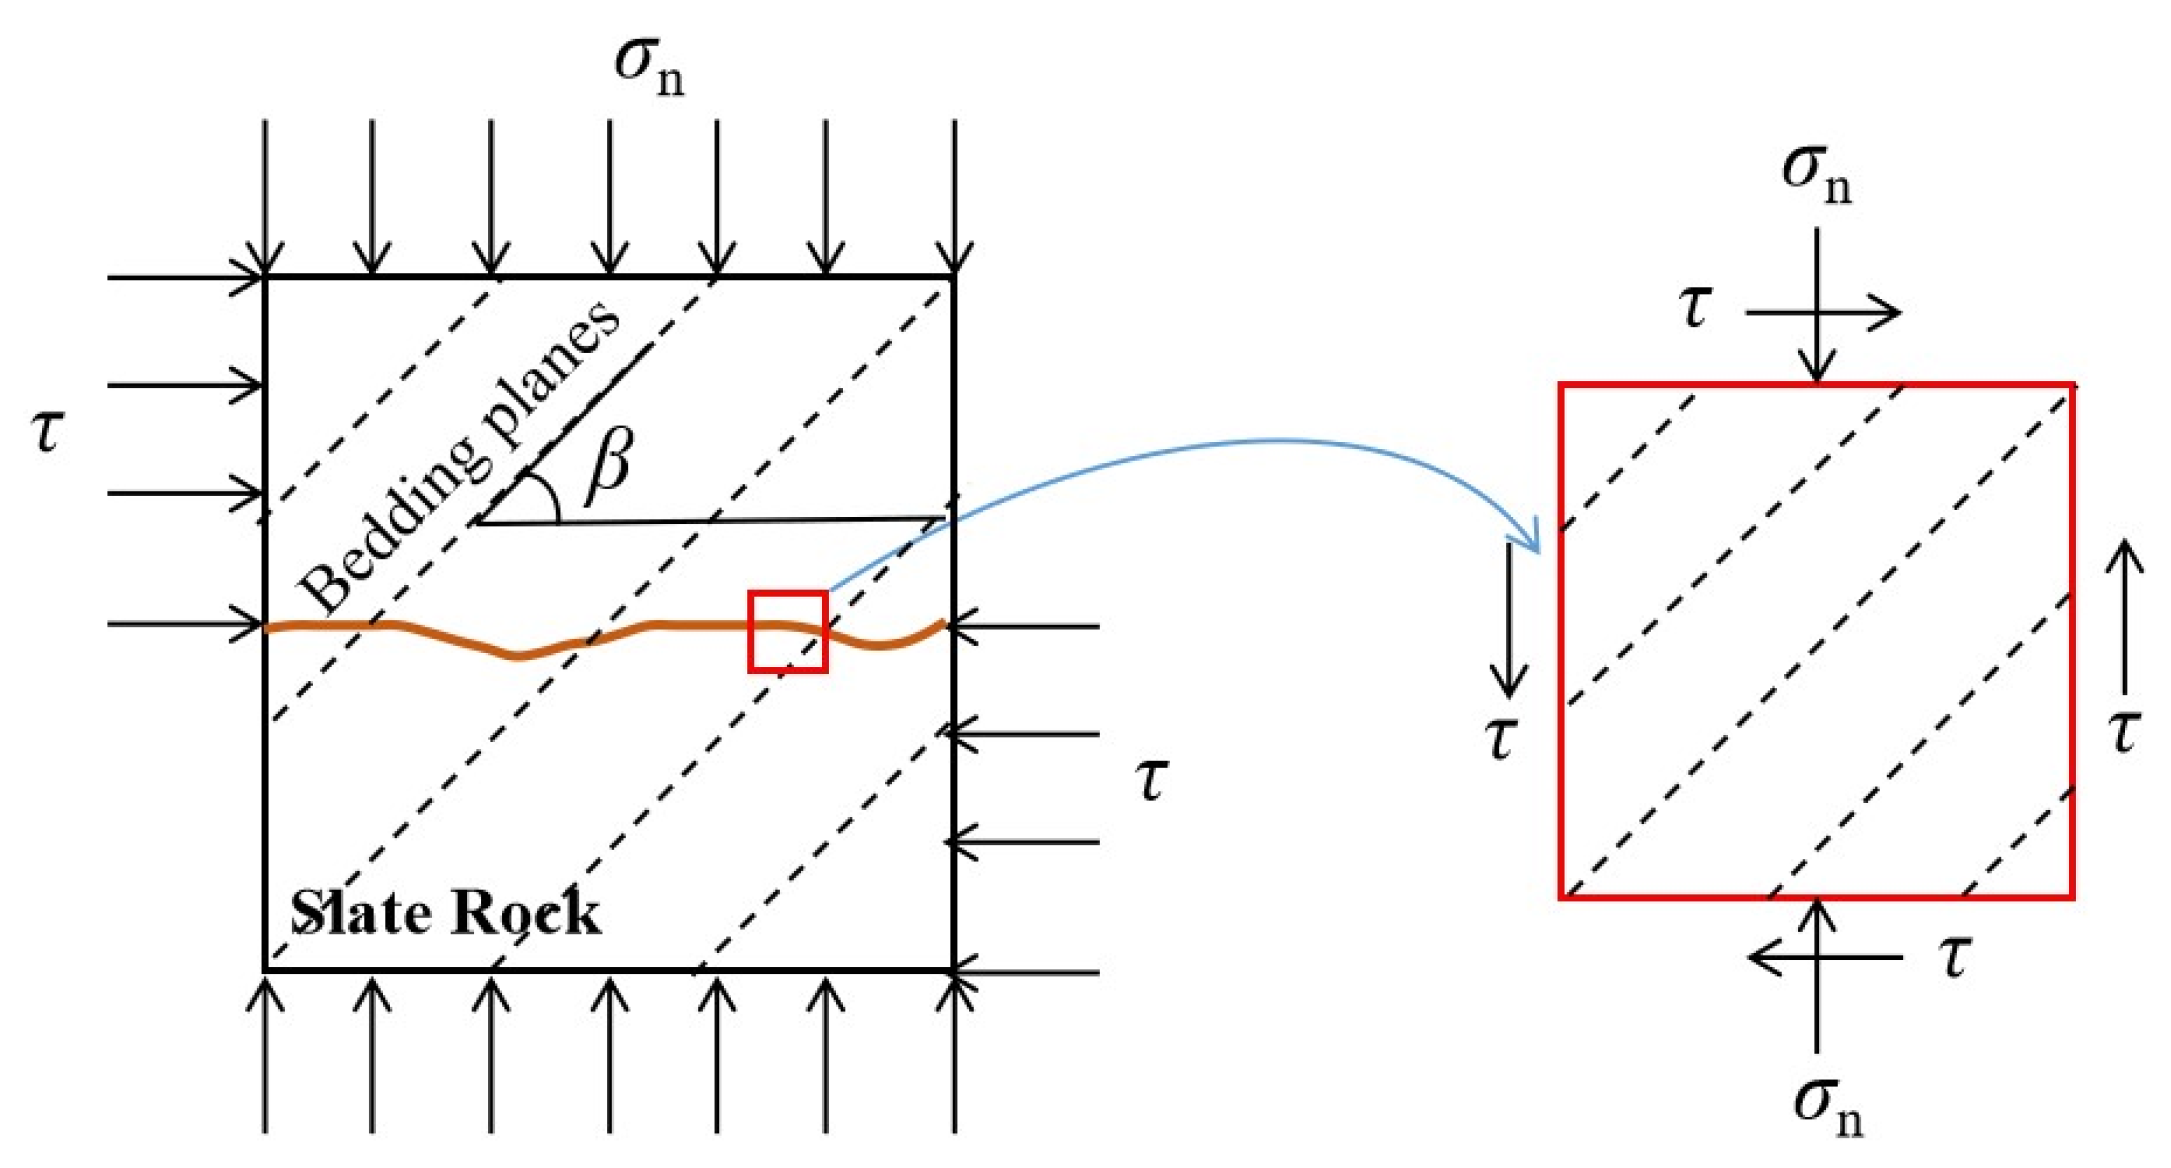
Different values of β significantly influence the mechanical properties and failure modes of rocks, which can be explained from the stress state perspective. In a direct shear test, the β of the rock sample affects the transmission mode of the shear force, the shear fracture, and the failure mode. Rock shear failure is controlled by τ and σn. An even distribution of shear and normal stresses along the shear fracture is assumed in this study. For an element at any point on the fracture, as shown in Figure 18, and ignoring the normal stress on the left and right sides, the in-plane stress state during shear loading is represented by a combination of σn and τ. When the bedding planes of the slate are parallel to the loading direction, shear load transfer is relatively simple because the bedding plane facilitates shear crack formation, resulting in weak shear strength. However, for inclined β, shear load transfer becomes more complicated.
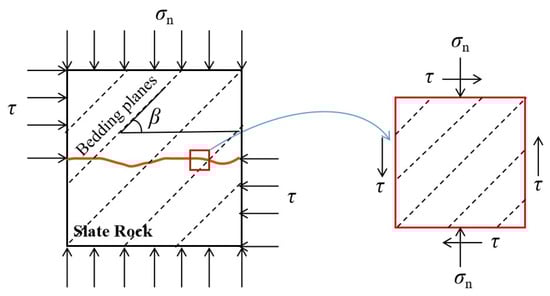
Figure 18.
Stress state of the slate element from the shear fracture [32].
Whether from numerical simulations or experimental results, the strength of the slate is consistently lowest when the bedding angle is 0°. At a 0° bedding angle, the bedding plane is parallel to the shear direction, allowing shear loads to be transmitted more easily along the bedding plane and making it easier for cracks to form, resulting in lower shear strength. This conclusion aligns with the findings in the literature [43], which conducted direct shear tests on slates in the northwest of the Iberian Peninsula (Spain). This study found that rock failure was mainly due to sliding along weak planes. When the shear direction is parallel to the bedding plane, the sample is more likely to experience shear failure along the bedding plane, demonstrating lower shear strength. The experiments in the literature further validate the impact of bedding plane orientation on rock shear behavior, highlighting the weakness when the bedding plane is parallel to the shear direction.
Liu et al. [22] conducted direct shear tests on Kangding slate with bedding angles of 0°, 30°, 45°, 60°, and 90°, analyzing the effects of bedding angle on failure modes, AE characteristics, and shear strength parameters. They found that the shear strength of the samples was positively correlated with normal stress under different conditions, but the rate of increase in shear strength was negatively correlated with bedding angle. Cohesion was positively correlated with bedding angle, meaning that higher bedding angles corresponded to greater cohesion. However, at a bedding angle of 90°, the acoustic emission count rate and energy release rate were lower. These results align with the conclusions of this study, validating the accuracy and effectiveness of the findings.
Tan et al. [44] conducted in situ direct shear tests on the thick mudstone interlayers in the Guizhou Expressway slate. Their research showed a positive correlation between shear stress and normal stress, which is consistent with the conclusions of this study. This finding highlights the significant impact of normal stress on the shear behavior of mudstone interlayers and provides crucial insights into understanding the effect of bedding on rock shear mechanics.
6. Conclusions and Prospects
6.1. Conclusions
In this study, indoor and simulated direct shear tests were carried out on layered slate specimens under varying normal stresses and bedding dip angles. The strength parameters, shear failure mode, AE characteristics, and micro-mechanism were thoroughly analyzed. The main conclusions drawn from the obtained results are as follows:
The τp increases linearly with σn, but the rate of increase is inversely related to β. Slate cohesion positively correlates with β, while φ and AE activity negatively correlate. The energy release rate is 3.92 × 10⁸ aJ/s at 0° and 1.93 × 10⁸ aJ/s at 90°, with the least energy released by microcracks with vertical bedding.
As σn increases, lateral cracks become more pronounced, and compression force chain (FC) distribution becomes more uniform and denser. Cracks along the inclined bedding plane form a wide shear band (mainly compression FC) and often a dense tensile chain along the bedding plane.
The shear strength variation of layered slate under numerical and experimental conditions differs significantly from shale due to macro and micro factors. Existing theoretical formulas should be used cautiously to predict slate strength.
6.2. Prospects
In rocks with bedding planes, the number of planes affects mechanical properties. This study examines the effects of bedding dip angles and normal stress on shear behavior but does not address the impact of varying numbers of bedding planes. Future research should explore how different quantities of bedding planes influence shear failure and consider additional factors to enhance tunnel stability.
In experimental research, the precision limitations of experimental instruments can significantly impact the reliability and accuracy of the results. In future research, we will use higher precision and more advanced instrumentation for experimental analysis, seeking different analytical methods to comprehensively evaluate the shear mechanical behavior of layered rocks.
This study focuses solely on carbonaceous slate from a specific tunnel, and the generalizability of the results to other types of slate or different geological contexts requires further validation. Future research will combine with other numerical simulation software, advanced methods, and field data to be applied to different types of rocks or geological contexts, further enhancing and refining the understanding of shear failure behavior in layered rocks.
Author Contributions
J.G.: methodology (equal), software (equal), and writing—original draft (equal); M.H.: investigation (equal), writing—review (equal), and resources (equal); F.R.: funding acquisition (equal), supervision (equal), methodology (equal), and writing—review and editing (equal); C.Z.: funding acquisition (equal) and supervision (equal); Z.C.: supervision (equal), investigation (equal), resources (equal), and writing—review (equal); Z.B.: supervision (equal),writing—review (equal), and resources (equal); Z.S.: supervision (equal), investigation (equal), and resources (equal). All authors have read and agreed to the published version of the manuscript.
Funding
This study is supported by the Province Education Department of Liaoning (Grant No. JYTMS20230958), and the opening fund of the Key Laboratory of Water Management and Water Security for Yellow River Basin, Ministry of Water Resources (No. 2023-SYSJJ-02).
Institutional Review Board Statement
Not applicable.
Informed Consent Statement
Not applicable.
Data Availability Statement
The data that support the findings of this study are available from the corresponding author upon reasonable request.
Conflicts of Interest
The authors have no conflicts of interest to disclose.
Nomenclature
| β | The bedding dip angle of slate: the angle between the bedding plane and the horizontal plane |
| AE | Acoustic emission |
| τp, τr | Peak and residual shear stresses |
| τ, σn | Shear and normal stresses |
| σnmax | Maximum normal stress |
| c, φ | Cohesion and internal friction angle |
| τr/τp | the ratio of residual stress to peak stress |
| XRD | X-ray diffraction |
| PAC | Physical Acoustics Corporation |
| FC | Force chain |
| SD | Standard deviation |
| SW | Slip weakening |
| M-C | Mohr–Coulomb |
References
- Zhuo, X.; Liu, X.; Shi, X.; Liang, L.; Xiong, J. The anisotropic mechanical characteristics of layered rocks under numerical simulation. J. Pet. Explor. Prod. Technol. 2022, 12, 51–62. [Google Scholar] [CrossRef]
- Zhai, M.; Xue, L.; Chen, H.; Xu, C.; Cui, Y. Effects of shear rates on the damaging behaviors of layered rocks subjected to direct shear: Insights from acoustic emission characteristics. Eng. Fract. Mech. 2021, 258, 108046. [Google Scholar] [CrossRef]
- Zhu, T.; Huang, D. Experimental investigation of the shear mechanical behavior of sandstone under unloading normal stress. Int. J. Rock Mech. Min. Sci. 2019, 114, 186–194. [Google Scholar] [CrossRef]
- Meier, T.; Rybacki, E.; Backers, T.; Dresen, G. Influence of bedding angle on borehole stability: A laboratory investigation of transverse isotropic oil shale. Rock Mech. Rock Eng. 2015, 48, 1535–1546. [Google Scholar] [CrossRef]
- Liu, X.; Zhou, Y.; Xu, D. Anisotropic mechanical properties of quartz mica schist subjected to true triaxial compression. Environ. Earth Sci. 2023, 82, 204. [Google Scholar] [CrossRef]
- Mashhadiali, N.; Molaei, F. Theoretical and experimental investigation of a shear failure model for anisotropic rocks using direct shear test. Int. J. Rock Mech. Min. Sci. 2023, 170, 105561. [Google Scholar] [CrossRef]
- Gong, Y.; Yao, A.; Li, Y.; Li, Y.; Li, Y.; Sun, Y. Model test study on sliding-toppling composite deformation evolution of anti-dip layered rock slope. Bull. Eng. Geol. Environ. 2023, 82, 194. [Google Scholar] [CrossRef]
- Pan, W.; Yang, W.; Wu, F.; Zhao, L.; Yao, R.; Fu, J. Layered soft rock simulation based on uniaxial and triaxial tests and direct shear test. Rock Soil Mech. 2022, 43, 3437–3452. [Google Scholar] [CrossRef]
- Alsuwaidi, E.; Xi, G.; Zimmerman, R. Mechanical characterization of laffan and Nahr Umr anisotropic shales. J. Petrol Sci. Eng. 2021, 200, 108195. [Google Scholar] [CrossRef]
- Heng, S.; Guo, Y.; Yang, C.; Daemen, J.J.; Li, Z. Experimental and theoretical study of the anisotropic properties of shale. Int. J. Rock Mech. Min. Sci. 2015, 74, 58–68. [Google Scholar] [CrossRef]
- Ikari, M.J.; Niemeijer, A.R.; Marone, C. Experimental investigation of incipient shear failure in foliated rock. J. Struct. Geol. 2015, 77, 82–91. [Google Scholar] [CrossRef]
- Fan, Z.; Xie, H.; Zhang, R.; Lu, H.; Zhou, Q.; Nie, X.; Luo, Y.; Ren, L. Characterization of anisotropic mode II fracture behaviors of a typical layered rock combining AE and DIC techniques. Eng. Fract. Mech. 2022, 271, 108599. [Google Scholar] [CrossRef]
- Mousavi, N.M.; Fisher, Q.J.; Gironacci, E.; Rezania, M. Experimental study and numerical modeling of fracture propagation in shale rocks during Brazilian disk test. Rock Mech. Rock Eng. 2018, 51, 1755–1775. [Google Scholar] [CrossRef]
- Kim, J.S.; Lee, K.S.; Cho, W.J.; Choi, H.J. A Comparative Evaluation of Stress-Strain and Acoustic Emission Methods for Quantitative Damage Assessments of Brittle Rock. Rock Mech. Rock Eng. 2015, 48, 495–508. [Google Scholar] [CrossRef]
- Wieser, C.; Käsling, H.; Raith, M.; Richter, R.; Moser, D.; Gemander, F.; Grosse, C.; Thuro, K. Acoustic emission technique to detect micro cracking during uniaxial compression of brittle rocks. In Engineering Geology for Society and Territory; Springer: Cham, Switzerland, 2015; Volume 6, pp. 465–468. [Google Scholar] [CrossRef]
- Hampton, J.; Gutierrez, M.; Matzar, L. Microcrack damage observations near coalesced fractures using acoustic emission. Rock Mech. Rock Eng. 2019, 52, 3597–3608. [Google Scholar] [CrossRef]
- Indraratna, B.; Mirzaghorbanali, A.; Oliveira, D.; Premadasa, W.N. Shear behaviour of rock joints under cyclic loading. Fac. Eng. Inf. Sci. 2012, 1256–1261. [Google Scholar]
- Moradian, Z.A.; Ballivy, G.; Rivard, P. Application of acoustic emission for monitoring shear behavior of bonded concrete–rock joints under direct shear test. Can. J. Civ. Eng. 2012, 39, 887–896. [Google Scholar] [CrossRef]
- Moradian, Z.A.; Ballivy, G.; Rivard, P.; Rousseau, B. Evaluating damage during shear tests of rock joints using acoustic emissions. Int. J. Rock Mech. Min. Sci. 2010, 47, 590–598. [Google Scholar] [CrossRef]
- Klyuchkin, V.N.; Novikov, V.A.; Okunev, V.I.; Zeigarnik, V.A. Acoustic and electromagnetic emissions of rocks: Insight from laboratory tests at press and shear machines. Environ. Earth Sci. 2022, 81, 64. [Google Scholar] [CrossRef]
- Roshan, H.; Sarmadivaleh, M.; Iglauer, S. Shale fracture surface area measured by tracking exchangeable cations. J. Pet. Sci. Eng. 2016, 138, 97–103. [Google Scholar] [CrossRef]
- Liu, P.; Liu, Q.; Deng, P.; Pan, Y.; Lei, Y.; Du, C.; Xie, X. Anisotropic shearing mechanism of Kangding slate: Experimental investigation and numerical analysis. J. Rock Mech. Geotech. Eng. 2024, 16, 1487–1504. [Google Scholar] [CrossRef]
- Noori, M.; Khanlari, G.; Sarfarazi, V.; Rafiei, B. An Experimental and Numerical Study of Layered Sandstone’s Anisotropic Behaviour Under Compressive and Tensile Stress Conditions. Rock Mech. Rock Eng. 2023, 57, 1451–1470. [Google Scholar] [CrossRef]
- Debecker, B.; Vervoort, A. Two-dimensional discrete element simulations of the fracture behaviour of slate. Int. J. Rock Mech. Min. Sci. 2013, 61, 161–170. [Google Scholar] [CrossRef]
- Ghazvinian, A.; Vaneghi, R.G.; Hadei, M.R.; Azinfar, M.J. Shear behavior of inherently anisotropic rocks. Int. J. Rock Mech. Min. Sci. 2013, 61, 96–110. [Google Scholar] [CrossRef]
- Fereidooni, D.; Khanlari, G.R.; Heidari, M.; Sepahigero, A.A.; Kolahi-Azar, A.P. Assessment of inherent anisotropy and confining pressure influences on mechanical behavior of anisotropic foliated rocks under triaxial compression. Rock Mech. Rock Eng. 2016, 49, 2155–2163. [Google Scholar] [CrossRef]
- Park, B.; Min, K.B. Bonded-particle discrete element modeling of mechanical behavior of transversely isotropic rock. Int. J. Rock Mech. Min. Sci. 2015, 76, 243–255. [Google Scholar] [CrossRef]
- Saeidi, O.; Rasouli, V.; Vaneghi, R.G.; Gholami, R.; Torabi, S.R. A modified failure criterion for transversely isotropic rocks. Geosci. Front. 2014, 5, 215–225. [Google Scholar] [CrossRef]
- Wang, M.; Li, P.; Wu, X.; Chen, H. A study on the brittleness and progressive failure process of anisotropic shale. Environ. Earth. Sci. 2016, 75, 886. [Google Scholar] [CrossRef]
- Wang, H.; Ren, F.; Chang, Y. Effect of bedding angle on tunnel slate failure behavior under indirect tension. Geomat. Nat. Haz. Risk 2020, 11, 428–445. [Google Scholar] [CrossRef]
- Ren, F.; Zhu, C.; He, M.; Shang, J.; Feng, G.; Bai, J. Characteristics and precursor of static and dynamic triggered rockburst: Insight from multifractal. Rock Mech. Rock Eng. 2023, 56, 1945–1967. [Google Scholar] [CrossRef]
- Lu, H.; Xie, H.; Luo, Y.; Ren, L.; Zhang, R.; Li, C.; Wang, J.; Yang, M. Failure characterization of Longmaxi shale under direct shear mode loadings. Int. J. Rock Mech. Min. Sci. 2021, 148, 104936. [Google Scholar] [CrossRef]
- Lepakshi, R.; Reddy, B.V. Shear strength parameters and Mohr-Coulomb failure envelopes for cement stabilised rammed earth. Constr. Build. Mater. 2020, 249, 118708. [Google Scholar] [CrossRef]
- Zhu, C.; Li, Z.; Xiansen, X.; He, M.; Wang, F.; Karakus, M.; Ren, F.; Tang, S. Investigation on the Dynamic Cracking Mechanism of Sandstone with an Ice-Saturated Flaw Based on Drop Weight Tests. Rock Mech. Rock Eng. 2024, 1–18. [Google Scholar] [CrossRef]
- Xu, Z.; Wang, W.; Lin, P.; Xiong, Y. A parameter calibration method for PFC simulation: Development and a case study of limestone. Geomech. Eng. 2020, 22, 97–108. [Google Scholar] [CrossRef]
- Xiong, L.; Chen, H.; Yuan, H.; Xu, Z. Triaxial creep test and PFC numerical simulation of rock-like materials with cracks. Arab. J. Geosci. 2023, 16, 613. [Google Scholar] [CrossRef]
- Jiang, Z.; Yin, Q.; Wu, J.; Zhu, Q.; Li, M.; Su, H.; Jing, H. The effect of cyclic heating and cooling on mechanical and deformation responses of granites under preset angle shearing. Environ. Earth Sci. 2023, 82, 29. [Google Scholar] [CrossRef]
- Shi, X.; Yang, X.; Meng, Y.; Li, G. Modified Hoek–Brown failure criterion for anisotropic rocks. Environ. Earth Sci. 2016, 75, 995. [Google Scholar] [CrossRef]
- Chen, R.; Lei, W.; Li, Z. Anisotropic shear strength characteristics of a tailings sand. Environ. Earth Sci. 2014, 71, 5165–5172. [Google Scholar] [CrossRef]
- Yuan, S.; Sun, Q.; Geng, J.; Wang, S.; Xue, S.; Ding, X. Distribution pattern and geological evolution of combustion metamorphic rocks in the northeast margin of Ordos Basin. Environ. Earth Sci. 2023, 82, 497. [Google Scholar] [CrossRef]
- Marques, E.A.G.; Williams, D.J.; Assis, I.R.; Leão, M.F. Effects of weathering on characteristics of rocks in a subtropical climate: Weathering morphology, in situ, laboratory and mineralogical characterization. Environ. Earth Sci. 2017, 76, 602. [Google Scholar] [CrossRef]
- Wang, Z.; Li, W.; Wang, Q.; Liu, S.; Hu, Y.; Fan, K. Relationships between the petrographic, physical and mechanical characteristics of sedimentary rocks in Jurassic weakly cemented strata. Environ. Earth Sci. 2019, 78, 131. [Google Scholar] [CrossRef]
- Garcia-Fernandez, C.; Gonzalez-Nicieza, C.; Alvarez-Fernandez, M.; Gutierrez-Moizant, R. New methodology for estimating the shear strength of layering in slate by using the Brazilian test. Bull. Eng. Geol. Environ. 2019, 78, 2283–2297. [Google Scholar] [CrossRef]
- Tan, X.; Ren, Y.; Li, T.; Zhou, S.; Zhang, J.; Zhou, S. In-situ direct shear test and numerical simulation of slate structural planes with thick muddy interlayer along bedding slope. Int. J. Rock Mech. Min. Sci. 2021, 143, 104791. [Google Scholar] [CrossRef]
Disclaimer/Publisher’s Note: The statements, opinions and data contained in all publications are solely those of the individual author(s) and contributor(s) and not of MDPI and/or the editor(s). MDPI and/or the editor(s) disclaim responsibility for any injury to people or property resulting from any ideas, methods, instructions or products referred to in the content. |
© 2024 by the authors. Licensee MDPI, Basel, Switzerland. This article is an open access article distributed under the terms and conditions of the Creative Commons Attribution (CC BY) license (https://creativecommons.org/licenses/by/4.0/).